
Submitted:
30 June 2025
Posted:
03 July 2025
You are already at the latest version
Abstract
Background/Objectives: Thrombosis, a critical condition that can have severe conse-quences, such as myocardial infarction and cerebral infarction, can be induced by steroid drugs. Although the mechanisms for inducing thrombosis are known for some types of steroid drugs, much remains unknown about the differences in the tendency and mecha-nisms for thrombosis. Methods: To address this knowledge gap, we analyzed the rela-tionship between thrombosis and steroid use by utilizing the U.S. Food and Drug Admin-istration (FDA) Adverse Event Reporting System (FAERS) database. From the database, we extracted demographic and drug information and information on reported adverse events from 2004 to 2024. We characterized drugs according to physiological function, receptor specificity, and Anatomic Therapeutic Chemical classification and calculated the propor-tion of steroid drugs that were likely to induce thrombosis. Results: Among steroid drugs, sex hormones such as androgens, progestogens, and estrogens appeared to have particu-larly high potential for causing thrombotic events. Results of principal component analy-sis and cluster analysis indicated that sex hormone preparations were associated with an increased risk of venous thrombosis. In addition, cardiovascular medications and miner-alocorticoids, which are used to treat diseases of major organs, showed a tendency to in-duce large-vessel occlusions. Conclusions: These findings may be useful for selecting ster-oid drugs for patients who are at risk for similar adverse effects.
Keywords:
steroids
; FAERS database
; venous thromboembolism
; arterial thrombosis
; sex hormones
; pharmacovigilance
1. Introduction
Because of their anti-inflammatory and immunosuppressive effects, steroid drugs are used widely in the treatment of various diseases [1,2]. Pharmaceuticals with a steroid backbone can be categorized into several types, including glucocorticoids, mineralocorticoids, sex hormones, and anabolic steroids [3]. Glucocorticoids have immunosuppressive and anti-inflammatory properties and are used to treat nearly all autoimmune diseases, chronic inflammatory disorders, allergies, and some malignant tumors [4]. Sex hormones are broadly categorized as female and male hormones, and female hormones are subdivided into progestins and estrogens. These are used primarily for contraception and osteoporosis prevention and in the treatment of menstrual disorders, menopausal symptoms, and certain cancers [5,6,7,8,9,10]. Anabolic steroids generally promote muscle growth and protein synthesis; they are used medicinally to treat muscle weakness caused by various conditions [11,12].
However, Steroids are also known to cause various adverse effects [13]. A cohort study conducted in the United States revealed that short-term use (30 days) of oral corticosteroids increased the incidence of sepsis (5.30%), venous thromboembolism (3.33%), and fractures (1.87%) [13]. However, the mechanisms underlying these adverse effects, including thrombosis, remain largely unclear. In Japan, the Ministry of Health, Labor and Welfare has issued guidelines addressing thrombosis as a serious adverse effect, which underscores the need for further research [14].
Thrombosis can be broadly classified into arterial and venous thrombosis [15]. A shared underlying mechanism is endothelial dysfunction. Under normal conditions, endothelial cells produce nitric oxide and prostacyclin, which suppress platelet aggregation, promote fibrinolysis via tissue plasminogen activator, and inhibit coagulation via anticoagulant factors. In endothelial dysfunction, these protective functions are lost, which leads to a thrombogenic state. Dysfunctional endothelium increases lipoprotein permeability, causing accumulation in the subendothelial space and triggering local inflammation, macrophage differentiation, and foam cell formation. These processes eventually lead to the development of atherosclerotic plaque and arterial thrombosis. In atherosclerotic regions, the anticoagulant activity of endothelial cells is reduced, which accelerates the development of thrombosis. Conversely, venous thrombosis is mainly caused by blood stasis and hypercoagulability. Factors such as inflammation, hypoxia, and mechanical stress caused by blood pooling may induce endothelial dysfunction, in which tissue factor is expressed and which initiates the coagulation cascade. Hypoxia from venous stasis activates thrombogenic factors such as plasminogen activator inhibitor-1 and von Willebrand factor, while suppressing fibrinolysis, which exacerbates endothelial dysfunction. This vicious cycle characterizes venous thrombosis [16,17]. Although these mechanisms are largely elucidated, the tendency of different types of steroid drugs to induce specific types of thrombosis remains unclear [18]. We hypothesized that the tendency to develop thrombosis (e.g., arterial vs. venous) varies by steroid class.
Therefore The U.S. Food and Drug Administration (FDA) Adverse Event Reporting System (FAERS) [19] is a collection of numerous reports of adverse event from the United States and abroad, which are useful for analyzing the relationship between thrombosis and steroid drugs. In this study, we used the FAERS database to comprehensively identify steroid drugs that may induce thrombosis and to clarify their associated characteristics and classifications.
2. Results
2.1. Creation of the Data Table
In the analysis, the FAERS drug information (DRUG) table (127,228,343 rows) and the adverse event (REAC) table (54,645,478 rows) were used. We combined the information in these tables to create an informal data table, consisting of 18,328,780 rows, for analysis. Duplicate entries were removed during the creation of the data table (Figure 1).
2.2. Steroid Drugs That Induce Thrombosis
All steroid drugs included in the informal data table are listed in Table 1. Scatter plots were generated for drugs with 1000 or more reported adverse events in the data table. These scatter plots (Figure 2) depict the correlation between steroid drugs and thrombosis. Each plot represents a steroid drug; the greater the natural logarithm of the reporting odds ratio (ROR) and the negative logarithm of the p value [log(p value)](Supplementary Table S1), the more statistically significant the drug is estimated to induce thrombosis. Steroid drugs for which the natural logarithm of the ROR > 0 and p < 0.05 were documented and analyzed.
2.3. Classification of Steroid Drugs and Their Relationships to Thrombogenesis
Steroids with a high potential to induce thrombosis (lnROR<0, p<0.05) were categorized according to their physiological functions, receptor specificity, and Anatomical Therapeutic Chemical (ATC) classification. We then calculated the proportions of steroids in each classification (Table 2). According to results of Fisher’s exact test, androgens were significantly increased the risk of thrombosis (ROR = 5.305, p < 0.05).
2.4. Principal Component Analysis
We performed a principal component analysis (Figure 3). According to the results, the contribution rates of principal components 1, 2, and 3 were 34.0%, 13.7%, and 8.54%, respectively. Component 1 is considered to be associated with the estimated risk of thrombosis onset because all the loading vectors of thrombosis-related terms were in a positive direction. For component 2, pulmonary embolism, deep vein thrombosis, and superficial vein thrombosis had high positive loading vectors. Adverse events whose vectors loaded highly in a negative direction included coronary artery bypass, arterial occlusive disease, and peripheral arterial occlusive disease. Thus, higher values of principal component 2 were associated with a tendency toward venous thrombosis. The relationship between principal component 2 and thrombosis-related terms was analyzed at the Standardized Medical Dictionary for Regulatory Activities (MedDRA) Query (SMQ) level (Figure 4); SMQs are systematically grouped MedDRA terms related to specific medical areas of interest and are used to comprehensively and efficiently extract and analyze terms for safety evaluations and adverse event analyses. Drugs classified under the SMQ for “arterial embolism and thrombosis” had low values for principal component 2, whereas those under “venous embolism and thrombosis” had high values. With regard to principal component 3, loading vectors in the positive direction included those for transient ischemic attack, stroke, myocardial infarction, hemorrhagic stroke, and coronary artery occlusion. In contrast, loading vectors in the negative direction included those for disseminated intravascular coagulation, thrombotic microangiopathy, and heparin-induced thrombocytopenia.
2.5. Hierarchical Cluster Analysis
Hierarchical cluster analysis performed with principal components 1, 2, and 3 (see section 2.4) resulted in the classification of drugs into four broad clusters (Figure 5). Drugs with high values for principal component 1 included sex hormone preparations found across clusters, as well as digoxin, digitoxin, and methyldigoxin in cluster 4. Cluster 3 was characterized by drugs with high values for principal component 2, whereas drugs with high values for principal component 3 were included primarily in cluster 4. On the basis of the results of the cluster analysis, we created a constellation dendrogram to visualize the relationship between drugs and adverse events (Figure 6).
3. Discussion
3.1. Classification of Steroid Drugs with High Thrombogenic Potential
In this study, 51 steroid drugs showed statistically significant associations with thrombosis (those for which the natural logarithm of the ROR > 0 and p < 0.05). These 51 drugs were categorized into 15 therapeutic groups according to the ATC classification. Of these groups, the androgen class exhibited the highest thrombogenic potential (ROR = 5.305, p < 0.001), followed by progestogens (ROR = 3.572) and estrogens (ROR = 3.227). These results suggest that sex hormone preparations, in particular, have a strong tendency to induce thrombosis. Previous studies have also confirmed an increased risk of venous thromboembolism with testosterone therapy, attributed to enhanced thrombogenesis and reduced fibrinolysis [20]. Moreover, results of a meta-analysis of Dutch cohort and case–control studies of the use of oral contraceptives suggest a thrombogenic risk associated with female hormone preparations [21]. Our findings are consistent with this previous evidence; thus, clinicians must carefully consider the risk of thrombosis when administering steroid drugs related to sex hormones, and preventive measures and monitoring must be implemented when necessary. Unlike previous studies that focused on specific steroid drugs, the novelty of our research lies in our use of the large-scale FAERS database, which enabled a comprehensive analysis of the entire spectrum of steroid drugs. This approach allowed us to identify associations between thrombosis and steroid drugs that had not been sufficiently studied before, such as cardiac glycosides (e.g., digoxin) and anabolic steroids.
3.2. Principal Component Analysis
Principal component analysis is a technique used to reduce the dimensionality of a dataset, enhancing interpretability while minimizing information loss [22]. In this study, principal component 1 represented the estimated risk of thrombosis onset; principal component 2 represented the type of thrombosis, with a positive correlation with venous thrombosis and a negative correlation with arterial thrombosis. This finding suggests that the vectors for drugs associated with venous thrombosis are loaded in the positive direction, whereas those associated with arterial thrombosis are loaded in the negative direction. Principal component 3 appears to correspond to occlusive events in major vessels of vital organs in the positive direction and to microvascular-level thrombosis in the negative direction. On the basis of this hypothesis, score plots were examined. Drugs strongly associated with principal component 1, and thus with high potential for inducing thrombosis in general, included gestodene, estramustine, and chlormadinone. Drugs such as drospirenone, ethinylestradiol, and norelgestromin were strongly and positively associated with principal component 2, which indicated a high potential for inducing venous thrombosis. In addition, loteprednol, digoxin, and obeticholic acid were estimated to have high potential for inducing arterial thrombosis. A strong association with principal component 3, which characterized testosterone, conjugated estrogens, and digoxin, suggested a potential to cause occlusion of major vessels in vital organs. Previous studies have also indicated that digoxin and testosterone are associated with cardiac events and an increased risk of arteriosclerosis [23]. Conversely, drugs such as rocuronium, ursodeoxycholic acid, and flumethasone were estimated to be more likely to induce microvascular thrombosis. These findings are expected to be useful in monitoring thrombosis according to the type of steroid drug administered to patients.
3.3. Cluster Analysis
Hierarchical cluster analysis is a method used to group and classify similar data [24]. As a result of our analysis, the drugs were classified into four clusters (Figure 5 and Figure 6), and the drugs included in each cluster are listed in Table 3. Cluster 2 contained drugs with high values for principal component 1. All drugs in cluster 3 and some in other clusters had high values for principal component 2. These drugs included drospirenone, ethinylestradiol, and etonogestrel, most of which were sex hormone preparations, particularly progestogens or estrogens. This suggests that female hormone preparations have potential for inducing venous thrombosis. Cluster 4 showed a strong correlation with principal component 3 and included drugs such as testosterone, digoxin, and loteprednol. These drugs are used in the treatment of diseases in major organs and include cardiovascular medications and mineralocorticoids.
3.4. Study Limitations
This study had several limitations. First, the FAERS database contains reports of spontaneous adverse events; it does not provide information about all patients who were administered the drugs, and thus the true incidence of adverse events cannot be calculated, and absolute risk assessments cannot be performed. Furthermore, spontaneous reports of adverse events are subject to reporting bias, including underreporting, overreporting, and misreporting. This bias could have affected our analyses of FAERS data. Second, some values may be missing from the FAERS database, and some included reports may be inaccurate. To address this, we excluded data suspected to be missing or erroneous in the age and gender data tables. Third, the number of drugs analyzed was limited by the number of reported cases. Information not considered in this analysis—such as patients’ underlying diseases, concomitant drug use (presence, type, and number), and methods and duration of drug administration—could have affected the manifestation of adverse events. In particular, when multiple drugs are administered, determining which drug caused the adverse event may be difficult [25]. Further research is expected to yield insights that take these confounding factors into account.
4. Materials and Methods
4.1. FAERS Database
FAERS is a large-scale database consisting of case reports. The FAERS comprises seven data tables: DEMO, which contains patient information such as age, sex, and weight; DRUG, which includes drug information; REAC, which contains information on reported adverse events; OUTC, which contains descriptions of clinical outcomes; RPSR, which provides the information sources; INDI, which contains data on drug indications; and THER, which includes details about therapy dates and treatment progress. In this analysis, the DRUG and REAC tables were integrated on the basis of a unique identifier. This allowed for the creation of a unified dataset (the informal table described in section 2.1) in which each record corresponded to a specific drug and adverse event. To avoid overestimation in case-based aggregation, duplicate cases based on the same unique identifier were excluded. To accurately assess the effects and adverse events of individual drugs, we excluded records of cases involving combination therapies, focusing only on groups in which the target drug was used alone. For this study, we utilized FAERS data from the first quarter of 2004 (January–March) through the third quarter of 2024 (July–September). Because the data were open access and anonymized, this study was exempt from ethical review and informed consent by the Meiji Pharmaceutical University Ethics Committee.
4.2. Selection of Target Drugs and Control of Adverse Events
To obtain Simplified Molecular Input Line Entry System (SMILES) representations of drug names listed in FAERS, we used the Python library PubChem Py [26] to search the PubChem database. Of the 5523 drugs in FAERS that were assigned SMILES representations, 233 drugs containing a steroid backbone were extracted and analyzed (Table 4) l. The following SMILES Arbitrary Target Specification (SMARTS) expression for the steroid backbone was used in the analysis:
“[#6]~1~[#6]~[#6]~2~[#6]~[#6]~[#6]~3~[#6](~[#6]~[#6]~[#6]~4~[#6]~[#6]~[#6]~[#6]~[#6]~3~4)~[#6]~2~[#6]~1”
For extraction, the Molecular Operating Environment [27], we used a comprehensive computational chemistry system equipped with Scientific Vector Language developed by Chemical Computing Group, Montreal, Quebec, Canada. For adverse event analysis, we applied the SMQ [28] from MedDRA version 27.1 [29]. For analysis, we utilized 419 narrow-scope preferred terms from the SMQs for “Arterial embolism and thrombosis,” “Venous embolism and thrombosis,” and “Embolism and thrombosis of unspecified or mixed vessels.” Of these, 399 preferred terms were found in the FAERS database.
4.3. Calculation of RORs
The ROR is a signal detection metric used to evaluate the association between drugs and adverse events. Using information from the analysis table, we created a 2 × 2 contingency table that reflected the presence or absence of steroid drug use and the occurrence of thrombosis (Table 5). If any cell in the 2 × 2 table contains a zero, calculation is infeasible. Furthermore, small values can introduce estimation bias. To correct for this, 0.5 was added to each cell as a continuity (Haldane) correction [30,31].
reporting odds ratios is [(a/b)/(c/d) = (a × d)/(b × c)].4.4. Creation of Scatter Plots
From the 2 × 2 contingency tables described in section 4.3, the RORs and p values from Fisher’s exact test were calculated. The ROR for each drug represents the strength of association with the adverse event, thrombosis, and the p value indicates statistical significance. We created a volcano plot in which the vertical axis represented the negative common logarithm of the p value (log p) and the horizontal axis represented the natural logarithm of the ROR [32,33,34,35,36]. Drugs for which the natural logarithm of the ROR > 0 and p < 0.05 [32,33,34,35,36] and for which 1000 or more adverse events were reported, as well as 52 thrombosis-related preferred terms included in 2000 or more reports of adverse events, were used in the subsequent cluster and principal component analyses. The drugs and preferred terms included in the analysis are summarized in Table 6 and Table 7.
4.5. Classification of Steroid Drugs with High Potential for Inducing Thrombosis
The analyzed drugs were classified into 18 categories based on physiological function, receptor specificity, and ATC classification (Table 8). We calculated the proportion of steroid drugs within each category that were likely to induce thrombosis.
4.6. Principal Component Analysis
We performed principal component analysis for the drugs listed in Table 6. (Supplementary Table S2) We then used the results focusing on principal components 1, 2, and 3 to create association diagrams.
4.7. Hierarchical Cluster Analysis
4.8. Statistical Analysis
To merge the data tables, we used Python. To perform statistical analyses, we used JMP Pro 18 (SAS Institute Inc., Cary, NC, USA). A p value of less than 0.05 was considered statistically significant.
5. Conclusions
According to the results of this study, 51 steroid drugs have a high potential for inducing thrombosis. Furthermore, through principal component analysis and cluster analysis, characteristics related to venous and arterial thrombosis for each steroid drug and the tendency of onset based on their classifications were also estimated. Therefore, we achieved our objective of identifying and characterizing steroid drugs that can induce thrombosis. This research thus provides new evidence for risk assessment of steroid treatment. These findings need to be confirmed by observational studies or randomized controlled trials in the future to provide more detailed data on thrombosis-inducing steroid drugs. These insights could prove useful in selecting appropriate medications and monitoring for adverse effects in patients who receive steroid treatment.
Supplementary Materials
The following supporting information can be downloaded at the website of this paper posted on Preprints.org. Table S1: List of 77 steroids with Potential Risk of Inducing Thromboses Based on RORs and p-values; Table S2: lnROR Matrix for Steroids and Thromboses.
Author Contributions
Conceptualization Y.U.; Methodology Y.U.; Software Y.U.; Validation Y.U. and A.W.; Formal analysis A.W.; Investigation A.W. and Y.U; Resources A.W. and Y.U; Data curation A.W. and Y.U.; Writing-original draft preparation A.W.; Writing-reviewing and editing A.W. and Y.U; Visualization A.W. and Y.U.; Supervision Y.U.; Project administration Y.U.; Funding acquisition Y.U. All authors have read and agreed to the published version of the manuscript.
Funding
This work was partly supported by the JSPS KAKENHI (grant numbers 21K06653 and 22K06707).
Institutional Review Board Statement
Not applicable.
Informed Consent Statement
Not applicable.
Data Availability Statement
Data are contained within the article and Supplementary Materials.
Conflicts of Interest
The authors declare no conflicts of interest.
References
- Ryken, T.C.; McDermott, M.; Robinson, P.D.; Ammirati, M.; Andrews, D.W.; Asher, A.L.; Burri, S.H.; Cobbs, C.S.; Gaspar, L.E.; Kondziolka, D. The role of steroids in the management of brain metastases: a systematic review and evidence-based clinical practice guideline. J. Neurooncol. 2009, 96, 103–114.
- Möhlmann, J.E.; Ezzafzafi, S.; Lindemans, C.A.; Jansen, M.H.A.; Nierkens, S.; Huitema, A.D.R.; van Luin, M. Pharmacokinetics and pharmacodynamics of systemic corticosteroids in autoimmune and inflammatory diseases: a review of current evidence. Clin. Pharmacokinet. 2024, 63, 1251–1270.
- Shagufta, I.; Panda, G. Quest for steroidomimetics: amino acids derived steroidal and nonsteroidal architectures. Eur. J. Med. Chem. 2017, 133, 139–151.
- Ronchetti, S.; Ayroldi, E.; Gentili, M.; Migilorati, G.; Riccardi, C. A glance at the use of glucocorticoids in rare inflammatory and autoimmune diseases: still an indispensable pharmacological tool? Front. Immunol. 2021, 11, 613435.
- Sugiura, K.; Kobayashi, T.; Ojima, S. The actual status of thromboembolism caused by the use of female hormonal agents in Japan. July 14, 2017. Available online: https://www.jstage.jst.go.jp/article/shinzo/48/7/48_826/_article/-char/ja/.
- Zhang, G.-Q.; Chen, J.-L.; Luo, Y.; Mathur, M.B.; Anagnostis, P.; Nurmatov, U.; Talibov, M.; Zhang, J.; Hawrylowicz, C.M.; Lumsden, M.A.; Critchley, H.; Sheikh, A.; Lundbäck, B.; Lässer, C.; Kankaanranta, H.; Lee, S.H.; Nwaru, B.I. Menopausal hormone therapy and women’s health: an umbrella review. PLoS Med. 2021, 18, e1003731.
- Pan, M.; Pan, X.; Zhou, J.; Wang, J.; Qi, Q.; Wang, L. Update on hormone therapy for the management of postmenopausal women. Biosci. Trends 2022, 16, 46–57.
- Nelson, H.D. Postmenopausal osteoporosis and estrogen. 2003. Available online: https://pubmed.ncbi.nlm.nih.gov/12952379/.
- Khosla, S.; Monroe, D.G. Regulation of bone metabolism by sex steroids. Cold Spring Harb. Perspect. Med. 2018, 8, a031211.
- Timmermans, S.; Souffriau, J.; Libert, C. A general introduction to glucocorticoid biology. Front. Immunol. 2019, 10, 1545.
- Bond, P.; Smit, D.L.; Ronde, W.D. Anabolic–androgenic steroids: How do they work and what are the risks?. Front. Endocrinol. 2022, 13, 1059473.
- Wenbo, Z.; Yan, Z. The uses of anabolic androgenic steroids among athletes; its positive and negative aspects-a literature review. J. Multidiscip. Healthc. 2023, 16, 4293–4305.
- Waljee, A.K.; Rogers, M.A.M.; Lin, P.; Singal, A.G.; Stein, J.S.; Marks, R.M.; Ayanian, J.Z.; Nallamothu, B.K. Short term use of oral corticosteroids and related harms among adults in the United States: population based cohort study. BMJ. 2017, 357.
- Ministry of Health, Labour and Welfare of Japan. Manual for serious adverse drug reactions by disease: thrombosis (thromboembolism, embolism, infarction). 2007.
- Ayyoub, S.; Orriols, R.; Oliver, E.; Ceide, O.T. Thrombosis models: An overview of common in vivo and in vitro models of thrombosis. Int. J. Mol. Sci. 2023, 24, 2569.
- Delluc, A.; Lacut, K.; Rodger, M.A. Arterial and venous thrombosis: what’s the link? A narrative review. Thromb. Res. 2020, 191, 97–102.
- Donadini, M.P.; Calcaterra, F.; Romualdi, E.; Ciceri, R.; Cancellara, A.; Lodigiani, C.; Bacci, M.; Bella, S.D.; Ageno, W.; Mavilio, D. The Link Between Venous and Arterial Thrombosis: Is There a Role for Endothelial Dysfunction?. Cells. 2025, 14, 144.
- Macleod, C.; Hadoke, P.W.F.; Nixon, M. Glucocorticoids: fuelling the fire of atherosclerosis or therapeutic extinguishers?. Int. J. Mol. Sci. 2021, 22, 7622.
- FDA. FDA Adverse event reporting system (FAERS). Available: https://www.fda.gov/drugs/fdas-adverse-event-reporting-system-faers/fda-adverse-event-reporting-system-faers-public-dashboard.
- Glueck, C.J.; Goldenberg, N.; Wang, P. Testosterone therapy, thrombophilia, venous thromboembolism, and thrombotic events. J. Clin. Med. 2018, 8, 11.
- [van Hylckama Vlieg, A.; Helmerhorst, F.M.; Vandenbroucke, J.P.; Doggen, C.J.M.; Rosendaal, F.R. The venous thrombotic risk of oral contraceptives, effects of oestrogen dose and progestogen type: results of the MEGA case-control study. BMJ 2009, 339.
- Jolliffe, I.T.; Cadima, J. Principal component analysis: a review and recent developments. Philos. Trans. Roy. Soc. A 2016, 374, 20150202.
- Chao, T.F.; Liu, C.J.; Chen, S.J.; Wang, K.L.; Lin, Y.J.; Chang, S.L.; Lo, L.W.; Tuan, T.C.; Chen, T.J.; Chiang, C.E.; Chen, S.A. Does digoxin increase the risk of ischemic stroke and mortality in atrial fibrillation? A nationwide population-based cohort study. Can. J. Cardiol. 2014, 30, 1190–1195.
- Everitt, B.S.; Landau, S.; Leese, M.; Stahl, D. Cluster Analysis, 5th ed.; Wiley-Blackwell; 2011.
- Pariente, A.; Avillach, P.; Salvo, F.; Thiessard, F.; Salamé, G.M.; Reglat, A.F.; Haramburu, F.; Bégaud, B.; Moore, N. Effect of competition bias in safety signal generation: analysis of a research database of spontaneous reports in France. Drug Saf. 2012, 35, 855–864.
- PubChemPy. Available: https://github.com/mcs07/pubchempy.
- Molecular Operating Environment. Available: https://www.chemcomp.com/en/Products.htm.
- Introductory guide for standardised MeDRA queries (SMQs) version 27.1. 9 2024. Available: https://www.jmo.pmrj.jp/download/2361.
- Introductory guide MeDRA version 27.1. 9 2024. Available: https://www.jmo.pmrj.jp/download/2360.
- Watanabe, Y.; Matsushita, Y.; Watanabe, A.; Maeda, T.; Nukui, H.; Ogawa, Y.; Sawa, A.; Maeda, H. Early detection of important safety information—recent methods for signal detection. Jpn. J. Biomet. 2004, 25, 37–60.
- Greenland, S.; Schwartzbaum, J.A.; Finkle, W.D. Problems due to small samples and sparse data in conditional logistic regression analysis. Am. J. Epidemiol. 2000, 151, 531–539.
- Kawabe, A.; Uesawa, Y. Analysis of corticosteroid-induced glaucoma using the Japanese adverse drug event reporting database. Pharmaceuticals. 2023, 16, 948.
- Okunaka, M.; Kano, D.; Matsui, R.; Kawasaki, T.; Uesawa, Y. Comprehensive analysis of chemotherapeutic agents that induce infectious neutropenia. Pharmaceuticals. 2021, 14, 681.
- Kan, Y.; Nagai, J.; Uesawa, Y. Evaluation of antibiotic-induced taste and smell disorders using the FDA adverse event reporting system database. Sci. Rep. 2021, 11, 9625.
- Hamazaki, R.; Uesawa, Y. Characterization of Antineoplastic Agents Inducing Taste and Smell Disorders Using the FAERS Database. Pharmaceuticals. 2024, 17, 1116.
- Kagaya, M.; Uesawa, Y. Nuclear Receptors and Stress Response Pathways Associated with the Development of Oral Mucositis Induced by Antineoplastic Agents. Pharmaceuticals. 2024, 17, 1086.
- Everitt, B.S. Unresolved problems in cluster analysis. Biometrics. 1979, 35, 169–181.
Figure 1.
Flowchart of the process for creating the analysis data table. Data in the DRUG (drug information) and REAC (adverse event information) tables from the FDA Adverse Event Reporting System (FAERS) were combined, allowing for duplicates, and were linked by means of the primary ID number.
Figure 1.
Flowchart of the process for creating the analysis data table. Data in the DRUG (drug information) and REAC (adverse event information) tables from the FDA Adverse Event Reporting System (FAERS) were combined, allowing for duplicates, and were linked by means of the primary ID number.
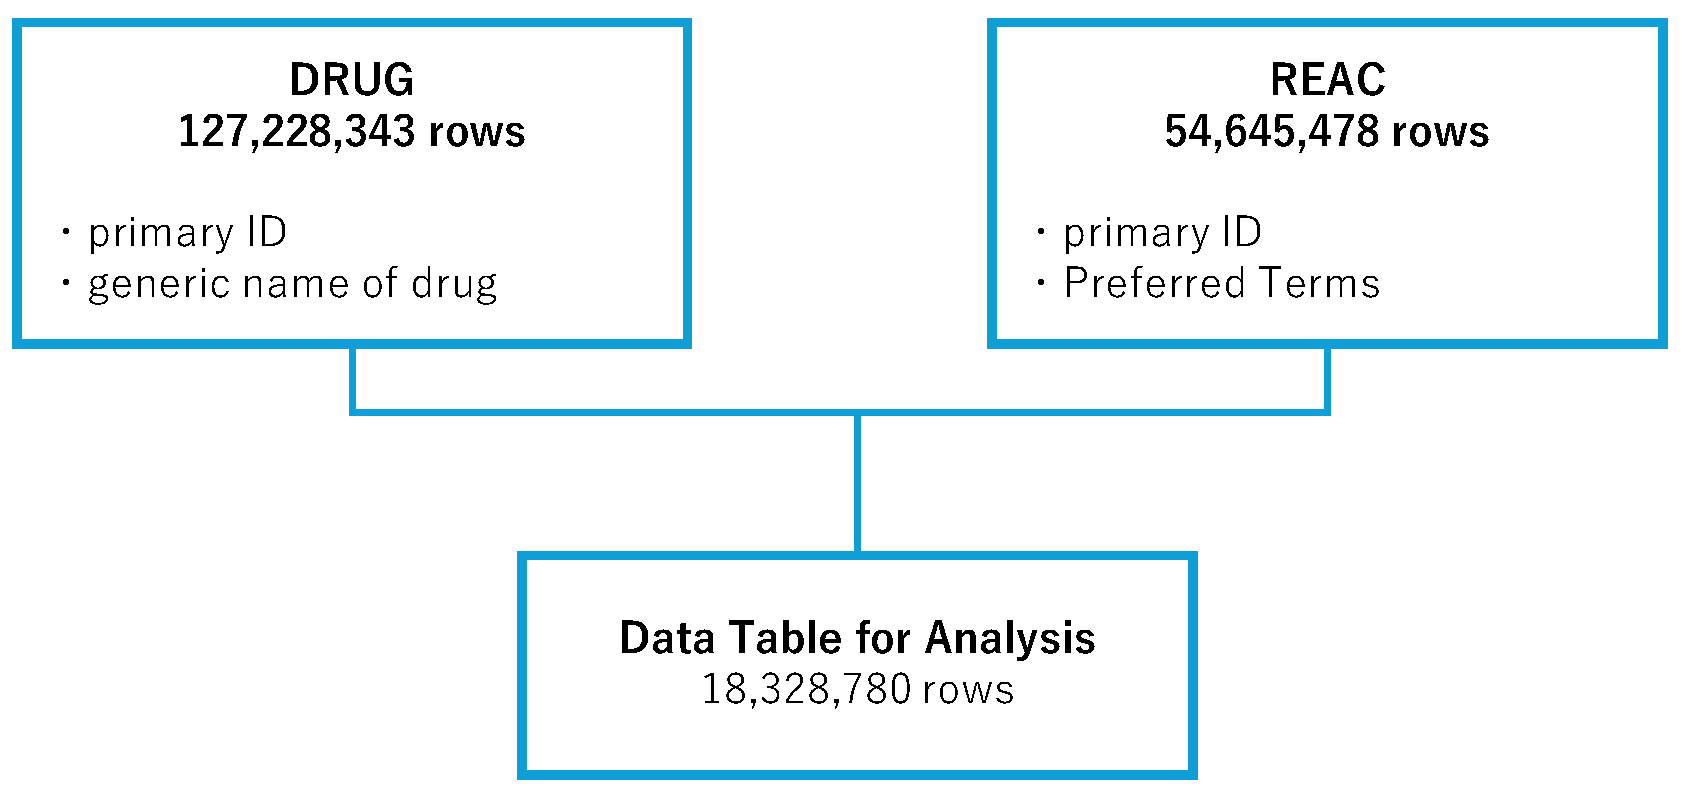
Figure 2.
Volcano plot for steroids and thromboses. The vertical axis represents the statistical significance according to Fisher’s exact test, and the horizontal axis represents the risk of inducing thromboses. The steroid names and their leaders are colored according to the number of reports.
Figure 2.
Volcano plot for steroids and thromboses. The vertical axis represents the statistical significance according to Fisher’s exact test, and the horizontal axis represents the risk of inducing thromboses. The steroid names and their leaders are colored according to the number of reports.
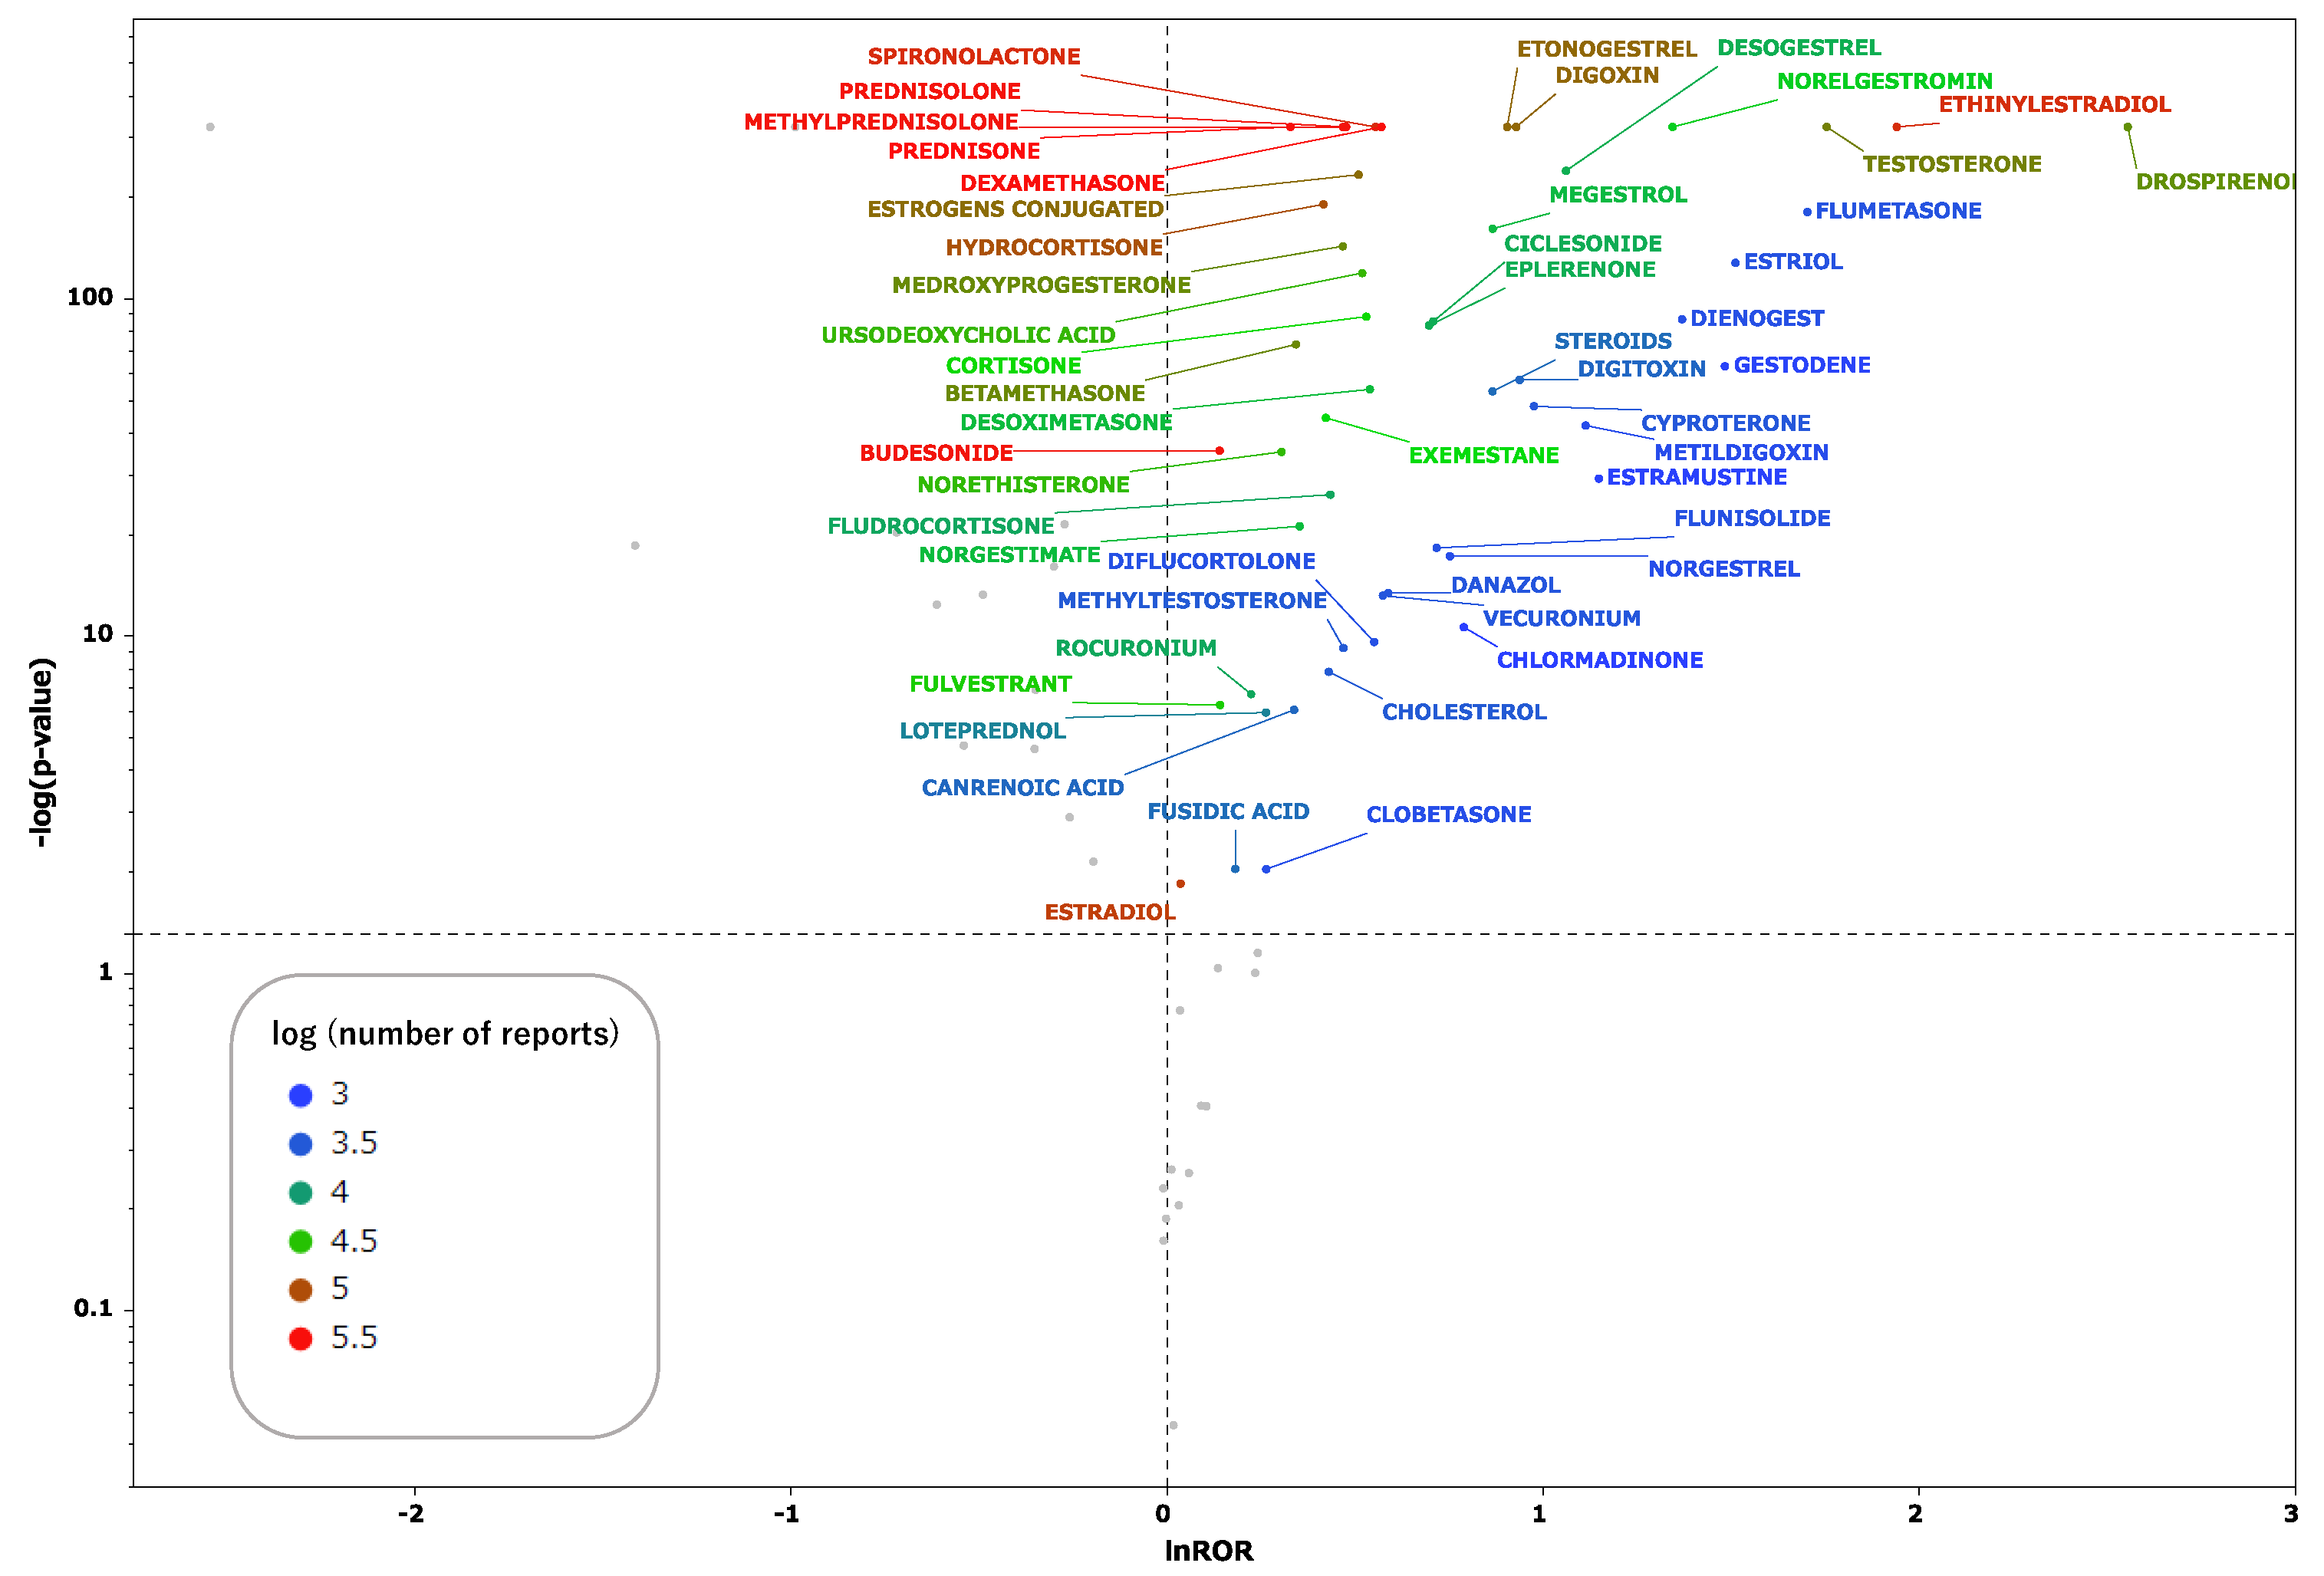
Figure 3.
Relationships of thromboses with steroids according to principal components analysis. (a) and (b) Results for components 1 (physiological functions) and 2 (receptor specificity). (c) and (d) Results for components 2 and 3 (Anatomic Therapeutic Chemical classification). Loading plots (a) and (c) represent the association between adverse events related to thromboses and each principal component. Each loading vector represents an adverse effect. Score plots (b) and (d) represent the relationship between steroids and each principal component. Each dot refers to a specific steroid drug.
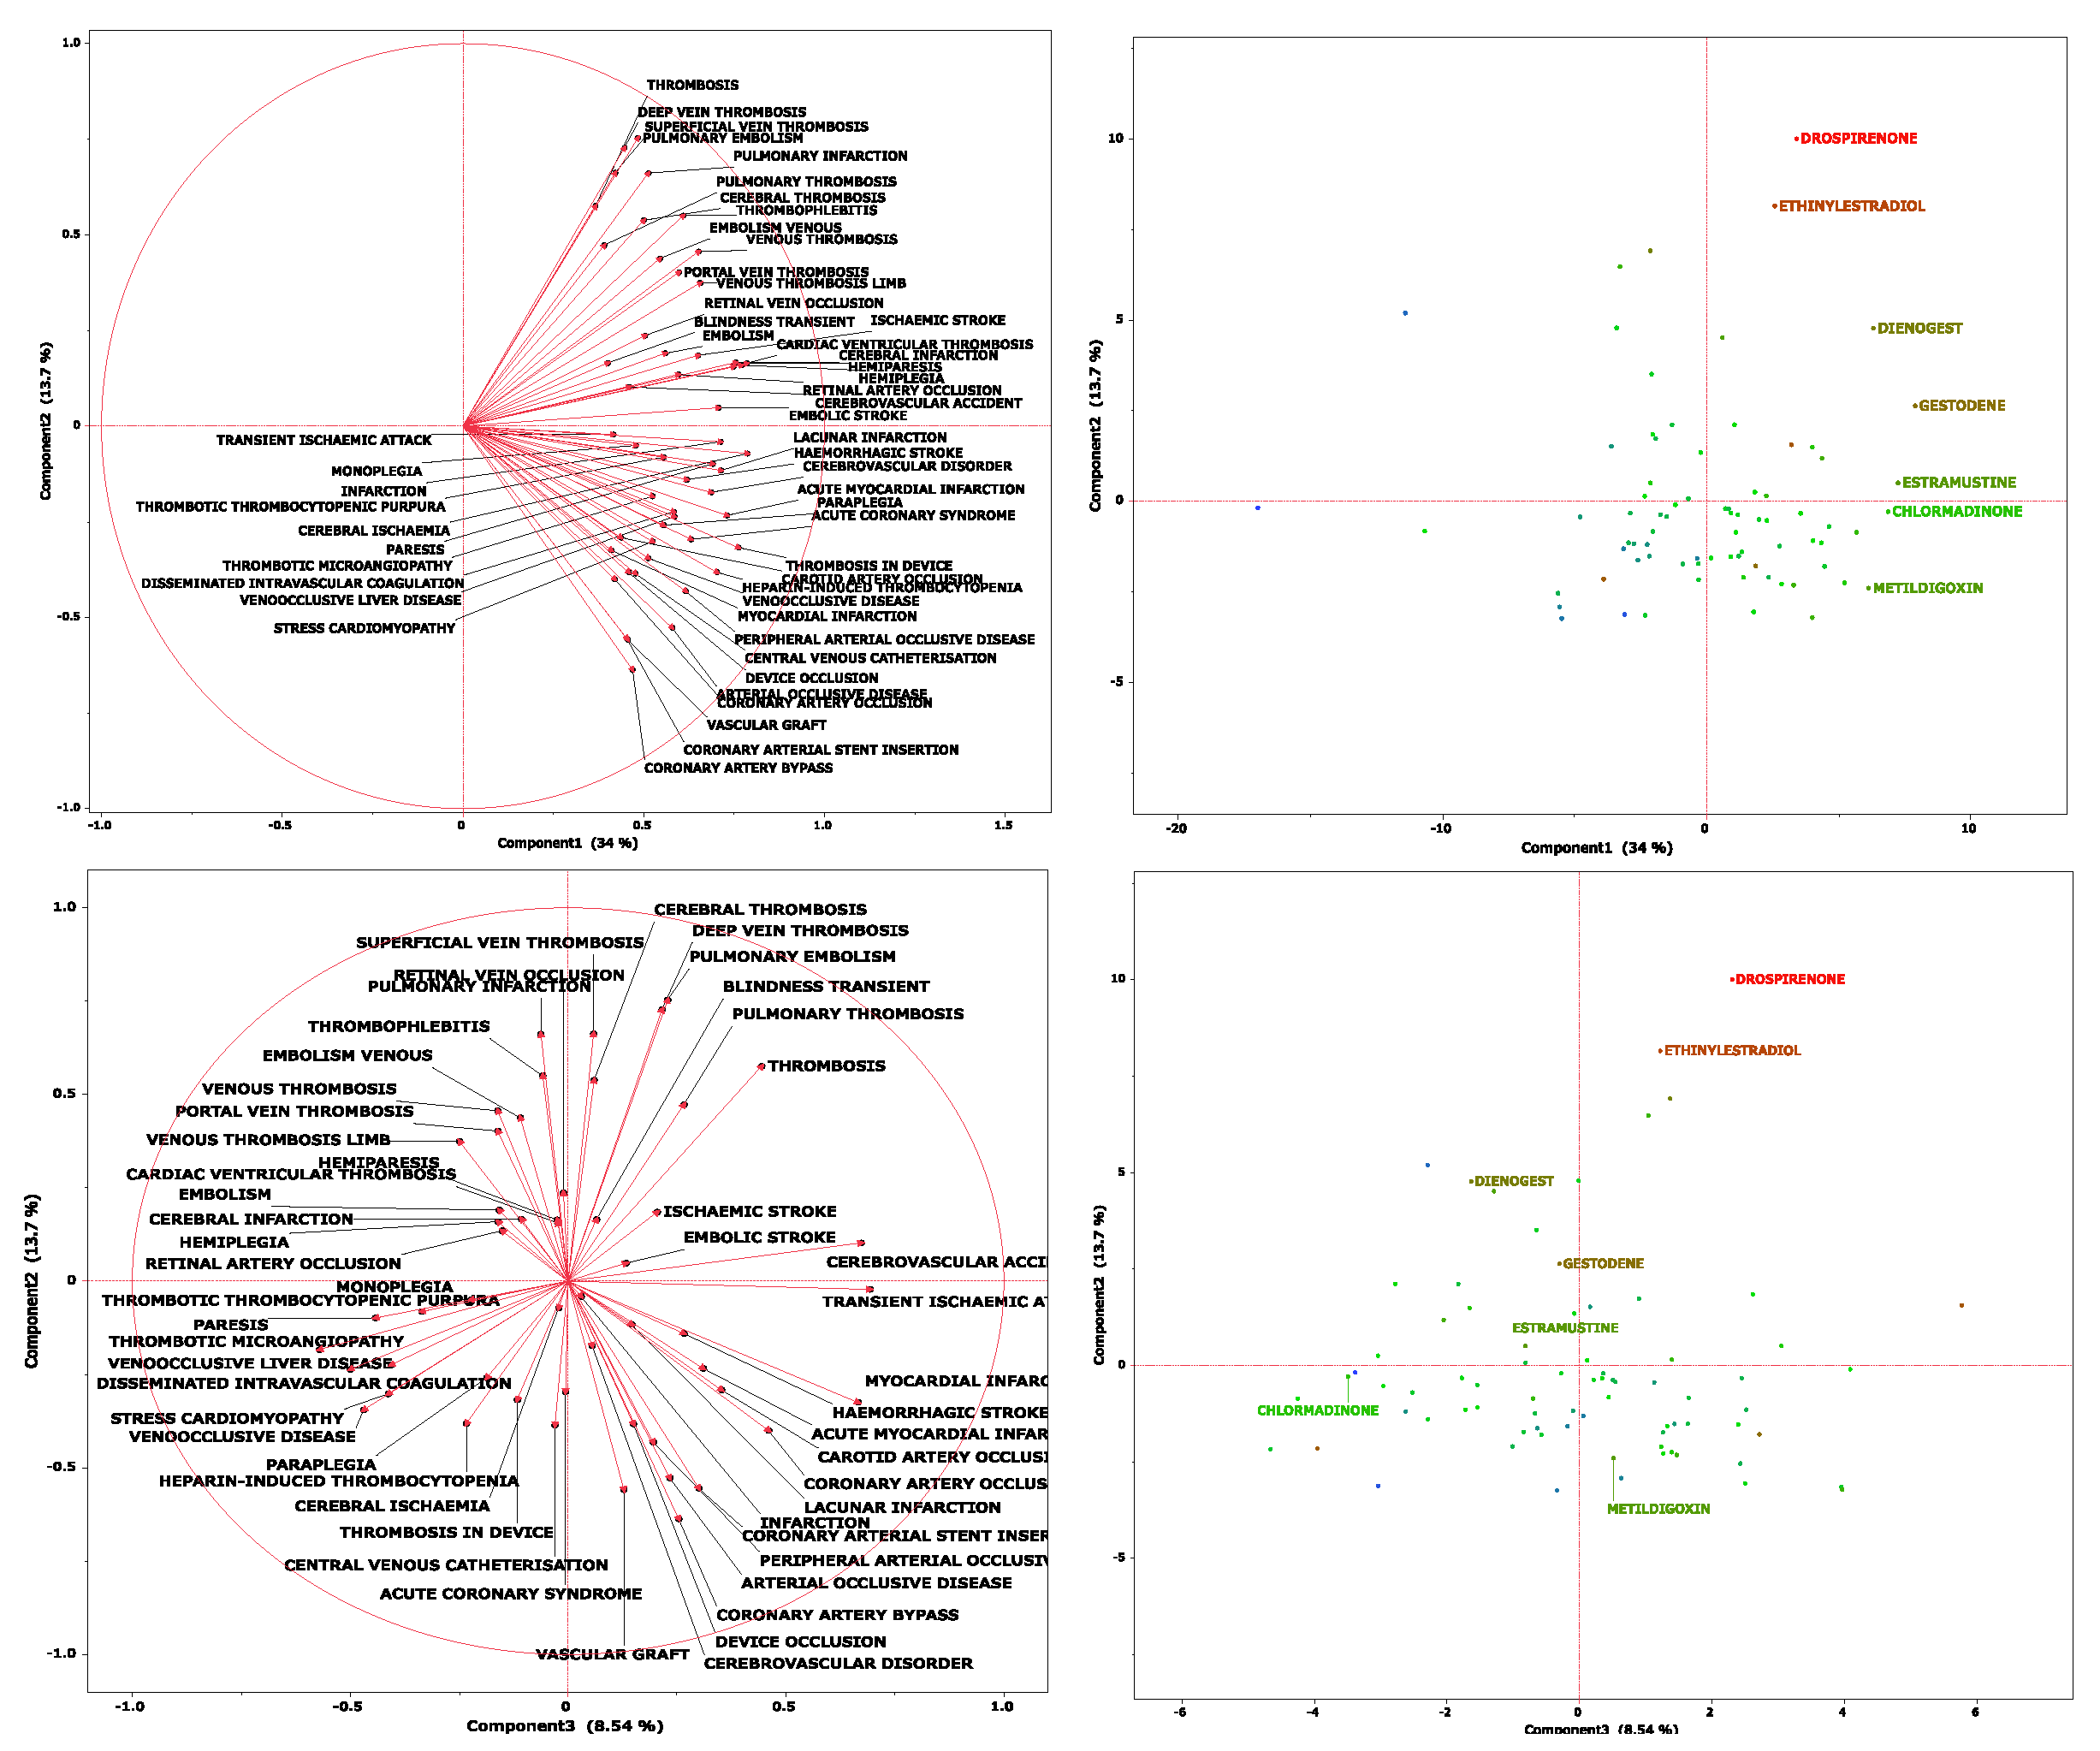
Figure 4.
The relationship between component 2 and each steroid at the level of the Standardised Medical Dictionary for Regulatory Activities (MedDRA) Query (SMQ). Cases classified as “Thromboses of unspecified or mixed vessels” were excluded. The average values of principal component 2 for each SMQ were 0.3050 for “Venous embolism and thrombosis” and 0.23034 for “Arterial embolism and thrombosis.” *Welch’s t test was performed to assess the statistical significance of the difference.
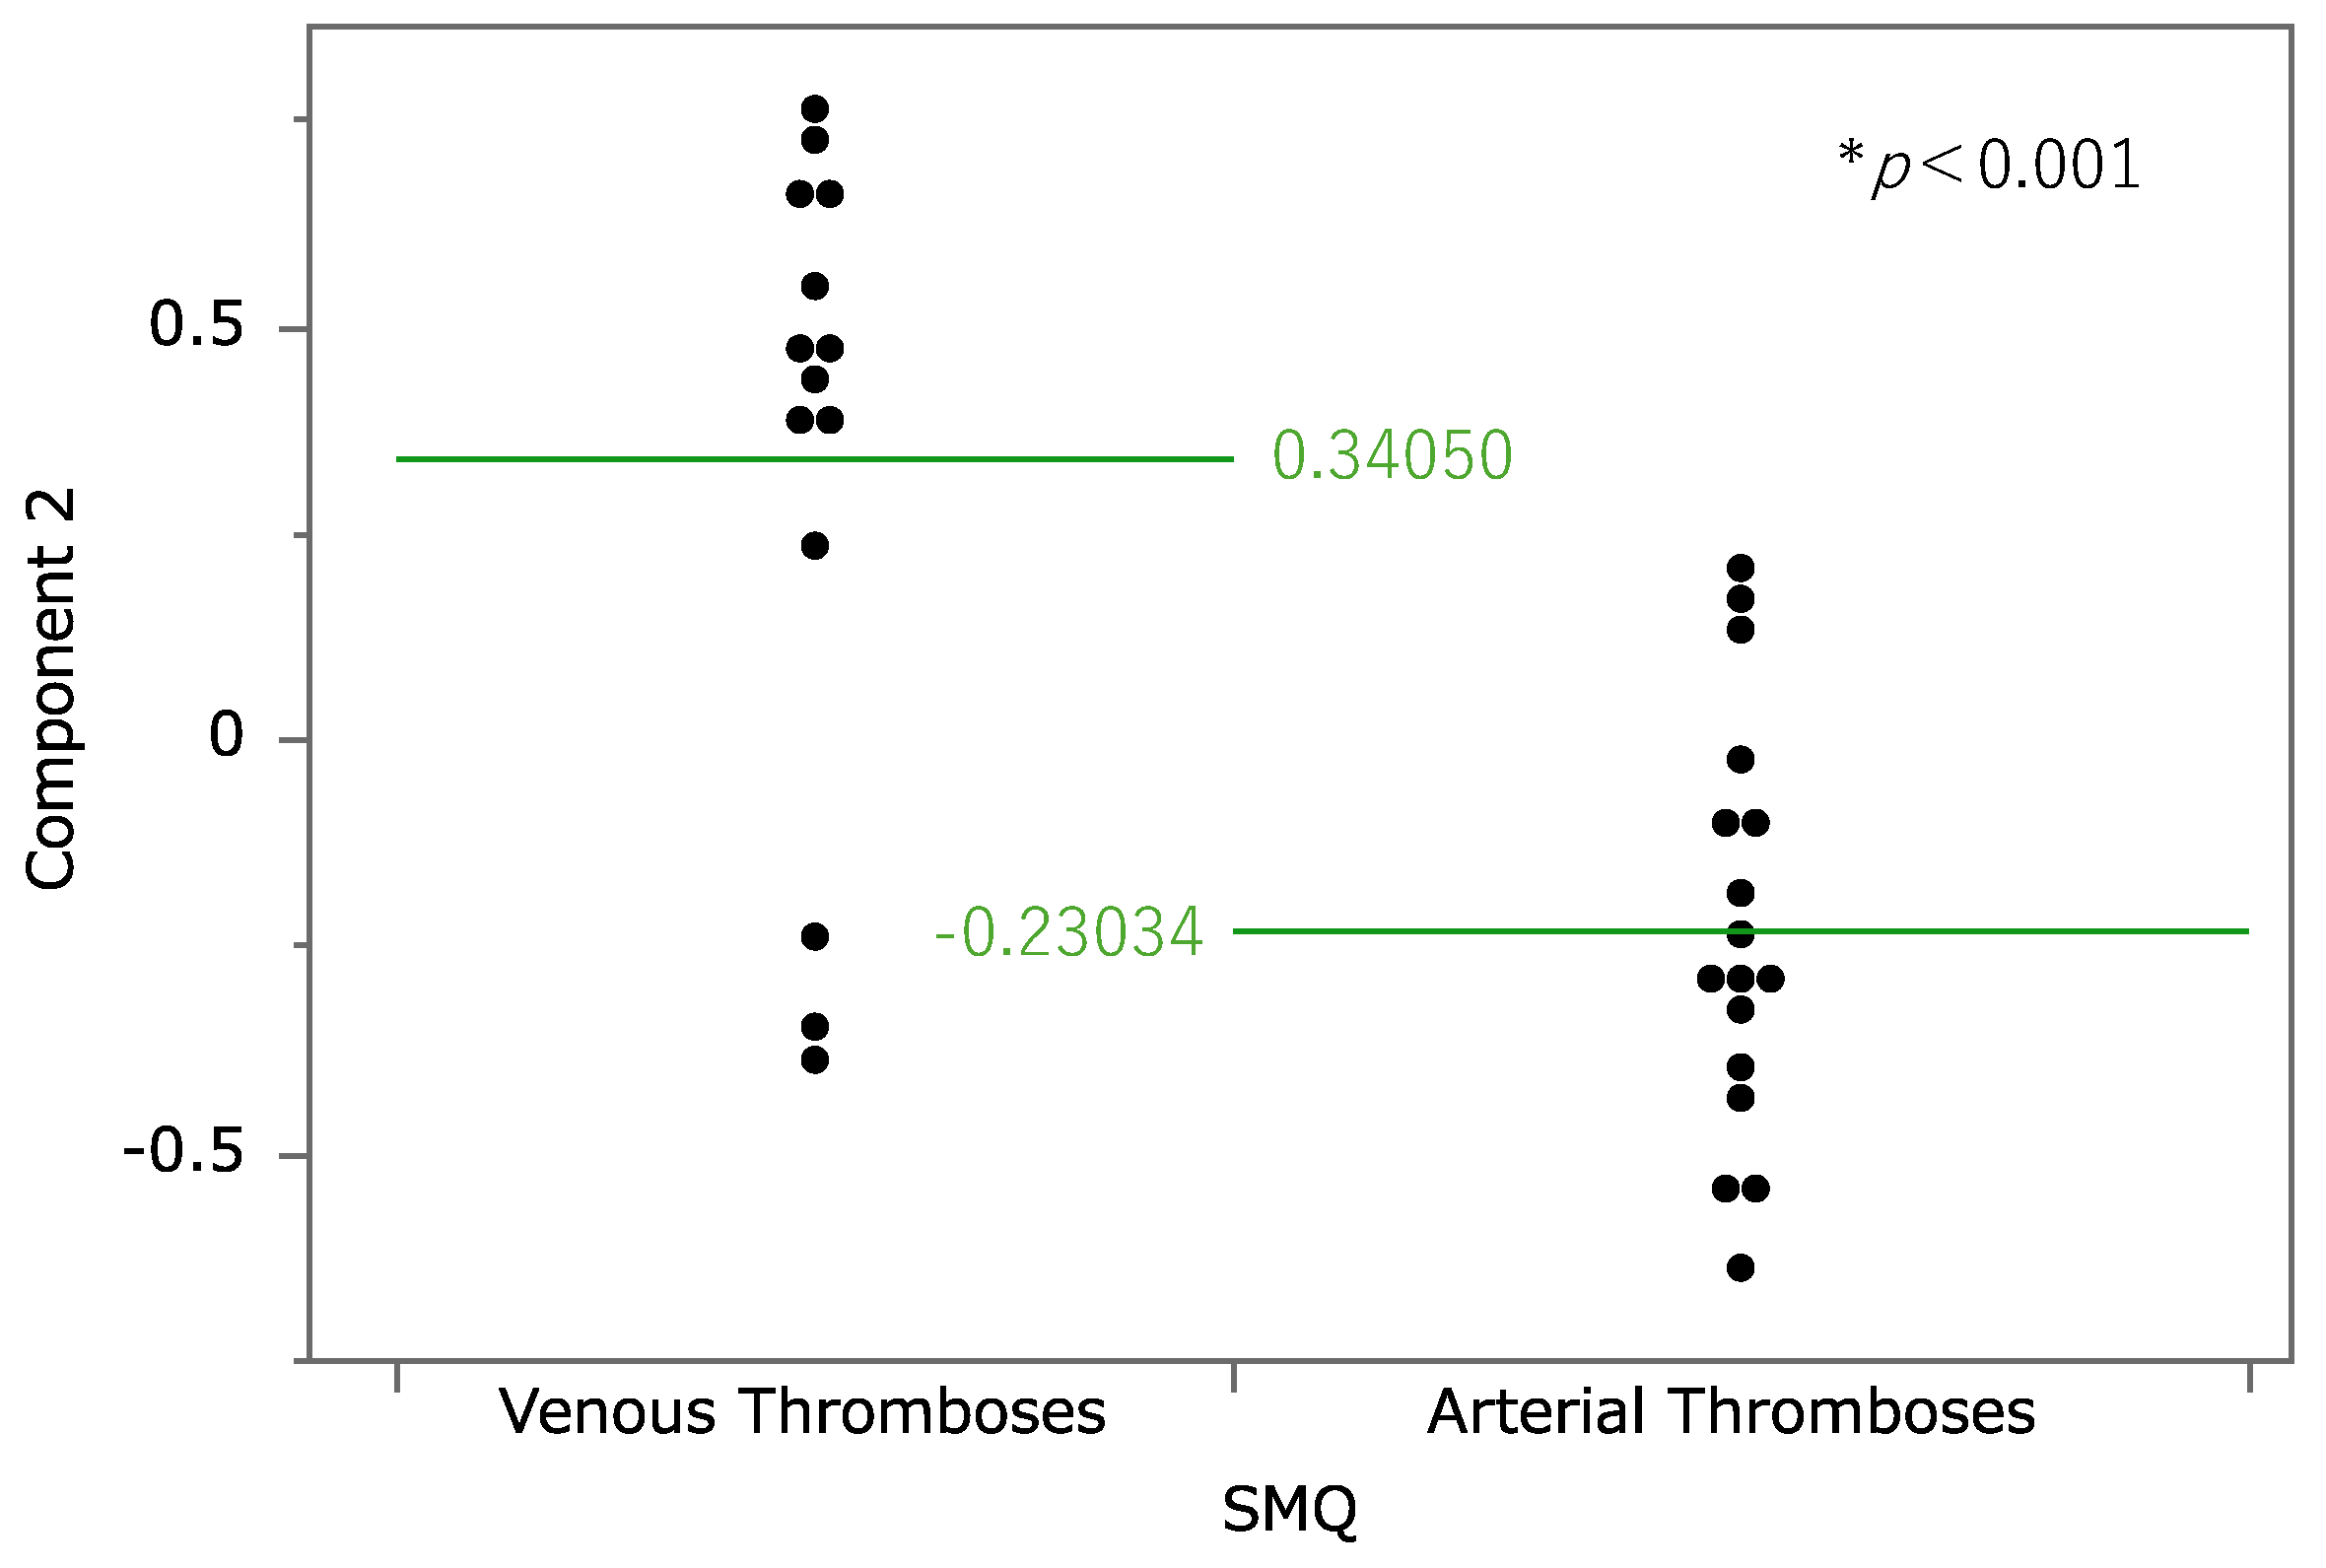
Figure 5.
Results of hierarchical cluster analysis, depicting the relationship between 52 side effects related to thromboses and 51 steroids. In the color map, the redder the color, the higher the value of each principal component, and the bluer the color, the lower the value.
Figure 5.
Results of hierarchical cluster analysis, depicting the relationship between 52 side effects related to thromboses and 51 steroids. In the color map, the redder the color, the higher the value of each principal component, and the bluer the color, the lower the value.
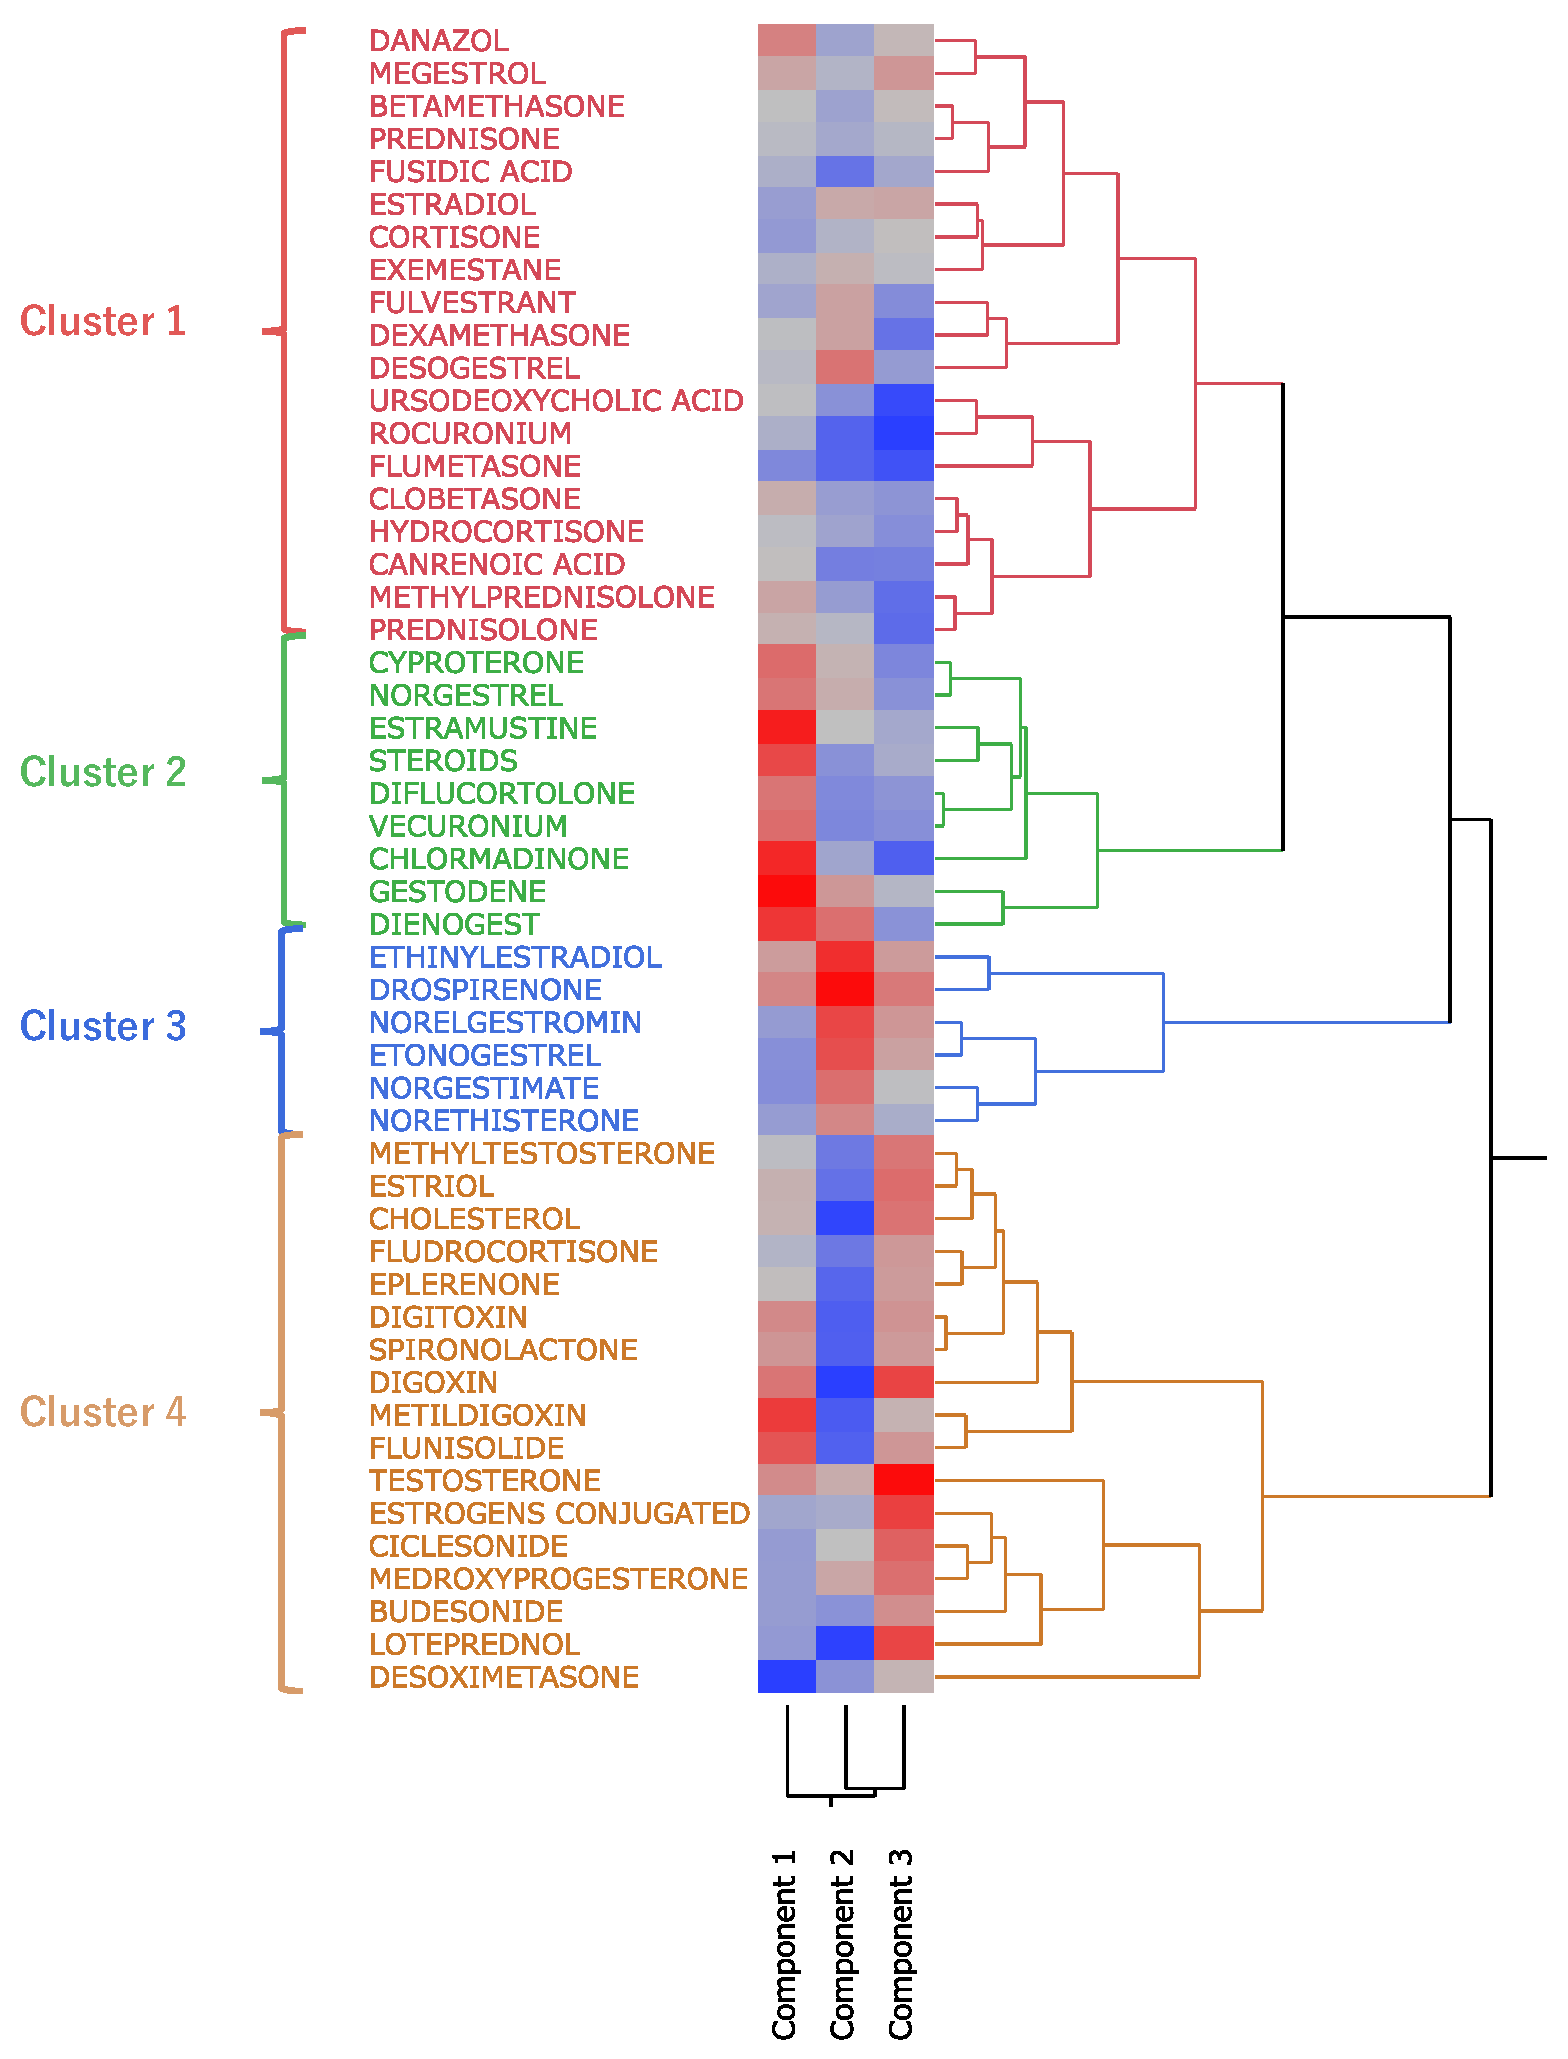
Figure 6.
Constellation dendrogram. The figure, enabling a visual understanding of the results of the cluster analysis. Dots indicate individual data lines, and line lengths indicate relative distances to clusters.
Figure 6.
Constellation dendrogram. The figure, enabling a visual understanding of the results of the cluster analysis. Dots indicate individual data lines, and line lengths indicate relative distances to clusters.
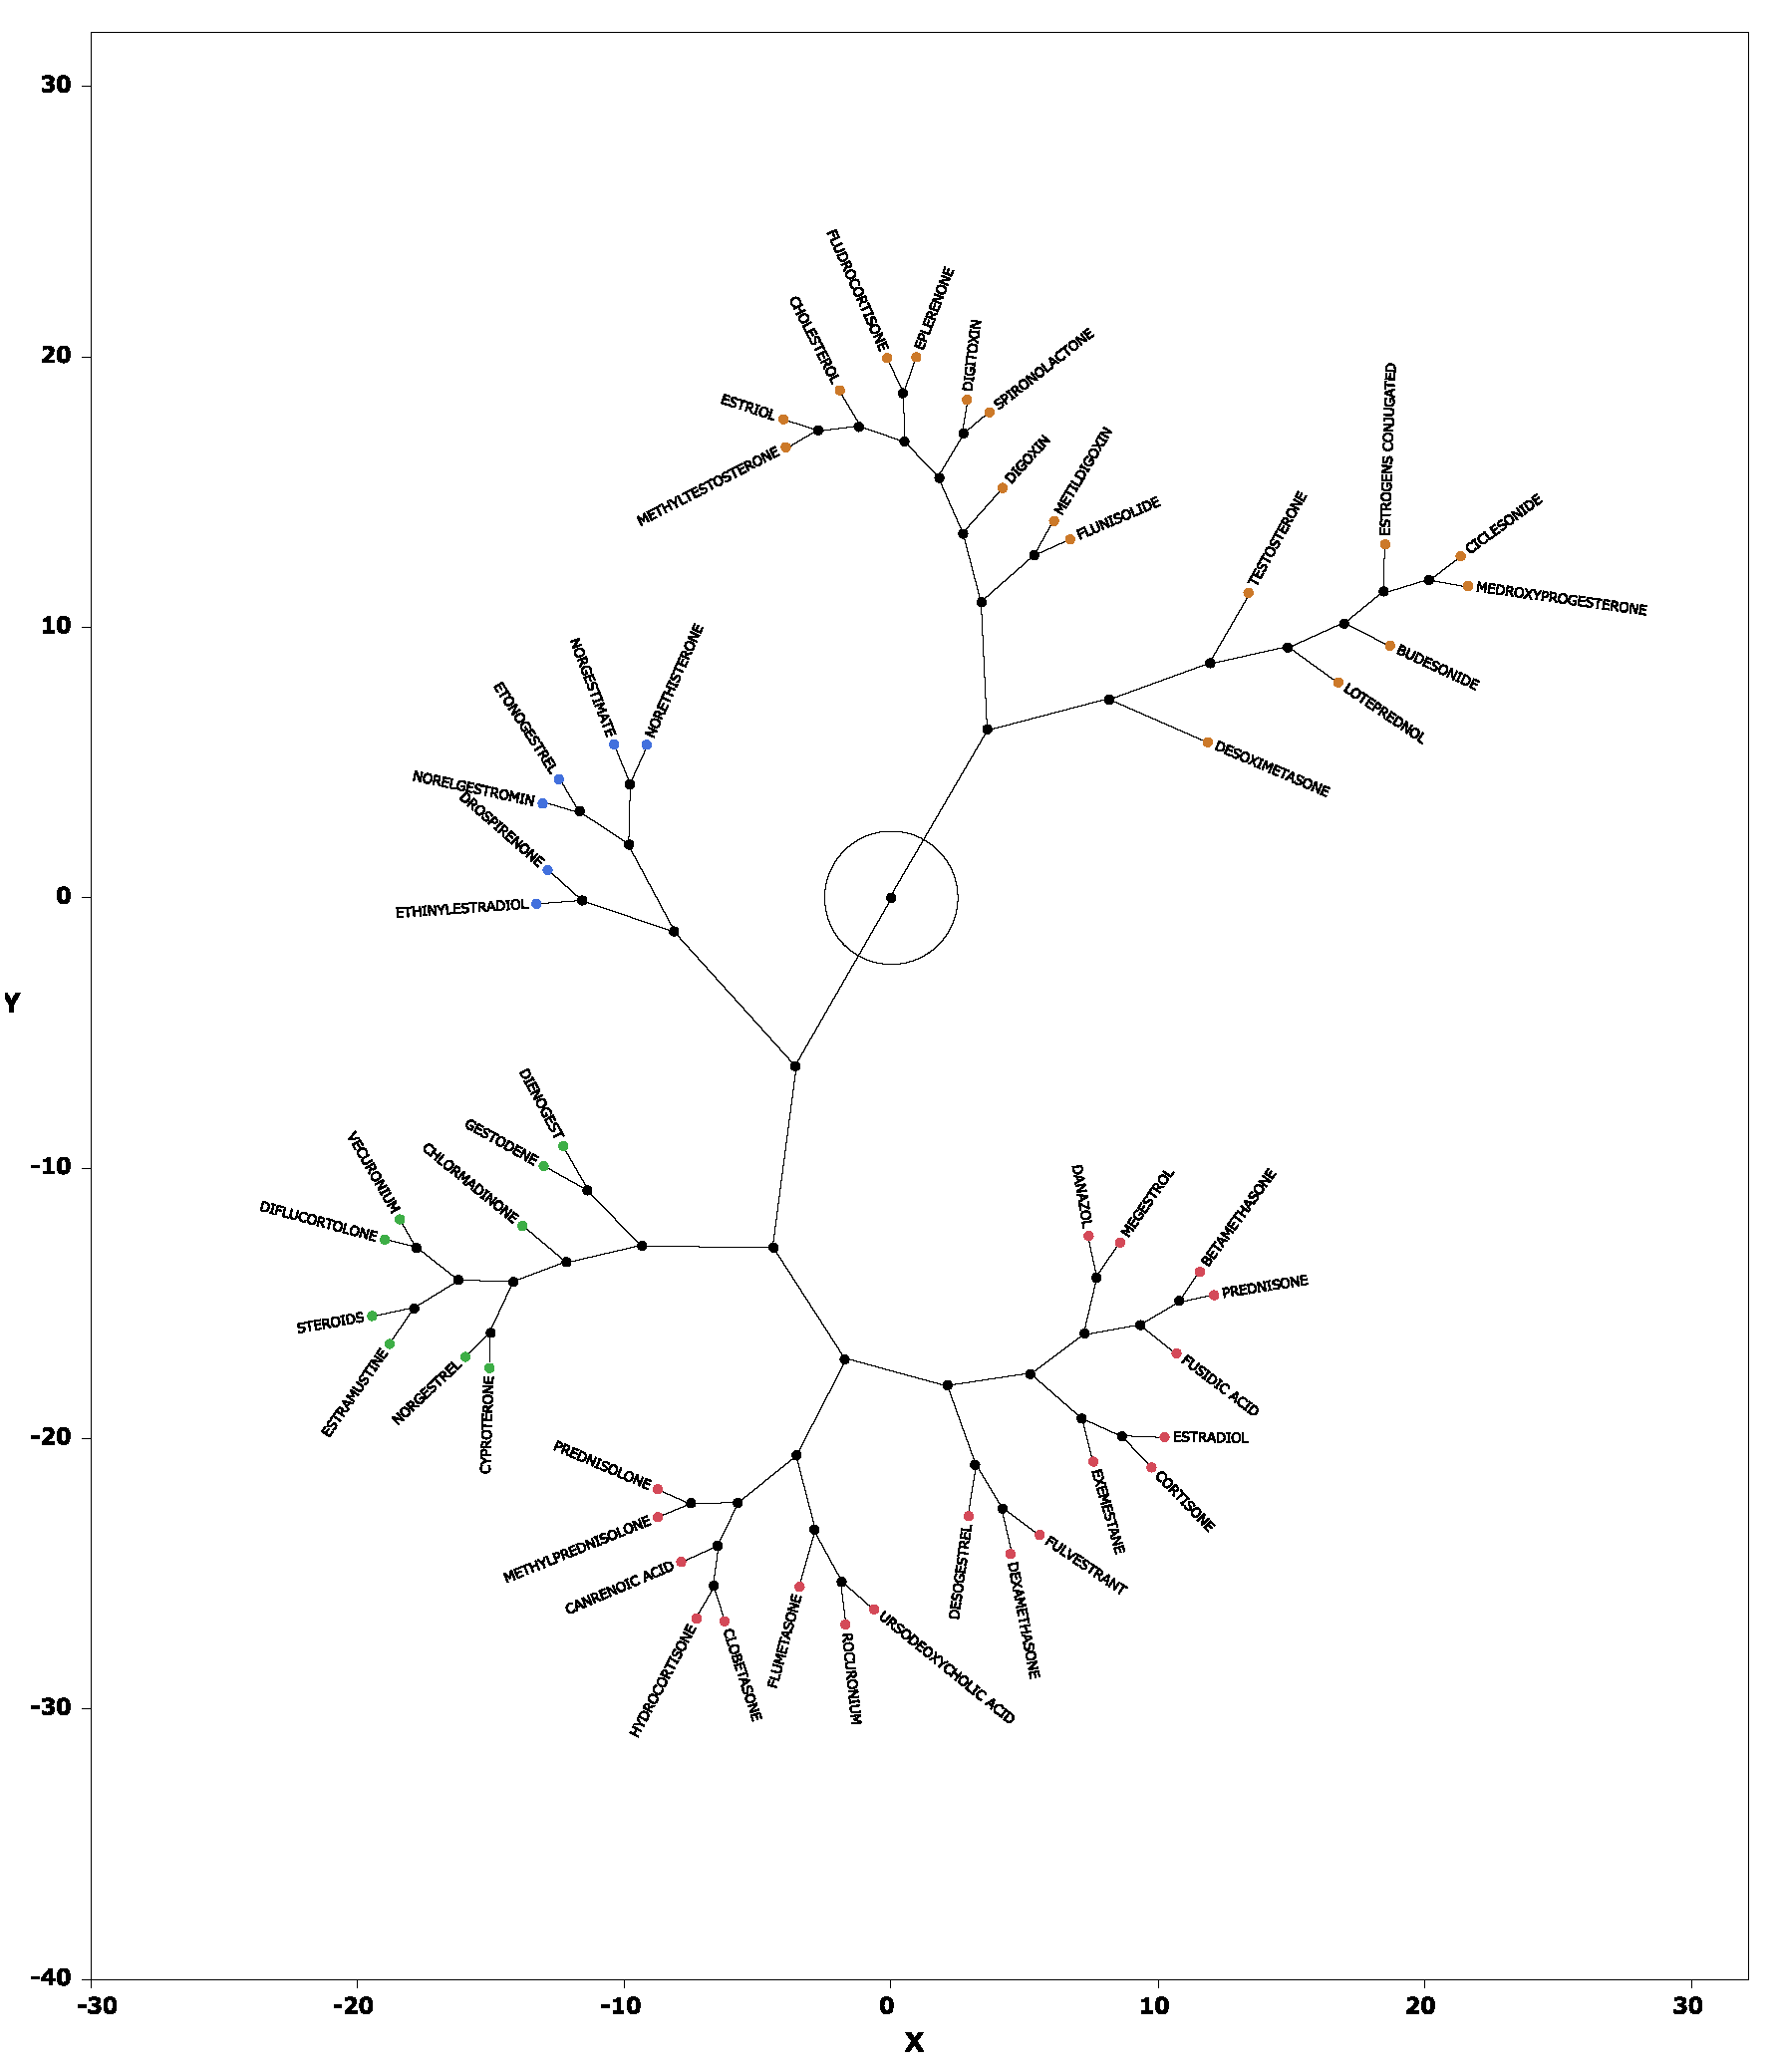

Table 1.
Drugs that have steroid structure.
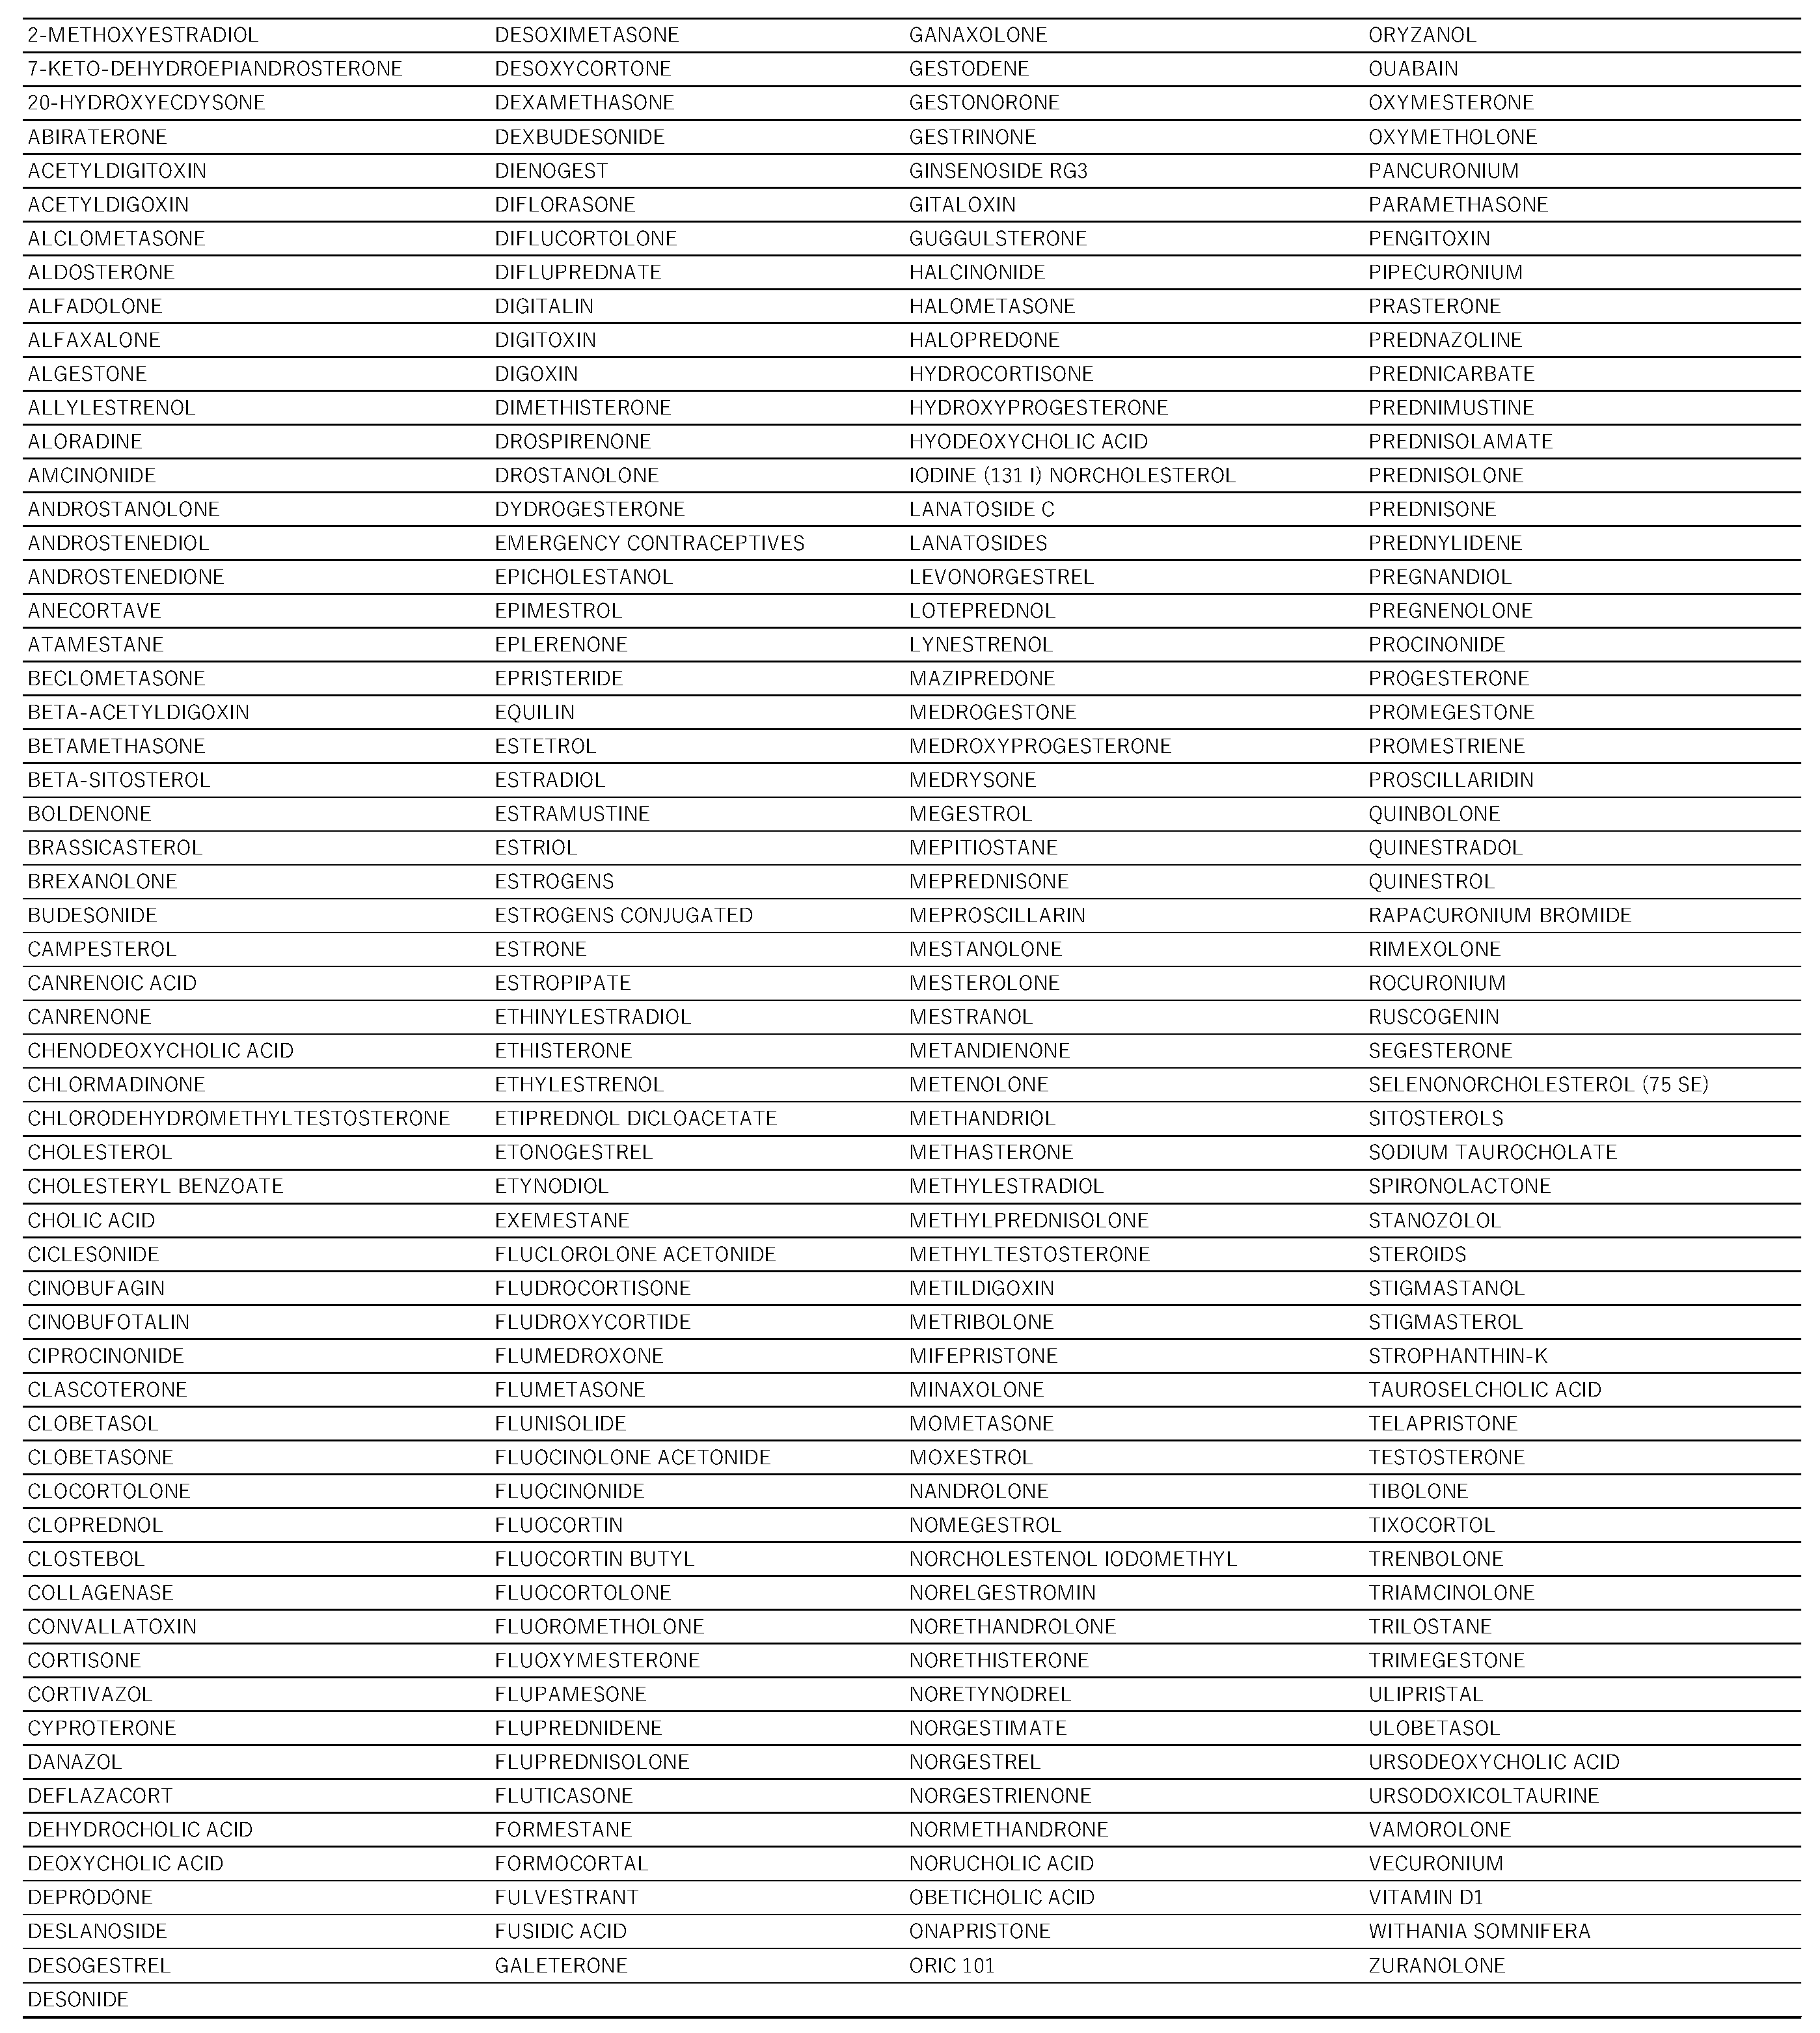 |
Table 2.
Distribution on volcano plots and the p-values and RORs by drug class.
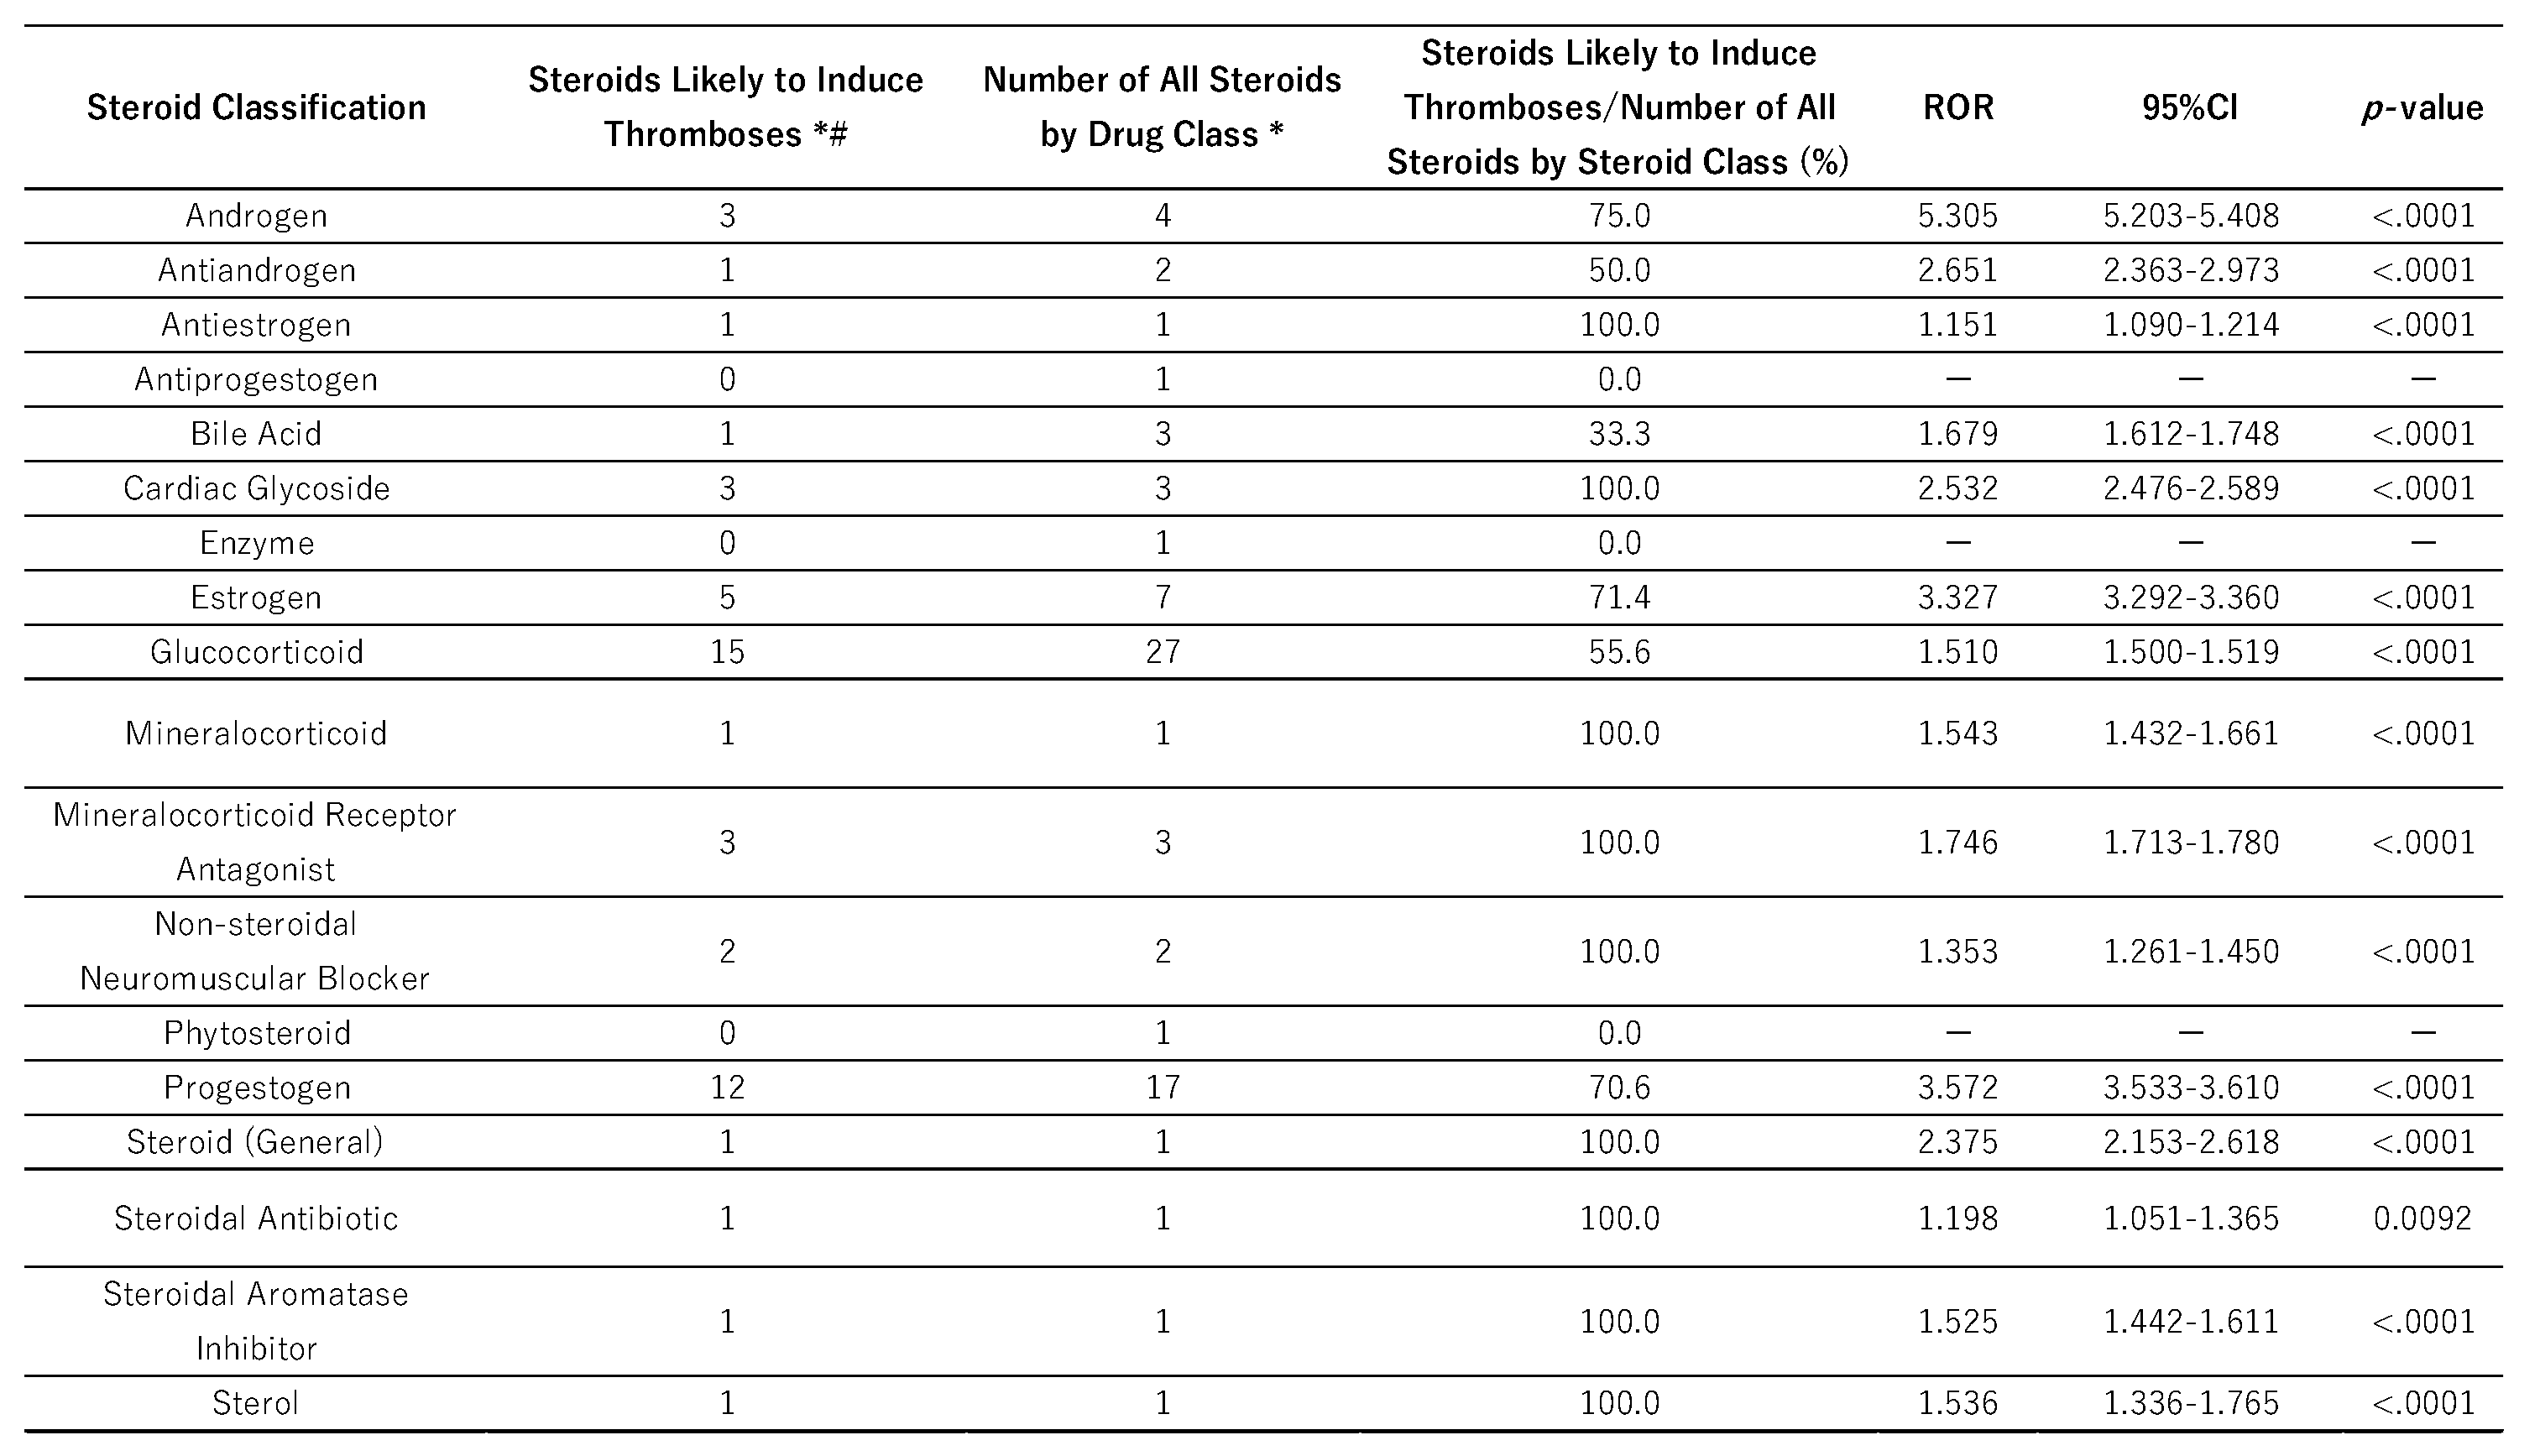 |
Table 3.
Drug Clusters.
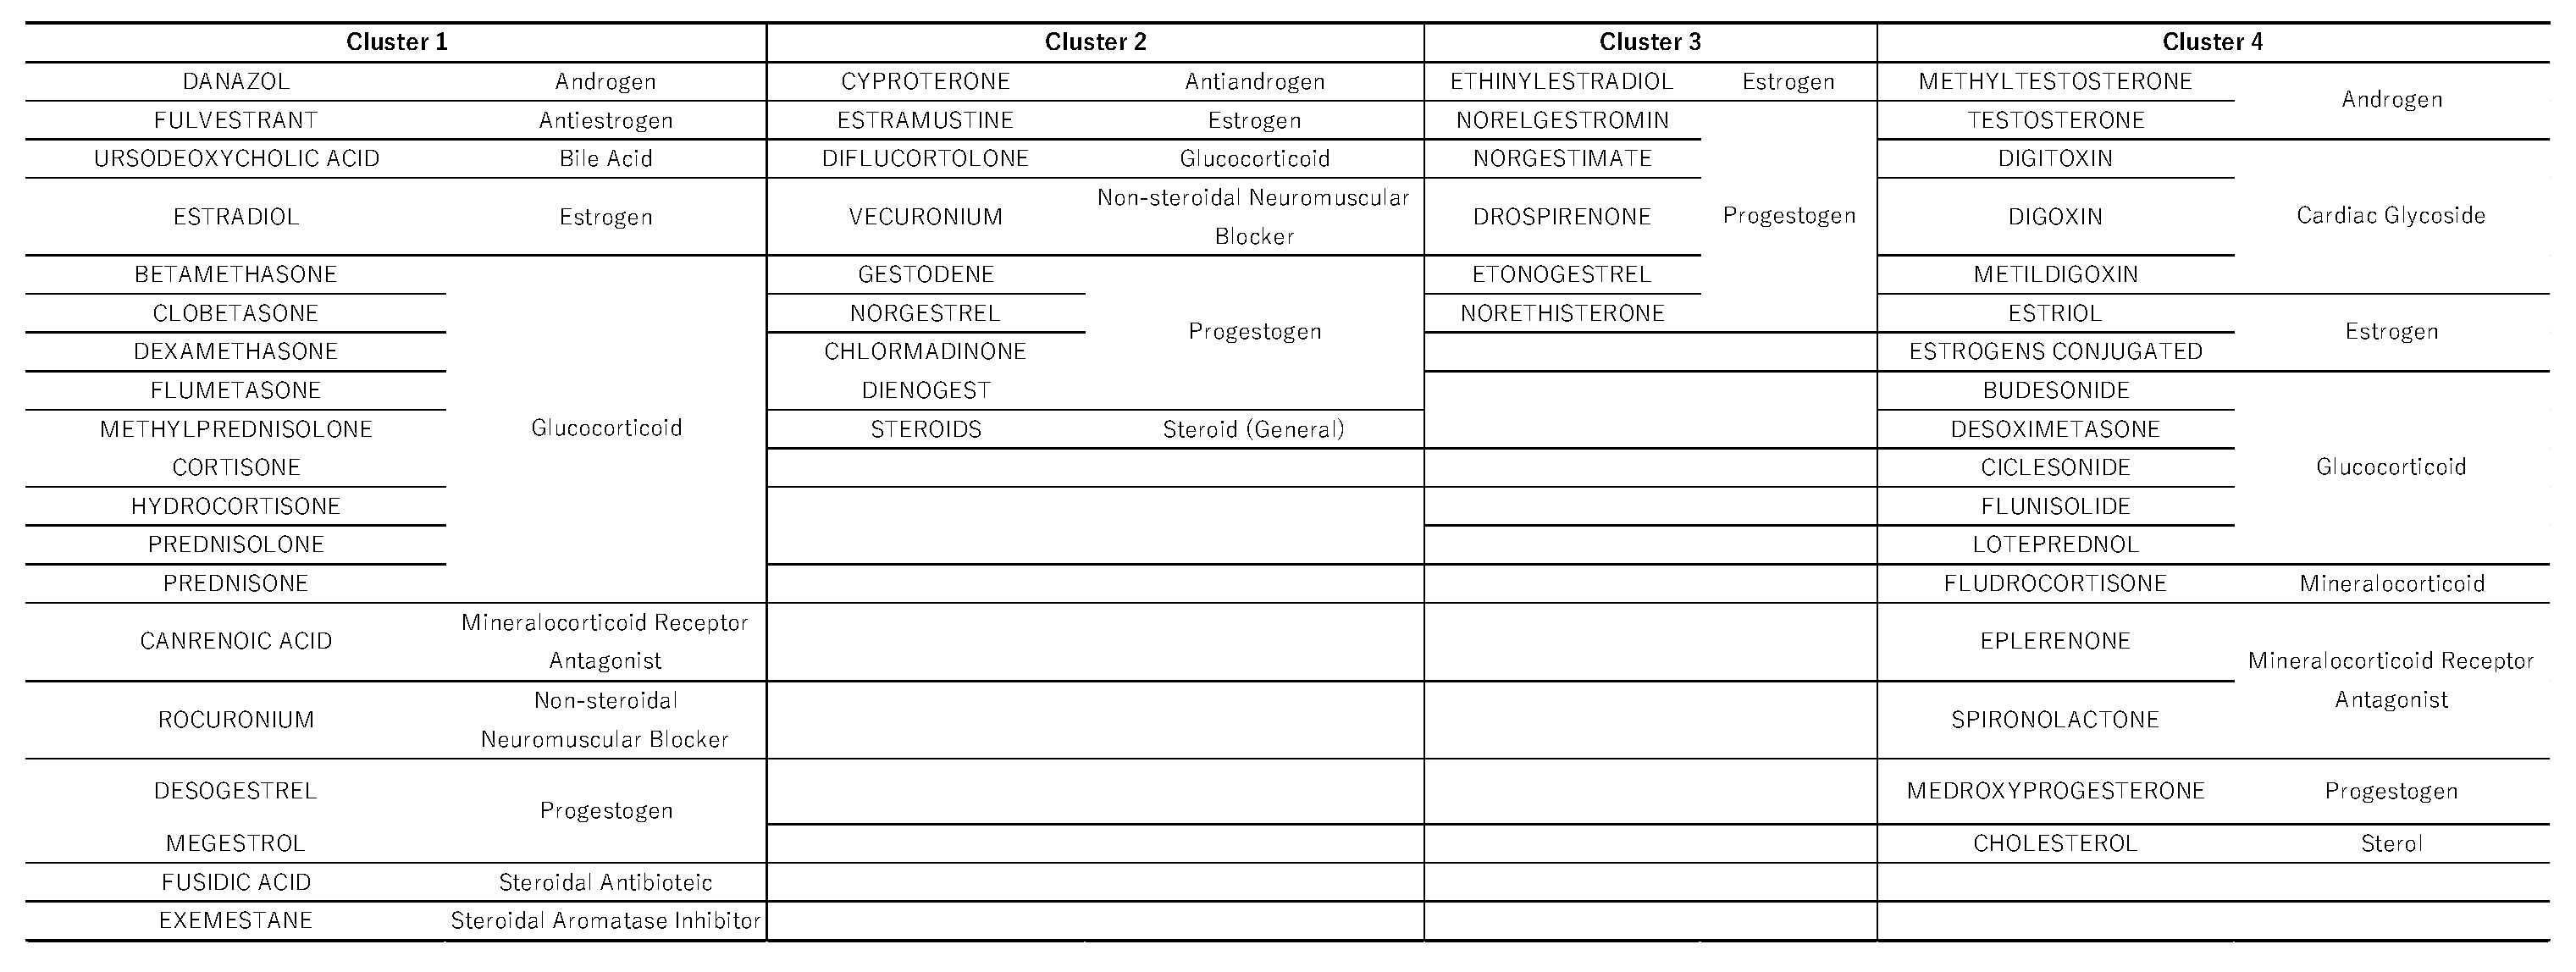 |
Table 5.
Cross-tabulation of the reporting odds ratios.
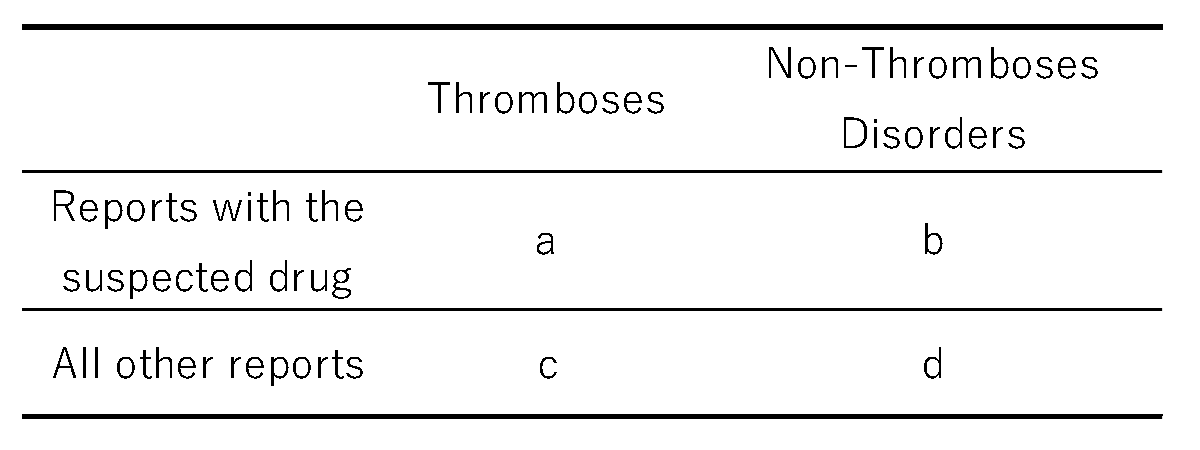 |
Table 6.
Drugs for analysis.
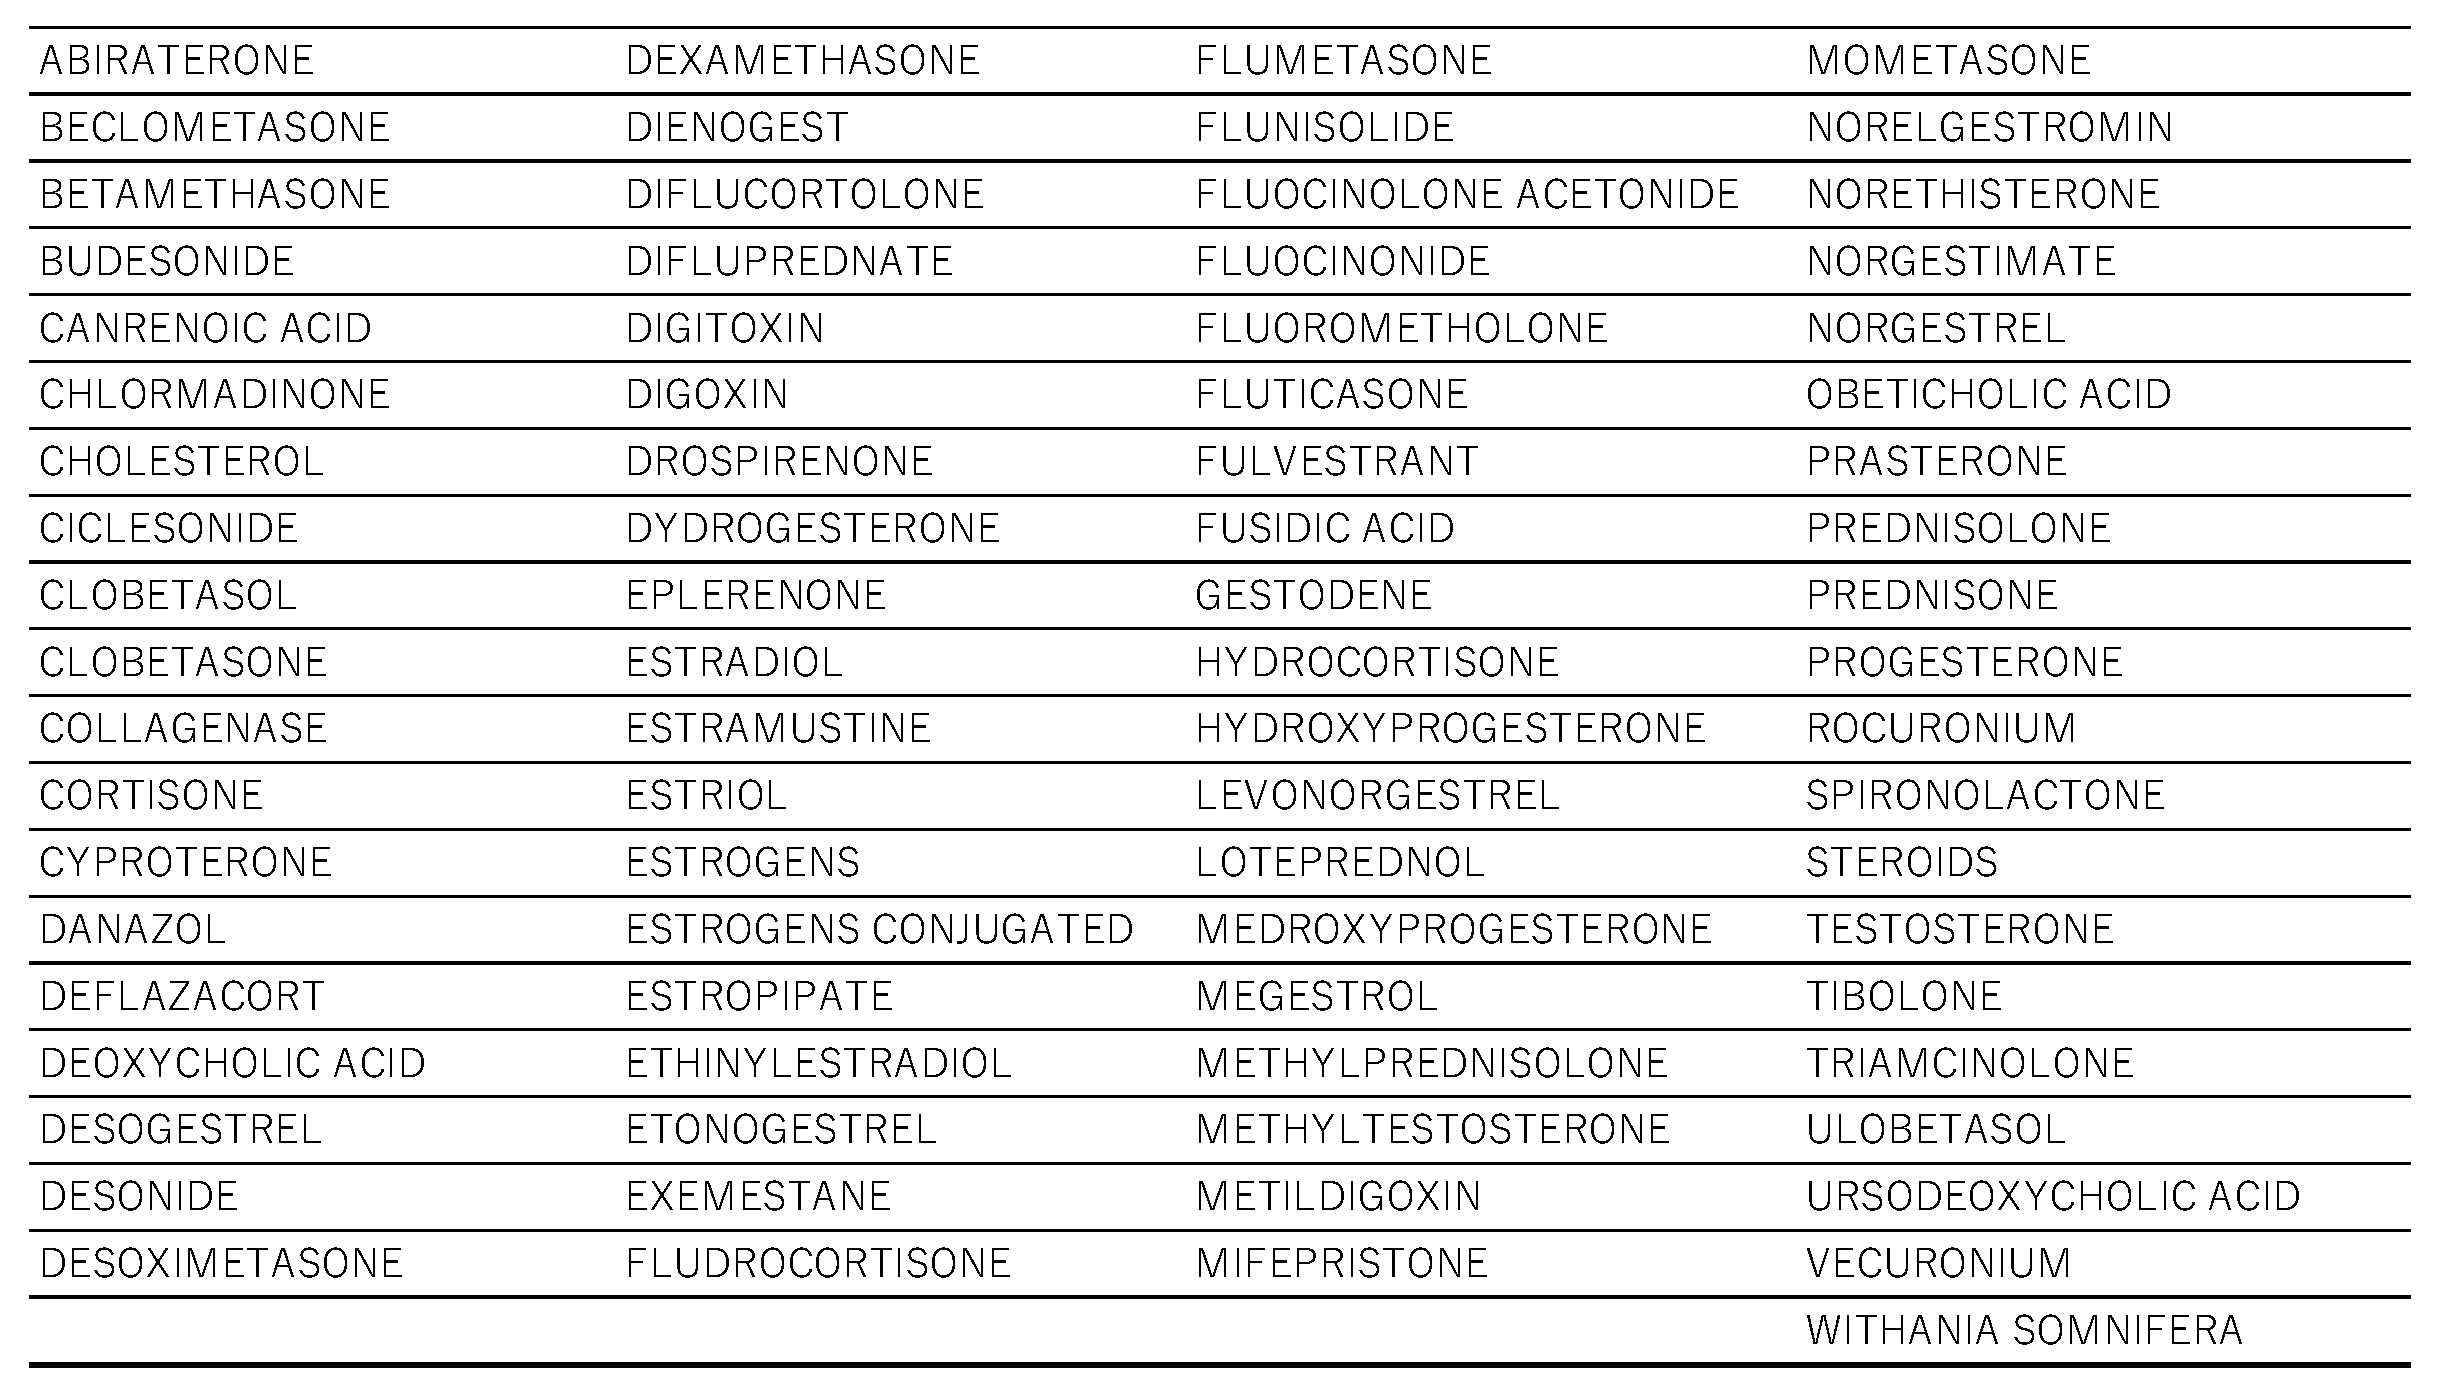 |
Table 7.
Preferred terms for analysis.
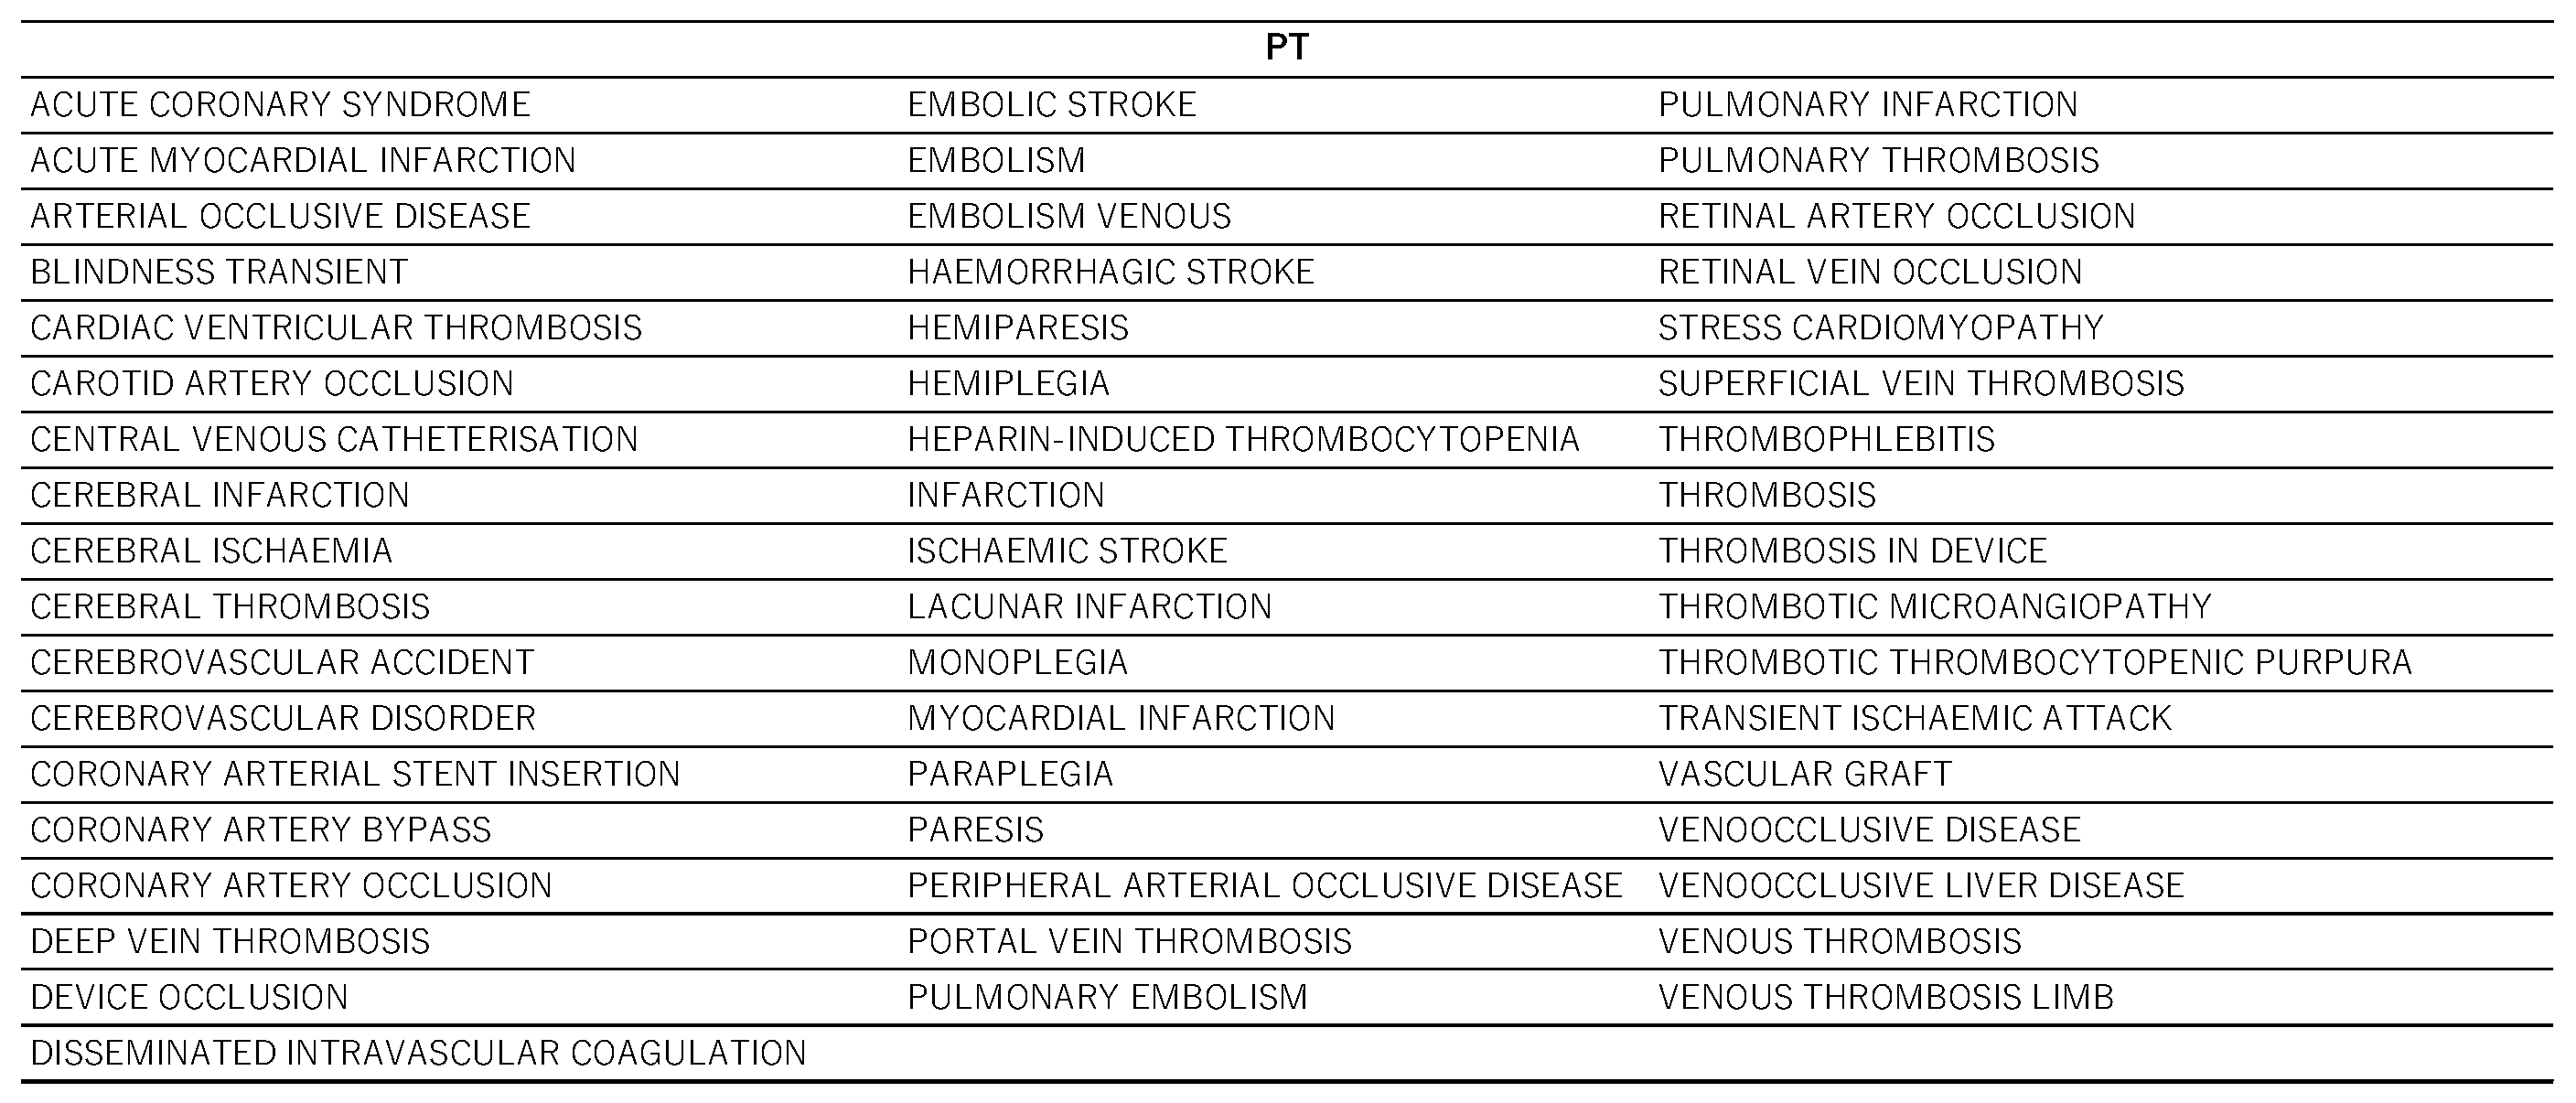 |
Table 8.
The classification of steroids.
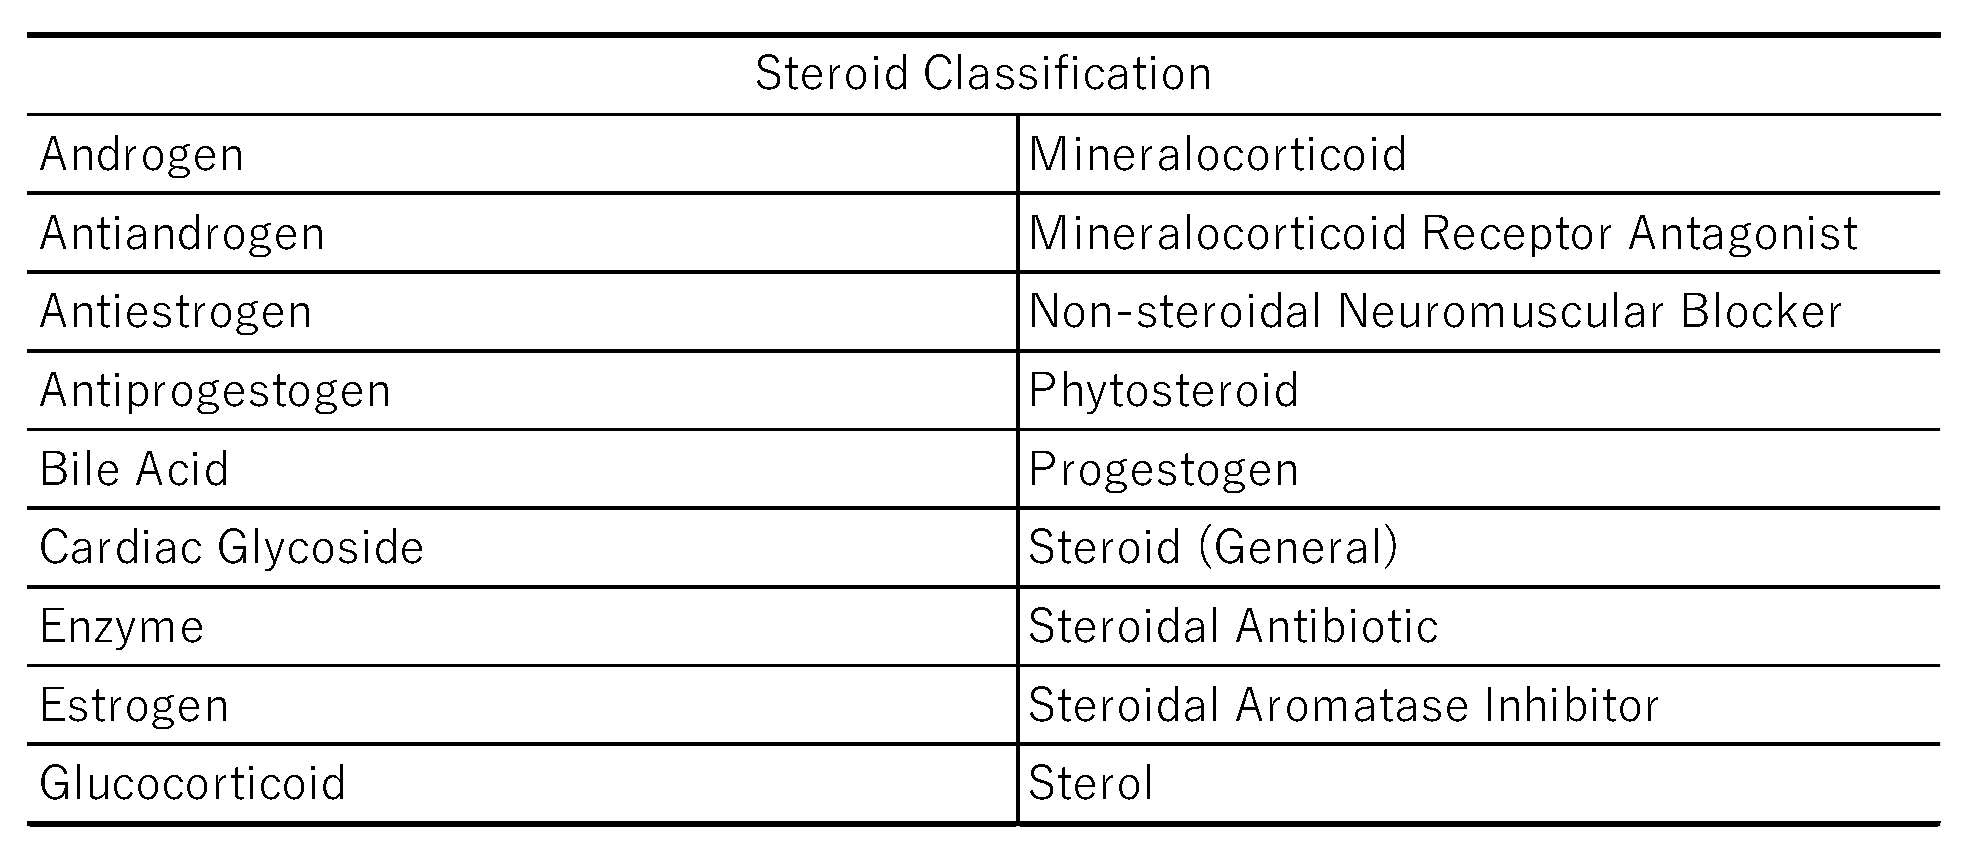 |
Disclaimer/Publisher’s Note: The statements, opinions and data contained in all publications are solely those of the individual author(s) and contributor(s) and not of MDPI and/or the editor(s). MDPI and/or the editor(s) disclaim responsibility for any injury to people or property resulting from any ideas, methods, instructions or products referred to in the content. |
© 2025 by the authors. Licensee MDPI, Basel, Switzerland. This article is an open access article distributed under the terms and conditions of the Creative Commons Attribution (CC BY) license (http://creativecommons.org/licenses/by/4.0/).
Copyright: This open access article is published under a Creative Commons CC BY 4.0 license, which permit the free download, distribution, and reuse, provided that the author and preprint are cited in any reuse.


