
Submitted:
02 July 2025
Posted:
03 July 2025
You are already at the latest version
Abstract
Background/Objectives: The diagnosis of pediatric dental conditions from panoramic radiographs is uniquely challenging due to the dynamic nature of the mixed dentition phase, which can lead to subjective and inconsistent interpretations. This study aims to develop and rigorously validate an advanced deep learning model to enhance diagnostic accuracy and efficiency in pediatric dentistry, providing an objective tool to support clinical decision-making. Methods: YOLO object detection models was developed for the automated identification of four conditions: Dental Caries, Deciduous Tooth, Root Canal Treatment, and Pulpotomy. A stringent two-tiered validation strategy was employed: a primary public dataset (n=644 images) was used for training and the comparative selection of YOLOv11x, while a completely independent external dataset (n=150 images) was used for final testing. All annotations across both datasets were validated by a dual-expert team, comprising a radiologist and a pediatric dentist, ensuring high-quality ground truth. Results: On internal validation, YOLOv11x was selected as the optimal model, achieving a superior mean Average Precision (mAP50) of 0.91. More significantly, when evaluated on the independent external test set, the model demonstrated robust generalization with an overall F1-Score of 0.81 and an mAP50 of 0.82. It yielded strong recall rates for therapeutic interventions (Root Canal Treatment: 88%, Pulpotomy: 86%) and clinically relevant rates for other conditions (Deciduous Tooth: 84%, Dental Caries: 79%). Conclusions: Validated through a rigorous dual-dataset and dual-expert process, the YOLOv11x model proves to be an accurate and reliable tool for automated detection in pediatric panoramic radiographs. This work provides strong evidence that AI-driven systems can augment clinical decision-making, enhance diagnostic precision, and ultimately contribute to improved dental healthcare outcomes for children.
Keywords:
pediatric dentistry
; YOLO models
; panoramic radiographs
; automated detection
; deep learning
; clinical decision support
1. Introduction
Oral diseases represent a major global public health issue, affecting individuals across their lifespan and diminishing their overall quality of life through pain, functional limitations, and psychosocial distress [1]. According to the WHO’s 2022 Global Oral Health Status Report, these conditions affect nearly half of the world’s population, with an estimated 3.5 billion people impacted, showing a higher prevalence in low and middle income countries [2]. The economic consequences are profound, encompassing not only high direct treatment costs but also significant indirect costs related to lost productivity from work and school [3]. Among the spectrum of oral diseases, untreated dental caries of permanent teeth is the single most prevalent condition, affecting over 2 billion people globally, underscoring its status as a primary target for diagnostic and preventive strategies.
Children are a particularly vulnerable demographic for oral diseases due to factors such as cariogenic dietary habits, developing oral hygiene practices, and the unique anatomical features of primary teeth. The impact is significant; for instance, a study in the United States revealed that 43.1% of children aged 2–19 are affected by dental caries [4]. The consequences of untreated caries in this age group extend beyond the need for invasive procedures like Root Canal Treatment or tooth extraction. They can also lead to malnutrition, speech impediments, poor school performance, and diminished self-esteem. Therefore, early and accurate diagnosis is paramount, yet conventional visual tactile examinations can be challenging, especially for detecting incipient lesions on complex surfaces. This diagnostic gap highlights the urgent need for advanced technological aids.
The cornerstone of traditional dental diagnosis is a combination of clinical examination and radiological imaging. Among various radiographic techniques, panoramic radiography (OPG) is a fundamental tool, particularly in pediatric dentistry, as it provides a comprehensive overview of all teeth, the mandible, and the maxilla in a single image [5,6]. This broad perspective is invaluable for assessing dental development, identifying gross pathological lesions, and formulating holistic treatment plans [7]. However, OPGs are not without limitations; they are susceptible to image distortion, overlapping of anatomical structures, and have a lower spatial resolution compared to intraoral radiographs, which can make the detection of subtle anomalies challenging for the human eye [5].
The diagnostic utility of these images is heavily reliant on human interpretation, a cognitive task that requires significant expertise and is susceptible to factors like diagnostic fatigue and high inter and intra observer variability. This subjectivity can lead to inconsistent diagnostic outcomes. To address these challenges, artificial intelligence has emerged as a transformative technology in medical imaging, offering the potential to augment human capabilities by providing objective, rapid, and consistent analysis of complex radiological data.
To address these challenges, artificial intelligence has emerged as a transformative technology in medical imaging. Within the broader field of artificial intelligence, deep learning, and specifically Convolutional Neural Networks (CNNs), have become the predominant methodology for medical image analysis [8,9,10]. Unlike traditional machine learning approaches that require manual, time-consuming feature engineering [9], CNNs are designed to automatically learn hierarchical feature representations directly from raw image data [11,12,15]. This intrinsic capability, which allows them to autonomously identify relevant patterns ranging from simple edges to complex pathological indicators, has revolutionized the field and provides powerful support to clinicians [13,14]. Consequently, deep learning algorithms now provide powerful support to clinicians by enabling the fast and accurate detection of dental anomalies in panoramic images, thereby improving diagnostic accuracy and workflow efficiency.
The application of these artificial intelligence technologies is especially critical and uniquely challenging in pediatric dentistry. The pediatric oral environment is a dynamic landscape characterized by the mixed dentition phase. Unlike the relatively static nature of adult dentition, pediatric radiographs present a constant state of change. Developing tooth germs, resorbing roots of deciduous teeth, and erupting permanent teeth create a complex radiographic tapestry where normal developmental milestones can easily be mistaken for pathological conditions such as cysts, tumors, or abscesses by the untrained eye. This inherent diagnostic ambiguity, which is far less prevalent in adult radiographs, poses a significant risk of misdiagnosis and highlights the urgent need for intelligent systems specifically trained to differentiate these normal, yet complex, developmental variations from true anomalies [16,17].
While previous studies have successfully applied artificial intelligence to dental diagnostics, many have focused on adult populations or singular pathologies like caries. However, as established, the pediatric oral environment presents unique diagnostic challenges that necessitate models specifically trained on this complex data. Furthermore, in a busy clinical setting, diagnostic tools must offer an optimal balance of speed and accuracy. To address these needs, this study first evaluates and compares several state-of-the-art, single-stage object detection algorithms from the YOLO family (YOLOv8, YOLOv9, YOLOv10, and YOLOv11) to identify the most effective architecture for this specific task. Following this comparative analysis, we aim to develop and rigorously validate the selected deep learning model for the simultaneous and automated detection of multiple common pediatric dental findings namely Dental Caries, Deciduous Teeth, Root Canal Treatment, and Pulpotomy from panoramic radiographs. The primary objective is to evaluate the final model’s performance and demonstrate its potential as an efficient and reliable clinical decision support tool capable of enhancing diagnostic accuracy and streamlining workflows in the demanding field of pediatric dental care.
2. Materials and Methods
2.1. Dataset and Preprocessing
This study’s methodology is built upon two distinct image cohorts: a primary public dataset used for model training and a separate, independent external dataset for final testing. This two-tiered data strategy ensures a rigorous and comprehensive evaluation pipeline.
The primary dataset for training and internal validation was sourced from the publicly available collection of pediatric panoramic images by Zhang et al. [19]. The original set contained 644 images from children aged 0–12 years, annotated for 14 conditions. To create a focused and balanced training environment, 10 classes with the fewest labels were excluded. The final curated primary dataset thus comprises the four most frequent conditions, with a detailed class distribution presented in Table 1 and visually represented in Figure 1.
The external test dataset was curated to provide a final, unbiased assessment of the model’s generalization capabilities on data from a completely different source. This independent cohort consists of 150 pediatric panoramic images sourced from public datasets on the Roboflow Universe platform. Further details on the implementation of this external validation set are provided in Section 2.3.1.
To establish an ideal ground truth for all data used in this study, a formal inter-rater reliability analysis was conducted. The complete set of 644 images from the primary dataset and the 150 images from the external dataset were independently evaluated by two experienced clinicians: an oral and maxillofacial radiologist with over 10 years of experience and a board-certified pediatric dentist. This dual-expert approach ensured that all annotations were both radiologically accurate and highly relevant to the specific challenges of pediatric dentistry. The experts verified each label’s presence, class, and bounding box coordinates. The analysis yielded a Cohen’s Kappa coefficient of κ=1.00, representing perfect agreement and providing absolute confidence in the reliability of all annotations used for training and testing.
Image Quality Assessment and Selection Criteria
Prior to their inclusion in the respective datasets, all images underwent a systematic quality assessment to ensure their suitability for robust model training and evaluation. This step is crucial as poor-quality data can introduce noise and reduce model accuracy. The primary objective was to curate a final dataset composed solely of diagnostically viable radiographs. The evaluation was based on a predefined set of criteria including diagnostic value, complete anatomical coverage, absence of significant artifacts, and correct patient positioning. Following the application of these rigorous criteria, all 644 primary images and 150 external images were confirmed to meet the minimum diagnostic quality standards necessary for the study, ensuring that the entire pipeline was built upon a foundation of reliable, high-quality radiographic data.
2.2. Model Selection and Architecture
Modern object detection has evolved significantly from early methods based on hand-designed features, such as Viola-Jones [20] and the Histogram of Oriented Gradients [21]. The advent of Convolutional Neural Networks (CNNs), marked by the success of AlexNet [22] revolutionized the field, paving the way for applications ranging from autonomous vehicles to medical image analysis. Current deep learning models are broadly categorized into two-stage detectors like Faster R-CNN [24], which are noted for high accuracy, and single-stage detectors like You Only Look Once (YOLO) [23], favored for their real-time processing speed. Furthermore, the field has produced architectures optimized for computational efficiency, such as EfficientDet [25], and foundational models like the Swin Transformer [26], which introduced new paradigms for image analysis beyond traditional CNNs. Given the need for a balance between rapid inference and high accuracy in a clinical setting, this study selected the YOLO framework, a state of the art single-stage detector.
The YOLO architecture, first introduced in 2015, has continuously evolved to optimize the trade-off between detection speed and accuracy. As illustrated in its developmental timeline (Figure 2), later versions have incorporated more complex and efficient components to enhance real-time performance and the detection of small objects. To ensure the use of a state of the art model for this study, we evaluated the most recent iterations of the YOLO family: YOLOv8, YOLOv9, YOLOv10, and YOLOv11. To select the most suitable variant for our task, we compared the high-performance versions of these models (YOLOv8x, YOLOv9e, YOLOv10x, and YOLOv11x) based on their parameter counts and computational cost (FLOPs), as detailed in Table 2. This comparison highlighted the need for empirical evaluation, as architectural efficiency (e.g., YOLOv10x having fewer parameters than YOLOv11x) does not always directly translate to superior performance on a specific task.
The evaluated models in the YOLO series (v8, v9, v10, and v11) share a foundational three-part structure comprising a Backbone, Neck, and Head, but they introduce distinct architectural innovations aimed at improving the speed accuracy trade off. YOLOv8 features a streamlined and efficient architecture, making it a strong baseline. YOLOv9 introduced significant enhancements like Programmable Gradient Information and the Generalized Efficient Layer Aggregation Network to improve information flow and learning efficiency. Subsequently, YOLOv10 redesigned the model by incorporating dual label assignments and, most notably, achieving an end to end, NMS free pipeline for deployment, which reduces inference latency. The YOLOv11 model, which is a primary focus of this study, builds upon these advancements by integrating transformer based attention modules and more advanced feature fusion strategies in its neck component to further enhance the detection of small and varied objects. This study’s empirical comparison aims to determine how these progressive architectural modifications affect diagnostic performance on pediatric panoramic radiographs.
2.3. Model Training and Parameters
2.3.1. Model Training and Validation Strategy
A rigorous, two-tiered validation approach was designed to first optimize the model parameters using the primary dataset and then to provide an unbiased assessment of its generalization capabilities on a completely independent, external dataset. This strategy directly addresses the limitations of a simple fixed-split methodology and provides a robust evaluation of the model’s real-world performance. This entire methodological workflow is visually summarized in Figure 3.
Tier 1: Internal Training and Hyperparameter Tuning on the Primary Dataset
The public dataset of 644 images provided by Zhang et al. was utilized exclusively for the training and internal validation phases. Given that panoramic radiographs in this dataset can contain multiple different labels (a multi-label problem), an iterative stratification splitting strategy based on labels was adopted to ensure a representative distribution. The dataset was partitioned into a training set (80%, 515 images) and a validation set (20%, 129 images), with this method guaranteeing that the proportions of each of the four annotated classes were preserved across both subsets. The training set was used for learning the model’s weights, while the validation set was essential for monitoring overfitting, tuning hyperparameters, and selecting the best-performing model checkpoint during the training process.
Tier 2: External Validation on an Independent Public Dataset
To conduct a true and unbiased test of the finalized model’s ability to generalize to data from a different source, a new, independent test cohort was established. This external validation set, consisting of 150 pediatric panoramic radiographs, was curated from various publicly available dental imaging datasets hosted on the Roboflow Universe platform. Great care was taken to select images that matched our study’s inclusion criteria and to ensure that there was absolutely no overlap between this external test set and the primary dataset used for training and validation.
To maintain a consistent and high-quality evaluation standard, this new cohort of 150 images was subjected to the same rigorous annotation protocol as the primary dataset. The images were independently annotated and verified by our two experts to ensure the ground truth was consistent with our study’s diagnostic criteria. This external test set was strictly held out and used only once for the final performance evaluation. Testing the model on data originating from different clinics, imaging equipment, and patient populations, as provided by this external cohort, offers a powerful and realistic measure of the model’s true generalization performance and clinical potential.
2.3.2. Training Configuration and Hyperparameters
To ensure a fair and standardized comparison, all evaluated YOLO models were trained from scratch using a consistent set of hyperparameters, detailed in Table 3. These parameters were selected based on a combination of the Ultralytics framework’s established baseline configurations and best practices reported in the object detection literature. To enhance model generalization and prevent overfitting, a standard suite of data augmentation techniques including mosaic, mixup, and random affine transformations was applied to the training data. The models were trained for 500 epochs to ensure convergence, with performance on the validation set monitored throughout the process to select the optimal checkpoint for each model.
2.4. Performance Evaluation Metrics
The performance of the trained models was quantitatively evaluated using a comprehensive set of metrics. These metrics were chosen to assess the model’s optimization during training (loss functions), its core classification capability (classification metrics), and its overall effectiveness in object detection (detection metrics).
2.4.1. Loss Functions
The model’s learning process was guided by minimizing a composite loss function, which is a weighted sum of three key components:
- Bounding Box (Box) Regression Loss: This component quantifies the accuracy of the predicted bounding box locations and sizes. Modern YOLO versions utilize advanced IoU-based losses, such as Complete IoU (CIoU) Loss, which accounts for overlap area, central point distance, and aspect ratio, leading to more stable training.
- Classification (CLS) Loss: This measures the correctness of the class predictions for each detected object. It is typically calculated using Binary Cross-Entropy (BCE) with logits, which is effective for multi-label classification tasks.
- Objectness (OBJ) or Distribution Focal (DFL) Loss: This component helps the model distinguish between foreground objects and the background. It also uses a BCE-based loss to predict the confidence score for each bounding box.
2.4.2. Classification Performance Metrics
The model’s classification performance was evaluated using metrics derived from a confusion matrix, which compares the predicted labels to the ground-truth labels. The four components of this matrix are:
- True Positive (TP): An instance where the model correctly identifies a positive class.
- False Positive (FP): An instance where the model incorrectly identifies a positive class.
- True Negative (TN): An instance where the model correctly identifies a negative class.
- False Negative (FN): An instance where the model incorrectly identifies a negative class.
From these components, the following metrics were calculated:
- Accuracy: The ratio of all correct predictions (both positive and negative) to the total number of instances, as calculated in Formula 1.
- Precision: The ratio of correctly identified positive detections (True Positives, TP) to the total number of positive detections made by the model (TP + False Positives, FP), as shown in Formula 2. It measures the accuracy of the predictions
- Recall: The ratio of correctly identified positive detections (TP) to the total number of actual positive instances in the data (TP + False Negatives, FN), calculated as shown in Formula 3. It measures the model’s ability to find all relevant objects.
- F1-Score: The harmonic mean of Precision and Recall. It provides a single, balanced measure of a model’s performance, which is particularly useful when there is an uneven class distribution.
2.4.3. Object Detection Metrics
The primary evaluation metric for the object detection task was mean Average Precision (mAP). This metric provides a comprehensive assessment of the model’s ability to both correctly classify and localize objects.
- Average Precision (AP): Calculated as the area under the Precision-Recall curve for a single class, as shown in Formula 5. It summarizes the model’s performance on that specific class across all recall levels
- mean Average Precision (mAP): The mean of the AP values calculated across all classes, as defined by Formula 6. This provides a single, aggregate score for the model’s overall performance. In this study, we report mAP50 (mAP at an IoU threshold of 0.5) and mAP50-95 (mAP averaged over IoU thresholds from 0.5 to 0.95).
2.5. Implementation Details
All experiments were conducted on a high-performance workstation to ensure computational efficiency and reproducibility. The hardware setup consisted of an Intel Core i9-14900K CPU, 64 GB of DDR5 RAM, and an NVIDIA GeForce RTX 4090 GPU with 24 GB of GDDR6X memory for accelerating the deep learning computations.
The software environment was based on the Windows 11 operating system. The models were implemented in Python (v3.11) using the PyTorch deep learning framework (v2.5.1). We utilized the object detection architectures provided by the Ultralytics library (v8.3.158). The training process was accelerated using NVIDIA’s CUDA Toolkit (v12.1) and cuDNN library (v8.9.2). Data manipulation, image processing, and visualization were handled by standard scientific libraries, including NumPy, OpenCV, and Matplotlib
3. Results
This section presents the empirical results of the study. The evaluation was conducted in two sequential stages, consistent with the two-tiered validation strategy. First, to select the most suitable architecture, the four YOLO model variants were competitively evaluated on the internal validation set. Subsequently, the performance of the selected optimal model was definitively assessed on the separate, independent external test set to determine its generalization capability.
3.1. Comparative Performance and Model Selection on the Internal Validation Set
The primary objective of this phase was to identify the optimal model by comparing the performance of YOLOv8x, YOLOv9e, YOLOv10x, and YOLOv11x on the internal validation set. The selection was based on a comprehensive evaluation of detection accuracy, learning efficiency, and computational cost.
The overall object detection performance of the four models was first evaluated using key metrics summarized in Table 4 and Table 5. The YOLOv11x model achieved the highest mean Average Precision at the primary IoU threshold (mAP50 = 0.91), which was the key indicator for overall detection accuracy. Furthermore, it demonstrated a superior balance of precision and recall, culminating in the highest F1-Score of 0.93 among all contestants.
A more detailed analysis of the YOLOv11x model’s performance on the validation set provides deeper insights. The model’s per-class accuracy is detailed in the normalized confusion matrix presented in Figure 4. The matrix reveals excellent performance in identifying therapeutic interventions, with recall rates of 94% for Pulpotomy and 93% for Root Canal Treatment. For the more visually varied classes, the model achieved robust recall rates of 82% for Deciduous Tooth and 84% for Dental Caries. The relationship between precision and recall is further visualized in Figure 5, where the Precision-Recall curve illustrates the model’s high AP across all classes. Qualitative examples of these successful detections from the validation set are provided in Figure 6.
Beyond detection accuracy, the models’ learning efficiency was assessed via their validation loss components, as shown in Table 6. Lower loss values signify a more effective learning process. YOLOv11x registered the lowest Box Loss (0.90) and CLS Loss (0.82) values, confirming its superior ability to accurately localize objects and classify them correctly during training. The stability of this training process is demonstrated by the learning curves in Figure 7, which show a consistent decrease in both training and validation loss over 500 epochs, indicating stable convergence without significant overfitting.
Finally, in terms of computational efficiency, all models performed well. As detailed in Table 7, YOLOv11x was among the fastest in terms of training time per epoch (0.90 seconds).
In summary, based on its superior performance across key detection metrics (mAP50 and F1-Score), its detailed per-class accuracy, its lower validation loss values, and its high computational efficiency, the YOLOv11x model was selected as the optimal model for the final evaluation on the independent external test set.
3.2. Final Performance on the Independent External Test Set
After selecting YOLOv11x as the optimal model, its generalization capability was assessed on the independent external test set, which consisted of 150 images the model had never previously encountered. This final evaluation provides a realistic measure of the model’s performance in real-world scenarios.
The overall performance of YOLOv11x on the external test set is summarized in Table 8. The model achieved a robust F1-Score of 0.81, with a recall of 0.83 and a precision of 0.80.
A detailed, per-class breakdown of the model’s performance on this unseen data is provided by the normalized confusion matrix in Figure 8. The matrix reveals strong performance for detecting therapeutic interventions, with a recall of 88% for Root Canal Treatment and 86% for Pulpotomy. The model also demonstrated effective detection for the more challenging classes, achieving a recall of 79% for Dental Caries and 84% for Deciduous Tooth. The off-diagonal values indicate minimal confusion between the primary pathological conditions, with most errors occurring as confusion with the ‘background’ class. These results confirm that the YOLOv11x model can generalize effectively to new data from different sources.
The primary object detection performance on the external test set was evaluated using the mean Average Precision (mAP) metric, with the final scores presented in Table 9. The model achieved a final mAP50 score of 0.82, demonstrating a high level of accuracy at the standard IoU threshold of 0.5. For the more stringent evaluation across multiple IoU thresholds (from 0.5 to 0.95), the model maintained a robust mAP50-95 score of 0.62. These mAP scores, which represent a comprehensive assessment of both localization and classification accuracy, provide quantitative evidence of the model’s strong and reliable generalization capability.
4. Discussion
This study successfully developed and validated a deep learning model based on the YOLOv11x architecture for the automated detection of four common conditions in pediatric panoramic radiographs. The principal findings demonstrate that the selected model not only performs with high accuracy on internal validation data but also generalizes effectively to a completely independent external test set, highlighting its potential as a reliable clinical decision support tool.
4.1. Interpretation of Findings and Clinical Implications
The core achievement of this study is the robust performance of the YOLOv11x model in a challenging, dynamic pediatric imaging environment. Our two-tiered evaluation strategy revealed two key insights. First, the comparative analysis on the internal validation set showed that YOLOv11x offered a superior balance of high detection accuracy (mAP50 of 0.91) and learning efficiency compared to other state-of-the-art YOLO variants. Second, and more importantly, the final evaluation on the independent external test set confirmed the model’s clinical potential. The model demonstrated strong performance in identifying therapeutic interventions, with recall rates of 88% for Root Canal Treatment and 86% for Pulpotomy. This high accuracy is likely attributable to the distinct and consistent radiographic features of these treatments. The model also achieved robust, clinically relevant recall rates for the more visually ambiguous classes: 79% for Dental Caries and 84% for Deciduous Tooth.
The errors in detecting deciduous teeth, primarily missed detections, are likely concentrated on teeth nearing exfoliation where physiological root resorption diminishes their radiographic signature. This difficulty may be compounded by the superimposition of underlying permanent tooth germs, which can obscure the features of the primary tooth. The few instances of misclassification as dental caries could be attributed to the complex occlusal anatomy of primary molars, which can mimic carious lesions on 2D radiographs.
A detailed analysis of the confusion matrix from the external test (Figure 8) provides deeper insight into specific diagnostic challenges. It shows that most errors were false negatives (confusion with the ‘background’ class) rather than misclassifications between pathological conditions, which suggests the model is conservative in its predictions. Regarding the distinction between primary and permanent teeth, while not a primary objective, the high recall for the ‘Deciduous Tooth’ class and minimal confusion with other classes indicate that the model effectively learned to distinguish primary teeth, though a dedicated study would be needed to confirm its accuracy in numbering or differentiating from all stages of permanent tooth development. As for the minimum degree of caries detected, our annotation protocol focused on radiographically evident lesions that had progressed to the dentin-enamel junction, excluding incipient enamel-only lesions, which defines the current detection threshold of the model.
4.2. Comparison with Existing Literature
The performance of our YOLOv11x model is competitive within the landscape of AI in dental diagnostics. While many studies have focused on adult populations or single pathologies, our work addresses the unique challenges of the pediatric mixed dentition phase. For instance, Kaya et al. [31] achieved an accuracy of 0.89 using YOLOv4 for detecting permanent tooth germs, a task complementary to our detection of deciduous teeth. Our model’s performance is comparable, demonstrating the versatility of the YOLO framework. Similarly, studies using different architectures like Faster R-CNN for primary tooth detection have reported high precision [32], but often lack the inference speed of single-stage detectors like YOLO, which is critical for clinical workflow.
Broader trends in the literature further contextualize our work. A scoping review by Sivari et al. [2] confirms the growing trend and potential of AI in pediatric dentistry, positioning our study as a practical application within this evolving field. Furthermore, a recent study by Bumann et al. [33] focused on segmenting teeth in mixed dentition, achieving a high mAP. Our study complements this by focusing on the detection of specific pathological and therapeutic findings within that same complex environment, demonstrating the feasibility of a multi-target diagnostic tool.
4.3. Strengths and Limitations
A primary strength of this study is its rigorous, two-stage validation methodology. By testing our final model on an independent external dataset, we transcended the limitations of a single-source dataset, thereby providing a more realistic and reliable assessment of the model’s generalization capability. Additional strengths include the use of a dual-expert, clinically relevant ground truth, established collaboratively by a radiologist and a board-certified pediatric dentist, and the systematic comparison of four distinct state-of-the-art YOLO architectures
Despite these strengths, we acknowledge certain limitations. Although an external test set was utilized, both datasets were composed of retrospective digital radiographs; consequently, performance may vary on images acquired from different devices or with different exposure parameters. The dataset size, while typical for such studies, could be expanded to further improve model robustness. An additional limitation is the inherent class imbalance within the dataset (e.g., a higher prevalence of ‘Dental Caries’ labels compared to ‘Pulpotomy’), which can potentially hinder the learning process for minority classes. Moreover, in its current iteration, our model is designed for detection identifying the presence of findings rather than for classification of severity or grading of conditions, such as caries depth or treatment quality.
4.4. Future Directions
The promising outcomes of this study lay the foundation for several future research avenues. To further enhance the model’s generalization capability, future work should focus on training with larger and more diverse datasets sourced from multiple clinical centers. Exploring advanced data augmentation techniques and architectural modifications, such as the integration of more sophisticated attention mechanisms, could notably improve the detection of ambiguous carious lesions and mitigate confounding from background structures.
A critical next step involves conducting prospective clinical trials to assess the model’s impact on real-world diagnostic accuracy, treatment planning, and clinical workflow efficiency for pediatric dentists. Furthermore, a significant advancement would be to evolve the model from its current “detection” capability into a tool for “severity assessment,” capable of classifying carious lesions (e.g., Enamel-Dentin-Pulp involvement) or determining the grades of root resorption. Finally, investigating the model’s utility for longitudinal tracking of a patient’s dynamic dental development and optimizing its performance for deployment on clinical computers with varying hardware capacities will be invaluable steps toward its seamless clinical integration.
5. Conclusions
This study successfully developed and, most importantly, rigorously validated a deep learning framework using the YOLOv11x architecture for the automated detection of four critical findings in pediatric panoramic radiographs. The selected model demonstrated not only high accuracy on internal validation data but also robust generalization capabilities when evaluated on a completely independent external test set. The model’s ability to reliably detect diverse conditions, from carious lesions to therapeutic interventions, underscores its potential as a powerful diagnostic aid for clinicians. By leveraging a state-of-the-art, single-stage detector and proving its efficacy through a stringent two-tiered validation process, this work provides strong evidence that AI-driven systems can significantly enhance diagnostic precision and workflow efficiency in the demanding environment of pediatric dentistry. This contributes to the ultimate goal of improving dental healthcare outcomes for children globally.
Author Contributions
U.Ş. (First Author) advanced the conceptual development of the study, critically reviewed the manuscript, and contributed to the interpretation of the findings. O.M. (Second Author) identified the initial idea and dataset, implemented the artificial intelligence algorithms and coding processes, conducted the experimental studies, and prepared the first draft of the manuscript. Onur Mutlu also took the lead in organizing and finalizing the manuscript based on feedback. Both authors have read and agreed to the published version of the manuscript.
Funding
No funding was received to assist with the preparation of this manuscript.
Data Availability Statement
The data is available at: https://www.kisa.link/PAhjU.
Acknowledgments
The authors are deeply grateful to the clinical experts whose contributions were fundamental to this study’s validity. We extend our sincere appreciation to the board-certified pediatric dentist and the experienced oral and maxillofacial radiologist who meticulously and independently validated the annotations for the entire dataset. Their rigorous work was essential in establishing the high-quality ground truth that underpins our findings
Conflicts of Interest
The authors declare they have no financial interests.
References
- Özşin Özler, C.; İleri Keçeli, T.; Uzamış Tekçiçek, M. Pediatric Dentistry and General Anesthesia. Ankara Med. J. 2019. [Google Scholar] [CrossRef]
- Sivari, E.; Senirkentli, G.B.; Bostanci, E.; Guzel, M.S.; Acici, K.; Asuroglu, T. Deep Learning in Diagnosis of Dental Anomalies and Diseases: A Systematic Review. Diagnostics 13 (2023). [CrossRef]
- Peres, M.A.; Macpherson, L.M.D.; Weyant, R.J.; Daly, B.; Venturelli, R.; Mathur, M.R.; Listl, S.; Celeste, R.K.; Guarnizo-Herreño, C.C.; Kearns, C.; Benzian, H.; Allison, P.; Watt, R.G. Oral Diseases: A Global Public Health Challenge. Lancet 394 (2019) 249–260. [CrossRef]
- Ali, A.H.; Koller, G.; Foschi, F.; Andiappan, M.; Bruce, K.D.; Banerjee, A.; Mannocci, F. Self-Limiting versus Conventional Caries Removal: A Randomized Clinical Trial. J. Dent. Res. 97 (2018) 1207–1213. [CrossRef]
- Muresan, M.P.; Barbura, A.R.; Nedevschi, S. Teeth Detection and Dental Problem Classification in Panoramic X-Ray Images using Deep Learning and Image Processing Techniques. Proceedings - 2020 IEEE 16th Int. Conf. on Intell. Comput. Commun. Process. ICCP 2020 (2020) 457–463. [CrossRef]
- Schwendicke, F.; Golla, T.; Dreher, M.; Krois, J. Convolutional Neural Networks for Dental Image Diagnostics: A Scoping Review. J. Dent. 91 (2019) 103226. [CrossRef]
- Macdonald, D.; Yu, W. Incidental Findings in a Consecutive Series of Digital Panoramic Radiographs. Imaging Sci. Dent. 50 (2020) 53–64. [CrossRef]
- Nguyen, T.T. Use of Artificial Intelligence in Dentistry: Current Clinical Trends and Research Advances. (2021).
- Park, W.J.; Park, J.B. History and Application of Artificial Neural Networks in Dentistry. Eur. J. Dent. 12 (2018) 594–601.
- Saglam, H.; ARI, T.; BAYRAKDAR, İ.Ş.; BİLGİR, E.; UĞURLU, M.; ÇELİK, Ö.; ORHAN, K. Diş Hekimliğinde Yapay Zeka. Sağlık Bilimlerinde Yapay Zeka Dergisi (Journal of Artificial Intelligence in Health Sciences) ISSN:2757-9646 1 (2021) 26–33. [CrossRef]
- Mumuni, A.; Mumuni, F. Automated Data Processing and Feature Engineering for Deep Learning and Big Data Applications: A Survey. J. Inf. Intell. 2024. [CrossRef]
- Zhou, T.; Ruan, S.; Canu, S. A Review: Deep Learning for Medical Image Segmentation Using Multi-Modality Fusion. Array 3–4 (2020). [CrossRef]
- Prados-Privado, M.; Villalón, J.G.; Martínez-Martínez, C.H.; Ivorra, C. Dental Images Recognition Technology and Applications: A Literature Review. Appl. Sci. 2020, 10, 2856. [Google Scholar] [CrossRef]
- Naqvi, R.A.; Arsalan, M.; Qaiser, T.; Khan, T.M.; Razzak, I. Sensor Data Fusion Based on Deep Learning for Computer Vision Applications and Medical Applications. Sensors 22 (2022) 8058. [CrossRef]
- Hamdan, M.H.; Tuzova, L.; Mol, A.; Tawil, P.Z.; Tuzoff, D.; Tyndall, D.A. The Effect of a Deep-Learning Tool on Dentists’ Performances in Detecting Apical Radiolucencies on Periapical Radiographs. Dentomaxillofacial Radiol. 51 (2022).
- Vishwanathaiah, S.; Fageeh, H.N.; Khanagar, S.B.; Maganur, P.C. Artificial Intelligence Its Uses and Application in Pediatric Dentistry: A Review. Biomedicines 11 (2023) 788. [CrossRef]
- Çolak, H.; Dülgergil, Ç.; Dalli, M.; Hamidi, M. Early Childhood Caries Update: A Review of Causes, Diagnoses, and Treatments. J. Nat. Sci. Biol. Med. 4 (2013) 29. [CrossRef]
- Khanam, R.; Hussain, M. YOLOv11: An Overview of the Key Architectural Enhancements. (2024). Available online: https://arxiv.org/abs/2410.17725v1 (accessed on 11 December 2024).
- Zhang, Y.; Ye, F.; Chen, L.; Xu, F.; Chen, X.; Wu, H.; Cao, M.; Li, Y.; Wang, Y.; Huang, X. Children’s Dental Panoramic Radiographs Dataset for Caries Segmentation and Dental Disease Detection. Sci. Data 10 (2023). [CrossRef]
- Viola, P.; Jones, M. Rapid Object Detection Using a Boosted Cascade of Simple Features. Proceedings of the IEEE Computer Society Conference on Computer Vision and Pattern Recognition 1 (2001). [CrossRef]
- Dalal, N.; Triggs, B. Histograms of Oriented Gradients for Human Detection. Proceedings - 2005 IEEE Computer Society Conference on Computer Vision and Pattern Recognition, CVPR 2005 I (2005) 886–893. [CrossRef]
- Krizhevsky, A.; Sutskever, I.; Hinton, G.E. ImageNet Classification with Deep Convolutional Neural Networks. Adv. Neural Inf. Process. Syst. 25 (2012).
- Redmon, J.; Farhadi, A. YOLO9000: Better, Faster, Stronger. Proceedings - 30th IEEE Conference on Computer Vision and Pattern Recognition, CVPR 2017 2017-January (2017) 6517–6525. [CrossRef]
- Ren, S.; He, K.; Girshick, R.; Sun, J. Faster R-CNN: Towards Real-Time Object Detection with Region Proposal Networks. IEEE Trans. Pattern Anal. Mach. Intell. 39 (2015) 1137–1149. [CrossRef]
- Tan, M.; Pang, R.; Le, Q.V. EfficientDet: Scalable and Efficient Object Detection. Proceedings of the IEEE Computer Society Conference on Computer Vision and Pattern Recognition (2019) 10778–10787. [CrossRef]
- Liu, Z.; Lin, Y.; Cao, Y.; Hu, H.; Wei, Y.; Zhang, Z.; Lin, S.; Guo, B. Swin Transformer: Hierarchical Vision Transformer Using Shifted Windows. Proceedings of the IEEE International Conference on Computer Vision (2021) 9992–10002. [CrossRef]
- Sapkota, R.; Meng, Z.; Churuvija, M.; Du, X.; Ma, Z.; Karkee, M. Comprehensive Performance Evaluation of YOLO11, YOLOv10, YOLOv9, and YOLOv8 on Detecting and Counting Fruitlet in Complex Orchard Environments. (2024). Available online: https://arxiv.org/abs/2407.12040v5 (accessed on 11 December 2024).
- Terven, J.; Córdova-Esparza, D.M.; Romero-González, J.A. A Comprehensive Review of YOLO Architectures in Computer Vision: From YOLOv1 to YOLOv8 and YOLO-NAS. Machine Learning and Knowledge Extraction 5 (2023) 1680–1716. [CrossRef]
- Khanam, R.; Hussain, M.; Hill, R.; Allen, P. A Comprehensive Review of Convolutional Neural Networks for Defect Detection in Industrial Applications. IEEE Access 12 (2024) 94250–94295. [CrossRef]
- YOLO11 🚀 YENİ - Ultralytics YOLO Documentation. (n.d.). Available online: https://docs.ultralytics.com/tr/models/yolo11/ (accessed on 11 December 2024).
- Kaya, E.; Gunec, H.G.; Aydin, K.C.; Urkmez, E.S.; Duranay, R.; Ates, H.F. A Deep Learning Approach to Permanent Tooth Germ Detection on Pediatric Panoramic Radiographs. Imaging Sci. Dent. 52 (2022) 275–281. [CrossRef]
- Kılıc, M.C.; Bayrakdar, I.S.; Çelik, Ö.; Bilgir, E.; Orhan, K.; Aydın, O.B.; Kaplan, F.A.; Sağlam, H.; Odabaş, A.; Aslan, A.F.; Yılmaz, A.B. Artificial Intelligence System for Automatic Deciduous Tooth Detection and Numbering in Panoramic Radiographs. Dentomaxillofacial Radiol. 50 (2021) 20200172.
- Bumann, E.E.; Al-Qarni, S.; Chandrashekar, G.; Sabzian, R.; Bohaty, B.; Lee, Y. A Novel Collaborative Learning Model for Mixed Dentition and Fillings Segmentation in Panoramic Radiographs. J. Dent. 140 (2024) 104779. [CrossRef]
Figure 1.
Representative examples of the four annotated dental conditions from the primary dataset. The images display examples of (a) Dental Caries, (b) Deciduous Tooth, (c) Root Canal Treatment, and (d) Pulpotomy. Bounding boxes indicate the ground-truth labels used for model training.
Figure 1.
Representative examples of the four annotated dental conditions from the primary dataset. The images display examples of (a) Dental Caries, (b) Deciduous Tooth, (c) Root Canal Treatment, and (d) Pulpotomy. Bounding boxes indicate the ground-truth labels used for model training.
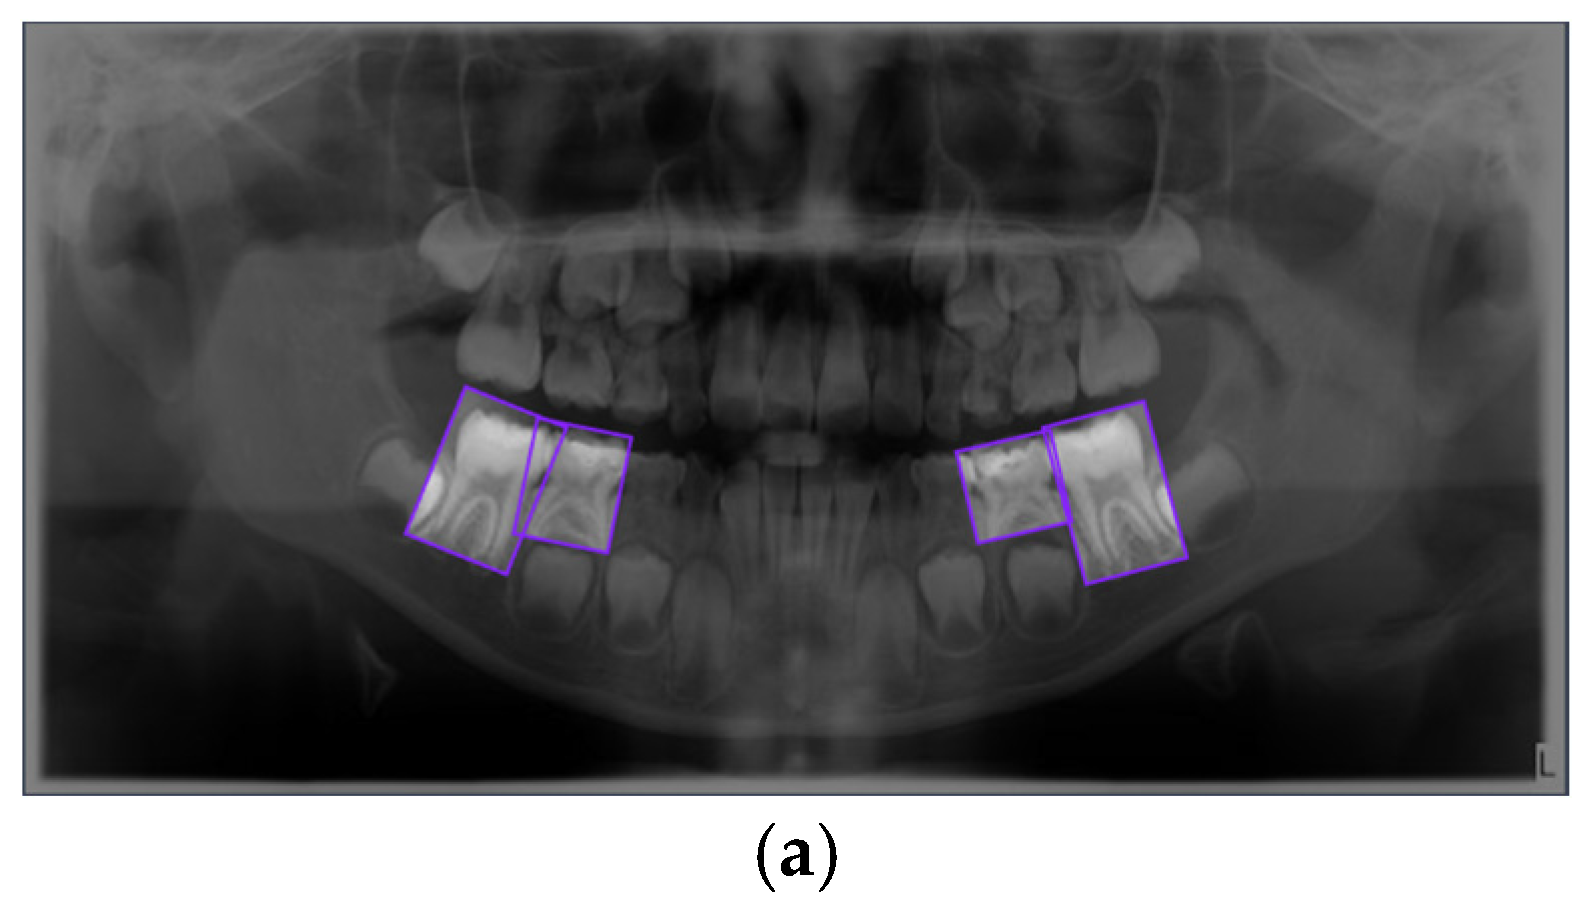
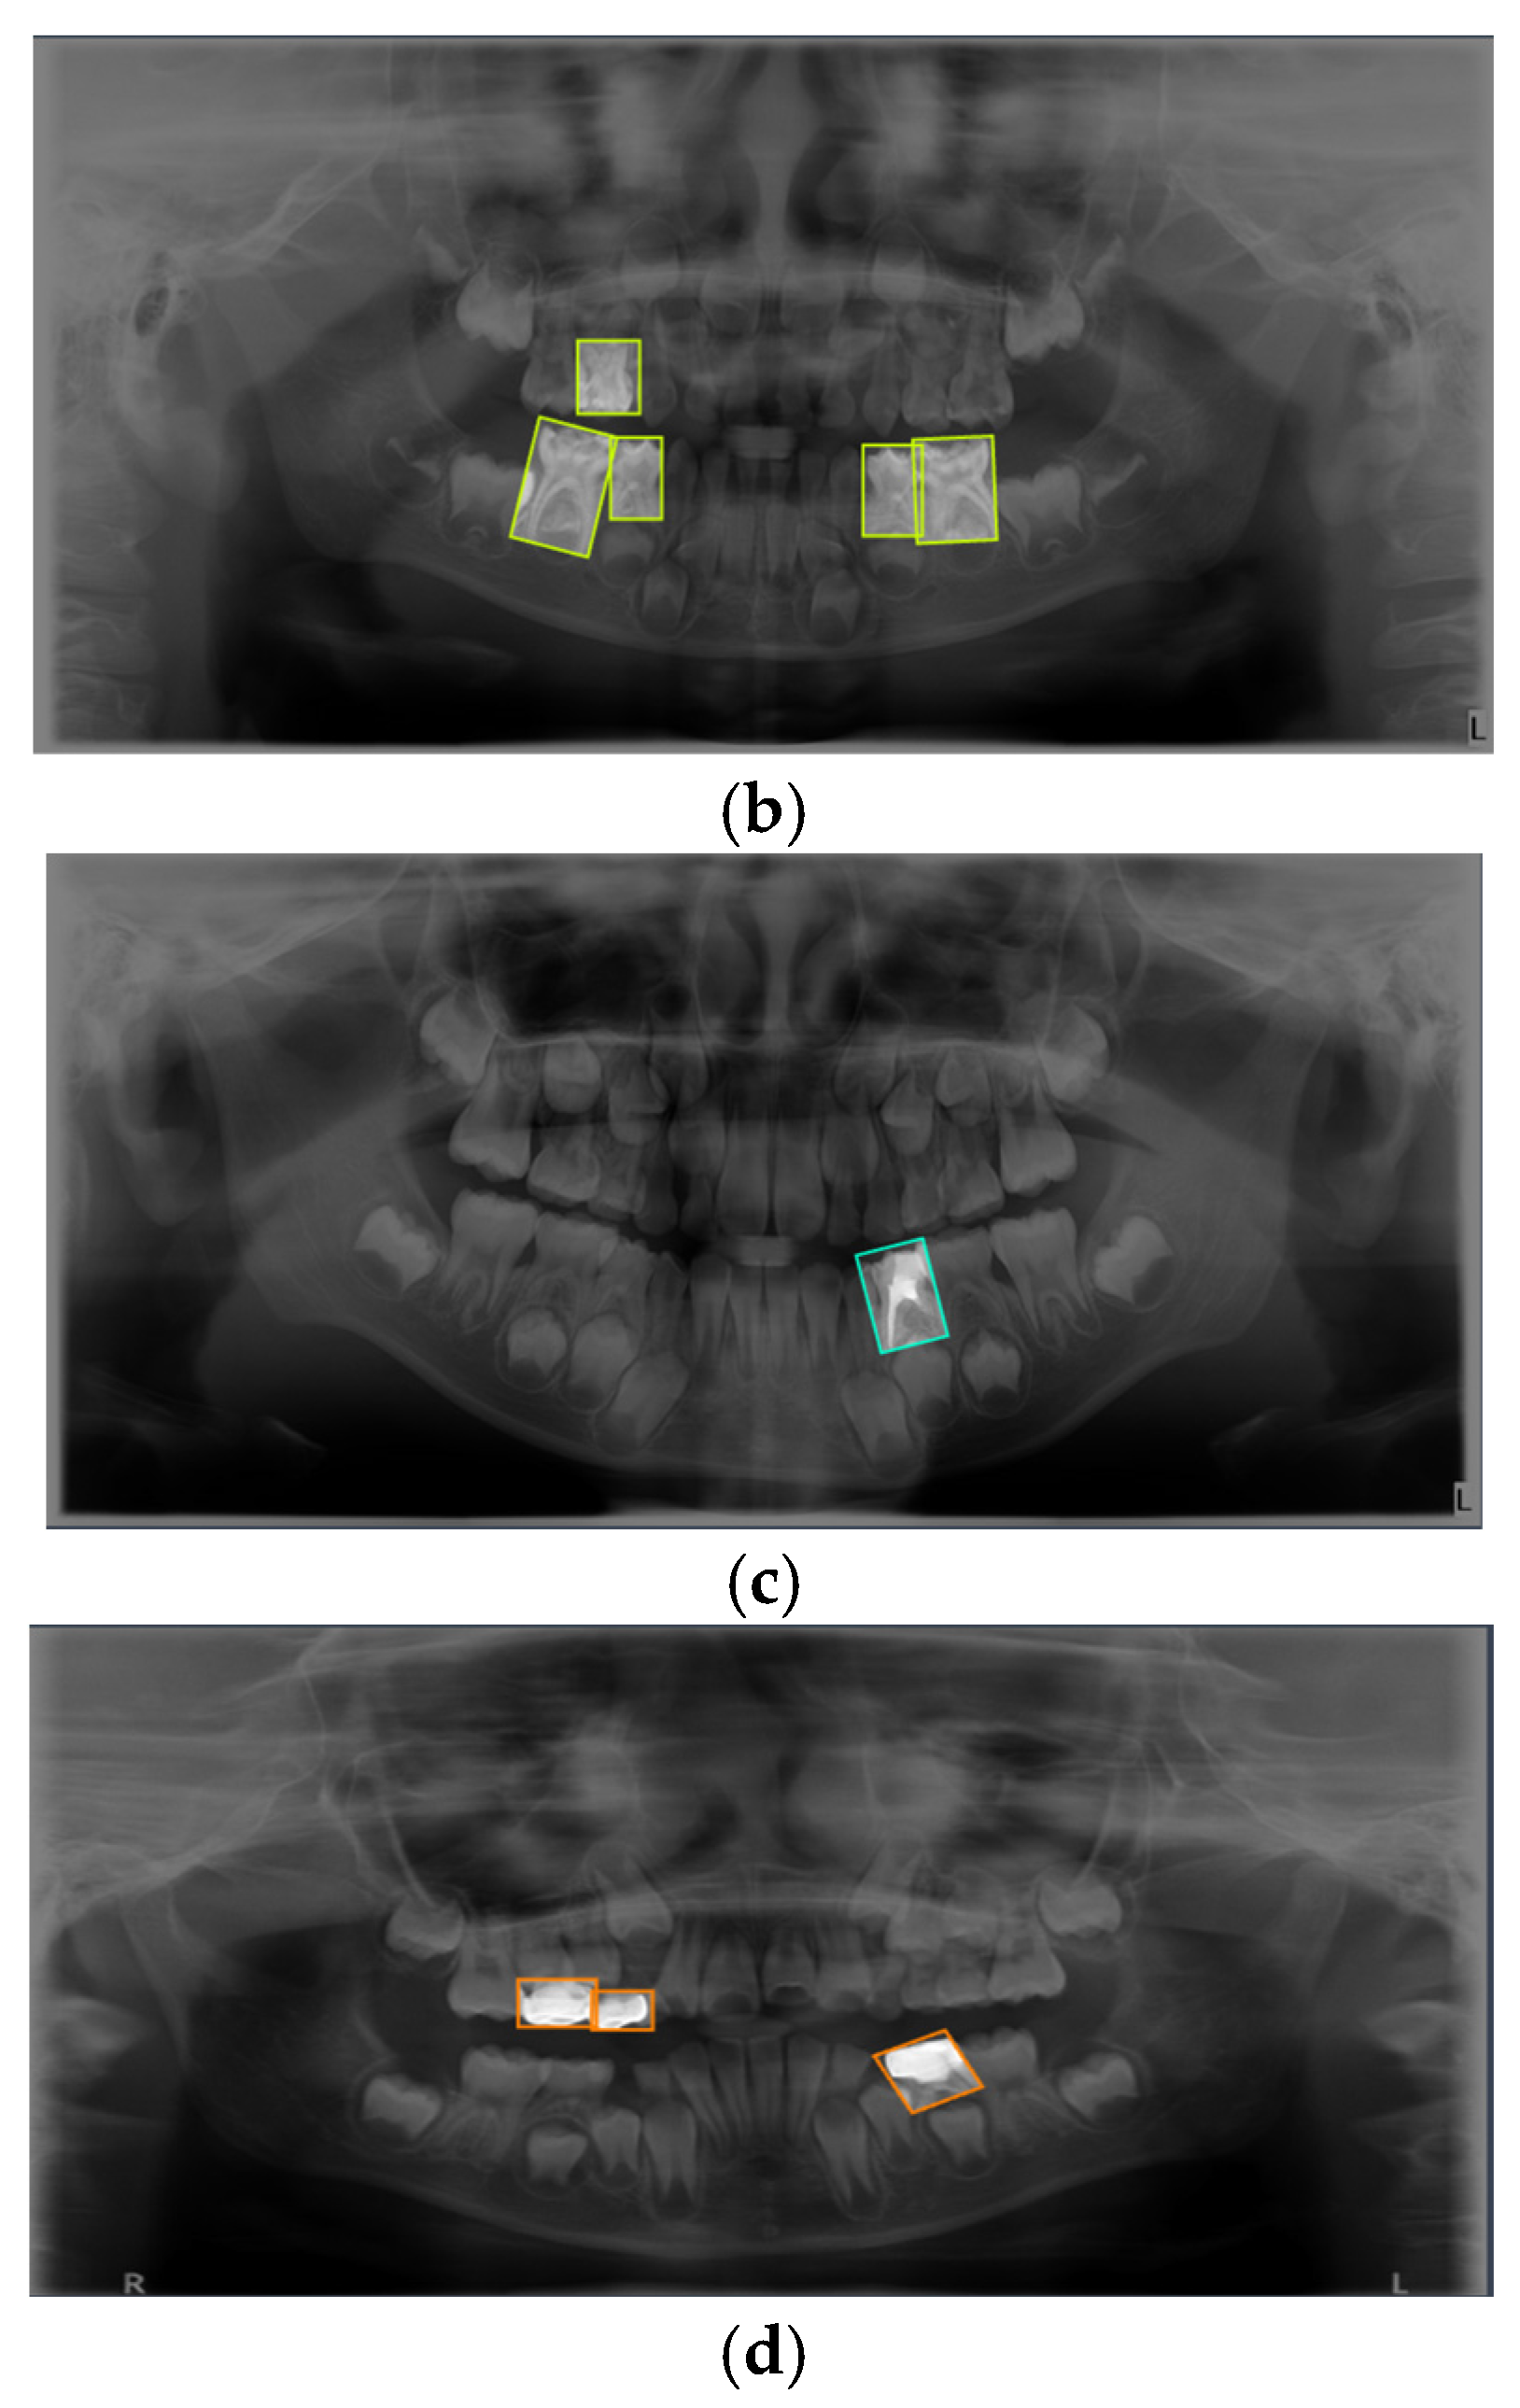
Figure 2.
Timeline of the major YOLO architecture releases from 2015 to 2024 [27].
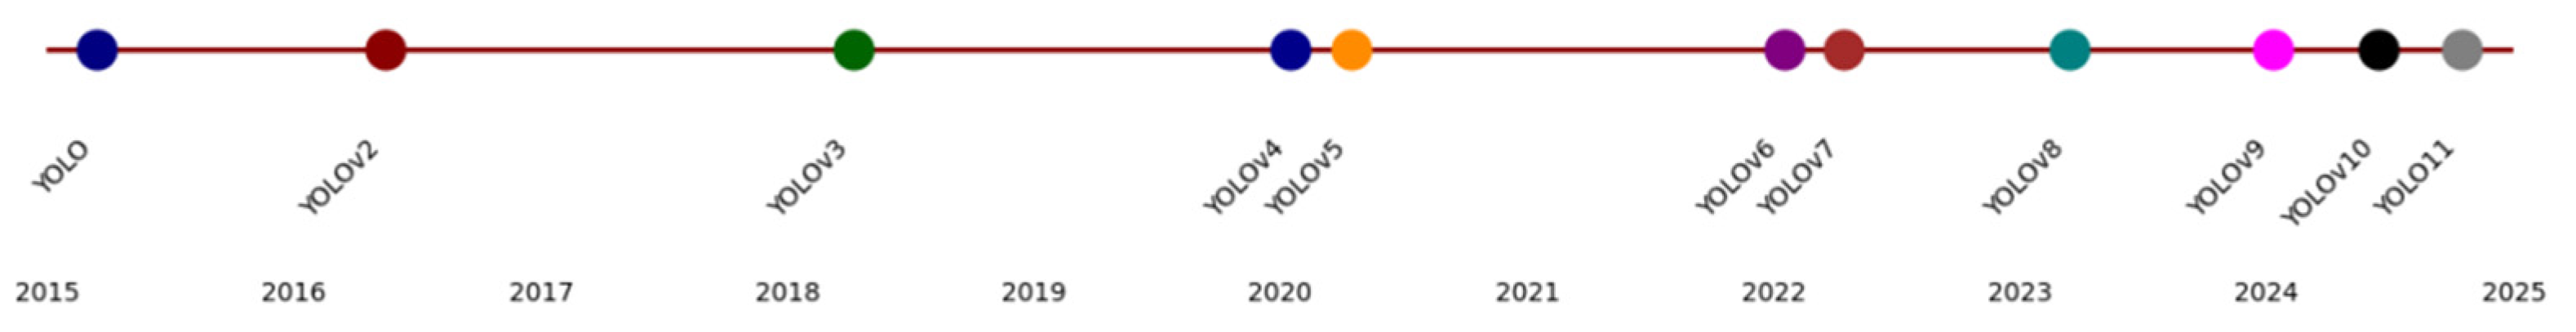
Figure 3.
The diagram illustrates the two-tiered validation strategy, showing the use of a primary dataset for model training and selection, and a separate, independent external dataset for the final performance evaluation of the selected mode.
Figure 3.
The diagram illustrates the two-tiered validation strategy, showing the use of a primary dataset for model training and selection, and a separate, independent external dataset for the final performance evaluation of the selected mode.
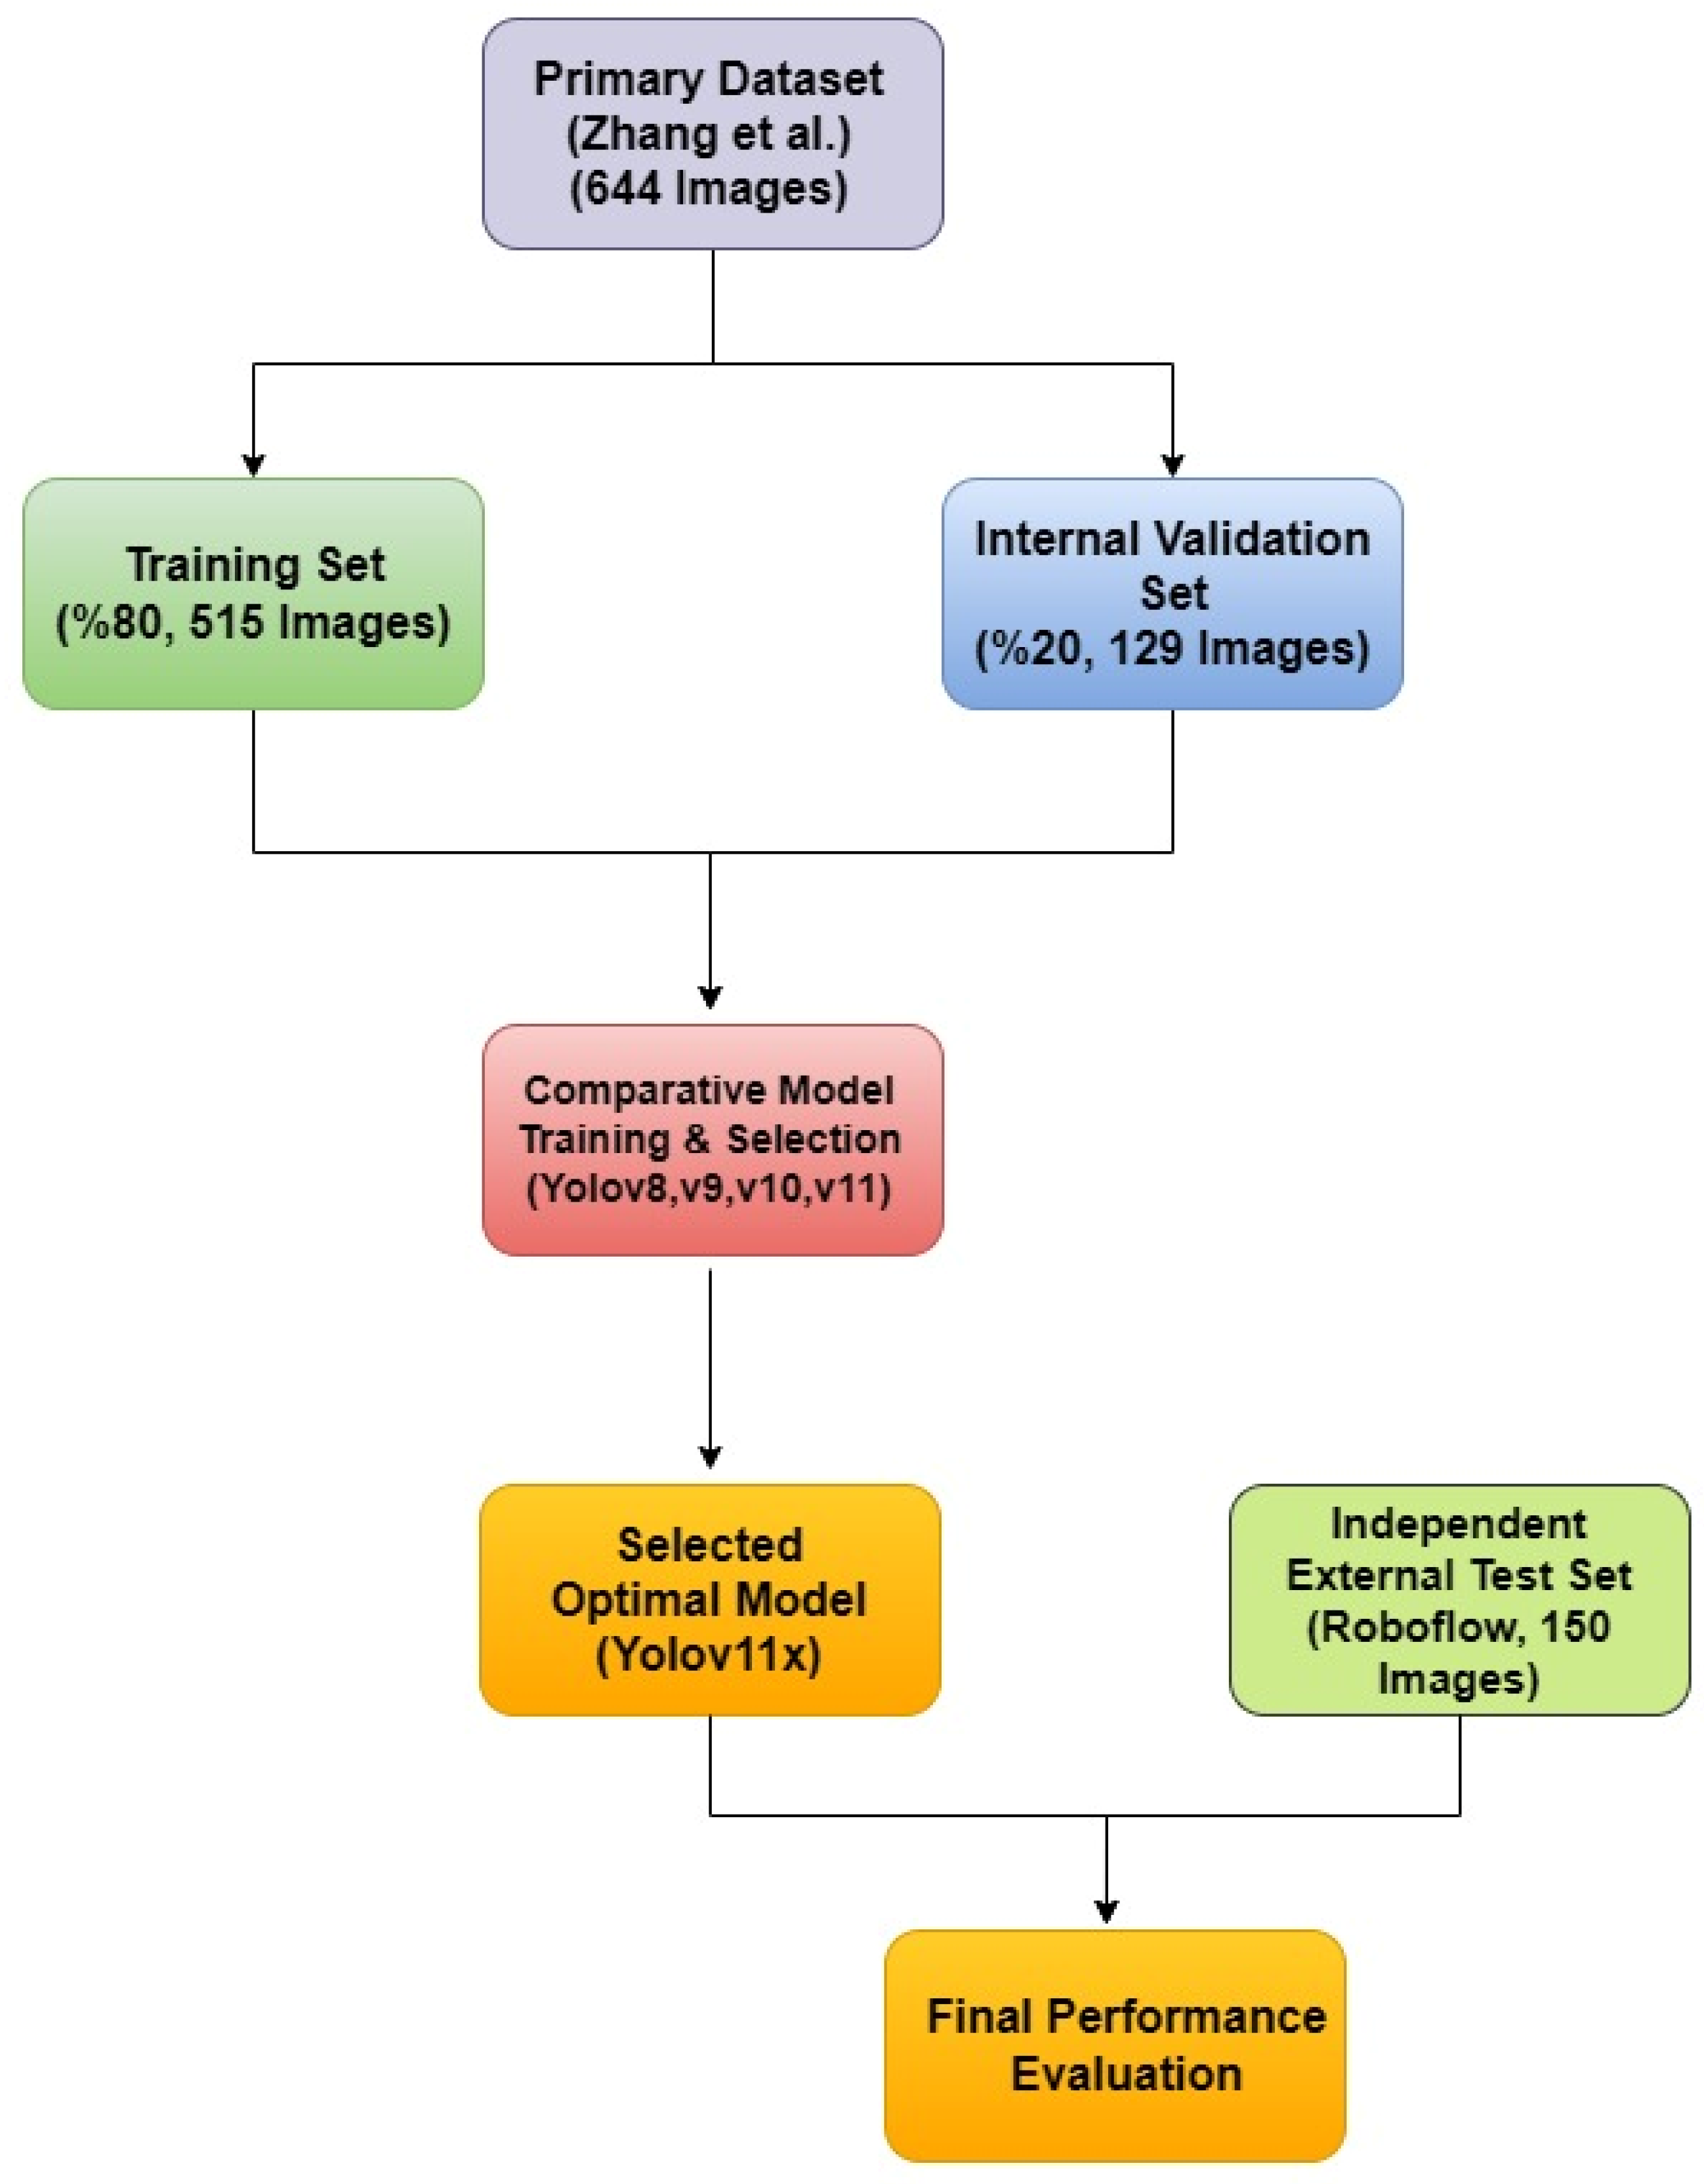
Figure 4.
Normalized confusion matrix for the YOLOv11x model on the internal validation set. The matrix illustrates the model’s per-class performance, with the diagonal elements representing the true positive rate (recall) for each class. Off-diagonal elements indicate sources of confusion between classes.
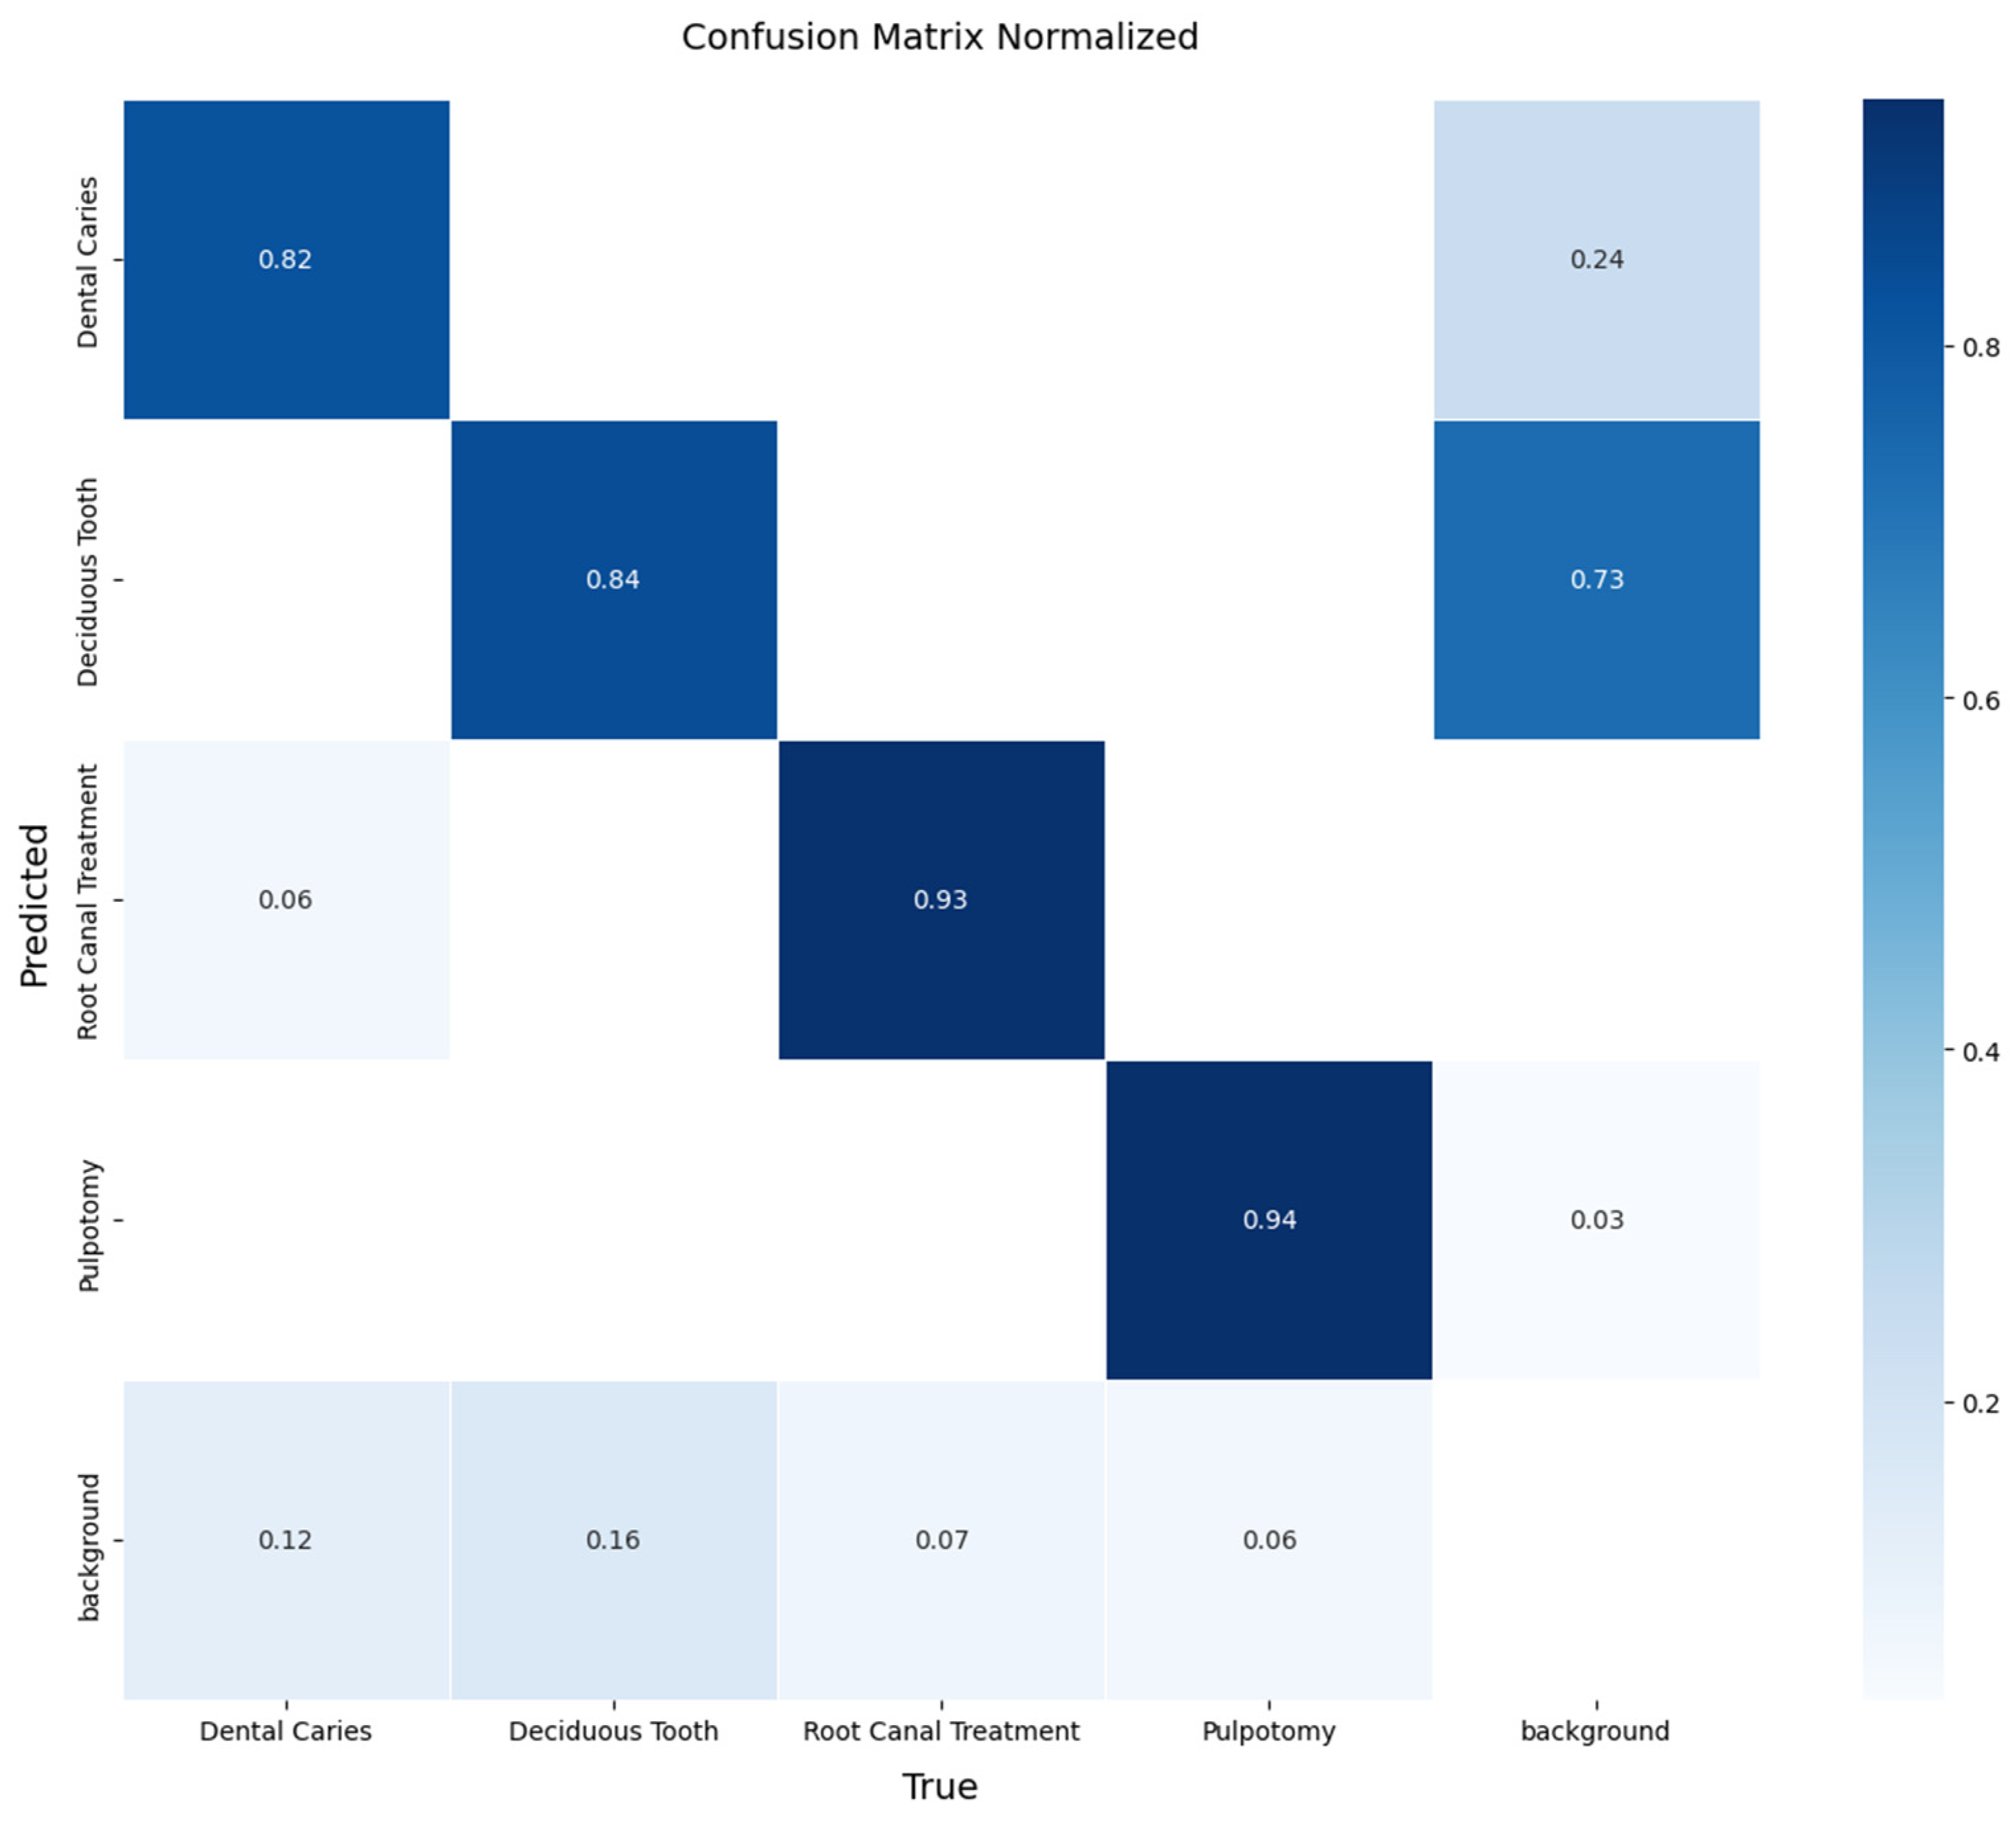
Figure 5.
Precision-Recall curve for the YOLOv11x model on the internal validation set. The plot shows the AP for each of the four classes, as well as the overall mAP at an IoU threshold of 0.5.
Figure 5.
Precision-Recall curve for the YOLOv11x model on the internal validation set. The plot shows the AP for each of the four classes, as well as the overall mAP at an IoU threshold of 0.5.
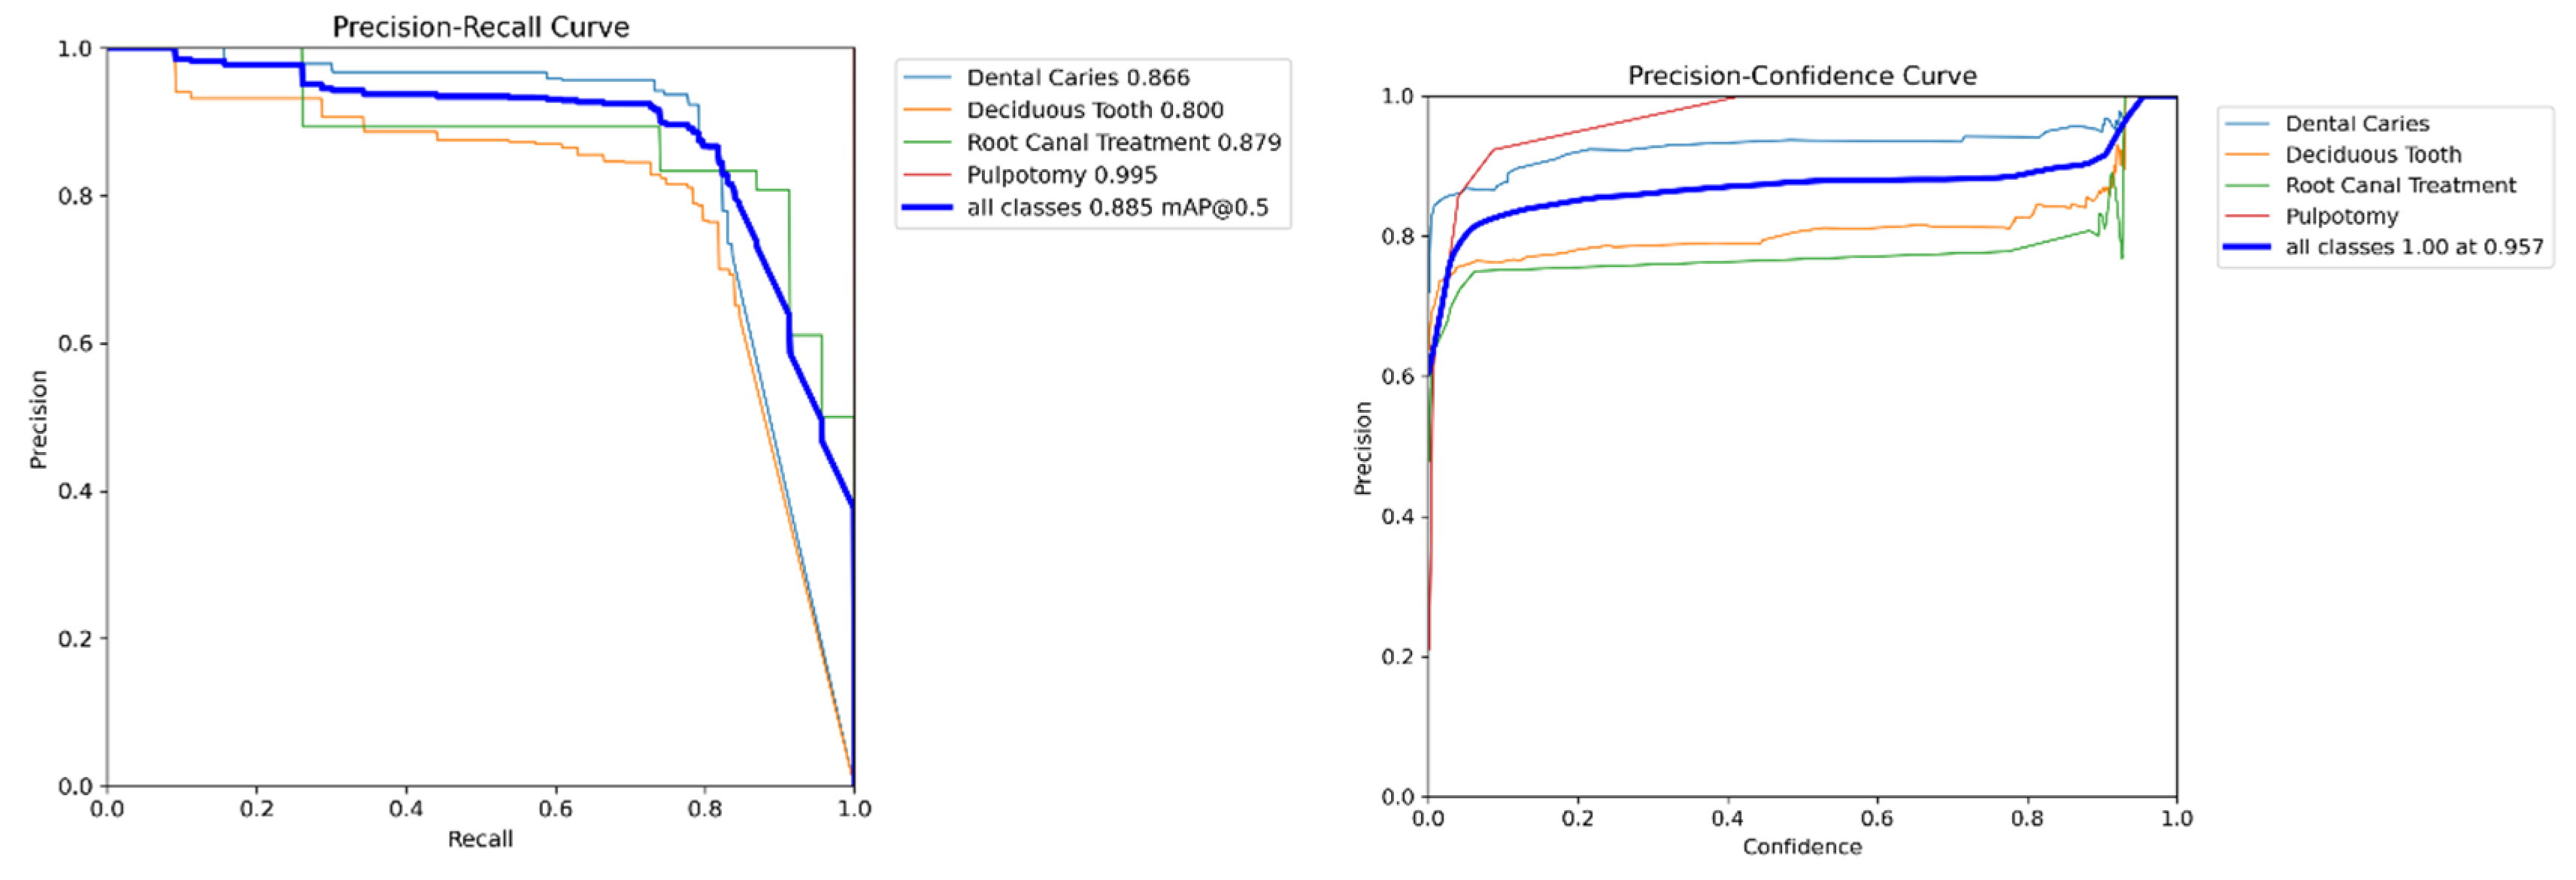
Figure 6.
Examples of Successful Detection of YOLO Models for Different Dental Conditions. The images display representative examples of correct detections for (a) Dental Caries, (b) Deciduous Tooth, (c) Root Canal Treatment, and (d) Pulpotomy.
Figure 6.
Examples of Successful Detection of YOLO Models for Different Dental Conditions. The images display representative examples of correct detections for (a) Dental Caries, (b) Deciduous Tooth, (c) Root Canal Treatment, and (d) Pulpotomy.
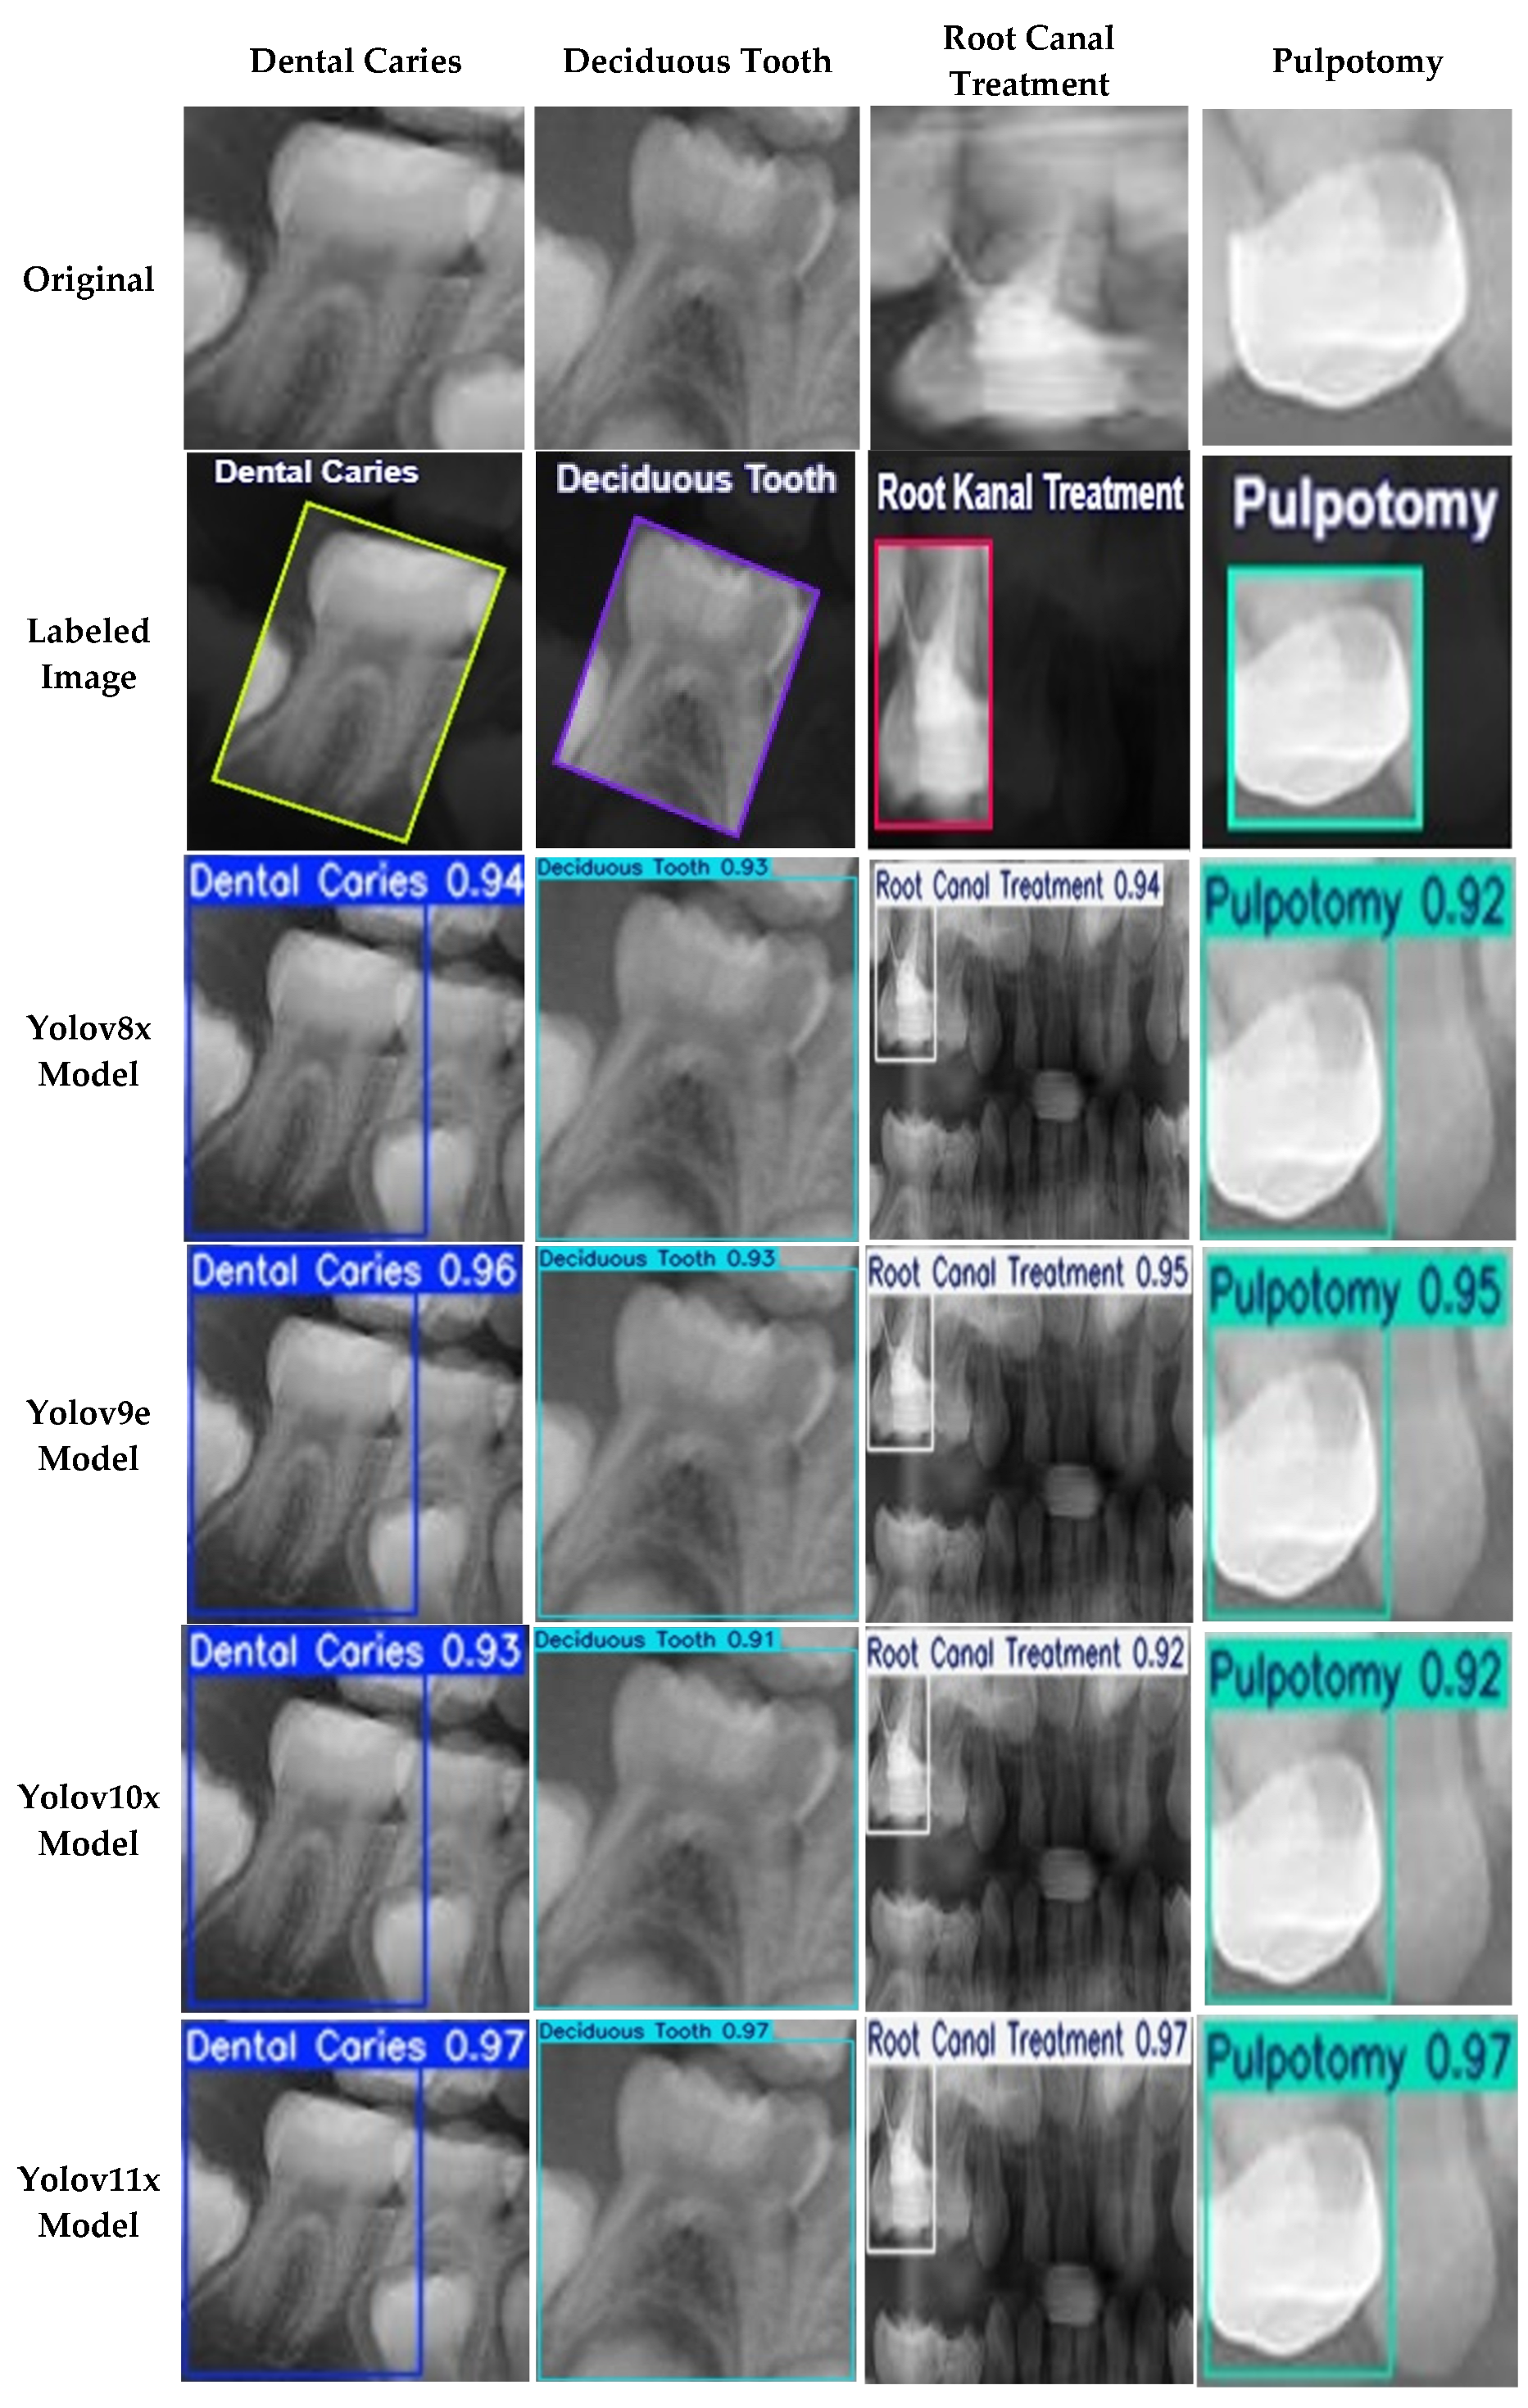
Figure 7.
Training and validation learning curves for the YOLOv11x model over 500 epochs. The plots demonstrate the convergence of loss components (box, cls, dfl) and the progression of key performance metrics (mAP, precision, recall), indicating a stable training process without significant overfitting.
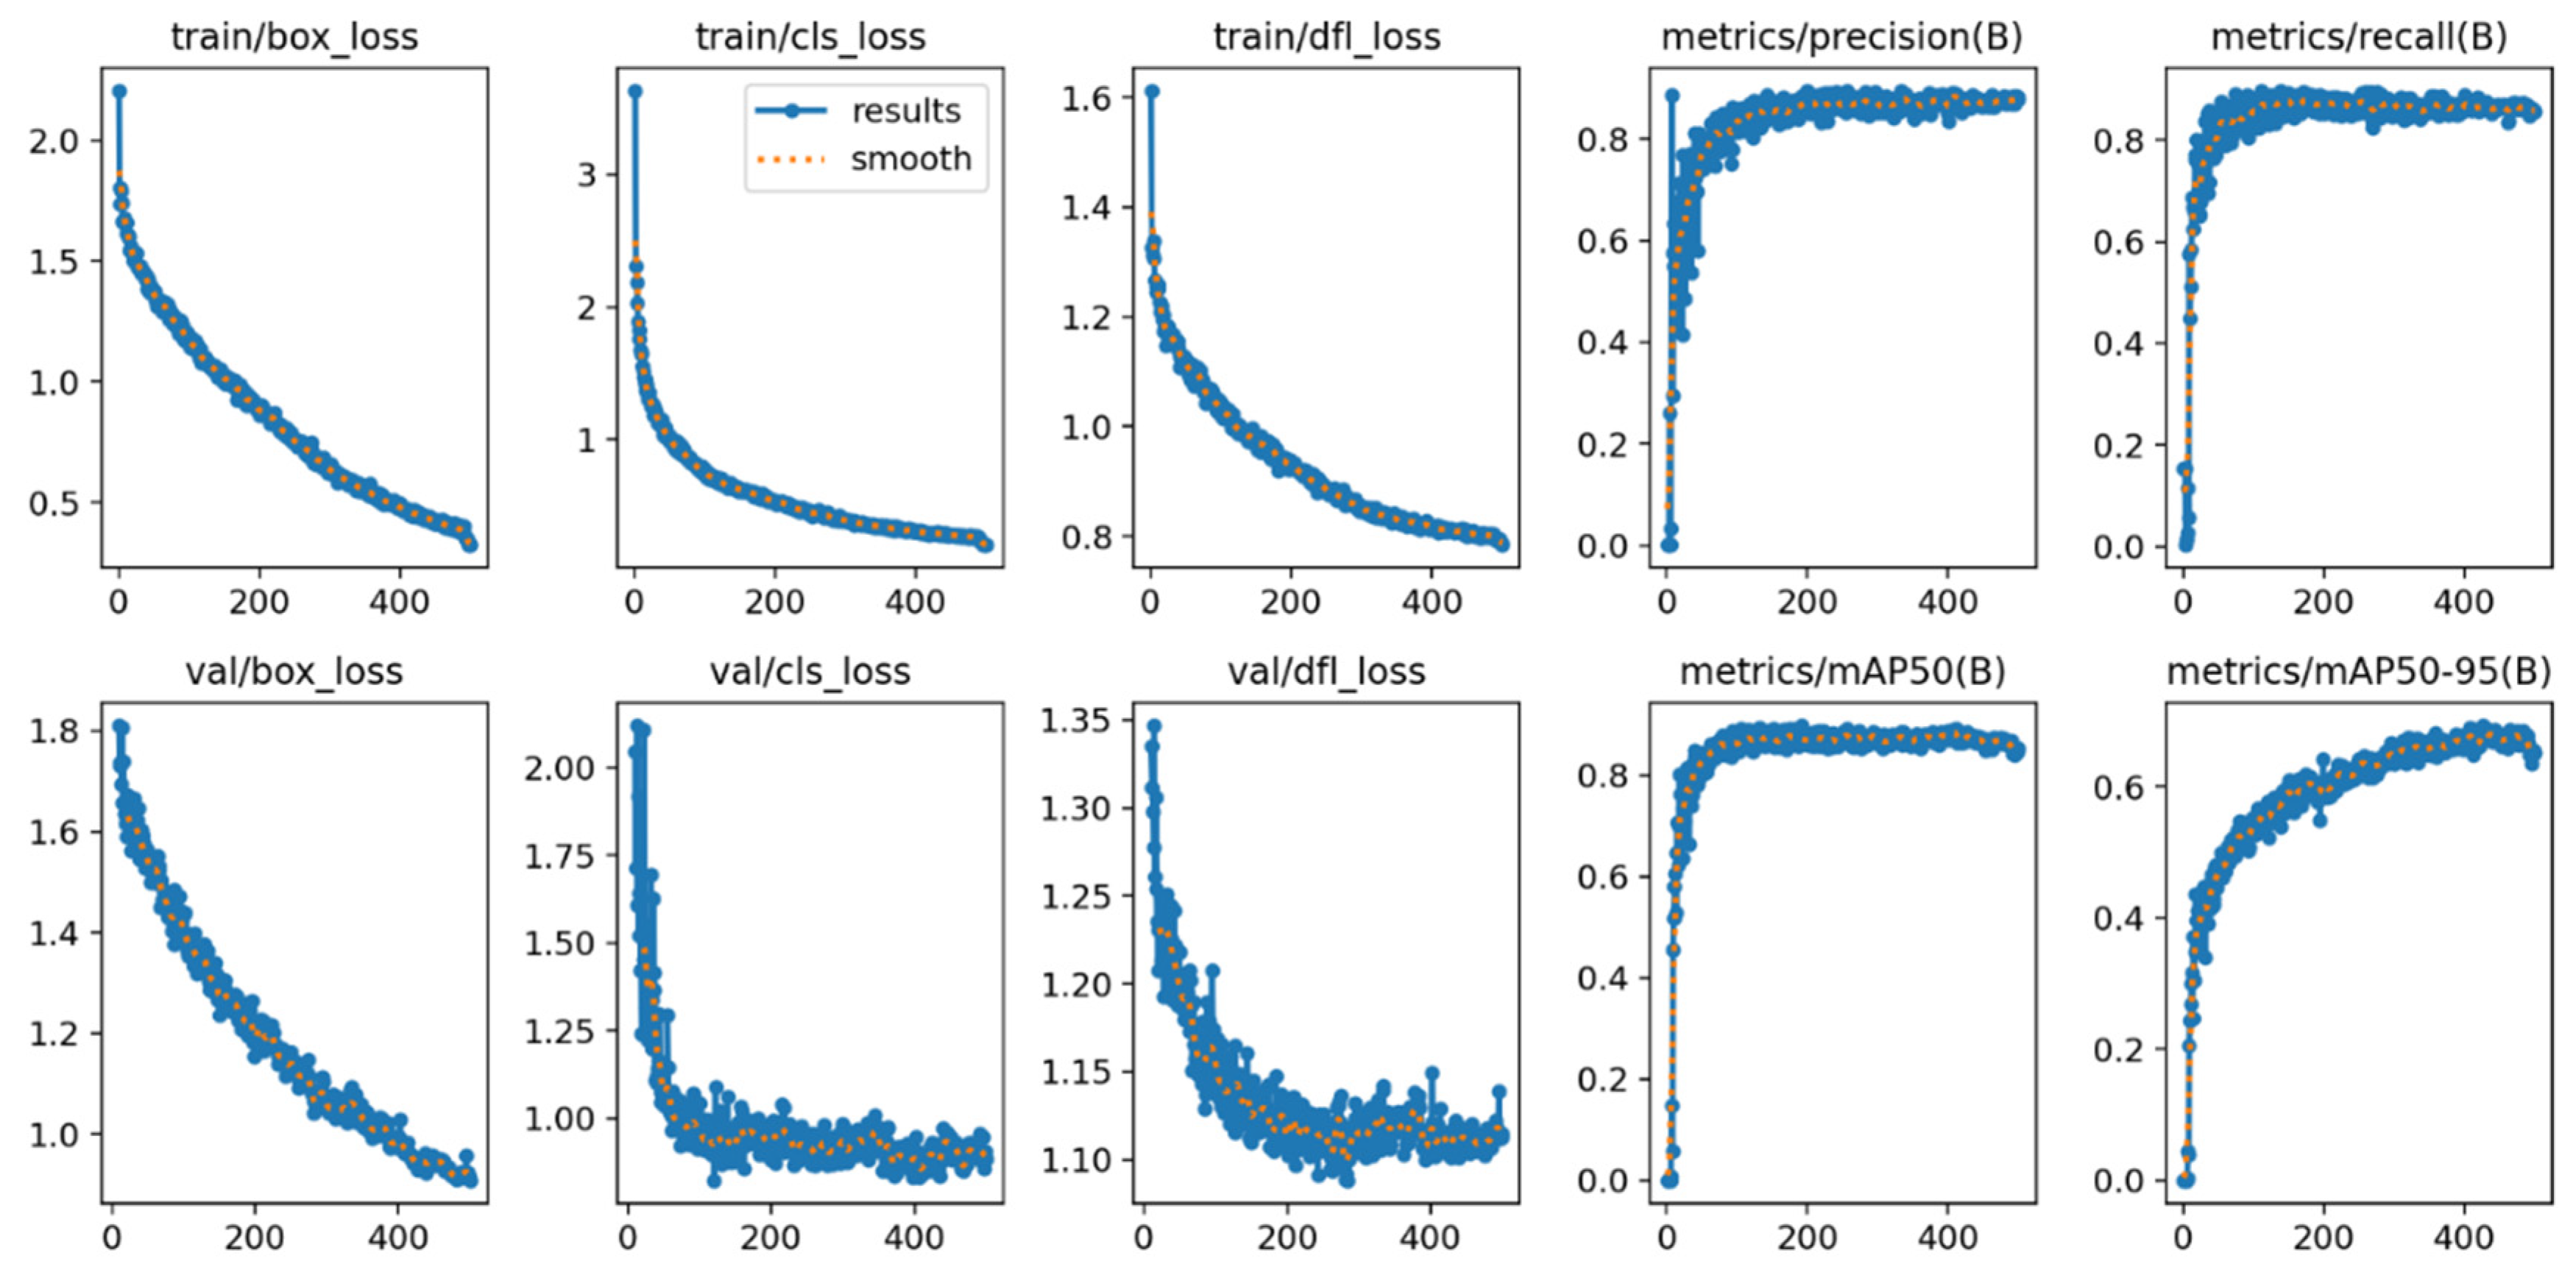
Figure 8.
Normalized confusion matrix illustrating the performance of the YOLOv11x model on the independent external test set. The diagonal elements represent the recall (true positive rate) for each class, providing a clear view of per-class accuracy.
Figure 8.
Normalized confusion matrix illustrating the performance of the YOLOv11x model on the independent external test set. The diagonal elements represent the recall (true positive rate) for each class, providing a clear view of per-class accuracy.


Table 1.
Distribution and relative frequency of the four selected dental conditions within the primary training and validation dataset derived from Zhang et al. [19] (n=644 images).
Table 1.
Distribution and relative frequency of the four selected dental conditions within the primary training and validation dataset derived from Zhang et al. [19] (n=644 images).
| Frequency (Label) |
Relative Frequency (%) |
Cumulative (%) |
|
|---|---|---|---|
| Dental Caries | 830 | 43.57 | 43.57 |
| Deciduous Tooth | 791 | 41.52 | 85.09 |
| Root Canal Treatment | 171 | 8.98 | 94.07 |
| Pulpotomy | 113 | 5.93 | 100.00 |
Table 2.
Comparison of computational costs and model parameters for the evaluated YOLO variants (YOLOv8x, YOLOv9e, YOLOv10x, and YOLOv11x).
Table 2.
Comparison of computational costs and model parameters for the evaluated YOLO variants (YOLOv8x, YOLOv9e, YOLOv10x, and YOLOv11x).
| Algorithms | Pixels | Parameters (M) | FLOPs(G) |
|---|---|---|---|
| YOLOv8x | 640 | 68.16 | 311.2 |
| YOLOv9e | 640 | 58.1 | 192.5 |
| YOLOv10x | 640 | 29.5 | 160.4 |
| YOLOv11x | 640 | 56.9 | 194.9 |
Table 3.
Key hyperparameters and configuration settings for model training.
| Parameter | Value | Description |
|---|---|---|
| Input Size | 640x640 | The input images were resized to this dimension before being fed into the models, balancing computational load and feature preservation. |
| Batch Size | 16 | The number of images processed in a single forward/backward pass. Selected to maximize GPU memory utilization. |
| Number of Epoch | 500 | The total number of times the entire training dataset was passed through the model. Chosen to ensure full model convergence. |
| Optimizer | SGD | Stochastic Gradient Descent, a robust and widely-used optimizer. Selected for its stability, with a momentum of 0.937 and weight decay of 0.0005. |
| Learning Rate | 0.01 | The initial learning rate for the optimizer. A cosine annealing scheduler was used to adjust the rate over the training epochs. |
| IoU Threshold | 0.5 | The Intersection over Union threshold used during training for matching predictions to ground-truth boxes. |
| Loss Function | Combination of IoU Loss, Confidence Loss, Class Loss | A composite loss function combining Complete IoU, Binary Cross-Entropy, and Distribution Focal Loss. |
Table 4.
Performance comparison of the evaluated YOLO model variants on the internal validation set. The highest scores for each metric are highlighted in bold.
Table 4.
Performance comparison of the evaluated YOLO model variants on the internal validation set. The highest scores for each metric are highlighted in bold.
| Accuracy | Recall | Precision | F1-Score | |
|---|---|---|---|---|
| YOLOv8x | 0.86 | 0.89 | 0.92 | 0.90 |
| YOLOv9e | 0.87 | 0.89 | 0.91 | 0.90 |
| YOLOv10x | 0.87 | 0.89 | 0.92 | 0.90 |
| YOLOv11x | 0.91 | 0.92 | 0.94 | 0.93 |
Table 5.
mAP scores for the evaluated YOLO model variants on the internal validation set. The mAP50 metric was the primary indicator for model selection. The highest score is highlighted in bold.
Table 5.
mAP scores for the evaluated YOLO model variants on the internal validation set. The mAP50 metric was the primary indicator for model selection. The highest score is highlighted in bold.
| mAP50 | mAP50-95 | |
|---|---|---|
| YOLOv8x | 0.89 | 0.71 |
| YOLOv9e | 0.90 | 0.70 |
| YOLOv10x | 0.89 | 0.71 |
| YOLOv11x | 0.91 | 0.69 |
Table 6.
Comparison of validation loss components (Box, CLS, and DFL) for each model on the internal validation set. The lowest loss values, indicating better performance, are highlighted in bold.
Table 6.
Comparison of validation loss components (Box, CLS, and DFL) for each model on the internal validation set. The lowest loss values, indicating better performance, are highlighted in bold.
| Box Loss | CLS Loss | DFL Lose | |
|---|---|---|---|
| YOLOv8x | 0.93 | 0.83 | 1.27 |
| YOLOv9e | 0.92 | 0.84 | 1.49 |
| YOLOv10x | 1.84 | 2.38 | 2.23 |
| YOLOv11x | 0.90 | 0.82 | 1.10 |
Table 7.
Training and validation time per epoch for each YOLO model variant.
| Training time per epoch (second) | Validation time per epoch (second) | |
|---|---|---|
| YOLOv8x | 0.92 | 0.89 |
| YOLOv9e | 0.91 | 0.89 |
| YOLOv10x | 0.92 | 0.89 |
| YOLOv11x | 0.90 | 0.90 |
Table 8.
Final performance of the selected YOLOv11x model on the independent external test set (n=150 images). The table reports the primary object detection metric (mAP) and key classification metrics.
Table 8.
Final performance of the selected YOLOv11x model on the independent external test set (n=150 images). The table reports the primary object detection metric (mAP) and key classification metrics.
| Accuracy | Recall | Precision | F1-Score | |
|---|---|---|---|---|
| YOLOv11x | 0.82 | 0.83 | 0.80 | 0.81 |
Table 9.
mAP scores for YOLOv11x model variants assessed in the test set.
| mAP50 | mAP50-95 | |
|---|---|---|
| YOLOv11x | 0.82 | 0.62 |
Disclaimer/Publisher’s Note: The statements, opinions and data contained in all publications are solely those of the individual author(s) and contributor(s) and not of MDPI and/or the editor(s). MDPI and/or the editor(s) disclaim responsibility for any injury to people or property resulting from any ideas, methods, instructions or products referred to in the content. |
© 2025 by the authors. Licensee MDPI, Basel, Switzerland. This article is an open access article distributed under the terms and conditions of the Creative Commons Attribution (CC BY) license (https://creativecommons.org/licenses/by/4.0/).
Copyright: This open access article is published under a Creative Commons CC BY 4.0 license, which permit the free download, distribution, and reuse, provided that the author and preprint are cited in any reuse.


