

Submitted:
05 May 2023
Posted:
08 May 2023
You are already at the latest version
Abstract
Panoramic and periapical radiograph tools help dentists diagnose the most common dental diseases. Generally, dentists identify dental caries manually by inspecting X-ray images. However, due to their heavy workload, or poor image quality, dentists may sometimes overlook some unnoticeable dental caries, which may ultimately hinder the patient treatment. The purpose of this study was to develop an algorithm that classifies the teeth X-Ray images into three categories of “Normal”, “Caries”, and “Filled”. Our study used a dataset of 116 patients and 3712 single teeth images for training, validation and testing. Images were pre-processed using a sharpening filter and an intensity color map. We used a pre-trained transfer learning model, the NASNetMobile, which served as the feature extractor and the Convolutional Neural Network (CNN) model served as the classifier. The training dataset had a “Recall” of 0.92, 0.90 and 0.91 for “Normal”, “Caries” and “Filled” respectively and the test dataset had a “Recall” of 0.86, 0.81 and 0.85 for “Normal”, “Caries” and “Filled” respectively. The classification of the teeth X-Rays was successful and can be valuable for dentist as the artificial intelligence algorithm can serve as a decision support tool to aid dentists when they need to diagnose dental treatment.
Keywords:
deep learning
; medical imaging
; clinical decision support system
; Teeth X-Rays
; Images
; CNN model
; transfer learning
; NASNetMobile feature extractor
; classification model
1. Introduction
Generally, according Gomez, J. [1], dentists identify dental caries manually by inspecting X-ray images. Dental caries result when plaque forms on the surface of a tooth and converts the free sugars in foods and drinks into acids that destroy the tooth over time. From WHO oral health, a continued high intake of free sugars, inadequate exposure to fluoride and a lack of removal of plaque by tooth brushing can lead to caries [2]. In the wikipedia page, the general teeth caries symptoms are described as pain and difficulty with eating [3]. According to the World Health Organization website, nearly 3.5 billion people are affected by oral disease worldwide [2]. The most effective way to prevent oral disease would be to keep personal hygiene and lead a well-balanced diet to avoid taking in too much sugar. At the same time, it is also necessary to conduct regular medical tests and screening to detect potential teeth abnormalities [2]. According to the Cattani Compressors Team, the most common method to conduct dental health screening, would be the X-ray detector [4], and among all X-ray equipment, the Orthopantomogram (OPG) and the Radiovisiography (RVG) x-ray images are the most widely used tools for the diagnoses of dental diseases. From Cosson, and Harikri, the OPG images are used to identify the hard tissues of the oral cavity and surrounding skeletal structures and the RVG is commonly used in dentistry to take intraoral periapical radiographs features [5,6]. Therefore, to interpret and reach the conclusion of the dental situation based on these X-ray images, dentists need to possess domain knowledge, expertise, and experience obtained by years of learning and working so it is nearly impossible for ordinary people without professional dental background to make a preliminary judge of their dental situation based on the X-ray images.
With the recent incredible application of deep learning algorithms in the medical field, deep learning models such as CNN have many applications in the area of medical image processing. Krizhev proposed imagenet for the use of medical images [7]. Tohnak stated that CNN has a significant performance in solving the segmentation problem [8], including brain tumor segmentation [9], liver tumor segmentation [10], and Abdi applied it to the dental classification problem [11]. The rest of our paper is organized as follows: Section 2 presents related work on how other researchers have classified Teeth X-Ray images. Section 3 describes 4 our methodology. In Section 4, we present the results of the teeth classification. In Section 5, we conclude and discuss our findings.
2. Related Work
There are various methods described in the literature that examined digital images of teeth in an effort to categorize the carious lesions. Using image analysis software, Umemori et. al. [12] processed and examined digital photos. With 86% sensitivity and 8% specificity, they were able to identify and categorize regions of interest. The visual classification of teeth into the various groups studied by the authors without describing the criteria they utilized; instead, the classification was solely relied on the examiners’ experience. Additionally, the impacted teeth were processed to confirm the diagnosis, leaving no way to confirm that the non-carious teeth were correctly classified because they were not prepared. The non-carious teeth made up the vast bulk of the sample (64%) so any systematic inaccuracy in classifying the teeth in this category would have a significant impact on the study’s findings. Kositbowornchai et. al. [13] created a neural network to detect false dental cavities using images from an intra-oral digital radiography [14] and charged coupled device (CCD) camera. Their method’s sensitivity and specificity when using images from a CCD camera were 77 and 85 percent, respectively, and when using images from intra-oral digital radiography, they were 81 and 93 percent, respectively. This technique was tested using teeth with fake fillings, which is the study’s principal flaw. The artificial caries was very different from the real caries, mostly because they had a distinct histochemical makeup in terms of the organic material and staining, which resulted in various optical qualities that affected how the lesion was classified according to the classification criterion proposed by Sahiner in 1996 [15]. As a result, it was unclear how well this approach can distinguish between in vitro stressed lesions of different depths.
Abraham, et. al. [16] provided a comprehensive study of various preprocessing, enhancement and segmentation techniques applied for tooth classification and labeling. Ying, et. al. [17] studied a deep network was proposed aiming for caries segmentation on the clinically collected tooth X-ray images. The proposed network inherited the skip connection characteristic from the widely used U-shaped network, and creatively adopted vision Transformer, dilated convolution, and feature pyramid fusion methods to enhance the multi-scale and global feature extraction capability. Olsen et. al. [18] proposed a system that uses digital color photographs of dental preparations drilled in practice teeth to identify damaged areas on tooth surfaces. To segment the tooth and drilled preparation, the pictures were analyzed using the Directed Active Shape Modeling (DASM) technique. The color image gradient and six texture measurements were used to extract seven characteristics. The classification method identified pixels that represented portions of the tooth surface that were affected by caries using the feature vectors as its input. Using Radial Basis Functions (RBF) proposed by Thong [19], the greatest detection accuracy (96.86%) was attained.
3. Methodology
The analysis process for this study is depicted in Figure 1 below.
The process for “Color Image” is detailed in Section 3.2 below, while the “Image Augmentation is detailed in Section 3.3 and the “Feature Extraction and Image Classification” is detailed in Section 3.4 below.
3.1. Dataset
A small size dataset of 116 patients was used for this project. The source of The dataset is from Mendeley Data [20], it is an open-sourced dataset consisting of anonymized and de-identified panoramic dental X-rays of 116 patients from the local hospitals. Among all 116 X-ray images, 3712 single teeth images are provided, with 2267 (61.07%) normal teeth, 98 (2.64%) caries, 617 (16.62%) Filled teeth. We used labelling tool “LabelMe” to draw the bounding boxes around the dental images. Some low quality images are filtered out during this stage.
3.2. Image Pre-Processing
The color image is converted from color into gray scale (grayIm), proposed by Gonzalez, by keeping the luminance information while removing the hue and saturation information [21]. More specifically, the formula below is used to create a weighted sum of the R, G, and B components to convert RGB values to gray scale values:
where R, G and B are the pixel value of the red, green and blue channel, respectively.
grayIm = 0.2989*R+ 0.5870*G + 0.1140*B
The following sigmoid function by proposed Kumar [22] is used to change the contrast of the image after rescaling the gray scale image’s intensities to the range [0, 1], according to Tuan [23]:
where gain determines the real contrast, newIm(x,y), proposed by Shakeel [24], represents the pixel’s value after the sigmoid function has been applied to the picture. The value of the pixel (x, y) in the image before the sigmoid function was applied is represented by resIm(x, y) by Sund [25], and c is the (normalized) gray value about which contrast is increased or lowered. An image before processing can be found in Figure 2 below.
newlm(x, y) = 1/(1 + egain∗(c−resIm(x,y)))
3.3. Image Augmentation
Three thousand seven hundred dental images were finally selected and resized to 300 x 300 pixels. We divided the dataset into a training and validation test (n = 2960 [80%]), and a test dataset (n = 740 [20%]). The training dataset consists of 70 dental caries, and the test dataset contains 28. Because of the unbalanced image number distribution between caries, normal, and filled images in the training dataset (normal: caries: Filled = 2267: 70: 623). We applied three different augmentation schemas to the training dataset.
In the first schema, we augmented all three categories five times. In the second schema, was augmented “Normal” and “Filled” categories five times and “Caries” fifteen times. In the last schema, we augmented “Caries” twenty times, “Normal” five times, and “Filled” ten times. We used the python package “imgaug” to conduct the augmentation operation. “Imgaug” generated a random augmentation operation sequence. The operation sequence includes upscale or downscale, rotating between -15 to +15 degrees, image shifting, image flip, changing image brightness, adding Gaussian noise, and adding Gaussian blur. A sample image after augmentation is provided in Figure 3 below.
Comparing with Figure 2, images before preprocessing, we see the teeth images become brighter than the surrounding pixel point, while the surrounding pixel point become darker, which can be helpful for the feature extraction process.
3.3. Feature Extraction and Image Classification
We have used the data (mentioned in the Image Augmentation part) for the training process. For the model training process, we used a pre-trained transfer learning model named NASNetMobile, a convolutional neural network that is trained on more than a million images from the ImageNet database for the feature extraction [7,26], and a Convolutional Neural Network (CNN) model for prediction with the architecture shown in Figure 4 and Figure 5 below.
The NASNETMobile is an algorithm that searches for the best algorithm to achieve the best performance on a certain task. The pioneering work by Zoph & Le 2017 [28] and Baker et al. 2017 [29] have attracted a lot of attention into the field of Neural Architecture Search (NAS), leading to many interesting ideas for better, faster, and more cost-efficient NAS methods. Commercial services such as Google’s AutoML and open-source libraries such as Auto-Keras make NAS accessible to the broader machine learning environment [30].
The general setup of NAS involves three components:
- (a)
- Search Space
- (b)
- Search Strategy
- (c)
- Performance Estimation Strategy
Convolutional networks are composed of an input layer, an output layer, and one or more hidden layers. A convolutional network is different than a regular neural network in that the neurons in its layers are arranged in three dimensions (width, height, and depth dimensions). This allows the CNN to transform an input volume in three dimensions to an output volume. The hidden layers are a combination of convolution layers, pooling layers, normalization layers, and fully connected layers. CNNs use multiple convolutional layers to filter input volumes to greater levels of abstraction [32].
CNNs improve their detection capability for unusually placed objects by using pooling layers for limited translation and rotation invariance. Pooling also allows for the usage of more convolutional layers by reducing memory consumption. Normalization layers are used to normalize over local input regions by moving all inputs in a layer towards a mean of zero and variance of one. Other regularization techniques such as batch normalization, where we normalize across the activations for the entire batch, or dropout, where we ignore randomly chosen neurons during the training process, can also be used. Fully-connected layers have neurons that are functionally similar to convolutional layers (compute dot products) but are different in that they are connected to all activations in the previous layer [33].
3.4. Transfer Learning as a Feature Extractor
In this study, we employed the pre-trained NASNetMobile model was for feature extraction. The Google brain team created NASNetMobile Neural Architecture Search Network (Nasnet), which uses two primary functionalities: 1) Normal cell 2) The reduction cell [34].
To attain a higher efficiency and feature mapping, the Nasnet first applies its operations to a small dataset before transferring its block to a large dataset. For a better Nasnet performance, a customized drop-path called a Scheduled drop-path for effective regularization was utilized. The original Nasnet Architecture, from wikipedia, [26] uses normal and reduction cells specifically because the number of cells not pre-determined. While reduction cells returned the feature map that was reduced by a factor of two in terms of height and breadth, the normal cells dictated the size of the feature map. A “Control” architecture in the Nasnet, based on the Recurrent Neural network (RNN) was used to predict the entire structure for the network based on the two initial hidden states. The Nasnet network consisted of 8 convolutional layers and 3 max pooling layers. Each convolution layer was followed by a rectified linear unit (ReLU). In the last layers, all the units were fully connected to the output probabilities for 7 classes using the softmax function. In the actual training, Krizhevsky proposed the network architecture that employs dropout, [7] in which some unit activations in the fully connected layers were randomly set to zero, so that these connection weights would not be updated and thereby prevent over-fitting.
The NASNetMobile was trained on more than a million images from the ImageNet database [7], the NASnetMobile had an image input size of 224-by-224, but because we did not include the fully-connected layer at the top of the network, the images size was kept as 300 x 300. The NASNetMobile’s pre-trained weights, were fixed by placing the imagenet as the model weight and used as a feature extractor [35,36].
3.5. Convolutional Neural Network (CNN) Architecture
The final dental disease recognition is done by applying convolution neural network, All the images are scaled down to 300 x 300 to avoid the high computational expense, the images are next fed as input to the network. The network architecture is shown in Figure 6 and Figure 7 respectively [37], below. The filter size, the number of filters, and the stride for each layer are specified in Figure 7.
The pre-trained NASNetMobile first processes input images to complete the feature extraction process, then the output of the transfer learning model was fed into the CNN model according to the network of Russakovsky [38]. The CNN model was a multi-output model and outputs both the bounding box and the prediction class. For class prediction, three classes, including “Normal”, “Caries”, and “Filled” were included as possible prediction results. For both parts, the CNN model would first apply the global 2D pooling to the input, which was the output of the transfer learning model.
For the class prediction part, there were three convolution layers, two max pooling layers and one fully connected (FC) layer at the end. Within the class prediction process, all the convolution layers had the activation function ReLU. The Softmax activation function was applied to the last FC layer, as proposed by Setio [33], a dropout of 0.2 was added between the convolution layer one and the convolution layer two and between convolution layer two and convolution layer three, in which some unit activations in the fully connected layers were randomly set to zero, so that these connection weights did not update, and thereby prevented the overfitting problem [33].
The box prediction process contained three hidden layers, with a dropout of 0.2 added between the hidden layer one and two and the hidden layer two and three. All the layers except the output layers had the activation function Relu, while the output layer had the activation function Sigmoid. The Stochastic Gradient Descent (SGD) was used as the optimizer to accelerate the model computation with the learning rate (lr) = 1e-3, and the momentum = 0.9.
In short, the class prediction CNN had a structure of [256,128,64,32,3] with first layer and last layer as the input and output layer. Layers were connected with each other using the Relu activation function, and a drop-out layer of 0.2 was added between the first layer and the second layer, and the second layer and the third layer, while the output layer applied the Softmax function.
For the box prediction, the CNN has structure of [256,128,64,32,4], with the first layer and the last layer as the input and the output layers. Layers were connected with the Relu activation function and the last layer had the Sigmoid function, a drop-out layer of 0.2 was added between the first layer and the second layer, and the second layer and the third layer.
Because of the limited number of training samples, the number of training epochs was set to 10000, the base learning rate was set to 0.01, the momentum was set at 0.9 as in the original network. The training time with the three different schemas was roughly forty minutes, 70 minutes and 120 minutes respectively, with the use of Google Colab GPU.
4. Results
For the dental images, class prediction was used, because all the output variables were categorical variables. We used accuracy, precision, recall, and the categorical loss entropy loss function for the class prediction. For the bounding boxes prediction, we used the Mean Square Error (MSE) to calculate the difference between the coordinates of the actual bounding boxes and the coordinates of the boxes that were manually drawn.
During the training process, the experiment used batch sizes of 32 and 10000 Epoches. Apart from the loss and accuracy, we also used three other criteria for the model evaluation. Precision, Recall and the F1-Score. In this study, we had a total of three classes, “Normal”, “Caries”, and “Filled”. For the “Caries” category, true positive means “Caries” that are correctly identified as “Caries”, while true negative means “non-Caries” images that are not identified as “Caries”. False positive means “non-Caries” images that are identified as “Caries”, while false negative means “Caries” images that are not identified as “Caries”. For the bounding boxes prediction, we used the MSE for the bounding boxes evaluation.
For schema 1, in Table 1 below, the training dataset had an accuracy of 0.96 and from Table 2 below, the “Normal” class had a Precision of 0.97, and the “Filled” category had a Precision of 0.79. The “Caries” category had a Precision of 0.7 and a Recall of 0.82.
However, for the Test dataset the accuracy results were not so good. Table 3 and Table 4 below show the Schema 1 confusion matrix and test accuracy results.
As we only had 350 Caries images in the training dataset, comparing to 11335 Normal Images in the training dataset, the Precision (0.37), Recall (0.65) and F1- score (0.47) accuracies in the Test dataset for Caries was not as high as the Precision (0.95), Recall (0.87) and the F1-score (0.91) for the Normal category. Therefore, we decided to augment more Caries images in the training dataset while avoiding overfitting on the training dataset.
For schema 2, because of the unbalanced proportion between the Caries and other dental categories, we decided to augment the Caries category fifteen times while keeping the augmentation of the other categories at five times. The resulting test accuracy was 0.87, which had some improvement comparing with the previous Schema 1 Test accuracy results. For the schema 2 training confusion matrix and training accuracy can be found in Table 5 and Table 6 below.
For the Test data, the Test Precision for “Caries” improved from 0.37 to 0.47, while the Recall improved from 0.65 to 0.86. Table 7 and 8 below show the Schema 2 Test confusion matrix and Test accuracy result respectively.
As we have increasing test accuracy, and the increased number of “Caries” images has not caused any overfitting while improving the performance of identifying the “Caries” images. However, with the improvement in the capability of identifying the “Caries”, the ability to identify the “Filled” images dropped a bit compared with the previous schema 1. Though, the “Normal” class has similar performance as schema 1. In this case, we will now try to augment more “Caries” images and “Filled” images in the augmentation schema 3.
In this last schema 3, we augmented the training Caries images twenty times and the Filled images ten times, and we kept the augmentation for the Normal images at five times. The training dataset had an accuracy of 0.97. The schema 3 for the training dataset confusion matrix and the training accuracy result can be found in Table 9 and Table 10 below respectively.
The schema 3 Test dataset confusion matrix and Test accuracy result can be found in Table 11 and Table 12 respectively, below.
From the result, the Tests dataset accuracy has a dropped from schema 2 to schema 3 from 0.87 to 0.84, which may be because we over-fitted the training dataset. The reason for overfitting may be that we now have too many augmentation images and that the augmentation operation cannot generate new images thus the training model may now fit to the noise instead of the useful information in the training data.
The “Caries” Precision dropped from 0.47 to 0.42, but the Recall improved from 0.75 to 0.81. The “Normal” classification had worse performance in the Recall compared with the previous two schema experiments. For the “Filled” classification, the Recall improved from 0.82 to 0.85. For the bounding boxes prediction, all three schemas had similar performance. Schema 1 had a MSE of 0.0207, schema 2 had a MSE of 0.0257, and schema 3 had a MSE of 0.0233.
We can tell from the three experiments, schema 1, 2, and 3, as the number of “Caries” images increased in the training dataset, the Recall kept increasing, but the Precision first increased and then dropped. Besides, among all the three experiment schemas, the “Caries” category had relatively huge differences between the accuracy of the training and the test performances. The reason may be that the small number of “Caries” images in the original dataset, which had only 94 “Caries” images compared to 2267 “Normal” teeth and 617 “Filled” teeth. The performance of the “Normal” and “Filled” classification was also negatively affected by the increased number of “Caries” images in the training dataset because of the overfitting problem in the last schema 3. However, because we aim to identify “Caries” in the real life clinical practice, we eventually decided to employ the last schema 3, as it had the best performance in identifying the “Caries” images.
5. Conclusions
In this research, Dental disease is classified using the transfer learning model as the feature extractor and the CNN model as the classifier. The three most common categories of “Normal”, “Caries”, and “Filled” was considered. The model achieved an overall accuracy of 0.84, and the true positive rate for the “Caries” category was 0.81.
In this research, because of the lack of a large dataset, we used a dataset of 116 patients with a total of 3712 dental images, and we also used three different augmentation schemas to increase the number of training samples. Comparing all three augmentation schemas, schema 3, which augmented the number of “Caries” twenty times had the best performance in identifying the “Caries” images than the previous two schemas, which augmented the “Caries” five times and fifteen times, respectively. However, the improved performance in the “Caries” images also resulted in the decreased total accuracy performance because of the overfitting problem. Eventually, because our research emphasis was more on identifying “Caries” than the “Normal” or “Filled” categories, we used schema 3 as the final model. Therefore, further study can focus on: Obtaining the Access to a larger dataset which has more rational proportion between the number of “Caries” and “Normal” teeth images. We recommend that future research focus more on finding the best combination between the “Normal”, “Caries”, and “Filled” augmentation schema.
Author Contributions
Conceptualization, Carol Anne Hargreaves.; methodology, Dankai Liao; software, Dankai Liao; validation, Dankai Liao and Carol Anne Hargreaves; formal analysis, Dankai Liao; writing—original draft preparation, Dankai Liao.; writing—review and editing, Carol Anne Hargreaves; visualization, Dankai Liao; supervision, Carol Anne Hargreaves; project administration, Carol Anne Hargreaves; All authors have read and agreed to the published version of the manuscript.
Funding
This research received no external funding.
Data Availability Statement
The dataset is available at https://data.mendeley.com/datasets/hxt48yk462/2. This dataset consists of anonymized and deidentified panoramic dental X-rays of 116 patients, taken at Noor Medical Imaging Center, Qom, Iran. The subjects cover a wide range of dental conditions from healthy, to partial and complete edentulous cases. The mandibles of all cases are manually segmented by two dentists. This dataset is used as the basis for the article by Abdi et al [1]. [1] A. H. Abdi: S. Kasaei, and M. Mehdizadeh, “Automatic segmentation of mandible in panoramic x-ray,” J. Med. Imaging, vol. 2, no. 4, p. 44003, 2015.
Conflicts of Interest
The authors declare no conflict of interest.
References
- Gomez, J. Detection and diagnosis of the early caries lesion. BMC oral health 2015, 15, 1–7. [CrossRef]
- WHO, Oral Health. https://www.who.int/news-room/fact-sheets/detail/oral-health, 2022, [Online; accessed 7-November-2022].
- Wikipedia contributors, Tooth decay — Wikipedia, The Free Encyclopedia. https://en.wikipedia.org/w/index.php?title=Tooth_decay&oldid=1112346535, 2022; [Online; accessed 7-November-2022].
- Dental-equipment. https://www.cattanicompressors.com.au/2021/12/28/dental-equipment-names, 2022; [Online; accessed 7-November-2022].
- Cosson, J. Australian Journal for General Practitioners 2020, 49, 550–555.
- Harikrishnan, P. Journal of Hand and Microsurgery 2016, 8, 181–182.
- Krizhevsky, A.; Sutskever, I.; Hinton, G. E. Communications of the ACM 2017, 60, 84–90.
- Tohnak, S.; Mehnert, A.; Mahoney, M.; Crozier, S. Dental identification system based on unwrapped CT images. 2009 Annual International Conference of the IEEE Engineering in Medicine and Biology Society. 2009; pp 3549– 3552.
- de Brebisson, A.; Montana, G. Deep neural networks for anatomical brain segmentation. Proceedings of the IEEE conference on computer vision and pattern recognition workshops. 2015; pp 20–28.
- Yadav, S. S.; Jadhav, S. M. Deep convolutional neural network based medical image classification for disease diagnosis; Journal of Big Data 2019, 6, 1–18.
- Abdi, A. H.; Kasaei, S.; Mehdizadeh, M. Automatic segmentation of mandible in panoramic x-ray. Journal of Medical Imaging; 2015, 2, 044003.
- Zakian, C.; Taylor, A.; Ellwood, R.; Pretty, I. Occlusal caries detection by using thermal imaging; Journal of dentistry 2010, 38, 788 -795.
- Kositbowornchai, S.; Siriteptawee, S.; Plermkamon, S.; Bureerat, S.; Chetchotsak, D. An Artificial Neural Network for Detection of Simulated Dental Caries; International Journal of Computer Assisted Radiology and Surgery 2006, 1, 91–96.
- Litjens, G.; Kooi, T.; Bejnordi, B. E.; Setio, A. A. A.; Ciompi, F.; Ghafoorian, M.; Van Der Laak, J. A.; Van Ginneken, B.; Sánchez, C. I. A survey on deep learning in medical image analysis; Medical image analysis 2017, 42, 60–88.
- Sahiner, B.; Chan, H.-P.; Petrick, N.; Wei, D.; Helvie, M. A.; Adler, D. D.; Goodsitt, M. M. Classification of mass and normal breast tissue: a convolution neural network classifier with spatial domain and texture images; IEEE transactions on Medical Imaging 1996, 15, 598–610.
- https://ieeexplore-ieee-org.libproxy1.nus.edu.sg/stamp/stamp.jsp?tp=&arnumber=9753092; [online; accessed on 24 April 2023]. 24 April.
- https://www.sciencedirect.com/science/article/abs/pii/S0300571222001336?via%3Dihub; [Online; accessed on 24 April 2023]. 24 April.
- Olsen G. Ph.D. Thesis. Virginia Commonwealth University; Richmond, VA, USA: 2010. Fundamental Work toward an image Processing-Empowered Dental Intelligent Educational System. [Google Scholar].
- Thong, W.; Kadoury, S.; Piché, N.; Pal, C. J. Computer Methods in Biomechanics and Biomedical Engineering: Imaging & Visualization 2018, 6, 277–282.
- Abdi, Amir Hossein and Kasaei, Shohreh and Mehdizadeh, Mojdeh, Panoramic Dental X-rays with segmented Mandibles. https://data.mendeley.com/datasets/hxt48yk462/2, [Online; accessed 7-November-2022].
- Gonzalez, R.; Woods, R.; Eddins, S. Digital image processing using Matlab; Gatesmark Publishing. 2009.
- Kumar, R. ; Multimed Tools Appl; 2019.
- Tuan, T. M., et al.; A cooperative semi-supervised fuzzy clustering framework for dental X-ray image segmentation; Expert Systems with Applications 2016, 46, 380–393. [CrossRef]
- Shakeel, P. M.; Tobely, T. E. E.; Al-Feel, H.; Manogaran, G.; Baskar, S.; Neural network-based brain tumor detection using wireless infrared imaging sensor; IEEE Access 2019, 7, 5577–5588. [CrossRef]
- Sund, T.; Møystad, A. Sliding window adaptive histogram equalization of intraoral radiographs: effect on image quality. Dentomaxillofacial Radiology 2006, 35, 133–138. [CrossRef]
- Wikipedia contributors, Neural architecture search — Wikipedia, The Free Encyclopedia. 2022; https://en.wikipedia.org/w/index.php?title=Neural_architecture_search&oldid=1119690514, [Online; accessed 23-November-2022].
- https://iq.opengenus.org/nasnet/, [Online; accessed 24- April 2023]. 20 April.
- Barret Zoph, Quoc V. Le (2017). Neural Architecture Search with Reinforcement Learning. https://arxiv.org/abs/1611.01578, [Online; accessed 7-November-2022].
- Bowen Baker, Otkrist Gupta, Ramesh Raskar, Nikhil Naik 920170. Accelerating Neural Architecture Search using Performance Prediction. https://arxiv.org/abs/1705.10823, [Online; accessed 7-November-2022].
- Arjun Ghosh (2020). The Fundamentals of Neural Architecture Search (NAS). https://pub.towardsai.net/the-fundamentals-of-neural-architecture-search-nas-9bb25c0b75e2, [Online; accessed 7-November-2022].
- https://www.upgrad.com/blog/basic-cnn-architecture/, [Online; accessed 24 April 2023]. 24 April.
- https://developer.nvidia.com/discover/convolutional-neural-network, [Online; accessed 24 April 2023]. 24 April.
- Setio, A. A. A.; Ciompi, F.; Litjens, G.; Gerke, P.; Jacobs, C.; Van Riel, S. J.; Wille, M. M. W.; Naqibullah, M.; Sánchez, C. I.; Van Ginneken, B. Pulmonary Nodule Detection in CT Images: False Positive Reduction Using Multi-View Convolutional Networks; IEEE transactions on medical imaging 2016, 35, 1160–1169. [CrossRef]
- Addagarla, S.; Chakravarthi, G.; Anitha, P. Real Time Multi-Scale Facial Mask Detection and Classification Using Deep Transfer Learning Techniques; International Journal of Advanced Trends in Computer Science and Engineering 2020, 9, 4402–4408. [CrossRef]
- nasnetmobile structure. https://www.mathworks.com/help/deeplearning/ref/nasnetmobile.html, 2022; [Online; accessed 7-November-2022].
- nasnetmobile document. https://www.tensorflow.org/api_docs/python/tf/keras/applications/nasnet/NASNetMobile, 2022; [Online; accessed 7-November-2022].
- Prajapati, S. A.; Nagaraj, R.; Mitra, S. Classification of dental diseases using CNN and transfer learning. 2017 5th International Symposium on Computational and Business Intelligence (ISCBI). 2017; pp 70–74.
- Russakovsky, O.; Deng, J.; Su, H.; Krause, J.; Satheesh, S.; Ma, S.; Huang, Z.; Karpathy, A.; Khosla, A.; Bernstein, M., et al. ImageNet Large Scale Visual Recognition Challenge; International journal of computer vision 2015, 115, 211–252.
Figure 1.
Project Pipeline Diagram.
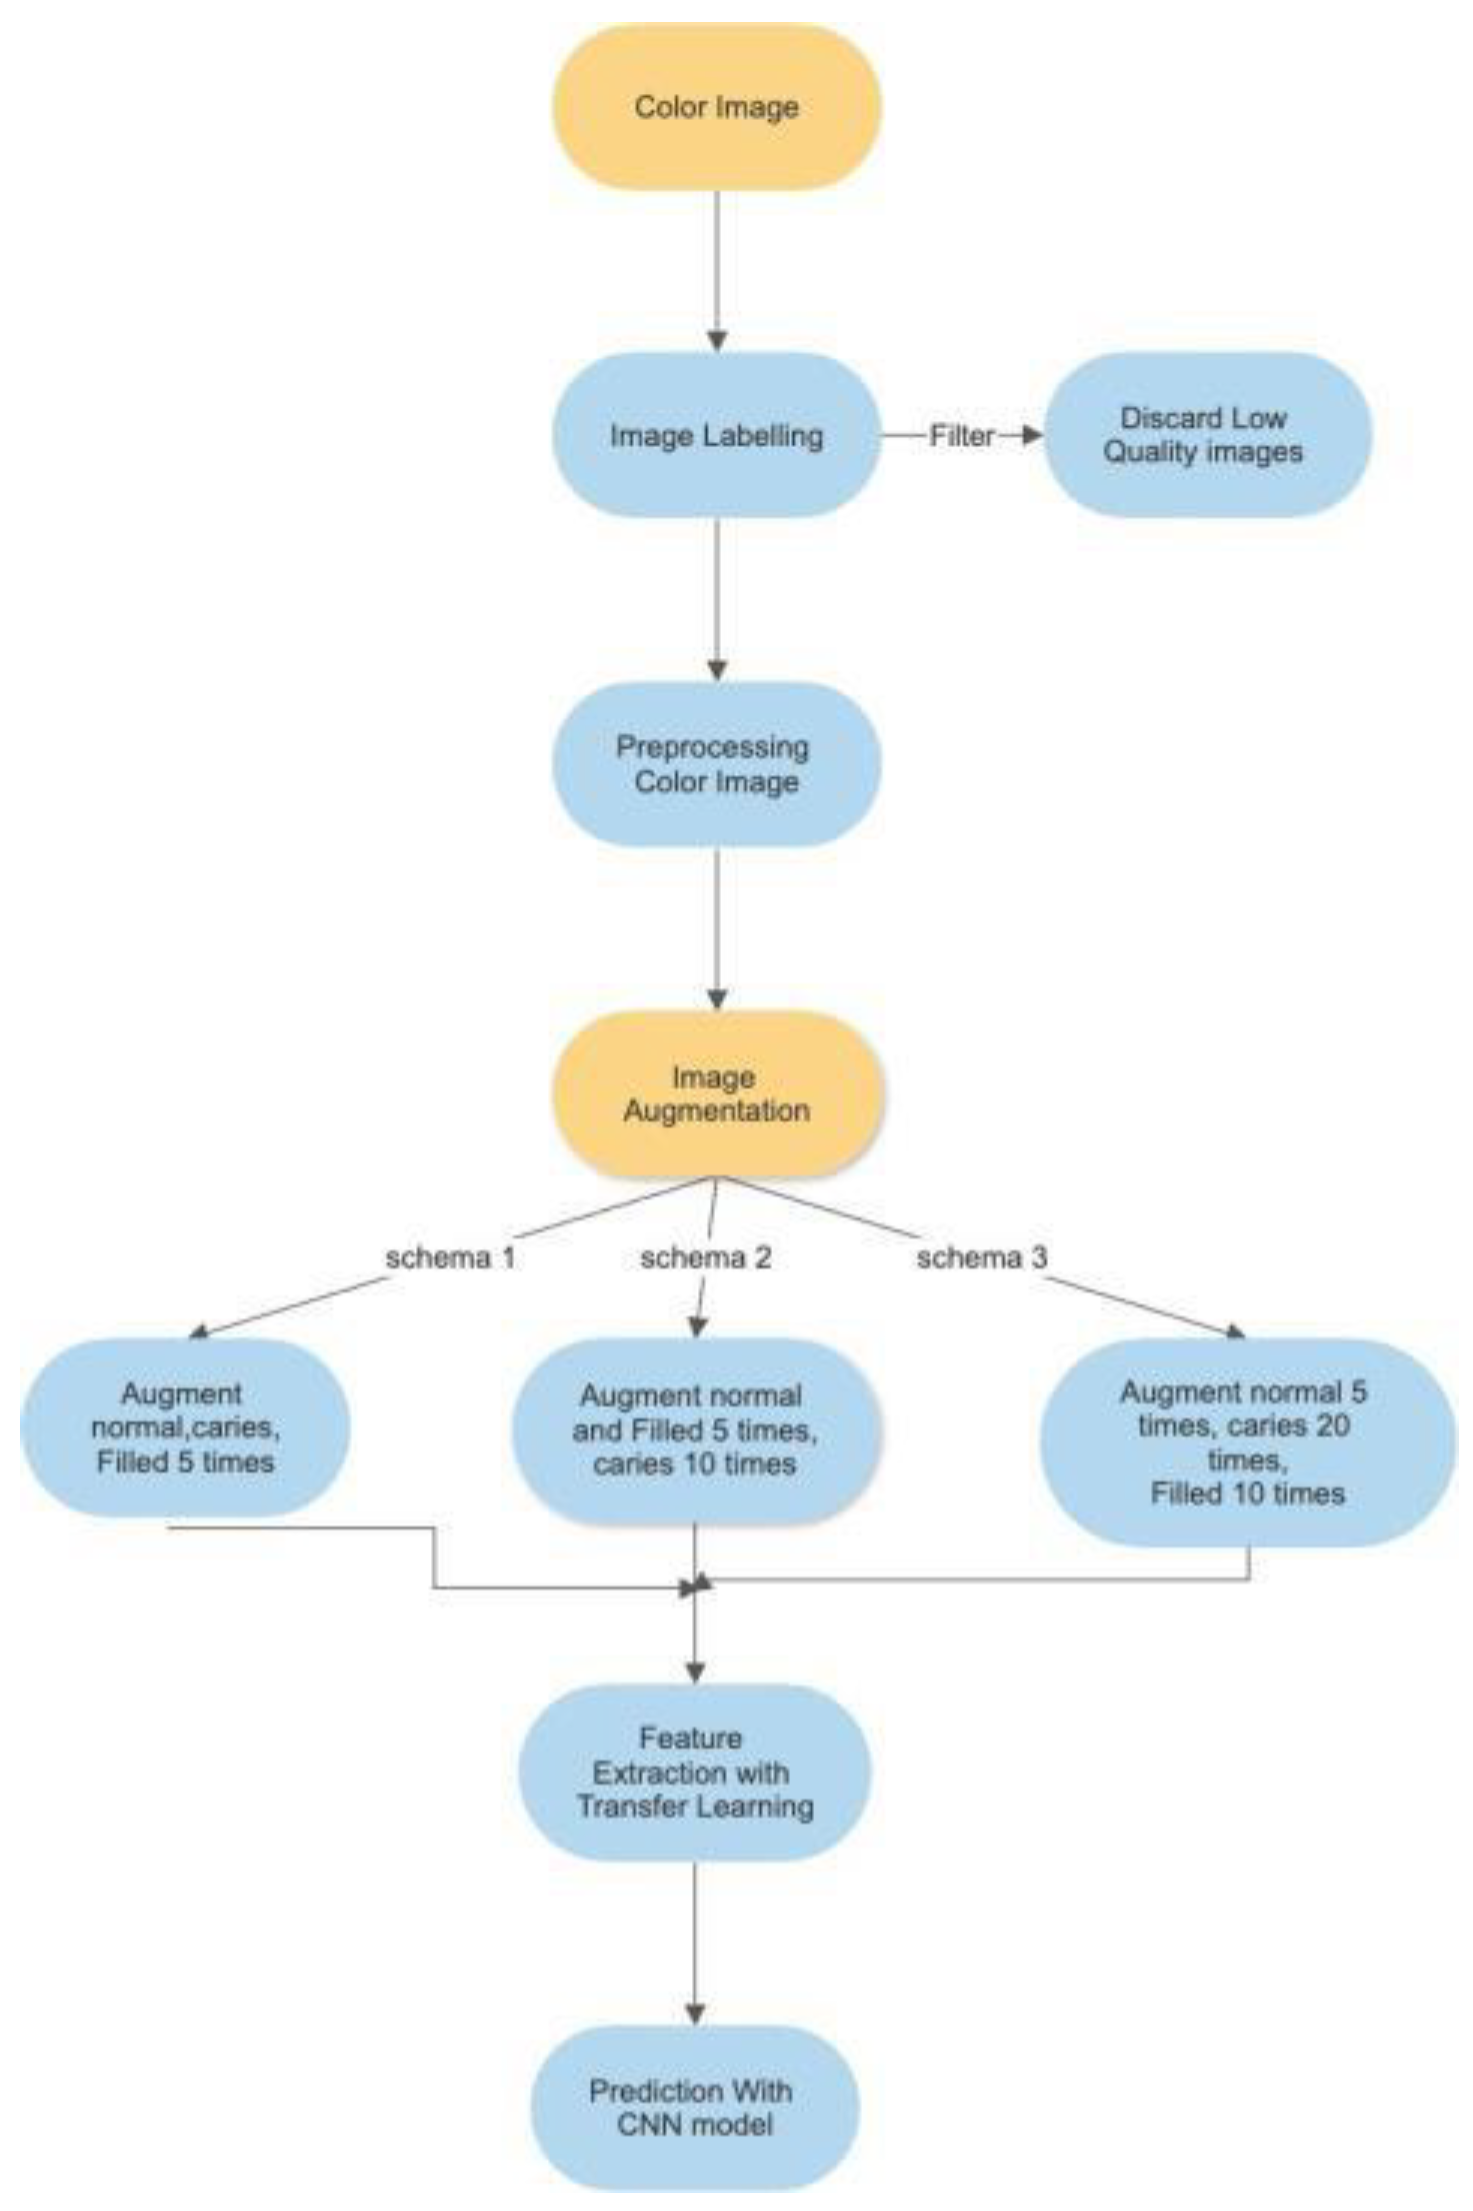
Figure 2.
A Sample Image before pre-processing.
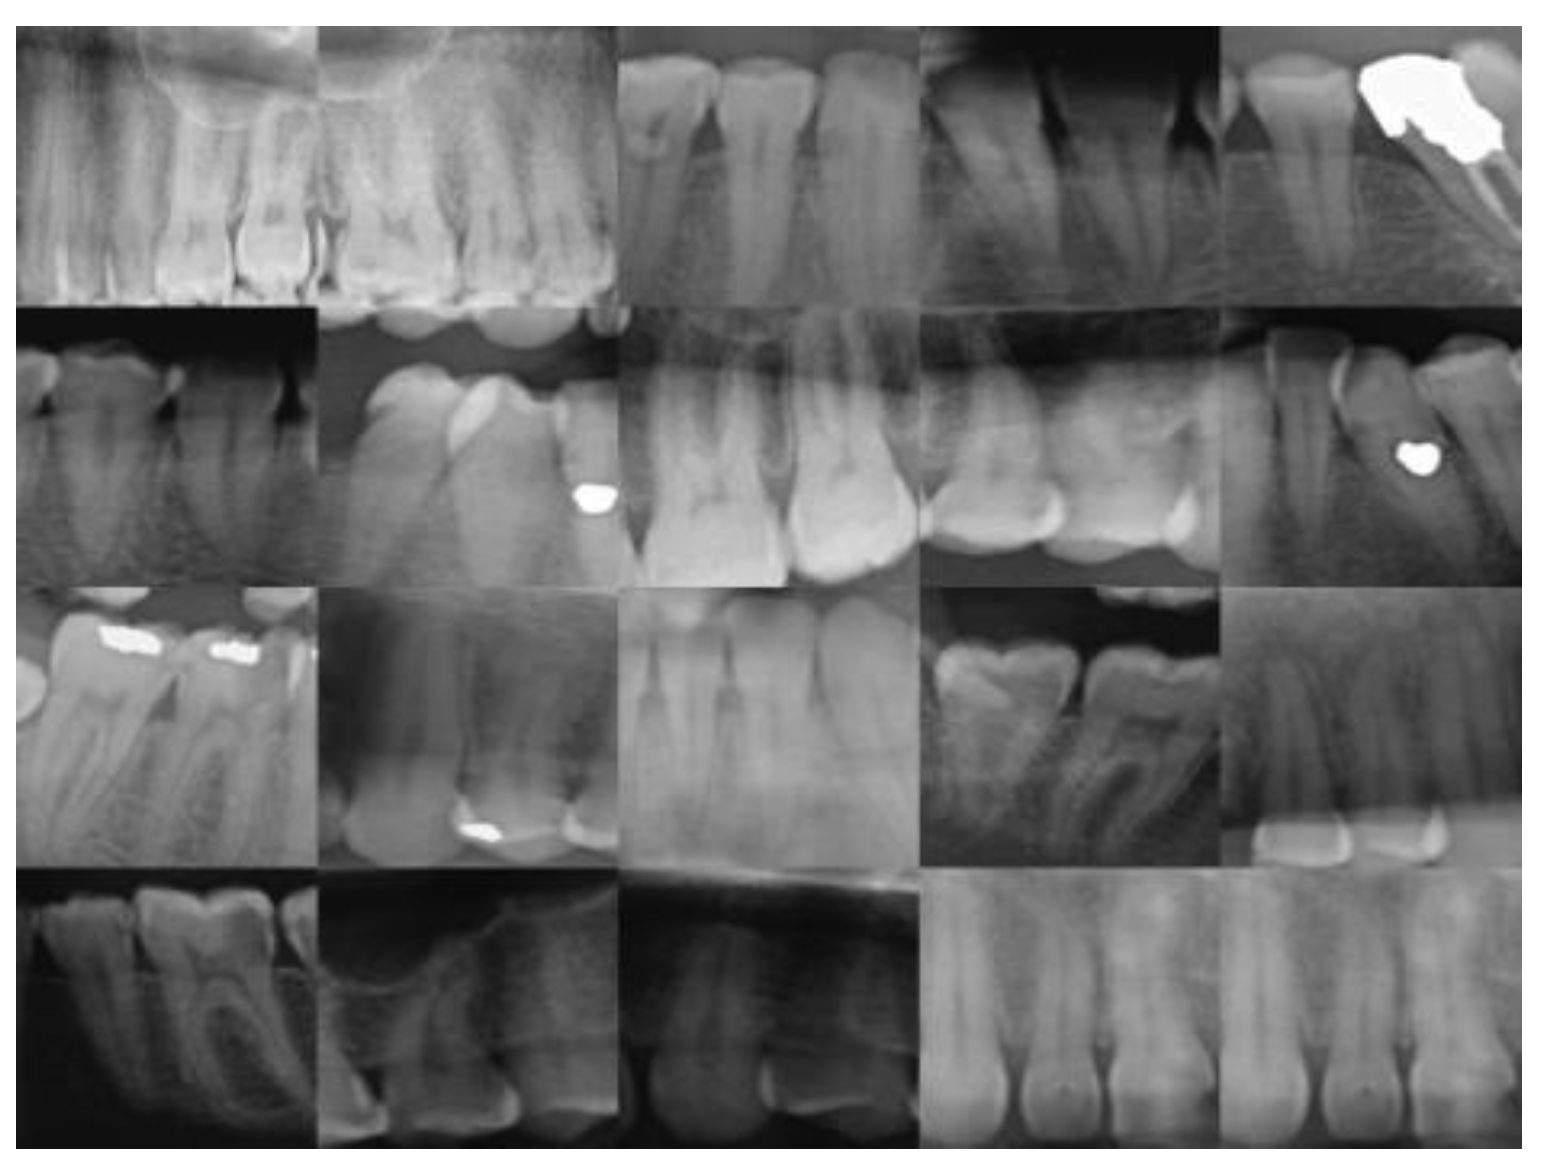
Figure 3.
A Sample Image after Augmentation.
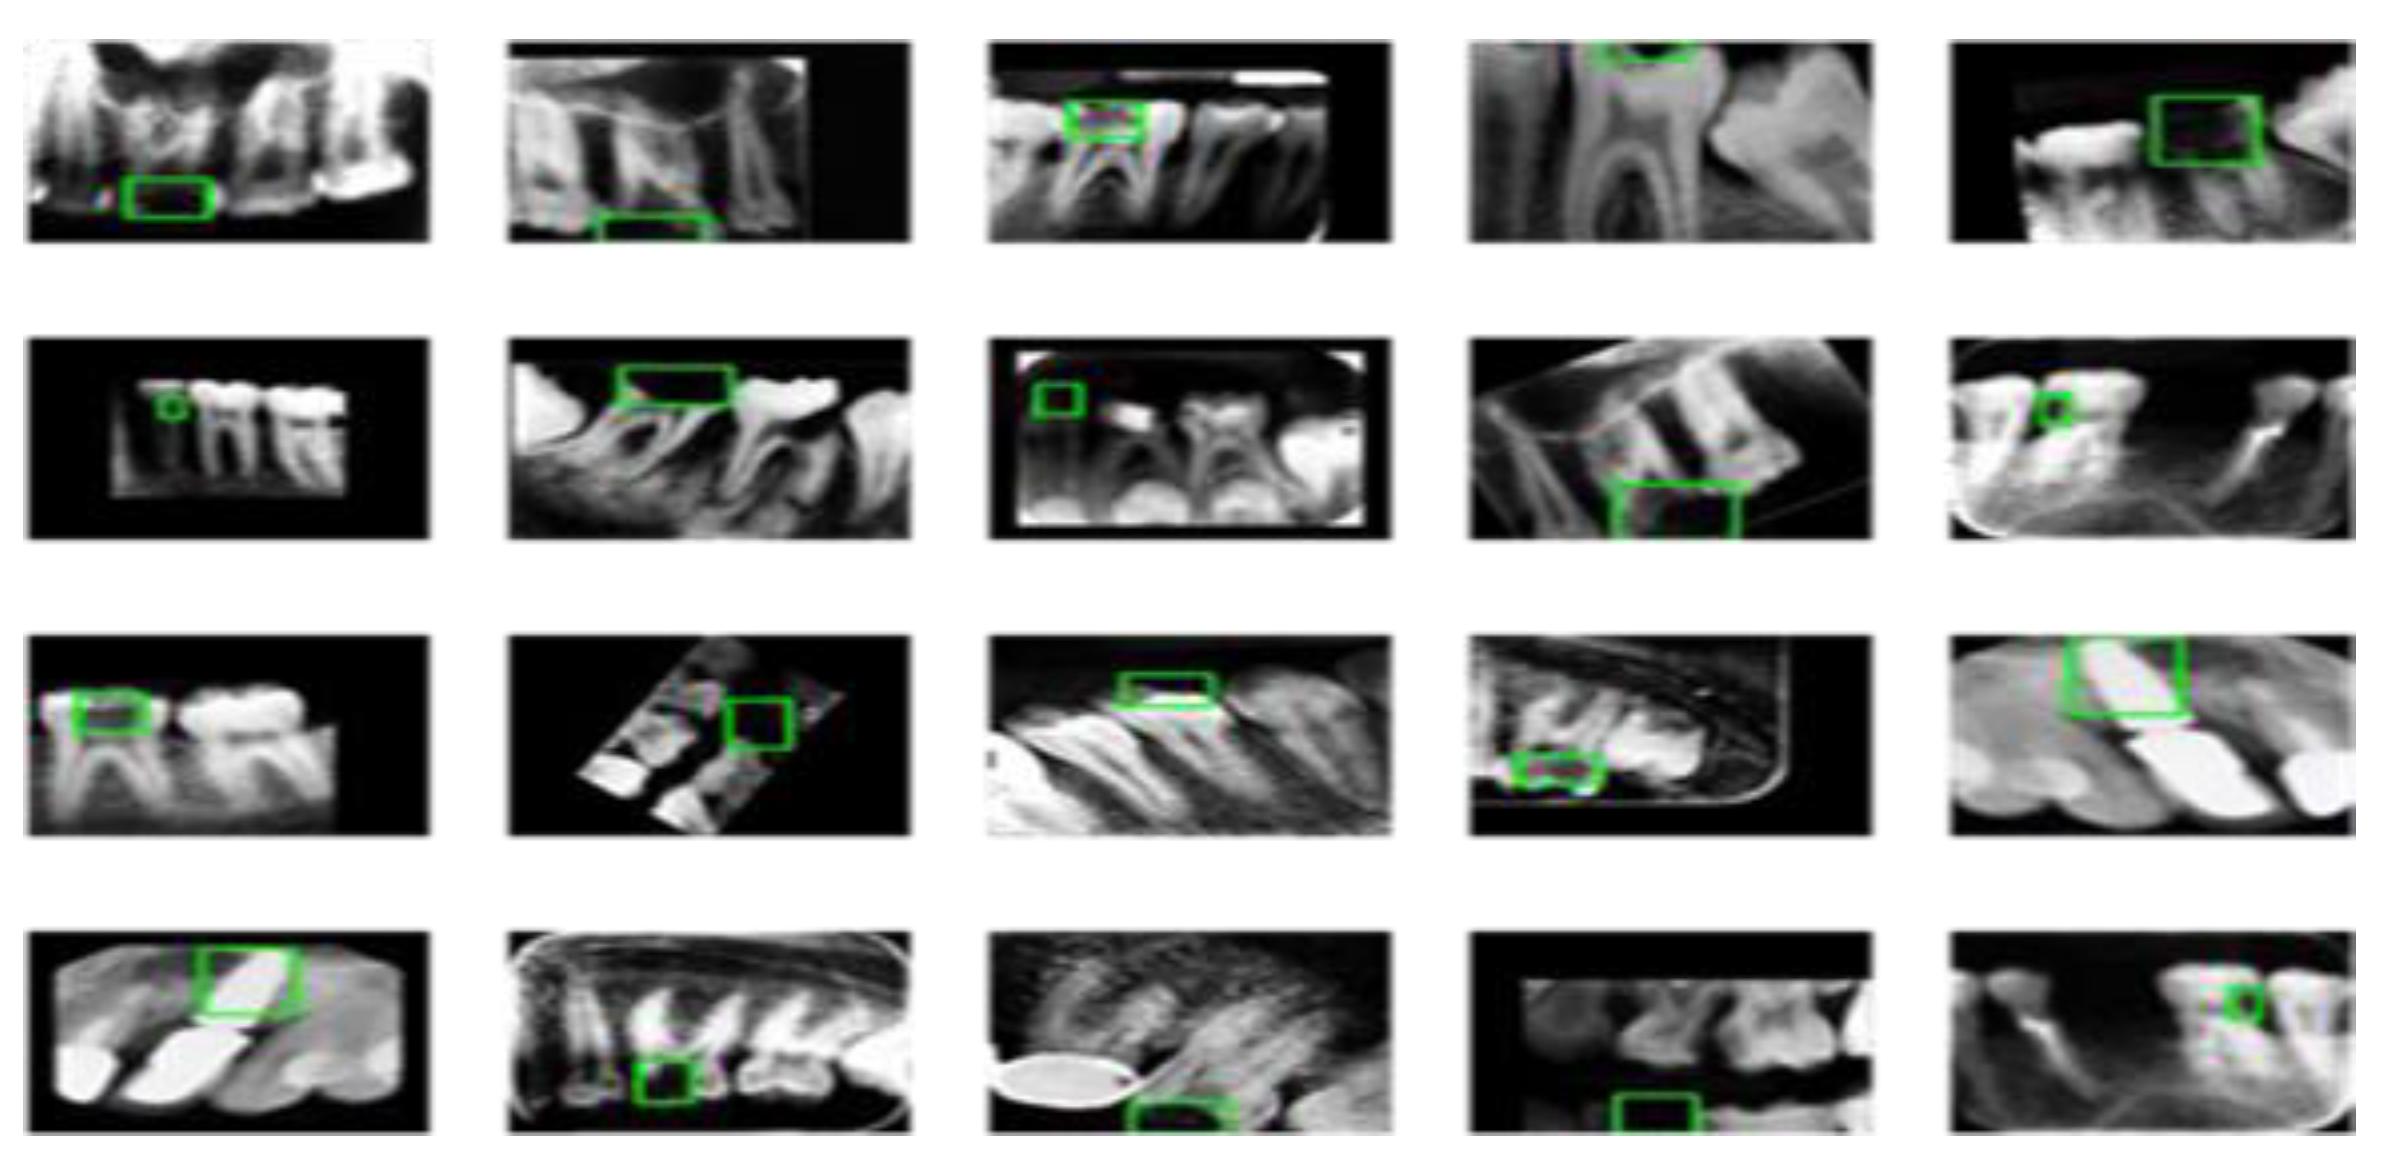
Figure 4.
Neural Architecture Search (NAS) that automates network architecture engineering. https://iq.opengenus.org/nasnet/ [27].
Figure 4.
Neural Architecture Search (NAS) that automates network architecture engineering. https://iq.opengenus.org/nasnet/ [27].
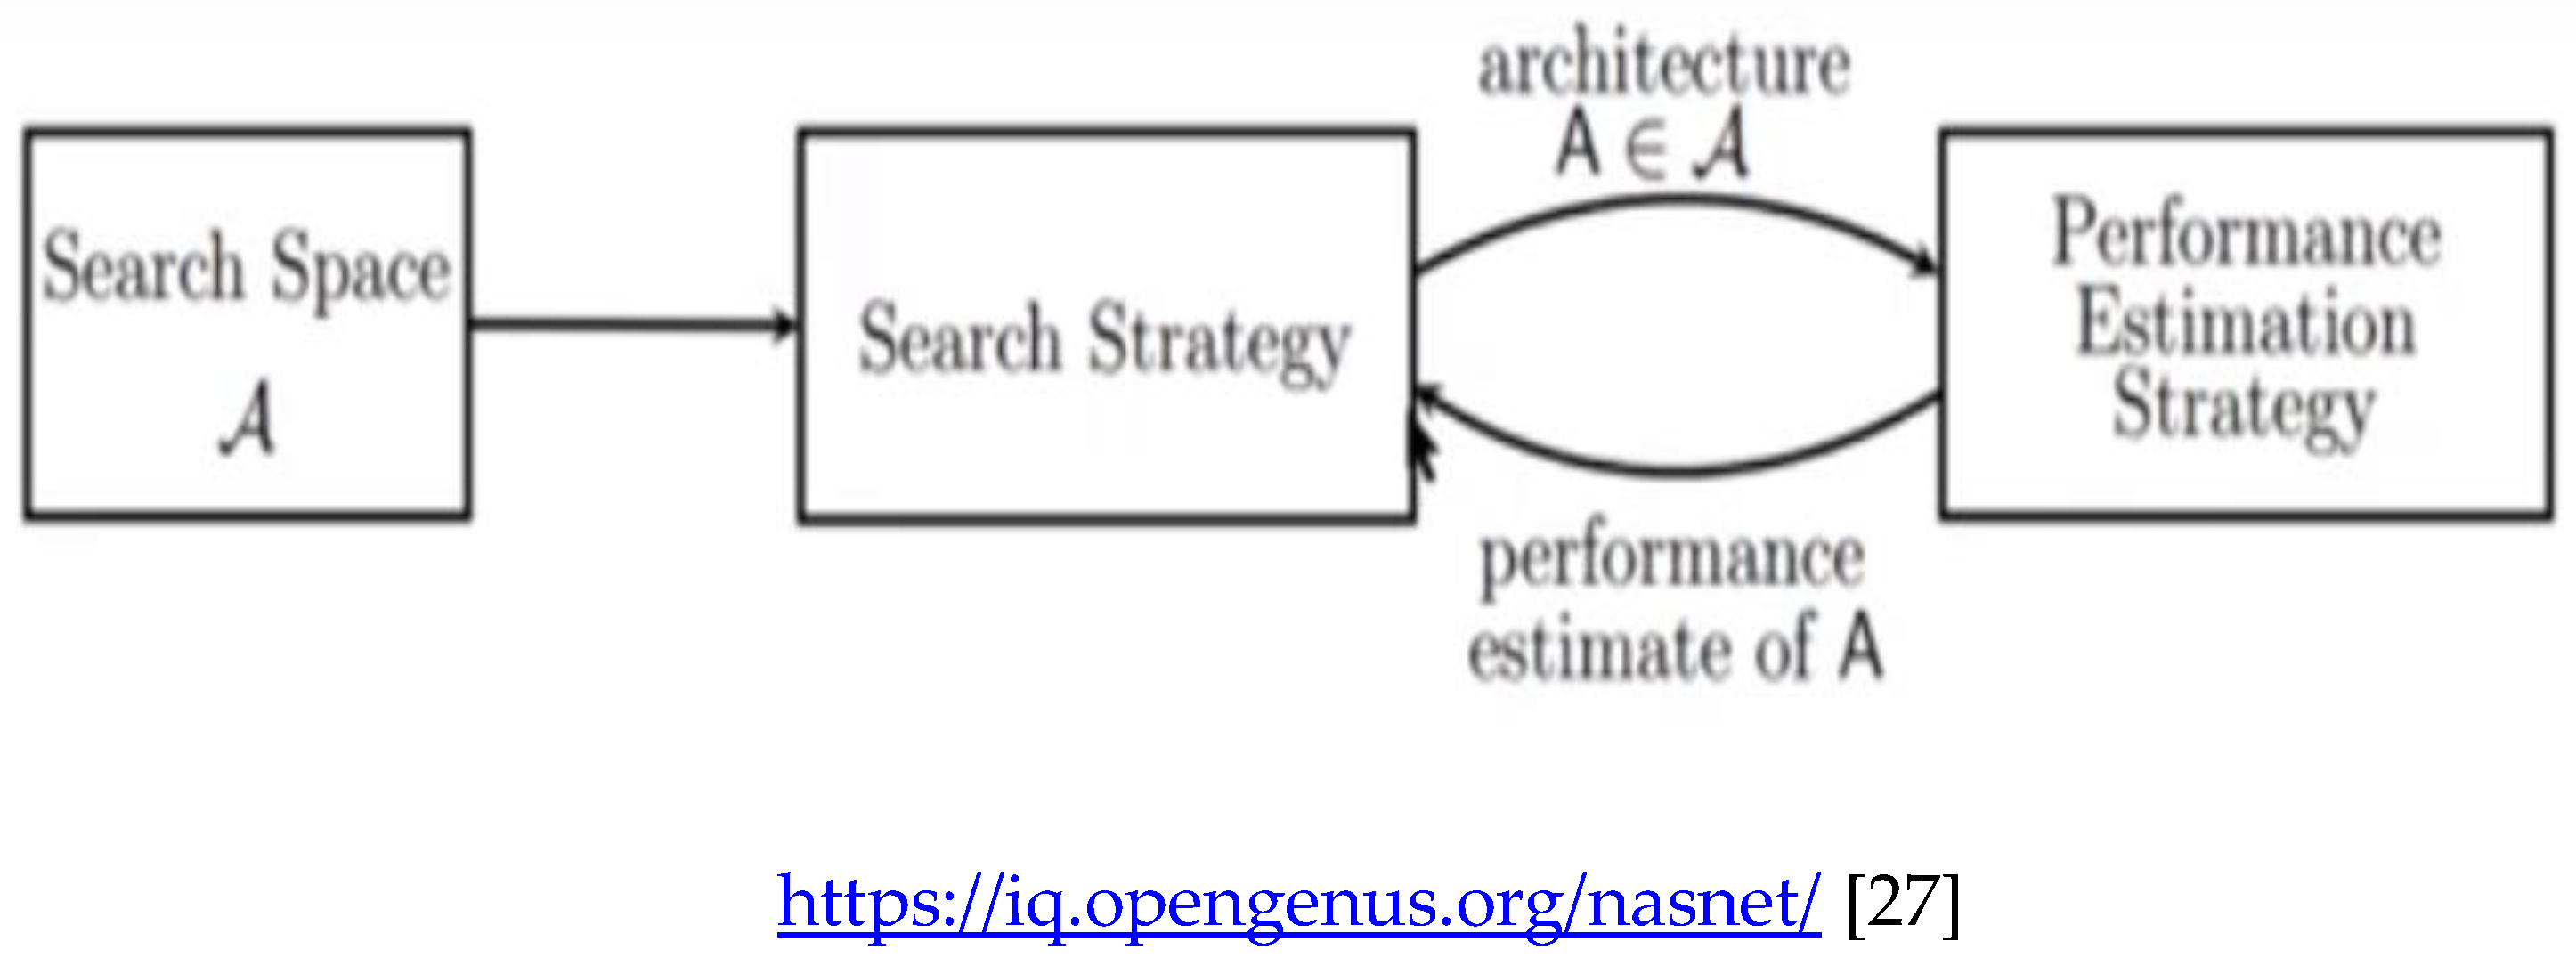
Figure 5.
Architecture of a CNN Model. https://www.upgrad.com/blog/basic-cnn-architecture/ [31].
Figure 5.
Architecture of a CNN Model. https://www.upgrad.com/blog/basic-cnn-architecture/ [31].
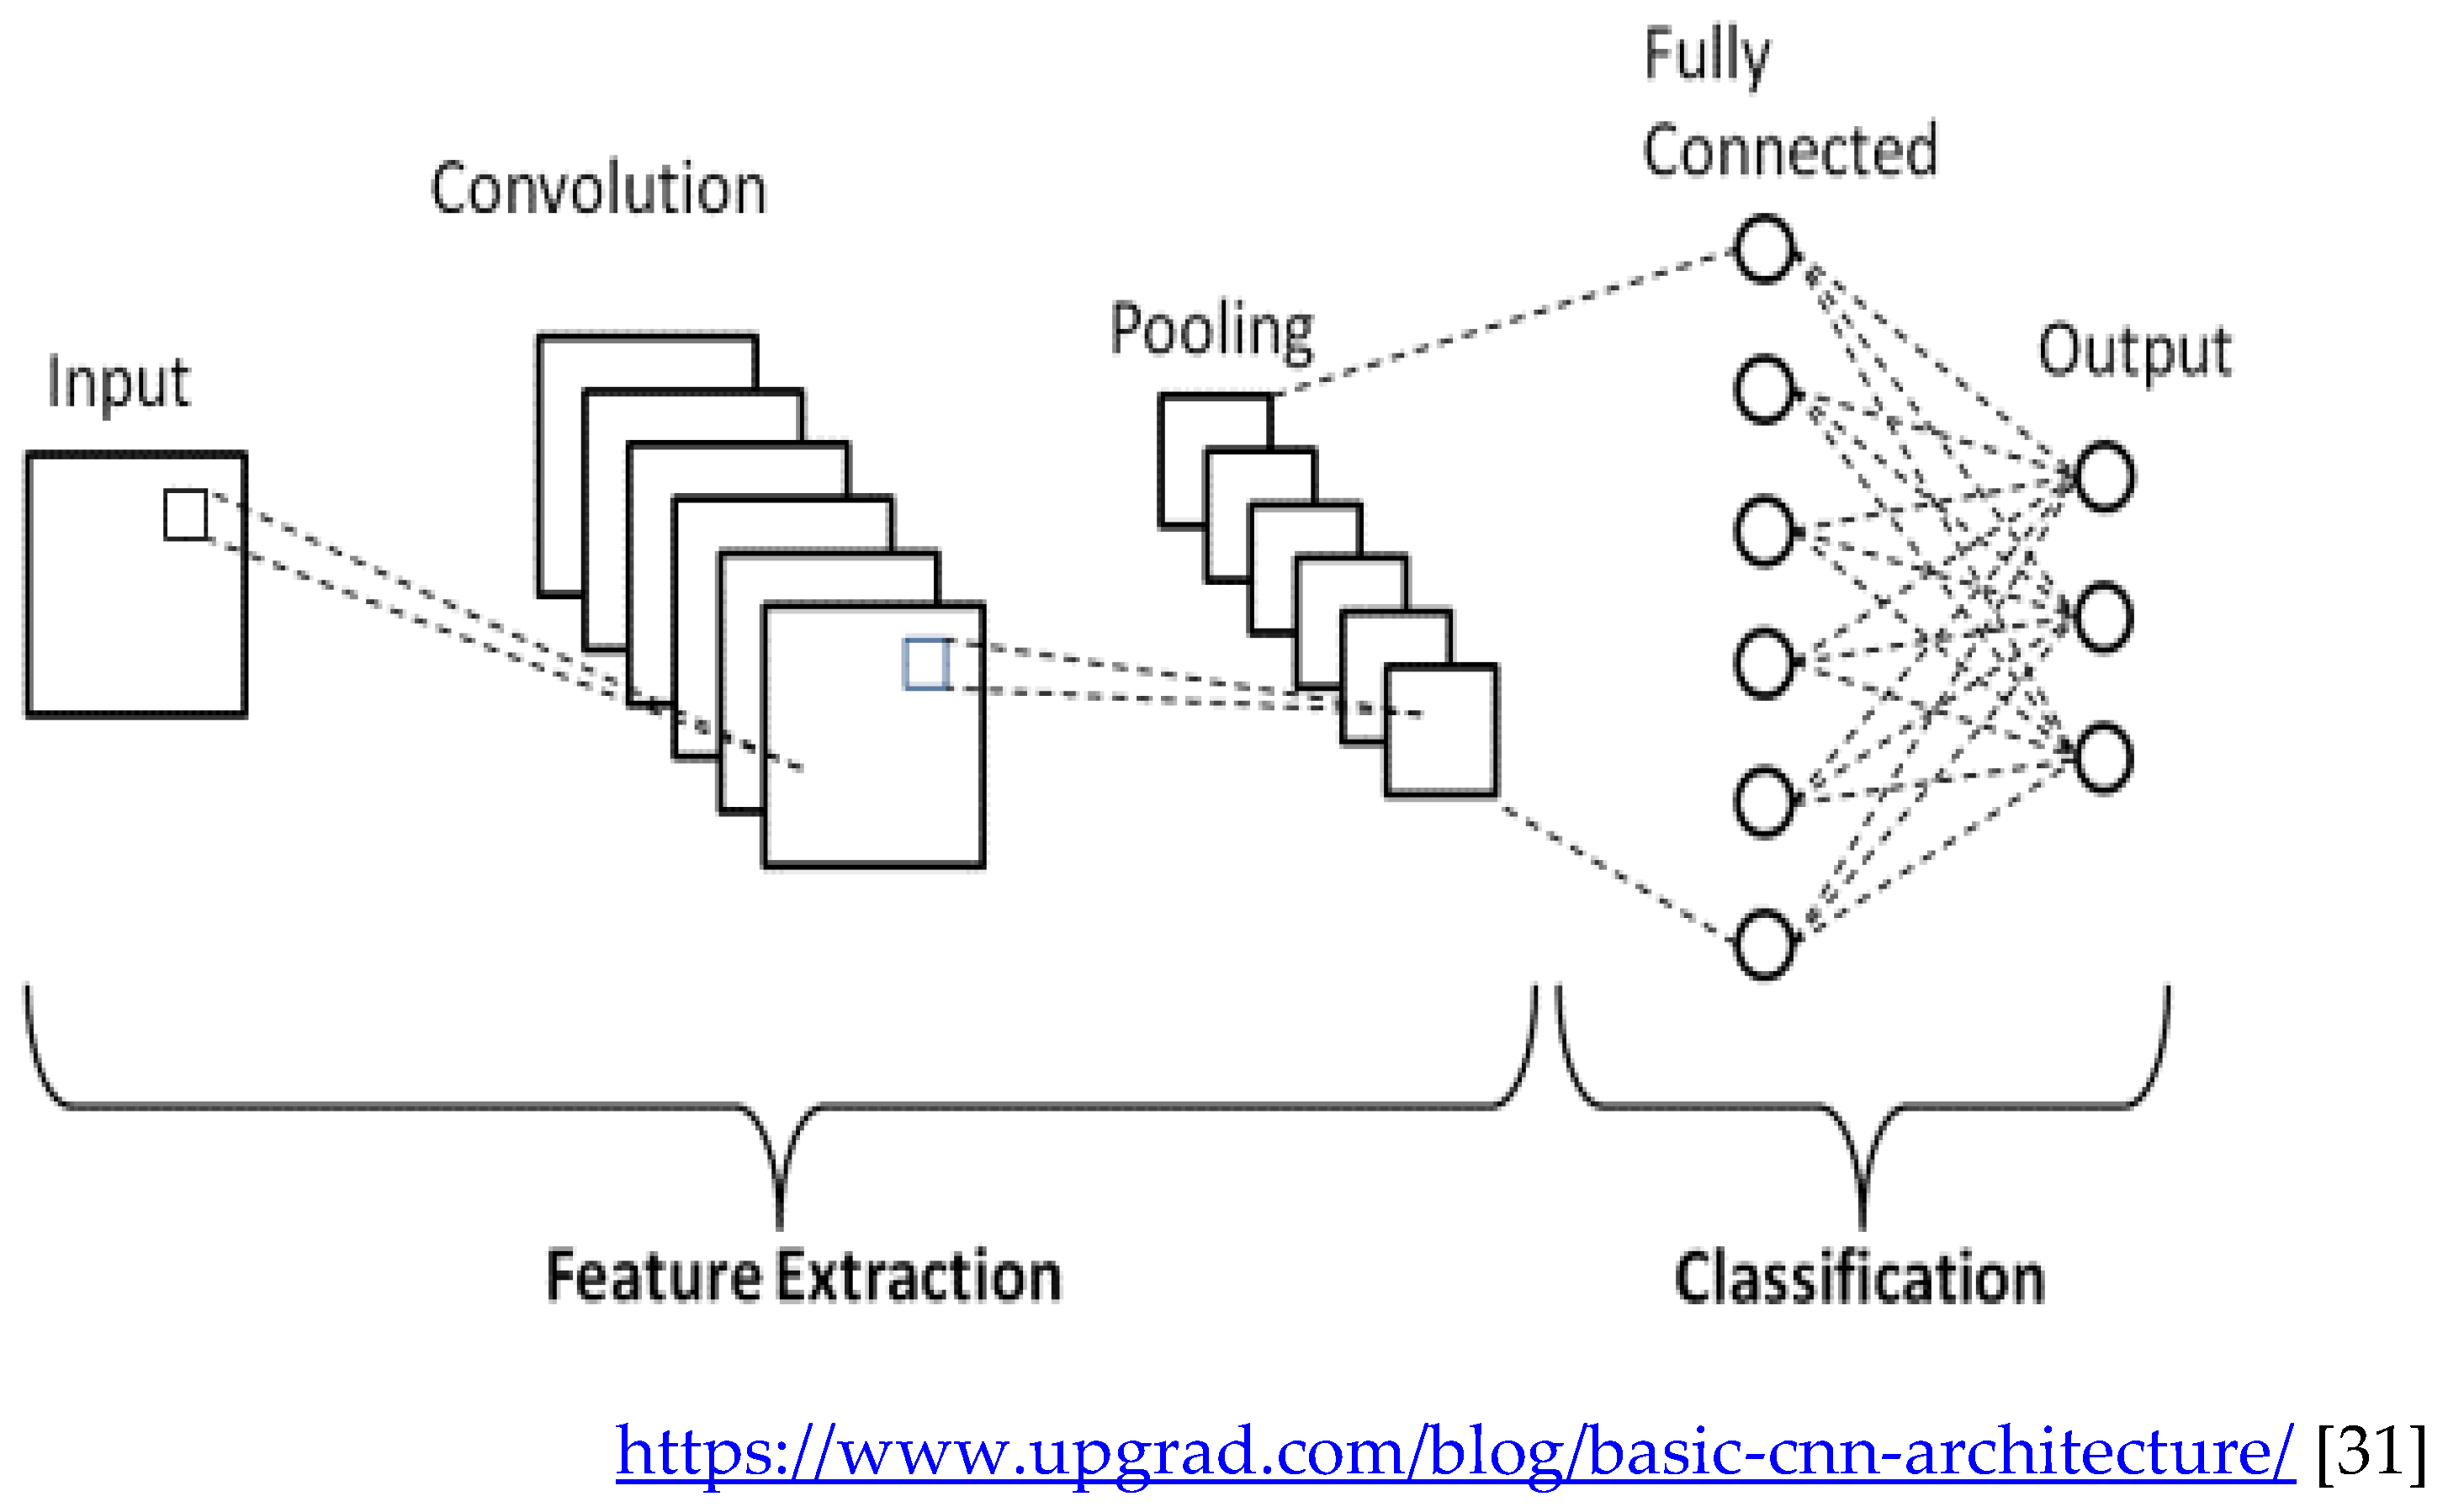
Figure 6.
Artificial Neural Network with four layers.
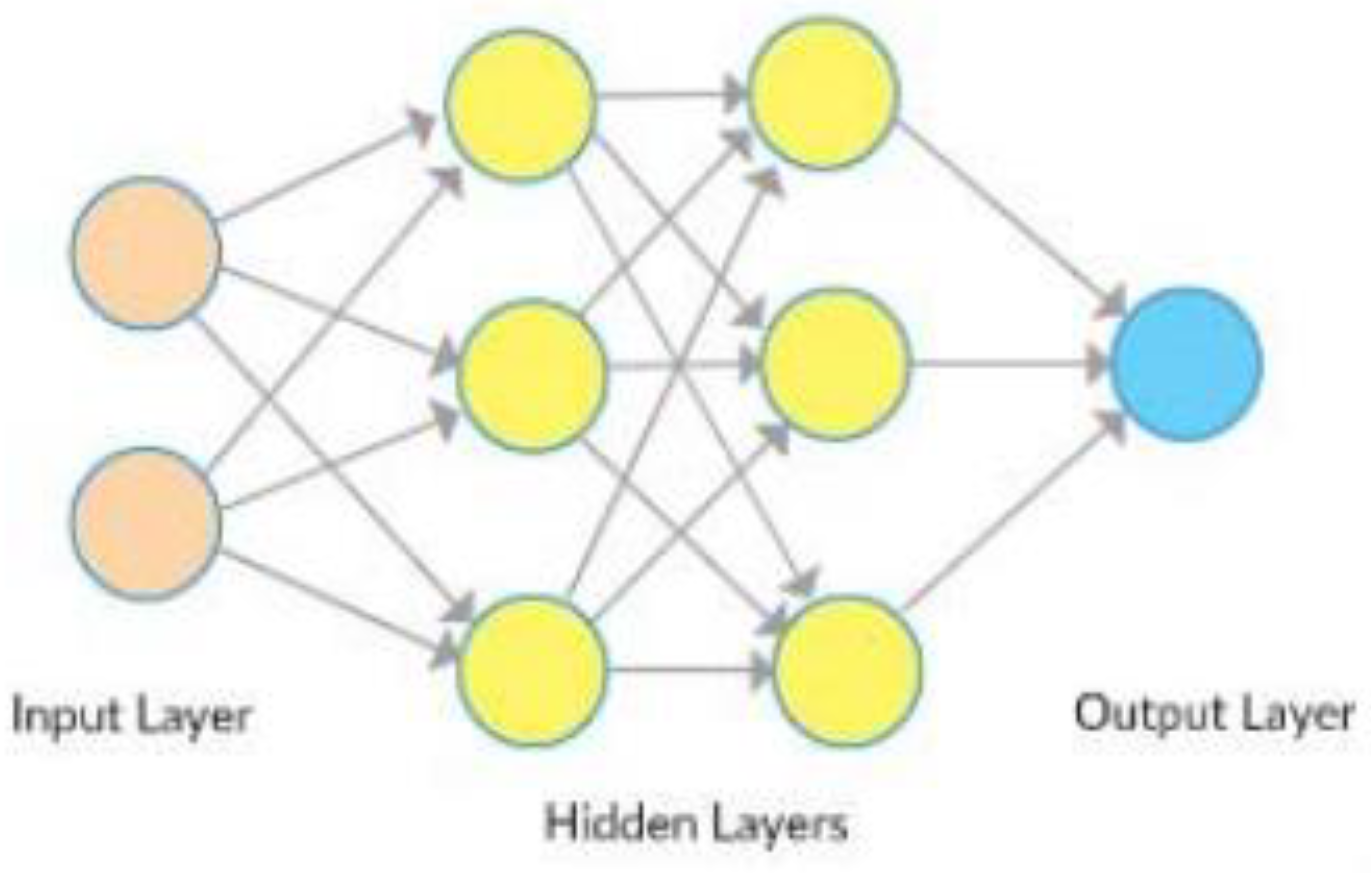
Figure 7.
Convolutional Neural Network Architecture.
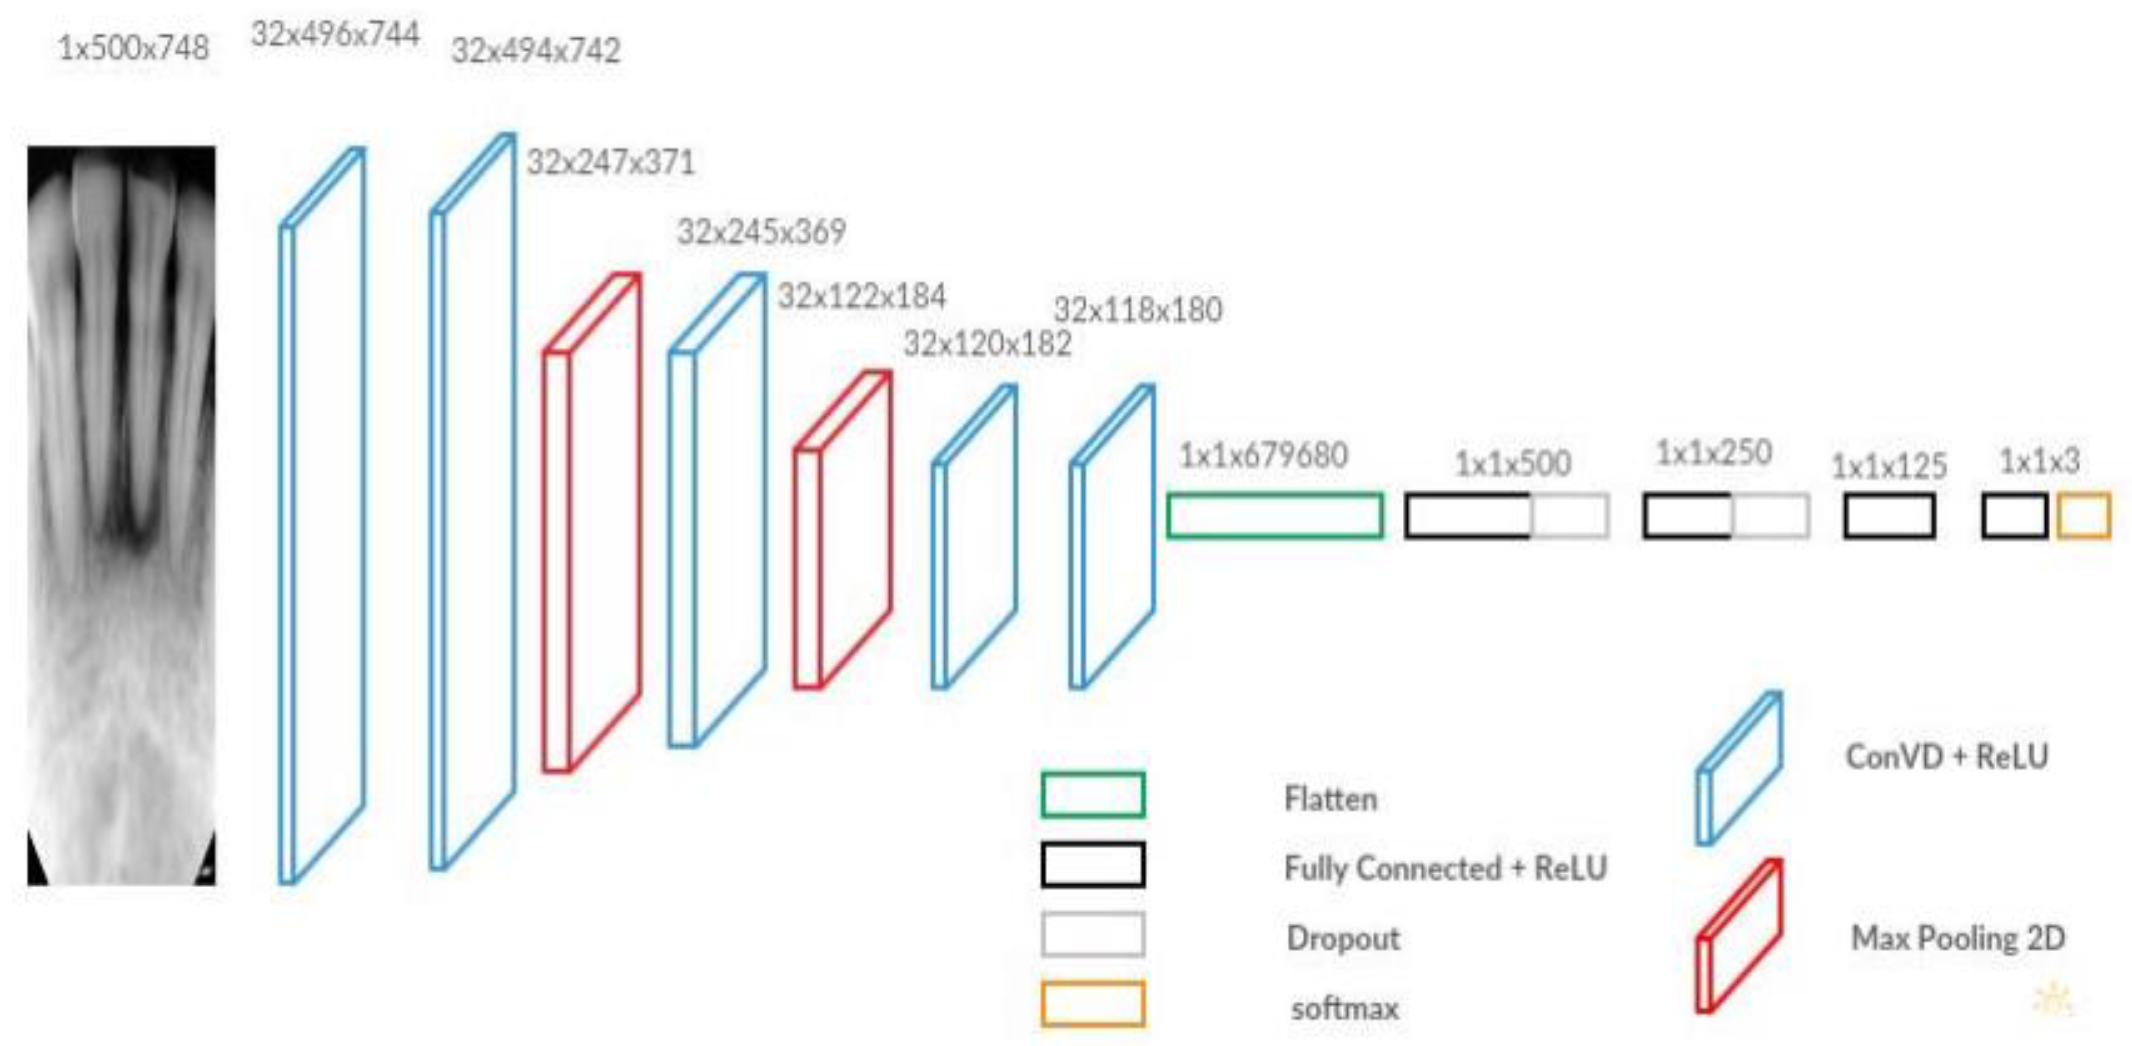

Table 1.
Schema 1 Training Confusion Matrix.
| Predict \ Fact | Normal | Caries | Filled |
| Normal | 10541 | 42 | 285 |
| Caries | 74 | 287 | 52 |
| Filled | 720 | 21 | 2778 |
Table 2.
Schema 1 Training Accuracy Result.
| Class | Precision | Recall | F1-score |
| Normal | 0.97 | 0.93 | 0.95 |
| Caries | 0.70 | 0.82 | 0.76 |
| Filled | 0.79 | 0.89 | 0.84 |
Table 3.
Schema 1 Test Confusion Matrix .
| Predict \ Fact | Normal | Caries | Filled |
| Normal | 395 | 7 | 12 |
| Caries | 24 | 18 | 7 |
| Filled | 35 | 3 | 105 |
Table 4.
Schema 1 Test Accuracy Result .
| Class | Precision | Recall | F1-score |
| Normal | 0.95 | 0.87 | 0.91 |
| Caries | 0.37 | 0.65 | 0.47 |
| Filled | 0.74 | 0.85 | 0.80 |
Table 5.
Schema 2 Training confusion matrix.
| Predict \ Fact | Normal | Caries | Filled |
| Normal | 10498 | 94 | 239 |
| Caries | 283 | 903 | 79 |
| Filled | 554 | 53 | 2797 |
Table 6.
Schema 2 Training Accuracy Result.
| Class | Precision | Recall | F1-score |
| Normal | 0.97 | 0.93 | 0.95 |
| Caries | 0.71 | 0.86 | 0.78 |
| Filled | 0.82 | 0.90 | 0.86 |
Table 7.
Schema 2 Confusion Matrix.
| Predict \ Fact | Normal | Caries | Filled |
| Normal | 403 | 5 | 13 |
| Caries | 15 | 21 | 9 |
| Filled | 36 | 2 | 102 |
Table 8.
Schema 2 Test Accuracy Result.
| Class | Precision | Recall | F1-score |
| Normal | 0.96 | 0.89 | 0.92 |
| Caries | 0.47 | 0.75 | 0.58 |
| Filled | 0.73 | 0.82 | 0.77 |
Table 9.
Schema 3 Training Confusion Matrix.
| Predict \ Fact | Normal | Caries | Filled |
| Normal | 10492 | 101 | 410 |
| Caries | 242 | 1260 | 120 |
| Filled | 601 | 39 | 5700 |
Table 10.
Schema 3 Training Accuracy Result.
| Class | Precision | Recall | F1-score |
| Normal | 0.95 | 0.92 | 0.93 |
| Caries | 0.78 | 0.90 | 0.84 |
| Filled | 0.90 | 0.91 | 0.90 |
Table 11.
Schema 3 Test Confusion Matrix.
| Predict \ Fact | Normal | Caries | Filled |
| Normal | 388 | 4 | 11 |
| Caries | 24 | 23 | 8 |
| Filled | 42 | 1 | 105 |
Table 12.
Schema 3 Test Accuracy Result.
| Class | Precision | Recall | F1-score |
| Normal | 0.96 | 0.86 | 0.91 |
| Caries | 0.42 | 0.81 | 0.55 |
| Filled | 0.71 | 0.85 | 0.77 |
Disclaimer/Publisher’s Note: The statements, opinions and data contained in all publications are solely those of the individual author(s) and contributor(s) and not of MDPI and/or the editor(s). MDPI and/or the editor(s) disclaim responsibility for any injury to people or property resulting from any ideas, methods, instructions or products referred to in the content. |
© 2023 by the authors. Licensee MDPI, Basel, Switzerland. This article is an open access article distributed under the terms and conditions of the Creative Commons Attribution (CC BY) license (http://creativecommons.org/licenses/by/4.0/).
Copyright: This open access article is published under a Creative Commons CC BY 4.0 license, which permit the free download, distribution, and reuse, provided that the author and preprint are cited in any reuse.


