
Submitted:
15 July 2024
Posted:
17 July 2024
You are already at the latest version
Abstract
The use of artificial intelligence algorithms (AI) has gained importance for dental applications in recent years. Analyzing using IA information from different sensor data such as images or X-ray radiographs can help to improve medical decisions and to achieve early diagnosis of different dental pathologies. In particular, the use of deep learning (DL) techniques based on convolutional neural networks (CNNs) has obtained promising results in dental applications based on images, in which approaches based on classification, detection, and segmentation are being studied with growing interest. However, there are still several challenges to be tackled, such as the data quality and quantity, the variability among categories, and the analysis of the possible bias and variance associated with each dataset distribution. In this work, we compare three different DL object detection models, which are Faster R-CNN, YOLO V2, and SSD. Each object detection architecture was trained, calibrated, validated, and tested with three different feature extraction CNNs which are ResNet-18, ResNet-50, and ResNet-101, which were the networks that best fit our dataset distribution. Based on such detection networks, we detect four different categories of angles in third molars using X-ray panoramic radiographs by using Winter's classification criterion. This criterion characterizes the third molar's position regarding the second molar's longitudinal axis. The detected categories for the third molars are distoangular, vertical, mesioangular, and horizontal. For training, we used a total of 644 panoramic X-ray images. The results obtained in the testing dataset reached up to 99% mean average accuracy performance, demonstrating the YOLOV2 obtained higher effectiveness in solving the third molar angle detection problem. These results demonstrate that the use of CNNs for object detection in panoramic X-rays represents a promising solution in dental applications.
Keywords:
Dentistry
; Third Molars Angle Detection
; Artificial Intelligence
; Convolutional Neural Networks
1. Introduction
Nowadays, the advancement of artificial intelligence (AI) has piqued the interest of researchers and programmers in incorporating this technology into numerous fields of dentistry. These advances have encouraged the creation of AI technological tools for activities such as patient management, education, predictive diagnostics, treatment planning, and even the detection of dental pathogens [1,2]. The term AI in dentistry applications corresponds to programming algorithms that are developed to fulfill work tasks similar to the performance of a dentist or worker related to specific dentistry activities. In particular, vision algorithms based on IA for dentistry can represent novel solutions to support human decision-making and to improve early diagnosis of pathologies [1,3].
To use IA-based algorithms, it is usually recommended to have a large amount of data that allows the algorithm to be trained and calibrated to fulfill successfully certain dentistry tasks. The dataset (or database) for dentistry applications corresponds to magnetic resonance imaging (MRI), three-dimensional (3D) digital models, red-green-blue (RGB) dental images, or radiographs (x-rays) obtained from diagnoses and medical histories of patients. The combination of an IA-based algorithm with an extensive database has also been demonstrated to be useful during the analysis of CAD/CAM (computer-aided design/computer-aided manufacturing) systems [4,5]. There are multiple initiatives and research found in the literature in which the use of AI in dentistry allowed algorithms to detect a variety of pathologies. The most prevalent are periodontal disease, caries, and tissue lesions. These IA-based algorithms collect and present all this information in results to be later used by specialists as optimization and support tools for dental treatment, personalizing diagnosis, dental prostheses, planning and development of treatments for each patient, and even assistance in oral area surgeries [4,5]. Although this technology has allowed dentists during diagnosis and assistance to solve dental problems, there are still several research challenges in dentistry that keep this research field on a long and open path. For example, the reliability of the algorithm as well as the confidence of the result given by the IA-based algorithm might have high percentages of errors. Therefore, both the treatments and the diagnoses of dentists could damage the oral health and safety of patients because dental specialists need to work in an invasive manner with human patients. Another challenge that is extremely relevant in the implementation of IA-based algorithms is the collection and labeling of data. The database must be sufficiently broad, varied, robust, and correctly classified in labels by dental professionals to develop a concise and reliable IA-based model [4,5]. Finally, errors in training, configuration, or calibration can be responsible for the creation of IA-based models with overfitting (the model only works well with known data) or underfitting problems (the model did not learn well from the data). These problems affect the ability of the IA-based model to interpret new data and achieve generalization capabilities [6,7].
1.1. State of the Art
Within the literature, there are various works and research where IA models were developed aimed at detection and classification in dentistry. We performed a search in the Scopus database with the keywords "dentistry", "machine learning", and "deep convolutional neural networks" to download a total of 72 documents related to those topics. We used those documents to create the illustration presented in Figure 1 to represent the most commonly used terms and words obtained during the search result.
As can be seen in Figure 1, several topics are considered for research that involves the implementation of IA algorithms in dentistry. The topics that are used most repeatedly are databases, convolutional neuronal networks, machine learning, artificial neural networks, algorithms, feature extractors, image analysis, image segmentation, object detection, dental caries, periodontitis, orthodontics, and diagnosis, among others. It can be seen that several research fields related to AI and dentistry are strongly related to artificial vision systems, highlighting Machine Learning (ML), Deep Learning (DL), and computer vision (CV). We briefly summarize each of those research areas as follows:
- Machine learning (ML) is a subfield of artificial intelligence (AI) that is dedicated to developing algorithms capable of "learning" statistical patterns in data, with the ultimate goal of predicting previously unobserved data [8].
- Computer vision (CV) allows machines to process and interpret data visually. It allows you to address the problems of artificial vision systems since it provides the ability to understand and interpret data. The relevant topics related to this concept are object detection, image classification, and segmentation [9].
In addition, we developed an analysis of the state of the art corresponding to the number of documents and their publication history from each year starting from 2017 to 2024, as can be observed in Figure 2. It is to be noticed that the development of IA in dentistry began with 2 publications in 2017, and that value rose to 20 articles in 2023. In the first half of 2024, we can observe that there are already more documents published than in the first years of research of this analysis.
Likewise, we carried out an analysis of documents published by each country concerning IA for dentistry, which is presented in Figure 3. As can be seen in the figure, the countries that have the greatest interest in this research topic are India, Saudi Arabia, the United States, China, and Germany. This shows evidence of how the IA for the dentistry research field is increasing, especially in developed countries. In the following Section 1.2, we present a summary of the related work that has been developed to date regarding IA and dentistry.
1.2. Related Work
In this subsection, we describe in detail the main research works that have been found in the literature related to IA and dentistry. In [10], a Faster R-CNN detection model based on residual networks is used to perform tooth recognition. For this, the ResNet-50 and ResNet-101 neural networks were used to subsequently use a candidate optimization technique based on the positional relationship and the confidence score, achieving results of up to 97.4% for ResNet-50 and values of 98.1% for ResNet-101. When applying the optimization, the results of ResNet-101 range from 97.8% to 98.2%, while in the validation procedure, an accuracy of 97% was achieved. The authors in [11] addressed dental analysis and care as a research topic. For this work, detection and classification algorithms were developed using 83 panoramic X-ray images made up of dental restorations in panoramic radiography. A total of 83 panoramic X-ray images were used to train a model, obtaining results with an accuracy of up to 93.6%. In [12], the authors developed an AI method in conjunction with a computer vision algorithm that combines DL and CNN to carry out dental caries diagnosis and application applications. For this, the GoogleNet and Inception V3 networks were trained and a data set of 3000 x-ray images was used to evaluate the detector. This method achieved up to 89% accuracy. Similarly, in [13], an algorithm was developed based on a CNN and using a database made up of 3932 RGB images of oral photographs. A computer vision algorithm was developed to detect caries in teeth with sensitivity results of up to 81.90%. In addition, the authors of the study [14], propose a method that combines image processing and CNNs to achieve the identification of dental caries based on X-rays and classify them according to the severity of the injury. To this end, they used a database made up of 112 radiographs together with data augmentation. The architecture was based on both Inception and ResNet neural networks for the training process, obtaining up to 73.3% accuracy percentages for the test set. Another work used the VGG-16 architecture to develop an automated classification algorithm [15]. The authors used a total of 1352 X-ray images to train the model, and the results related to the identification and enumeration of teeth had an accuracy of up to 99.45%. In [16], a CNN-based algorithm was proposed to obtain the detachment probability of CAD/CAM composite resin cores. The developed algorithm was trained with a set of 8640 3D images, obtaining results up to 97% accuracy. Another work used a CNN algorithm with XGBoost architecture to train a model from 4,135 images of electronic dental records. This approach allowed decisions to be made for tooth extraction with precision percentages of up to 87%. Cyst analysis is another of the dental applications that have used AI [17,18]. In these works, the proposed algorithms were developed by using CNNs such as You Only Look Once (YOLO) architecture. The authors used 1602 panoramic X-ray images to detect keratocysts and odontogenic tumors achieving accuracy results of 66.3%. Other deep algorithms developed for the detection and diagnosis of cystic lesions used deep CNN models. The authors trained a model with 1140 X-ray images and 986 computed tomography (CTs), obtaining accuracy results up to 84.7% for X-rays and 91.4% for computerized tomography respectively [18]. In their work [19], the authors used a CNN for age estimation using a panoramic X-ray database, with 4035 images of living patients and 89 users, achieving results with accuracy of up to 73%. In another work, the authors proposed an algorithm to identify facial reference points for orthodontics based on the YOLO architecture, with accuracy results of 97.7% [20]. However, the authors only trained the algorithms with 22 RGB images, which is probably not enough for a feasible evaluation of this application. In [21], a DL approach was used to develop an algorithm to detect oral cancer using CNN. For this, a database based on 6176 RGB images is used for training algorithms achieving results of 91% sensitivity, 93.5% efficiency, and 92.3% accuracy. In [22], different deep learning architectures are references for the segmentation of dental structures in X-rays. A total of 72 models were built by combining six neural network architectures (U-Net, U-Net++, Feature Pyramid Networks, LinkNet, Pyramidal Scene Analysis Network, and Mask Attention Network) with 12 encoders. Three different families (ResNet, VGG, DenseNet) of different depths were used for this work. The design of each model was initiated using three strategies (ImageNet, CheXpert, and random initialization), resulting in 216 trained models. These models were trained for 200 seasons with the Adam optimizer (learning rate = 0.0001) and a batch size of 32, using a dataset of 1625 manually annotated radiologists. A 5-fold cross-validation was applied, and performance was mainly quantified by the F1 score. Initialization with ImageNet or CheXpert significantly exceeds random initialization (P<0.05). The authors demonstrated that VGG-based models were more robust in different configurations, while more complex models for the ResNet family achieved higher accuracy results. Finally, in a document selected for the state-of-the-art analysis, a Deep CNN algorithm is proposed and validated to perform the detection and segmentation of the lower third molars and the lower alveolar nerve for dental panoramic X-rays. For this purpose, 81 panoramic X-ray images were used the lower third molars were manually segmented, and the U-net-based DL technique was used to train the convolutive neural network, resulting in an average of 94.7% with an error of 0.3% and 84,7% with an error of 0,9% [23].
The presented works found in the literature demonstrate that several researchers developed different ML, DL, and vision algorithms for dentistry applications and achieved sundry results. The most representative examples are within the research area of diagnosis that comes from detection and classification using DL and vision. Although these investigations exist, the detection of third molar angles remains an open research issue. This is partly due to the difficulty of finding a model that can be adapted to a specific distribution of data sets, which depends on several factors, including the extraction stage of the model characteristics, the configuration of the hyper-parameter, and the specific dental application.
1.3. Main Contributions
Considering the state of the art and related work analysis carried out in previous subsections, we briefly present the main contributions of our work as follows.
- We propose the use of a dataset made up of a total of 647 dental panoramic X-rays that were labeled by expert dentists using Winter’s classification criterion. This criterion considers the position of the third molar from the longitudinal axis of the second molar. Based on Winter’s criterion, we were able to characterize the vertical, distoangular, horizontal, and mesioangular angles of the third molars.
- We train, validate, and test DL-based object detection algorithms based on the You Only Look Once V2 (or YOLO V2), Faster Region-Convolutional Neural Network (Faster R-CNN), and Single Shot Multi-box detector (SSD). We compare the performance of each object detection model by using ResNet-18, ResNet-50, and ResNet-101 for the feature extraction stage of each detector.
- We present our results by using precision-recall curves in the proposed dataset. In addition, we evaluated bias, variance, overfitting, and underfitting for each model trained based on YOLO V2, Faster R-CNN, and SSD for the proposed dataset along with detection results and comparison tables of detection percentages.
1.4. Outline
In Section 2, we present and explain in detail each stage of the proposed methodology for third molar angle detection based on the Faster R-CNN, YOLO V2, and SSD algorithms implementing the architectures of ResNet-18, ResNet-50, and ResNet-101 as feature extraction stages. In Section 3, we present the results of validation and testing using precision-recall curves and other performance metrics. We also made a comparative table of screening results, we assessed bias, variance, overfitting, and underfitting at this stage. Finally, we present the main findings and discussion in Section 3.5, as well as the most important conclusions of our work in Section 4.
2. Materials and Methods
In this work, we propose several architectures based on DL object detection algorithms to detect the angle of third molars from dental X-rays using Winter’s criterion. The proposed methodology is represented in Figure 4. As can be seen, the first stage is the data set acquisition, in which we explain the X-ray dataset distribution and the data augmentation procedure. In the second stage, we propose the use of Faster R-CNN, YOLO V2, and SSD object detection models. Each object detection model was tested with different CNN-based feature extraction techniques, which are ResNet-18, ResNet-50, and ResNet-101. Finally, in the results stage, we present the training, validation, and testing results and a comparative analysis of the object detection models. The following sections will provide a detailed explanation of each stage of the suggested technique.
2.1. Data Acquisition
In this work, we constructed and manually labeled the data set used for the detection of third molar angles for panoramic dental x-rays based on Winter’s classification criterion [24,25]. Such criterion was used for dentist specialists to label four different categories for the third molar angles, which are: distoangular, horizontal, mesioangular, and vertical [25]. The data set was then divided into training, validation, and test sets. The proposed database consists of a total of 322 panoramic X-ray images of the third molar at different angles. The images that make up this data set are standardized to a resolution of pixels. To increase the number of images, three random data augmentation techniques were implemented within the original data set, such as saturation transformations, changes in brightness, image rotation, and a scalpel in resolution. This last technique consists of changing the resolution of the image to a new format of pixels. The rotation involves randomly rotating the image in a range of 0.5 to 10 degrees in the clockwise direction for all original images. Finally, a threshold filter is applied that changes the saturation and brightness of the images. We illustrate the procedure of data augmentation in Figure 5, as well as The detailed distribution of the data set in Table 1.
The proposed training set is used to train the Faster R-CNN, YOLO V2, and SSD algorithms for third molar angle detection. The validation set is used to calibrate the hyperparameters of the detection models to find the most optimal model that fits the distribution of our data set. Finally, the efficiency of the detectors was evaluated to determine the best validation found for each model using a new set of panoramic dental X-rays, this allowed us to evaluate the generalization capacity of the proposed models and to check whether the algorithms have any overfitting or underfitting problems.
2.2. Third Molar’s Angle Detection Using CNN-Based Object Detection
In this work, we propose the use of fast and high-performance CNN-based object detection algorithms which are Faster R-CNN, YOLO V2, and SSD. Those algorithms are explained in Section 2.2.1. For each algorithm, we tested different feature extraction CNN methods, which are Resnet-18, Resnet-50, and Resnet-101. The feature extraction methods are explained in Section 2.2.2. This is in total 9 different object detection architectures to train, calibrate, validate, and test.
2.2.1. Object Detection Methods
In this work, we train, calibrate, validate, and test three different object detection techniques based on CNNs, which are Faster R-CNN, YOLOV2, and SSD. We briefly explain each of the object detection methods, as well as each of the feature extraction techniques as follows.
Faster-RCNN
Faster R-CNN (Region-based Convolutional Neural Networks) is a CNN-based object detection method that integrates three different stages: a feature extraction stage, region proposal networks (RPNs), and a classification stage. The feature extraction stage is in charge of extracting the most important feature maps from the X-ray images. Typically, ResNet or VGG are used for the Faster-RCNN object detection network. However, we used ResNet-18, ResNet-50, and ResNet-101 in this work since it obtained high-performance results for our X-ray dataset distribution. Then, the RPNs, which are based on CNNs, propose regions in which the probability of finding objects of interest is high. The RPNs can simultaneously find and propose multiple region proposals of different geometric sizes and configurations due to the use of anchor boxes. Finally, at the classification stage, the Faster-RCNN uses a feed-forward fully connected layers followed by a softmax layer to classify the object category and other feed-forward fully connected to refine the bounding box proposed coordinates (further details in [26,27]).
YOLO V2
YOLO V2 is an object detection method that performs object detection as a single regression problem, directly predicting bounding boxes and class probabilities in a single evaluation. This means that the YOLO V2 does not require an RPN network for work such as in the case of Faster R-CNN. A YOLO v2 algorithm comprises two stages: a feature extraction network and a detection network. Typically, YOLO V2 uses a feature extraction stage based on GoogLeNet as an engine for high accuracy and speed. However, in this work, we used ResNet-18, ResNet-50, and ResNet-101 for the YOLO V2 feature extraction stage since those networks obtained high-performance results for our X-ray dataset distribution. The details extracted within the feature extraction stage include both low-level details (borders) and high-level semantics information (shapes and textures) [28,29,30]. YOLO V2 applies a feature extraction method on a grid-based approach that divides the input image into cells, which will be used for detecting objects within its region. However, since different objects can have several geometric configurations, YOLO V2 uses a set of anchor boxes of different sizes, shapes, and scales on each cell to accurately localize all kinds of objects [28,29]. Each anchor box prediction is based on a confidence score that indicates an object’s presence and its category prediction’s accuracy. YOLO V2 uses non-maximum suppression to improve the results and eliminate the repetition of several encompassing boxes for the same object of interest, which improves the accuracy of the detection [28]. Likewise, objects that have lower trust scores are eliminated than a default threshold (for example, 70% confidence), which improves the final result. The output of YOLO v2 includes encompassing boxes that are labeled with their respective categories of objects and scores that indicate the probability that the object detected corresponds to its category.
SSD
The last object detection method we used in our work is the Single Shot MultiBox Detector (SSD). This object detection technique is usually known for its low inference time, which is reached by eliminating the need for a region proposal stage used in Faster R-CNN. The SSD uses a single-shot approach where both the object localization and classification tasks are performed simultaneously. Typically, the SSD algorithm uses a feature extraction stage composed of CNNs such as VGG16. Nevertheless, we employed ResNet-18, ResNet-50, and ResNet-101 in our study due to their exceptional performance on our X-ray dataset distribution. The next stage in the SDD algorithm combines additional convolutional layers to enable the detection of objects at multiple scales by producing predictions from feature maps of varying resolutions. SDD also uses a set of anchor boxes with varying aspect ratios and scales at each feature map cell, allowing the network to detect objects of various sizes and geometrical configurations. For each anchor box, SSD predicts both a category score and the offsets for the bounding box to better localize the objects of interest. By applying convolutional operations across the anchor boxes on different feature layers, SSD can simultaneously handle object localization and classification problems [31,32].
2.2.2. Feature Extraction Methods
In this work, we propose the use of three CNN-based models as feature extractors that are able to work fast and have high performance on our X-ray dataset distribution. The selected feature extraction networks are ResNet-18, ResNet-50, and ResNet-101. Compared to the rest of the CNNs, the main architecture of ResNet layers is based on residual layers that allow the creation of connections that add the input directly to the output [33]. This structure facilitates the flow of gradients through the network during the backpropagation process to facilitate network training and helped us obtain outstanding results for third molar angle detection. We explain in detail the feature extraction methods used in this work as follows.
ResNet-18
ResNet-18 is a CNN with 11.7 million parameters that address the vanishing gradient problem by using residual layers [33,34]. The convolutional layers, batch normalization, and Relu activation functions compose the entire 18-layer architecture of ResNet-18. This network has an input resolution of , therefore any image different from that resolution should be resized. The rest of the layers that compose ResNet-18 correspond to Relu layers, batch normalization layers, residual layers, fully connected layers, and the softmax for classification. In our case, the categories of interest for classification correspond to the third molar angle (vertical, distoangular, horizontal, and mesioangular). The structure of the ResNet-18 network begins with convolutional layer with 64 filters (stride of 2), followed by batch normalization, a ReLU activation function, and a max-pooling layer (stride of 2) [35,36]. The max-pooling layer helps to reduce the size of the spatial dimensions of the input panoramic X-ray images, which allows ResNet-18 to extract patterns from panoramic X-ray images. The final characteristics are sent through a fully connected layer and a softmax layer to get the classification results. Further details for ResNet-18 can be found in [35,36,37]. Although ResNet-18 has a structure capable of achieving high-performance accuracy for classification problems, it needs to be combined with the Faster R-CNN, YOLO, and SSD detection models to solve the proposed object detection problem.
ResNet-50
ResNet-50 is a CNN that extends the depth and capacity of ResNet-18 by using bottleneck residual blocks [38]. ResNet-50 has 25.6 million parameters for training, with an input size of . ResNet-50 starts with convolutional layer with 64 filters (with a stride of 2). Then, batch normalization followed by ReLU and a max-pooling are used. ResNet-50 is primarily composed of four stages, each containing bottleneck residual blocks resulting in a cumulative of 50 layers. Each bottleneck block includes a layer that reduces the dimensionality (bottleneck), a layer that performs the convolution, and another layer that restores the dimensionality. These blocks also use batch normalization and ReLU activations after each convolution. ResNet-50 uses shortcut connections that skip one or more layers, allowing gradients to flow directly through the network, thus mitigating the vanishing gradient problem and enabling the training of very deep networks. After the residual stages, a global average pooling layer reduces the spatial dimensions to , followed by a fully connected layer with 4 neurons and a softmax activation for third molar angle classification in X-ray images [38,39]. Further details of ResNet-50 can be found in [38,39,40]. Although ResNet-50 has a structure capable of achieving high-performance accuracies for classification problems, it must be combined with the Faster R-CNN, YOLO, and SSD detection models to solve object detection problems.
ResNet-101
Resnet-101 is a CNN that uses residual learning such as its ResNet-18 and ResNet-50 predecessors, which allows the training of deep networks while addressing the problem of gradient vanishing. Resnet-101 has 101 layers, which means a greater depth than Resnet-18 (18 layers) and Resnet-50 (50 layers). This allows Resnet-101 to extract more rich features from X-ray images to detect third molar angles using Winter’s criterion. However, this strongly depends on the dataset size and distribution. Resnet-101, as well as Resnet-50, uses bottleneck blocks that consist of convolutional layers of , , and . These bottleneck blocks are more efficient in the parameters compared to the basic residual blocks used in Resnet-18, which consist of two convolutions. However, Resnet-101 has a greater number of blocks of this nature, which further expands its capacity. The structure of this neural network is made of 44.6 million parameters available for training [40]. Unlike previous feature extractors, Resnet-101 architecture has 101 deep layers which maintain the structure of the combination and connection of 105 convolutional layers, 105 batch normalization layers, and 100 Relu activation layers. Resnet-101 has an input layer of but its structure continues with the same number of layers that make up the residual layers similar to the structure of ResNet-50 (further details in [41]). The final features obtained by Resnet-101 are sent through a fully connected layer with 4 neurons and a softmax layer to get the ranking results [42]. Further details of ResNet-50 can be found in [40,41,42]. Although ResNet-101 has a structure capable of achieving very high-performance accuracies for classification problems, it must be combined with the Faster R-CNN, YOLO, and SSD detection models to solve object detection problems.
3. Results
This section shows the results of the YOLO V2, Faster R-CNN, and SSD object detection models to localize and characterize the vertical, distoangular, horizontal, and mesioangular angles of the third molars in panoramic X-rays based on Winter’s criterion. Each object detection model was trained and evaluated using three different feature extraction CNNs, which are ResNet-18, ResNet-50, and ResNet-101. We performed training, validation, and testing procedures for each model. We also analyze bias, variance, overfitting and underfitting. The training, validation, and testing procedures are explained in detail below.
First, we performed a validation procedure by testing several hyper-parameter configurations to train each of the proposed algorithms for the third molar angle detection on panoramic X-rays. We set different values of epochs, learning rate, and different optimizer methods as can be observed in Table 2. We used values of 20 and 40 epochs as the limit of training epochs along with learning rate values of 0.001, 0.005, and 0.0001. We used three optimizers: Adam, SGDM, and RMSProp. Adam adapts learning rates using both momentum and squared gradients, SGDM uses momentum to accelerate convergence, and RMSProp adjusts learning rates based on the mean square of the gradients.
Once the different proposed models were trained using the hyper-parameter configuration of Table 2, we evaluate bias, variance, overfitting, and underfitting considering the following guidelines. If the error in training data is high, then the model has a high bias. If the error in the validation/testing data is much greater than the error in the training data, the model has high variance. If the error in the training and validation data is low and the error in the testing data is significantly higher, the model has overfitting. Finally, if the error in the training, validation, and testing data is high, the model is considered underfitting, which means that the model complexity is not enough to fit the dataset distribution. Considering these guidelines, we analyze in detail our results below.
3.1. Results for Third Molar Angle Detection with ResNet-18
In this section, we present the training, validation, and testing results for algorithms using ResNet-18 as a feature extractor of each object detection method as can be observed in Table 3.
We also present the training, validation, and testing best results by using precision-recall curves as can be observed in Figure 7.
The object detection results for Faster R-CNN, YOLO v2, and SSD with ResNet-18 obtained when evaluating the dental panoramic X-rays with the trained algorithms can be observed in Figure 8.
We summarize the main findings of the object detection results for ResNet-18 as feature extraction as follows.
- It can be observed in Table 3 that a few Faster R-CNN, YOLO v2, and SSD models based on ResNet-18 as feature extractor reaches a very low accuracy result. For Faster R-CNN, the test with the lowest results is Test 3 (training: 1.8%, validation: 1.2%, and testing: 1.1%). YOLO V2 also presents low accuracy results in Test 6 (training: 7%, validation: 12%, and testing: 5%). Finally, SSD also presents low results in Test 15 (training: 2.9%, validation: 2%, and testing: 2%). This suggests that such models have an underfitting problem, which means that the models can’t fit the proposed dental panoramic X-rays dataset distribution. Moreover, a high error in the training set indicates that the models do not fit well with the dental panoramic X-rays dataset distribution, which means a high bias.
- For Test 16, the Faster R-CNN achieves an accuracy of 18% on the training set, whilst the YOLO V2 and SSD reach 99% and 89% respectively. This might be because the Faster R-CNN is characterized by using an RPN (Region Proposal Network) stage, which for our application, can’t fit the X-Rays dataset distribution (underfitting). On the other hand, YOLO V2 and SSD use a single-stage detection approach without using an RPN stage, which fits better for the proposed X-ray dataset. The results for YOLO V2 and SSD are also high for validation, with 85% and 80% respectively, and testing, with 95% and 79% respectively. The high training accuracy of YOLO V2 (99%) and SSD (89%) suggests that these models have a low bias compared to Faster R-CNN. However, the slight drop in validation accuracy (YOLO V2: 85%, and SSD: 80%) and tests for both models (YOLO V2: 95%, and SSD: 79%) indicates a light variance, since the performance of the models decreases slightly in validation and testing experiments.
- We obtained the best results for Faster R-CNN using ResNet-18 were reached in test 2 (training: 25%, validation: 24%, and testing: 39%). For YOLO V2 using ResNet-18, the best result is test 10 (training: 99%, validation: 90%, and testing: 96%). Finally, for the SSD model using ResNet-18, the best result was in test 12 (training: 87%, validation: 82%, and testing: 81%). This indicates that the best model for this experiment set is YOLO V2 using ResNet-18 with the hyper-parameter configuration of test 10. This model has a low bias and variance, demonstrating high generalizing capabilities (no overfitting) since the accuracy is barely reduced from training to validation and testing. We can observe the training, validation, and testing results for models obtained in tests 2, 10, and 12 in Figure 7, in which we present the precision-recall curves for such models.
3.2. Results for Third Molar Angle Detection with ResNet-50
In this section, we present the training, validation, and testing results for algorithms using ResNet-50 as a feature extractor as can be observed in Table 4.
We also present the training, validation, and testing best results by using precision-recall curves as can be observed in Figure 9.
The object detection results for Faster R-CNN, YOLO v2, and SSD with ResNet-50 as feature extraction obtained when evaluating the dental panoramic X-rays with the trained algorithms can be observed in Figure 10.
We summarize the main findings of the object detection results for ResNet-50 as feature extraction as follows.
- It can be observed in Table 4 that a few Faster R-CNN, YOLO v2, and SSD models based on ResNet-50 as feature extractor reaches a very low accuracy result. For Faster R-CNN, the test with the lowest results is Test 6 (training: 1.2%, validation: 1.2%, and testing: 1.1%). YOLO V2 also presents low accuracy results in Test 6 (training: 1.8%, validation: 1.5%, and testing: 1.5%). Finally, SSD also presents low results in Test 6 (training: 1.5%, validation: 1.3%, and testing: 1.4%). This suggests that such models have an underfitting problem, which means that the models can’t fit the proposed dental panoramic X-rays dataset distribution. Moreover, a high error in the training set indicates that the models do not fit well with the dental panoramic X-rays dataset distribution, which means a high bias.
- For all the tests, the Faster R-CNN achieves very low accuracy results. The worst results for Faster R-CNN are for test 6 (training: 1.2%, validation: 1.2%, and testing: 1.1%), whilst the best result is for test 11 (training: 35%, validation: 33%, and testing: 34%), which is still a very low accuracy result. This means Faster R-CNN working with ResNet-50 as feature extraction tends to suffer from underfitting for our X-Ray dataset distribution. Again, this might be because the Faster R-CNN is characterized by using an RPN (Region Proposal Network) stage.
- We obtained the best results for YOLO V2 using ResNet-50 in test 18 (training: 99%, validation: 89%, and testing: 95%). For the SSD model using ResNet-50, the best result was in test 9 (training: 88%, validation: 91%, and testing: 88%). This indicates that the best model for this set of experiments is YOLO V2 using ResNet-50 with the hyper-parameter configuration of test 18. This model has a low bias and variance, demonstrating high generalizing capabilities (no overfitting) since the accuracy is barely reduced from training to validation and testing. We can observe the training, validation, and testing results for models obtained in tests 11, 18, and 9 in Figure 9 in which we present the precision-recall curves for both models.
3.3. Results for Third Molar Angle Detection with ResNet-101
In this section, we present the training, validation, and testing results for algorithms using ResNet-101 as a feature extractor as can be observed in Table 5.
We also present the training, validation, and testing best results by using precision-recall curves as can be observed in Figure 11.
The object detection results for Faster R-CNN, YOLO v2, and SSD with ResNet-101 obtained when evaluating the dental panoramic X-rays with the trained algorithms can be observed in Figure 12.
We summarize the main findings of the object detection results for ResNet-101 as feature extraction as follows.
- It can be observed in Table 5 that a few Faster R-CNN, YOLO v2, and SSD models based on ResNet-101 as feature extractor reaches a very low accuracy result. For Faster R-CNN, the test with the lowest results is Test 6 (training: 1.6%, validation: 1.3%, and testing: 1.1%). YOLO V2 also presents low accuracy results in Test 6 (training: 7%, validation: 12%, and testing: 5%). Finally, SSD also presents low results in Test 6 (training: 3.3%, validation: 7.7%, and testing: 2%). This suggests that such models have an underfitting problem, which means that the models can’t fit the proposed dental panoramic X-rays dataset distribution. Moreover, a high error in the training set indicates that the models do not fit well with the dental panoramic X-rays dataset distribution, which means a high bias.
- For all the tests, the Faster R-CNN achieves very low accuracy results. The worst results for Faster R-CNN are for test 6 (training: 1.6%, validation: 1.3%, and testing: 1.1%), whilst the best result is for test 5 (training: 28%, validation: 22%, and testing: 35%), which is still a very low accuracy result. This means Faster R-CNN working with ResNet-101 as feature extraction tends to suffer from underfitting for our X-Ray dataset distribution. Once again, this might be because the Faster R-CNN is characterized by using an RPN (Region Proposal Network) stage.
- We obtained the best results for YOLO V2 using ResNet-101 in test 11 (training: 99%, validation: 92%, and testing: 99%). For the SSD model using ResNet-101, the best result was in test 12 (training: 88%, validation: 90%, and testing: 89%). This indicates that the best model for this set of experiments is YOLO V2 using ResNet-101 with the hyper-parameter configuration of test 11. This model has a low bias and variance, demonstrating high generalizing capabilities (no overfitting) since the accuracy is barely reduced from training to validation and testing. We can observe the training, validation, and testing results for models obtained in tests 5, 11, and 12 in Figure 11 in which we present the precision-recall curves for both models.
3.4. Comparison of Inference Times
In this subsection, we briefly summarize in Table 6 the inference times for each object detection algorithm (Faster R-CNN, YOLO V2, and SSD) with each of the feature extraction methods (ResNet-18, ResNet-50, and ResNet-101). It is to be noticed that Faster R-CNN has higher inference times compared to YOLO V2 and SSD. On the other hand, YOLO and SSD have similar inference times. This is because the Faster R-CNN uses an RPN (Region Proposal Network) stage, which requires more time to make an inference. On the other hand, YOLO V2 and SSD use a single-stage detection approach without using an RPN stage, which makes them a faster solution compared to Faster R-CNN [26,43].
3.5. Discussion
In this section, we present a summary of the most important findings and future work insights related to the development of this work.
- During the implementation of third-molar detection algorithms using different detection models and ResNet architectures, it can be observed that YOLO V2 is the model that stands out in terms of both accuracy and consistency during the training, validation, and testing stages. In the ResNet architectures used (18, 50, and 101), the YOLO V2 detection model achieves an accuracy close to 99% during training and maintains high levels of accuracy, around 90%, both in the validation stage and in the testing stages. These high accuracy results indicate that YOLO V2 is very effective for these types of jobs. On the other hand, the Faster R-CNN models with ResNet CNNs (ResNet-18, ResNet-50, and ResNet-101) possess underfitting problems. This means Faster R-CNN working with ResNet as feature extraction tends to suffer from underfitting for our X-Ray dataset distribution. This might be because the Faster R-CNN is characterized by using an RPN (Region Proposal Network) stage. On the other hand, the SSD detection model has moderate accuracy across all ResNet architectures. Although SSD does not achieve the accuracy levels of YOLO V2, it produces reasonably consistent results, making it suitable for applications that require a balance of accuracy and detection speed (inference times less than 100 ms).
- Although each of the ResNet architectures used has several parameters, it is to be noticed that there is no direct correlation between the number of parameters in the ResNet architectures and the detection accuracy obtained. Although ResNet-50 and ResNet-101 have many more parameters than ResNet-18, the results do not necessarily rise. The best results in terms of accuracy scores were consistently obtained with YOLO V2, regardless of the ResNet architecture used. For example, the best results for YOLO V2 using ResNet-18 (training: 99%, validation: 90%, and testing: 96%), YOLO V2 using ResNet-101 (training: 99%, validation: 92%, and testing: 99%), and YOLO V2 using ResNet-101 (training: 99%, validation: 92%, and testing: 99%) are very similar. In conclusion, there is no direct correlation between the number of parameters and the precision obtained. Although ResNet-50 and ResNet-101 have more parameters and offer superior modeling capability, YOLO V2 with ResNet-18, which has the fewest parameters, still achieves very high accuracy. This might be due to our dataset structure and size. This behavior might change if the dataset increases to the order of thousands or even millions of images since it is well known that while deeper the network it learns better from big datasets. In future works, we will try to increase our dataset distribution for this problem.
4. Conclusions
In this work, we proposed an artificial intelligence algorithm based on the Faster R-CNN, YOLO V2, and SSD as object detection models. For each object detector, we tested different CNN architectures (ResNet-18, ResNet-50, and ResNet-101) as a feature extractor to carry out the third molar angle detection. We used Winter’s criterion to characterize distoangular, vertical, mesioangular, and horizontal third molar angles in panoramic X-ray images. A data augmentation process was carried out to expand the data to build a dataset of greater robustness and increase data variability. We perform training, validation, and testing results for different hyper-parameter configurations. We also analyzed bias, variance, overfitting, and underfitting based on the training, validation, and testing results for each model. The best results from our experiments were obtained by YOLO V2 using ResNet-18 (training:99%, validation:90%, and testing:96%), YOLO V2 using ResNet-101 (training:99%, validation:92%, and testing:99%), and YOLO V2 using ResNet-101 (training:99%, validation:92%, and testing:99%), which indeed are very similar. On the other hand, the Faster R-CNN models with ResNet CNNs (ResNet-18, ResNet-50, and ResNet-101) possess underfitting problems. This means Faster R-CNN working with ResNet as feature extraction tends to suffer from underfitting for our X-Ray dataset distribution. We found that this behavior might be because the Faster R-CNN is characterized by using an RPN (Region Proposal Network) stage. In contrast, YOLO V2 and SSD use a single-stage detection approach without using an RPN stage, which fits better for the proposed X-ray dataset. We have shown that it is possible to characterize distoangular, vertical, mesioangular, and horizontal angles of third molars based on Winter’s criterion using panoramic X-ray images and different DL-based object detection models such as Faster R-CNN, YOLO V2, and SSD with ResNet architectures as feature extraction. In future works, we will extend our dataset distribution, and we also will train more sophisticated DL models such as semantic segmentation approaches.
Author Contributions
Conceptualization, J.P.V., P.V., D.P., and G.G.; Data curation, J.P.V., P.V., D.P., and G.G.; Formal analysis, J.P.V., P.V., D.P., I.N.V., A.F., and G.G; Funding acquisition, J.P.V.; Investigation, J.P.V., P.V., D.P., I.N.V.; Methodology, J.P.V., P.V., D.P., and I.N.V.; Software, J.P.V., P.V.; Project administration, J.P.V.; Resources, J.P.V.; Supervision, J.P.V. and D.P.; Visualization, J.P.V., and P.V.; Writing—original draft, J.P.V., P.V., D.P., and I.N.V.; Writing—review and editing, J.P.V., P.V., D.P., I.N.V., A.F., G.G. All authors have read and agreed to the published version of the manuscript.
Funding
This work has been supported by ANID (National Research and Development Agency of Chile) under Fondecyt Iniciación 2024 Grant 11240105.
Data Availability Statement
The raw data supporting the conclusions of this article will be made available by the authors on request.
Acknowledgments
This work has been supported by ANID (National Research and Development Agency of Chile) under Fondecyt Iniciación 2024 Grant 11240105.
Conflicts of Interest
The authors declare no conflicts of interest.
References
- Aravena, H.; Arredondo, M.; Fuentes, C.; Taramasco, C.; Alcocer, D.; Gatica, G. Predictive Treatment of Third Molars Using Panoramic Radiographs and Machine Learning. 2023 19th International Conference on Wireless and Mobile Computing, Networking and Communications (WiMob). IEEE, 2023, pp. 123–128.
- Thanh, M.T.G.; Van Toan, N.; Ngoc, V.T.N.; Tra, N.T.; Giap, C.N.; Nguyen, D.M. Deep learning application in dental caries detection using intraoral photos taken by smartphones. Applied Sciences 2022, 12, 5504. [Google Scholar] [CrossRef]
- Osimani, C. Análisis y procesamiento de imágenes para la detección del contorno labial en pacientes de odontología. 2do Congreso Nacional de Ingenierıa Informática y Sistemas de Información (CoNaIISI 2014), San Luis, Argentina, 2014.
- Fang, X.; Zhang, S.; Wei, Z.; Wang, K.; Yang, G.; Li, C.; Han, M.; Du, M. Automatic detection of the third molar and mandibular canal on panoramic radiographs based on deep learning. Journal of Stomatology, Oral and Maxillofacial Surgery, 2024; 101946. [Google Scholar] [CrossRef]
- Vinayahalingam, S.; Kempers, S.; Limon, L.; Deibel, D.; Maal, T.; Hanisch, M.; Bergé, S.; Xi, T. Classification of caries in third molars on panoramic radiographs using deep learning. Scientific reports 2021, 11, 12609. [Google Scholar] [CrossRef]
- Cejudo, J.E.; Chaurasia, A.; Feldberg, B.; Krois, J.; Schwendicke, F. Classification of dental radiographs using deep learning. Journal of Clinical Medicine 2021, 10, 1496. [Google Scholar] [CrossRef]
- Hwang, J.J.; Jung, Y.H.; Cho, B.H.; Heo, M.S. An overview of deep learning in the field of dentistry. Imaging science in dentistry 2019, 49, 1–7. [Google Scholar] [CrossRef] [PubMed]
- Schwendicke, F.a.; Samek, W.; Krois, J. Artificial intelligence in dentistry: chances and challenges. Journal of dental research 2020, 99, 769–774. [Google Scholar] [CrossRef] [PubMed]
- Tsuneki, M. Deep learning models in medical image analysis. Journal of Oral Biosciences 2022, 64, 312–320. [Google Scholar] [CrossRef]
- Mahdi, F.P.; Motoki, K.; Kobashi, S. Optimization technique combined with deep learning method for teeth recognition in dental panoramic radiographs. Scientific reports 2020, 10, 19261. [Google Scholar] [CrossRef]
- Abdalla-Aslan, R.; Yeshua, T.; Kabla, D.; Leichter, I.; Nadler, C. An artificial intelligence system using machine-learning for automatic detection and classification of dental restorations in panoramic radiography. Oral surgery, oral medicine, oral pathology and oral radiology 2020, 130, 593–602. [Google Scholar] [CrossRef]
- Lee, J.H.; Kim, D.H.; Jeong, S.N.; Choi, S.H. Detection and diagnosis of dental caries using a deep learning-based convolutional neural network algorithm. Journal of dentistry 2018, 77, 106–111. [Google Scholar] [CrossRef]
- Zhang, X.; Liang, Y.; Li, W.; Liu, C.; Gu, D.; Sun, W.; Miao, L. Development and evaluation of deep learning for screening dental caries from oral photographs. Oral diseases 2022, 28, 173–181. [Google Scholar] [CrossRef]
- Moran, M.; Faria, M.; Giraldi, G.; Bastos, L.; Oliveira, L.; Conci, A. Classification of approximal caries in bitewing radiographs using convolutional neural networks. Sensors 2021, 21, 5192. [Google Scholar] [CrossRef] [PubMed]
- De Tobel, J.; Radesh, P.; Vandermeulen, D.; Thevissen, P.W. An automated technique to stage lower third molar development on panoramic radiographs for age estimation: a pilot study. The Journal of forensic odonto-stomatology 2017, 35, 42. [Google Scholar] [PubMed]
- Yamaguchi, S.; Lee, C.; Karaer, O.; Ban, S.; Mine, A.; Imazato, S. Predicting the debonding of CAD/CAM composite resin crowns with AI. Journal of Dental Research 2019, 98, 1234–1238. [Google Scholar] [CrossRef] [PubMed]
- Yang, H.; Jo, E.; Kim, H.J.; Cha, I.h.; Jung, Y.S.; Nam, W.; Kim, J.Y.; Kim, J.K.; Kim, Y.H.; Oh, T.G.; others. Deep learning for automated detection of cyst and tumors of the jaw in panoramic radiographs. Journal of clinical medicine 2020, 9, 1839. [Google Scholar] [CrossRef] [PubMed]
- Lee, J.H.; Kim, D.H.; Jeong, S.N. Diagnosis of cystic lesions using panoramic and cone beam computed tomographic images based on deep learning neural network. Oral diseases 2020, 26, 152–158. [Google Scholar] [CrossRef] [PubMed]
- Banjšak, L.; Milošević, D.; Subašić, M. Implementation of artificial intelligence in chronological age estimation from orthopantomographic X-ray images of archaeological skull remains. Bulletin of the International Association for Paleodontology 2020, 14, 122–129. [Google Scholar]
- Rao, G.K.L.; Srinivasa, A.C.; Iskandar, Y.H.P.; Mokhtar, N. Identification and analysis of photometric points on 2D facial images: A machine learning approach in orthodontics. Health and Technology 2019, 9, 715–724. [Google Scholar] [CrossRef]
- Fu, Q.; Chen, Y.; Li, Z.; Jing, Q.; Hu, C.; Liu, H.; Bao, J.; Hong, Y.; Shi, T.; Li, K.; others. A deep learning algorithm for detection of oral cavity squamous cell carcinoma from photographic images: A retrospective study. EClinicalMedicine 2020, 27. [Google Scholar] [CrossRef] [PubMed]
- Schneider, L.; Arsiwala-Scheppach, L.; Krois, J.; Meyer-Lückel, H.; Bressem, K.; Niehues, S.; Schwendicke, F. Benchmarking deep learning models for tooth structure segmentation. Journal of dental research 2022, 101, 1343–1349. [Google Scholar] [CrossRef]
- Vinayahalingam, S.; Xi, T.; Berge, S.; Maal, T.; de Jong, G. Automated detection of third molars and mandibular nerve by deep learning. Sci Rep 9: 9007, 2019.
- Primo, F.T.; Primo, B.T.; Scheffer, M.A.R.; Hernández, P.A.G.; Rivaldo, E.G. Evaluation of 1211 third molars positions according to the classification of Winter, Pell & Gregory. Int j odontostomatol 2017, 11, 61–5. [Google Scholar]
- Escoda, C.G.; Aytes, L.B. Cirugía bucal; Océano, 2011.
- Vasconez, J.P.; Delpiano, J.; Vougioukas, S.; Cheein, F.A. Comparison of convolutional neural networks in fruit detection and counting: A comprehensive evaluation. Computers and Electronics in Agriculture 2020, 173, 105348. [Google Scholar] [CrossRef]
- Maity, M.; Banerjee, S.; Chaudhuri, S.S. Faster r-cnn and yolo based vehicle detection: A survey. 2021 5th international conference on computing methodologies and communication (ICCMC). IEEE, 2021, pp. 1442–1447.
- Terven, J.; Córdova-Esparza, D.M.; Romero-González, J.A. A comprehensive review of yolo architectures in computer vision: From yolov1 to yolov8 and yolo-nas. Machine Learning and Knowledge Extraction 2023, 5, 1680–1716. [Google Scholar] [CrossRef]
- Du, J. Understanding of object detection based on CNN family and YOLO. Journal of Physics: Conference Series. IOP Publishing, 2018, Vol. 1004, p. 012029.
- Jiang, P.; Ergu, D.; Liu, F.; Cai, Y.; Ma, B. A Review of Yolo algorithm developments. Procedia computer science 2022, 199, 1066–1073. [Google Scholar] [CrossRef]
- Liu, W.; Anguelov, D.; Erhan, D.; Szegedy, C.; Reed, S.; Fu, C.Y.; Berg, A.C. Ssd: Single shot multibox detector. Computer Vision–ECCV 2016: 14th European Conference, Amsterdam, The Netherlands, October 11–14, 2016, Proceedings, Part I 14. Springer, 2016, pp. 21–37.
- Kumar, A.; Srivastava, S. Object detection system based on convolution neural networks using single shot multi-box detector. Procedia Computer Science 2020, 171, 2610–2617. [Google Scholar] [CrossRef]
- Xie, S.; Girshick, R.; Dollár, P.; Tu, Z.; He, K. Aggregated residual transformations for deep neural networks. Proceedings of the IEEE conference on computer vision and pattern recognition, 2017, pp. 1492–1500.
- Sukegawa, S.; Yoshii, K.; Hara, T.; Matsuyama, T.; Yamashita, K.; Nakano, K.; Takabatake, K.; Kawai, H.; Nagatsuka, H.; Furuki, Y. Multi-task deep learning model for classification of dental implant brand and treatment stage using dental panoramic radiograph images. Biomolecules 2021, 11, 815. [Google Scholar] [CrossRef] [PubMed]
- Choi, E.; Lee, S.; Jeong, E.; Shin, S.; Park, H.; Youm, S.; Son, Y.; Pang, K. Artificial intelligence in positioning between mandibular third molar and inferior alveolar nerve on panoramic radiography. Scientific Reports 2022, 12, 2456. [Google Scholar] [CrossRef] [PubMed]
- Kim, B.S.; Yeom, H.G.; Lee, J.H.; Shin, W.S.; Yun, J.P.; Jeong, S.H.; Kang, J.H.; Kim, S.W.; Kim, B.C. Deep learning-based prediction of paresthesia after third molar extraction: A preliminary study. Diagnostics 2021, 11, 1572. [Google Scholar] [CrossRef] [PubMed]
- Jing, E.; Zhang, H.; Li, Z.; Liu, Y.; Ji, Z.; Ganchev, I. ECG Heartbeat Classification Based on an Improved ResNet-18 Model. Computational and Mathematical Methods in Medicine 2021, 2021, 6649970. [Google Scholar] [CrossRef] [PubMed]
- Wen, L.; Li, X.; Gao, L. A transfer convolutional neural network for fault diagnosis based on ResNet-50. Neural Computing and Applications 2020, 32, 6111–6124. [Google Scholar] [CrossRef]
- Chen, T.; Kornblith, S.; Norouzi, M.; Hinton, G. A simple framework for contrastive learning of visual representations. International conference on machine learning. PMLR, 2020, pp. 1597–1607.
- Reddy, A.S.B.; Juliet, D.S. Transfer learning with ResNet-50 for malaria cell-image classification. 2019 International conference on communication and signal processing (ICCSP). IEEE, 2019, pp. 0945–0949.
- Zhang, Q. A novel ResNet101 model based on dense dilated convolution for image classification. SN Applied Sciences 2022, 4, 1–13. [Google Scholar] [CrossRef]
- Zoph, B.; Cubuk, E.D.; Ghiasi, G.; Lin, T.Y.; Shlens, J.; Le, Q.V. Learning data augmentation strategies for object detection. Computer Vision–ECCV 2020: 16th European Conference, Glasgow, UK, August 23–28, 2020, Proceedings, Part XXVII 16. Springer, 2020, pp. 566–583.
- Vasconez, J.P.; Salvo, J.; Auat, F. Toward semantic action recognition for avocado harvesting process based on single shot multibox detector. 2018 IEEE International Conference on Automation/XXIII Congress of the Chilean Association of Automatic Control (ICA-ACCA). IEEE, 2018, pp. 1–6.
Figure 1.
Conceptual map for a search result for third molar detection literature.
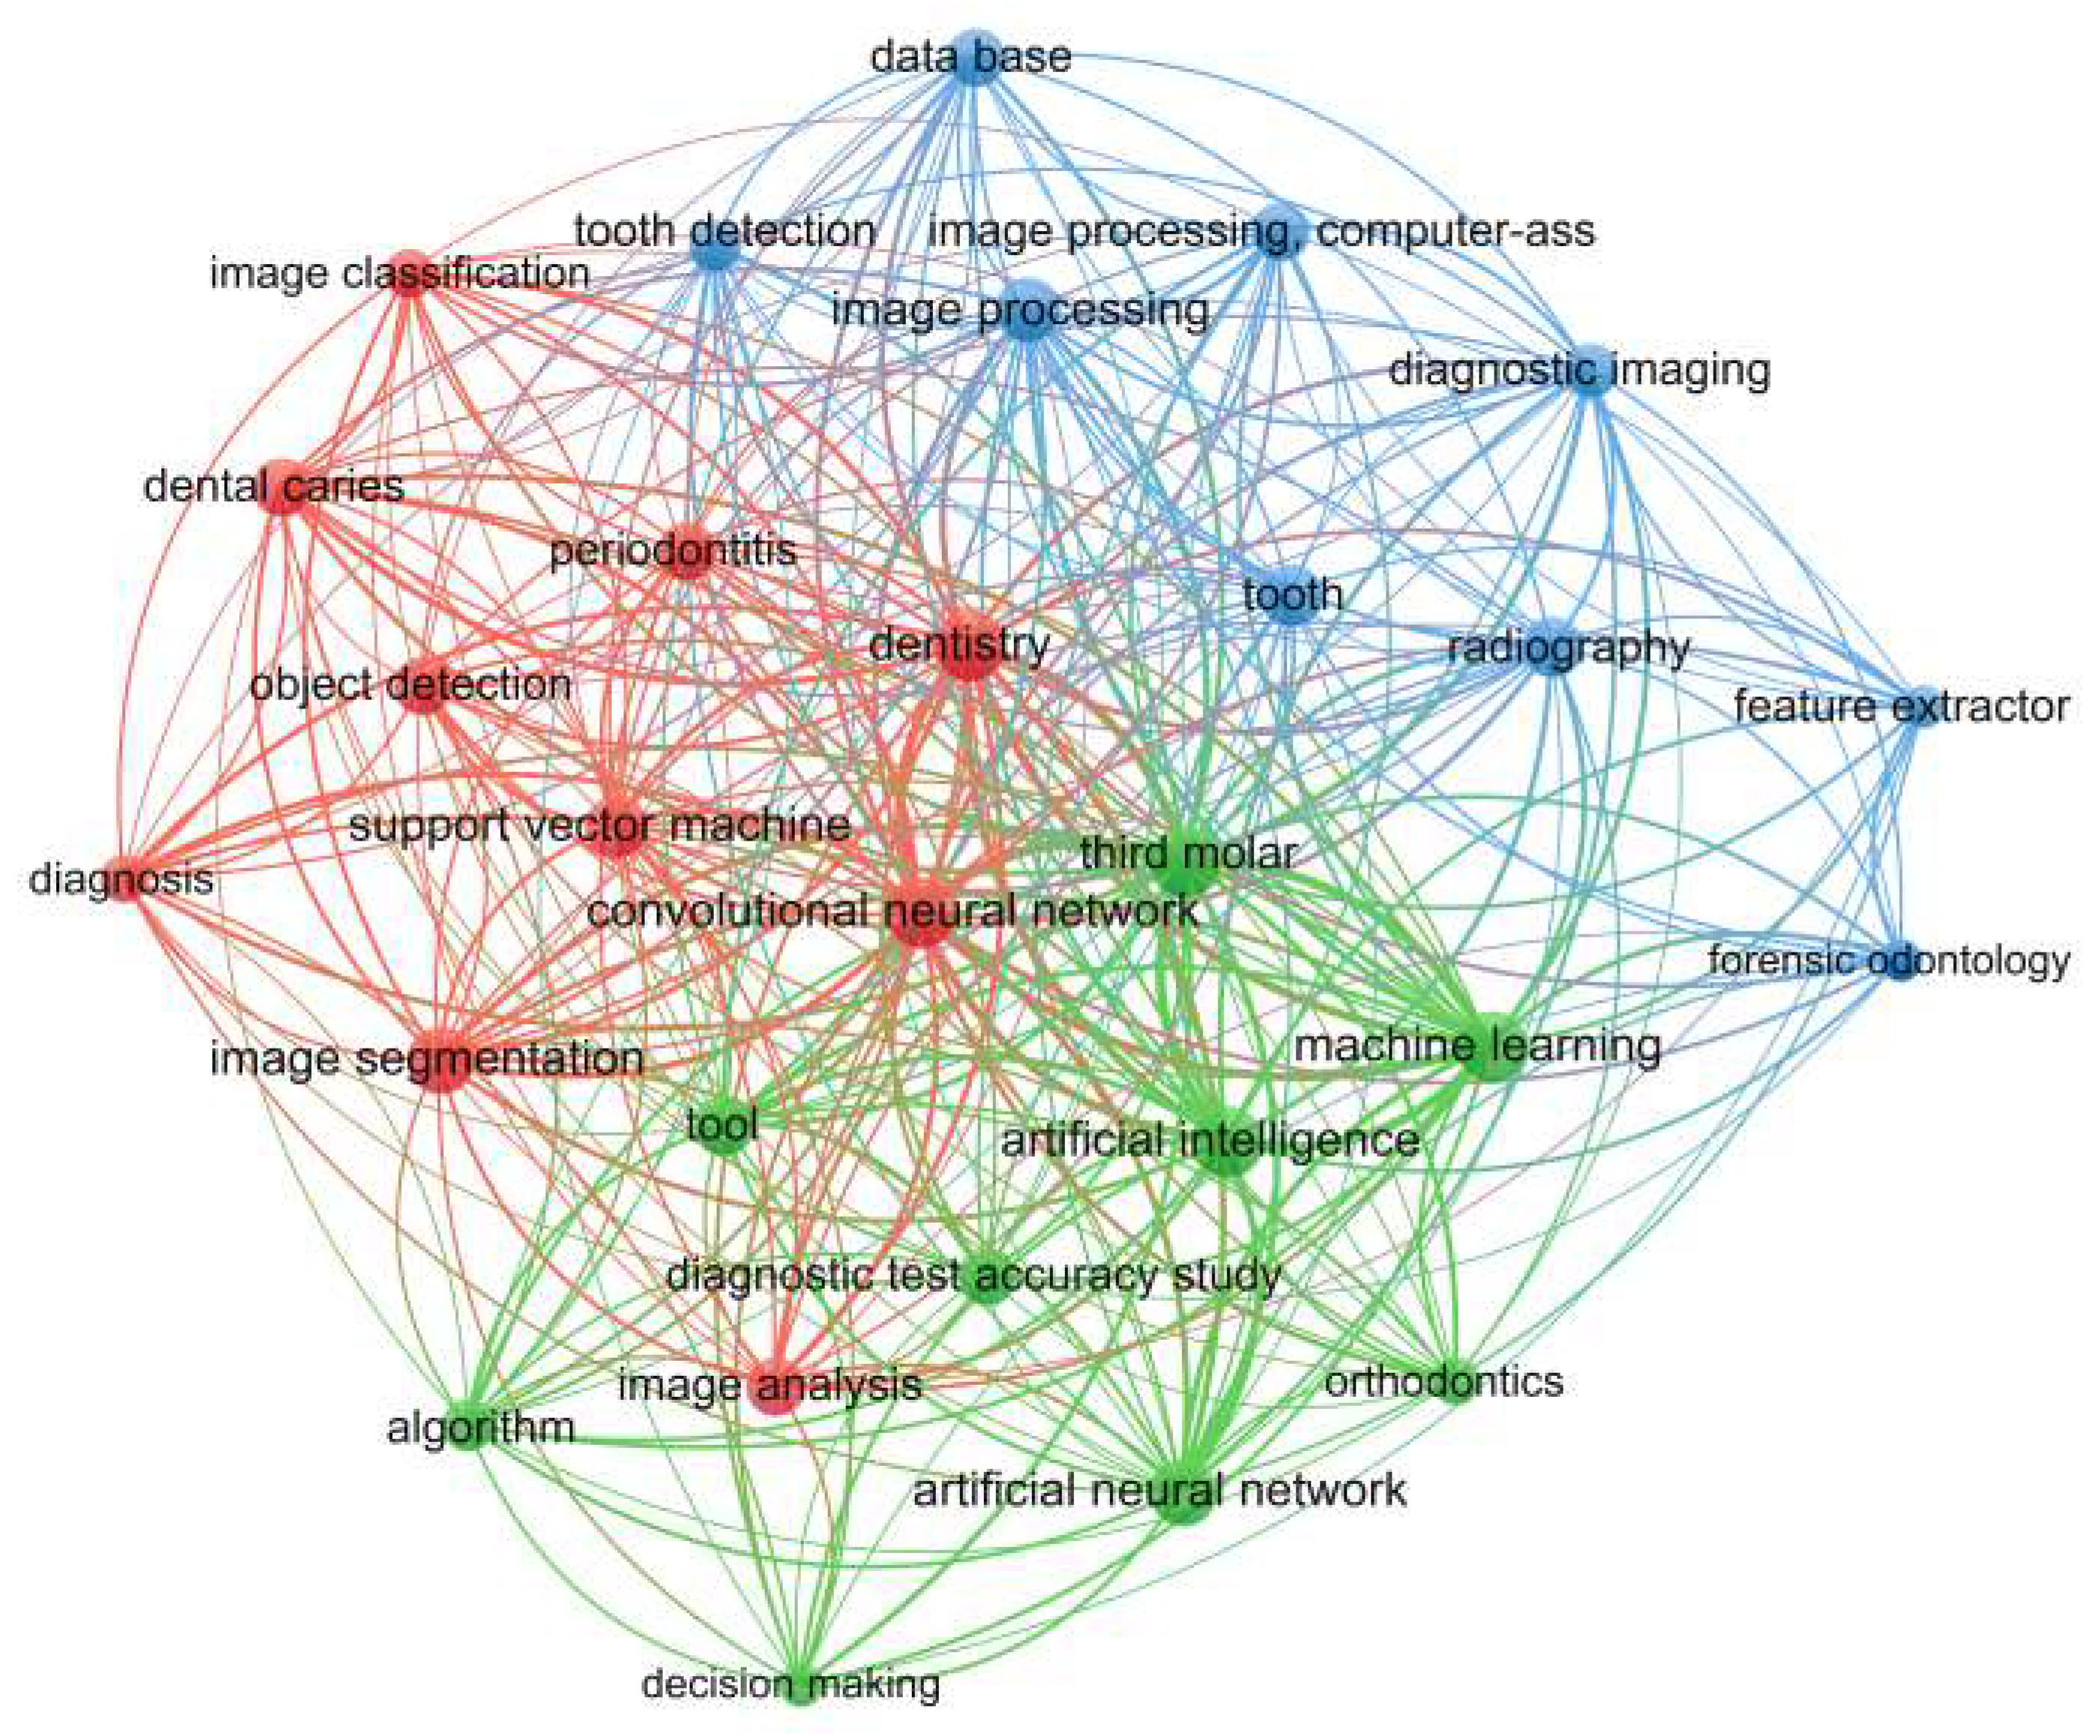
Figure 2.
History of published documents based on the implementation of AI in dentistry from 2017 to 2024.
Figure 2.
History of published documents based on the implementation of AI in dentistry from 2017 to 2024.
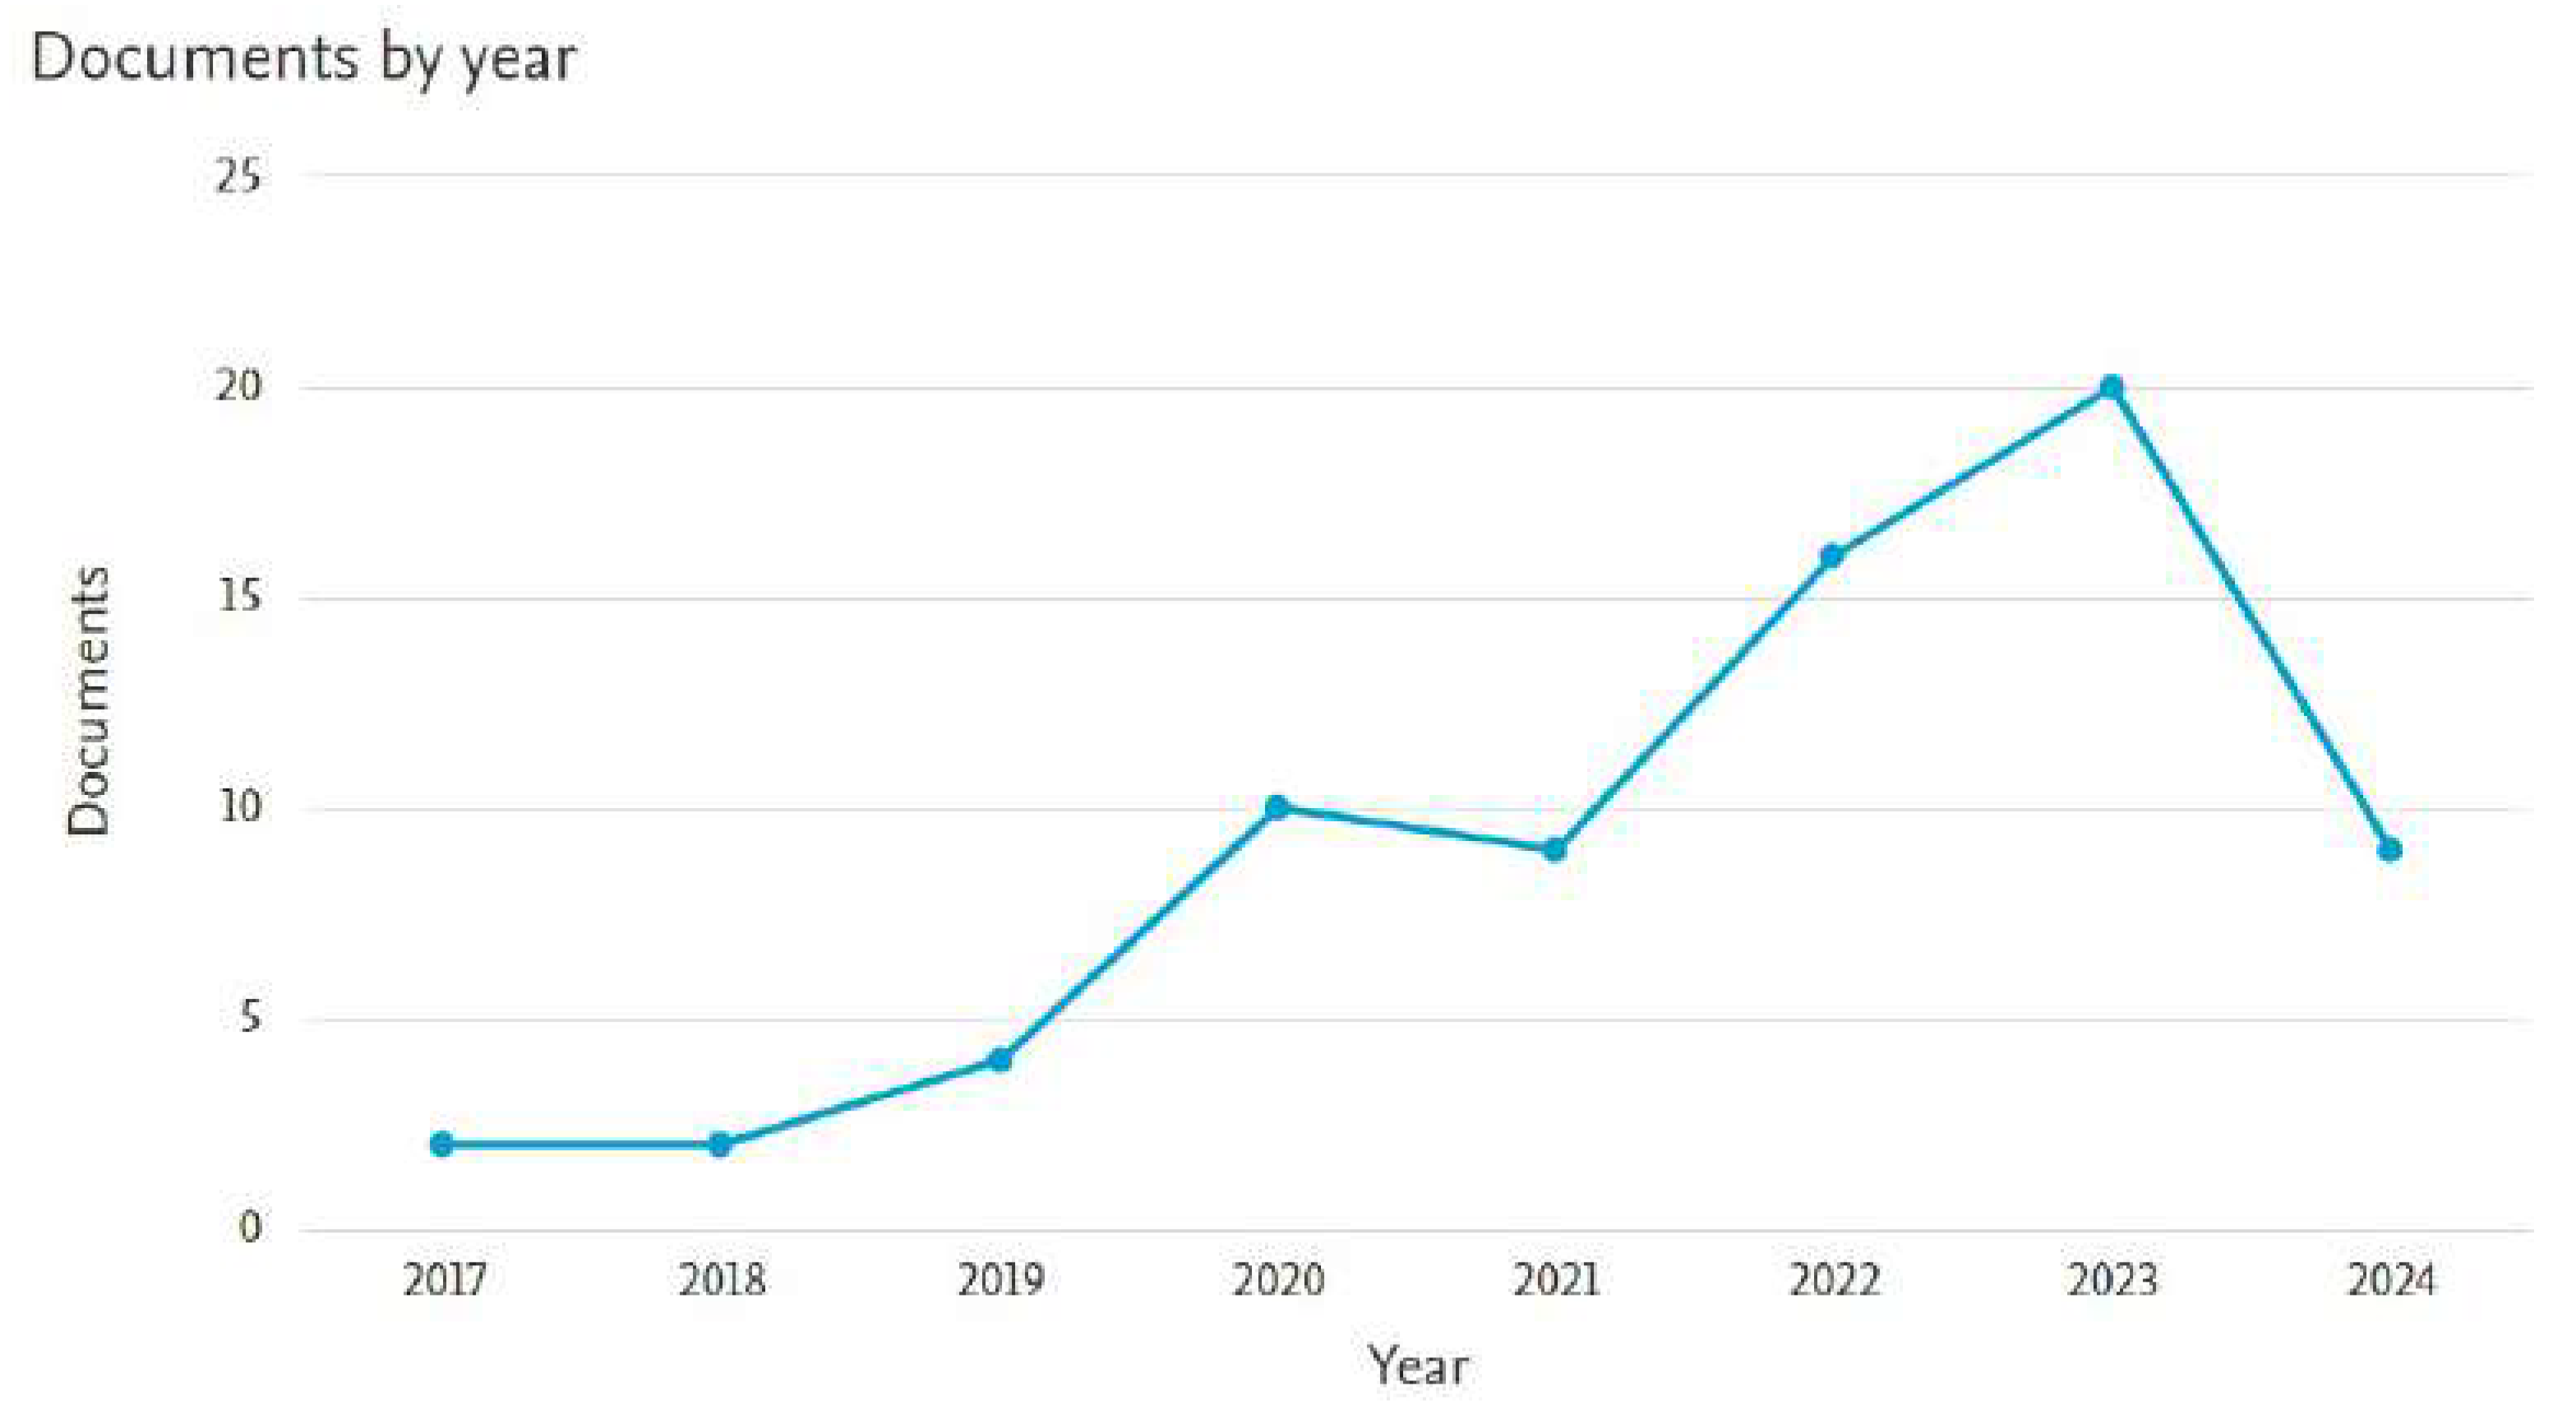
Figure 3.
Relationship between published documents related to IA and dentistry and countries of origin.
Figure 3.
Relationship between published documents related to IA and dentistry and countries of origin.
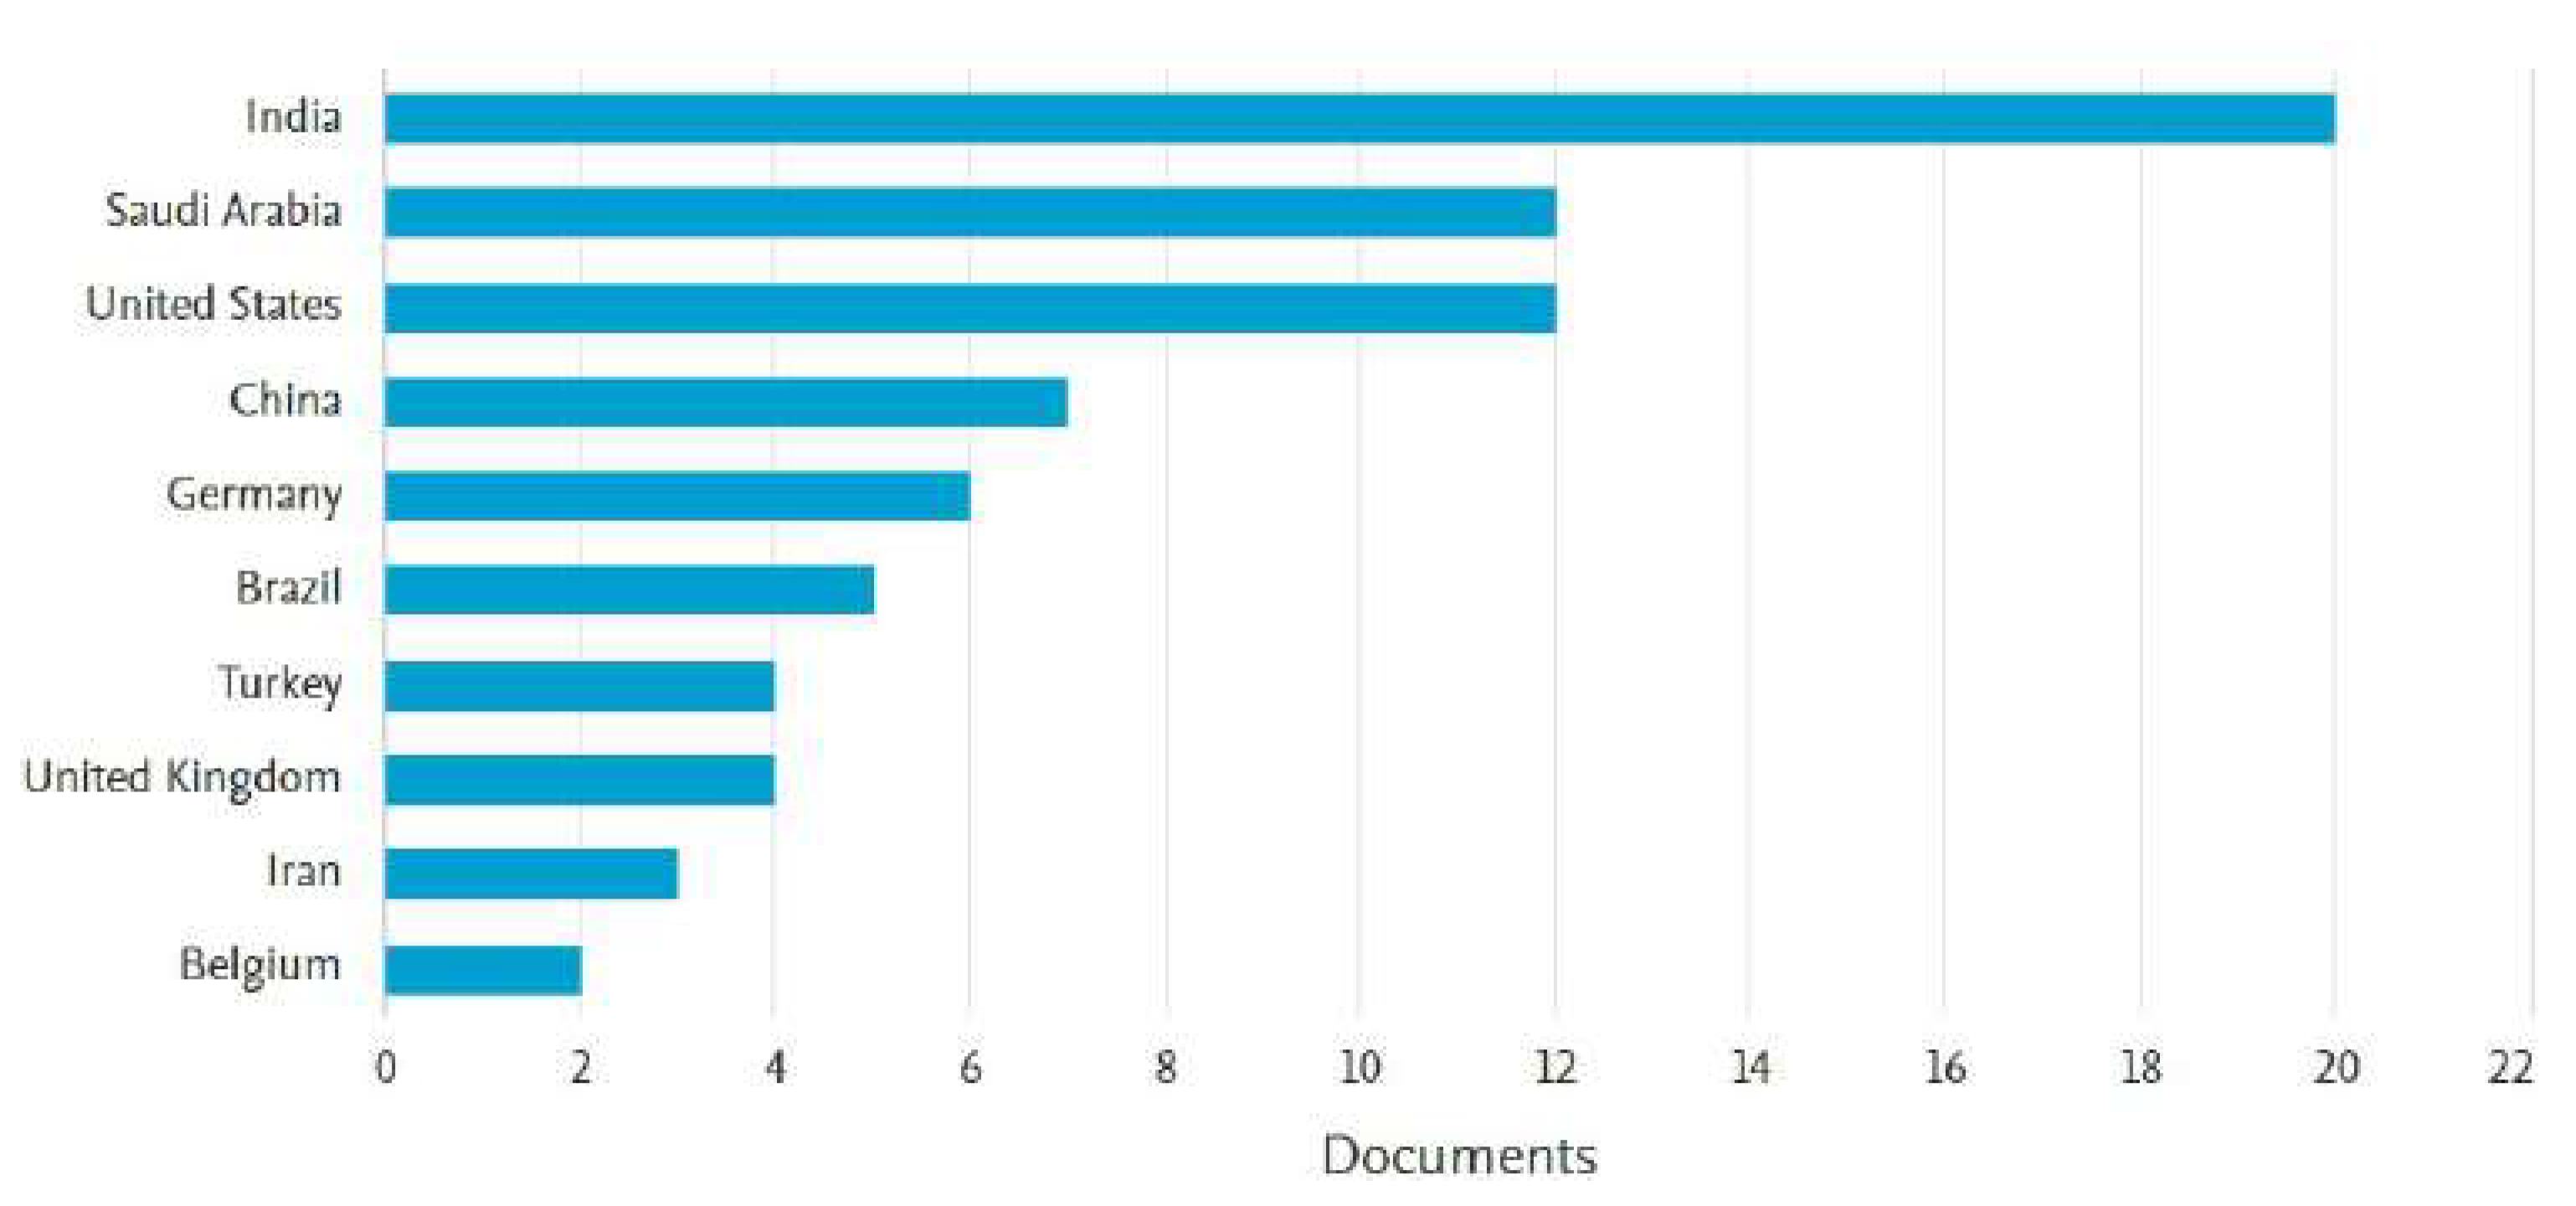
Figure 4.
Proposed methodology for third molar angle detection in X-rays using Winter’s criterion. We used Faster R-CNN, YOLO V2, and SSD combined with ResNet-18, ResNet-50, and ResNet-101 feature extractor CNNs.
Figure 4.
Proposed methodology for third molar angle detection in X-rays using Winter’s criterion. We used Faster R-CNN, YOLO V2, and SSD combined with ResNet-18, ResNet-50, and ResNet-101 feature extractor CNNs.
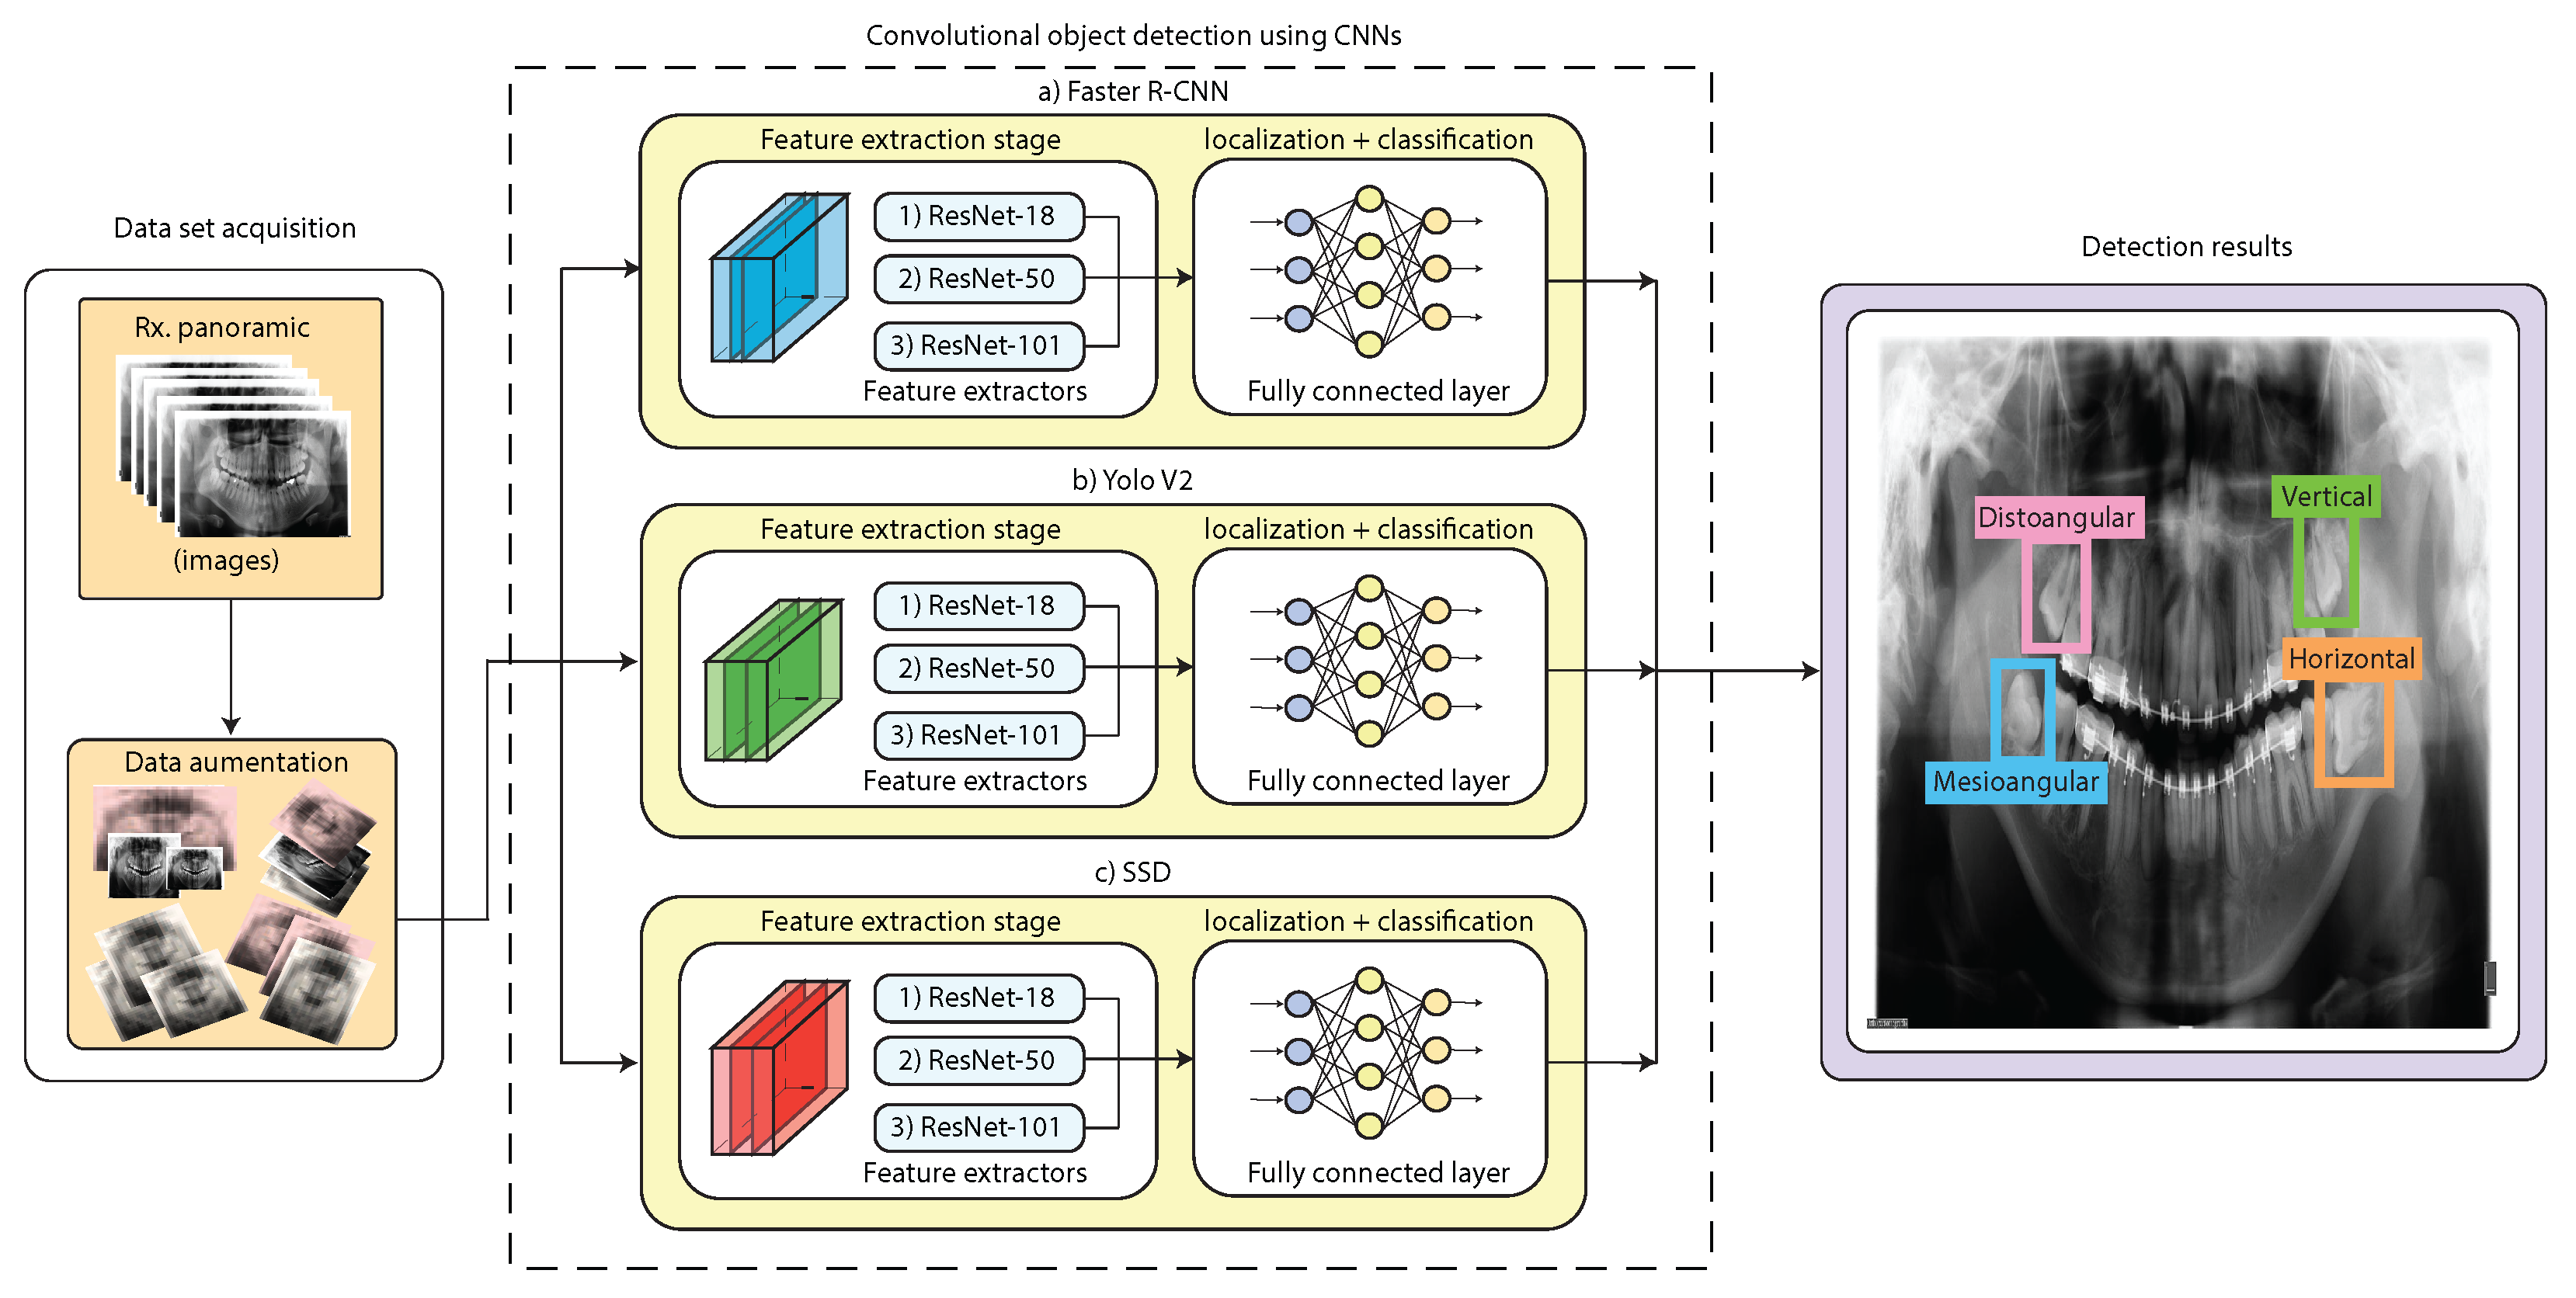
Figure 5.
Distribution of third molar angle to Data Acquisition. (a) Distoangular, (b) Horizontal, (c) Mesioangular, (d) Vertical.
Figure 5.
Distribution of third molar angle to Data Acquisition. (a) Distoangular, (b) Horizontal, (c) Mesioangular, (d) Vertical.
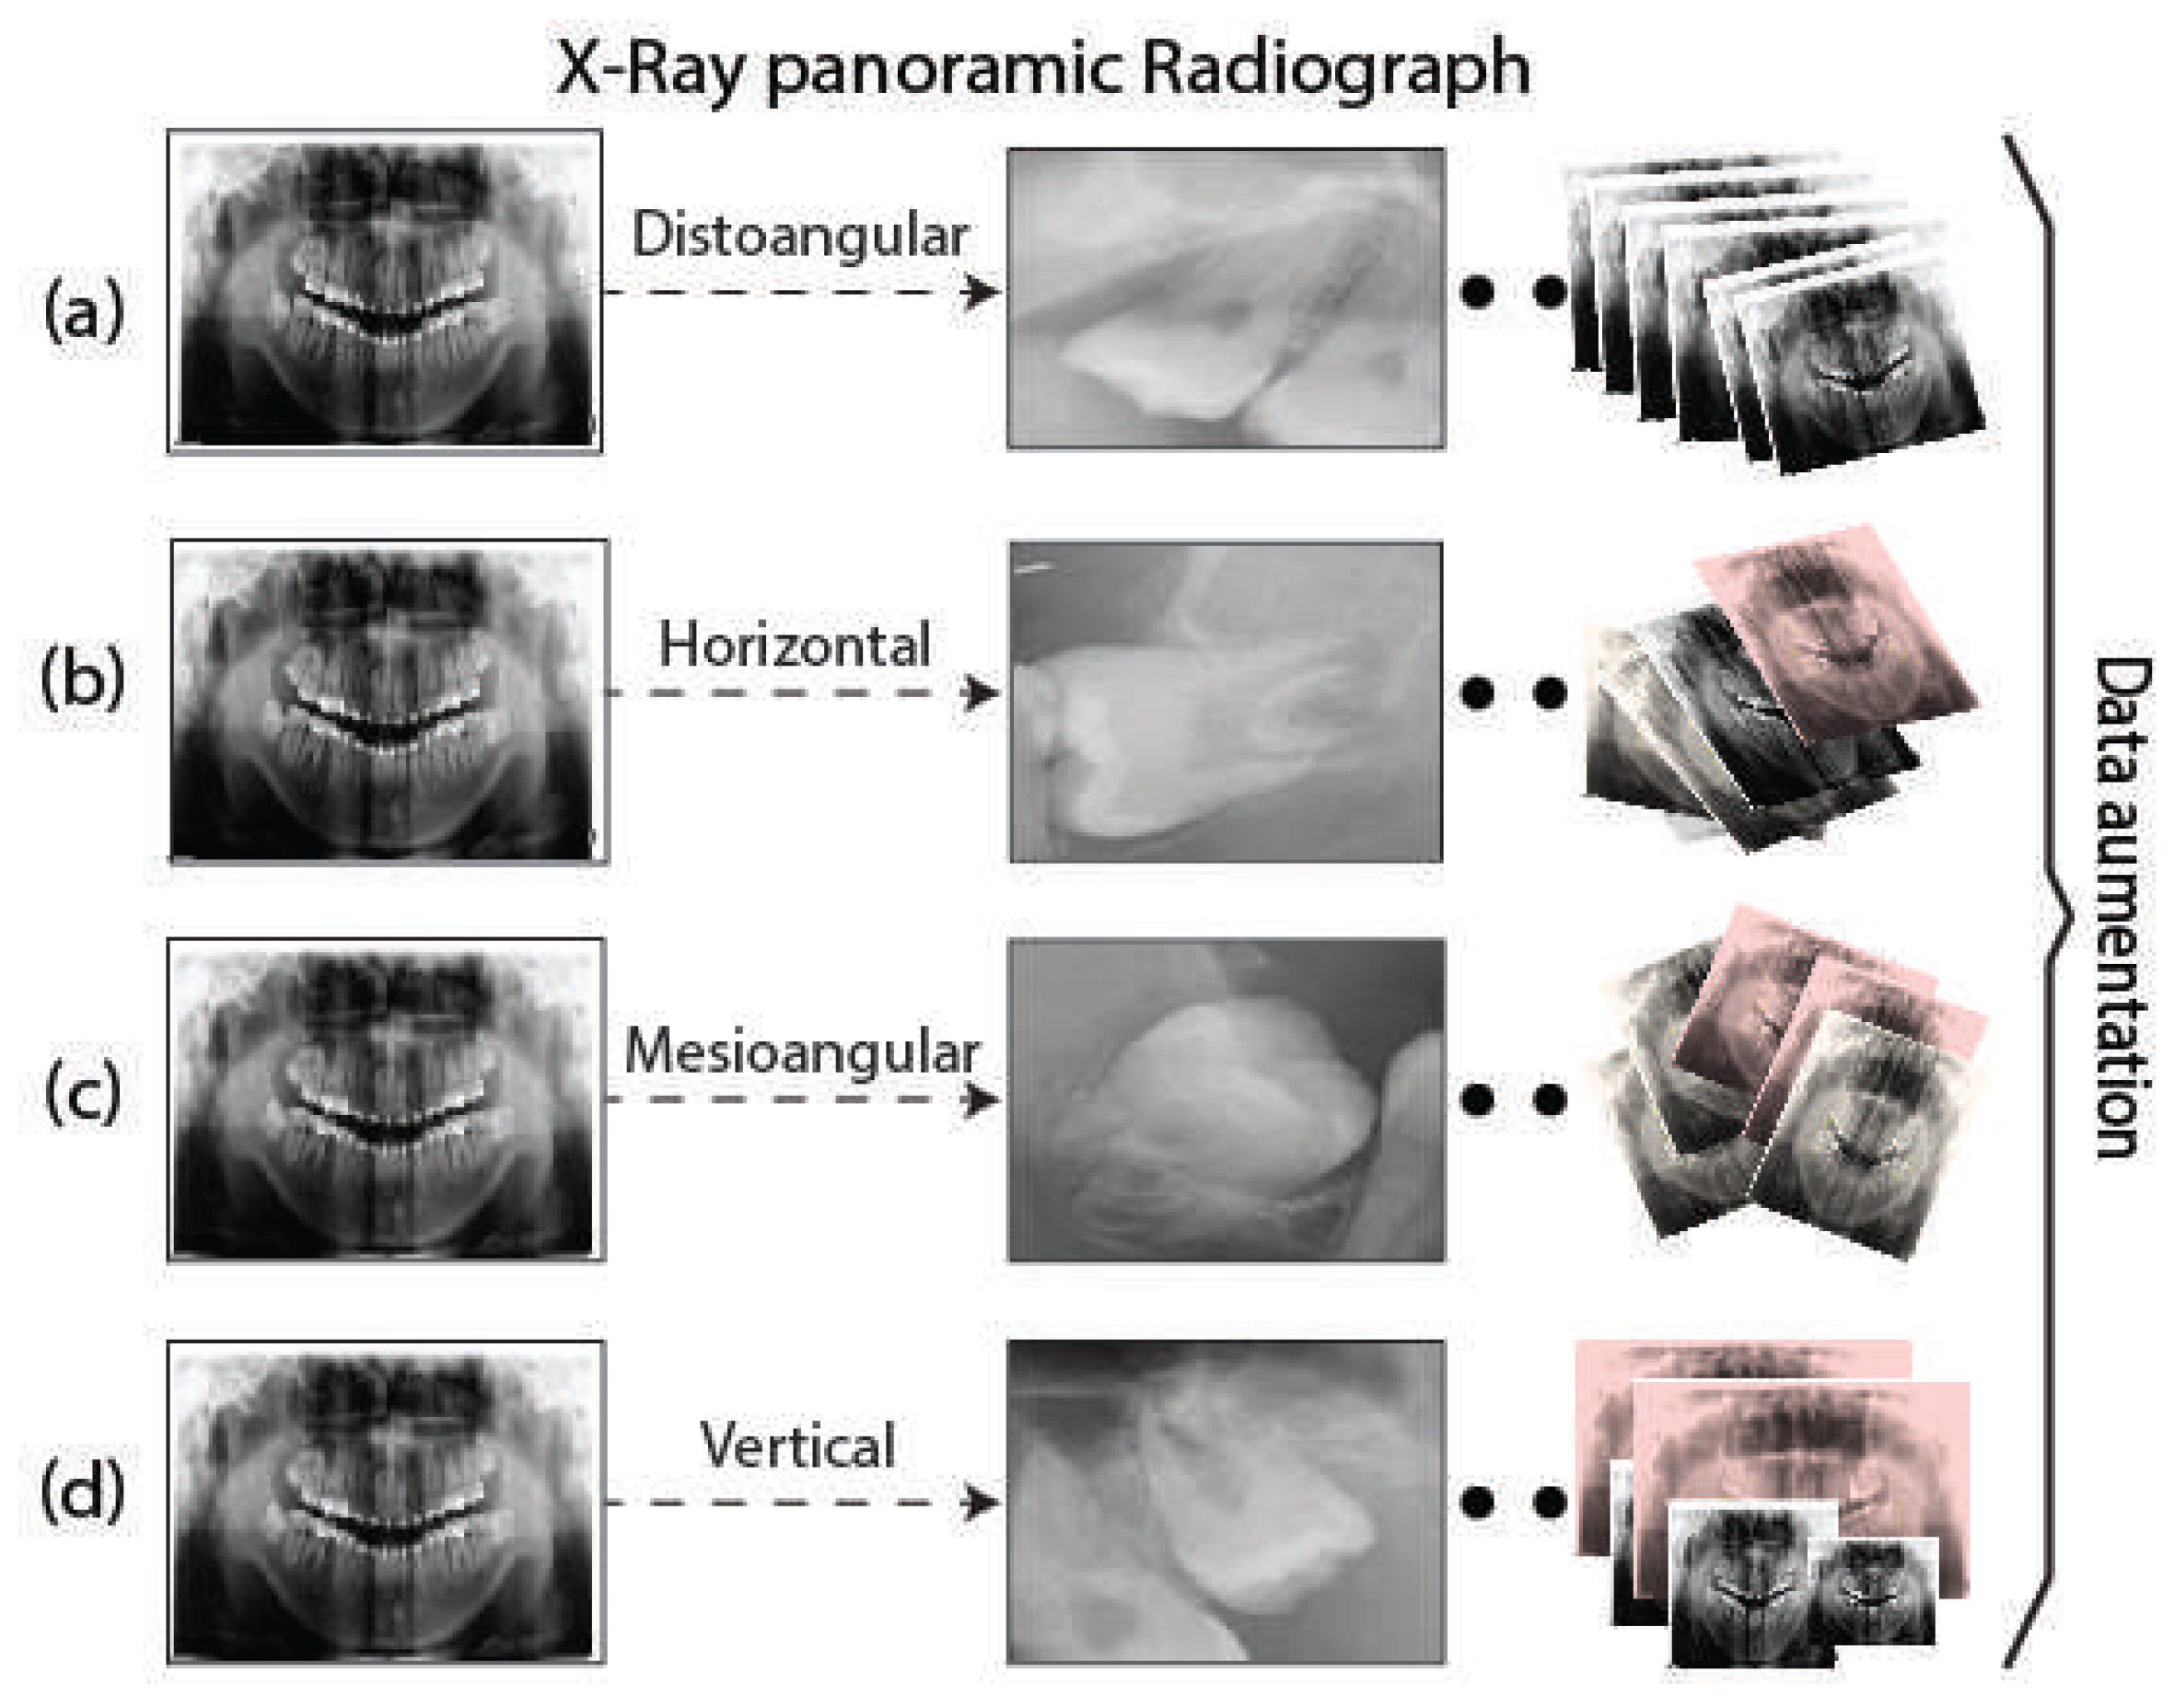
Figure 6.
YOLO V2 Pipeline for third molar detection in X-ray panoramic radiographs.
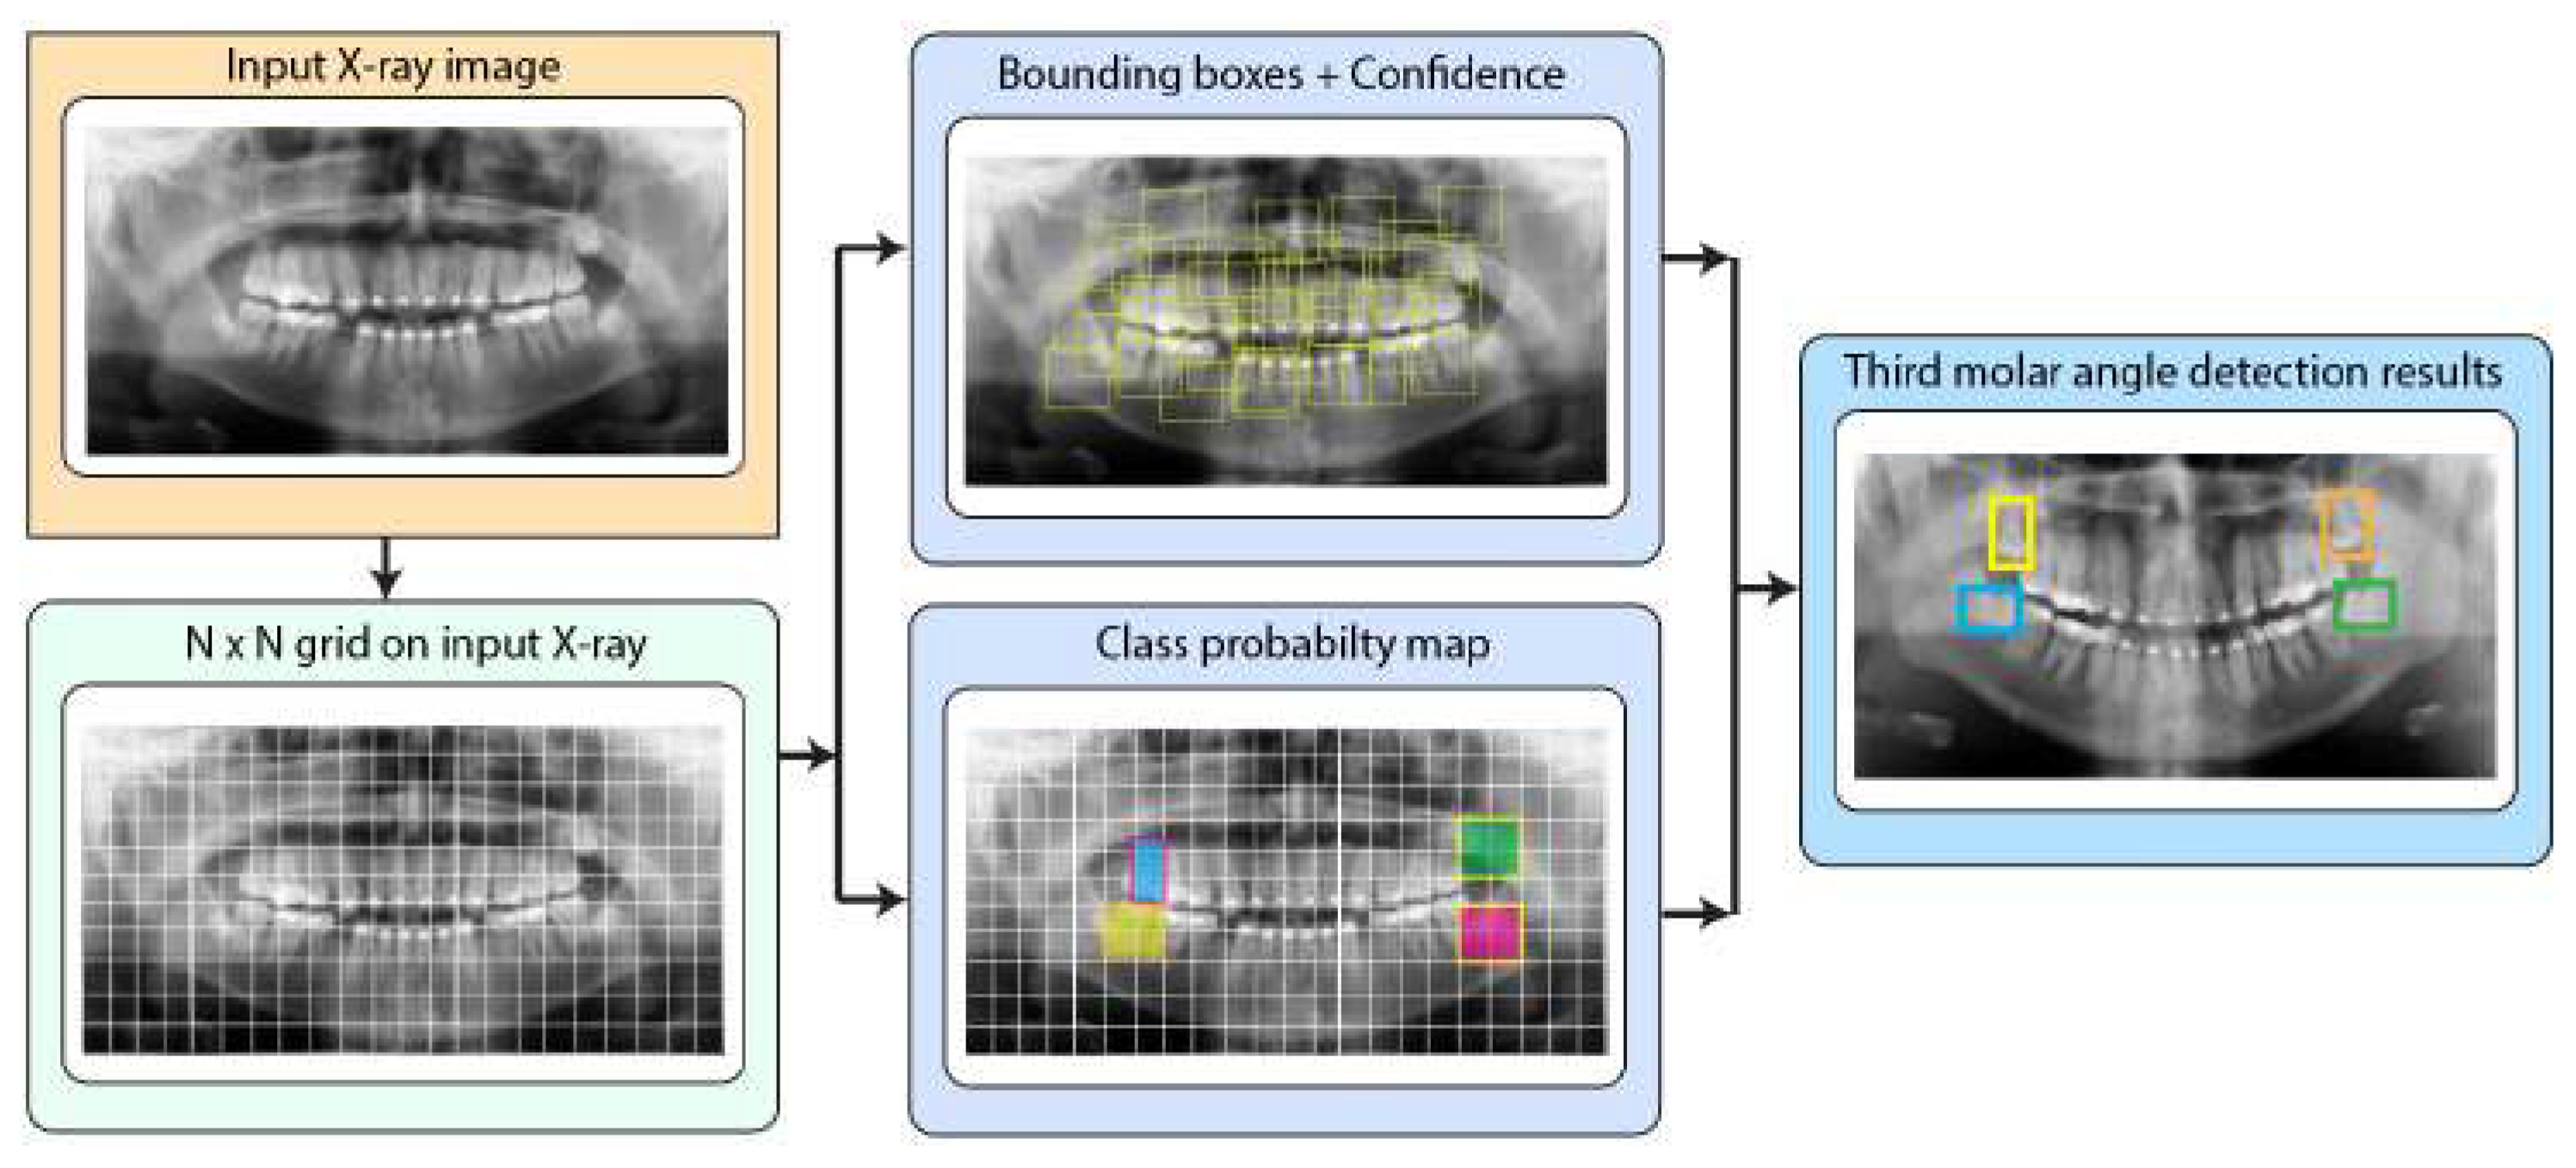
Figure 7.
Best precision-recall curves for the obtained algorithms using ResNet-18. Training results (left), validation results (center), and testing results (right). (a) Test 2 - Faster R-CNN, (b) Test 10 - YOLO V2, (c) Test 12 - SSD. YOLO V2 using ResNet-18 obtained the best result in test 10 (training:99%, validation:90%, and testing:96%).
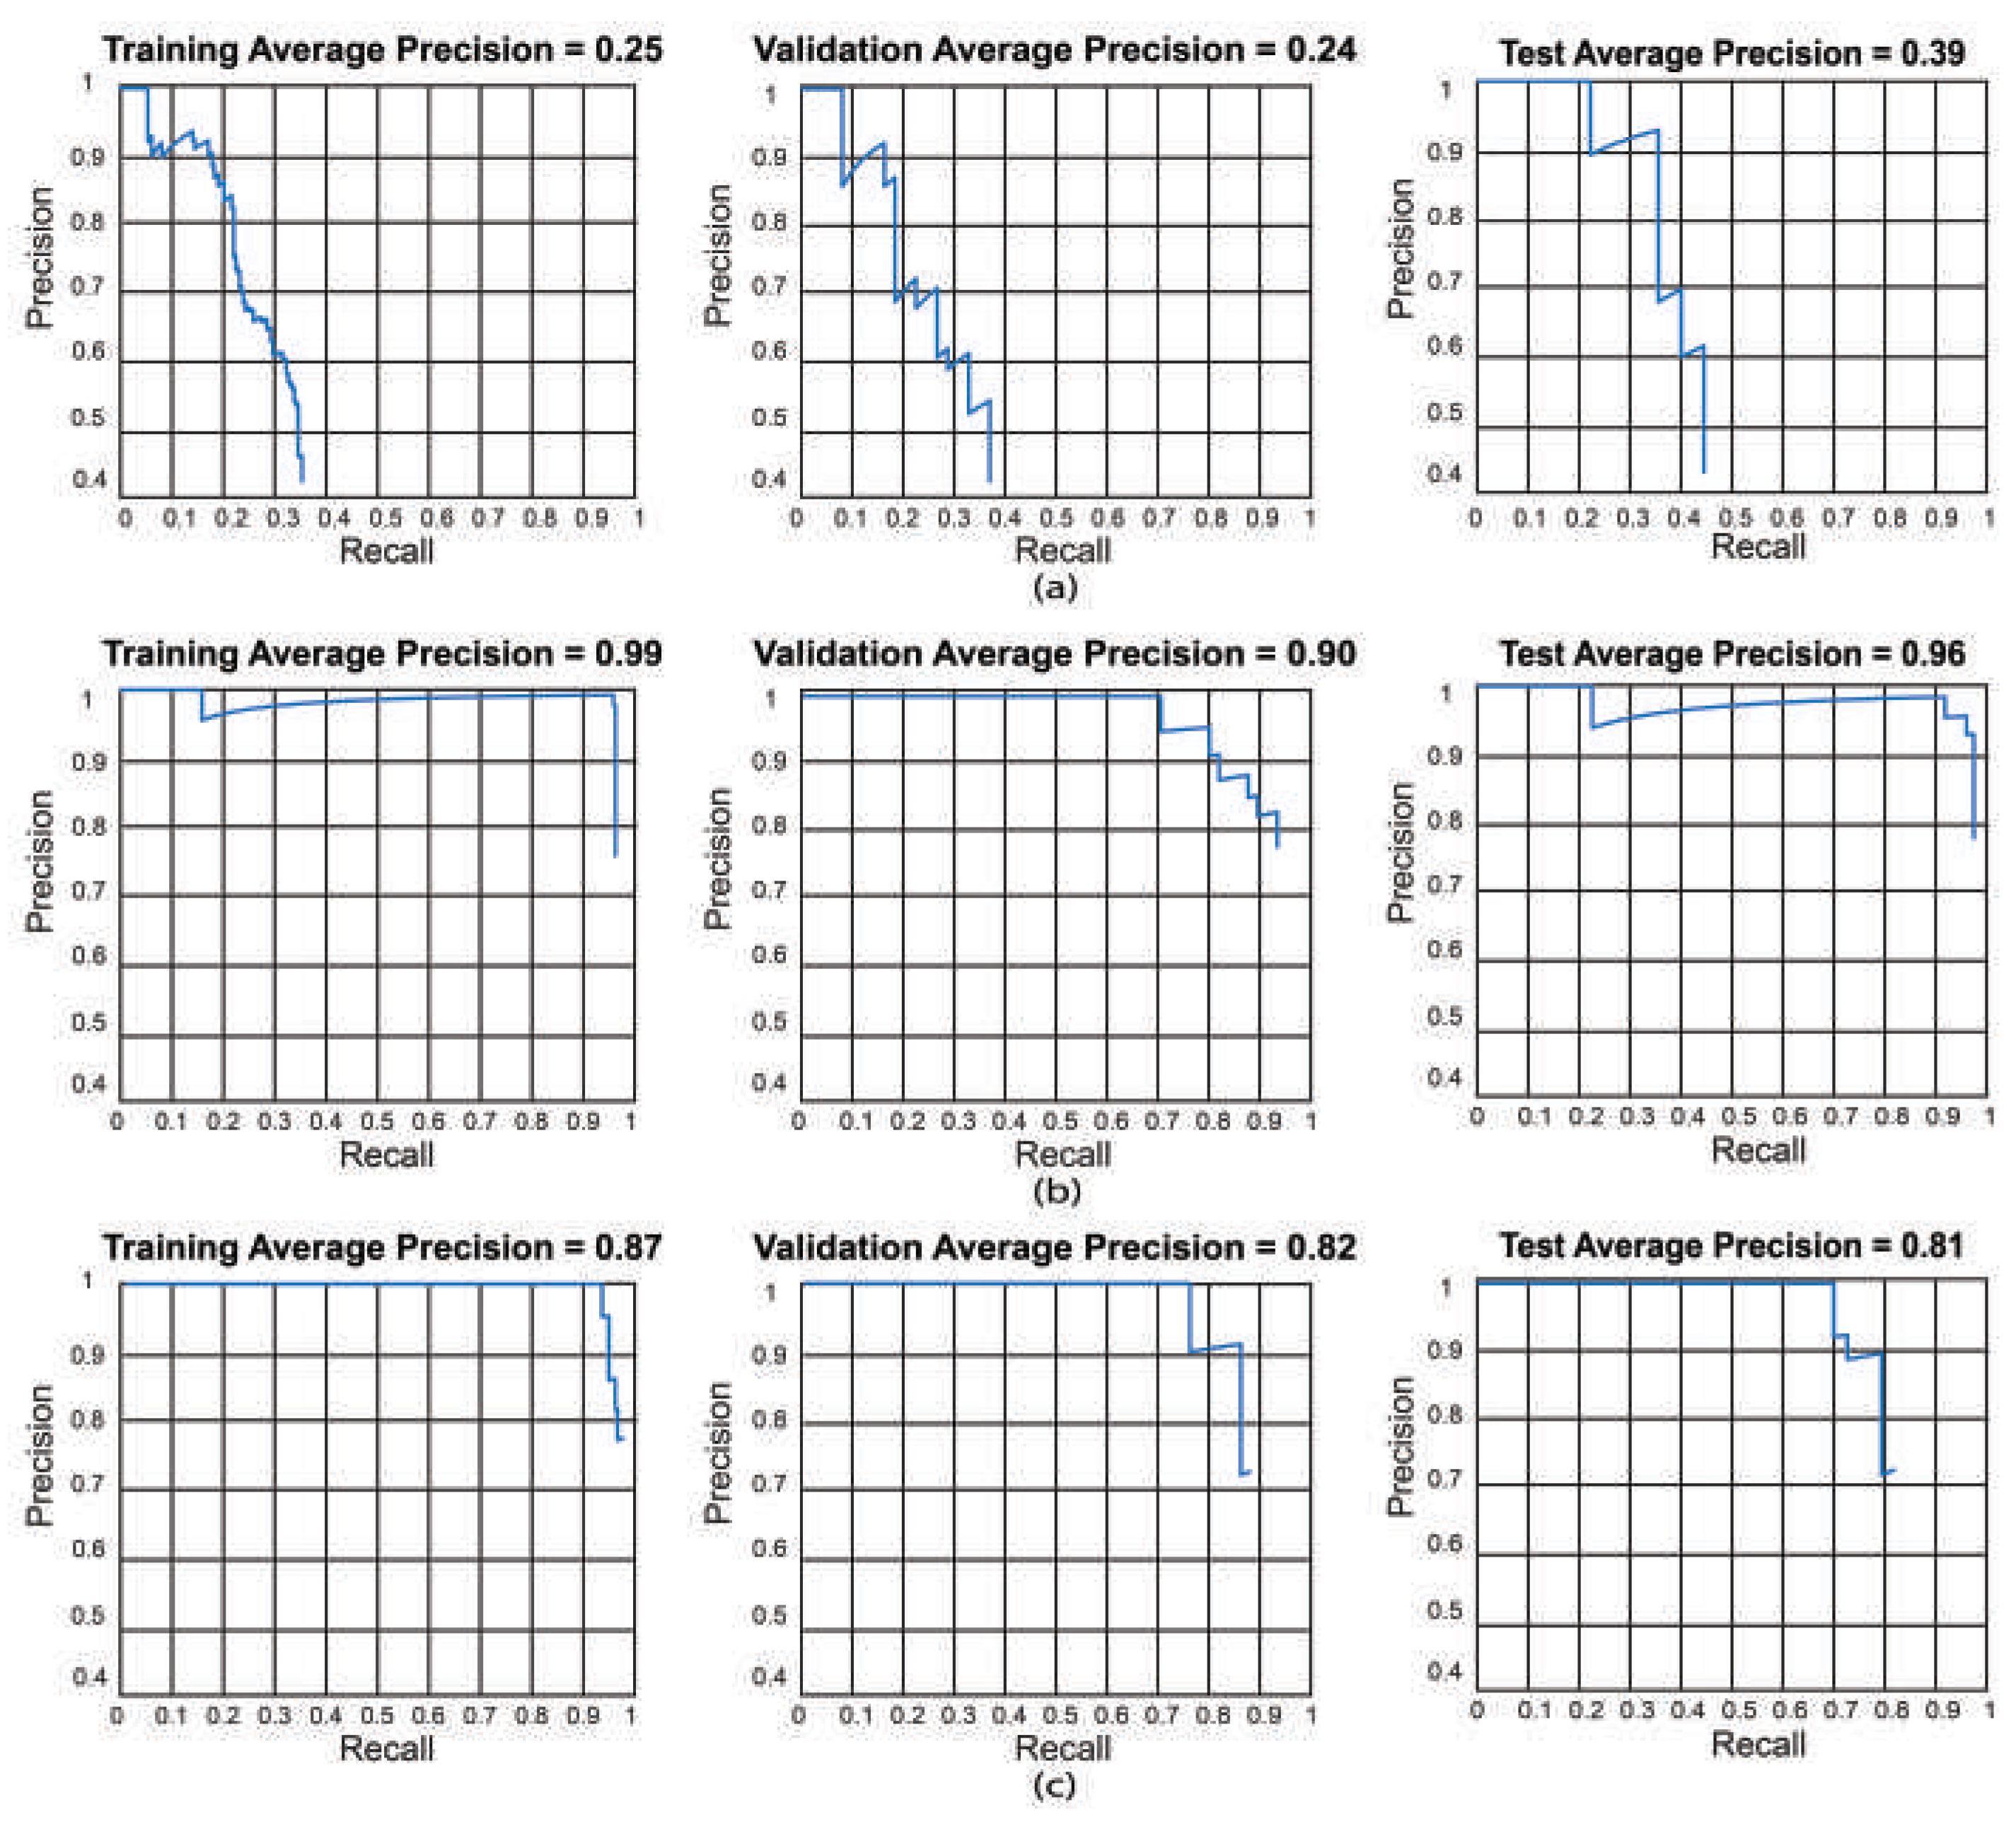
Figure 8.
Third molar angle detection in dental panoramic X-rays with ResNet-18 as feature extractor for Faster R-CNN, YOLO v2, and SSD.
Figure 8.
Third molar angle detection in dental panoramic X-rays with ResNet-18 as feature extractor for Faster R-CNN, YOLO v2, and SSD.
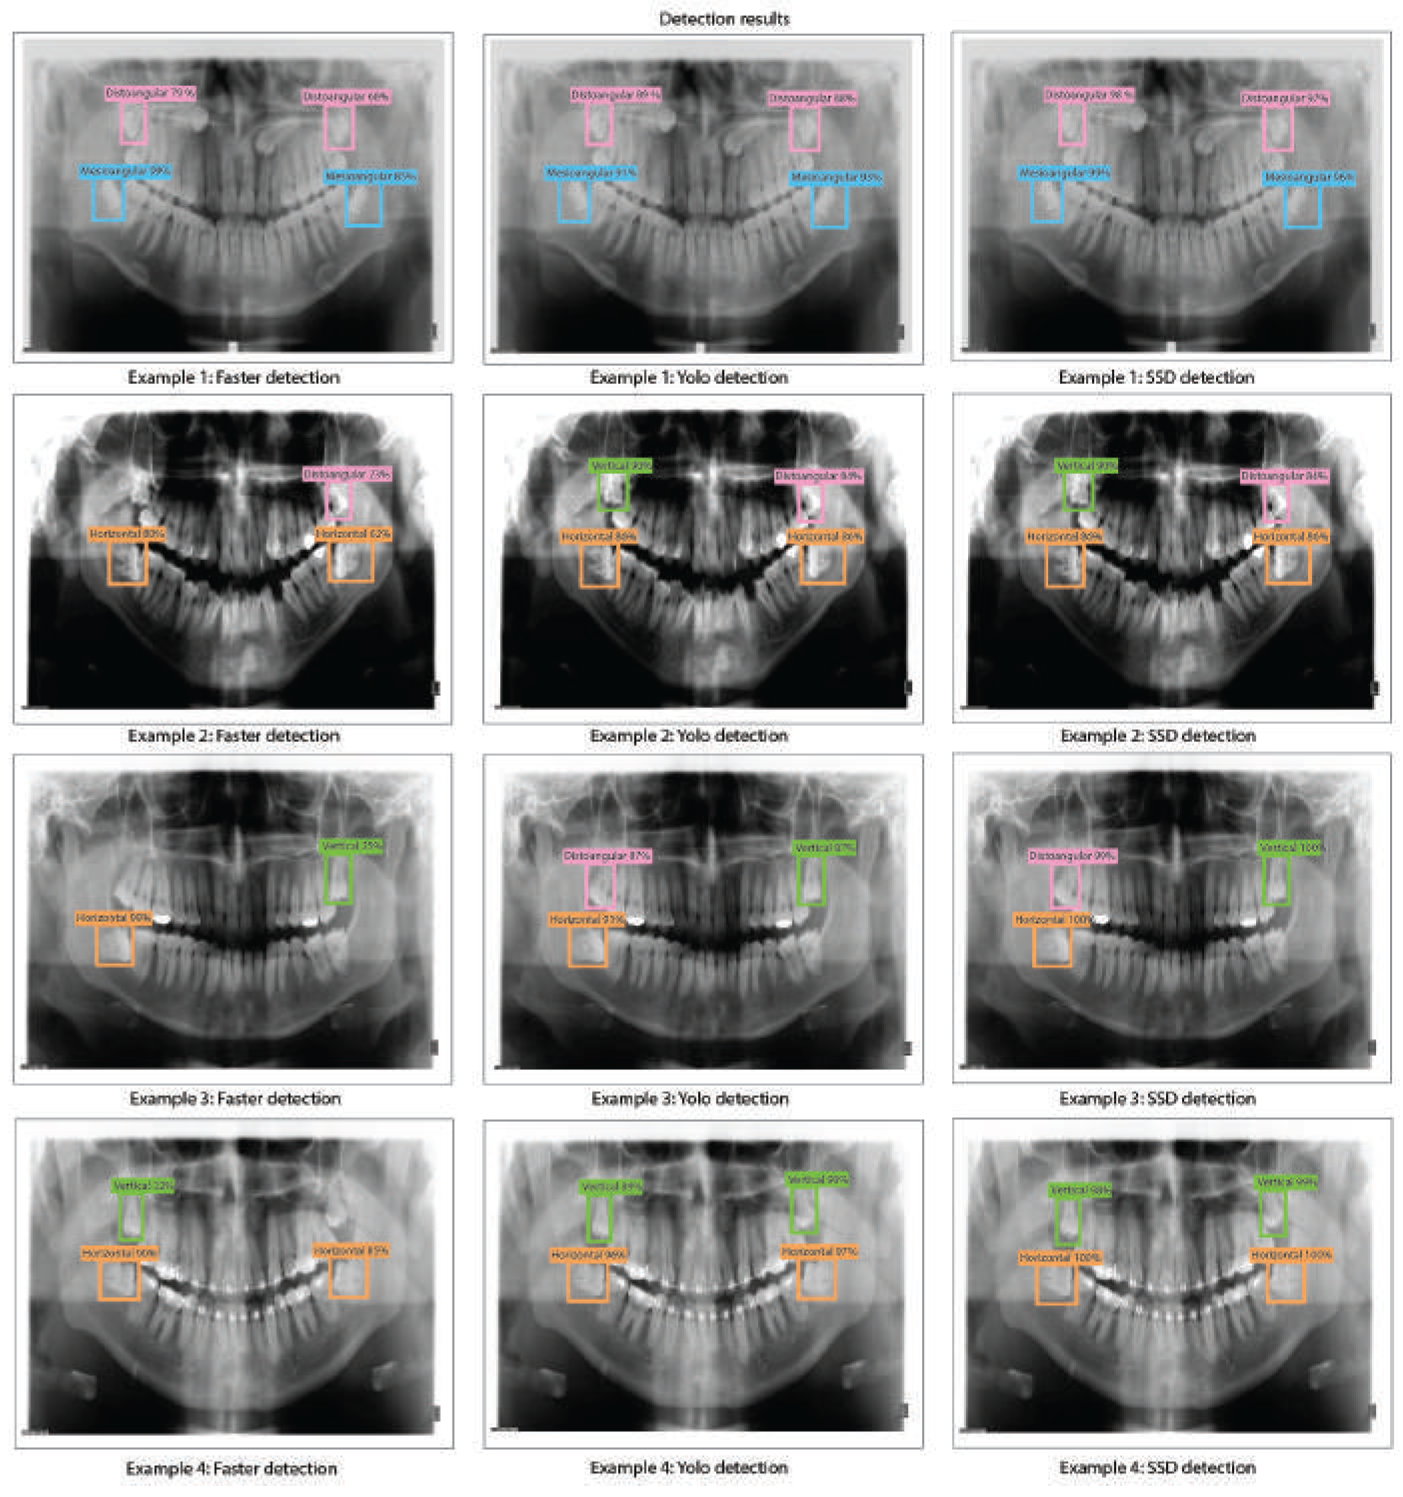
Figure 9.
Best precision-recall curves for the obtained algorithms using ResNet-50. Training results (left), validation results (center), and testing results (right). (a) Test 11 - Faster R-CNN, (b) Test 18 - YOLO V2, (c) Test 9 - SSD.
Figure 9.
Best precision-recall curves for the obtained algorithms using ResNet-50. Training results (left), validation results (center), and testing results (right). (a) Test 11 - Faster R-CNN, (b) Test 18 - YOLO V2, (c) Test 9 - SSD.
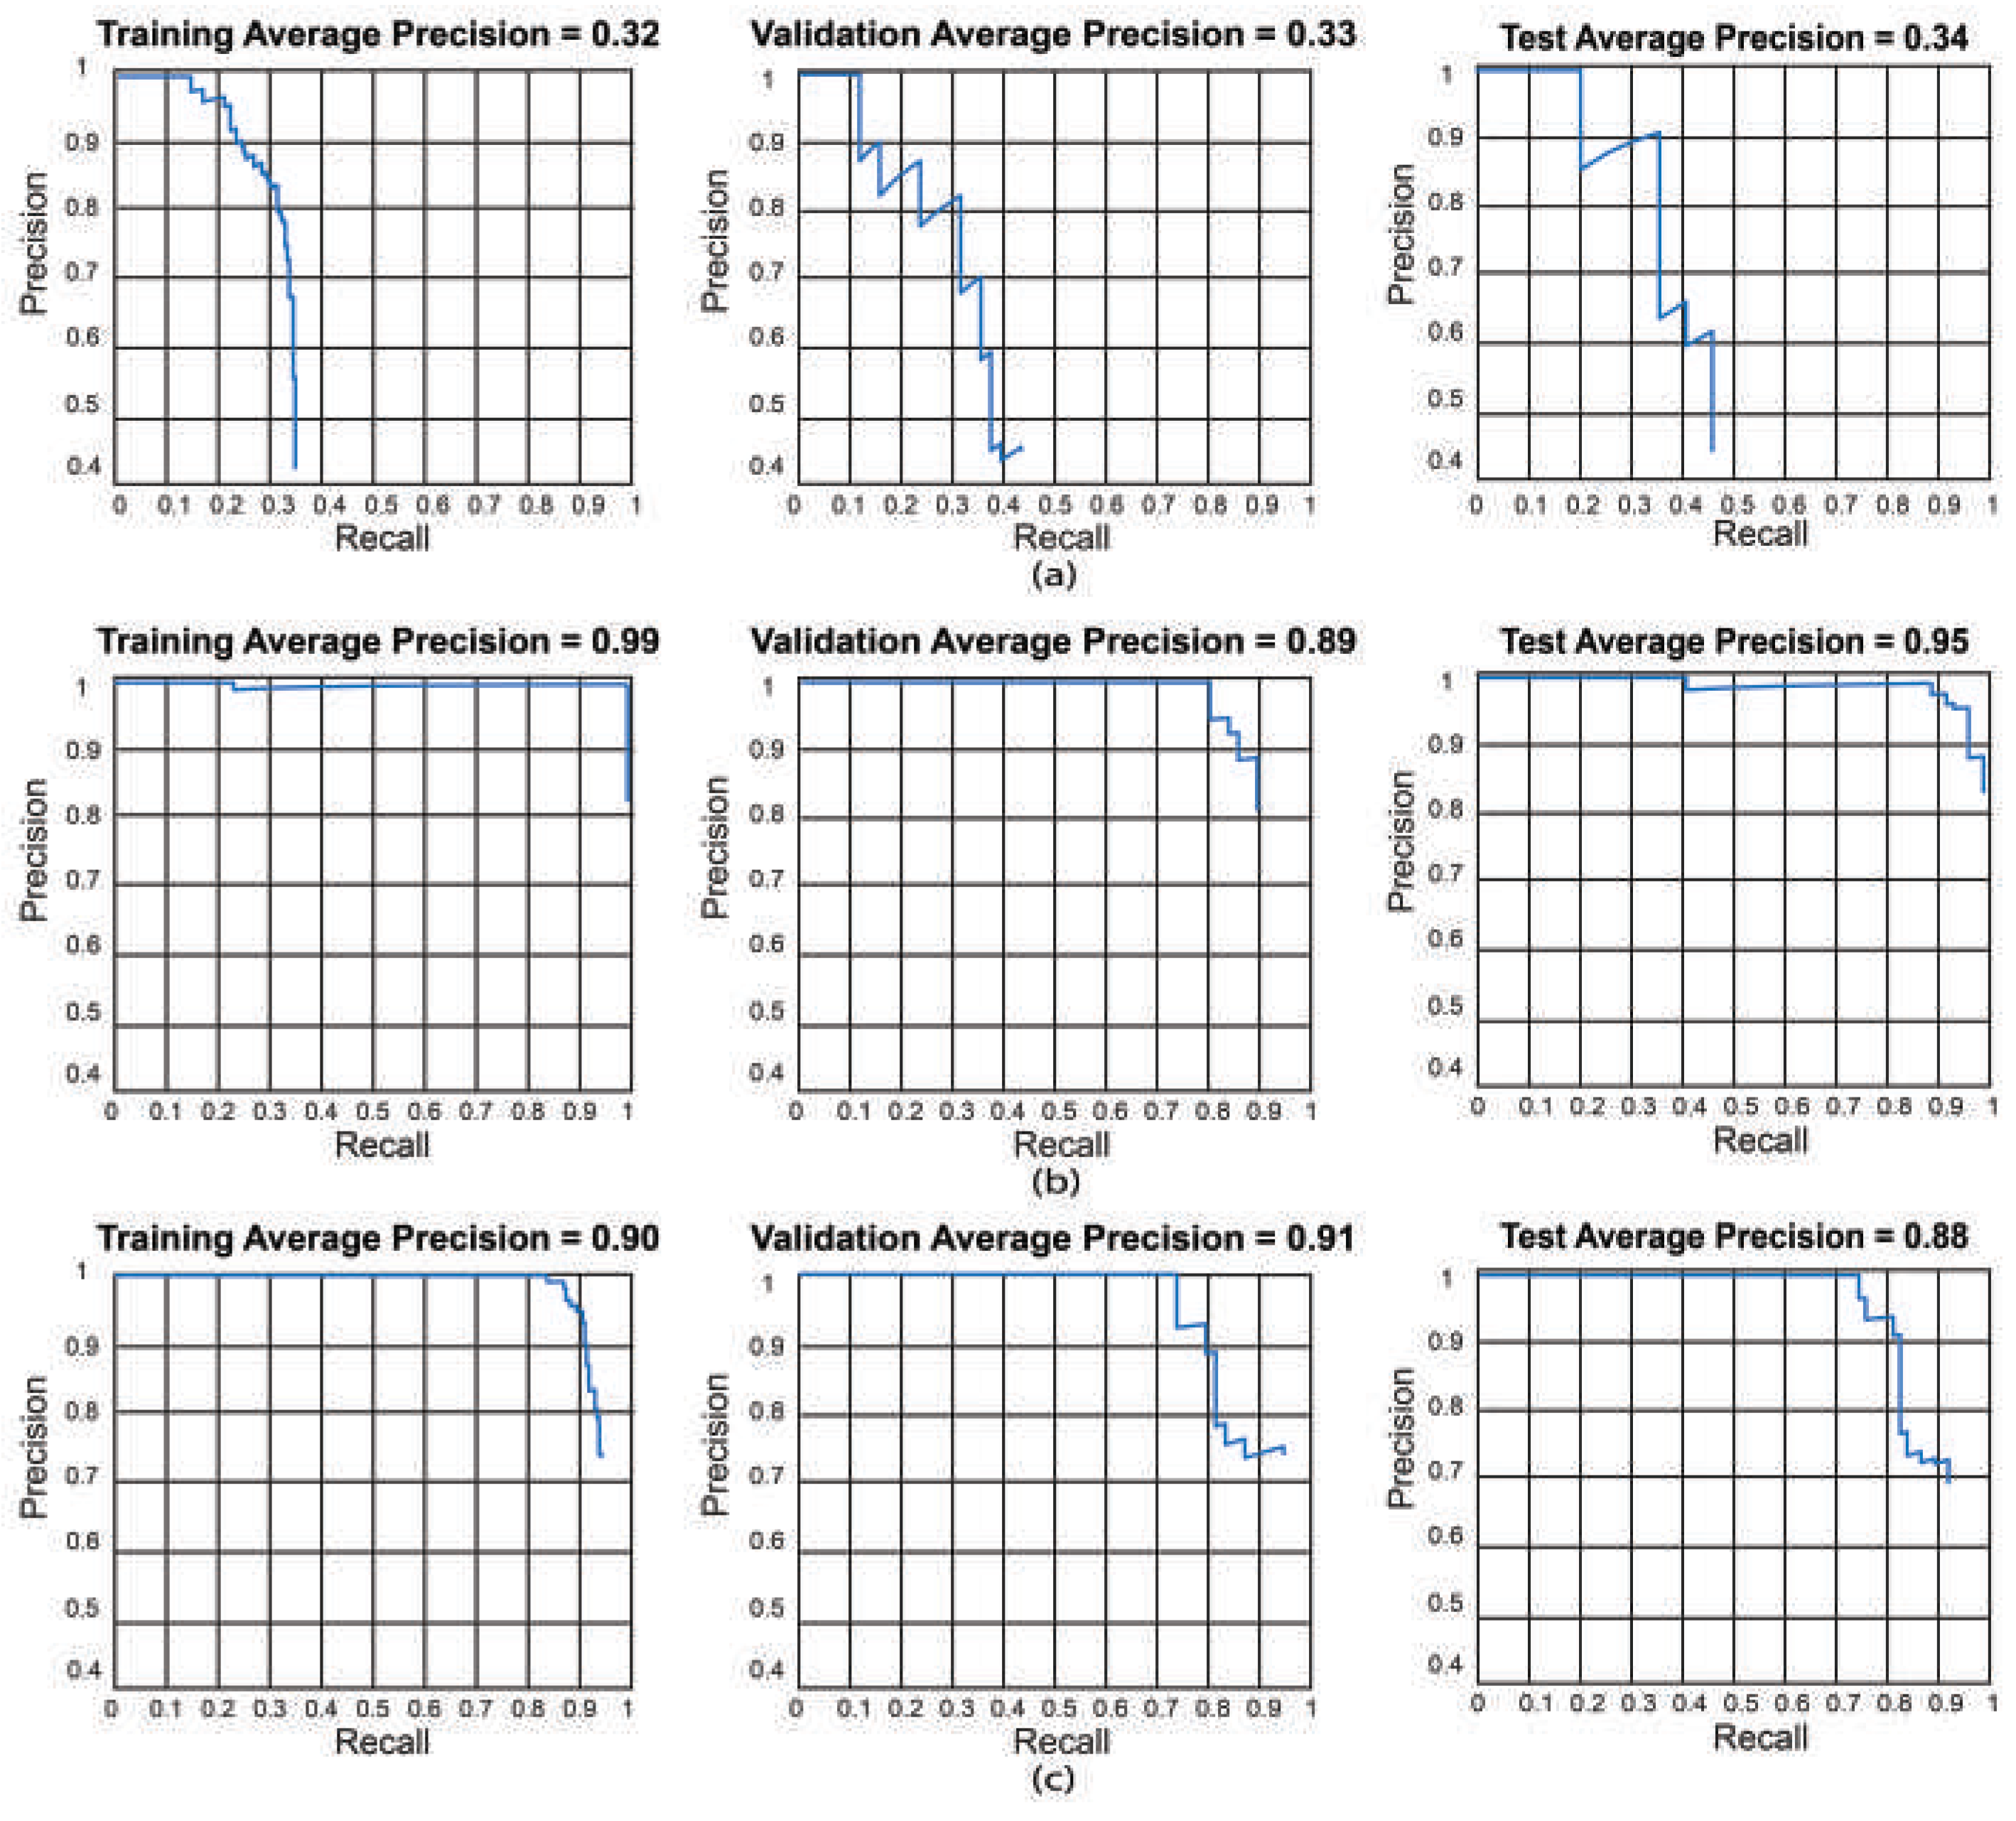
Figure 10.
Third molar angle detection in dental panoramic X-rays with ResNet-50 as feature extractor for Faster R-CNN, YOLO V2, and SSD.
Figure 10.
Third molar angle detection in dental panoramic X-rays with ResNet-50 as feature extractor for Faster R-CNN, YOLO V2, and SSD.
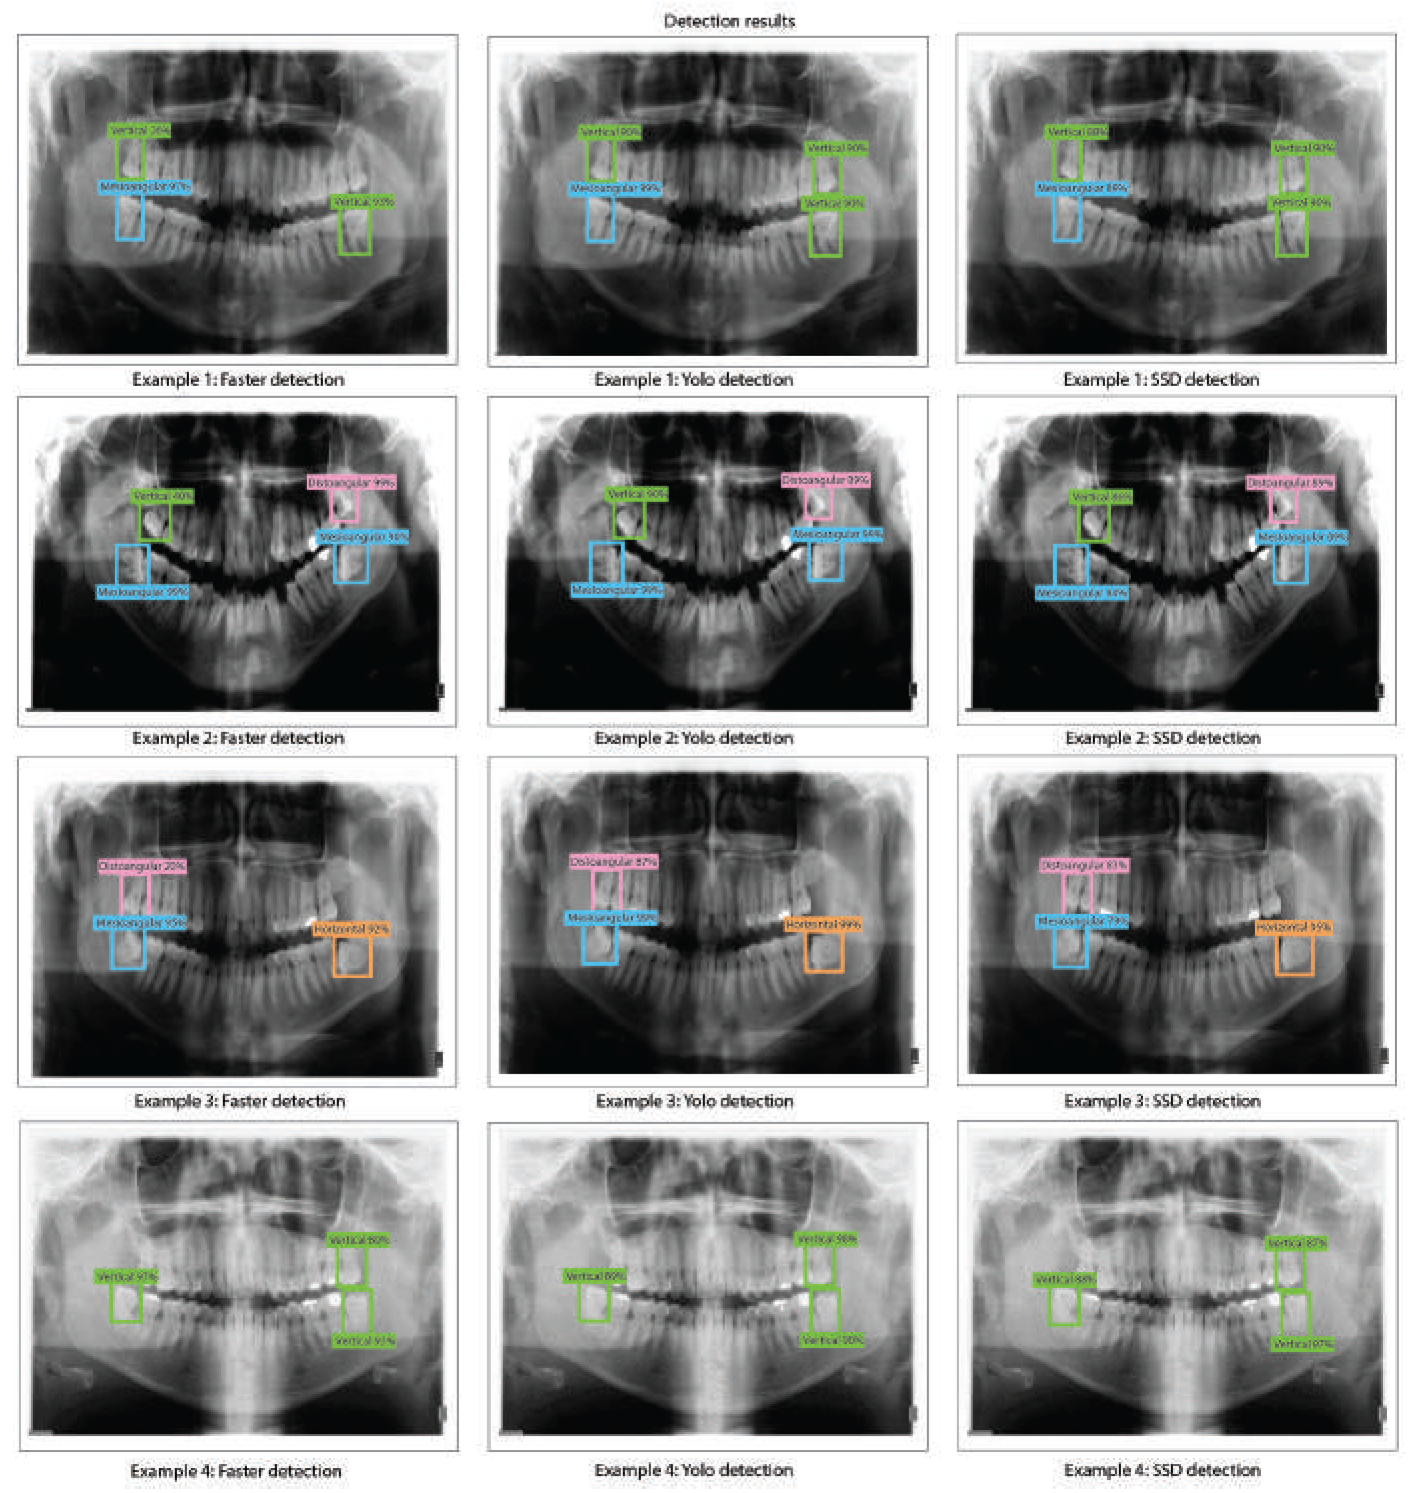
Figure 11.
Best precision-recall curves for the obtained algorithms using ResNet-101. Training results (left), validation results (center), and testing results (right). (a) Test 5 - Faster R-CNN, (b) Test 11 - YOLO V2, (c) Test 12 - SSD.
Figure 11.
Best precision-recall curves for the obtained algorithms using ResNet-101. Training results (left), validation results (center), and testing results (right). (a) Test 5 - Faster R-CNN, (b) Test 11 - YOLO V2, (c) Test 12 - SSD.
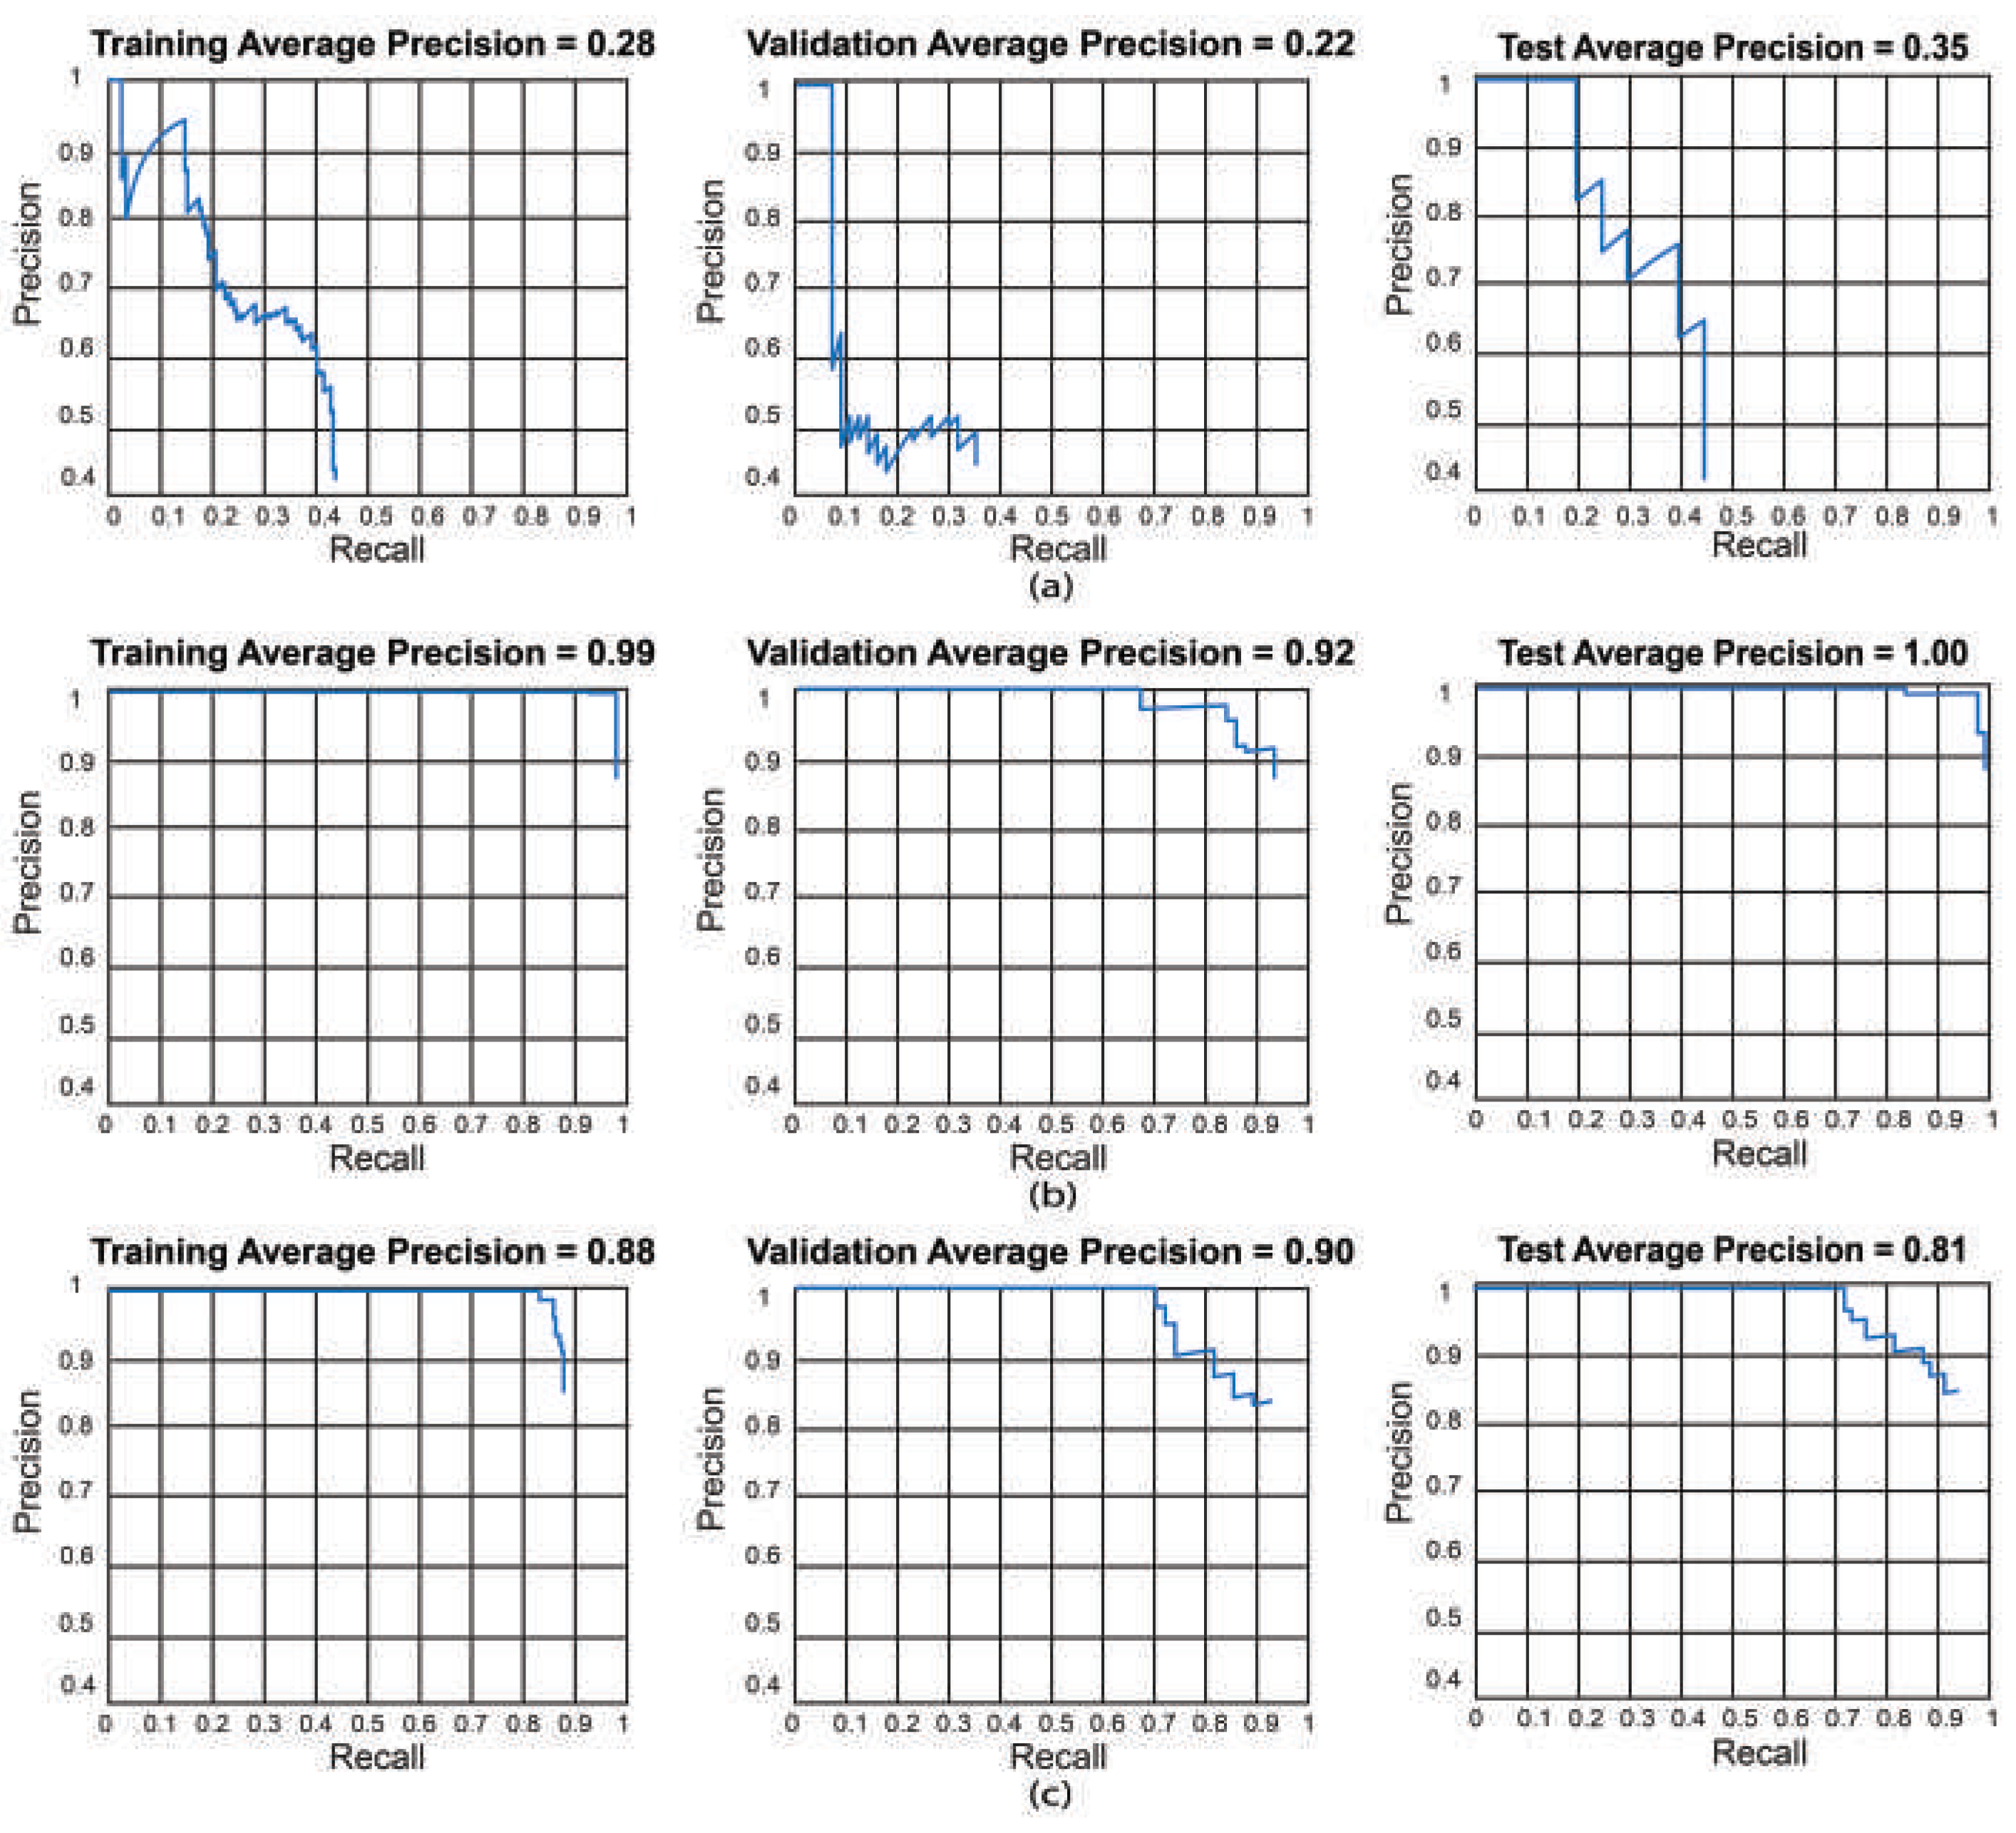
Figure 12.
Third molar angle detection in dental panoramic X-rays with ResNet-101 as feature extractor for Faster R-CNN, YOLO V2, and SSD.
Figure 12.
Third molar angle detection in dental panoramic X-rays with ResNet-101 as feature extractor for Faster R-CNN, YOLO V2, and SSD.
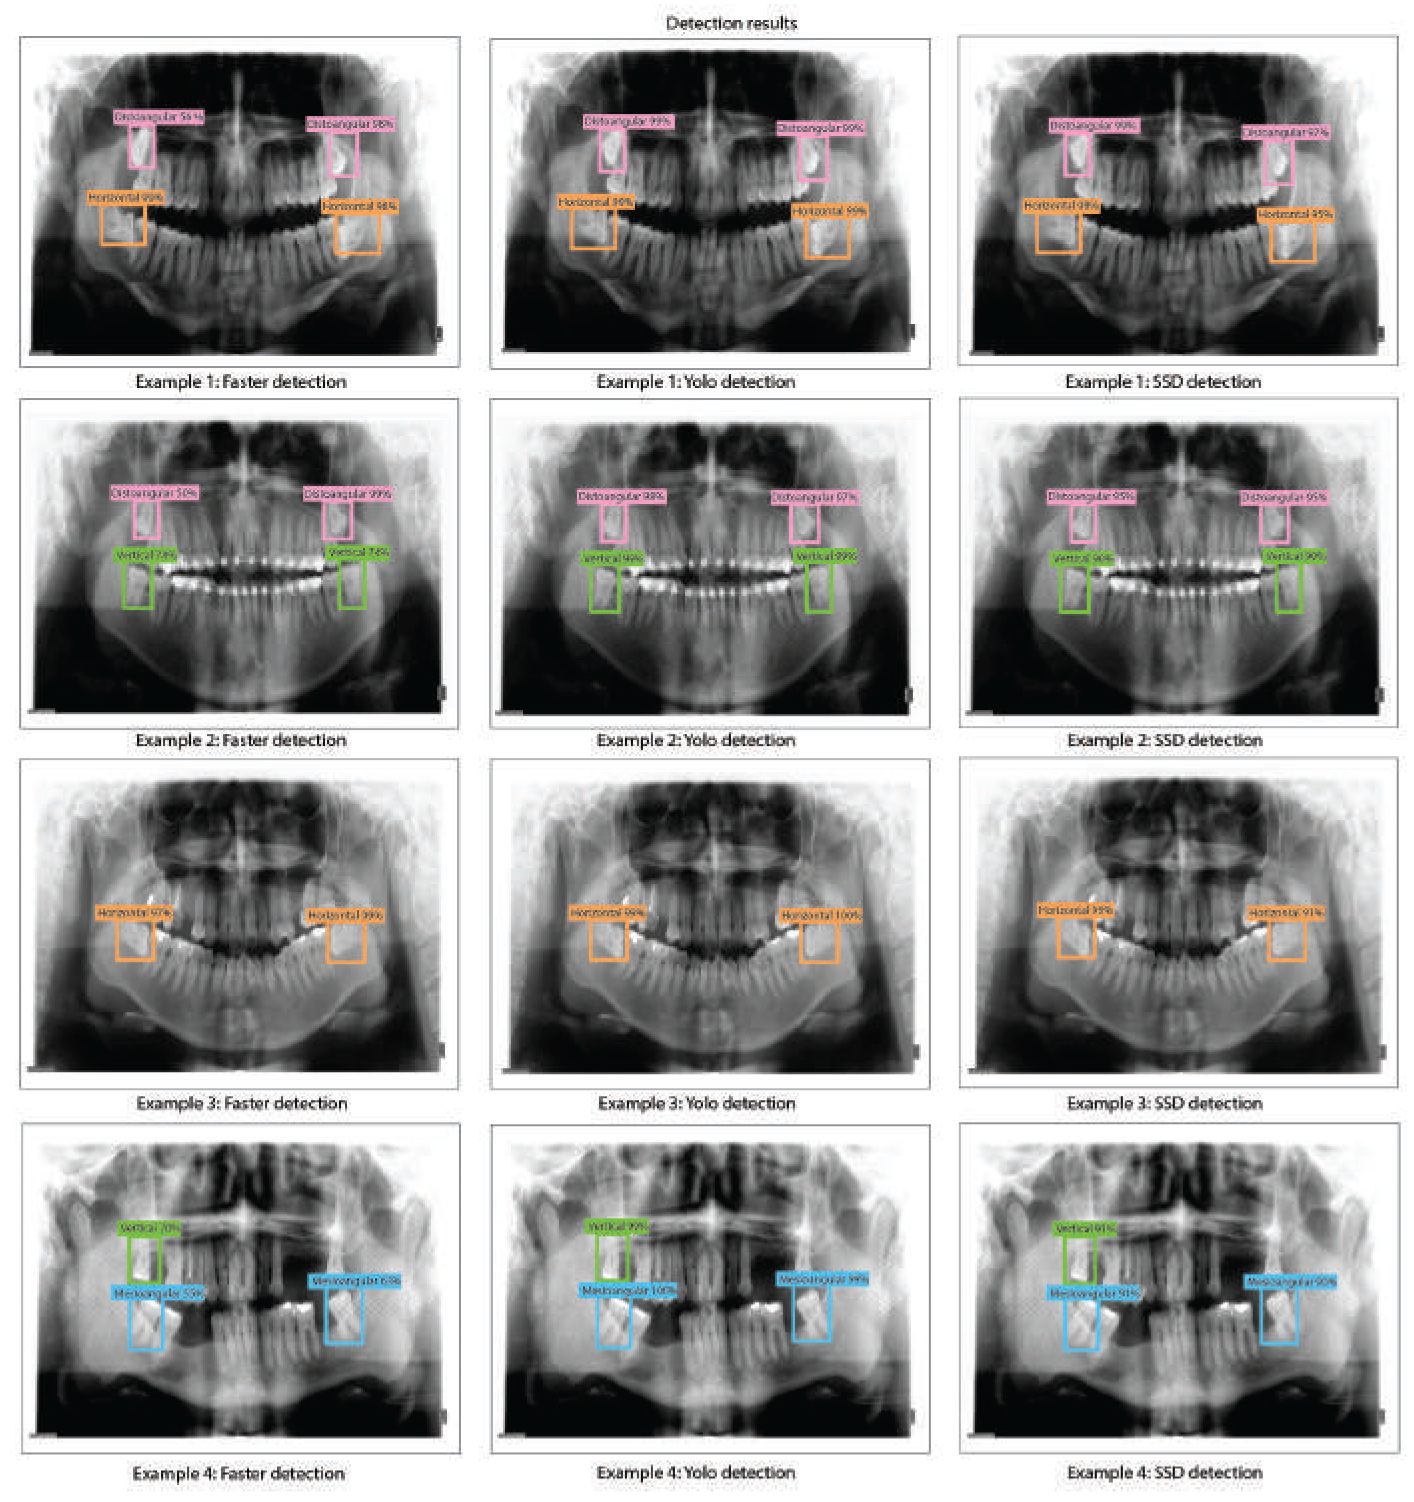

Table 1.
Dataset distribution for X-ray panoramic images.
| Data | |||
| Database | Training | Validation | Testing |
| Normal | 258 | 34 | 33 |
| Data augmentation |
516 | 65 | 66 |
Table 2.
Hyper-parameter configuration for training detector.
| Hyper-parameter configuration | |||
| Test | Max Epochs | Learning Rate | Optimizer |
| Test 1 | 20 | 0.001 | adam |
| Test 2 | 20 | 0.001 | sgdm |
| Test 3 | 20 | 0.001 | rmsprop |
| Test 4 | 20 | 0.005 | adam |
| Test 5 | 20 | 0.005 | sgdm |
| Test 6 | 20 | 0.005 | rmsprop |
| Test 7 | 20 | 0.0001 | adam |
| Test 8 | 20 | 0.0001 | sgdm |
| Test 9 | 20 | 0.0001 | rmsprop |
| Test 10 | 20 | 0.001 | adam |
| Test 11 | 40 | 0.001 | sgdm |
| Test 12 | 40 | 0.001 | rmsprop |
| Test 13 | 40 | 0.005 | adam |
| Test 14 | 40 | 0.005 | sgdm |
| Test 15 | 40 | 0.005 | rmsprop |
| Test 16 | 40 | 0.0001 | adam |
| Test 17 | 40 | 0.0001 | sgdm |
| Test 18 | 40 | 0.0001 | rmsprop |
Table 3.
ResNet-18 third molar angle detection results.
| Training | Validation | Testing | |||||||
| Test | Faster R- CNN |
Yolo V2 |
SSD | Faster R- CNN |
Yolo V2 |
SSD | Faster R- CNN |
Yolo V2 |
SSD |
| Test 1 | 2.3% | 99% | 83% | 1.2% | 85% | 77% | 2% | 96% | 75% |
| Test 2 | 25% | 87% | 60% | 24% | 61% | 53% | 39% | 81% | 51% |
| Test 3 | 1.3% | 97% | 84% | 1% | 84% | 81% | 1.3% | 86% | 77% |
| Test 4 | 3.2% | 94% | 84% | 2% | 71% | 70% | 3% | 86% | 69% |
| Test 5 | 5% | 99% | 86% | 12% | 85% | 74% | 14% | 87% | 72% |
| Test 6 | 8.4% | 81% | 3% | 8.3% | 63% | 2.7% | 7.1% | 77% | 2% |
| Test 7 | 6% | 85% | 88% | 6% | 72% | 73% | 5.2% | 81% | 71% |
| Test 8 | 3% | 42% | 1.4% | 3% | 38% | 1.2% | 2% | 36% | 1.3% |
| Test 9 | 4.6% | 81% | 88% | 4.6% | 70% | 77% | 3.6% | 69% | 74% |
| Test 10 | 9.3% | 99% | 88% | 8.3% | 90% | 79% | 8.3% | 96% | 77% |
| Test 11 | 16% | 99% | 89% | 17% | 82% | 76% | 12% | 93% | 75% |
| Test 12 | 6.2% | 99% | 87% | 6% | 84% | 82% | 4% | 91% | 81% |
| Test 13 | 6.3% | 99% | 88% | 3% | 92% | 79% | 8.9% | 89% | 78% |
| Test 14 | 11% | 99% | 88% | 8% | 88% | 76% | 19% | 97% | 77% |
| Test 15 | 2.2% | 96% | 87% | 2% | 84% | 77% | 1.5% | 87% | 78% |
| Test 16 | 18% | 99% | 89% | 18% | 85% | 80% | 28% | 95% | 79% |
| Test 17 | 14% | 52% | 6% | 11% | 50% | 11% | 21% | 51% | 8% |
| Test 18 | 8.2% | 99% | 88% | 8.6% | 79% | 76% | 8.6% | 86% | 76% |
Table 4.
ResNet-50 third molar angle detection results.
| Training | Validation | Testing | |||||||
| Test | Faster R- CNN |
Yolo V2 |
SSD | Faster R- CNN |
Yolo V2 |
SSD | Faster R- CNN |
Yolo V2 |
SSD |
| Test 1 | 6% | 99% | 88% | 7% | 85% | 79% | 19% | 93% | 77% |
| Test 2 | 18% | 96% | 91% | 22% | 87% | 82% | 24% | 76% | 82% |
| Test 3 | 3.3% | 97% | 86% | 2.9% | 81% | 79% | 3.1% | 88% | 78% |
| Test 4 | 8.2% | 85% | 84% | 2% | 72% | 80% | 7.2% | 80% | 72% |
| Test 5 | 17% | 98% | 1.3% | 13% | 89% | 1.3% | 17% | 91% | 1.2% |
| Test 6 | 1.2% | 1.8% | 1.5% | 1.2% | 1.5% | 1.3% | 1.1% | 1.5% | 1.4% |
| Test 7 | 16% | 99% | 87% | 13% | 89% | 85% | 14% | 91% | 85% |
| Test 8 | 8% | 9% | 65% | 10% | 8% | 64% | 13% | 15% | 63% |
| Test 9 | 7.6% | 99% | 88% | 6.6% | 91% | 91% | 7.1% | 92% | 88% |
| Test 10 | 14% | 94% | 88% | 9% | 82% | 78% | 21% | 98% | 78% |
| Test 11 | 35% | 99% | 89% | 33% | 90% | 81% | 34% | 83% | 79% |
| Test 12 | 3% | 99% | 86% | 2.9% | 88% | 76% | 2.9% | 90% | 79% |
| Test 13 | 8.2% | 98% | 87% | 7.2% | 78% | 83% | 8% | 94% | 82% |
| Test 14 | 30% | 99% | 2.1% | 22% | 84% | 1.1% | 18% | 89% | 1.2% |
| Test 15 | 4.2% | 3% | 2% | 4% | 2.6% | 2.2% | 4.2% | 2.3% | 2.5% |
| Test 16 | 12% | 99% | 89% | 14% | 90% | 84% | 17% | 88% | 84% |
| Test 17 | 23% | 30% | 82% | 22% | 20% | 71% | 20% | 18% | 70% |
| Test 18 | 8% | 99% | 88% | 7.2% | 89% | 84% | 6.9% | 95% | 83% |
Table 5.
ResNet-101 third molar angle detection results.
| Training | Validation | Testing | |||||||
| Test | Faster R- CNN |
Yolo V2 |
SSD | Faster R- CNN |
Yolo V2 |
SSD | Faster R- CNN |
Yolo V2 |
SSD |
| Test 1 | 2.8% | 99% | 88% | 1.5% | 90% | 87% | 2.1% | 97% | 87% |
| Test 2 | 20% | 98% | 86% | 10% | 81% | 75% | 24% | 89% | 72% |
| Test 3 | 1.8% | 96% | 87% | 1.2% | 79% | 84% | 1.1% | 89% | 84% |
| Test 4 | 7.2% | 93% | 64% | 4.2% | 84% | 53% | 3.1% | 92% | 52% |
| Test 5 | 28% | 99% | 3.2% | 22% | 86% | 2.8% | 35% | 86% | 3% |
| Test 6 | 1.6% | 7% | 3.3% | 1.3% | 12% | 7.7% | 1.1% | 5% | 2% |
| Test 7 | 20% | 99% | 88% | 19% | 92% | 86% | 27% | 95% | 84% |
| Test 8 | 12% | 15% | 66% | 7% | 11% | 66% | 25% | 12% | 62% |
| Test 9 | 3% | 99% | 89% | 1.1% | 93% | 87% | 2% | 93% | 82% |
| Test 10 | 9% | 99% | 85% | 6% | 87% | 81% | 1% | 98% | 81% |
| Test 11 | 21% | 99% | 88% | 12% | 92% | 78% | 14% | 99% | 77% |
| Test 12 | 5.5% | 99% | 88% | 4% | 83% | 90% | 3% | 97% | 89% |
| Test 13 | 3.3% | 98% | 88% | 3% | 80% | 83% | 2.8% | 92% | 77% |
| Test 14 | 23% | 99% | 5.2% | 19% | 85% | 4.2% | 26% | 89% | 4.1% |
| Test 15 | 6% | 14% | 2.9% | 3% | 9% | 2% | 6.5% | 10% | 2% |
| Test 16 | 18% | 99% | 88% | 9% | 91% | 84% | 31% | 95% | 81% |
| Test 17 | 16% | 38% | 82% | 18% | 20% | 76% | 33% | 21% | 74% |
| Test 18 | 2.7% | 99% | 88% | 2.4% | 92% | 87% | 2.1% | 95% | 83% |
Table 6.
Comparison of inference times between Faster R-CNN, YOLO V2, and SSD and their respective feature extraction methods.
Table 6.
Comparison of inference times between Faster R-CNN, YOLO V2, and SSD and their respective feature extraction methods.
| Detection Model | ResNet-18 (s) | ResNet-50 (s) | ResNet-101 (s) |
| Faster R-CNN | 0.223 | 0.188 | 0.360 |
| YOLO V2 | 0.071 | 0.089 | 0.092 |
| SSD | 0.077 | 0.104 | 0.093 |
Disclaimer/Publisher’s Note: The statements, opinions and data contained in all publications are solely those of the individual author(s) and contributor(s) and not of MDPI and/or the editor(s). MDPI and/or the editor(s) disclaim responsibility for any injury to people or property resulting from any ideas, methods, instructions or products referred to in the content. |
© 2024 by the authors. Licensee MDPI, Basel, Switzerland. This article is an open access article distributed under the terms and conditions of the Creative Commons Attribution (CC BY) license (http://creativecommons.org/licenses/by/4.0/).
Copyright: This open access article is published under a Creative Commons CC BY 4.0 license, which permit the free download, distribution, and reuse, provided that the author and preprint are cited in any reuse.


