Submitted:
01 July 2025
Posted:
03 July 2025
You are already at the latest version
Abstract
Systematic reviews are a cornerstone of evidence-based research, providing comprehensive summaries of existing studies to answer specific research questions. This article offers a detailed guide to conducting high-quality systematic reviews in health and social sciences. It outlines key steps, including developing and registering a protocol, designing comprehensive search strategies, and selecting studies through a screening process. The article emphasizes the importance of accurate data extraction and the use of validated tools to assess the risk of bias across different study designs. Methods for synthesizing data are discussed, covering both quantitative approaches like meta-analysis and qualitative narrative synthesis when statistical pooling is not possible. The guide also highlights the use of frameworks, such as GRADE, to assess the certainty of evidence and provides recommendations for clear and transparent reporting in line with the PRISMA 2020 guidelines. By adhering to these best practices, researchers can improve the reproducibility and the impact of their systematic reviews supporting decision-making in daily practice, public policy, and future research.
Keywords:
systematic review
; meta-analysis
; evidence synthesis
; risk of bias
; GRADE
; PRISMA
; publication bias
; narrative synthesis
; study selection
; guideline
1. Introduction
Systematic reviews (SRs) are widely regarded as the highest form of evidence within the hierarchy of research designs. However, this position has been increasingly challenged, with some arguing that SRs should be conceptualized not as the apex of evidence-based practice, but rather as a methodological lens through which primary studies are critically appraised, synthesized, and interpreted [1]. From this perspective, SRs serve as structured tools that enable stakeholders to consume, evaluate, and apply the underlying evidence more effectively [1]. This holds true not only within the field of biology but across all areas of scientific research, where systematic reviews play a crucial role in synthesizing evidence and guiding practice because well conducted SRs minimize bias and offer robust conclusions that inform clinical practice, public health policy, and further research endeavors.
However, not all systematic reviews are of high quality as the reporting and methodological quality of SRs are inconsistent although reporting guidelines and quality assessment tools exist [2]. Poor methodological rigor can result in misleading conclusions, which in turn may negatively impact clinical decision-making and policy formulation. Therefore, understanding the correct methodology is essential not only for researchers but also for reviewers, editors and readers undertaking or interpreting systematic reviews.
The aim of this paper is to offer a comprehensive overview of how to conduct a high-quality systematic review, with detailed discussions of each step based on internationally recognized guidelines and best practices.
2. Formulating the Research Question
The first and most fundamental step in a systematic review is to develop a clearly but articulated research question. A well-structured question serves as the foundation for the entire review process, guiding search strategies, study selection, and data synthesis. However, even if this is the most crucial step a study find that 3 out of 10 studies would have needed a major rewording of the research question [3].
In biology and more generally in health sciences, the PICO framework and more frequently its extended version – PICOS, is the most commonly employed tool to structure the research question. PICOS stands for:P: Population or patient group; I: Intervention or exposure; C: Comparator or control; O: Outcomes of interest, S:Study design. It has been shown that researchers using the PICO framework have better precision in retrieving relevant studies when querying databases compared to a free keywords strategy [4].
Below are presented two examples of PICOS question:
- (1)
-
In degraded tropical forest ecosystems, does reforestation with native tree species, compared to natural recovery without intervention, lead to greater increases in species richness and abundance of native fauna, based on long-term field observational studies?Population (P): Degraded tropical forest ecosystemsIntervention (I): Reforestation using native tree speciesComparison (C): Degraded land left without intervention (natural recovery)Outcome (O): Increase in species richness and abundance of native fauna (e.g., birds, insects)Study Design (S): Field-based longitudinal observational study over 5–10 years
- (2)
-
In Pseudomonas aeruginosa cultures, does exposure to sub-lethal concentrations of ciprofloxacin, compared to no antibiotic treatment, reduce biofilm formation in in vitro experimental studies?Population (P): Bacterial strains of Pseudomonas aeruginosaIntervention (I): Treatment with sub-lethal concentrations of ciprofloxacinComparison (C): No antibiotic exposure (control cultures)Outcome (O): Reduction in biofilm formation (quantified by biomass or biofilm thickness)Study Design (S): In vitro laboratory-based experimental study
While PICO is a strong starting point for many clinical and intervention-based studies, exploring these alternatives can lead to a more focused and effective research question for other contexts. For example, “SPIDER” (sample, phenomenon of interest, design, evaluation, research type), designed specifically to identify relevant qualitative and mixed-method studies [5], however its use is widely more limited than the PICOS framework [6] and it is exemplified as follows:
- (3)
-
How do local community members living near protected wildlife reserves perceive and experience community-based wildlife conservation programs, as explored through qualitative interviews and focus groups?Sample (S): Local community members living near protected wildlife reservesPhenomenon of Interest (PI): Experiences and perceptions of community-based wildlife conservation programsDesign (D): Semi-structured interviews and focus groupsEvaluation (E): Perceived benefits, challenges, and attitudes toward conservation effortsResearch type (R): Qualitative research
Several alternatives to the PICOS and SPIDER framework exist to structure research questions, especially for qualitative and mixed-method studies [7]. SPICE (Setting, Perspective, Intervention, Comparison, Evaluation) focuses on the context and is useful in social research—for example, assessing how farmers in arid regions perceive agroforestry compared to monoculture. PEO (Population, Exposure, Outcome) simplifies qualitative inquiries, like exploring the experiences of fishers affected by marine protected areas. For policy and service evaluation, ECLIPSE (Expectation, Client group, Location, Impact, Professionals, Service) frames questions around service improvement, such as evaluating community expectations of local conservation programs. CIMO (Context, Intervention, Mechanism, Outcome) suits organizational or environmental management research, like examining how community-led wetland restoration (intervention) in urban areas fosters stewardship (mechanism) and improves biodiversity (outcome).
3. Developing a Protocol
Developing and pre-registering a protocol serves two key purposes. First, it provides structured guidance for each stage of the review, ensuring that all team members understand the workflow and process. Second, it acts as a safeguard against methodological bias by promoting transparency and accountability. Several platforms are available for protocol pre-registration. The most widely recognized is PROSPERO [8], a public registry specifically dedicated to systematic reviews. Another widely used option is the Open Science Framework (OSF), which supports the pre-registration of a broader range of research projects beyond systematic reviews. Additionally, researchers may consider publishing their protocol as an article in a peer-reviewed journal that accepts protocol submissions, which provides the added benefit of formal peer review and greater visibility.
Some registries guide researchers by requiring them to complete structured fields that cover the key aspects of the systematic review. Others allow researchers to simply upload a study protocol without predefined fields. This second approach is better suited for researchers already experienced in conducting systematic reviews, as it carries the risk of producing incomplete protocols that may omit essential methodological details. Regardless of the format, certain critical information should always be provided: the objectives and research questions, eligibility criteria, information sources (such as databases and registries), detailed search strategies, the study selection process, the data extraction plan, strategies for assessing risk of bias, and methods for data synthesis—including plans for meta-analysis or narrative synthesis. Additionally, any intended subgroup or sensitivity analyses should be specified if applicable.In relation to minimizing the risk of bias, it is important to emphasize that a poorly detailed or vague protocol carries similar risks to conducting a systematic review without a protocol at all [9] and pre-registering the protocol helps reduce the risk of selective inclusion of studies or outcome data, which could otherwise lead to overestimation or underestimation of the systematic review’s results [10]. Inadequate protocol transparency may lead readers to underestimate the potential for bias, thereby limiting the critical appraisal of the review’s methodological rigor.
4. Formulating the Search Strategy
A comprehensive search strategy aims to capture all relevant studies. While the PICOS model is fundamental in formulating the research question, it should not be directly applied in full when designing the search strategy. In fact, evidence suggests that incorporating all elements of PICOS—particularly the comparator and outcomes—can reduce the accuracy of search results, as these elements are often inconsistently reported in titles and abstracts [11]; current guidelines generally recommend that search strategies focus on the population, intervention(s), and study design [12].
The Cochrane Handbook for Systematic Reviews of Interventions [13] advises searching multiple databases to minimize the risk of missing relevant studies. Commonly used databases include MEDLINE/PubMed, EMBASE, Scopus, Cochrane Central Register of Controlled Trials (CENTRAL), CINAHL, and PsycINFO. However, this list is not exhaustive; researchers are encouraged to expand their search to as many relevant databases as resources allow.
It is crucial for researchers to recognize that each database has its own controlled vocabulary and search syntax. While a detailed explanation of database-specific search languages falls outside the scope of this article, search strings typically combine database specific controlled vocabulary (e.g., MeSH terms) with free-text keywords. Boolean operators (AND, OR, NOT) and truncation symbols are employed to refine searches. Furthermore, to ensure transparency and reproducibility, the exact search strategy used for each database—including the date the search was conducted—should be reported, typically as supplementary material.
Additional strategies are commonly employed to maximize the retrieval of relevant articles for a systematic review. These include searching the grey literature, such as theses, dissertations, conference proceedings, and clinical trial registries (e.g., ClinicalTrials.gov, WHO ICTRP). Citation tracking—both backward (screening the reference lists of included studies) and forward (identifying articles that have cited the included studies, often referred to as snowballing)—is another effective approach. Furthermore, contacting the authors of included studies can help identify unpublished or ongoing studies that may otherwise be missed.
Other recommended strategies include searching preprint servers, consulting subject-specific repositories, and exploring regulatory agency reports or industry submissions, where applicable. All these supplementary search methods should be clearly outlined in the pre-registered protocol.
5. Study Screening and Selection
Study selection typically involves two main stages: screening titles and abstracts, followed by full-text review, both conducted against predefined eligibility criteria. To minimize the risk of bias, this process should be performed independently by at least two reviewers, with disagreements resolved by a third reviewer. Emphasizing a double-screening approach is crucial, as evidence indicates that single-reviewer screening is associated with the omission of a significant number of eligible studies [14].
However, manually screening hundreds—or even thousands—of records is highly resource-intensive and, in some cases, may become impractical. To address this challenge, various web-based screening tools have been developed to improve efficiency and manageability. Popular examples include Abstrackr [15], Rayyan [16], Covidence [17], and EPPI-Reviewer [18] which facilitate collaborative screening, streamline decision tracking, and reduce reviewer workload without compromising methodological rigor.
The overall results of the screening and selection process are typically summarized using the PRISMA flow diagram (Figure 1), which visually documents each step of the process.
This includes the total number of records identified (reported separately for each database and source), the number of records remaining after duplicate removal, the number of records excluded during title and abstract screening, the number of full-text articles assessed for eligibility, and the number of full-text articles excluded—along with the reasons for their exclusion. Finally, it reports the number of studies included in the qualitative synthesis (e.g., narrative review) and, where applicable, the quantitative synthesis (meta-analysis).
To improve the overall quality, researchers are encouraged to provide, as supplementary material, a dataset listing all studies retrieved, screened, included, or excluded, along with detailed reasons for exclusion at each stage of the selection process.
6. Data Extraction
Data extraction is the systematic collection of information from included studies. This step should be guided by a predefined data extraction form, often piloted on a subset of studies to ensure clarity and consistency. Essential data typically extracted include: study identifiers (authors, year, journal);study design (e.g., RCT, cohort, case-control); population characteristics (e.g., sample size, demographics); intervention and comparator details; outcomes measured and timepoints; results (e.g., effect sizes, confidence intervals); funding sources and potential conflicts of interest Similarly to the study screening and selection process, data extraction should be performed independently by at least two researchers, as evidence indicates that relying on a single extractor can lead to 21% more errors compared to a double-extraction approach [19]. Although this method nearly doubles the time required compared to a single-extractor approach, the substantial improvement in accuracy and reduction in errors justifies the additional effort. [19]. Readers should be aware that various tools such as EPPI-Reviewer, Covidence, and Excel-based templates can support data extraction.
7. Assessing Risk of Bias
Evaluating the methodological quality of included studies is a cornerstone of a rigorous systematic review, as it directly influences the reliability and validity of the review’s conclusions. Several standardized tools have been developed to assess the risk of bias in different types of studies (Table 1) [20].
For randomized controlled trials (RCTs), the most widely recommended tools are the Cochrane Risk of Bias 2 (RoB 2) tool and the Jadad scale, with RoB 2 offering a more comprehensive, domain-based assessment. For non-randomized studies of interventions, tools such as ROBINS-I (Risk Of Bias In Non-randomized Studies - of Interventions) and ROBINS-E (for exposures) are commonly used, alongside the older but still widely applied Newcastle-Ottawa Scale (NOS).
For diagnostic accuracy studies, the QUADAS-2 tool is the standard. When dealing with qualitative studies, researchers frequently employ the CASP (Critical Appraisal Skills Programme) checklists. For preclinical animal studies, the SYRCLE Risk of Bias tool is specifically designed to capture methodological concerns relevant to laboratory-based research.
Each tool is structured around a set of domains that reflect potential sources of bias relevant to the study design. While the specific domains vary between tools, they commonly assess areas such as:
- (1)
- Selection bias (e.g., randomization, allocation concealment)
- (2)
- Performance bias (e.g., blinding of participants and personnel)
- (3)
- Detection bias (e.g., blinding of outcome assessors)
- (4)
- Attrition bias (e.g., incomplete outcome data)
- (5)
- Reporting bias (e.g., selective outcome reporting)
The assessment of each domain typically involves assigning a judgment categorized as low risk, high risk, or unclear risk of bias, often visually represented by colors (e.g., green for low risk, yellow for unclear, and red for high risk). Some tools, such as RoB 2 and ROBINS-I, generate an overall risk of bias judgment for each study based on domain-level assessments, while others, like the Newcastle-Ottawa Scale, provide a score without a formal overall risk category. The results of risk of bias assessments are commonly presented in summary tables or graphical displays, such as traffic light plots or weighted bar charts. However, to enhance transparency and allow readers to fully understand how judgments were made, researchers should also provide detailed justifications for each risk of bias judgment assigned to each domain for every included study. Ideally, these justifications should be made available in the main text, appendices, or as supplementary material. the process should be conducted independently by at least two reviewers to minimize subjective judgment and ensure reliability.
8. Data Synthesis -Quantitative Synthesis (Meta-Analysis)
When a group of studies addressing the same research question are sufficiently similar in terms of participants, interventions, comparators, and outcomes, it is often appropriate to conduct a meta-analysis. Meta-analysis is a statistical technique that combines the results of individual studies to produce a single pooled estimate of the effect size, thereby increasing the overall statistical power and providing a more precise estimate than any single study alone. This approach also allows researchers to explore variability among study results and can offer insights into patterns that may not be apparent from individual studies.
A fundamental aspect of meta-analysis is the choice of the appropriate effect measure. Commonly used effect measures include the risk ratio (RR), odds ratio (OR), and hazard ratio (HR) for dichotomous outcomes, while continuous outcomes are often summarized using the mean difference (MD) or standardized mean difference when different scales are used. Selecting the correct effect measure depends on the nature of the outcome data and the clinical question. Another critical consideration is the degree of heterogeneity among the included studies. Heterogeneity refers to the variation in study outcomes beyond what would be expected by chance alone. It can arise from differences in study populations, interventions, outcome definitions, or study quality. The most commonly used statistic to quantify heterogeneity is the I² statistic, which represents the percentage of total variation across studies due to heterogeneity rather than chance. According to guidelines proposed by Higgins and colleagues (2003) [21], I² values of approximately 25%, 50%, and 75% are interpreted as low, moderate, and high heterogeneity, respectively. Understanding the extent of heterogeneity is crucial because it influences the choice of the meta-analytic model and the interpretation of pooled results.
Regarding model choice, two primary approaches exist: fixed-effect and random-effects models. Fixed-effect models operate under the assumption that all included studies estimate the same underlying effect size, and observed differences are due solely to sampling error. In contrast, random-effects models acknowledge that true effect sizes may vary across studies due to genuine clinical or methodological differences and therefore incorporate this variability into the pooled estimate. When heterogeneity is substantial, random-effects models are generally preferred as they provide more conservative estimates with wider confidence intervals. For this reason, fixed effects models should be preferred over random effect models only if researchers are absolutely certain that all the studies included do not have confounding effects or heterogeneity, a situation that rarely takes place.
Finally, assessing publication bias is a crucial step in meta-analysis to determine whether the included studies disproportionately represent positive or statistically significant findings, which can lead to an overestimation of the true effect. One common method for detecting publication bias is the funnel plot [22], a scatterplot that displays individual study effect sizes against a measure of their precision, typically the standard error or sample size. The underlying principle of funnel plots is that smaller studies, which have less precise estimates, should show a wider spread of effect sizes, while larger studies with greater precision tend to cluster closer to the true effect. In the absence of bias, the plot should resemble a symmetrical inverted funnel.
Funnel plots are primarily evaluated through visual inspection for asymmetry, which may suggest the presence of publication bias or other small-study effects. However, visual interpretation can be subjective and inconsistent. Therefore, when there are a sufficient number of studies (usually ten or more), statistical tests such as Egger’s regression test can be employed to provide a more objective and reproducible assessment of funnel plot asymmetry [23].
9. Data Synthesis -Qualitative Synthesis (Narrative Synthesis)
When conducting a systematic review, a meta-analysis may not be feasible or appropriate when there is substantial heterogeneity across studies—whether in terms of interventions, populations, outcome measures, or study designs—or when the available data are insufficient for meaningful quantitative synthesis, particularly when key outcomes are reported in too few studies or with inconsistent measures. In such cases, researchers should perform a narrative synthesis, which involves systematically summarizing and explaining the findings without statistically combining them. This approach typically organizes results thematically, categorically, or according to key characteristics such as intervention type, population group, or outcome domain.
To improve the rigor and transparency of narrative syntheses, the SWiM (Synthesis Without Meta-analysis) guideline was developed [24]. SWiM provides structured recommendations on how to transparently report the methods used for grouping studies, how findings are synthesized, and how certainty in the evidence is assessed. In particular, key components of SWiM include detailed descriptions of how studies were grouped or clustered for synthesis, the criteria and rationale for combining or comparing results, and the approach used to assess the certainty of evidence. SWiM also emphasizes the importance of reporting how data were extracted and how any quantitative transformations were conducted when applicable, such as when effect sizes are calculated but not pooled.
Another important aspect of SWiM is promoting clarity in presenting results, encouraging authors to use tables and figures effectively to summarize study characteristics and findings. This helps readers understand the evidence without relying solely on textual descriptions, which can sometimes be ambiguous or incomplete. The guideline also advocates for explicit discussion of the limitations of the narrative synthesis approach, including potential biases and challenges arising from lack of statistical pooling.
10. Assessing Certainty of Evidence
One of the final and most critical steps in conducting a systematic review is the assessment of the certainty of evidence, which reflects the degree of confidence that the estimated effect is close to the true effect. The GRADE (Grading of Recommendations, Assessment, Development and Evaluation) approach is the internationally recognized standard for evaluating the certainty of evidence [25] and should be applied in systematic reviews regardless of whether a meta-analysis is performed or not. GRADE provides a structured and transparent framework to assess the strength of evidence based on key domains, ensuring that the conclusions of the review are well-founded, even when quantitative synthesis is not feasible [24].
GRADE assesses certainty based on five key domains. The first is risk of bias, which considers whether limitations in study design or execution may have introduced systematic errors. The second is inconsistency, which refers to unexplained heterogeneity or variability in results across studies. The third domain, indirectness, evaluates the applicability of the evidence to the research question, particularly when there are differences in populations, interventions, or outcomes. The fourth domain is imprecision, which addresses whether the evidence is weakened by wide confidence intervals or small sample sizes that reduce the reliability of the effect estimate. Finally, publication bias assesses whether the available evidence might be skewed due to the selective publication of studies with positive or significant findings.
Based on an assessment of these domains, the certainty of evidence is classified into one of four levels: high, moderate, low, or very low. High-certainty evidence indicates strong confidence that the true effect lies close to the estimate, while very low certainty reflects considerable uncertainty about the effect estimate. The results of the GRADE assessment are commonly presented in a Summary of Findings (SoF) table, which succinctly displays the main outcomes, effect sizes, confidence intervals, and corresponding GRADE ratings.
11. Reporting the Systematic Review
Once the SR has been completed, the next crucial step is to report it in a clear, transparent, and comprehensive manner. Fortunately, researchers can rely on the PRISMA 2020 reporting guideline (Preferred Reporting Items for Systematic Reviews and Meta-Analyses) [26], which provides a structured framework to ensure that all essential components of the review are adequately reported. Adhering strictly to PRISMA enhances both the transparency and reproducibility of the review process. The PRISMA 2020 checklist consists of 27 items covering all sections of a systematic review, from title and abstract to methods, results, and discussion. Researchers are strongly encouraged to carefully read the checklist before drafting the manuscript and to complete it thoroughly prior to submission to a peer-reviewed journal. It is highly recommended that researchers annotate the checklist not only with the corresponding page and line numbers but also by including the exact sentences or sections that address each item. This practice greatly facilitates the work of editors, peer reviewers, and other research teams in verifying compliance with reporting standards, further strengthening the credibility, clarity, and transparency of the systematic review.
12. Conclusions
The responsibility of conducting a high-quality systematic review lies firmly with researchers. Beyond simply aggregating studies, researchers must engage in several steps that have to be planned at the real beginning of the development of a meta analysis as we have tried to illustrate in our review. Accurate planning, rigorous methodology and transparent reporting are the key-components to produce evidence that is both credible and useful. High-quality systematic reviews are foundational to evidence-based medicine, informing clinical decision-making, shaping community policies, and guiding future research priorities. Without strict adherence to internationally recognized best practices, systematic reviews risk bias, irreproducibility, and ultimately, misleading conclusions that could affect patient care and resource allocation. Several tools have been developed to help researchers in this hard work such as the PRISMA 2020 guideline, the Cochrane Handbook for Systematic Reviews of Interventions, and the GRADE approach enhances the methodological rigor and transparency of reviews. PRISMA ensures comprehensive and standardized reporting, making the review accessible and interpretable to a wide audience, including clinicians, policymakers, and fellow researchers. The Cochrane Handbook offers detailed guidance on every stage of the review process, from framing the research question and designing search strategies to assessing risk of bias and synthesizing evidence. Meanwhile, GRADE provides a systematic method to evaluate the certainty of evidence, helping stakeholders understand how confident they can be in the findings.
Moreover, researchers have an ethical obligation to minimize bias and maximize transparency throughout the review. This includes pre-registering protocols, conducting thorough and unbiased literature searches, independently screening and extracting data, and openly sharing data and analytic methods. Such transparency facilitates reproducibility and critical appraisal, strengthening trust in the findings. Additionally, acknowledging and addressing limitations—whether in study quality, heterogeneity, or publication bias—demonstrates intellectual honesty and allows readers to interpret results within the appropriate context.
Ultimately, high-quality systematic reviews serve as powerful tools that synthesize vast amounts of information into actionable knowledge. By committing to excellence in their conduct, researchers ensure that these reviews remain invaluable resources that advance science and inform policies that affect lives worldwide.
Author Contributions
Conceptualization, A.D.C. and B.D.; methodology, A.D.C.; resources, A.D.C. and B.D.; writing—original draft preparation, A.D.C., B.D., S.T., A.B.; writing—review and editing, A.D.C., B.D., S.T., A.B.; visualization, A.B.; supervision, A.B.; project administration, A.D.C. All authors have read and agreed to the published version of the manuscript.
Funding
This research received no external funding.
Institutional Review Board Statement
Not applicable.
Informed Consent Statement
Not applicable.
Data Availability Statement
All data referenced in the manuscript are fully available within the manuscript itself.
Acknowledgments
None.
References
- Murad, M.H.; Asi, N.; Alsawas, M.; Alahdab, F. New evidence pyramid. BMJ Evid.-Based Med. 2016, 21, 125–127. [CrossRef]
- Pussegoda, K.; Turner, L.; Garritty, C.; et al. Systematic review adherence to methodological or reporting quality. Syst. Rev. 2017, 6, 131. [CrossRef]
- Mayo, N.E.; Asano, M.; Barbic, S.P. When is a research question not a research question? J. Rehabil. Med. 2013, 45, 513–518. [CrossRef]
- Schardt, C.; Adams, M.B.; Owens, T.; Keitz, S.; Fontelo, P. Utilization of the PICO framework to improve searching PubMed for clinical questions. BMC Med. Inform. Decis. Mak. 2007, 7, 16. [CrossRef]
- Cooke, A.; Smith, D.; Booth, A. Beyond PICO: the SPIDER tool for qualitative evidence synthesis. Qual. Health Res. 2012, 22, 1435–1443. [CrossRef]
- Methley, A.M.; Campbell, S.; Chew-Graham, C.; et al. PICO, PICOS and SPIDER: a comparison study of specificity and sensitivity in three search tools for qualitative systematic reviews. BMC Health Serv. Res. 2014, 14, 579. [CrossRef]
- Davies, K.S. Formulating the Evidence Based Practice Question: A Review of the Frameworks. Evid.-Based Libr. Inf. Pract. 2011, 6, 75–80. [CrossRef]
- Booth, A.; Clarke, M.; Dooley, G.; et al. The nuts and bolts of PROSPERO: an international prospective register of systematic reviews. Syst. Rev. 2012, 1, 2. [CrossRef]
- Frost, A.D.; Hróbjartsson, A.; Nejstgaard, C.H. Adherence to the PRISMA-P 2015 reporting guideline was inadequate in systematic review protocols. J. Clin. Epidemiol. 2022, 150, 179–187. [CrossRef]
- Page, M.J.; McKenzie, J.E.; Forbes, A. Many scenarios exist for selective inclusion and reporting of results in randomized trials and systematic reviews. J. Clin. Epidemiol. 2013, 66, 524–537. [CrossRef]
- Frandsen, T.F.; Bruun Nielsen, M.F.; Lindhardt, C.L.; Eriksen, M.B. Using the full PICO model as a search tool for systematic reviews resulted in lower recall for some PICO elements. J. Clin. Epidemiol. 2020, 127, 69–75. [CrossRef]
- Duyx, B.; Swaen, G.M.H.; Urlings, M.J.E.; Bouter, L.M.; Zeegers, M.P. The strong focus on positive results in abstracts may cause bias in systematic reviews: a case study on abstract reporting bias. Syst. Rev. 2019, 8, 174. [CrossRef]
- Higgins, J.P.T.; Thomas, J.; Chandler, J.; et al., Eds. Cochrane Handbook for Systematic Reviews of Interventions, Version 6.3; Cochrane: London, UK, 2022. https://training.cochrane.org/handbook.
- Gartlehner, G.; Affengruber, L.; Titscher, V.; Noel-Storr, A.; Dooley, G.; Ballarini, N.; et al. Single-reviewer abstract screening missed 13 percent of relevant studies: a crowd-based, randomized controlled trial. J. Clin. Epidemiol. 2020, 121, 20–28. [CrossRef]
- Rathbone, J.; Hoffmann, T.; Glasziou, P. Faster title and abstract screening? Evaluating Abstrackr, a semi-automated online screening program for systematic reviewers. Syst. Rev. 2015, 4, 80. [CrossRef]
- Ouzzani, M.; Hammady, H.; Fedorowicz, Z.; Elmagarmid, A. Rayyan: a web and mobile app for systematic reviews. Syst. Rev. 2016, 5, 210. [CrossRef]
- Covidence systematic review software. Veritas Health Innovation, Melbourne, Australia. Available online: www.covidence.org (accessed on 27 June 2025).
- Thomas, J.; Brunton, J.; Graziosi, S. EPPI-Reviewer 4.0: software for research synthesis. EPPI Centre Software, London, UK, 2010.
- Buscemi, N.; Hartling, L.; Vandermeer, B.; Tjosvold, L.; Klassen, T.P. Single data extraction generated more errors than double data extraction in systematic reviews. J. Clin. Epidemiol. 2006, 59, 697–703. [CrossRef]
- De Cassai, A.; Boscolo, A.; Zarantonello, F.; Pettenuzzo, T.; Sella, N.; Geraldini, F.; Munari, M.; Navalesi, P. Enhancing study quality assessment: an in-depth review of risk of bias tools for meta-analysis—A comprehensive guide for anesthesiologists. J. Anesth. Analg. Crit. Care 2023, 3, 44. [CrossRef]
- Higgins, J.P.T.; Thompson, S.G.; Deeks, J.J.; Altman, D.G. Measuring inconsistency in meta-analyses. BMJ 2003, 327, 557–560. [CrossRef]
- Sterne, J.A.; Sutton, A.J.; Ioannidis, J.P.; Terrin, N.; Jones, D.R.; Lau, J.; Carpenter, J.; Rücker, G.; Harbord, R.M.; Schmid, C.H.; Tetzlaff, J.; Deeks, J.J.; Peters, J.; Macaskill, P.; Schwarzer, G.; Duval, S.; Altman, D.G.; Moher, D.; Higgins, J.P. Recommendations for examining and interpreting funnel plot asymmetry in meta-analyses of randomised controlled trials. BMJ 2011, 343, d4002. [CrossRef]
- Lin, L.; Chu, H. Quantifying publication bias in meta-analysis. Biometrics 2018, 74, 785–794. [CrossRef]
- Campbell, M.; McKenzie, J.E.; Sowden, A.; Katikireddi, S.V.; Brennan, S.E.; Ellis, S.; Hartmann-Boyce, J.; Ryan, R.; Shepperd, S.; Thomas, J.; Welch, V.; Thomson, H. Synthesis without meta-analysis (SWiM) in systematic reviews: reporting guideline. BMJ 2020, 368, l6890. [CrossRef]
- Guyatt, G.H.; Oxman, A.D.; Vist, G.E.; et al. GRADE: An emerging consensus on rating quality of evidence and strength of recommendations. BMJ 2008, 336, 924–926. [CrossRef]
- Moher, D.; Liberati, A.; Tetzlaff, J.; Altman, D.G.; PRISMA Group. Preferred reporting items for systematic reviews and meta-analyses: The PRISMA statement. PLoS Med. 2009, 6, e1000097. [CrossRef]
Figure 1.
Illustrative example of a PRISMA flowchart.
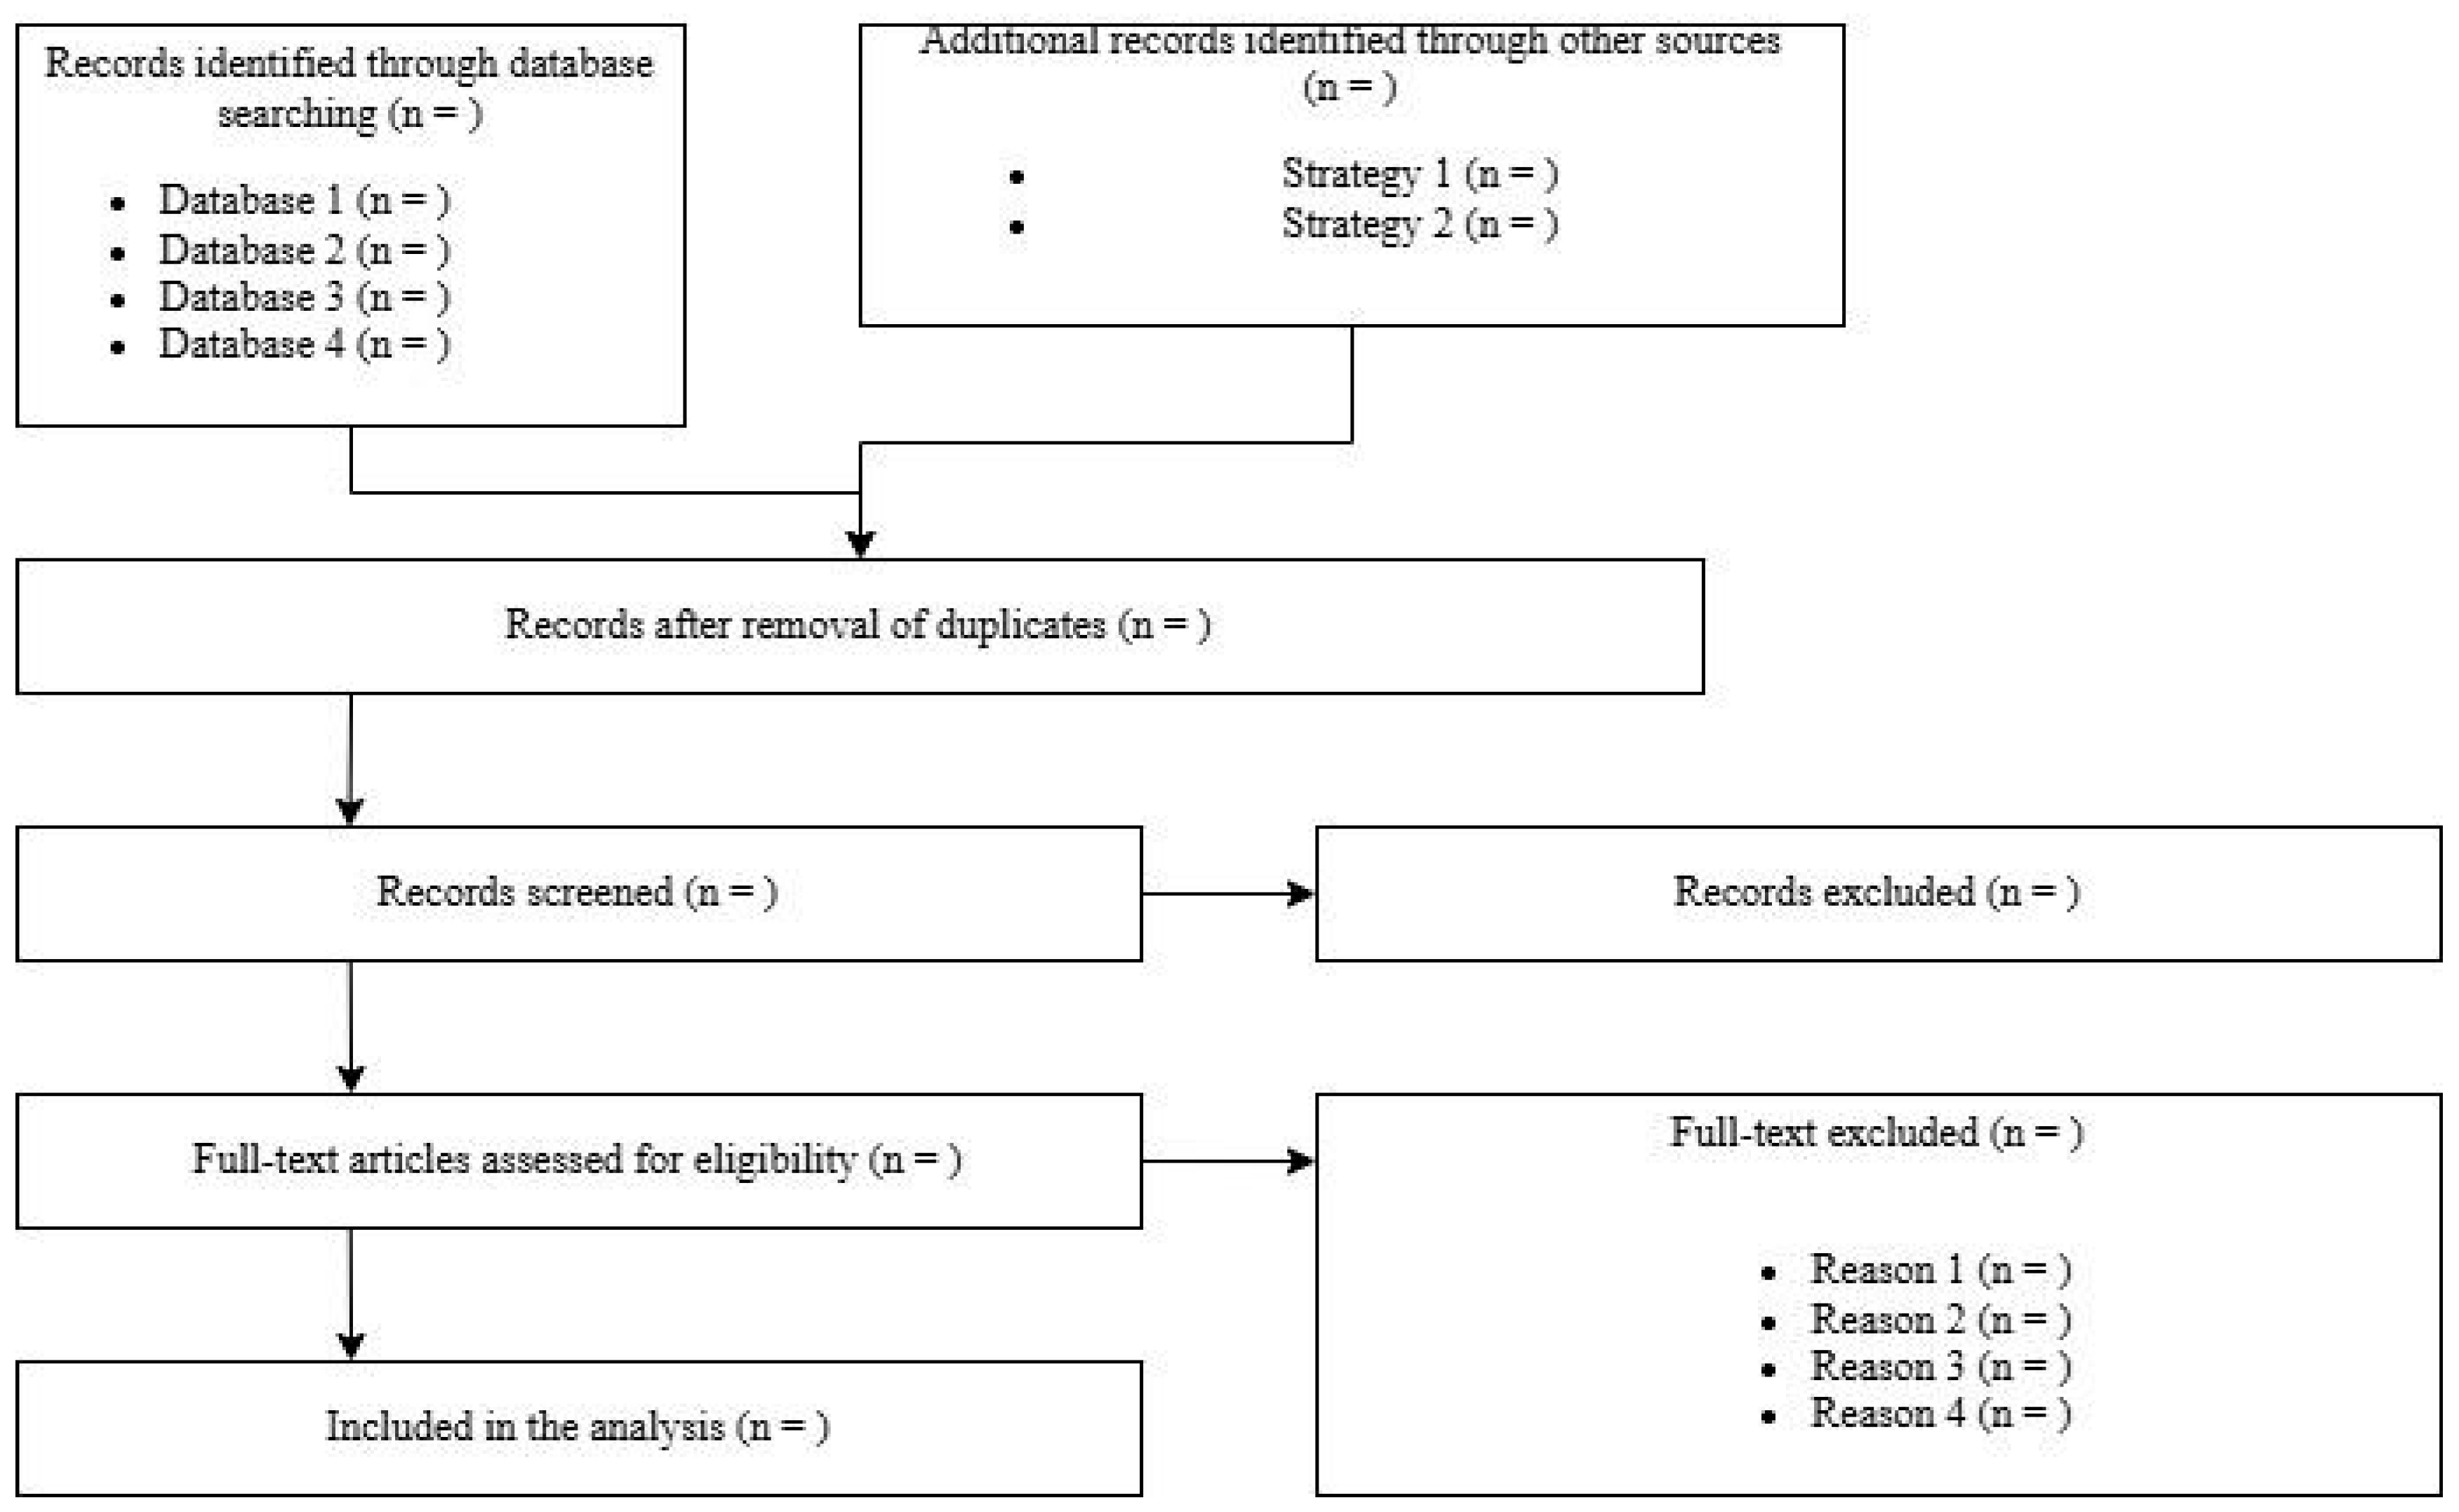

Table 1.
Risk of bias tools.
| Risk of Bias Tool | Study Type |
| Cochrane Risk of Bias 2 (RoB 2) | Randomized Controlled Trials |
| Jadad Scale | Randomized Controlled Trials |
| ROBINS-I (Risk Of Bias In Non-randomized Studies - of Interventions) | Non-Randomized Intervention Studies |
| ROBINS-E (Risk Of Bias In Non-randomized Studies - of Exposures) | Observational Exposure Studies (Cohort, Case-Control) |
| Newcastle-Ottawa Scale (NOS) | Cohort and Case-Control Studies |
| QUADAS-2 (Quality Assessment of Diagnostic Accuracy Studies) | Diagnostic Accuracy Studies |
| CASP (Critical Appraisal Skills Programme) | Qualitative Studies |
| SYRCLE Risk of Bias Tool | Animal Intervention Studies |
| ROBINS-C (Risk Of Bias In Non-randomized Studies - of Cohorts) | Cohort Studies |
| AMSTAR 2 (A Measurement Tool to Assess Systematic Reviews) | Systematic Reviews and Meta-Analyses |
| MINORS (Methodological Index for Non-Randomized Studies) | Non-Randomized Surgical Studies |
| Effective Public Health Practice Project (EPHPP) Quality Assessment Tool | Public Health Intervention Studies |
| Joanna Briggs Institute (JBI) Critical Appraisal Tools | Various Study Designs |
| ROBIS (Risk of Bias in Systematic Reviews) | Systematic Reviews |
| AXIS Tool | Cross-Sectional Studies |
Disclaimer/Publisher’s Note: The statements, opinions and data contained in all publications are solely those of the individual author(s) and contributor(s) and not of MDPI and/or the editor(s). MDPI and/or the editor(s) disclaim responsibility for any injury to people or property resulting from any ideas, methods, instructions or products referred to in the content. |
© 2025 by the authors. Licensee MDPI, Basel, Switzerland. This article is an open access article distributed under the terms and conditions of the Creative Commons Attribution (CC BY) license (http://creativecommons.org/licenses/by/4.0/).
Copyright: This open access article is published under a Creative Commons CC BY 4.0 license, which permit the free download, distribution, and reuse, provided that the author and preprint are cited in any reuse.


