Submitted:
01 July 2025
Posted:
02 July 2025
You are already at the latest version
Abstract
The collaborative support of "source storage" resources becomes a key condition when human error leads to islanding operation. This paper proposes an optimization method for the coordinated support of distributed power sources and energy storage in the scenario of islanding operation of distribution systems caused by human error. A comprehensive error probability model was established by analyzing probability models of human operational errors based on skills, rules, and knowledge. A comprehensive self-healing performance evaluation model was constructed using entropy weight method, taking into account core indicators such as load recovery rate, self-healing speed, and operational complexity. Considering the random output of distributed generation, energy storage system constraints, and network topology requirements, a "source-storage" resource collaborative support optimization model is constructed for islanding operation of distribution systems, with the goal of maximizing load recovery rate while minimizing switch operations and power losses. The improved particle swarm optimization algorithm effectively avoids local optima by dynamically adjusting the particle concentration and velocity update strategy. The simulation results based on IEEE-33 distribution network show that this method can quickly restore power supply to critical loads after faults, reduce power loss and fault recovery time, and significantly improve the self-healing performance of the distribution network.
Keywords:
distribution system
; "source-storage" resource
; coordination cupport
; island operation
; human misoperation
; Improved particle swarm optimization algorithm
1. Introduction
In recent years, against the backdrop of intelligent upgrading of equipment in distribution networks and continuous innovation in anti misoperation device technology, coupled with the standardization of anti misoperation operation systems and the refinement of management systems, the field of anti misoperation management has shown a development trend of “dual wheel drive of technology and management” [1,2,3,4,5,6,7,8]. It is worth noting that during this process, the behavior control of operators has gradually become a core issue in the construction of error prevention systems. As the only element with subjective initiative in the human-machine environmental management system, personnel behavior has become the most challenging governance dimension in modern error prevention management systems due to its dynamic, differential, and uncertain characteristics [9,10,11,12,13,14,15,16,17,18]. Human error not only caused large-scale power outages, but also resulted in significant economic losses [19,20,21,22,23]. In the 2019 California PG&E power outage scandal, PG&E cut off power without sufficient warning to avoid wildfire risks, affecting millions of users and exposing equipment aging and chaotic emergency management. The cause of the 2020 Queensland substation fire in Australia was the aging of insulation due to long-term lack of maintenance of equipment, and the failure of maintenance personnel to replace it in a timely manner, ultimately leading to the fire and causing regional power supply interruption. The cause of the 2021 Texas power grid misoperation incident was due to insufficient equipment maintenance and operational coordination errors by the Texas Power Grid Operator (ERCOT) during the disaster, resulting in overloaded operation of the power grid and ultimately causing widespread power outages throughout the state, affecting millions of people and causing economic losses exceeding billions of dollars [24,25,26,27,28]. From this, it can be seen that it is important to quickly restore the operation of the power grid under the influence of human operation errors. Therefore, it is of great significance to effectively utilize distributed power sources to connect to the grid for power supply after human operation errors, in order to ensure the normal power supply of important loads [29,30,31,32,33,34,35,36,37,38,39].
At present, some scholars have conducted research on how distributed power sources can quickly restore power supply after a fault occurs in the distribution network. Reference [40] proposes a particle swarm optimization algorithm for “breaking the loop” to achieve a coordinated optimization scheme of new energy access carrying capacity and line loss during the fault self-healing process. Reference [41] established an optimization configuration model for distributed power generation with the objective functions of minimizing the total investment and operation cost of distributed power generation, minimizing the total active power loss of the distribution network, and minimizing the node voltage deviation. The particle swarm optimization algorithm with adaptive weight update strategy was applied to the established multi-objective optimization model for solution analysis. Reference [42] proposes a fault recovery strategy for distribution networks based on the quantum firefly algorithm to address the issues of low efficiency and susceptibility to local convergence when dealing with high penetration distributed photovoltaic grid connections. Reference [43] proposes a fault recovery method for distribution networks based on an improved particle swarm algorithm to address the challenges posed by the uncertainty of distributed power sources and changes in load demand. Reference [44] proposes an active fault recovery method for distribution networks based on hybrid reinforcement learning to address the problem of fault recovery in the cases with high proportion new energy. Reference [45] proposes a fault recovery and reconstruction strategy for distribution networks that takes into account the results of island partitioning based on niche genetic algorithm. Reference [46] proposes a dual layer fault recovery strategy for distribution networks, aimed at addressing the coordination between islanding and reconstruction in fault recovery. The goal is to maximize the total power of important loads and minimize power losses. Reference [47] proposes a restoration and reconstruction method for distribution networks based on an improved quantum particle swarm algorithm to address the issue of the inability of existing restoration and reconstruction methods for complex and large-scale distribution networks due to the extensive integration of distributed power sources. Reference [48] proposed a coordinated optimization strategy for emergency recovery and repair of distribution network faults containing distributed power sources, and constructed a fault repair model with the comprehensive objective function of minimizing repair time and social and economic losses. Reference [49] proposed a fault location and self-healing strategy for distribution networks based on improved genetic algorithms, which can accurately identify fault locations in distribution networks with multiple distributed power sources. By establishing a fault recovery model, heuristic rules, and a candidate solution set for fault recovery, the goal of fault recovery has been achieved.
In response to the above issues, this paper proposes a self-healing control method for human operation errors in distribution networks based on an improved particle swarm algorithm. After human operation errors cause faults in the distribution system, considering the output randomness of distributed power sources, energy storage system constraints, and network topology requirements, a multi-objective optimization model is constructed with the objectives of maximizing load recovery rate, minimizing switch action times, and minimizing power losses, and an improved particle swarm algorithm is introduced for solution. Dynamically adjusting the particle concentration and velocity update strategy enhances the search and solving capabilities of the improved algorithm, effectively avoiding local optima problems. The simulation results based on IEEE-33 distribution system show that the proposed method can quickly restore power supply to important loads after faults, reduce the number of switch operations and power losses, and significantly improve the self-healing performance of the distribution network.
2. Probability of Human Error in Operation Failure
2.1. Classification of Human Operation Errors
In the operation of the distribution network, human operational errors can be divided into three categories: skill errors, rule-based errors, and knowledge-based reasoning errors.
Skill errors refer to errors caused by operational habits or interface design flaws, and their probability is expressed as follows:
where represents the probability of skill errors, represents the number of erroneous operations, represents the total number of operations, represents interface complexity, and represent weight coefficients, and it is defined , .
Rule errors refer to errors caused by misjudgments in process logic or deviations in signal interpretation. The probability of regular errors can be expressed as:
where represents the probability of regular errors; represents the training duration of operators; represents the comprehensive evaluation index of the number of process steps and branch logic; represents the maximum possible value of process complexity; , , represent fitting parameters, and are defined here as , , and .
Errors refer to errors caused by insufficient technical knowldge or self-healing logical understanding deviations, and their probability is expressed as follows:
where represents the probability of knowledge errors, represents the test score of the operator’s professional knowledge, represents the full score of the professional knowledge test, represents the complexity index of the strategy logic, such as the number of conditional branches, nested layers, etc. and represent weight parameters, defined here as and .
2.2. Comprehensive Probability Model
The comprehensive probability model for human operation errors needs to combine the probabilities of three types of errors (skill based, rule-based, and knowledge-based), and the total probability of misoperation is represented by the following formula:
3. The Indicators for Evaluating Self Healing Control of Human Errors
3.1. Core Evaluation Indicators
3.1.1. Self-Healing Recovery Rate
The load repair rate represents the ability to restore power to the load after a fault occurs. The higher the load repair rate, the greater the ability to restore detached loads. The load repair rate is expressed using the formula in reference [50] as:
where represents the duration of the fault, is the time interval, which is related to the accuracy of the power data; represents the weighting coefficient factor for different categories of loads; represents the load recovered during the self-healing process; represents the load power after the fault occurs.
3.1.2. Self-Healing Speed
The self-healing speed includes four parts, including fault reporting, localization, isolation, and repair. The self-healing speed is defined as the time between a fault report and power restoration in a non fault area:
where represents the time for fault repair; represents the fault location time, which depends on the automation level of the distribution network; and represent the isolation time of the fault and the recovery time of the non fault area, which are related to the self-healing strategy adopted.
3.1.3. The Complexity of Self-Healing Operations
It is important to ensure that the system maintains radial operation after power restoration is completed when designing self-healing strategies. In addition, during the self-healing process, it is necessary to consider the sequential connection of loads and distributed power sources. Frequent switching operations reduce the service life of switchgear and lower the quality of electrical energy due to the impact on the power grid. Therefore, in order to achieve better self-healing performance, it is necessary to minimize switching operations as much as possible. The occurrence of switch operations is used to measure the complexity of self-healing. This complexity can be represented by the following equation:
where is a switch set of distribution network; is a set of loads; is a set of distributed power sources; is the duration of the fault; represents the state of switch at time , with 1 when the switch is closed and 0 when it is open; represents the operational status of load at time ; represents the operational status of distributed power sources at time .
3.2. Comprehensive Evaluation Indicators
Considering the above three indicators, the entropy weight method [51] can be introduced to comprehensively evaluate the self-healing performance. Due to inconsistent data units, normalization is required. Assuming that the data matrix is a matrix, and its element serves as a self-healing performance indicator, it can be represented by the following equation:
By calculation, the weight of the data in the indicator can be determined:
The entropy value of each indicator can be determined using the following equation:
The weight of each indicator can be calculated using information entropy:
By calculation, the comprehensive self-healing performance of the system can be determined:
4. Power Model of Distributed Sources
4.1. Probability Model for Photovoltaic Power Generation
The probability model of the output power of photovoltaic power generation system shows that the illumination intensity approximately follows a Beta distribution, which can be represented by the equation in reference [52]:
where represents the light intensity within a given time period; represents the maximum light intensity within a given time period; represents the gamma function; and represent Beta distribution shape parameters; represents the active power of the photovoltaic power generation system.
Active power of a photovoltaic power generation system can be represented by the following equation:
where represents the area of the solar panel, and represents the conversion efficiency.
4.2. Probability Model for Wind Power Generation
The output power of wind turbines conforms to the characteristics of Weibull distribution, which can be represented by the following equation:
where and represent Weibull parameters.
The functional relationship between the output power AA of a wind turbine and the wind speed is formulated:
where is the rated power of the wind turbine unit; is the cutting-in wind speed; is the rated wind speed; is the cutting-out wind speed.
4.3. State of Charge Function of Battery
The state of charge of a battery is a mathematical or physical tool used to describe and simulate the operating characteristics of a battery in a distribution network, typically covering parameters such as energy storage capacity, charging and discharging efficiency, cycle life, dynamic response, and cost. Combining batteries with the operational needs of the power grid, optimizing control strategies to achieve time shifted storage and release of electrical energy, thereby improving grid stability, promoting the consumption of new energy, reducing peak valley differences, and supporting auxiliary services such as voltage regulation and backup power supply, battery is a key component of intelligent distribution network planning and operation analysis. The state of charge function of a battery can be expressed as follows:
5. Island Partitioning Method
5.1. The Objective Function for Island Partitioning
The islanding division is aimed at simulating the ability of distributed power sources in the distribution network to maintain power balance under islanding operation, including real-time matching of load power and generation power, fault isolation and restoration of grid connection, etc., to ensure the reliability of power supply for critical loads. To achieve this, the following function can be constructed with the goal of restoring power supply to important loads:
where represents the switch; represents the island; represents the set of switch for isolated island ; represents the status of the switch; represents the priority of the switch connected to the load; represents the load connected to the switch.
5.2. The Constraints
1) Constraint Conditions for Node Voltage
The node voltage cannot exceed its maximum allowable value or be less than its minimum allowable value:
2) Constraint Conditions for Branch Current
The branch current cannot exceed its maximum allowable value or be less than its minimum allowable value:
where and is the minimum and maximum currents allowed for branch currents, respectively.
3) Constraints on Island Capacity
where represents the total load power of the island; represents the total installed capacity of distributed power sources in the island.
4) Constraints on Island Connectivity
All nodes within each island (such as power sources, loads, etc.) must be interconnected through electrical paths to form a connected sub network, ensuring the feasibility and stability of power supply within the island, while strictly disconnecting direct connections with other islands.
5.3. Steps for Island Partitioning
The steps for the island partitioning is shown in Figure 1.
The steps for island partitioning are given as follows:
1)Determine the active power output of the distributed power source and the load level of power loss after the fault. After a fault occurs, the first step is to understand the available output power of distributed power sources, which includes understanding the types, capacities, and current operating status of each distributed power source. At the same time, according to the importance of the load, the load that has lost power is classified into different levels to ensure that the first level load can be prioritized for power restoration.
2)Starting from the layout nodes of distributed power sources, the breadth first search algorithm is used to search based on the active power output of distributed power sources during fault periods. Starting from the nodes arranged in the distributed power generation, expand the search layer by layer until reaching the limit of the output power of the distributed power generation. This method can quickly determine which loads can be included in the same island. If there is a situation of island crossing, island fusion should be carried out to avoid electrical interference between islands.
3)In the process of island partitioning, starting from important load nodes that have not been restored, Deep Optimal Search Algorithm is used to traverse the surrounding areas and assign them to the island with the closest electrical distance. Subsequently, it is necessary to verify the voltage and frequency stability constraints of the partitioned islands. If the verification fails, the secondary loads will be gradually reduced according to the load priority until the stability requirements for independent operation of the island are met, and a feasible island division plan will be ultimately determined. During this process, the island needs to maintain connectivity internally and be completely separated from the external network to ensure the autonomous power supply capability of the local area. This method can ensure that critical loads are prioritized for recovery while optimizing the partitioning of islands.
6. “Source-Storage” Resource Coordination Support Model
6.1. The Objective Function
An optimization model for self-healing control of human operational errors can be established with the objectives of maximizing load recovery rate, minimizing switch frequency, and minimizing power loss.
1) Maximizing Load Recovery Capacity
where is the duration of the fault; is the time interval, which is related to the accuracy of power data; is the weighting coefficient factor for loads of different categories; is the load recovered during the self-healing process.
2) Minimizing Switch Operation Number
where and represent the states before and after the action of the switch (0 is the open state, 1 is the closed state); represents the total number of switch
3) Minimizing Power Loss
where represents the total number of feeders; represents the on/off status of line ; represents the resistance of line ; represents the active power of line ; represents the reactive power of line ; represents the terminal node voltage of line .
Considering constraints such as current and capacity, a weighted summation method can be used to construct the objective function. By using the second-order cone relaxation method, the distribution network can be reconstructed and islanded, and a self-healing strategy has been designed. The objective function of the self-healing strategy is formulated as follows:
where , , and represent weight coefficients, .
6.2. The Constraints
The constraints include the output power of distributed power sources, transmission power of lines, power flow balance relationship, node voltage, branch current and network topology.
1) Output Power Constraints of Distributed Power Sources
A series of limiting conditions that distributed power sources must comply with during operation to ensure the safe, stable, and efficient operation of the power grid. Firstly, the output power of distributed power sources cannot exceed their maximum allowable value or be less than their minimum allowable value
where and represent the minimum and maximum allowable output power of distributed power sources.
2) Constraints on Energy Storage Systems
Energy storage system is a device or system used in the power system to store electrical energy and release it when needed. Energy storage systems play an important role in the power grid, which can improve the reliability, stability, and flexibility of grid operation. In the operation and planning of the power system, a series of constraints on the energy storage system need to be considered to ensure its safe, efficient, and economical operation. The control coefficients AA and BB for the discharge and charging of the energy storage system must meet the following conditions:
where represents the discharge state of the energy storage system at time ; represents the charging status of the energy storage system at time .
In addition, the energy storage system should also meet the constraints of the state of charge and charging and discharging power, ensuring that the energy storage works in a normal state and avoiding overcharging and overdischarging:
where and represent the upper and lower limits of the state of charge of the energy storage device; represents the rated power of the energy storage system.
3) Power Flow Equilibrium Equation.
Assuming that the power flow from the starting node to the ending node is positive. The self-healing strategy needs to meet the constraints on power flow:
where and represent sets of parent and child nodes. and represent the active power and reactive power from node to node ; and represent the resistance and reactance of the line; represents the load power at node , represents the active power of the output power of the distributed power source, and represents the removed load power.
4) Transmission Power Constraint of The Line
When a node is disconnected from the power grid during a fault, the current and power in the lines or branches associated with that node become zero. Under normal circumstances, to ensure that the transmission power of the line does not exceed the allowable limit of the line, the following constraints need to be met:
where is a sufficiently large constant, indicates the presence of connections between lines, and indicates the absence of connections between lines.
5) Constraints on Node Voltage and Line Current
To improve computational efficiency, constant can be used to simplify equation (33). In equation (35), it always holds when because , , and are all zero, which is equivalent to the original equation. The node voltage and branch current must meet the following constraints:
In the self-healing optimization problem model mentioned above, the existence of the constraint functions and the objective function with quadratic characteristics makes the calculation challenging and difficult to solve using traditional solving methods. Therefore, this paper adopts second-order cone relaxation method to perform reduced order relaxation processing. At this point, the relationship between active power, reactive power, voltage, and current can be represented by the following equation, and and is replaced by and , respectively, resulting in the following conversion equation:
6) Constraints on The Topology Structure of The Power Grid
The distribution network has unique characteristics, so its self-healing strategy needs to ensure that its topology structure maintains radial topology characteristics under normal operating conditions. This structural feature is crucial for ensuring the existence and uniqueness of power flow solutions. With the continuous increase in the number of distributed generation units (DGs), the complexity of power flow calculation has also correspondingly increased. This paper studies the island partitioning and network reconstruction methods of distribution networks. It should be noted that if the number of distributed power sources in the island partition is insufficient, it may result in the solution not being successful. In order to ensure the smooth progress of the calculation, it is necessary to eliminate fault states that do not match the power flow calculation model in the initial stage. Maintaining the integrity of radial networks requires two sufficient conditions: 1) each subgraph must remain connected; 2) The number of branches should be equal to the number of nodes minus the number of subgraphs. Due to the fact that traditional radial constraints do not allow for the existence of islands. In the second-order cone model, the radiation and connectivity constraints of the distribution network can be achieved by introducing virtual networks.
where represents the power transmitted in the virtual network, represents the power provided by the “source” node in the virtual network, is a set of branches, and is a set of distributed power sources.
6.3. The Solving Method and Steps
All existing PSO improvement strategies are derived from the framework of classical particle swarm optimization. The improvement method for PSO based on particle concentration gradient mechanism proposed in this article innovatively addresses the local convergence deficiency of classical algorithms. The core mechanism is that each particle acts as a mobile agent in the solution space, regulating its search trajectory through velocity vectors, and synchronously referencing the historical optimal position of the individual and the global optimal position of the group during the iteration process to explore the solution space. To break through the bottleneck of traditional algorithms easily falling into local optima, the improved algorithm in this paper introduces the mechanism of particle concentration gradient to dynamically adjust the distribution density of the population, and uses multi-dimensional collaborative update rules to achieve dynamic balance between global and local search. The innovative implementation path of this algorithm includes key technical links such as particle concentration evaluation, neighborhood information exchange, and inertia weight adaptation. By utilizing this innovative mechanism, a population diversity maintenance mechanism based on concentration feedback can be constructed.
The algorithm steps for maintaining population diversity based on concentration feedback are given as follows:
1)Initialization: Set the lower limit and the upper limit of the search space, configure learning factors and , the maximum number of iterations or convergence accuracy of the algorithm, and the particle velocity range . Randomly initialize the position and its velocity of the search point, and set the current position as for each particle. Find the global extremum from individual extremum, and label the particle with the best value as number and its position as .
2)Calculate the fitness value for each particle’s current position. If it is better than the individual historical optimal value of the particle, update the individual extreme value to the current position. Further compare all individual extreme values and select the current optimal solution. If it is better than the global extremum, update the global optimal position and corresponding particle number. This process provides directional guidance for subsequent searches by dynamically tracking the optimal solutions of individuals and groups.
3)Particle velocity update
The velocity of each particle is updated according to the following formula:
This formula can be used to adjust the particle velocity and limit its value to ensure that the particle velocity remains within this range: . Based on the updated particle velocity, the new particle position may be calculated to complete the evolution and update of the particle state by using the formula .
4)Introduce a concentration evaluation mechanism, calculate the spatial distribution density of particle swarm, and label high aggregation areas in order of concentration. For high-density particle swarm optimization, particle velocity vectors are redistributed based on concentration gradients, triggering secondary updates: by adjusting the search direction of some particles, these particles are forced to leave the local dense area, enhancing global exploration capability. This mechanism effectively suppresses premature particle aggregation and avoids falling into local optima.
5)If the current iteration number reaches or the global optimal solution changing value is less than the convergence accuracy, terminate the iteration and output as the final solution; Otherwise, return to step two to continue optimizing. This decision strategy balances computational efficiency and solution accuracy, ensuring that the algorithm obtains high-quality feasible solutions within limited resources.
7. Simulation and Result Analysis
7.1. Data Sources and Parameter Settings
Taking IEEE-33 distribution network as an example, as shown in Figure 2. Assuming the backup lines are 12-22, 8-21, 18-33, 9-15, 25-29, with a total load of 3715kW+j2300kvar. In the initial state, all contact switches are in the open position, while other switches are in the closed position. The distributed power sources are connected to nodes 10, 14, 24, and 31 respectively. Node 10 is connected to the wind power generation system, while 24 after node 14 is connected to the battery. Node 31 is connected to the photovoltaic power generation system. The connection scheme for distributed power sources is shown in Table 1, and the output power of distributed power sources is shown in Figure 3. The node load levels and weights are shown in Table 2, and the importance levels of node loads are divided into three categories [52].
Using the light intensity, wind speed, and battery data from reference [53], and based on the dynamic distribution model of distributed power sources, 24-hour output prediction data for distributed power sources can be obtained. The prediction of 24-hour wind turbine power generation is shown in Figure 3, the prediction of 24-hour photovoltaic power generation is shown in Figure 4, the distribution of 24-hour charging and discharging power of the battery is shown in Figure 5, and the change in the state of charge of the battery is shown in Figure 6.
By using Monte Carlo simulation method, the failure rates of each line under human operation errors can be obtained. The faulty lines is S7 and S22, as shown in Figure 7. Two time periods for the occurrence of the above-mentioned faults is set, namely 12:00-13:00 (time period 1) and 18:00-19:00 (time period 2).
7.2. The Case Analysis
To verify the restoration effect under human error in this paper, two schemes are set up:
Scheme 1: Adopt islanding partitioning and fault network reconstruction and load recovery power supply strategy based on improved particle swarm optimization algorithm.
Scheme 2: Only use island partitioning for power restoration.
The comparison of the results of the two fault restoration methods for Scheme 1 and Scheme 2 is shown in Table 3. Using Scheme 1, the fault restoration results for two fault periods are shown in Figure 8.
According to Table 3, from the comparison of fault restoration effects, although the total load recovery in Scheme 1 is higher than that in Scheme 2 and the power loss is lower, combined with the analysis of the periodic operation strategy in Figure 8, Scheme 1 has more advantages in dynamic adaptability. In time period 1, due to the differences in output characteristics and load demand of distributed power sources, the active output power of DG1 and DG4 is limited. Therefore, the s35 and s36 interconnection switches need to be closed to connect the loads of nodes 11-18, 32, and 33 to the main grid for power supply. In time period 2, DG2 and DG4 have insufficient output, and dynamic reconstruction of the island structure is used to form independent islands supported by DG2 to support the load of nodes 14-18; Close switch s33 to restore power supply to nodes 8-13 on the main grid, and rely on DG4 to construct an isolated network with loads on nodes 31-33. Then, connect nodes 28-30 to the main grid through switch s37. Compared to Scheme 2, Scheme 1 utilizes islanding partitioning and a distribution network reconstruction strategy based on improved particle swarm optimization algorithm to optimize the network’s dynamic adjustment capability while ensuring power supply reliability.
To further verify the self-healing effect of the fault, self-healing evaluation indicators were used for comparison. The results of the comparison in time period 1 are shown in Table 4.
According to Table 4, the self-healing recovery rate in Scheme 1 is higher than that in Scheme 2, and the self-healing speed is faster, further indicating that Scheme 2 has a better self-healing effect.
In order to verify the performance of the improved particle swarm algorithm, GA algorithm, PSO algorithm, and improved PSO algorithm were used for fault restoration with unchanged parameter settings. The comparison of the iterative effects of different algorithms for fault recovery is shown in Figure 9.
According to the iterative process analysis in Figure 9, the improved particle swarm algorithm exhibits significant advantages in convergence efficiency: its fitness value decreases much faster than traditional particle swarm algorithm and genetic algorithm, and can approach the global optimal solution in a shorter time. The simulation results show that the improved algorithm has outstanding performance in two aspects: first, faster convergence speed, and second, better particle fitness values in the final convergence state. Compared with traditional particle swarm optimization and genetic algorithm, this improved strategy achieves synchronous improvement of convergence stability and algorithm adaptability by optimizing the particle update mechanism, verifying its comprehensive advantages in complex optimization problems.
8. Conclusions
This paper proposes a self-healing control method for human operation errors in distribution networks based on an improved particle swarm optimization algorithm. This method adopts a phased collaborative strategy in the process of fault restoration: during the island construction stage, a hierarchical progressive algorithm that integrates breadth first search and depth first search is used to quickly generate island partitions with distributed power sources as the core and priority coverage of important loads, balancing the efficiency of topology search and power supply reliability. In the network reconstruction stage, a mathematical model is established for multi-objective collaborative optimization based on load recovery rate, switch action frequency, and power loss coefficient. Based on an improved particle swarm optimization algorithm, dynamic weight adjustment and global optimization are carried out to achieve a comprehensive balance between power supply capacity, operational economy, and operational feasibility. This method, through a two-stage coupling mechanism, not only ensures the rapid restoration of power demand for important loads, but also achieves overall optimization of the recovery benefits of the entire network.
The simulation results show that this method can obtain the optimal solution for fault restoration in the distribution network, not only achieving more recovery of lost loads, but also significantly reducing operating costs. Compared with genetic algorithm and traditional PSO algorithm, the improved PSO algorithm exhibits stronger global search capability, effectively avoids local optima problems, and has faster convergence speed, fully verifying its superiority in optimization performance.
Author Contributions
data curation, Dexiang Li, Ling Li, Huijie Sun, Tianlu Luo, Yicong Mo; writing—original draft preparation, Dexiang Li; writing—review and editing, Dexiang Li; visualization, Dexiang Li; supervision, Dexiang Li; project administration, Dexiang Li; funding acquisition, Dexiang Li. All authors have read and agreed to the published version of the manuscript.
Funding
This work is supported by Technology projects of Southern Power Grid Co., Ltd.(GXKJXM20230284).
References
- Zou, Y.; Xu, Y.; Li, J. Aggregator-Network Coordinated Peer-to-Peer Multi-Energy Trading via Adaptive Robust Stochastic Optimization. IEEE Trans. Power Syst. 2024, 1–13. [Google Scholar] [CrossRef]
- Zhang, R.; Chen, Y.; Li, Z.; Jiang, T.; Li, X. Two-stage robust operation of electricity-gas-heat integrated multi-energy microgrids considering heterogeneous uncertainties. Appl. Energy 2024, 371, 123690. [Google Scholar] [CrossRef]
- Wang, Z.; Ren, Y.; Meng, Q.; et al. A cooperative game-based strategy for the optimal operation of ELectricity-thermal-gas synergy in integrated energy systems. J. Sol. Energy 2022, 43, 20–29. [Google Scholar]
- Zhang, Z.; Kang, C. Challenges and prospects of constructing new power systems with carbon neutral goals. Proc. CSEE 2022, 42, 2806–2819. [Google Scholar]
- Li, R.; Hu, Y.; Wang, X.; Zhang, B.; Chen, H. Estimating the impacts of a new power system on electricity prices under dual carbon targets. J. Clean. Prod. 2024, 438, 140583. [Google Scholar] [CrossRef]
- Pei, M.; Ye, L.; Luo, Y.; et al. Inertia estimation method for new energy power systems considering spatiotemporal correlation of frequency response. Power Syst. Autom. 2024, 1–16. [Google Scholar]
- Si, J.; Wu, X.; Guo, Q.; et al. Wind farm group joint shared energy storage two-stage collaborative grid-connection optimization. Power Grid Technol. 2024, 1–18. [Google Scholar]
- Li, X.; Chen, L.; Sun, F.; Hao, Y.; Du, X.; Mei, S. Share or not share, the analysis of energy storage interaction of multiple renewable energy stations based on the evolution game. Renew. Energy 2023, 208, 679–692. [Google Scholar] [CrossRef]
- Song, M.; Meng, J.; Lin, G.; Cai, Y.; Gao, C.; Chen, T.; Xu, H. Applications of shared economy in smart grids: Shared energy storage and transactive energy. Electr. J. 2022, 35, 107128. [Google Scholar] [CrossRef]
- Yan, D.; Chen, Y. Review of shared energy storage business model and pricing mechanism. Power Syst. Autom. 2022, 46, 178–191. [Google Scholar]
- Qiu, W.; Zhou, S.; Yang, Y.; Lv, X.; Lv, T.; Chen, Y.; Huang, Y.; Zhang, K.; Yu, H.; Wang, Y.; et al. Application Prospect, Development Status and Key Technologies of Shared Energy Storage toward Renewable Energy Accommodation Scenario in the Context of China. Energies 2023, 16, 731–731. [Google Scholar] [CrossRef]
- Liu, L.; Yao, X.; Qi, X.; Han, Y. Low-carbon economy configuration strategy of electro-thermal hybrid shared energy storage in multiple multi-energy microgrids considering power to gas and carbon capture system. J. Clean. Prod. 2023, 428, 139366. [Google Scholar] [CrossRef]
- Xiao, J.W.; Yang, Y.B.; Cui, S.; Wang, Y.W. Cooperative online schedule of interconnected data center microgrids with shared energy storage. Energy 2023, 285, 129522. [Google Scholar] [CrossRef]
- Ma, K.; Yang, J.; Liu, P. Relaying-Assisted Communications for Demand Response in Smart Grid: Cost Modeling, Game Strategies, and Algorithms. IEEE J. Sel. Areas Commun. 2020, 38, 48–60. [Google Scholar] [CrossRef]
- Ma, K.; Yu, Y.; Yang, B.; Yang, J. Demand-Side Energy Management Considering Price Oscillations for Residential Building Heating and Ventilation Systems. IEEE Trans. Ind. Inform. 2019, 15, 4742–4752. [Google Scholar] [CrossRef]
- Chen, G.; Kuang, R.; Li, W.; Cui, K.; Fu, D.; Yang, Z.; Liu, Z.; Huang, H.; Yu, M.; Shen, Y. Numerical study on efficiency and robustness of wave energy converter-power take-off system for compressed air energy storage. Renew. Energy 2024, 232, 121080. [Google Scholar] [CrossRef]
- Li, L.; Sun, Y.; Han, Y.; Chen, W. Seasonal hydrogen energy storage sizing: Two-stage economic-safety optimization for integrated energy systems in northwest China. iScience 2024, 27, 110691. [Google Scholar] [CrossRef]
- Guo, X.; Zhu, D.; Hu, J.; Zou, X.; Kang, Y.; Guerrero, J.M. Inertial PLL of Grid-connected Converter for Fast Frequency Support. CSEE J. Power Energy Syst. 2023, 9, 1594–1599. [Google Scholar]
- Meng, Q.; Tong, X.; Hussain, S.; Luo, F.; Zhou, F.; Liu, L.; He, Y.; Jin, X.; Li, B. Revolutionizing photovoltaic consumption and electric vehicle charging: A novel approach for residentialmdistribution systems. IET Gener. Transm. Distrib. 2024, 18, 2822–2833. [Google Scholar] [CrossRef]
- Li, P.; Hu, J.; Qiu, L.; Zhao, Y.; Ghosh, B.K. A Distributed Economic Dispatch Strategy for Power–Water Networks. IEEE Trans. Control Netw. Syst. 2022, 9, 356–366. [Google Scholar] [CrossRef]
- Li, J.; Zhu, Y.; Xiao, Y.; Lan, X. Optimized configuration and operation model and economic analysis of shared energy storage based on master-slave game considering load characteristics of PV communities. J. Energy Storage 2024, 76, 109841. [Google Scholar] [CrossRef]
- Du, X.; Li, X.; Hao, Y.; Chen, L. Sizing of centralized shared energy storage for resilience microgrids with controllable load: A bi-level optimization approach. Front. Energy Res. 2022, 10, 954833. [Google Scholar] [CrossRef]
- Li, L.; Peng, K.; Yang, X.; Liu, K. Coordinated design of multi-stakeholder community energy systems and shared energy storage under uncertain supply and demand: A game theoretical approach. Sustain. Cities Soc. 2024, 100, 105028. [Google Scholar] [CrossRef]
- Han, X.; Li, J.; Zhang, Z. Dynamic game optimization control for shared energy storage in multiple application scenarios considering energy storage economy. Appl. Energy 2023, 350, 121801. [Google Scholar] [CrossRef]
- Liu, F.; Li, F.; Zhang, G.; et al. Optimization configuration of energy storage power stations in wind power gathering areas considering cycle life and operational strategies. Power Syst. Prot. Control 2023, 51, 127–139. [Google Scholar]
- Ju, Y.; Liu, W.; Zhang, Z.; Zhang, R. Distributed Three-Phase Power Flow for AC/DC Hybrid Networked Microgrids Considering Converter Limiting Constraints. IEEE Trans. Smart Grid 2022, 13, 1691–1708. [Google Scholar] [CrossRef]
- Shirkhani, M.; Tavoosi, J.; Danyali, S.; Sarvenoee, A.K.; Abdali, A.; Mohammadzadeh, A.; Zhang, C. A review on microgrid decentralized energy/voltage control structures and methods. Energy Rep. 2023, 10, 368–380. [Google Scholar] [CrossRef]
- Lu, Z.Q.; Zhao, L.; Fu, H.L.; Yeatman, E.; Ding, H.; Chen, L.Q. Ocean wave energy harvesting with high energy density and self-powered monitoring system. Nat. Commun. 2024, 15, 6513. [Google Scholar] [CrossRef] [PubMed]
- Xu, X.; Lin, Z.; Li, X.; Shang, C.; Shen, Q. Multi-objective robust optimisation model for MDVRPLS in refined oil distribution. Int. J. Prod. Res. 2022, 60, 6772–6792. [Google Scholar] [CrossRef]
- Ma, Y.; Zhu, D.; Hu, J.; Liu, R.; Zou, X.; Kang, Y. Optimized Design of Demagnetization Control for DFIG-Based Wind Turbines to Enhance Transient Stability During Weak Grid Faults. IEEE Trans. Power Electron. 2024, 1–5. [Google Scholar] [CrossRef]
- Zhang, X.; Wang, Z.; Liao, H.; Zhou, Z.; Ma, X.; Yin, X.; Wang, Z.; Liu, Y.; Lu, Z.; Lv, G. Optimal capacity planning and operation of shared energy storage system for large-scale photovoltaic integrated 5G base stations. Int. J. Electr. Power Energy Syst. 2023, 147, 108816. [Google Scholar] [CrossRef]
- Dai, R.; Charkhgard, H.; Rigterink, F. A robust biobjective optimization approach for operating a shared energy storage under price uncertainty. Int. Trans. Oper. Res. 2020, 29, 1627–1658. [Google Scholar] [CrossRef]
- Jinrui, S. Collaborative optimal scheduling of shared energy storage station and building user groups considering demand response and conditional value-at-risk. Electr. Power Syst. Res. 2023, 224, 109769. [Google Scholar]
- Wang, K.; Qi, X.; Liu, H.; Song, J. Deep belief network based k-means cluster approach for short-term wind power forecasting. Energy 2018, 16, 840–852. [Google Scholar] [CrossRef]
- Zhang, T.; Wu, Y. Collaborative allocation model and balanced interaction strategy of multi flexible resources in the new power system based on Stackelberg game theory. Renew. Energy 2024, 220, 119714. [Google Scholar]
- Yan, H.; Hou, H.; Deng, M.; Si, L.; Wang, X.; Hu, E.; Zhou, R. Stackelberg game theory based model to guide users’ energy use behavior, with the consideration of flexible resources and consumer psychology, for an integrated energy system. Energy 2024, 288, 129806. [Google Scholar] [CrossRef]
- Rehman, U.N.; Uzair, M.; Allauddin, U. An optical-energy model for optimizing the geometrical layout of solar photovoltaic arrays in a constrained field. Renew. Energy 2020, 14, 55–65. [Google Scholar] [CrossRef]
- Li, X.; Fang, Z.; Li, F.; et al. Game optimization scheduling of distribution network with multi-microgrid rental shared energy storage. Proc. CSEE 2022, 42, 6611–6625. [Google Scholar]
- Lu, Q.; Yang, Y.; Xie, P.; et al. A two-stage optimization operation strategy for leasing and sharing energy storage in wind farm clusters. Power Grid Technol. 2024, 48, 1146–1165. [Google Scholar]
- Liu, Z.; Wang, Y.; Huang, F. Collaborative Optimization of Active Distribution Network Fault Reconstruction by Ring-broken Based on Particle Swarm Optimization. Power Information and Communication Technology 2021, 19, 84–90. [Google Scholar]
- Tang, J.; Tang, T.; Chen, R.; Li, Z.; Deng, Q.; Jiang, Y. Research on optimal configuration of distributed generation based on multi-objective particle swarm optimization algorithm. Journal of Shaoyang University (Natural Science Edition) 2021, 18, 27–33. [Google Scholar]
- Li, J.; Wang, J.; Xu, S.; et al. Distribution Network Fault Recovery Strategy Based on Quantum Firefly Algorithm. Electric Power 2023, 56, 191–198. [Google Scholar]
- Wang, Y.; Xie, H.; Yan, Y. Study on fault recovery of distribution network based on improved particle swarm algorithm. Journal of Shaanxi University of Science and Technology 2023, 41, 174–181. [Google Scholar]
- Xu, Y.; Chen, J.; Ma, T. Fault Recovery Method for Active Distribution Network Based on Hybrid Reinforcement Learning. Proceedings of the Chinese Society for Electrical Engineering - Power System and Automation 2024, 36, 50–58. [Google Scholar]
- Liu, X.; Wang, X.; Qiu, S.; Cheng, Z.; Li, Y. A New Method for Active Distribution Network Island Fault Recovery and Reconstruction Considering Distributed Generation. Rural Electrification 2023, 2, 54–59. [Google Scholar]
- Xing, X.; Pan, C.; Li, Y. A Bi-level Fault Recovery Strategy for Distribution Networks Considering Islandingand Reconfiguration. Jilin Electric Power 2022, 50, 4–8. [Google Scholar]
- Gong, Y.; Zhang, L.; Li, T.; Yang, H.; Zhao, M.; Jia, H.; Zhang, S. Application of Quantum Particle Swarm Optimization (QPSO)in the restoration and reconstruction of power distribution network. Journal of Chongqing University of Technology (Natural Science) 2022, 36, 200–207. [Google Scholar]
- Xu, Yan. ; Chen, Jiayue.; Ma, Tianxiang. Fault Recovery Method for Active Distribution Network Based on Hybrid Reinforcement Learning. Power System Automation 2021, 45, 38–46. [Google Scholar]
- Li, B. Research on Fault Location and Self-Healing Strategy of Distribution Network Based on Genetic Algorithm. Power Equipment Management 2024, 20, 2–4. [Google Scholar]
- Lu, J.; Zhao, R.; Guo, W.; et al. Uniform design-based self-healing evaluation for active distribution network. Electric Power Systems Research 2024, 235, 110863–110863. [Google Scholar] [CrossRef]
- Yuan, J.; Yao, Y.; Wang, T.; Zhang, Y.; Sun Yongwen. Research on distribution network service restoration based on entropy weight and adaptive load coding strategy. Wireless Interconnection Technology 2024, 21, 15–19. [Google Scholar]
- Ran, X. Research on Self-healing Control Strategy of Microgrid. Hubei Minzu University, 2021.
- Research on Dynamic Reconstruction of Distribution Networks with Distributed Generation. Lanzhou Jiaotong University, Lanzhou, 2024.
Figure 1.
The flowchart of the island partitioning
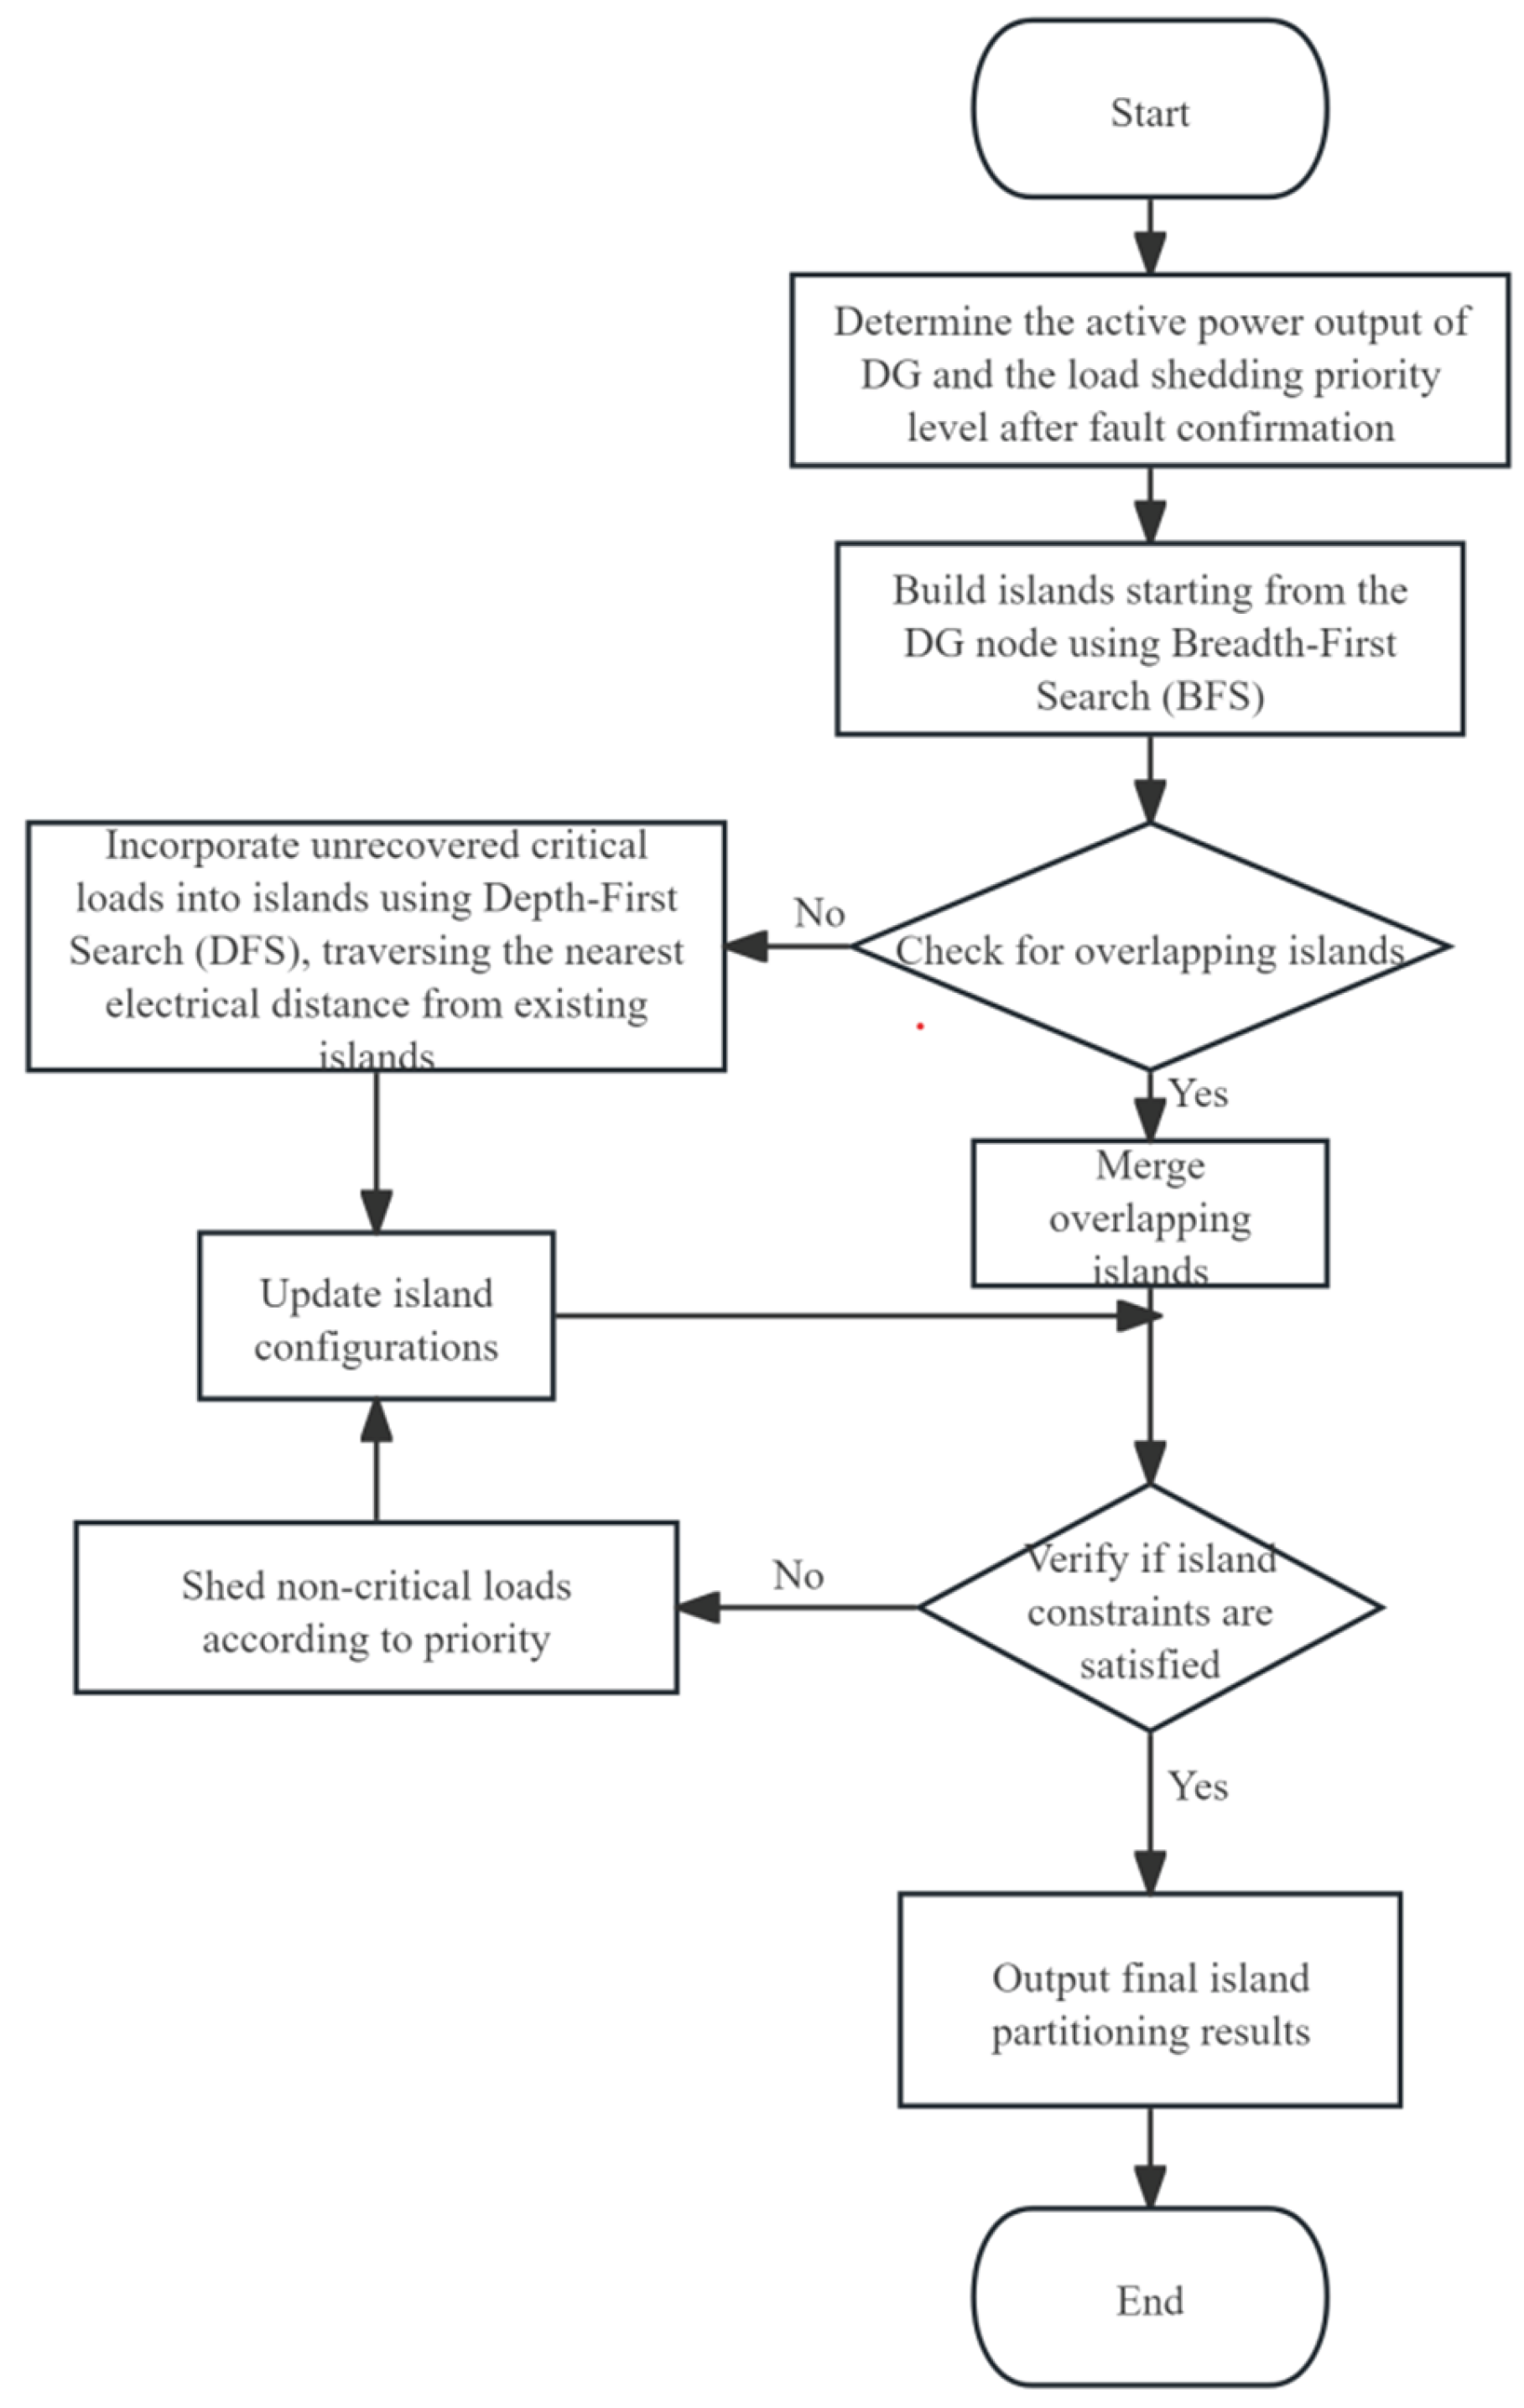
Figure 2.
The topology diagram of IEEE-33 distribution system
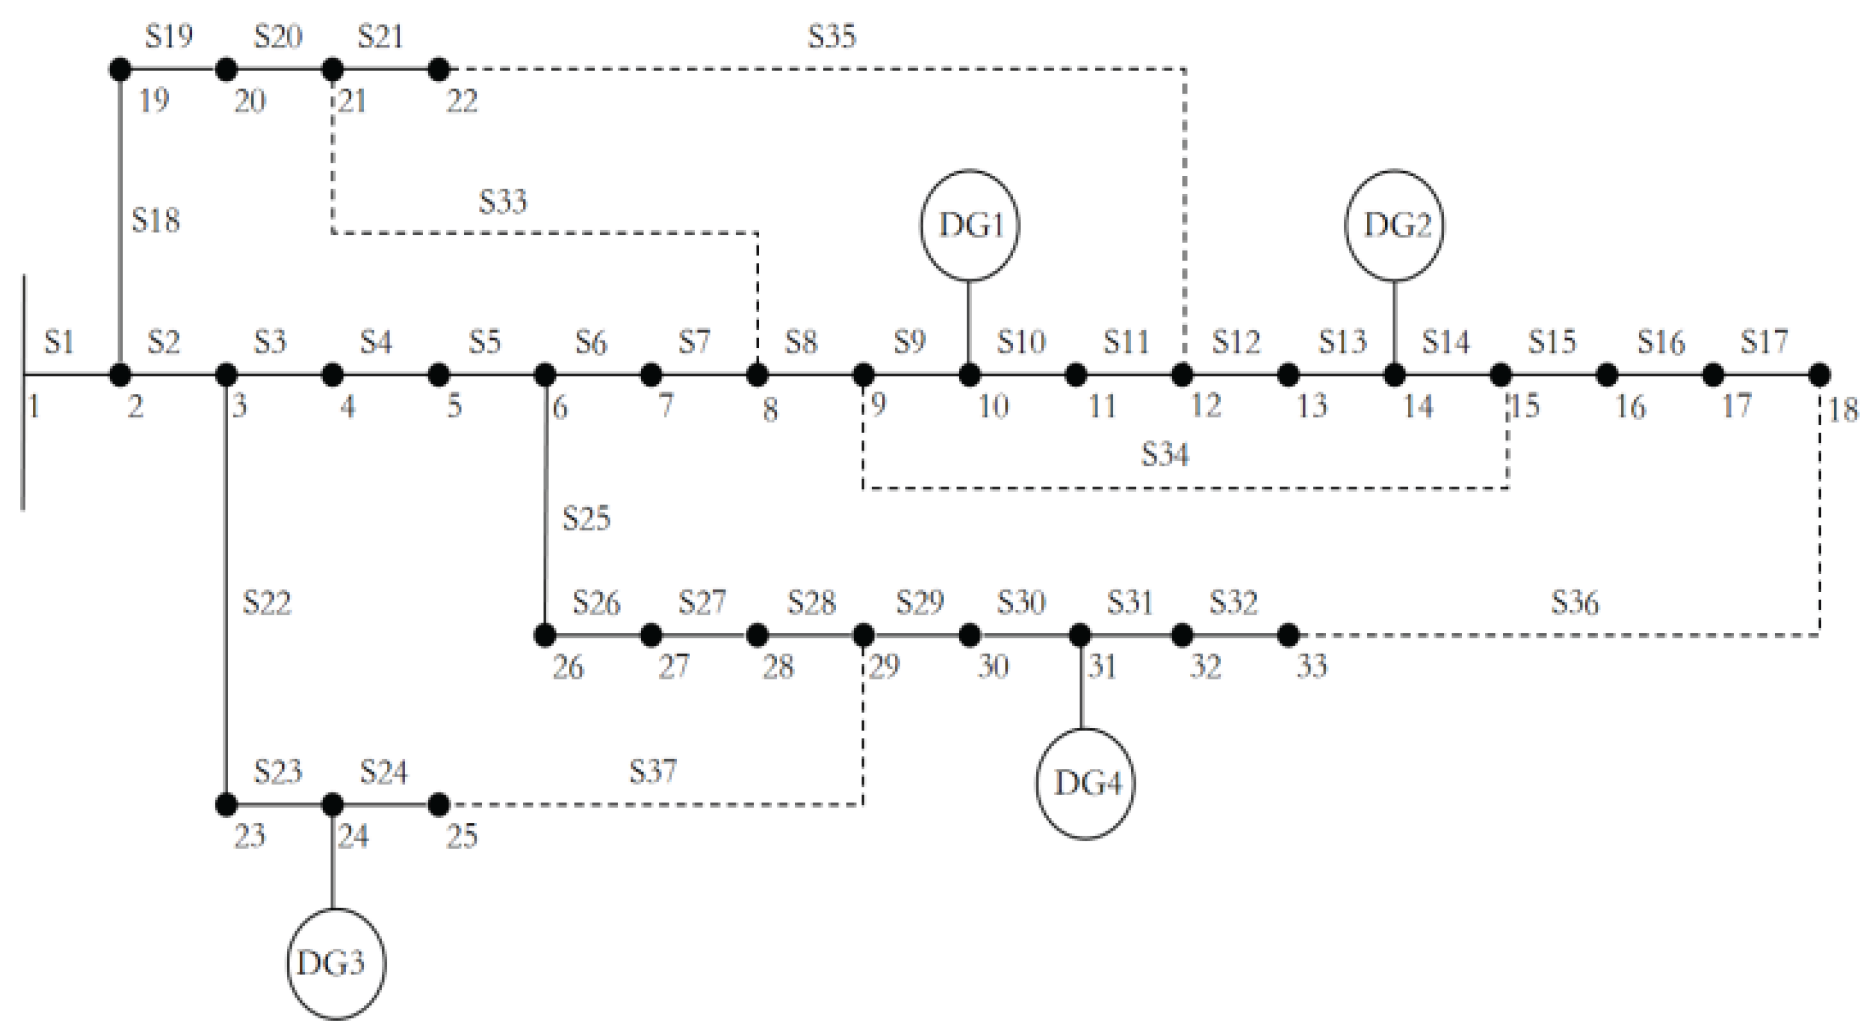
Figure 3.
Prediction diagram of wind power generation within 24 hours
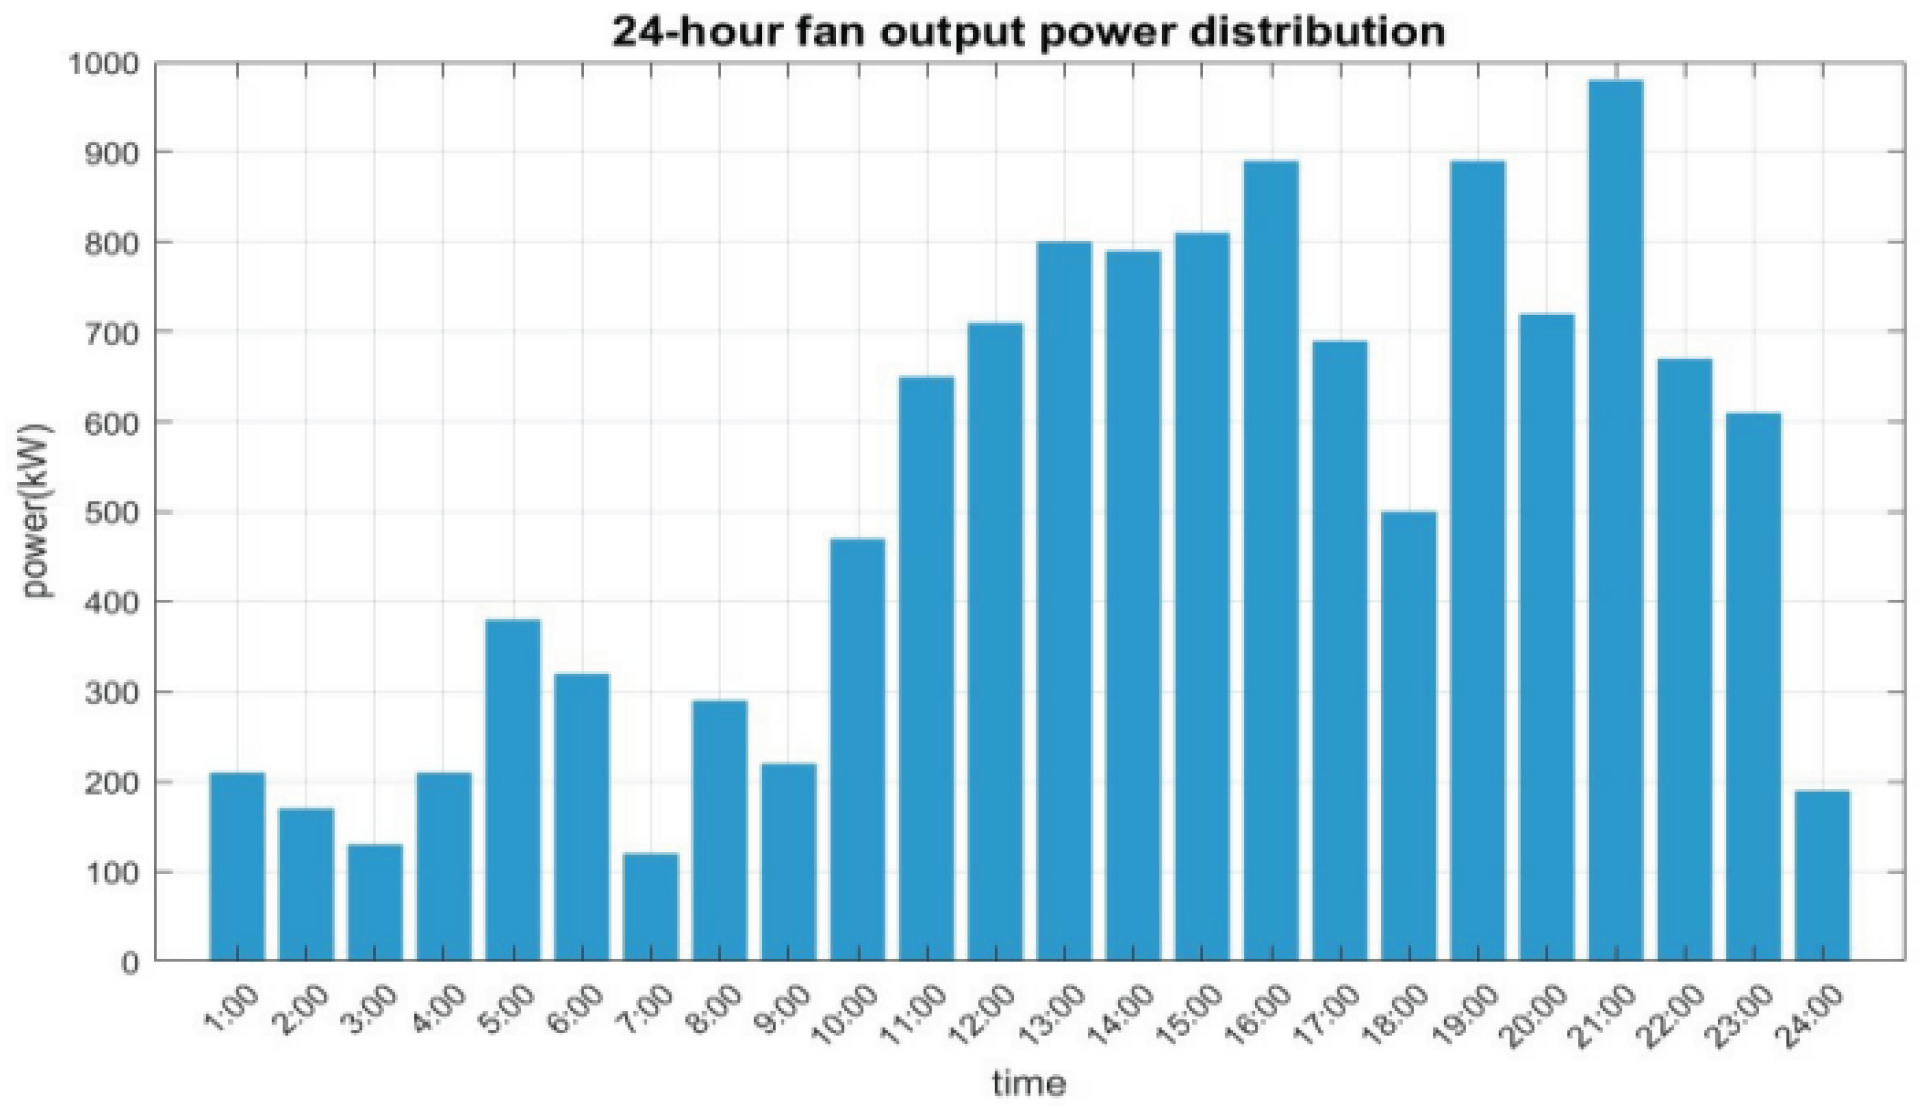
Figure 4.
Prediction diagram of photovoltaic power generation within 24 hours
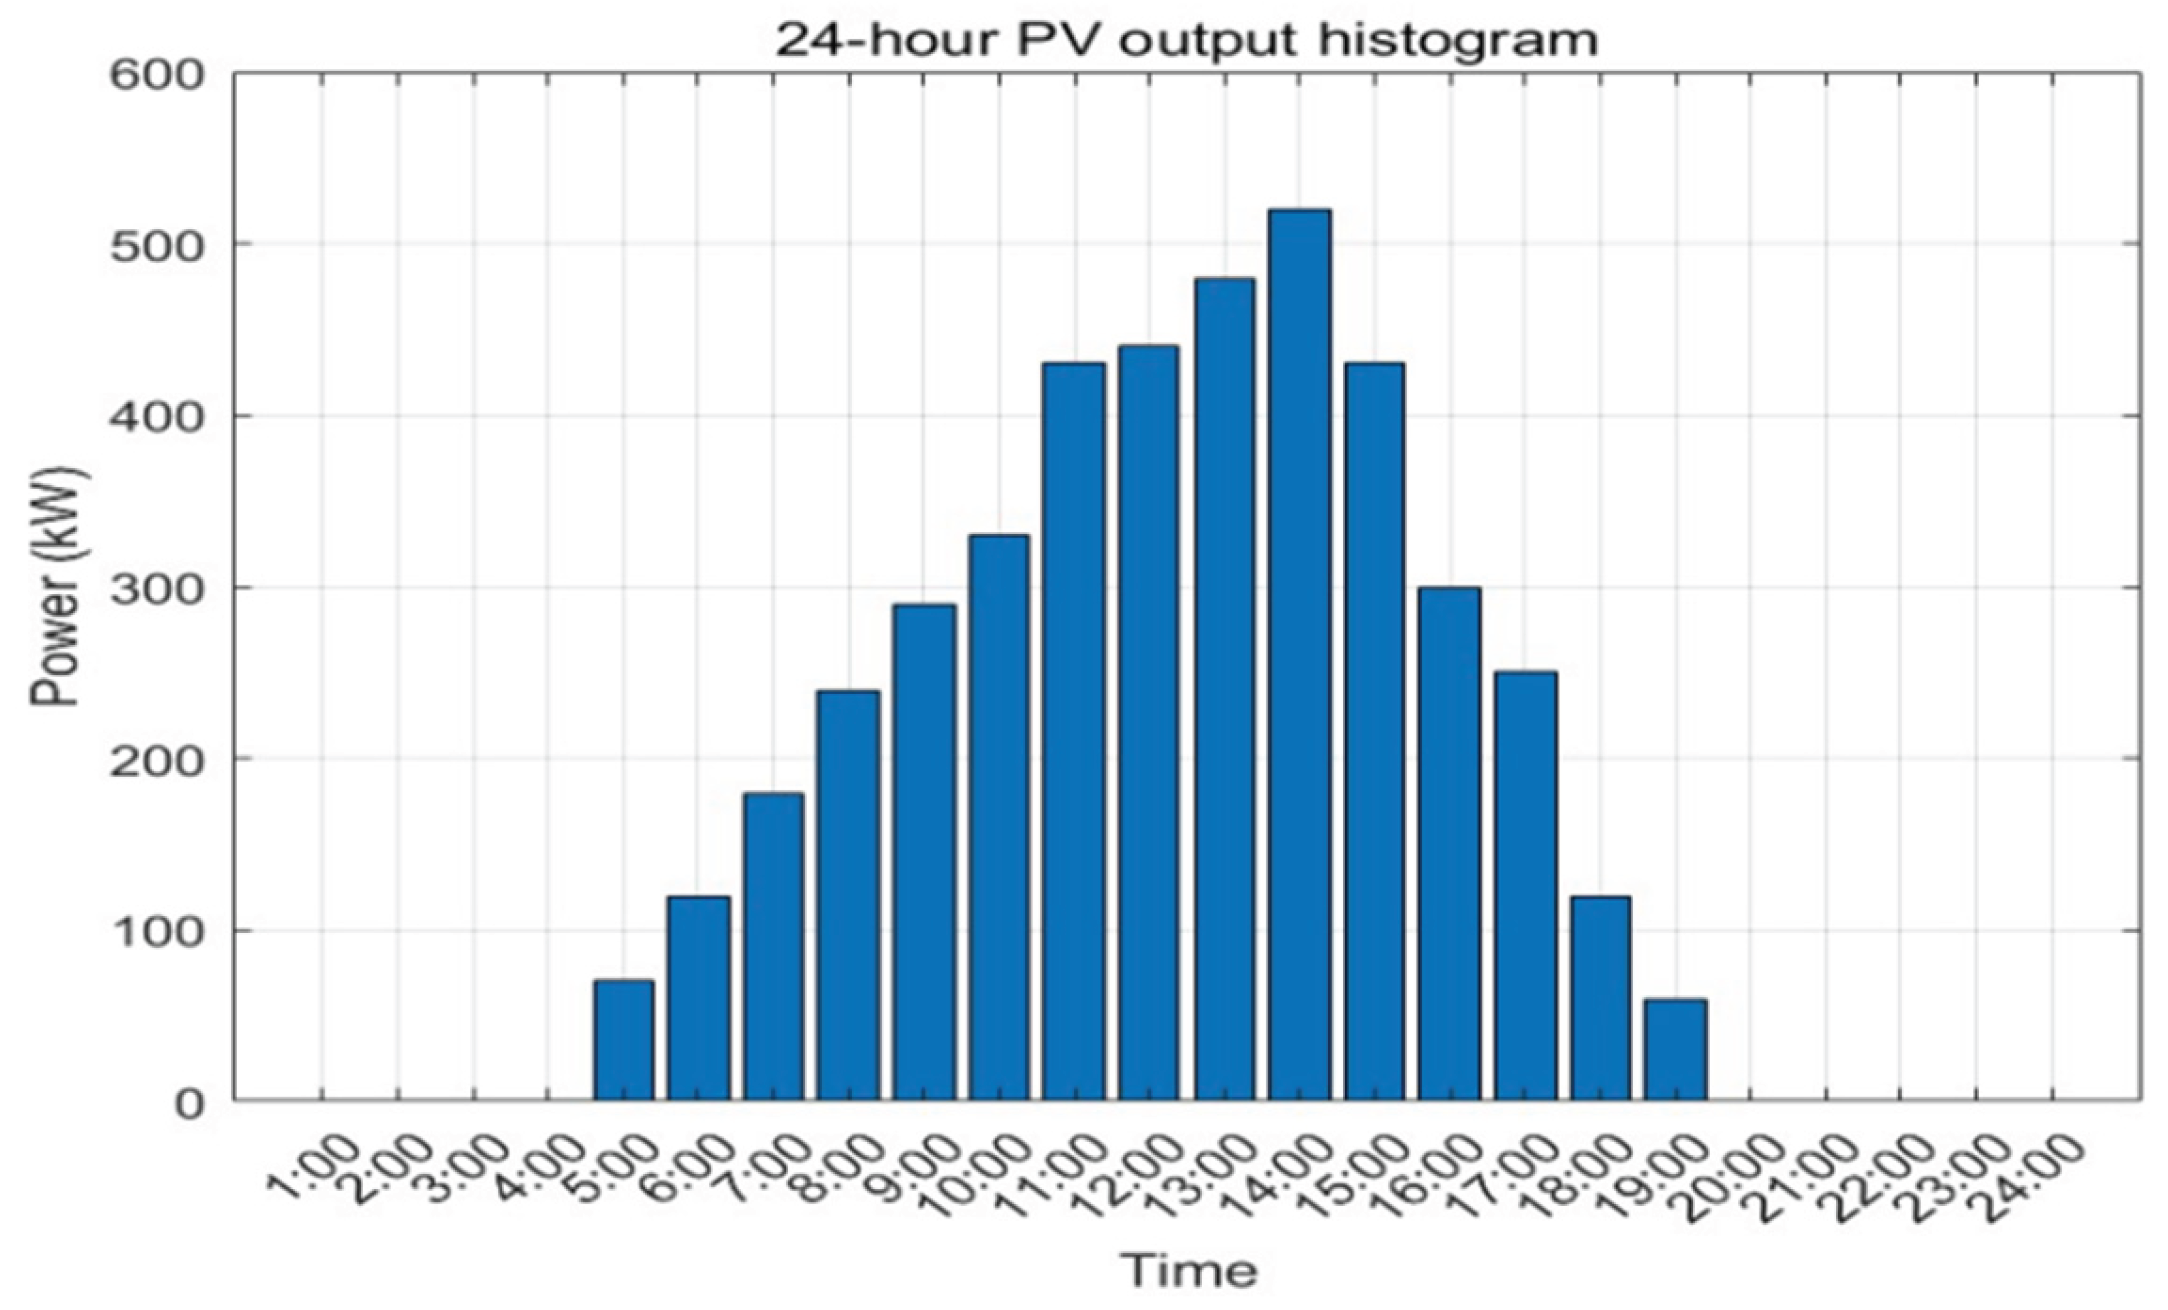
Figure 5.
Distribution diagram of charging and discharging power of energy storage system within 24 hours
Figure 5.
Distribution diagram of charging and discharging power of energy storage system within 24 hours
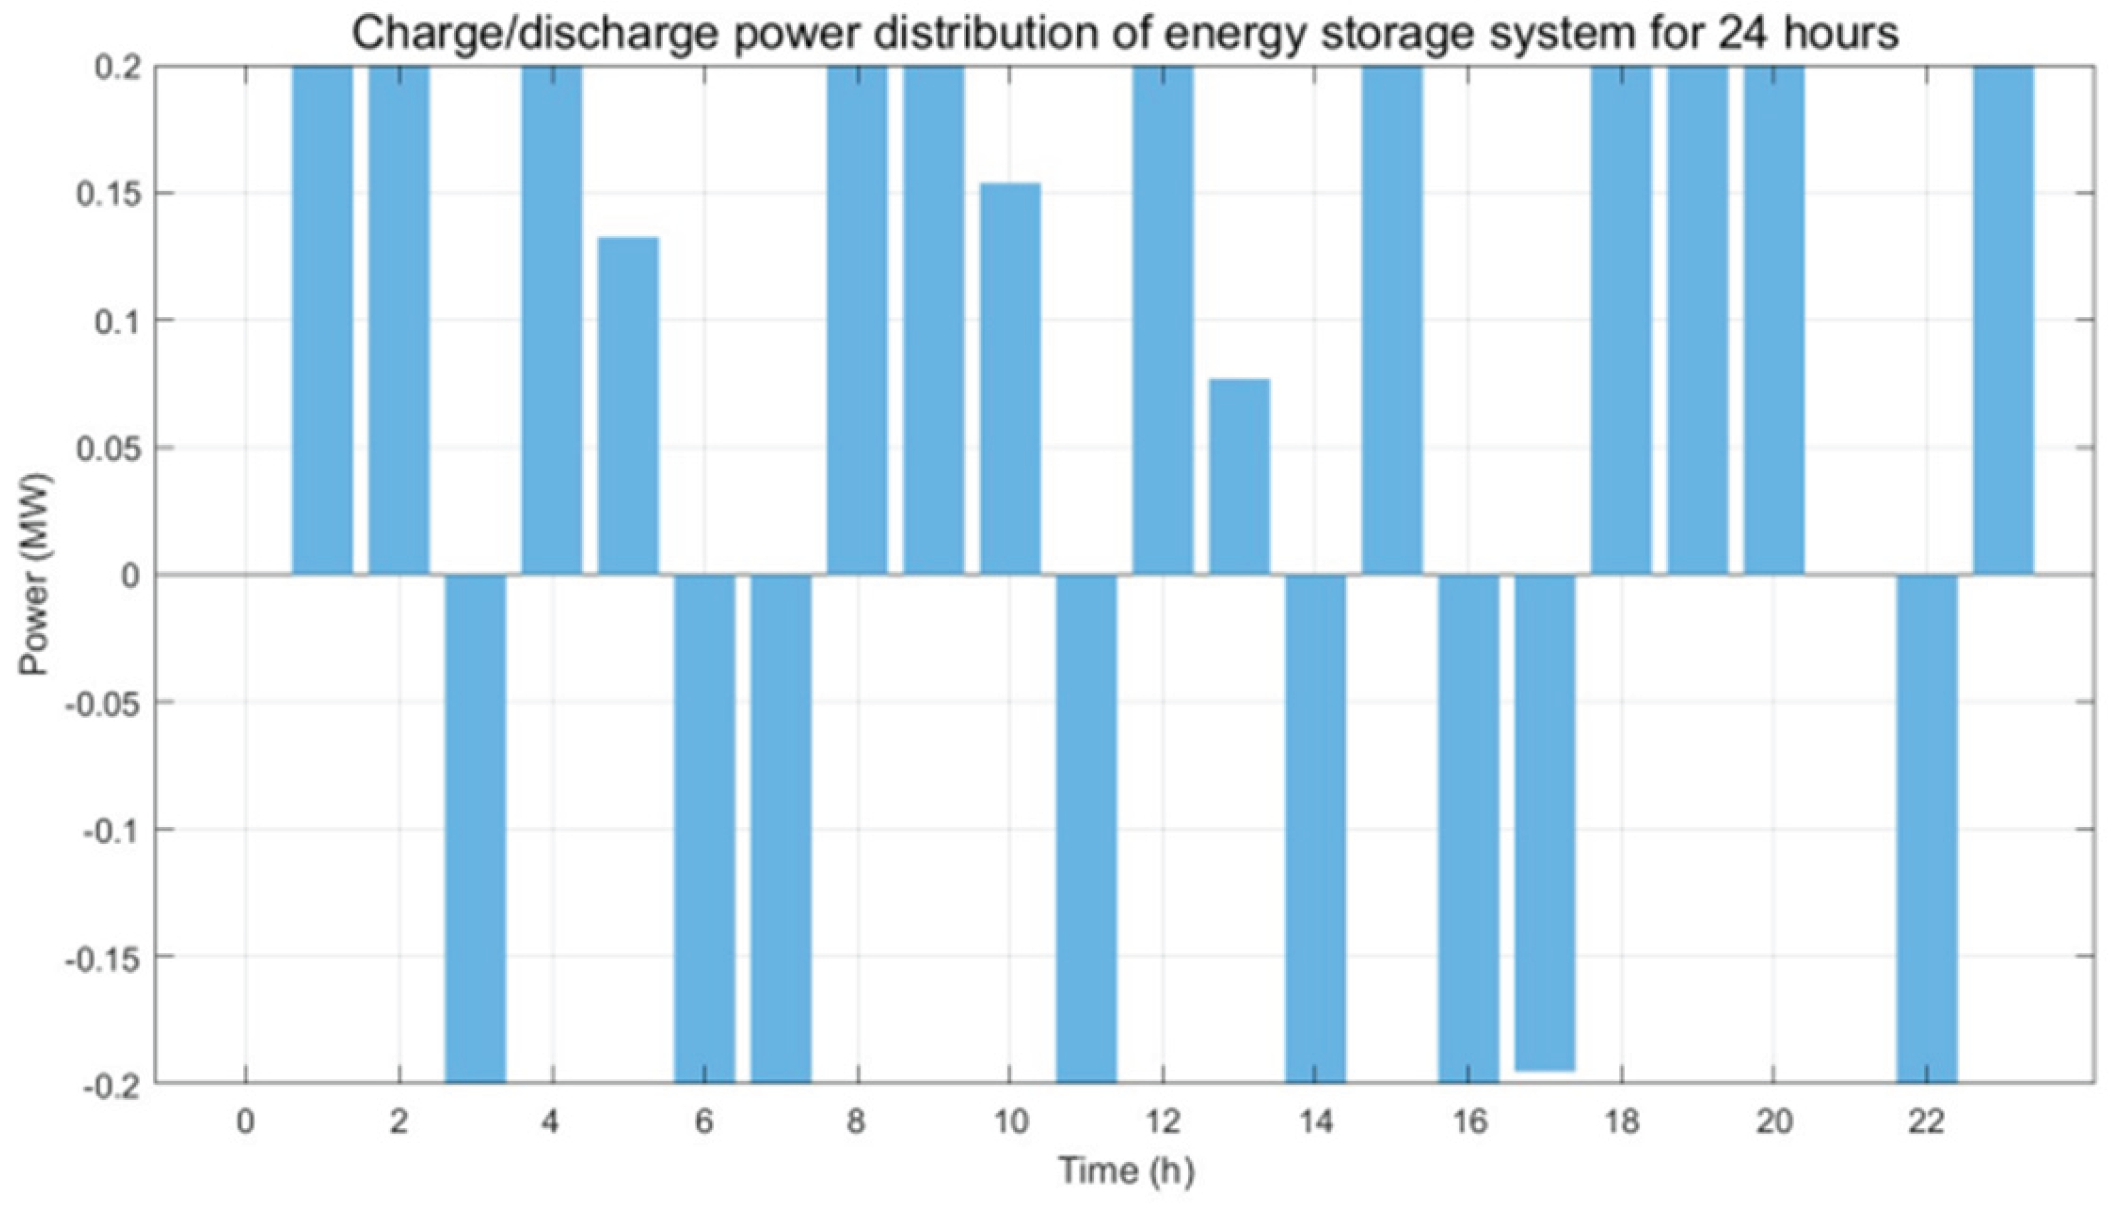
Figure 6.
The change diagram of the state of charge of the energy storage system within 24 hours
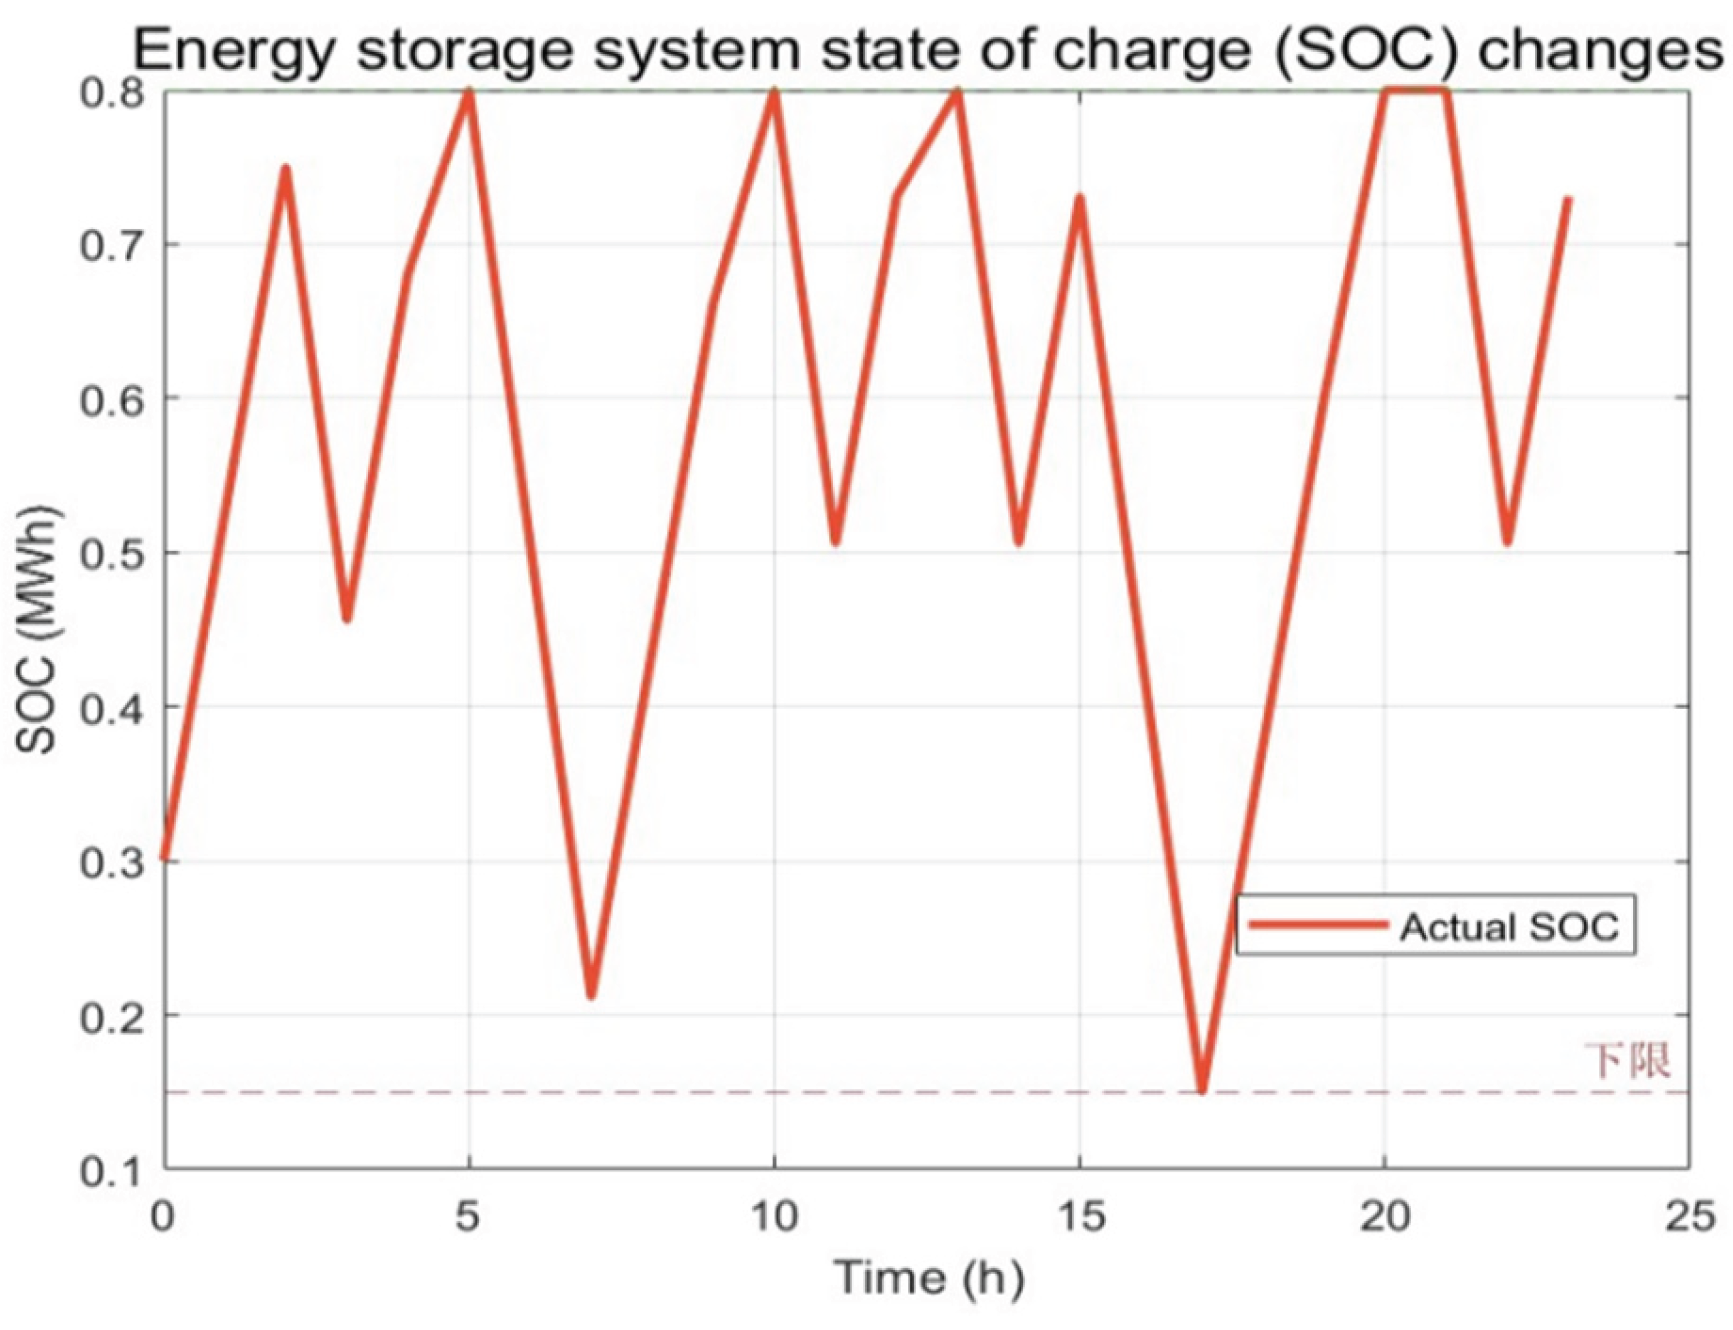
Figure 7.
The histogram of the probability of line failure
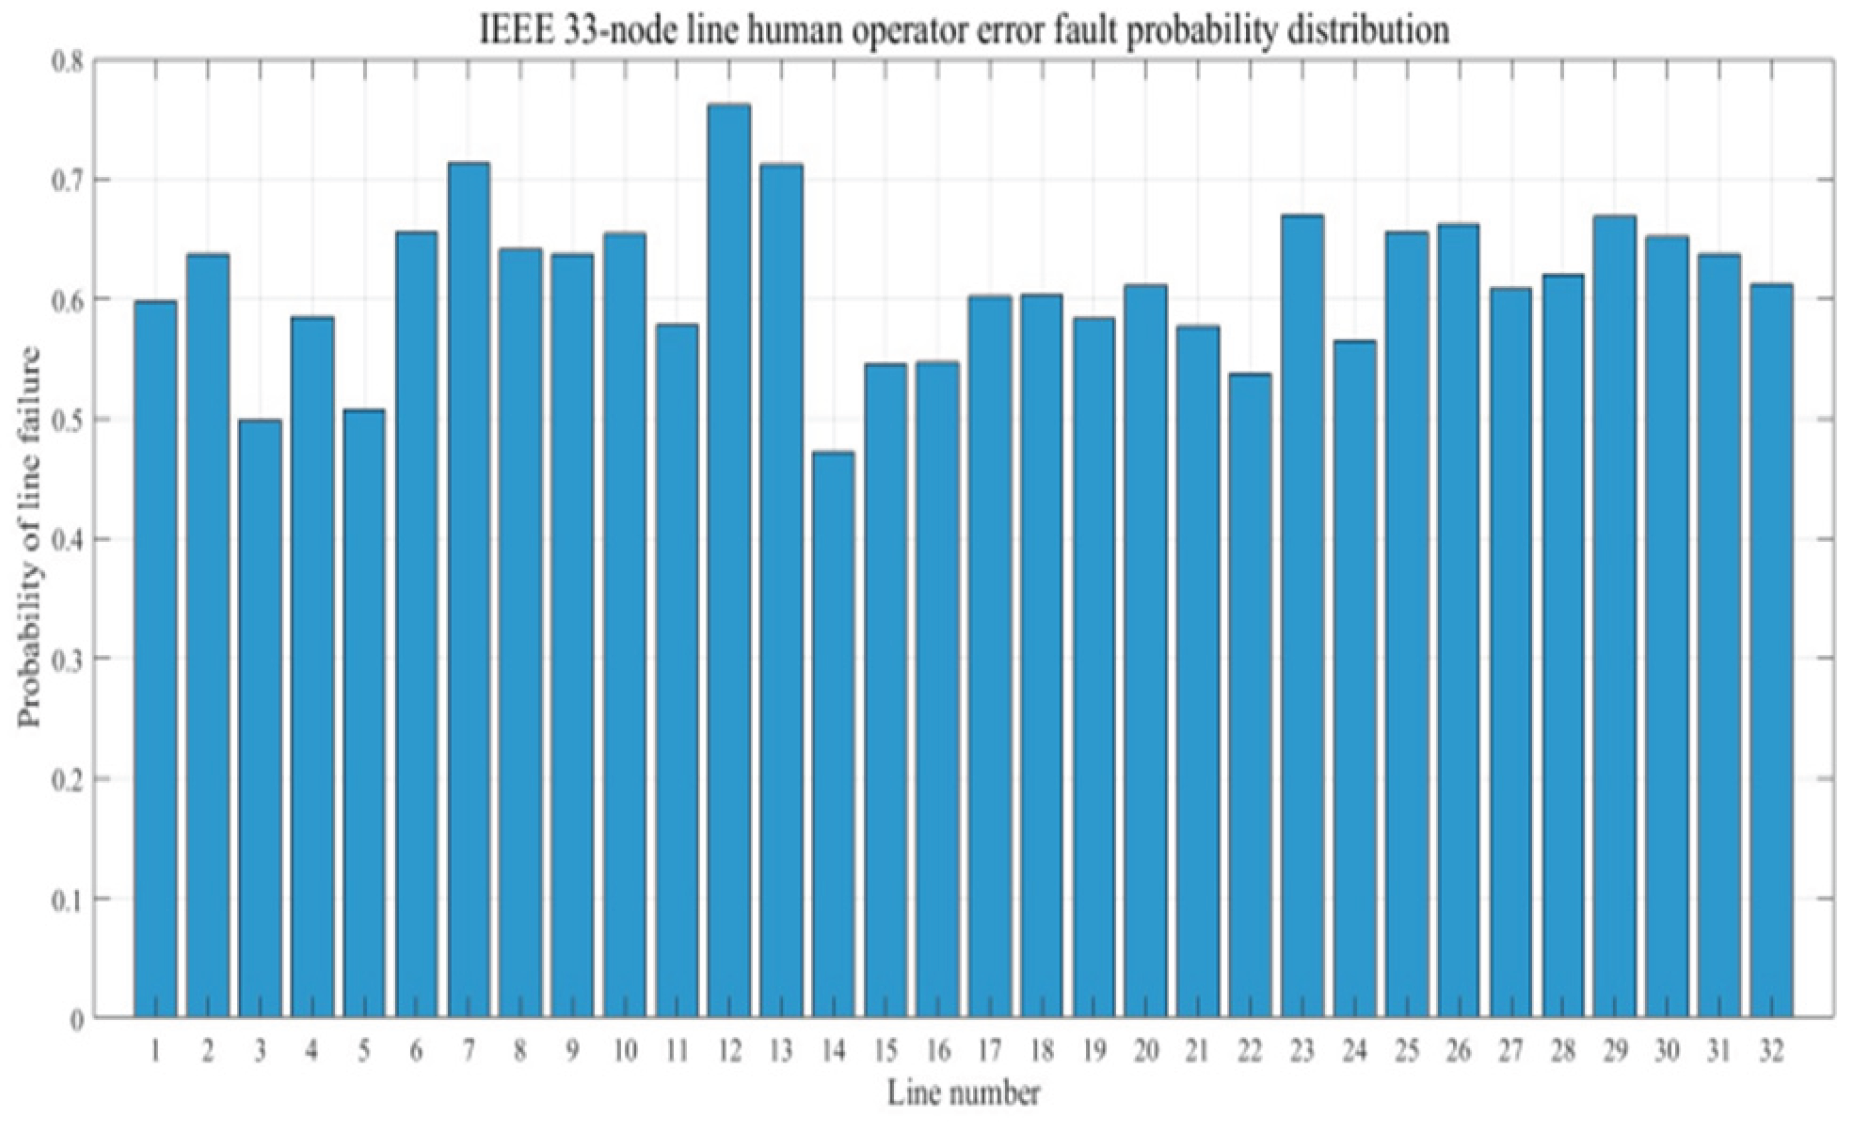
Figure 8.
Fault restoration results for two fault periods
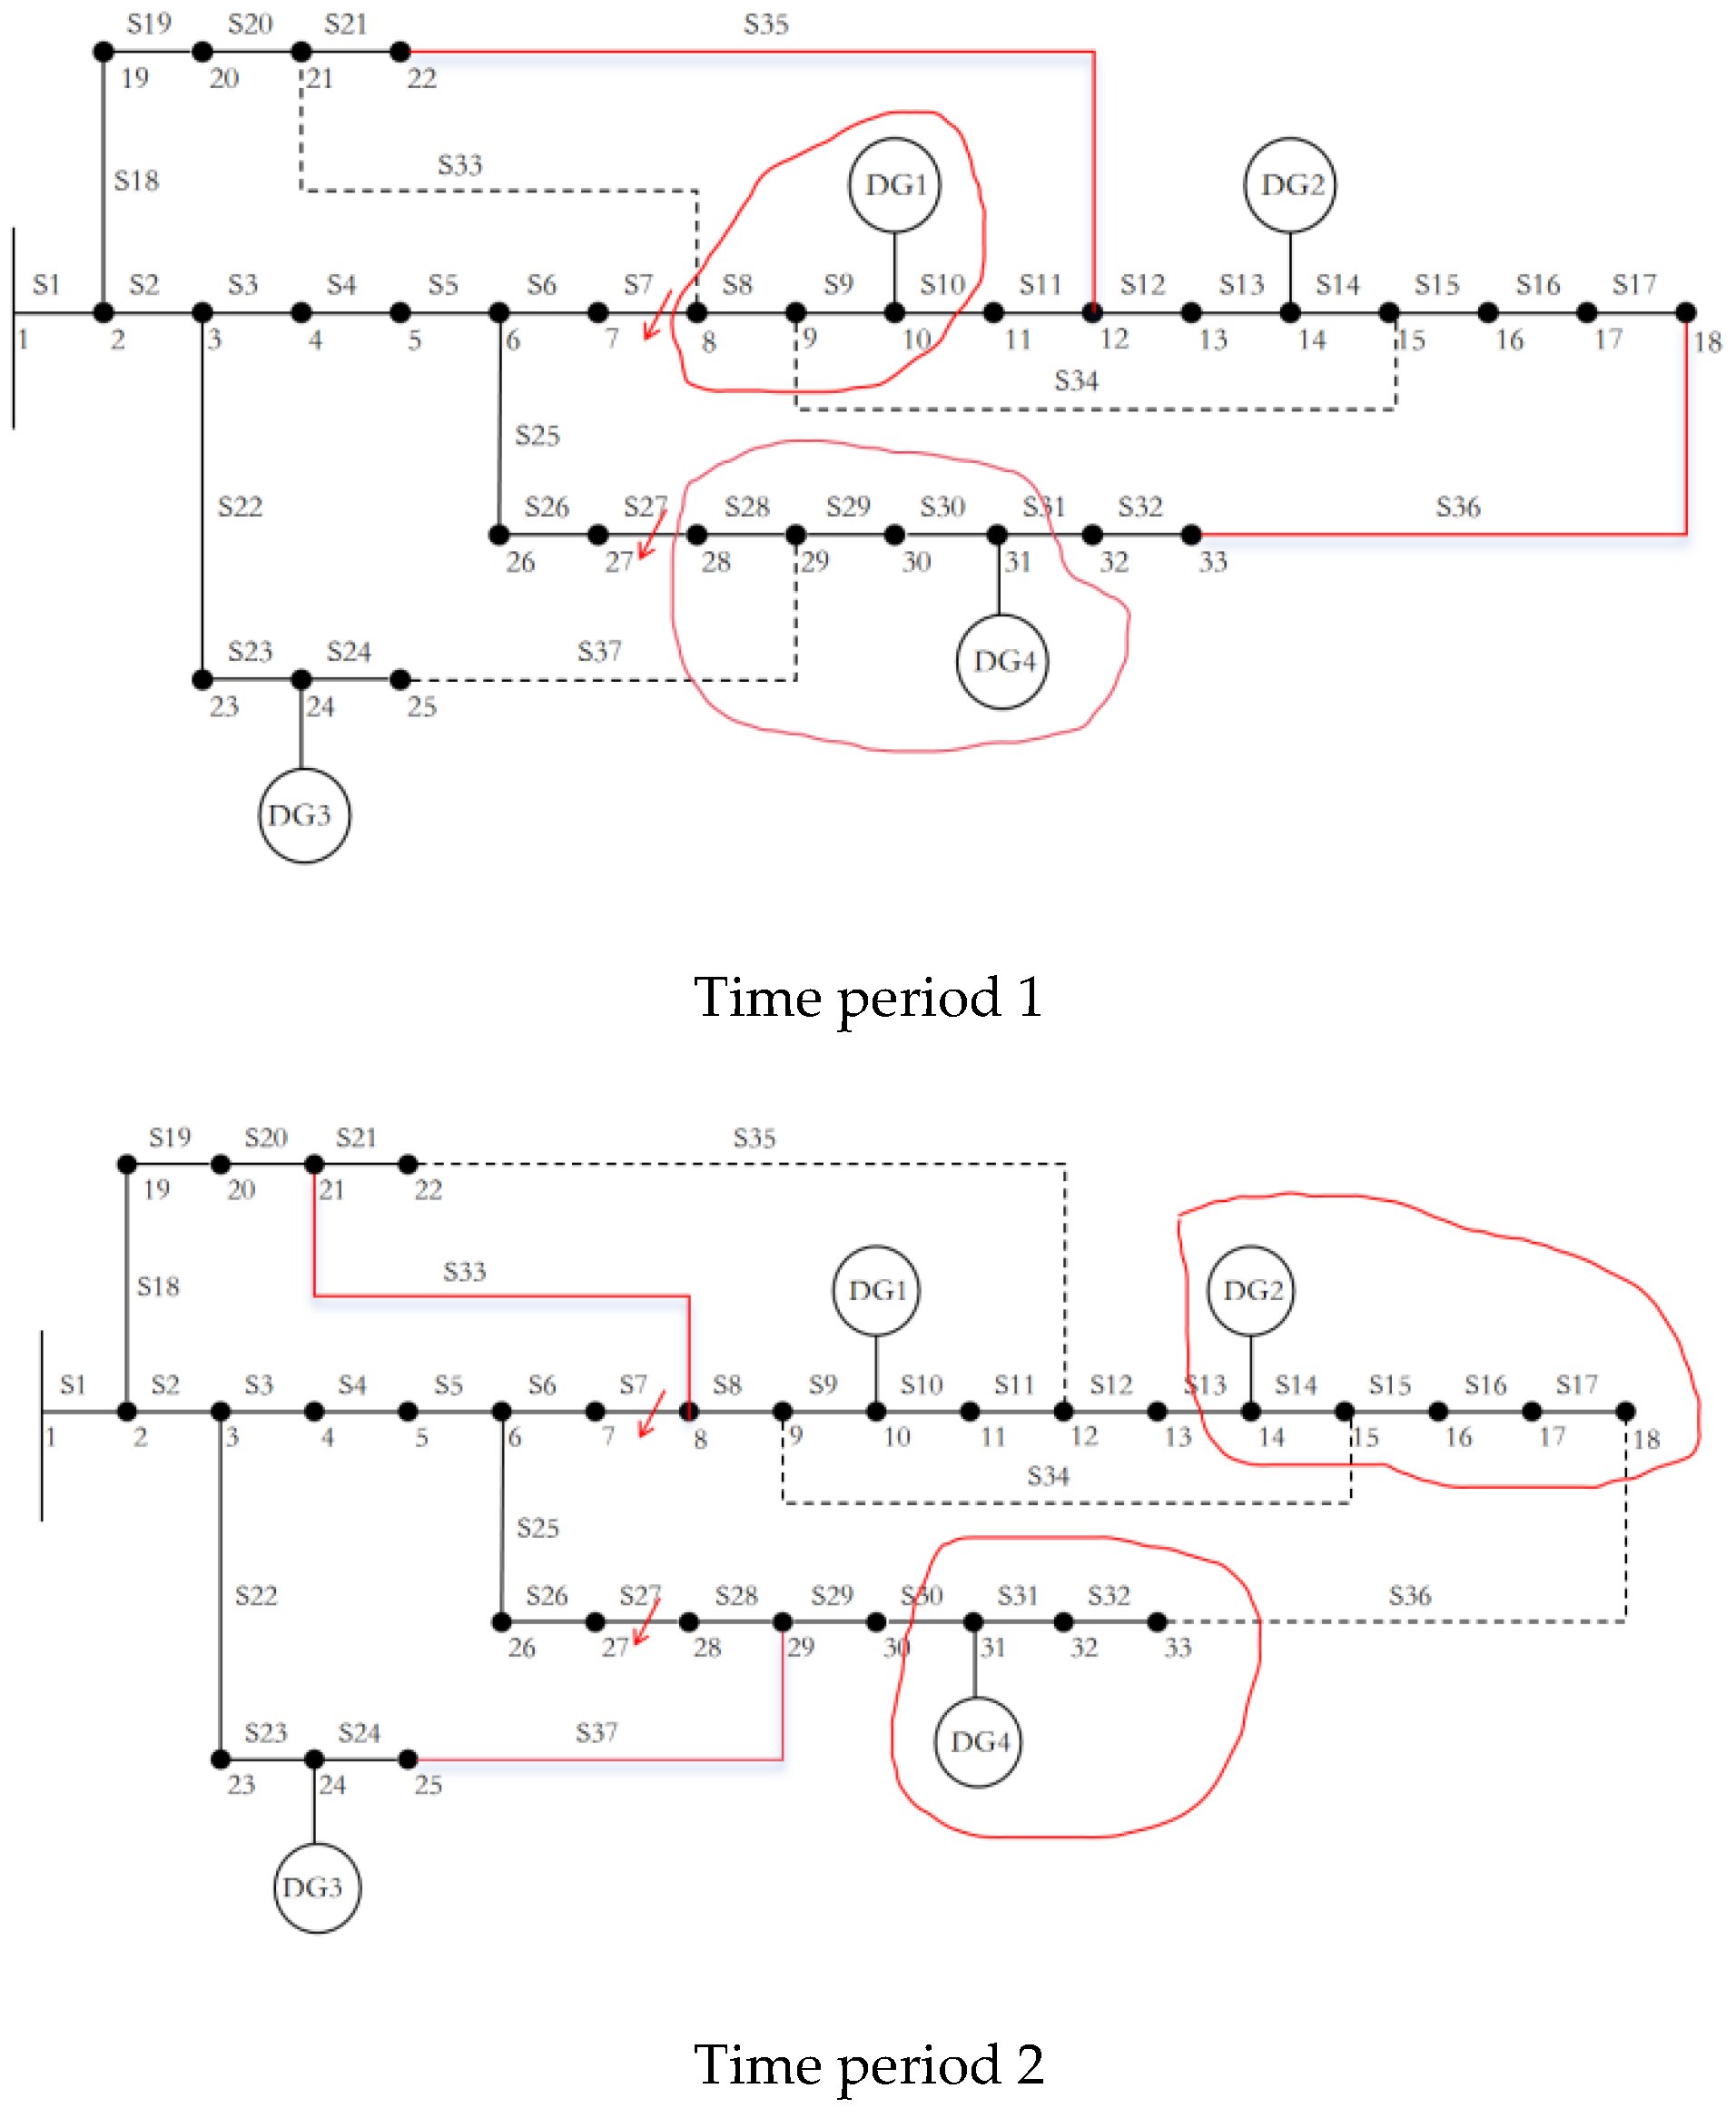
Figure 9.
The comparison of the iterative effects of different algorithms for fault recovery
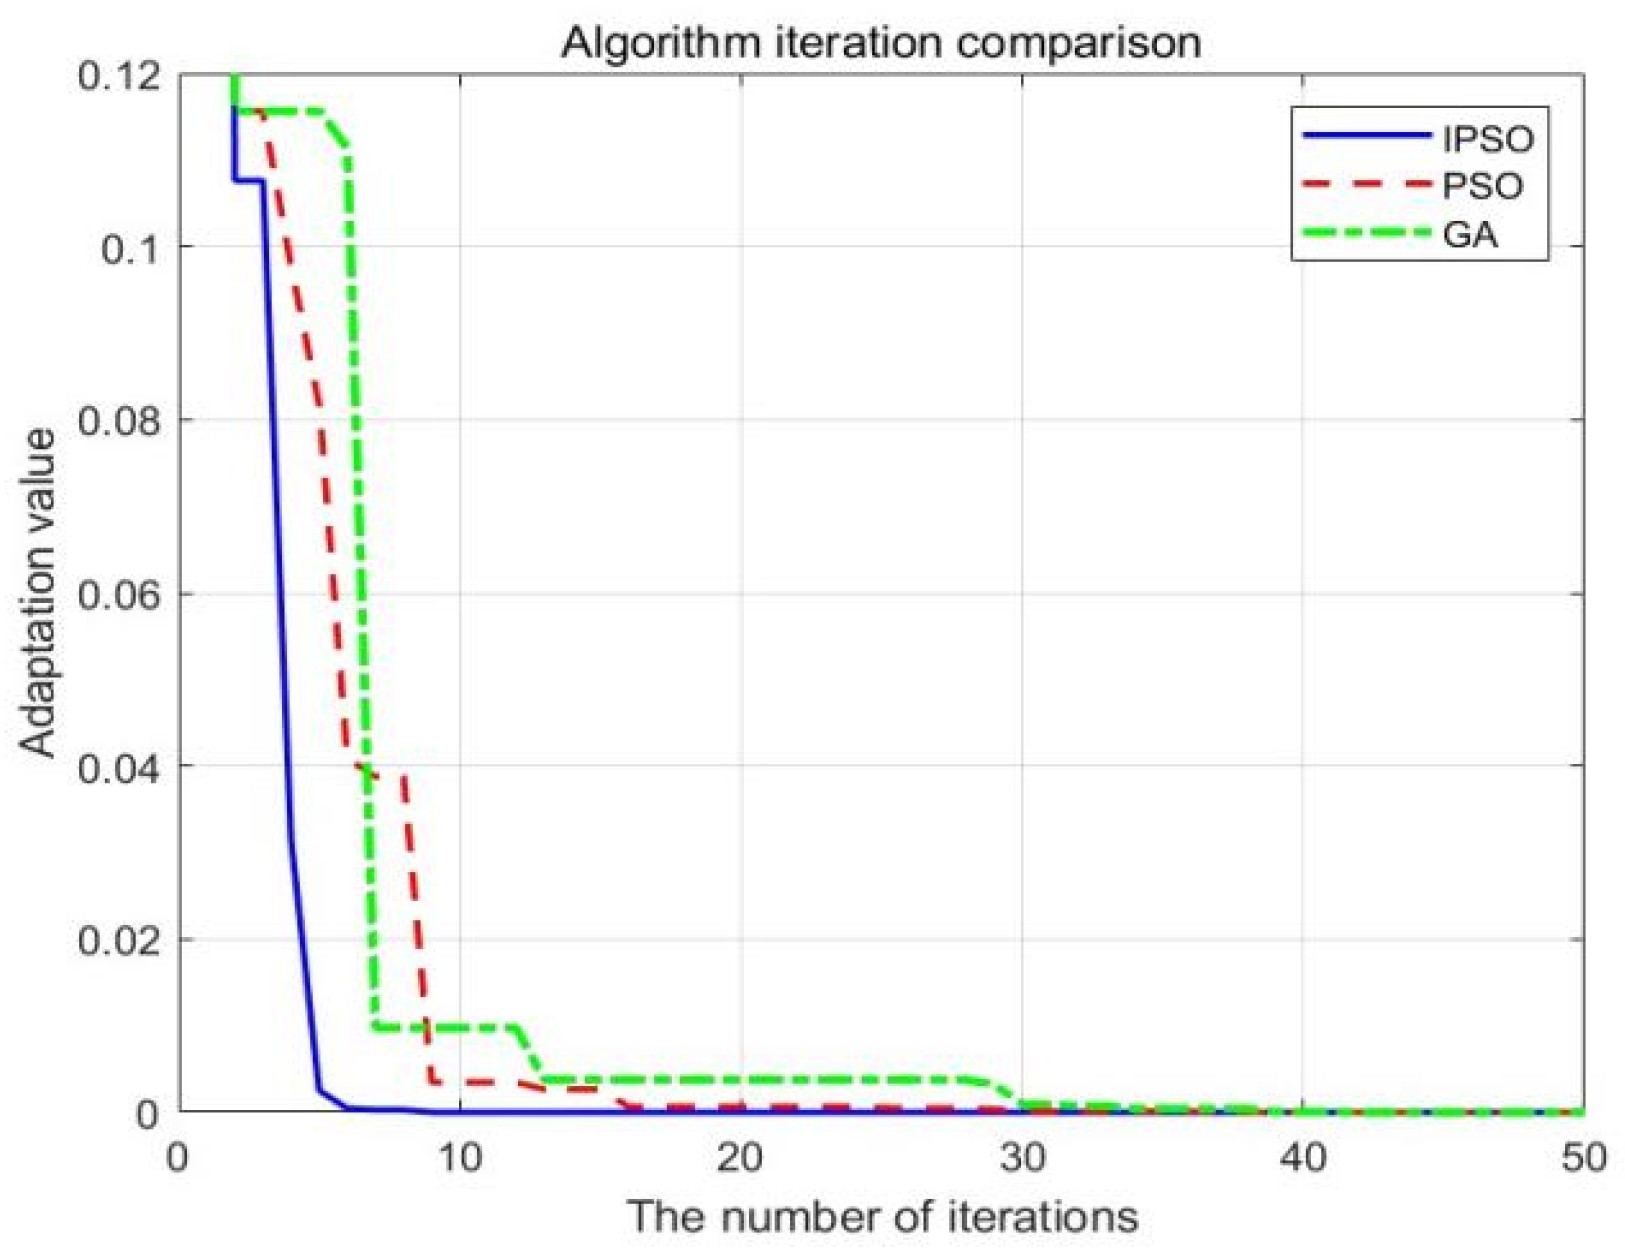

Table 1.
The access scheme for distributed power sources
| DG number | DG type | Node number | Output power during time period 1/kW | Output power during time period 2/kW |
| DG1 | WTG | 10 | 710 | 500 |
| DG2 | battery | 14 | 730 | 375 |
| DG3 | battery | 24 | 730 | 375 |
| DG4 | PVG | 31 | 430 | 120 |
Table 2.
The Level and weight of node load
| Load level | Node number | Load weight |
| Level 1 | 4、10、11、13、14、20、31、32 | 100 |
| Level 2 | 2、5、6、7、12、17、18、19、28、29、30、33 | 10 |
| Level 3 | 1、3、8、9、15、16、21、22、23、24、25、26、27 | 1 |
Table 3.
Comparison of the results of two fault restoration methods for Scheme 1 and Scheme 2.
| Fault period | Strategy | Restore load/kW | Number of switch operation | Power loss/kW |
| Time period 1 12:00-13:00 |
Scheme 1 SchemeScheme 2 |
1768.19 1535.81 |
2 0 |
90.25 110.34 |
| Time period 1 18:00-19:00 |
Scheme 1 SchemeScheme 2 |
1768.57 995 |
2 0 |
108.25 127.12 |
Table 4.
Comparison of self-healing effects
| Strategy | Self-healing recovery rate | Self-healing speed/min | Self-healing omplexity |
| Scheme 1 | 92.43% | 8.3 | 2 |
| Scheme 2 | 85.23% | 14.5 | 0 |
Disclaimer/Publisher’s Note: The statements, opinions and data contained in all publications are solely those of the individual author(s) and contributor(s) and not of MDPI and/or the editor(s). MDPI and/or the editor(s) disclaim responsibility for any injury to people or property resulting from any ideas, methods, instructions or products referred to in the content. |
© 2025 by the authors. Licensee MDPI, Basel, Switzerland. This article is an open access article distributed under the terms and conditions of the Creative Commons Attribution (CC BY) license (http://creativecommons.org/licenses/by/4.0/).
Copyright: This open access article is published under a Creative Commons CC BY 4.0 license, which permit the free download, distribution, and reuse, provided that the author and preprint are cited in any reuse.


