Submitted:
01 July 2025
Posted:
01 July 2025
You are already at the latest version
Abstract
Soil color has long been used as an indicator for soil properties such as soil organic carbon and soil moisture. Recent developments in citizen science have seen increased use of smartphone cameras for soil color measurements. However, there are high errors associ-ated with this technique. Two major sources of errors are smartphone camera and lighting condition. In this study we tested the effectiveness of using a color plate as a reference to reduce these errors on color measurements for the squares on the color plate itself, color chips in a Munsell soil color book and soil samples. The results show that the raw values of color parameters showed different patterns of biases with different smartphones and lighting conditions. The calibration reduced the errors consistently for all smartphones under all lighting conditions for the color plate squares. For the Munsell book chips or the soil samples, the calibration did not always reduce the bias but it did reduce the variations of all color parameters among smartphone and lighting condition, therefore, improved the precision of color measurements.
Keywords:
cell phone
; mobile phone
; calibration
; citizen science
; color space
; Munsell soil color book
1. Introduction
Soil color is one of the most outstanding soil morphological characteristics and is often the first property recognized or recorded by a soil scientist or a layperson [1,2]. Soil color is determined by many factors so in reverse, it has been used as an indicator for various soil properties. The most common application of soil color is probably to estimate soil organic carbon and soil moisture [3,4,5,6]. Soil color has also been used in the studies of soil genesis, classification, texture, structure and nutrients [7,8,9,10].
Despite the apparent connections between soil color and many important soil properties, until recently, measurement and use of soil color are largely descriptive and qualitative. There are several factors contribute to this. Physically, color is determined by light reflectance. For a real-life object, light reflectance is a mixture of lights in different wavelengths. So, color is also determined by how the light reflectance is perceived by human eyes. As such, the science of color is complex, cutting across disciplines such as physiology, psychology, physics, chemistry, and mineralogy [1]. It has been found that human eyes have three different color-response mechanisms and therefore color spaces generally use three parameters to represent three color stimuli [11,12]. Popular color spaces include the RGB color systems that are widely used in electronic systems and the CIE color systems defined by the International Commission on Illumination (CIE) which are often used as reference standards [13]. In soil science, soil color is traditionally recorded in the Munsell color space which defines the color space with three parameters: Hue for the type of a color; Value for the lightness of a color; and Chroma for the saturation of a color [14]. In practice, soil color is determined visually and subjectively by comparing a soil sample to chips in a Munsell soil color book. There are often substantial errors associated with this method and therefore, there is widespread perception that soil color cannot be measured accurately [4,15].
With the development of color science and spectroscopy, instrument for color measurement has evolved a lot over the past century [16]. Modern instruments have enabled soil scientists to measure soil color more precisely and accurately but more importantly, the measurement is more objective, not relying heavily on the experience and judgement of the operator. Therefore, more and more studies have been using colorimeter sensors and spectrometers for soil color data acquisition [4,5,9,17,18,19]. Another method for color data acquisition is through image analysis. Early applications of image analysis on soil properties include air photos and photos taken using handheld digital cameras [20,21,22,23,24]. A special case of handheld digital camera is smartphone camera. Smartphones are increasingly becoming a must-have portable device for everyone, and each smartphone has a camera. With the rapid development of camera capability and applications, smartphones are increasingly being used as a readily available, convenient yet powerful detection device by general citizens [2]. The potential for recording and estimating various soil properties (including color) with smartphones through citizen science is tremendous.
Many studies have been conducted in the past decade to use image analysis (especially with smartphones) as an alternative to the specialized colorimeter or spectrometer for soil color measurement to further estimate other soil properties that correlate with color. For example, Gómez-Robledo et al. [25] developed an Android application that obtains the color parameters in the Munsell and CEI color spaces. The authors found that their method had lower errors than the traditional method of visual determination of soil color from a Munsell soil color book. Aitkenhead et al. [23] extracted color and image texture information from photos taken with an iPhone 2 and used a neural network model to estimate multiple soil properties (soil structure, soil texture, bulk density, pH and drainage category). Han et al. [10] developed a method to use smartphone as a color sensor for soil classification. Perry et al. [26] tested various models on using smartphone images to estimate soil organic matter and soil moisture.
Despite the success of using image analysis for color detection, camera-derived color has been reported to have high errors [2]. Two major sources of errors are the optical characteristics of the camera and the lighting condition (illumination). Each camera has a combination of lenses and sensor which as a whole adds its unique signature to the digital color data recorded by the smartphone. Different camera settings complicate the situation even further. As a result, color parameters recorded for the same object with different cameras are not the same even all other conditions are kept the same. Gómez-Robledo et al. [25] noted the possible impact of smartphone camera on the accuracy of the predicted soil properties. Kirillova et al. [27] found that the color prediction results from two cameras were different and such discrepancy could not be effectively calibrated by using an external standard. Yang et al. [28] tested five smartphones and found that the color detection from the five phones followed different patterns at different wavelength ranges. Another well known source of errors for color measurement is the photographic lighting (illumination). As such, the CIE published a series of standard illuminants and recommended four illuminating and viewing geometries [16].
One strategy to control these errors is to standardize the camera and the light source. For example, many studies used a single camera or smartphone for all the samples [3,6,23]. To control the lighting condition, a standard light source was often used, and the lighting setup was carefully designed [25,30]. In fact, for specialized color measuring instruments, an internal light source following these CIE standards is used [29]. This strategy may work well for scientific research, but its technical requirements and high costs significantly restricted its use, especially for measurement in the field or by untrained citizens using smartphones. Another strategy to control these errors is to use an external color reference for calibration. The true values of color parameters for the color reference are measured with a reference method (e.g., a high-end spectrometer). The color reference is placed beside the target object when the photo is taken so that they will have the same errors. Based on the true values of the color reference, the color of the target object can then be corrected. One example of this strategy is the color checker card. It is often used with image postprocessing software in the photography world for color correction of a digital camera [30,31]. A less sophisticated but more common practice is to use a gray card to adjust the white balance of an image, which is believed to be able to correct the illumination difference to some degree [3,6]. However, it has been reported that using a single-color reference was not sufficient to correct the color [27].
One step further, Levin et al. [22] used plastic chips of different colors for calibration which the authors claimed can correct errors associated with both camera and lighting condition. Aitkenhead et al. [23,24] adopted this method but enhanced its applicability by replacing the plastic color chips by easily portable reference card with bands in different degrees of gray from white to black. However, none of these studies has validated the effectiveness of the calibration method or quantified the improvement in color detection with the calibration. Given the complicated patterns of errors for different smartphones in different ranges of wavelength as reported by Yang et al. [28], it is likely that a handful of data points provided by these references will not be enough for the calibration for the full range the color space albeit they may be better than a single-color reference. For soil color measurement, the most sophisticated calibration so far was probably the one conducted by Kirillova et al. [27]. The authors used a set of subsamples of the soil samples as the reference. Although this approach may be able to enhance the accuracy of the color detection significantly, preparing such a reference is difficult and time consuming. The applicability of the reference is also questionable as the range of soil color can vary a lot from region to region, from soil type to soil type and even from field to field.
Overall, there is still no validated method that can be easily applied to correct errors associated with camera and lighting condition for color measurement with image analysis. In particular, to support citizen science, the method needs to be effective, simple and inexpensive. In this study, we propose to use a color checking card (termed color plate herein) with a range of color squares, placed beside the object of interest, as the color reference to calibrate the color measurements with image analysis. The objective is to quantify the effectiveness of the proposed color calibration method for color parameters derived from different cameras under different lighting conditions on different objects including soil samples.
2. Materials and Methods
2.1. Measuring Objects
Three different types of objects were used in this study. The first was a commercially available color plate (Spyder Checkr 24 Target Color Cards, Datacolor©, Lawrenceville, NJ, USA) designed to be used together with a specialized software for postprocessing images to correct the color bias due to cameras (Figure 1). To serve the purpose of color correction for the whole color space, the color plate has 24 color squares that are distributed evenly in the color space. Taking the advantage of such design, the color plate squares were used as the color references for calibration in this study. They also served as one type of measuring objects in this study following the leave-one-out cross-validation procedure which will be described in detail in later sections.
The second type of objects were color chips in sheets taken out from a Munsell soil color book (Pantone©), which is widely used for soil color determination in soil science. Seven sheets from the book were used, including the sheets for 10R, 2.5YR, 5YR, 7.5YR, 10YR, 2.5Y, and 5Y, covering a broad range of soil colors commonly found in Canada. It should be noted that because the surface of the color chips is glossy, due to specular reflection, some color chips showed white glare in some images (Figure 1). The color detected from image analysis for these color chips obviously did not represent their true color. Therefore, these colors chips were excluded from the analysis and in total, there were 219 color chips used in the data analysis. Also, each color chip has a unique published color in the Munsell color book. These published Munsell color parameters were used as a benchmark for the validation of the reference color measurements (measured with FieldSpec 4 as described in the next section).
The third type of objects were soil samples. These soil samples were collected from sites in three Canadian provinces: New Brunswick (NB), Prince Edward Island (PEI), and Manitoba (MB) with 10 samples from each site and a total of 30 soil samples. These samples were selected because they represented the range of soil colors observed in Canada, from the blackish Chernozem in the prairies, to the yellowish Luvisolic and Podzolic soils in eastern Canada and the distinct red soil in PEI. On each site, the samples were taken along a transect going down the slope so that the samples also represented the soil catena along the slope, typically having a range of nutrient levels, especially soil organic carbon content. All samples were air-dried, passed through a 2-mm mesh sieve, and evenly spread (~1 cm thick) in petri dishes for measurement or imaging.
2.2. Reference Color Values Measured with FieldSpec 4
The color reflectance for all objects were measured with FieldSpec 4 (Malvern Panalytical, Boulder, CO, USA), a high resolution spectroradiometer. This instrument operates across a spectral range of 350–2500 nm, providing precise reflectance data that are often used to serve as a benchmark of accurate color measurements [17]. All measurements were conducted in a lab and CIE standard illuminant A was selected to minimize external light variability. During the measurement, the probe was positioned at a fixed distance of 3 cm and held at a 45-degree angle towards the object. A white reference panel was used before every ten measurements to standardize the reflectance values and maintain the accuracy of the data. Three replicate measurements were taken for each object and each measurement consisted of ten spectral reflectance readings, which were averaged to improve the accuracy of the data.
The spectral reflectance values were averaged for specific wavelength ranges corresponding to the blue (450–495 nm), green (495–570 nm), and red (620–750 nm) color channels. These values were then scaled to an 8-bit format (0–255) as the three color parameters: Red (R), Green (G) and Blue (B) for the RGB color space. The RGB values were converted to the Munsell Hue (H), Value (V), and Chroma (C) values using the munsellinterpol package in R [32]. An adjustment was applied to the H values to account for the circular nature of the hue scale, which represents continuous transitions between different types of colors. The R package used a 0 to 100 scale for H with the values of 0 and 100 corresponding to a red color. For a soil with a H value close to 0, a small error may result in huge difference in H value (e.g., a H value of 1 showed as 99 with an error of 2 H unit). Given that red hues were common among the soil samples in this study, we applied a shift of 50 units so that the starting and ending H centred at the rarely observed blue hues, minimizing the effects of the circular scale on error analysis. This adjustment was applied to all hue values in this study.
2.3. Image Acquisition
The three types of objects were place on a table and arranged with the color plate and one soil sample in the middle whereas the Munsell color book sheets on the sides (Figure 1). While there was only one soil sample in one picture, the same color plate and Munsell color book sheets were in every picture. Four smartphones were used, including an iPhone 14 (Apple Inc., Cupertino, CA, USA), a Huawei Mate 10 (Huawei Technologies Co., Ltd., Shenzhen, China), a Samsung Galaxy S23, and a Samsung Galaxy S23 Ultra (Samsung Electronics Co., Ltd., Suwon, South Korea). These smartphones were selected because they were produced in different years, by different companies or of different models. As a result, the camera specifications for these four smartphones vary a lot, potentially influencing their color acquisition performance (Table 1).
The images were captured under six lighting conditions, including two indoor and four outdoor lighting conditions. These conditions were chosen to represent typical lighting conditions in both laboratory and field studies. The two indoor lighting conditions, Inside-Dim and Inside-Normal, were set by turning on two thirds and all of the lights in the room, respectively, to represent different lighting conditions in a lab. The four outdoor lighting conditions, Overcast-AM, Overcast-PM, Sunny-AM and Sunny-PM, were designed to represent the lighting condition at different times in a day (morning and afternoon) in typical weather conditions (overcast or sunny) for field experiments.
All images were taken from a fixed top-down perspective, with the smartphones pointed straight down and positioned approximately 30 cm above the table surface. The default mode was selected with auto-focus and auto-exposure enabled to allow each device to adjust to the lighting conditions by default, but flash and HDR modes were disabled to prevent artificial color enhancement. Each layout (thus every soil sample) was photographed three times for each lighting condition with each smartphone. There was a total of 2160 photos taken. The photos were saved in their original image format (jpeg) without compression.
2.4. Image Processing and Color Calibration
The image was scaled, rotated, and cropped to a standardized resolution of 2821 × 3520 pixels using the GIMP software. A Region Of Interest (ROI) was defined for each object in the photo (Figure 1). The ROI areas were 30 × 30, 5 × 5 and 300 × 300 pixel areas for the color plate squares, Munsell book chips and soil samples, respectively, all in the centre areas of the objects. For each image, there were a total of 244 ROIs, including one for the soil samples and 24 and 219 for the color plate squares and Munsell book chips respectively. For each ROI, the RGB values for all pixels were extracted and averaged using the magick package in R [33]. The RGB values were then converted to Munsell HVC values using the munsellinterpol package in R. These RGB and HVC values were used as the raw data before the color calibration.
The color calibration was done for each color parameter in each image separately based on the image-derived versus the FieldSpec 4-measured values for the reference color plate. The image-derived raw color parameter values were plotted against the corresponding FeildSpec4-devrived values. A linear regression model was established for each color parameter between the two sets of data for the color plate squares. The regression model for a given color parameter was then applied back to each object on the image to obtain the calibrated value (aligned to the FeildSpec4 measurements) for this color parameter. This process went through one by one color parameter for all objects in the image. In the end, each object in the image will have a set of new values, considered as the calibrated (or corrected) values, for all color parameters. It should be noted that for the color plate squares, the calibration followed a leave-one-out cross-validation procedure (also called jackknife cross-validation). To calculate the calibrated value for a given square, the linear regression model was built on the data for the other 23 squares, leaving out only the square to be calculated. By doing so, potential bias due to the square in question itself being included in the regression analysis can be avoided. However, for the Munsell book chips and the soil samples, all 24 squares were used in building the regression models.
2.5. Precision and Accuracy Assessment for the Uncalibrated and Calibrated Data
All data analyses were conducted in R using the tidyversepackage [34]. For the FieldSpec 4 spectrometer data, mean, standard deviation (SD), and coefficient of variation (CV) were calculated from the three repeated measurements for each color parameter of each object. Statistical metrics (mean, minimum, maximum, percentiles and range) were calculated for each type of objects for the above mean, SD and CV (calculated from the three repeats) to assess the precision and accuracy of the FieldSpec 4 measurements.
To assess precision and accuracy of the smartphone image analysis data, the smartphone-derived values were plotted against the FieldSpec 4-measured values, and a linear regression model was established for these two sets of data via regression analysis. The coefficient of determination (R2) of the model and the slope of the regression line and its distance to the 1:1 line were used to assess the accuracy and precision of the smartphone-derived values. Error of the smartphone-derived value for each color parameter of each object in each image was calculated by subtracting it by the corresponding FieldSpec 4-measured value. Mean and SD of the errors for a given object under different lighting conditions were calculated for each phone. Statistical metrics (mean, minimum, maximum, percentiles and range) for the means and SDs among all the objects of a given type were calculated to assess the effects of lighting conditions on the accuracy and precision of the color parameters. Similarly, Mean and SD of the errors for a given object were calculated for different smartphones under each lighting condition and statistical metrics of these means and SDs among all objects of a given type were calculated to assess the effects of smartphones on the accuracy and precision of the color parameters. These analyses were done for each color parameter separately and for the uncalibrated and calibrated smartphone-derived values separately so that the enhancement of the calibration for each individual color parameter can be quantified.
It should be noted that for the same layout of a specific soil sample (the color plate and all the Munsell book sheets were in every photo), although three images were taken with a specific smartphone under a specific lighting condition, only one image was used in the above mentioned analyses. This was done because analysis with the three images showed that the repeatability of the data derived from the three images were very high and errors were negligible (typically less than 0.1%). By using only one image, the results reflect the citizen science scenario more realistically since the requirement for taking three pictures could be a hurdle for ordinary citizens to participate in such exercises. In the same vein, for the color plate square and Munsell book chip data analysis, only photos for one soil sample should be used because the color plate and Munsell book sheets were in every photo and as such, for the same smartphone of the same lighting condition, there were 30 photos, each for one soil sample. The results were almost identical no matter which soil sample was picked. The data presented in this manuscript was for a randomly selected soil sample (BR-317) from the New Brunswick site.
3. Results
3.1. The FieldSpec 4 Measurements
The FieldSpec 4 measurements were very precise, as evidenced in the low standard deviation (SD) and coefficient of variance (CV) values of the three repeated readings for all color parameters in both color spaces and all three types of objects tested in this study (Table 2). For the color plate squares, in the RGB color space, mean SD for the six color parameters ranged from 0.08 to 0.14 with mean CV ranged from 0.08% to 0.16% while in the Munsell color space, mean SD for the six color parameters ranged from 0.003 to 0.021 with mean CV ranged from 0.03% to 0.27%. Even at the 90th percentile, the highest SD was only 0.33 and the highest CV was only 0.51% among all color parameters in both color spaces.
For the Munsell book chips and the soil samples, the SD and CV values were noticeably higher than those for the color plate squares. The higher SD and CV values for the soil samples were likely due to the higher natural variation in color of soil samples. Color of a soil sample obviously will not be as uniform as the color plate squares, which were factory made to serve as color reference. The soil samples also had rougher surfaces which may have higher noises due to shadows created by the particles. For the Munsell book chips, the higher SD and CV values may also be related to the surface condition of the chips, which were glossy and reflective, making its actual color hard to discern under varying light (the ones with white glare have already been excluded from the analysis). Besides, the Munsell color chips were in sheets, which were hard to fit under the FieldSpec 4 for measurements. Therefore, the human operational errors could be higher too. Nevertheless, the SD and CV values were still at very low levels even at the 90th percentile, with the highest SD and CV of 1.52 and 1.54%, respectively, for the Munsell book chips and of 0.66 and 0.71%, respectively, for the soil samples.
The accuracy of the FieldSpec 4 and the formulas used to convert the spectral measurements to the Munsell color parameters were validated against the book values for the Munsell book chips. For Hue, Value and Chroma, the FieldSpec 4-measured values all correlated very well with the book values, with R2 of 0.96, 0.97 and 0.96, respectively (Figure 2). The FieldSpec 4-measured values generally fell close to the 1:1 line with the book values and the slopes of the regression lines were all close to 1. These all indicate that the FieldSpec 4-measured values matched the book values well. However, there were noticeable discrepancies. First, for the same book values, the FieldSpec 4-measured values varied. Among the three Munsell color parameters, Chroma appeared to have the highest variations which was reflected in that the data points had wider ranges for the same book values of Chroma than those for other two color parameters (Figure 2). Also, for both Chroma and Hue, there were slight but consistent underestimations and for Value, the slope of the regression line deviated the most from the 1:1 line. These discrepancies could be due to measurement errors, distortions rooted from the conversion formulas or errors with the Munselle soil color book.
3.2. The Color Plate Squares
The leave-one-out cross-validation with the color plate showed that using the color plate as a reference, variations due to lighting condition and smartphone can be reduced substantially for all six color parameters examined in this study. The adjustment with the color plate can be well illustrated using the Value parameter (V) in the Munsell color space as an example. Before calibrated using the color plate, the smartphone-derived V with an iPhone 14 under the same lighting conditions correlated very well with the FieldSpec 4-measured V (R2 ranged from 0.97 to 0.99, Figure 3Aa). This means that the relative differences of V were well reflected in the smartphone-derived V when lighting condition was set. However, the regression lines were quite different for different lighting conditions, some had a consistent bias (e.g., for Inside-Dim) and some had a steeper slope than the 1:1 line (e.g., for Overcast-AM and Overcast-PM). As a result, the smartphone-derived V varied in a wide range, even with the same phone, when data from the six lighting conditions were pooled together (Figure 3Ac). This means that the lighting condition will introduce large uncertainty to the smartphone-derived V.
After calibrating the smartphone-derived V using the color plate, under each lighting condition, the data points were brought closer to the 1:1 line although the correlations coefficient remained similar or even dropped slightly (R2 ranged from 0.96 to 0.99, Figure 3Ab). As a result, when data from the six lighting conditions were pooled together, the variation ranges were much smaller than those of the uncalibrated data (Figure 3Ac, 3Ad). Accordingly, the correlation was also greatly improved (R2 increased from 0.83 to 0.98) and the regression line also aligned much better to the 1:1 line. The improvement is also reflected well in the errors of the smartphone-derived V (differences to FieldSpec 4-measured V), where the data points were brought closer to the zero line (smaller error values) and closer to each other (smaller variation) (Figure 3Ae, 3Af).
Similar effects were observed for all other color parameters and for all other smartphones. After the calibration, the error values were reduced by an order of magnitude or more in most cases, indicating that the calibration has brought the smartphone-derived values of all color parameters much closer to the FieldSpec 4 measured values (Table 3). Moreover, Standard Deviation (SD) of the errors, a measure indicating the dispersion of the data due to different lighting conditions, were also drastically reduced (by half in most cases), except for those for Hue, which increased after the calibration. The narrower ranges of the errors indicate that the calibration has increased the precision of the smartphone-derived values.
The effects of calibration using the color plate on different phones were similar to those on different lighting conditions described above. Using the Munsell-V under Inside-Dim lighting condition as an example, for individual smartphones, before calibration, the smartphone-derived V correlated very well (R2 ranged from 0.96 to 0.98) with the FieldSpec 4-measured V, indicating that the smartphone-derived V reflected the relative differences of V very well (Figure 3Ba). However, there were noticeable differences among the regression lines of individual smartphones and as a result, the smartphone-derived V varied in a wide range when data from the four smartphones were pooled together (Figure 3Bc). The overall correlation between the smartphone-derived V and the FieldSpec 4-measured V was still strong (R2 of 0.81) but there were noticeable differences between the regression line and the 1:1 line. After calibration, data points were brought closer to the 1:1 line for individual smartphones although the correlation coefficient stayed similar (R2 ranged from 0.94 to 0.97) (Figure 3Bb). When data from the four smartphones were pooled together, data points were clustered much closer to the 1:1 line and together to each other than the uncalibrated data (Figure 3Bd). The regression line had a much greater correlation coefficient (R2 of 0.96). Overall, looking it from the perspective of errors, calibration reduced the variation of the errors (more precise) as well as the magnitude of the errors (more accurate) (Figure 3Be, 3Bf). Similar effects were observed for all other parameters and under all other lighting conditions. After the calibration, the error values were reduced dramatically (by one to two orders of magnitude in most cases) and except for Munsell-H, the SD of the errors also reduced a lot (by half in most cases) (Table 4).
When data from all combinations of lighting condition and smartphone were pooled together, the effect of calibration was similar: it increased the correlation between the smartphone-derived V and the FieldSpec 4-measured values (for V, R2 changed from 0.84 to 0.95) and the range of error were also greatly reduced (Figure 4). These results indicate that under variable lighting conditions using different smartphones, both precision and accuracy of the smartphone-derived values for all color parameters (except for the precision of Munsell-H) can be substantially enhanced with the calibration.
3.3. The Munsell Book Chips
For the Munsell book chips, with a given smartphone under a given lighting condition, the uncalibrated smartphone-derived values also correlated well with the FieldSpec 4-meausred values. However, the correlations were not as strong as those for the color plate squares under the same settings. Taking the Munsell-V as an example again, with iPhone 14, the R2 ranged from 0.89 to 0.95 for different lighting conditions for the Munsell book chips (data not shown), lower than those for the color plate squares (R2 ranged from 0.97 to 0.99, Figure 3Aa). This indicates that there were higher variations thus lower precision with the Munsell book chips than with the color plate squares. This could be due to the material itself (color is less uniform for the Munsell book chips than for the color plate squares) or the higher errors associated with the FieldSpec 4 measurements with the Munsell book chips as described previously (Table 2). There was also a consistent underestimation on all color parameters as evidenced in that the mean of errors (calculated as the smartphone-derived values minus the FieldSpec 4-meausred values) were negative with very few exceptions (Table 3). Higher errors associated with the FieldSpec 4 measurements on Munsell book chips can’t explain this systematic negative bias because the errors were not always negative (e.g., Munsell-Value had positive mean errors for the most part of the data range, Figure 2). It was speculated that the bias was mainly due to the material differences of the objects. For example, light reflection on Munsell book chips was probably not as effective as on color plate squares so that they appeared dull under ordinary lighting compared to under the intense light of FieldSpec 4.
Similar to that with the color plate squares, calibration using the color plate did not enhance the correlations between smartphone-derived and FieldSpec 4-measured color parameters for a given smartphone under a given lighting condition and the R2 stayed at the same level after the calibration (e.g., R2 range remained between 0.89 and 0.95 for Munsell-V with iPhone 14 under different lighting conditions, data not shown). A major difference compared to the color plate squares was that the calibration did not reduce the error (the absolute value) for the Munsell book chips. It actually increased it for the Munsell-V for iPhone 14 (Figure 5Aa, 5Ab) and for about half of the other color parameters under other settings as well (Table 3, 4). This indicates that the calibration was ineffective in removing the systematic bias of the data. However, the calibration did reduce the difference between lighting conditions and smartphones. As a result, when data from different lighting conditions or different smartphones were pooled together, the data points in the charts were clustered closer to each other after the calibration (e.g., Figure 5Ac, 5Ad). This was reflected in the SD of the errors as the means of SD of errors for the calibrated values were much lower than the uncalibrated ones with only a few exceptions (Table 3, 4). The correlations between the smartphone-derived and the FieldSpec 4-measured values were also enhanced after the calibration (e.g., for Munsell-V, R2 changed from 0.80, 0.78 and 0.80 to 0.90, 0.82 and 0.85 for the pooled data for iPhone 14, Inside-Dim and combined data of all settings, respectively; Figure 5A). Overall, the results indicate that although the calibration were ineffective in removing biases, it did enhance precision thus the power of the smartphones to distinguish different colors of the Munsell book chips.
3.4. Soil Samples
For the soil samples, the patterns were very similar to those of Munsell book chips. Under individual settings (smartphone and lighting), the smartphone-derived and FieldSpec 4-measured values correlated very well with each other but there were large differences between smartphones and between lighting conditions (data not shown). This indicates lower precision with the soil samples than with the color plate squares which, similar to the Munsell book chips, could be due to the material itself or the higher errors of the FieldSpec 4 measurements. There again was a consistent underestimation on all color parameters and the mean of errors were mostly negative values with very few exceptions (Table 3, 4). This bias was attributed to the material difference between the soil samples and the color plate squares.
The effects of calibration were also similar to that with the Munsell book chips. It did not reduce the negative bias but brought the data points of different settings closer together, resulting in the same level of errors (absolute value) but lower SD of errors than the uncalibrated data (Figure 5Ba, 5Bb; Table 3, 4). The correlations between the smartphone-derived and the FieldSpec 4-measured values were also enhanced drastically after the calibration (e.g., for Munsell-V, R2 changed from 0.54, 0.59 and 0.55 to 0.87, 0.95 and 0.83 for the pooled data for iPhone 14, Inside-Dim and the combined data of all settings, respectively, Figure 5B). This again confirms that although the calibration was unable to reduce the bias, it was effective in improving the precision of smartphone-derived color parameters.
4. Discussion
4.1. The Color Reference
The color plate was used as the color reference in this study. For the color plate squares, the calibration was a cross-validation. The results proved that the calibration could enhance both the precision and accuracy of the smartphone-derived color parameters when the pictures were taken with different phones or under different lighting conditions. For the other two types of objects, the Munsell book chips and the soil samples, the calibration was not able to reduce the biases but did enhance the precision of the smartphone-derived color parameters. The biases can be explained by the differences in the materials of the objects. The color plate was professionally manufactured as a color reference so that the uniformity of color must have been kept at a very high level. It has a smooth but not glossy surface which scatters lights from all directions. The Munsell book is designed to be used for visual color comparison. It has a slightly glossy surface with random patterns of unevenness. Depending on the direction of the light source and the camera shooting angle, there could be patches on the chips with high and low reflections (Figure 1). The soil samples had a less smooth surface. The soil particles could have some shadows depending on the direction of the light source. Soil is also a very different material that could reflect lights very differently from the color plate.
To reduce the systematic biases of the smartphone-derived color parameters, it is critical to keep the material and surface condition of the object as close as possible to the color reference [22,26,27]. For example, for soil sample measurement, instead of using the color plate used in this study, a color reference homemade from clay or dyed soil may work better [27]. These color references need to have color units cover the full ranges of different color parameters of the target objects and each color unit needs to have a set of “true” values for all color parameters, which can be measured with a reference machine like FieldSpec 4. That being said, in many applications, the relative differences in color are what really matters (e.g., using soil color to estimate soil organic carbon content). For these applications, it is not necessary to obtain the true values of the color parameters themselves, but the precision of relative differences between objects is very important. In such case, the color plate used in this study will work well as it enhances the precision of the results so that it has a better chance to tell the difference when there is indeed a difference.
The calibration in this study was based on linear regressions between the smartphone-derived and the FieldSpec 4-measured values. However, these relationships were not always linear. In fact, in most cases, the correlations were non-linear (e.g., Figure 3Aa, 3Ba). Tests have been conducted with higher degree of polynomial equations to fit the data points. The R2 values were generally higher with these polynomial equations but extreme values carried heavier weight in determining the equations. As a result, the errors for data points within the normal range were often higher than with the linear regression. Therefore, linear regression was chosen in this study.
4.2. Choosing Smartphones and Lighting Conditions
Among the four smartphones tested, assessed based on the errors, without calibration, it appeared that Huawei Mate 10 performed the best and iPhone 14 did not perform as well as the other phones (Table 3). Such differences could be due to the auto adjustment introduced in the newer smartphones with default mode. Nevertheless, after calibration, the differences disappeared and the errors and SD of errors for iPhone 14 were mostly smaller or at the same level as the other phones. Among the six lighting conditions, without calibration, it appeared that the Inside-Normal, Overcast-AM and Overcast-PM lighting conditions yielded better results than the other ones (Table 4). After calibration, the differences between lighting conditions have been reduced a lot but the overall pattern still existed. These mean that with the calibration, the choice of smartphone did not have noticeable effects on the results, but the choice of lighting condition did. The Inside-Normal, Overcast-AM and Overcast-PM were the better performed lighting conditions. The poor performance of the Inside-Dim lighting is an indication that sufficient lighting is required for a better result. The poor performance of the Sunny-AM and Sunny-PM lighting was likely due to the contrasts between the bright color under direct sunshine and the dark shadow due to surface roughness. Such effects could be reduced by blocking the direct sunlight, using an umbrella for example.
4.3. Applications of the Calibration Method
Analyses with the 30 photos of the same lighting conditions using the same smartphone (with 30 soil samples) for both the color plate squares and the Munsell book chips showed high R2 values (typically greater than 95%) between the smartphone-derived and FieldSpec 4-measured values (data not shown). The errors and SD of errors were also much lower than those with varying light conditions or smartphones (data not shown). This was not a surprise as many studies have suggested to fix the lighting and use the same photography device for color detection using image analysis [15,22,24,30]. The calibration has proven to reduce the differences between smartphones or between lighting conditions but it can not eliminate errors created due to these differences. Therefore, to apply the method to measure soil color in a lab, it is recommended to use the same smartphone and keep the lighting condition the same as much as possible.
This study also showed the different response of different types of objects, relating to the material differences, surface condition and the uniformity of color of the objects. Therefore, for soil color measurement, the soil samples need to be prepared in the same way. This includes the drying, grinding and sieving processes to keep the moisture level and particle size of the samples the same. It also requires the surface of the sample to be smoothed in the same way so that the surface roughness of the sample are approximately the same for all samples.
A more valuable application of the method is for field use. The ability of correcting different smartphones and lighting conditions enables ordinary citizens to participate in data collection of soil colors at any locations. To reduce errors, it is again recommended to use the same smartphone under similar lighting conditions as much as possible. Concerning lighting condition, measurements can be taken in days of similar weather (e.g., overcast) at about the same time in a day (e.g., always between 9 am and 11 am). If measurement has to be taken in a sunny day, direct sunlight should be avoided by blocking it using an umbrella or other tools. Moreover, the soil surface needs to be prepared so that it resembles that of the color plate.
Although the calibration method was developed to measure soil color, it should be applicable to color measurement for other objects since the principle would be the same. For example, it may be applicable to measure colors of water samples or plant tissue samples. The aforementioned recommendations are based on this study. Obviously, more studies are required to test the validity of the method to be used for field experiments and for other objects.
5. Conclusions
Soil color is an indicator for many soil properties and image analysis allows for color detection by ordinary citizens using their smartphone phone by taking a picture of the soil. However, color detected using a smartphone is strongly affected by the smartphone used and the lighting condition when the picture is taken. In this study, we developed a method by placing a color plate beside the target object while taking the picture and use the color plate as a reference to calibrate color parameters derived from a smartphone image. Three types of objects were tested, the color plate squares themselves, Munsell book chips and soil samples. The results show that for the color plate squares, the calibration reduced the errors consistently for all smartphones under all lighting conditions but for the Munsell book chips and soil samples, error reductions were not as consistent. However, the calibration did reduce the variations of all color parameters with different smartphones and lighting conditions for all three objects, thus improved the precision of color detection. This in turn will lead to enhanced prediction power (high R2) of using color to estimate related soil properties such as soil organic matter.
Author Contributions
Conceptualization, S.L.; methodology, S.L., F.Z., Y.K., A.K, D.L., M.G.; software, F.Z., A.K.; validation, S.L., F.Z.; formal analysis, F.Z., S.L.; investigation, F.Z., Y.K., S.L., A.K., M.G., D.L.; resources, S.L., D.L.; data curation, Y.K., F.Z.; writing—original draft preparation, S.L., F.Z.; writing—review and editing, S.L., F.Z., Y.K., A.K., D.L., M.G.; visualization, F.Z., S.L., Y.K.; supervision, S.L.; project administration, S.L.; funding acquisition, S.L. All authors have read and agreed to the published version of the manuscript.
Funding
“This research was funded by an Enabling Agricultural Research and Innovation (EARI) project “Developing a science based grass-roots level tool for systematic field evaluation of soil health in New Brunswick” (J-003242, PI: Li) managed by the province of New Brunswick via the Canadian Agricultural Partnership, as well as the Agriculture and Agri-food Canada project “Sustainability measures to monitor and analyze the environmental impact of Canadian agriculture” [project number J-002316] (PI: McDonald).
Institutional Review Board Statement
Not applicable.
Informed Consent Statement
Not applicable.
Data Availability Statement
The datasets presented in this article are not readily available because the data are part of an ongoing study. Requests to access the datasets should be directed to Sheng.Li@agr.gc.ca.
Acknowledgments
The authors would like to acknowledge Cory Barstow, Megan Bent, Sarah Etheridge and Rebekah Kiested for helping with data collection and sample processing.
Conflicts of Interest
The authors declare no conflicts of interest.
References
- Bigham, J.; Ciolkosz, E.; Luxmoore, R. Soil color: proceedings of a symposium sponsored by Divisions S-5 and S-9 of the Soil Science Society of America in San Antonio, Texas, 21-26 Oct. 1990. (No Title) 1993.
- Naeimi, M.; Daggupati, P.; Biswas, A. Image-based soil characterization: A review on smartphone applications. Computers and Electronics in Agriculture 2024, 227, 109502. [Google Scholar] [CrossRef]
- Persson, M. Estimating surface soil moisture from soil color using image analysis. Vadose Zone J. 2005, 4, 1119–1122. [Google Scholar] [CrossRef]
- Wills, S.A.; Burras, C.L.; Sandor, J.A. Prediction of soil organic carbon content using field and laboratory measurements of soil color. Soil Sci. Soc. Am. J. 2007, 71, 380–388. [Google Scholar] [CrossRef]
- Liles, G.C.; Beaudette, D.E.; O’Geen, A.T.; Horwath, W.R. Developing predictive soil C models for soils using quantitative color measurements. Soil Sci. Soc. Am. J. 2013, 77, 2173–2181. [Google Scholar] [CrossRef]
- Fu, Y.; Taneja, P.; Lin, S.; Ji, W.; Adamchuk, V.; Daggupati, P.; Biswas, A. Predicting soil organic matter from cellular phone images under varying soil moisture. Geoderma 2020, 361, 114020. [Google Scholar] [CrossRef]
- Viscarra Rossel, R.A.; Cattle, S.R.; Ortega, A.; Fouad, Y. In situ measurements of soil colour, mineral composition and clay content by vis–NIR spectroscopy. Geoderma 2009, 150, 253–266. [Google Scholar] [CrossRef]
- Ibáñez-Asensio, S.; Marques-Mateu, A.; Moreno-Ramón, H.; Balasch, S. Statistical relationships between soil colour and soil attributes in semiarid areas. Biosyst. Eng. 2013, 116, 120–129. [Google Scholar] [CrossRef]
- Moritsuka, N.; Matsuoka, K.; Katsura, K.; Sano, S.; Yanai, J. Soil color analysis for statistically estimating total carbon, total nitrogen and active iron contents in Japanese agricultural soils. Soil Sci. Plant Nutr. 2014, 60, 475–485. [Google Scholar] [CrossRef]
- Han, P.; Dong, D.; Zhao, X.; Jiao, L.; Lang, Y. A smartphone-based soil color sensor: For soil type classification. Computers and Electronics in Agriculture 2016, 123, 232–241. [Google Scholar] [CrossRef]
- Young, T. II. The Bakerian Lecture. On the theory of light and colours. Philosophical Transactions of the Royal Society of London 1802, 92, 12–48. [Google Scholar]
- Buchsbaum, G.; Gottschalk, A. Trichromacy, opponent colours coding and optimum colour information transmission in the retina. Proceedings of the Royal society of London. Series B. Biological sciences 1983, 220, 89–113. [Google Scholar] [PubMed]
- Tkalcic, M.; Tasic, J.F. Colour spaces: perceptual, historical and applicational background. In Proceedings of the The IEEE Region 8 EUROCON 2003. Computer as a Tool., 22-24 Sept. 2003, 2003; pp. 304-308 vol.301.
- Pendleton, R.L. , Nickerson, Dorothy. Soil colors and special Munsell soil color charts. Soil Science 1951, 71, 35–44. [Google Scholar] [CrossRef]
- Torrent, J.; Barrón, V. Laboratory measurement of soil color: theory and practice. Soil color 1993, 31, 21–33. [Google Scholar]
- Marcus, R.T. chapter 2 - The Measurement of Color. In AZimuth, Nassau, K., Ed.; North-Holland: 1998; Volume 1, pp. 31-96.
- Barthod, L.R.; Liu, K.; Lobb, D.A.; Owens, P.N.; Martínez-Carreras, N.; Koiter, A.J.; Petticrew, E.L.; McCullough, G.K.; Liu, C.; Gaspar, L. Selecting color-based tracers and classifying sediment sources in the assessment of sediment dynamics using sediment source fingerprinting. J. Environ. Qual. 2015, 44, 1605–1616. [Google Scholar] [CrossRef] [PubMed]
- Stiglitz, R.; Mikhailova, E.; Post, C.; Schlautman, M.; Sharp, J. Evaluation of an inexpensive sensor to measure soil color. Computers and Electronics in Agriculture 2016, 121, 141–148. [Google Scholar] [CrossRef]
- Das, B.; Chakraborty, D.; Singh, V.K.; Das, D.; Sahoo, R.N.; Aggarwal, P.; Murgaokar, D.; Mondal, B.P. Partial least square regression based machine learning models for soil organic carbon prediction using visible–near infrared spectroscopy. Geoderma Reg. 2023, 33, e00628. [Google Scholar] [CrossRef]
- Parry, J.; Cowan, W.; Heginbottom, J. Soils Studies Using Color Photos. Photogrammetric Engineering 1969, 35, 44–56. [Google Scholar]
- Chen, F.; Kissel, D.E.; West, L.T.; Adkins, W. Field-scale mapping of surface soil organic carbon using remotely sensed imagery. Soil Sci. Soc. Am. J. 2000, 64, 746–753. [Google Scholar] [CrossRef]
- Levin, N.; E., B.D.; and Singer, A. A digital camera as a tool to measure colour indices and related properties of sandy soils in semi-arid environments. International Journal of Remote Sensing 2005, 26, 5475–5492. [CrossRef]
- Aitkenhead, M.; Coull, M.; Gwatkin, R.; Donnelly, D. Automated Soil Physical Parameter Assessment Using Smartphone and Digital Camera Imagery. Journal of Imaging 2016, 2, 35. [Google Scholar] [CrossRef]
- Aitkenhead, M.; Cameron, C.; Gaskin, G.; Choisy, B.; Coull, M.; Black, H. Digital RGB photography and visible-range spectroscopy for soil composition analysis. Geoderma 2018, 313, 265–275. [Google Scholar] [CrossRef]
- Gómez-Robledo, L.; López-Ruiz, N.; Melgosa, M.; Palma, A.J.; Capitán-Vallvey, L.F.; Sánchez-Marañón, M. Using the mobile phone as Munsell soil-colour sensor: An experiment under controlled illumination conditions. Computers and electronics in agriculture 2013, 99, 200–208. [Google Scholar] [CrossRef]
- Taneja, P.; Vasava, H.K.; Daggupati, P.; Biswas, A. Multi-algorithm comparison to predict soil organic matter and soil moisture content from cell phone images. Geoderma 2021, 385, 114863. [Google Scholar] [CrossRef]
- Kirillova, N.; Zhang, Y.; Hartemink, A.; Zhulidova, D.; Artemyeva, Z.; Khomyakov, D. Calibration methods for measuring the color of moist soils with digital cameras. Catena 2021, 202, 105274. [Google Scholar] [CrossRef]
- Yang, J.; Shen, F.; Wang, T.; Luo, M.; Li, N.; Que, S. Effect of smart phone cameras on color-based prediction of soil organic matter content. Geoderma 2021, 402, 115365. [Google Scholar] [CrossRef]
- HunterLab. Spectrophotometer vs. Colorimeter: What’s the Difference? Available online: https://www.hunterlab.com/blog/spectrophotometer-vs-colorimeter-whats-the-difference/ (accessed on June 6).
- Liu, G.; Tian, S.; Xu, G.; Zhang, C.; Cai, M. Combination of effective color information and machine learning for rapid prediction of soil water content. Journal of Rock Mechanics and Geotechnical Engineering 2023, 15, 2441–2457. [Google Scholar] [CrossRef]
- Datacolor. Spyder Checkr user guide; 2023.
- Gama, J.; Centore, P.; Davis, G. Munsellinterpol: Interpolate Munsell Renotation Data from Hue/Chroma to CIE/RGB. R package version 2020, 2. [Google Scholar]
- Ooms, J. magick: Advanced graphics and image-processing in R, version 2.7. 4: http://CRAN. R-project. org/package= magick 2023.
- Wickham, H.; Averick, M.; Bryan, J.; Chang, W.; McGowan, L.D.A.; François, R.; Grolemund, G.; Hayes, A.; Henry, L.; Hester, J. Welcome to the Tidyverse. Journal of open source software 2019, 4, 1686. [Google Scholar] [CrossRef]
Figure 1.
Layout of the objects in the photos.
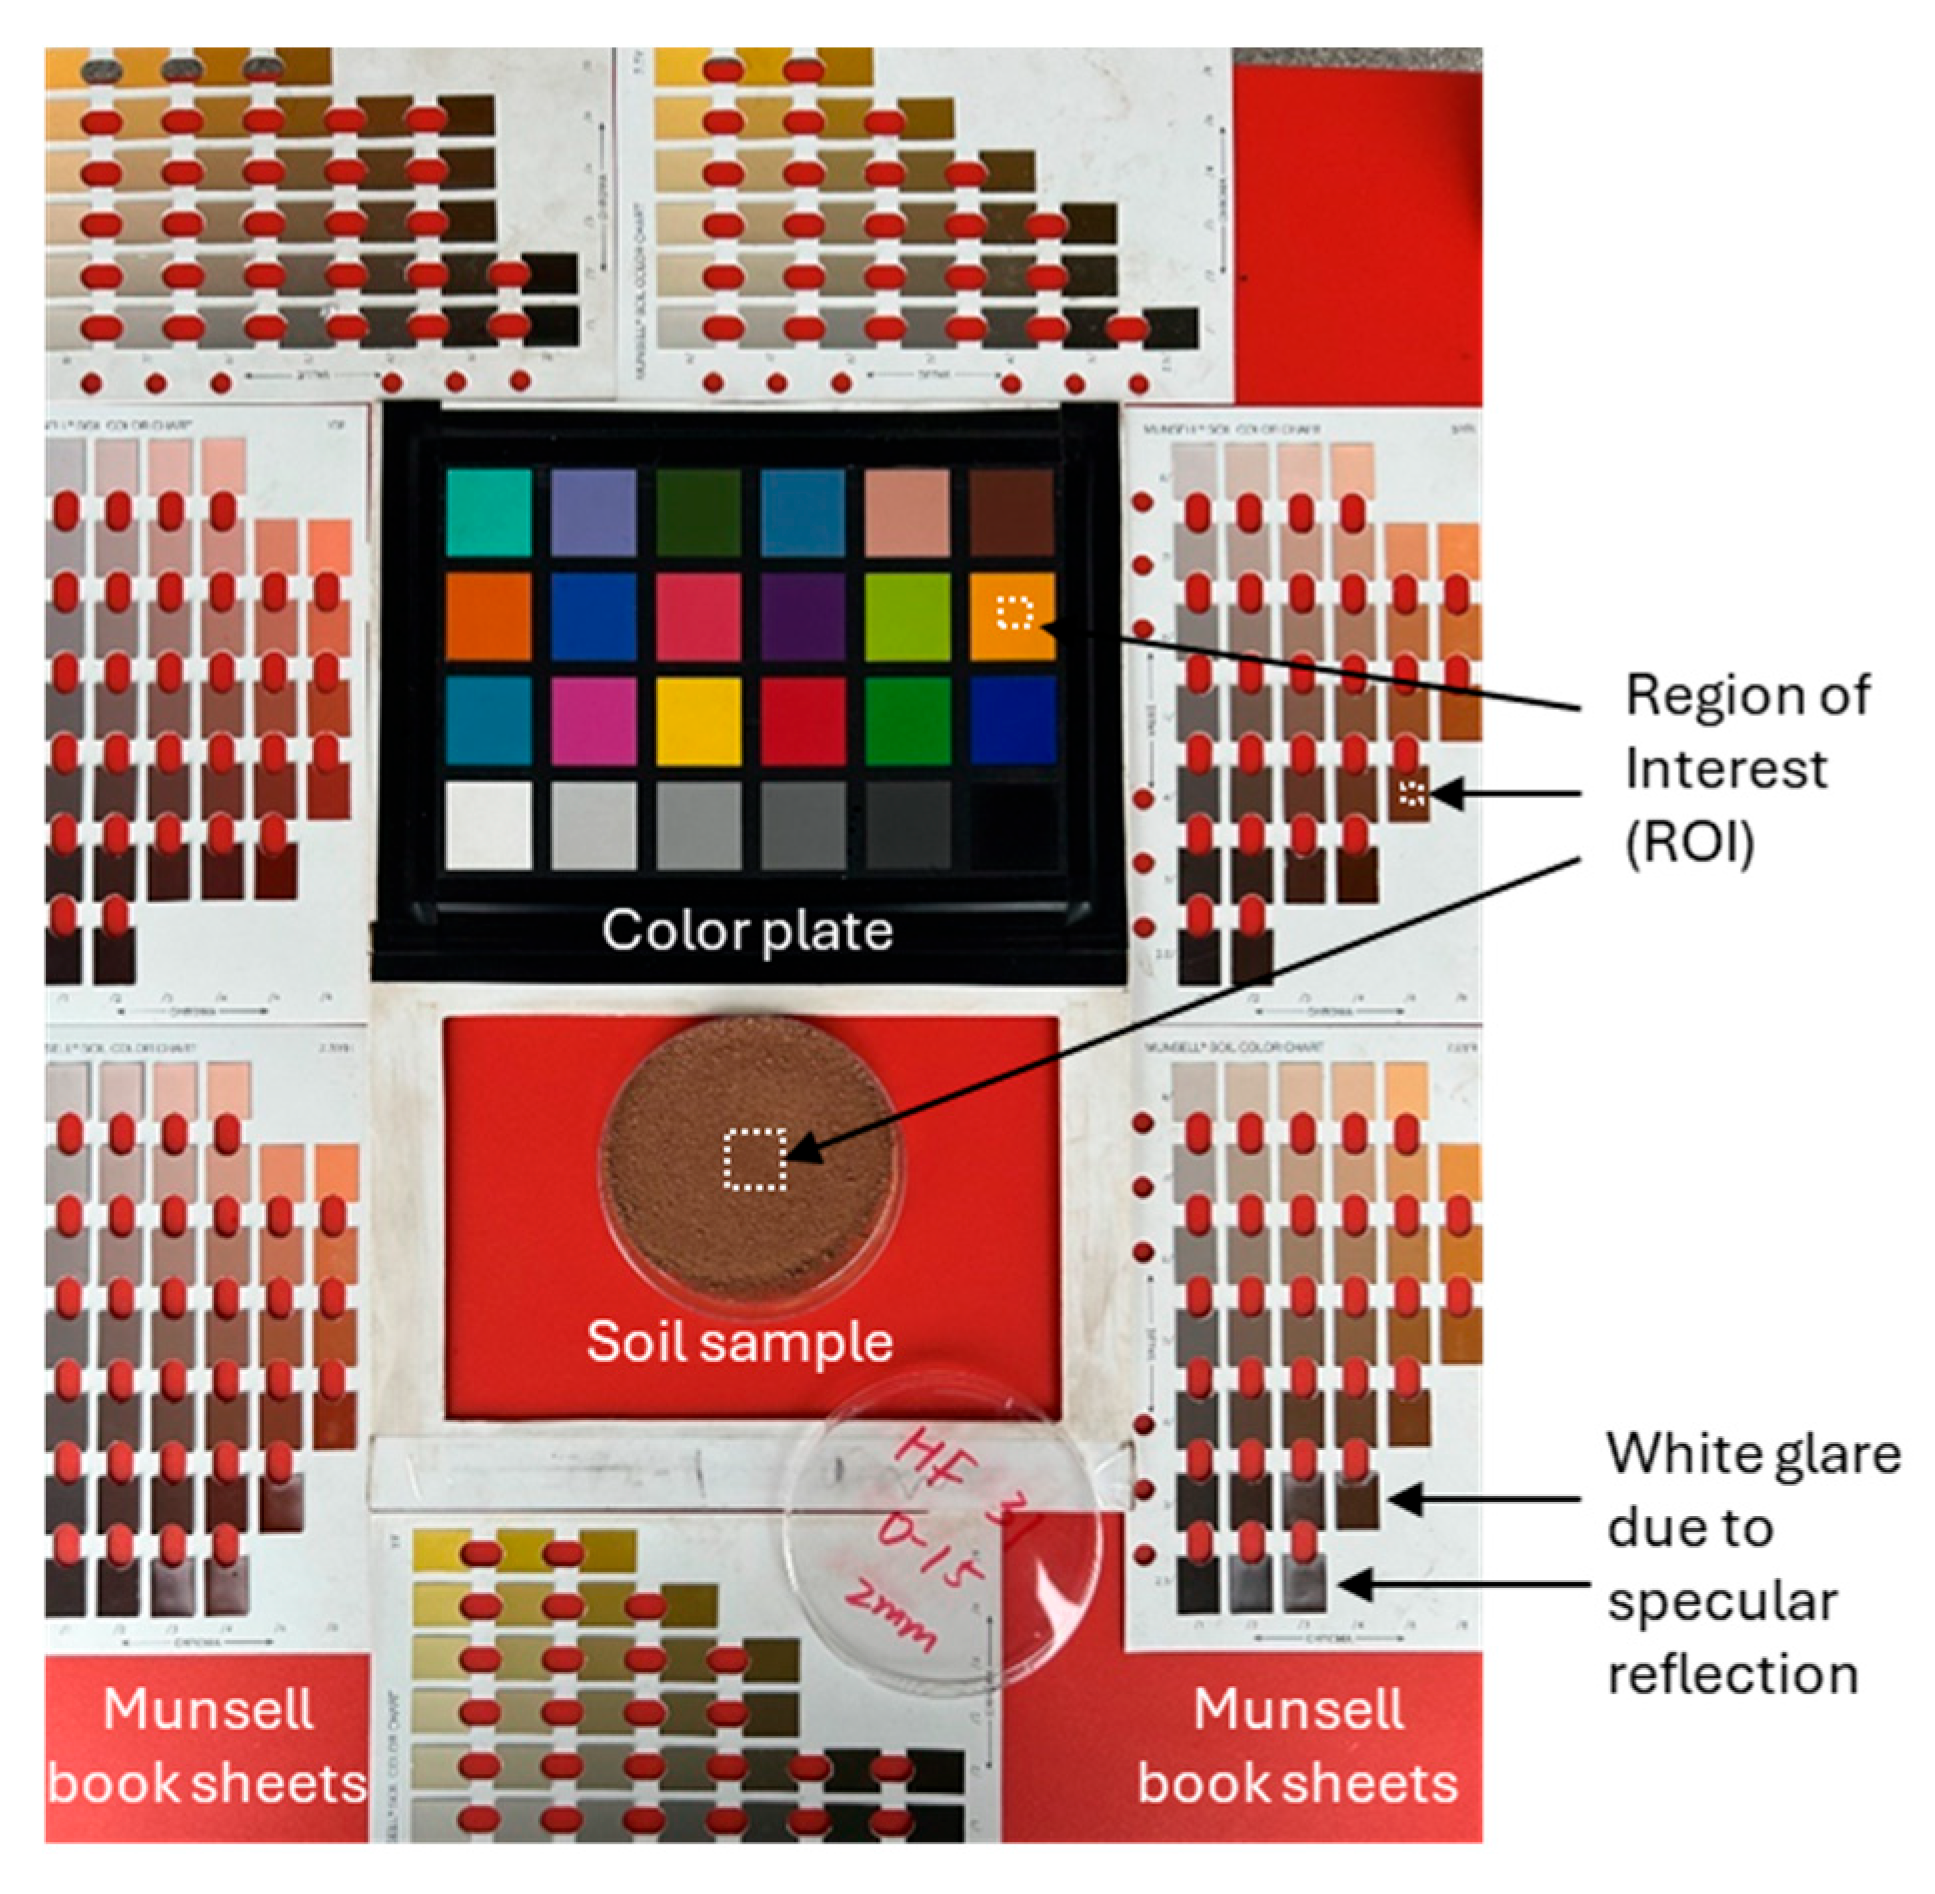
Figure 2.
Measurements derived from FieldSpec 4 compared to values provided in the Munsell soil color book.
Figure 2.
Measurements derived from FieldSpec 4 compared to values provided in the Munsell soil color book.
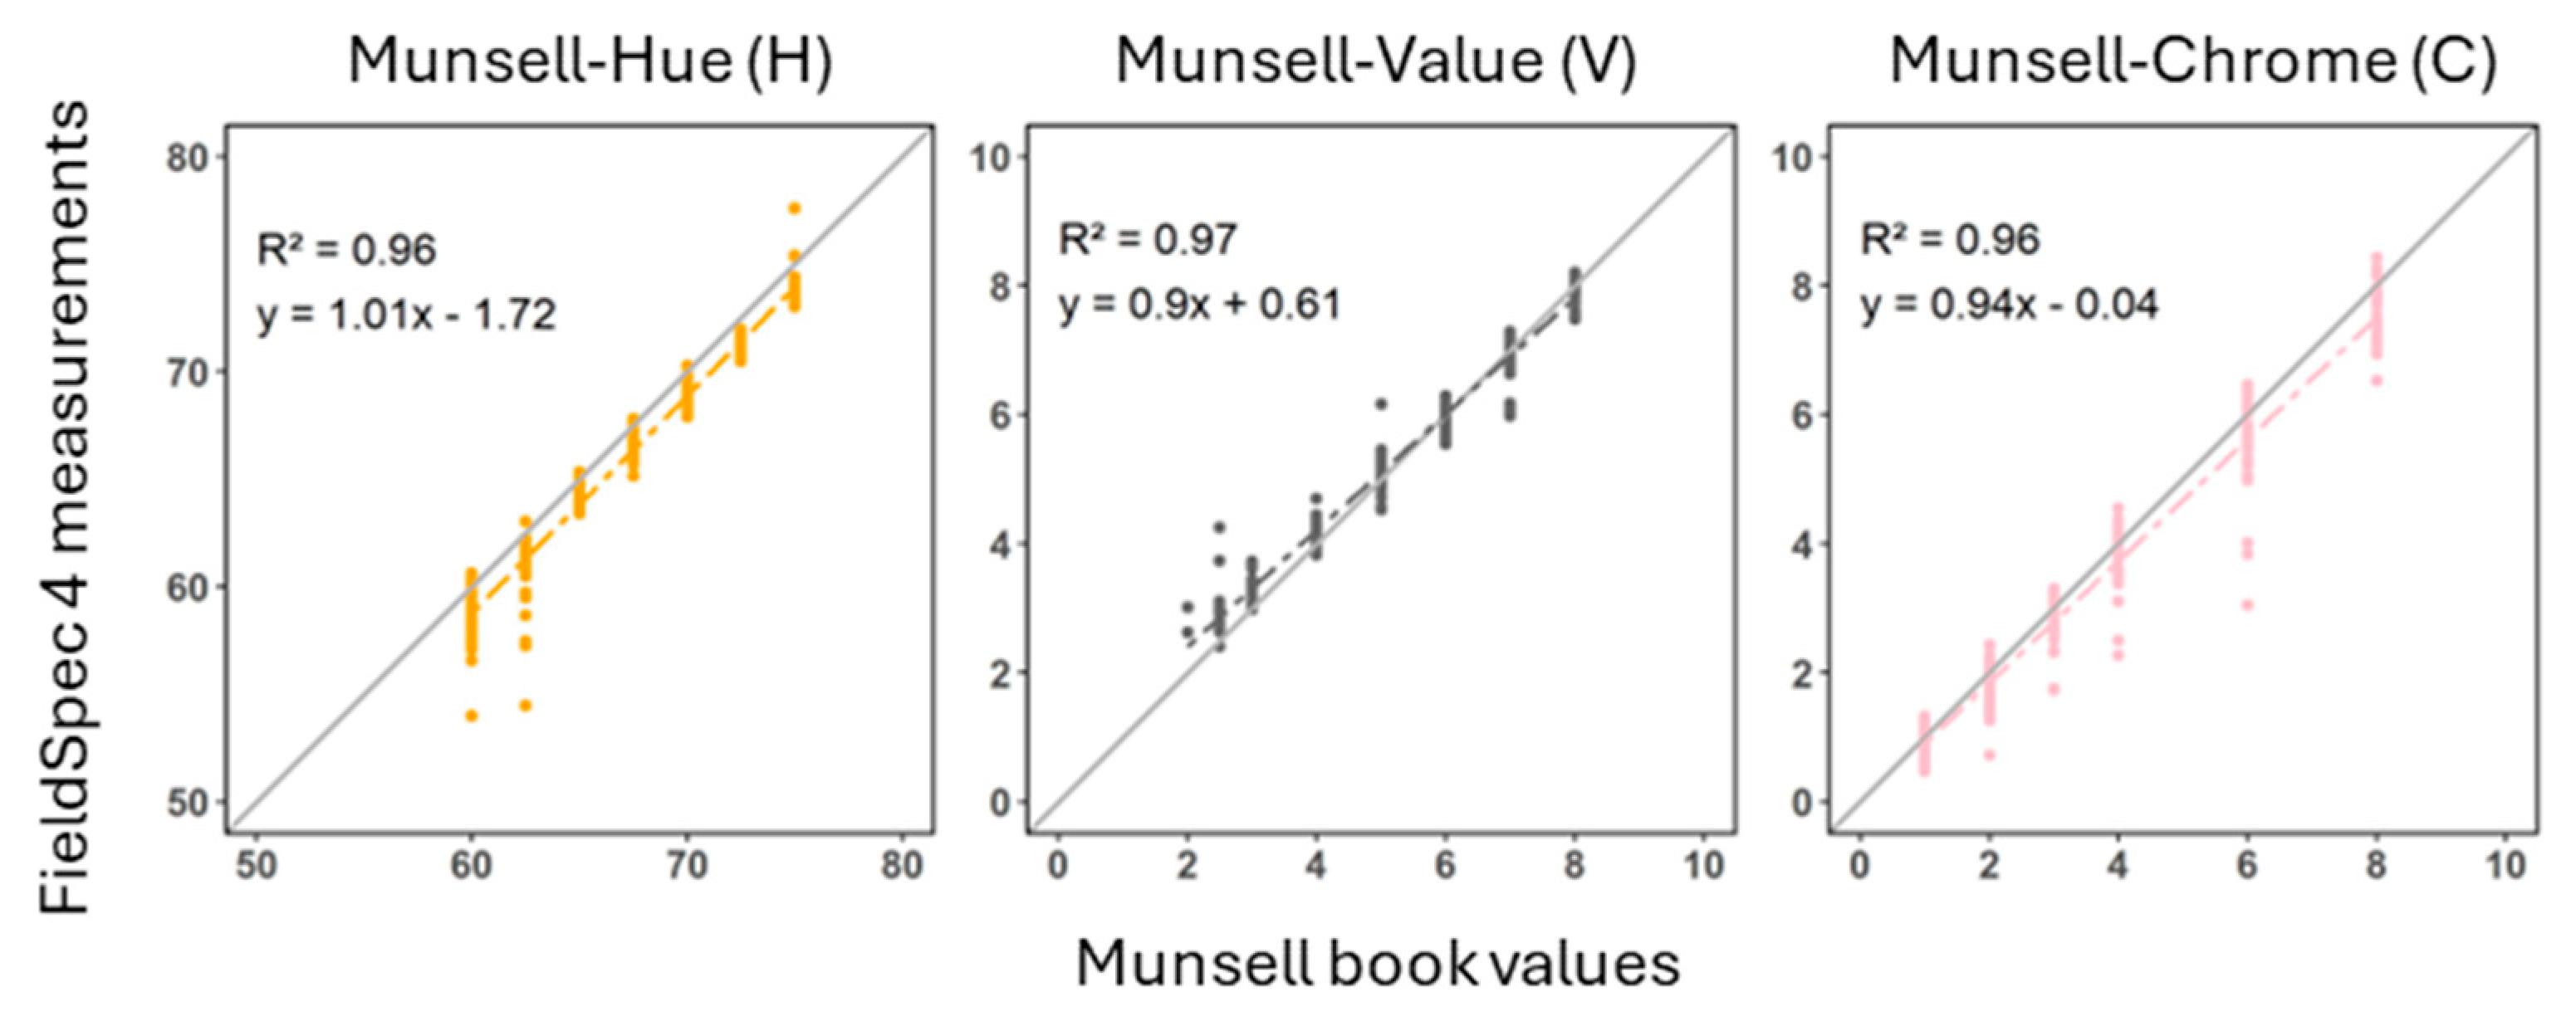
Figure 3.
Uncalibrated (a, c, e) and calibrated (b, d, f) smartphone-derived values compared to FieldSpec 4-measured values of Munsell-V (a, b, c, d) and the associated errors of the smartphone-derived values (e, f) as examples to show the effects of the calibration method on correcting color parameters under: A. different lighting conditions (photos all taken with iPhone 14), and B. with different smartphones (photos all taken under Inside-Dim lighting condition) for color plate squares.
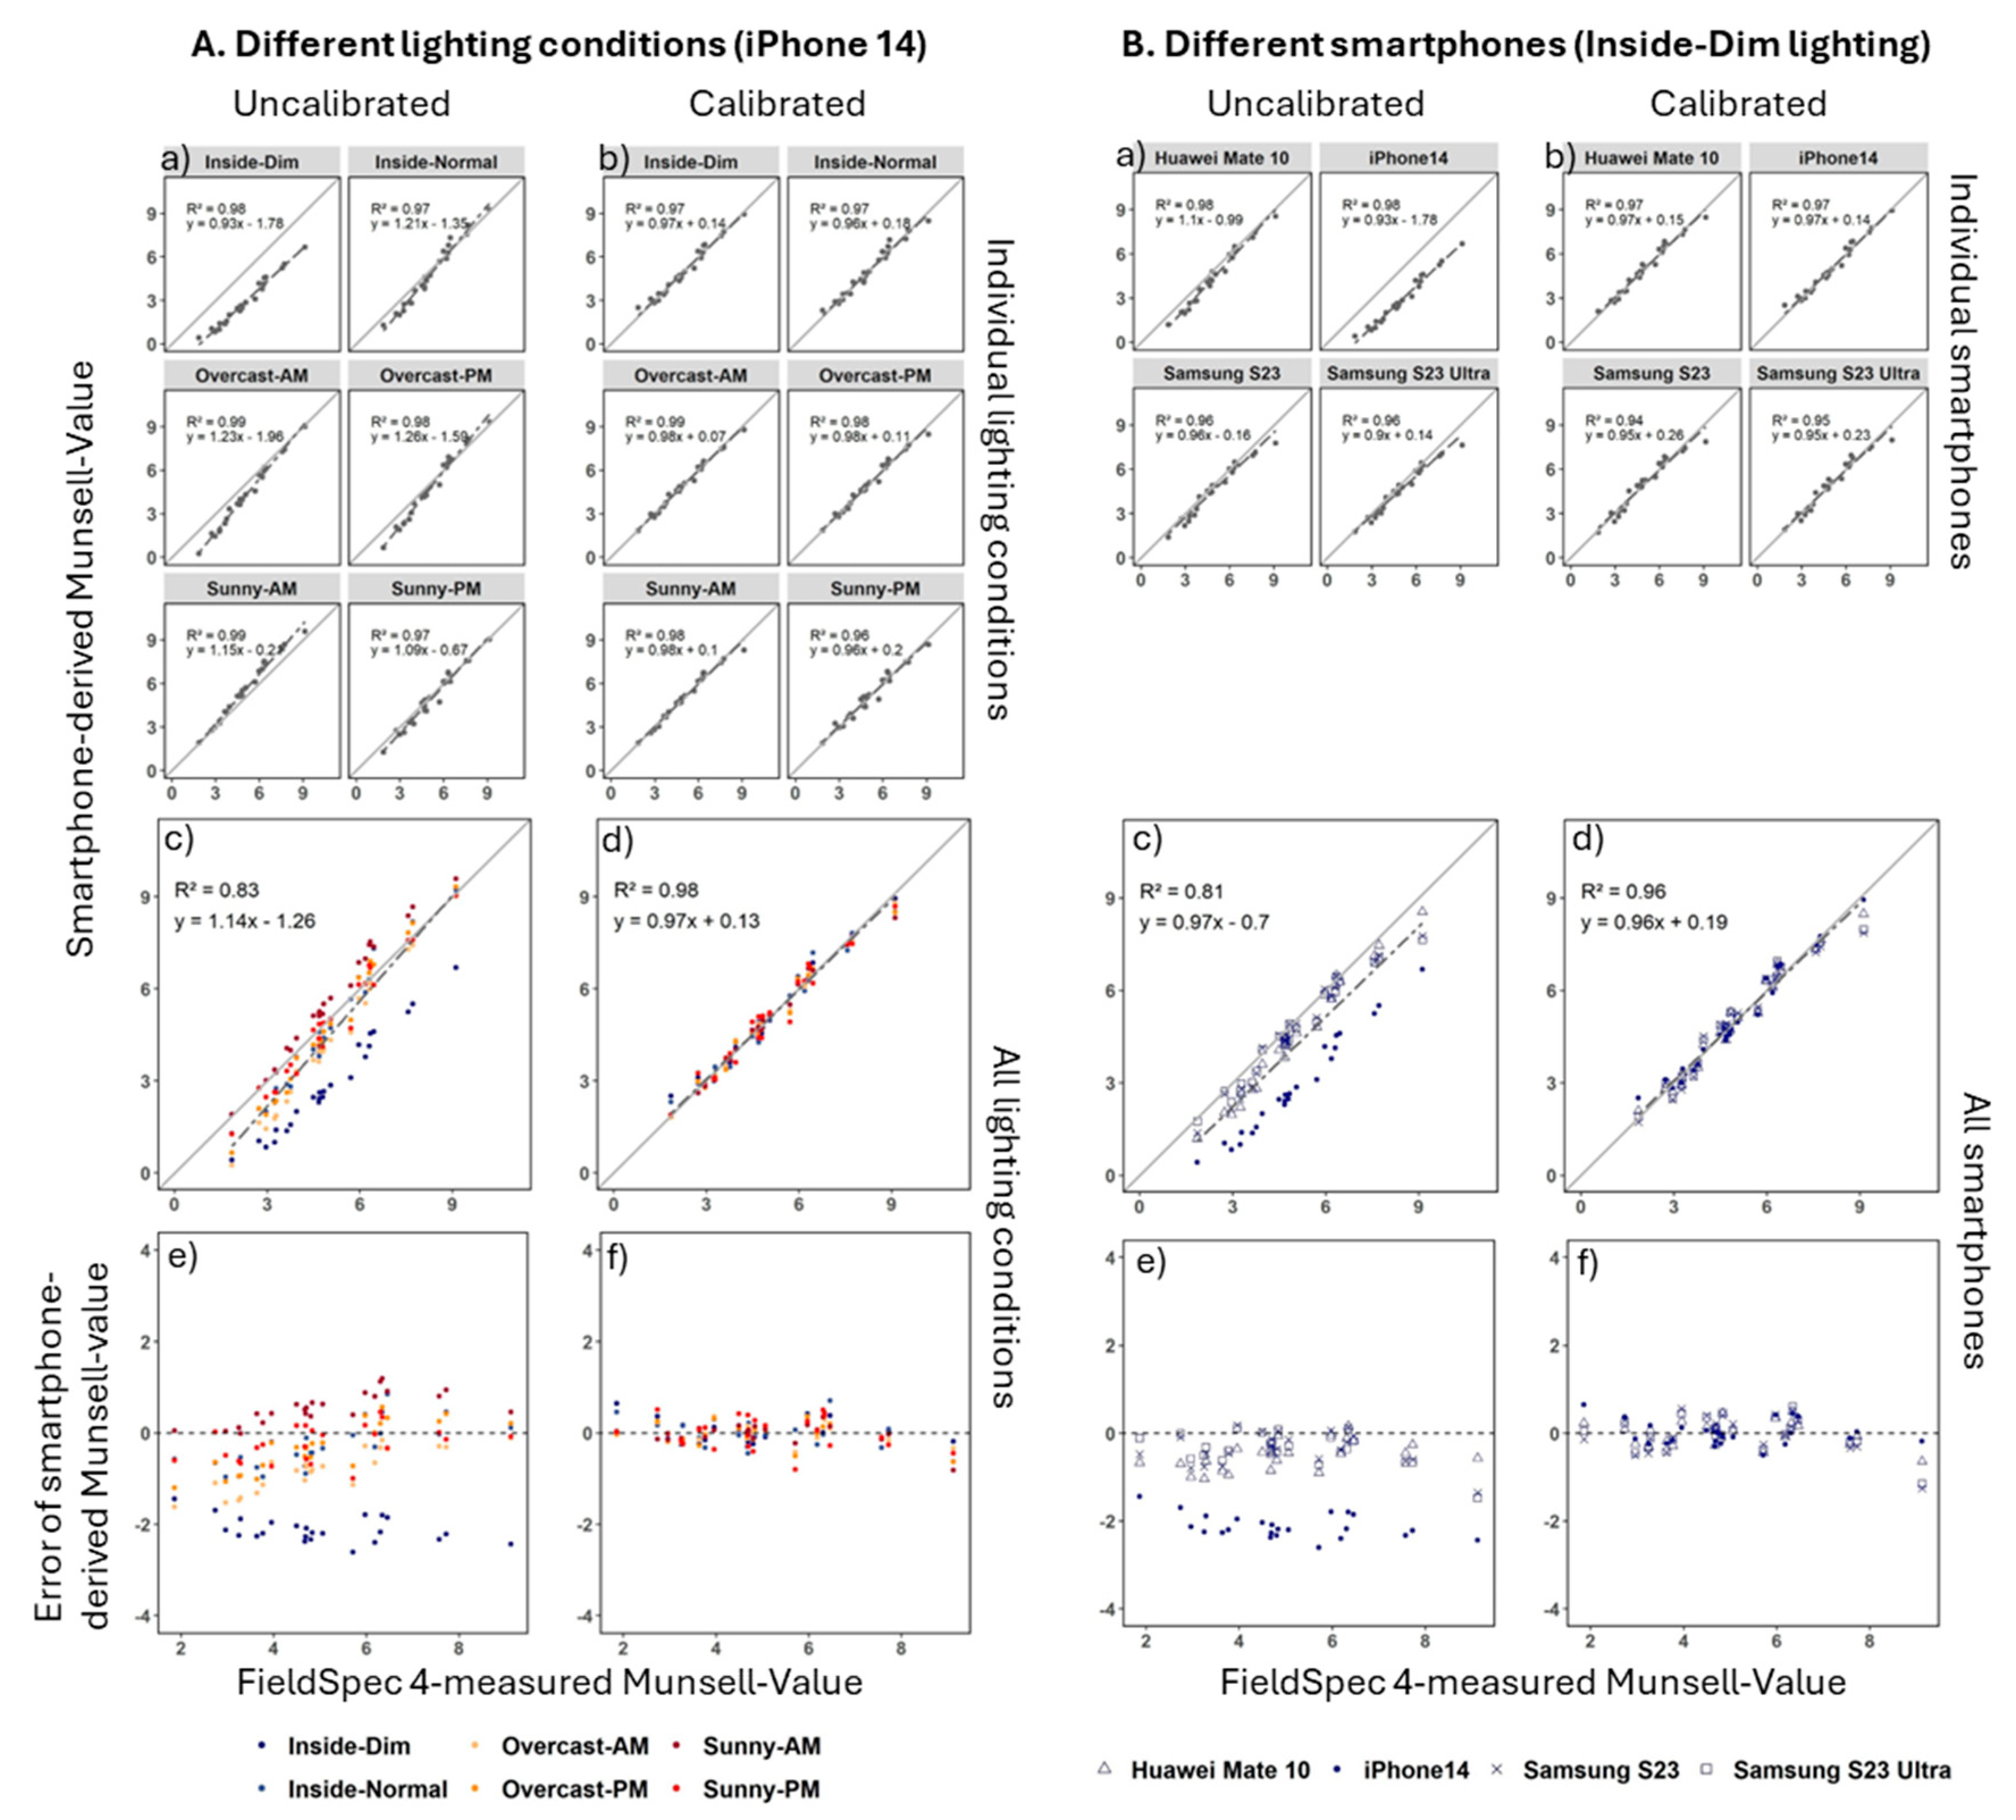
Figure 4.
Uncalibrated (a) and calibrated (b) smartphone-derived values compared to FieldSpec 4-measured values of Munsell-V and the associated errors of the smartphone-derived values (c, d) as examples to show the effects of the calibration method on correcting color parameters for both lighting conditions and smartphones for color plate squares.
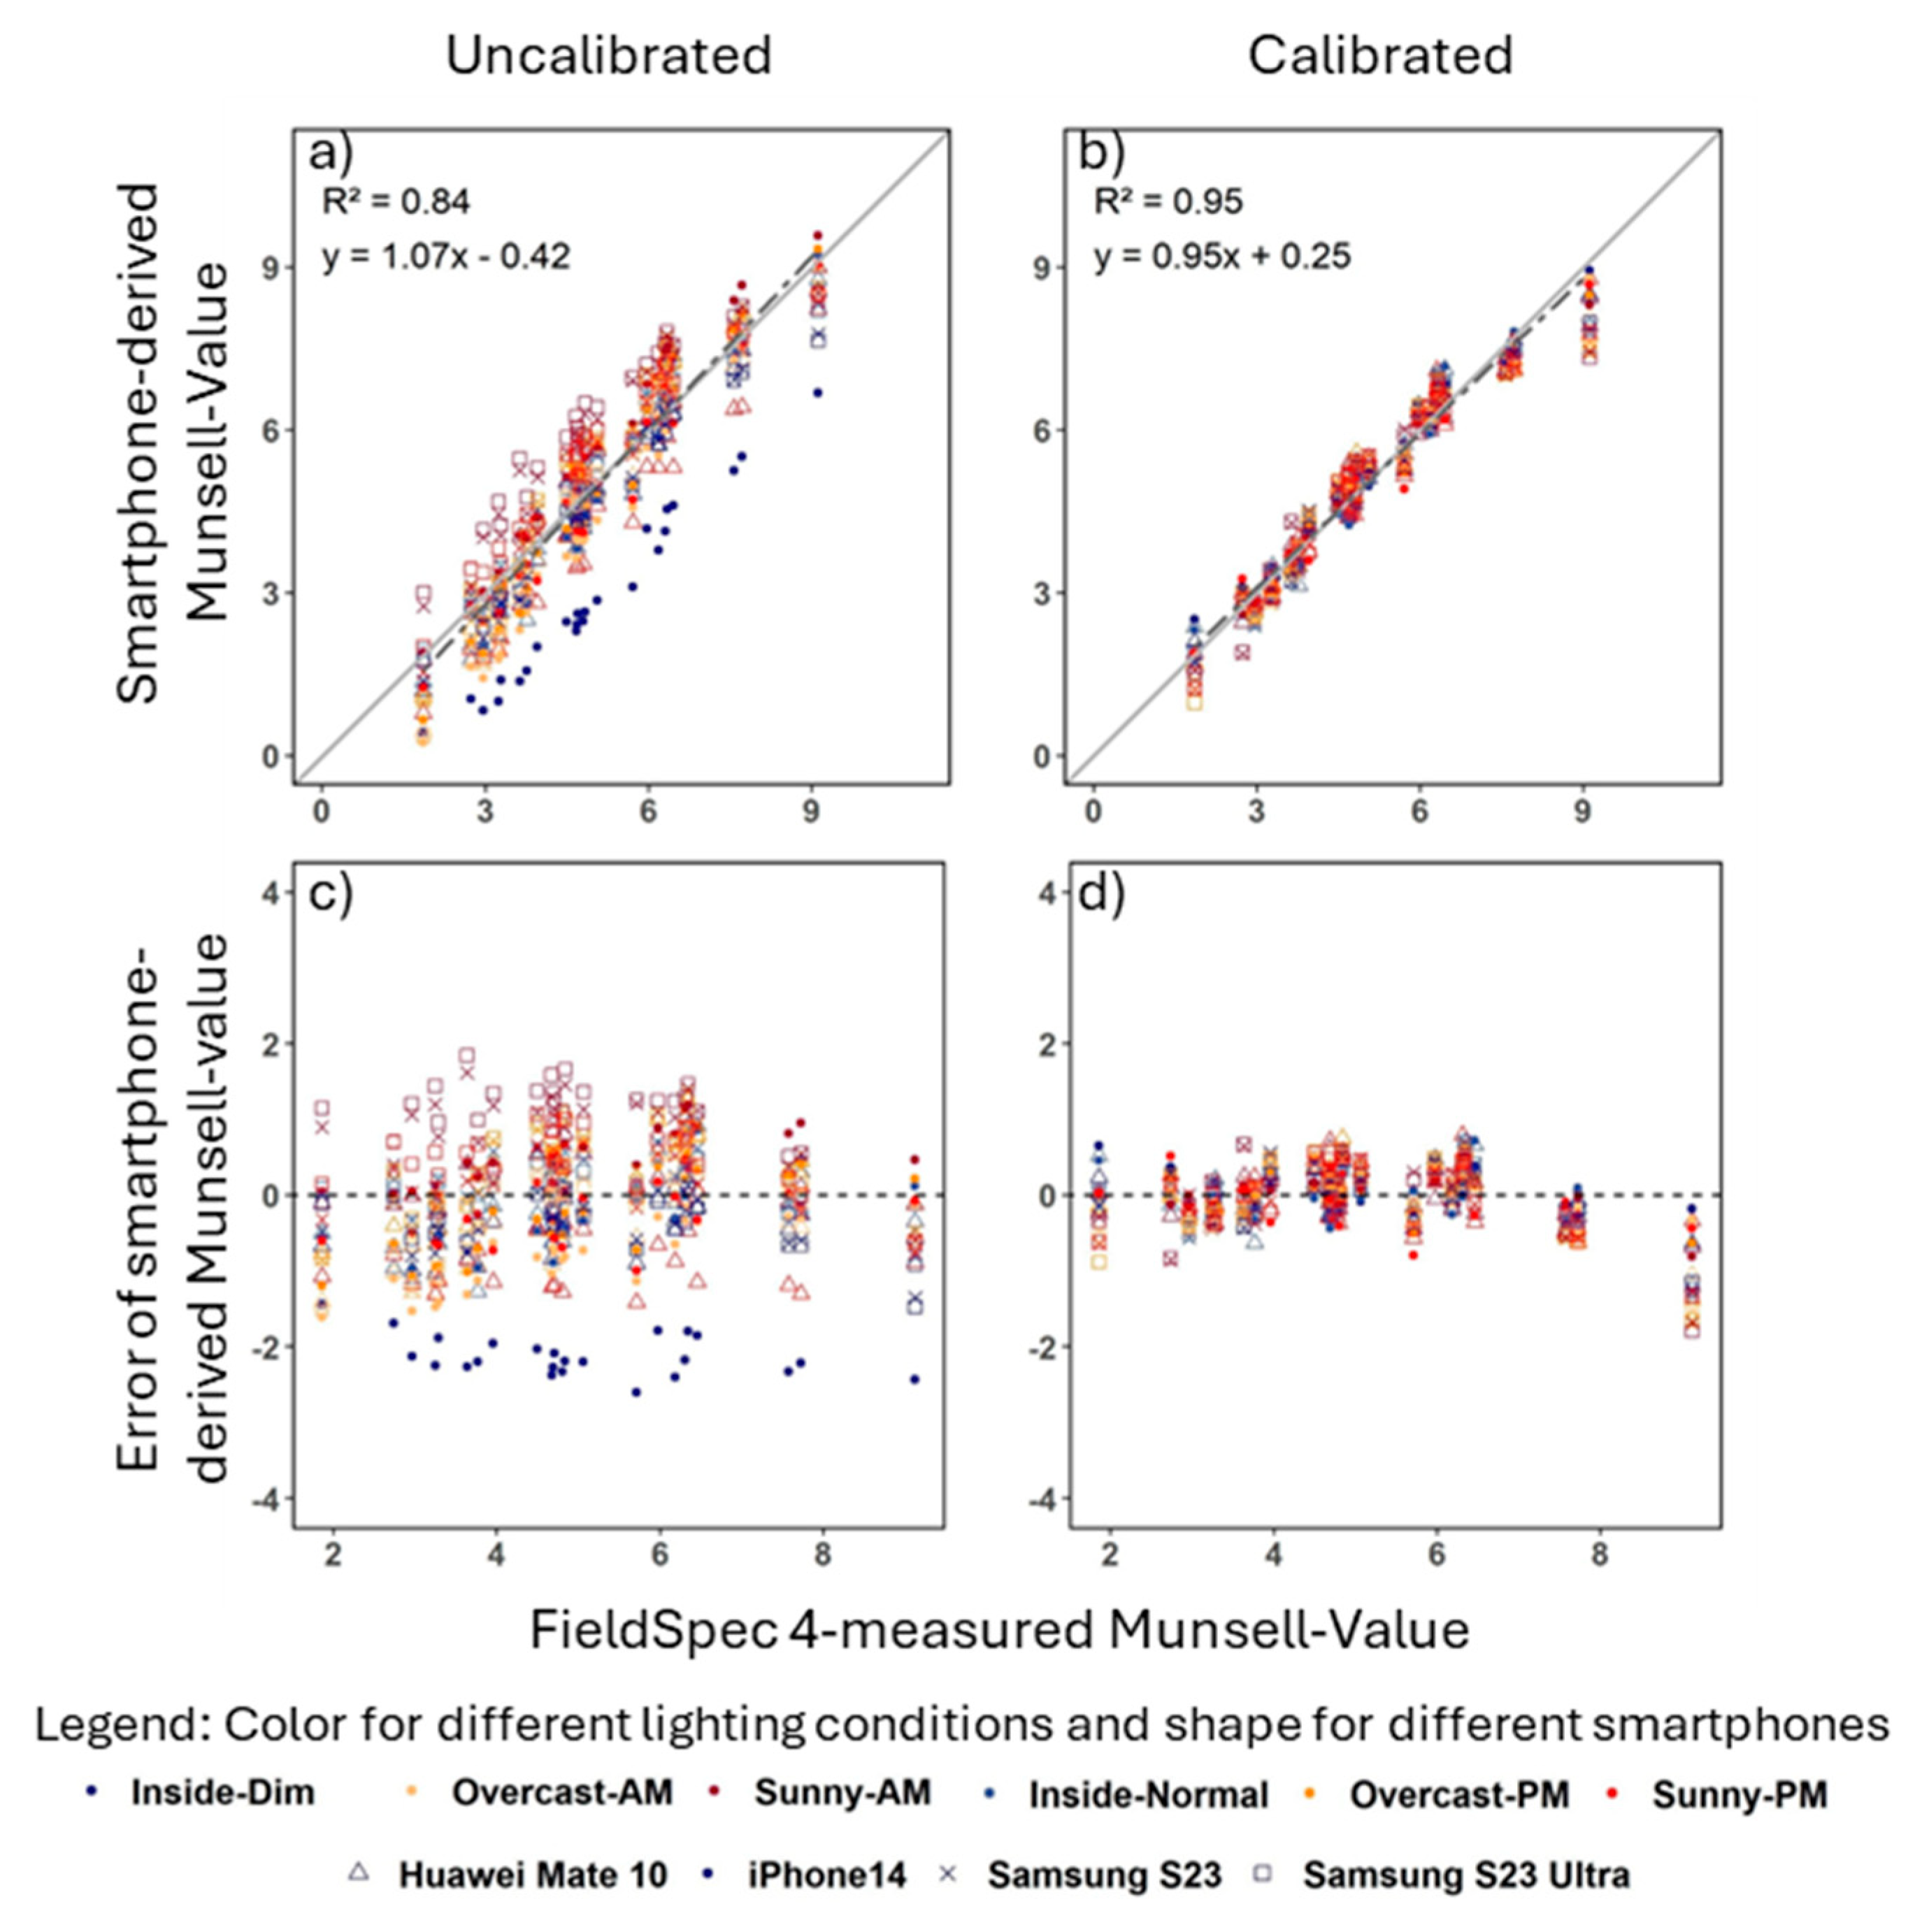
Figure 5.
Uncalibrated (a, c, e) and calibrated (b, d, f) smartphone-derived values compared to FieldSpec 4-measured values of Munsell-value as examples to show the effects of the calibration method on correcting color parameters for lighting conditions and smartphones, respectively and combined for: A. Munsell book chips, and B. soil samples.
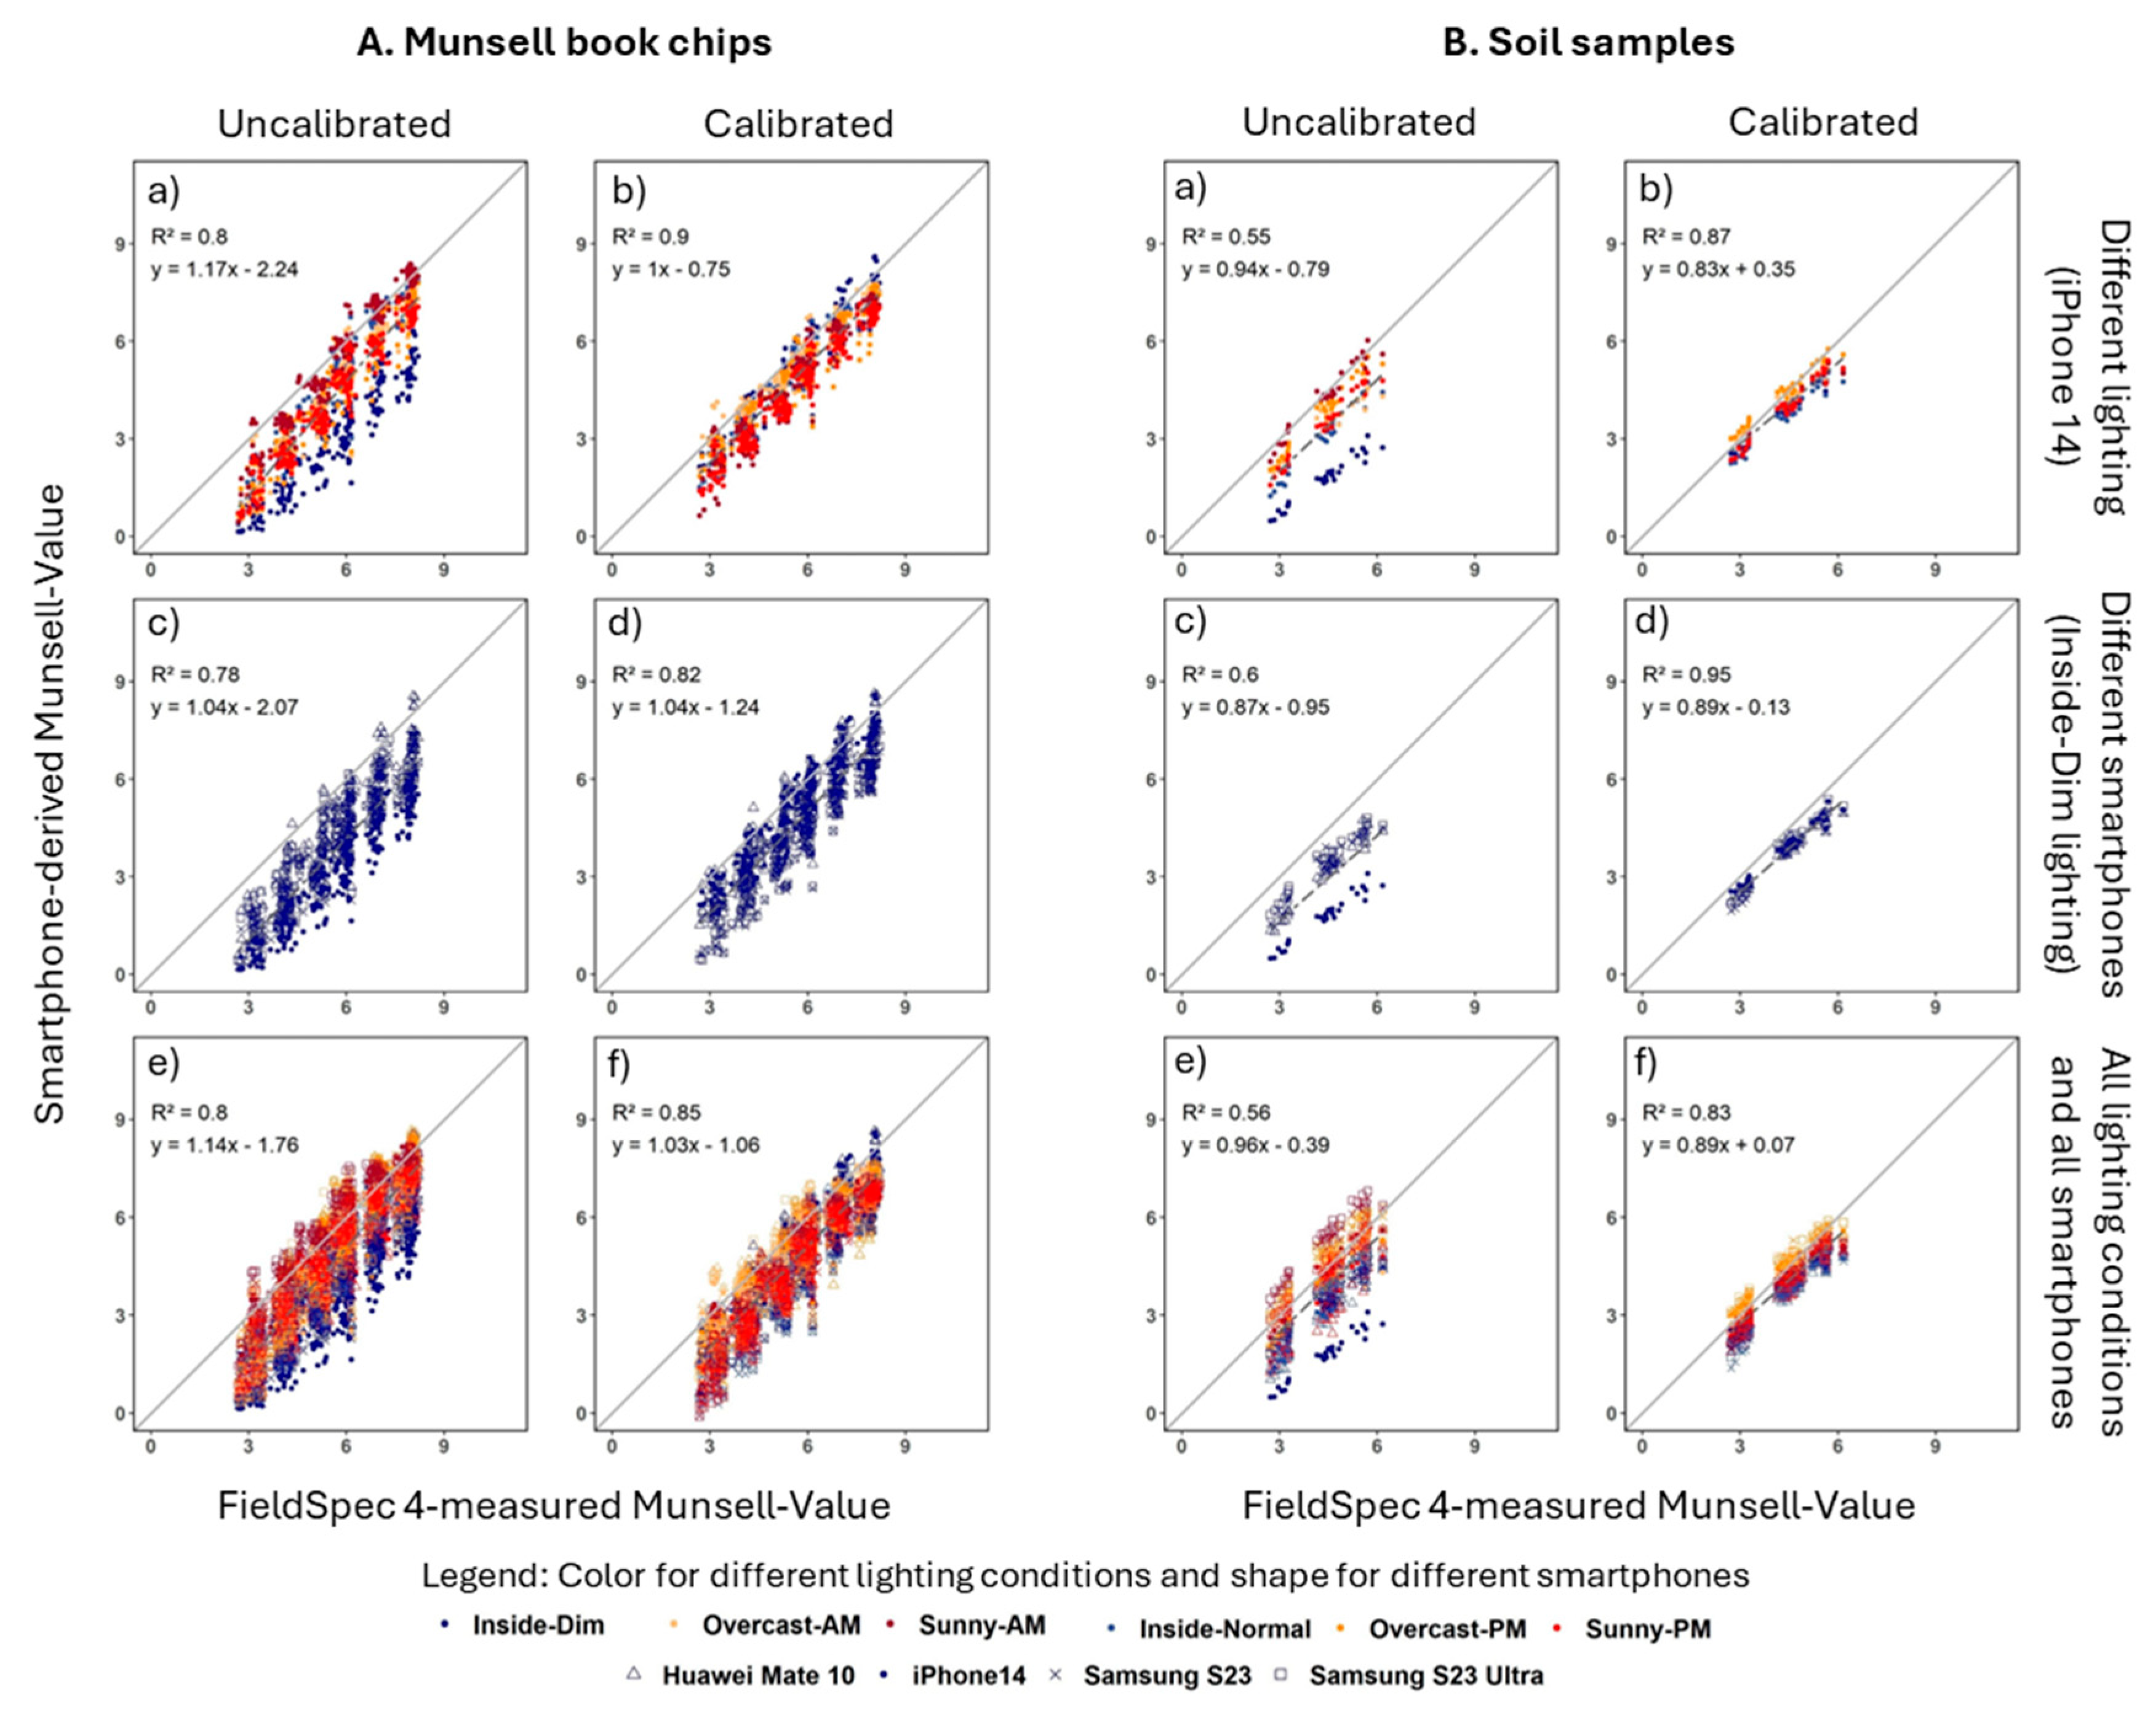

Table 1.
Specifications for the main camera for the four smartphones used in this study.
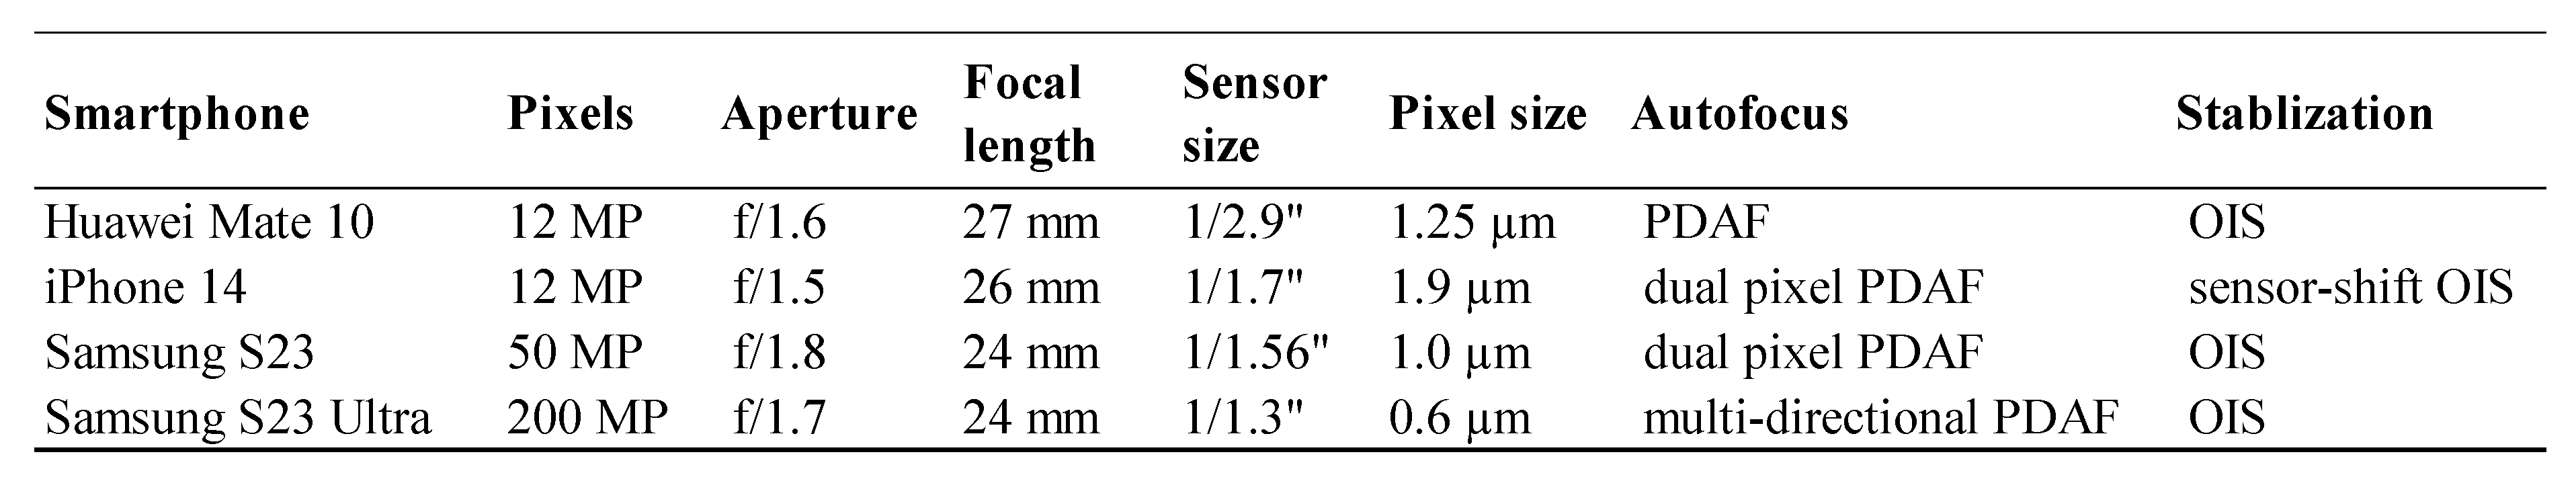 |
Table 2.
Means and 90th percentiles statistics (Avg = average/mean, SD = Standard Deviation, CV = coefficient of variance) of the three repeats among the number of objects within each object type.
Table 2.
Means and 90th percentiles statistics (Avg = average/mean, SD = Standard Deviation, CV = coefficient of variance) of the three repeats among the number of objects within each object type.
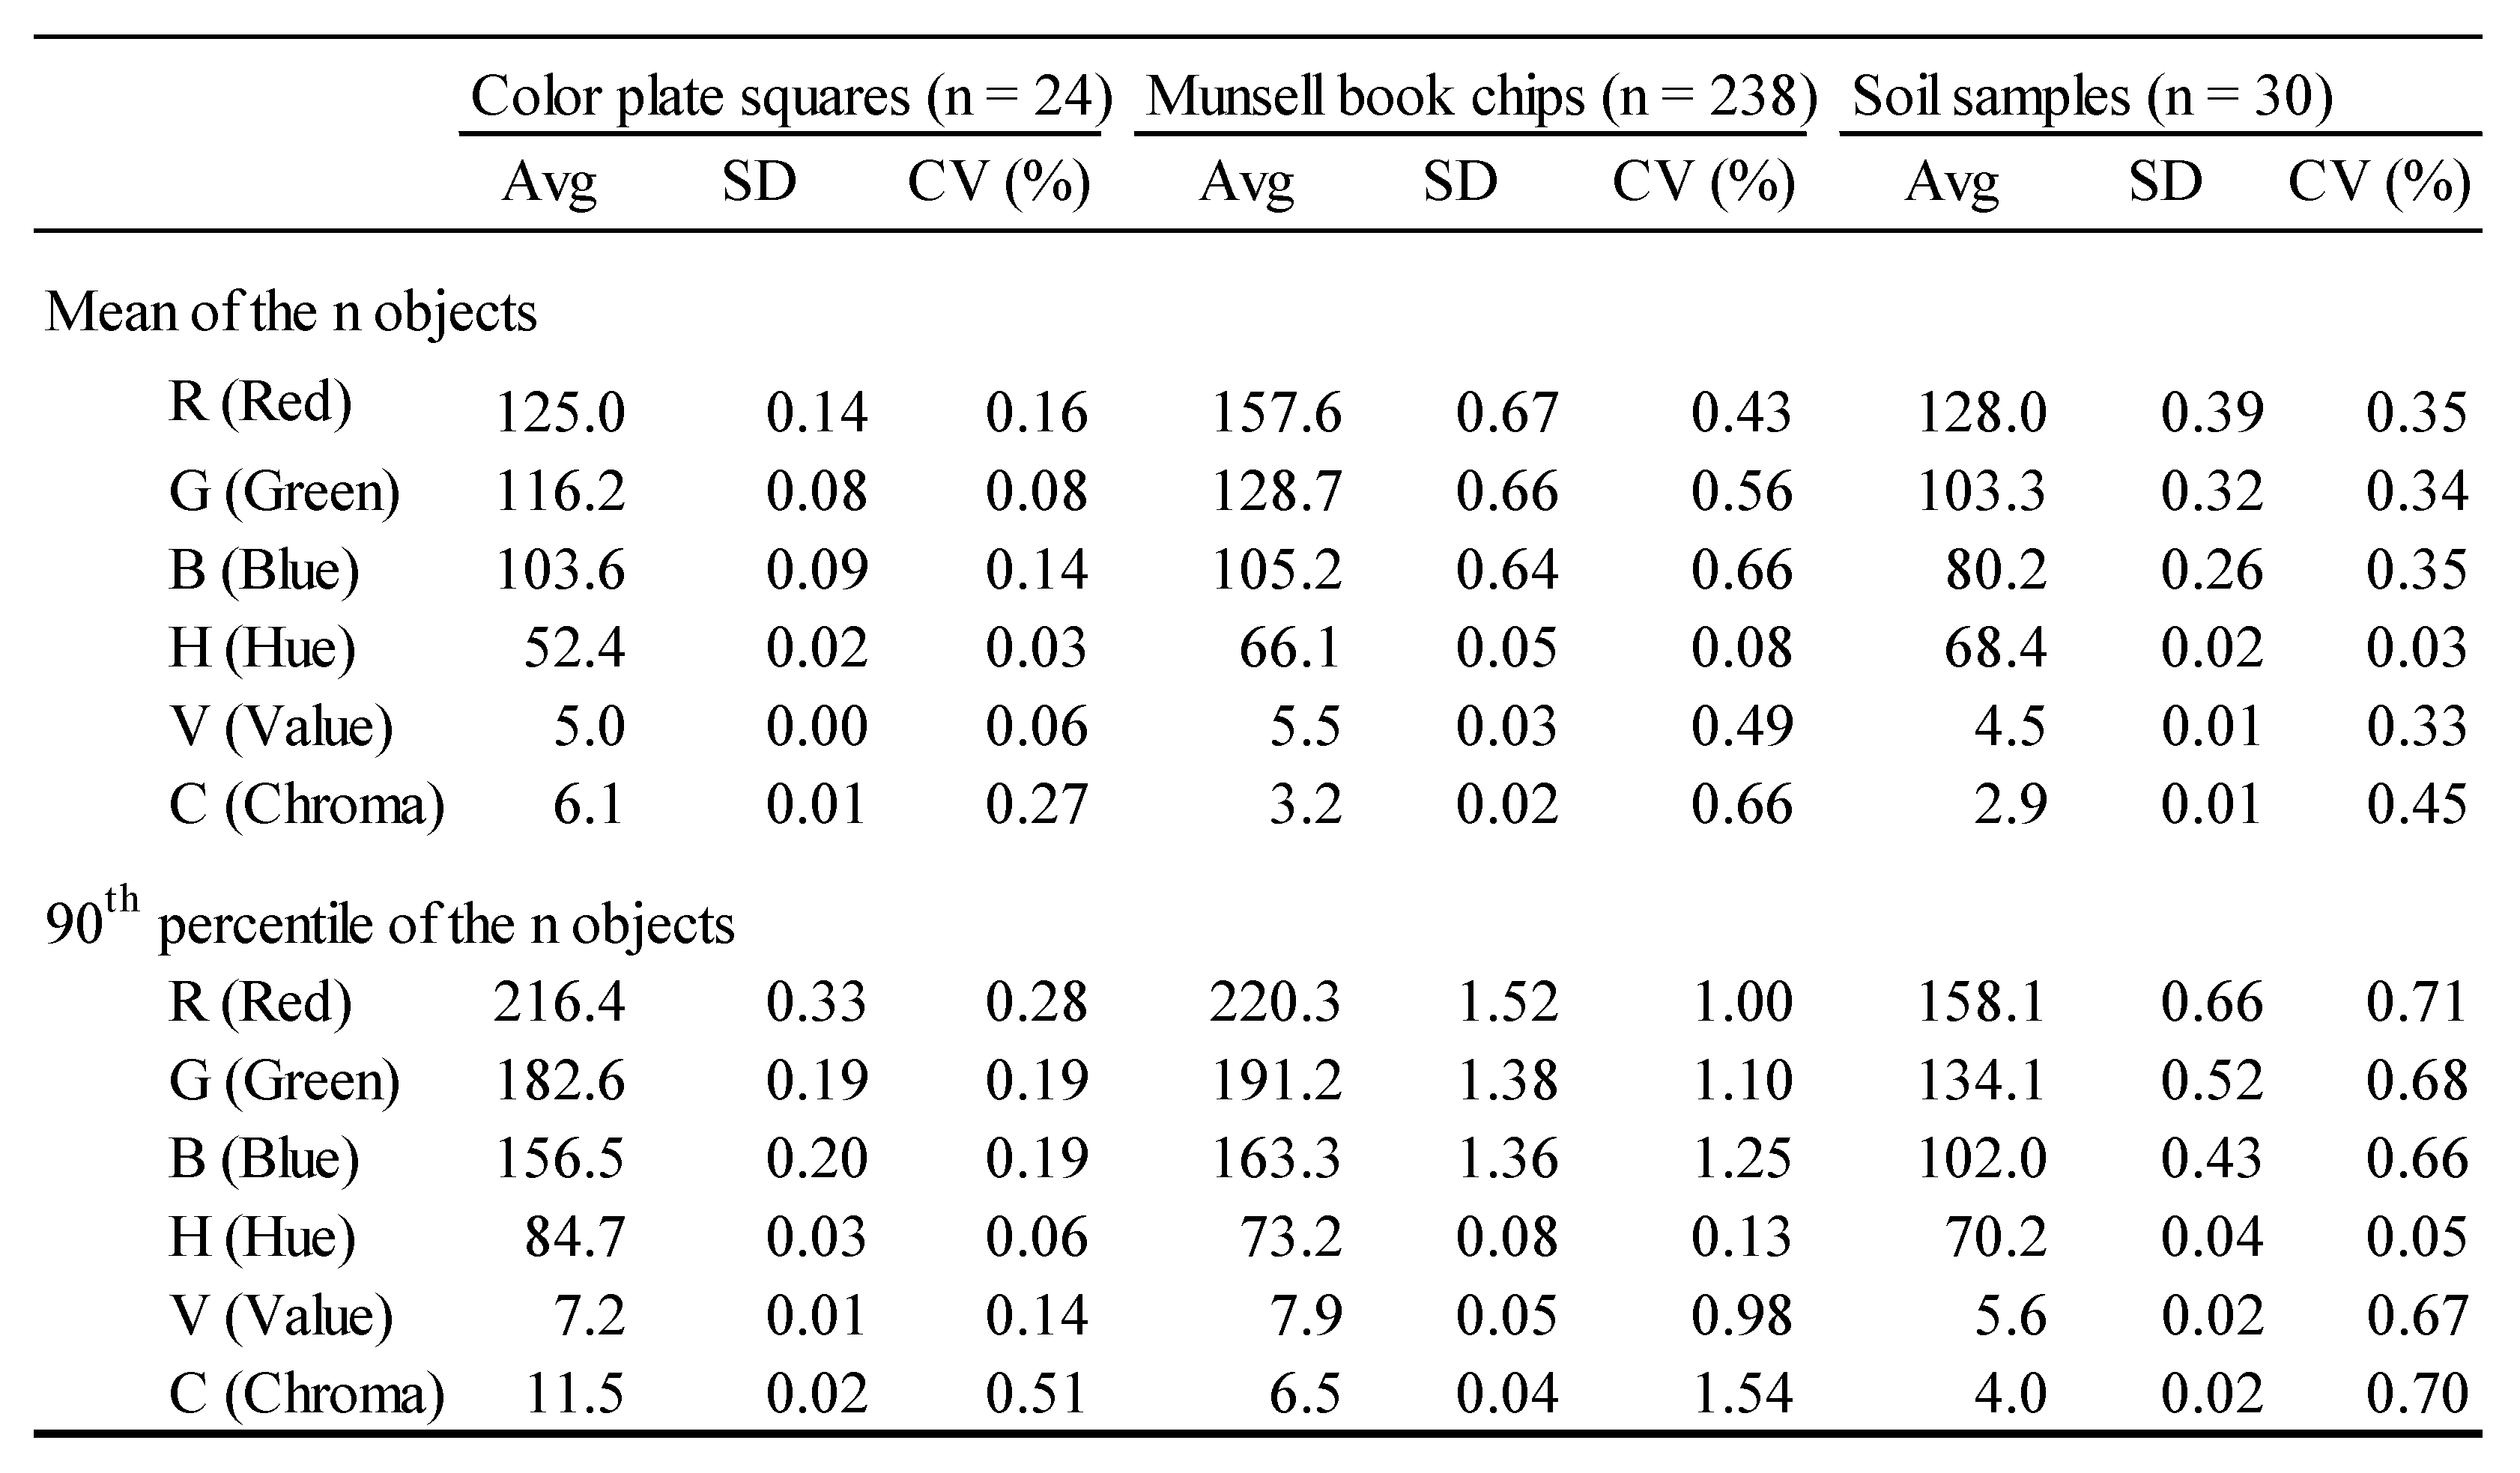 |
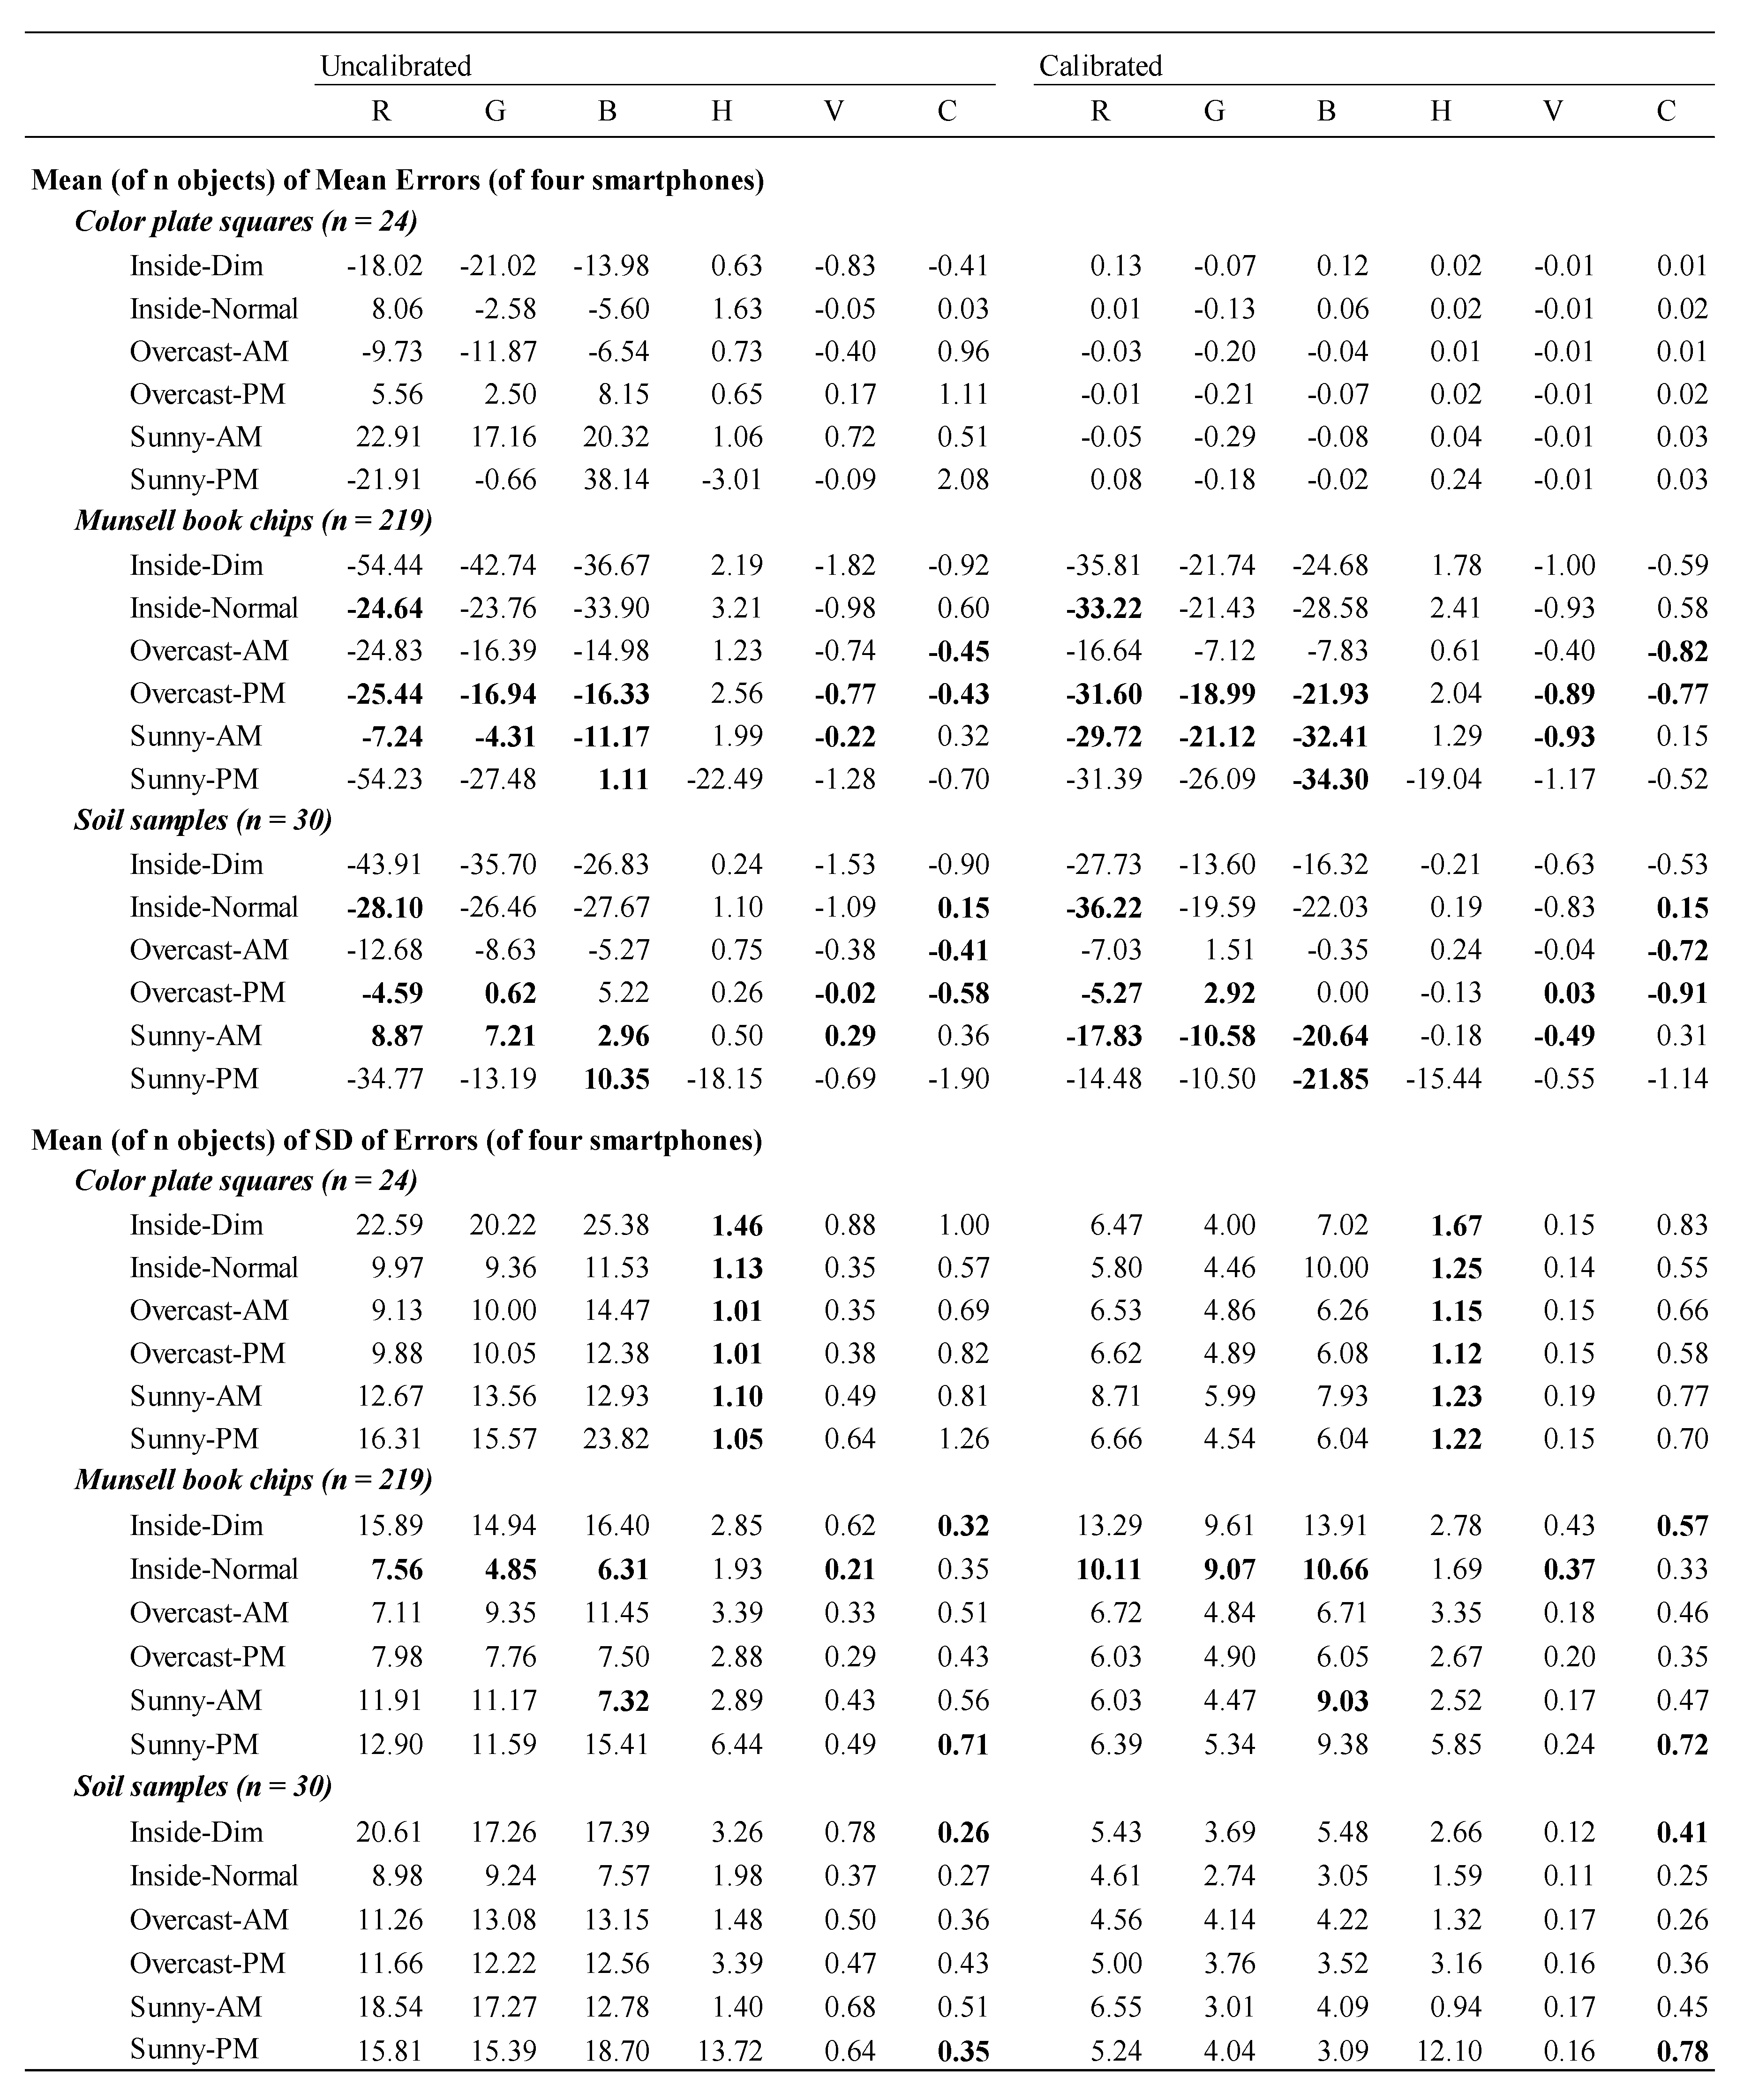
Table 3.
Means of the mean errors and standard deviation (SD) of errors for the six lighting conditions among the number of objects in each object type for the uncalibrated and clalibrated data of the six color parameters (R = Red, G = Green, B = Blue, H = Hue, V = Value and C = Chrome; bold numbers indicate the absolute values of the calibrated data are greater than those of the uncalibrated data).
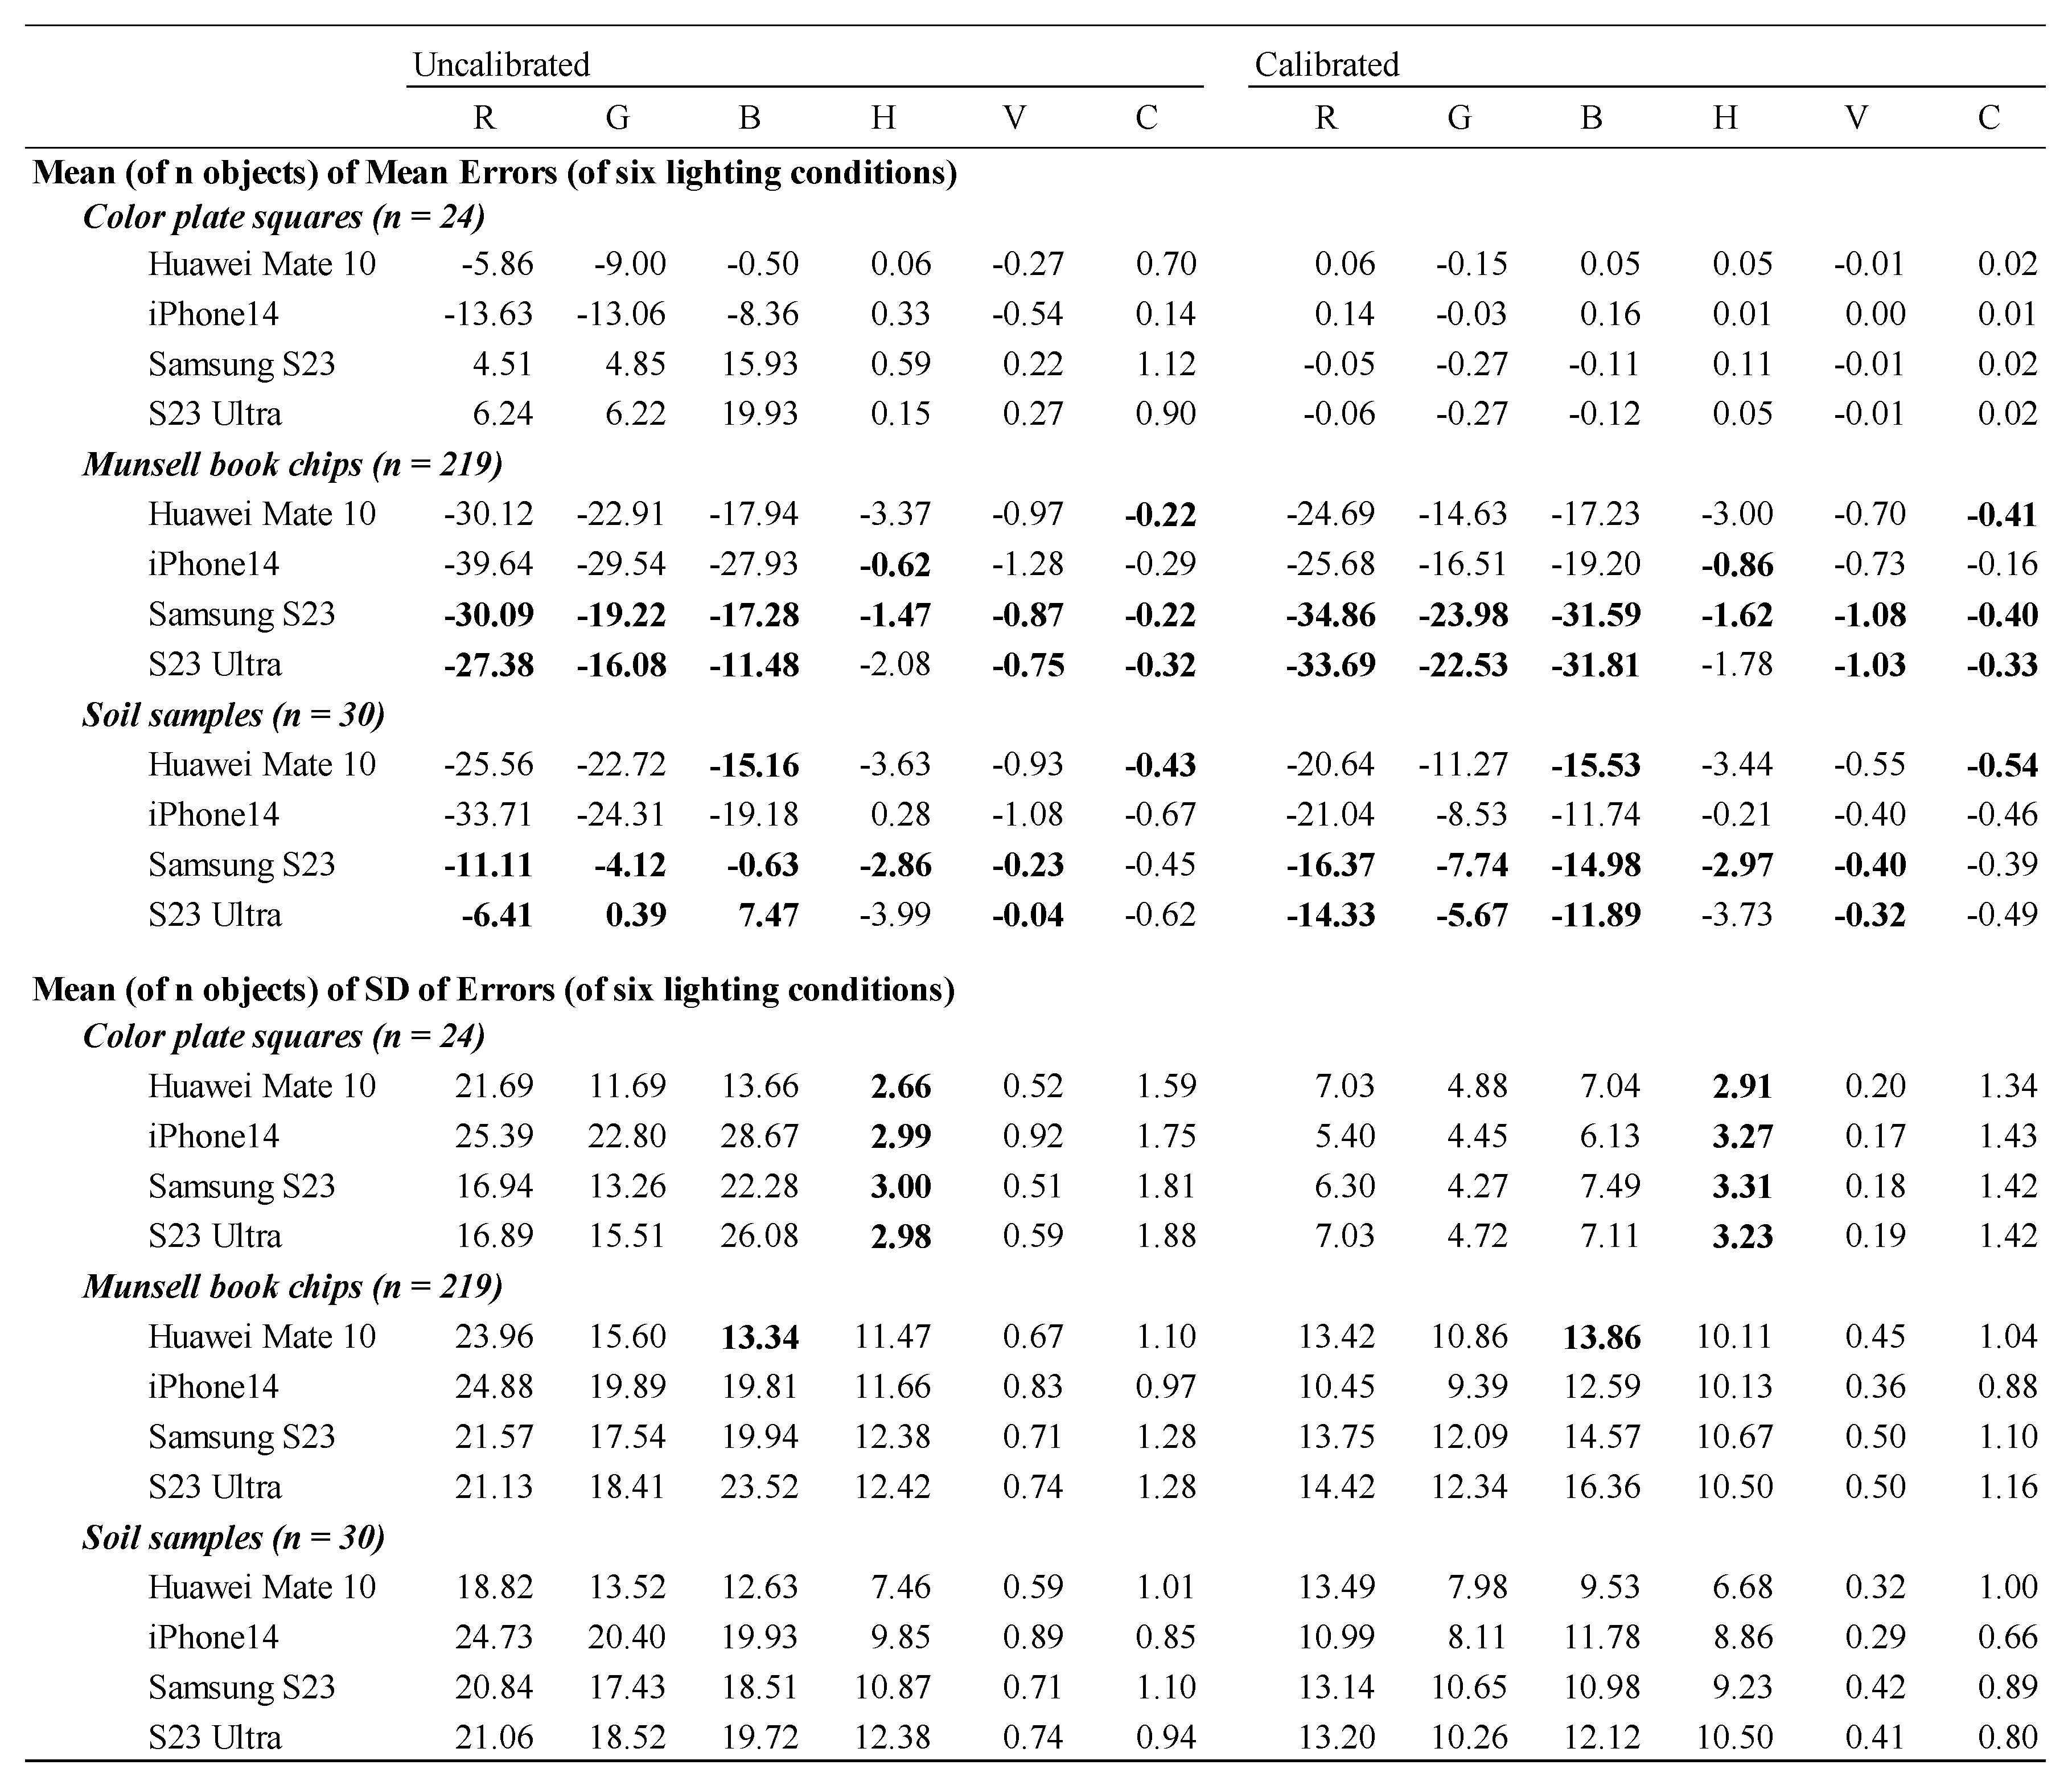 |
Table 4.
Means of the mean errors and standard deviation (SD) of errors for the four smartphones among the number of objects in each object type for the uncalibrated and calibrated data of the six color parameters (R = Red, G = Green, B = Blue, H = Hue, V = Value and C = Chrome; bold numbers indicate the absolute values of the calibrated data are greater than those of the uncalibrated data).
 |
Disclaimer/Publisher’s Note: The statements, opinions and data contained in all publications are solely those of the individual author(s) and contributor(s) and not of MDPI and/or the editor(s). MDPI and/or the editor(s) disclaim responsibility for any injury to people or property resulting from any ideas, methods, instructions or products referred to in the content. |
© 2025 by the authors. Licensee MDPI, Basel, Switzerland. This article is an open access article distributed under the terms and conditions of the Creative Commons Attribution (CC BY) license (http://creativecommons.org/licenses/by/4.0/).
Copyright: This open access article is published under a Creative Commons CC BY 4.0 license, which permit the free download, distribution, and reuse, provided that the author and preprint are cited in any reuse.


