
Submitted:
27 June 2025
Posted:
01 July 2025
You are already at the latest version
Abstract
In today’s digital age, education is inseparable from technology. This study explored Indian school teachers’ perceptions, attitudes, and behaviours toward the use of Augmented Reality Applications (ARA) and examined the interrelationships among these variables and factors. Employing a descriptive mixed-method approach, data were randomly collected from 730 teachers across all 28 states and 8 union territories of India using standardized, self-developed questionnaires. Quantitative analysis included percentages, chi-square, t-tests, ANOVA, multiple correlations, and coding techniques. The findings indicated teachers low to moderate levels of perception, attitude, and behaviour towards ARA, with females scoring notably higher than males. Significant differences emerged by school category, stream, qualification, and designation, excluding attitudes. Conversely, age, location, and experience showed minimal or no significant impact. Notably, strong positive correlations were found among the three variables, perception and attitude (r=0.34, p< .001), perception and behaviour (r=0.21, p< .001), and attitude and behaviour (r = 0.63, p < .001). Significant differences were evident across these domains (t=44.6612, 34.6312, and 5.2867; p< .0001), and an overall significant [F(2, 2187, 2189)=871.60, p< 0.05, 0.01] underscored meaningful variation in ARA engagement. Qualitative insights highlight major barriers such as lack of awareness, low motivation, inadequate infrastructure, and insufficient training. Nevertheless, teachers demonstrate resilience through adaptive strategies. Successful integration of AR in schools requires administrative support, funding, professional development, collaboration, and the creation of culturally relevant, discipline-specific content.
Keywords:
attitudes
; augmented reality
; behaviours
; Indian educators
; perceptions
1. Introduction
Technology has become our constant companion, like a shadow that never leaves us. It's becoming almost impossible to separate it from our lives. Just as we can’t imagine doing anything without it, we can’t even think beyond it anymore. In fact, there’s hardly any aspect of our day-to-day life where we can move forward without relying on technology. In the field of education, technology truly serves as a powerful catalyst for enhancing it in a variety of ways, providing unique opportunities for individuals to learn and collaborate. It is essential for teachers to harness their technological capabilities to improve classroom teaching and learning processes (Alam & Mohanty, 2023). In today’s world, smartphones, mobile gadgets, and other digital devices have become increasingly popular among students. The integration of these technologies into education can be traced back to the late 1950s. One of the earliest examples is the Sensorama (2024), a Simulator, developed by Morton Heiling in 1957. In 1966, Ivan Sutherland created the first augmented reality (AR) headset, known as the “Sword of Damocles,” which was designed to assist helicopter pilots with night landings by allowing cameras to track head movements. Later, in 1999, Hirokazu Kato of the Nara Institute of Science and Technology developed ARToolKit, the first cross-platform open-source library for augmented reality (Arena et al., 2022). As the use of electronic devices continues to grow among students and educators, it becomes increasingly important for teachers to be innovative in their teaching methods. By integrating technology into their teaching strategies, educators can create a more engaging and enjoyable learning experience for their students (Panakaje et al., 2024). Incorporating technology into education is not a novel concept, especially within the context of 21st-century teaching and learning. Augmented Reality (AR) is one such technological innovation that is currently being used to enhance the learning and teaching process, thereby strengthening concept formation and understanding. AR enriches real-world settings by overlaying virtual objects or information such as audio, video, graphics, or simulations created by computer-based technologies (Dunleavy et al., 2009). Essentially, AR enhances perceptions of reality by integrating two- and three-dimensional digital content into real-world environments (Cepeda-Galvis et al., 2017; Cheng & Tsai, 2014). AR can engage multiple sensory modalities, including visual, auditory, haptic, somatosensory, and olfactory experiences This multi-sensory approach effectively complements traditional teaching methods, fostering critical thinking and enhancing student engagement and perception (Cipresso et al., 2011; Syahputri, 2019). According to Paladini (2018), and Singh (2025) currently, there are three main types of AR used in education: Marker-based AR, which requires target images or markers to annotate objects in a given space, using phone camera feeds to place 3D digital content within the user’s visual field; Marker-less AR, which does not require object tracking systems but instead uses advancements in cameras, algorithms, sensors, and processors to detect and map the real world; and Location-based AR, which merges virtual 3D objects into the user’s physical location, overlaying information based on geographical data. These AR technologies are increasingly employed in educational and training settings to facilitate interaction with both virtual and real-time applications. They offer dynamic representations of complex concepts across various disciplines, such as arts, science, social science, and mathematics, thereby enhancing students’ understanding. However, the application of AR extends across multiple subjects, including English language education, foreign languages, science, social studies, history, mathematics, special education, and vocational training. AR is also utilized in higher education research, creating realistic simulations that allow students to practice skills and concepts in safe, controlled environments (Egunjobi & Adeyeye, 2024). Recent technological advancements have significantly altered the educational landscape, integrating innovative tools like AR into traditional learning environments. AR blends virtual elements with real-world settings, primarily through mobile devices, tablets, and other appropriate tools, offering immersive educational opportunities that encourage interaction with virtual counterparts of physical environments (Pasalidou et al., 2023). These advancements play a significant role in increasing students’ motivation and engagement (Khan et al., 2019; Zuo et al., 2025). AR, which not only incorporates digital information into live footage of a user’s real-life environment, it provides several potential benefits as well, such as enhancing understanding of our surroundings, building contextual awareness, and scaffolding learners’ live experiences (Wu et al., 2013). The benefits of AR in education are numerous, including improved access to learning materials, the availability of virtual equipment, higher student engagement, faster and more authentic learning experiences, safer practice environments, increased motivation and attention in classes, the development of imagination, creativity, and abstract thinking, and the ability to teach complex concepts that are challenging to present in a traditional classroom setting. Despite these potential benefits, the successful integration of AR into schools depends largely on the actions and behaviors of teachers. Educators play a crucial role in applying new technologies in classrooms, which directly influences students’ engagement and learning outcomes. Therefore, understanding teachers’ attitudes, perceptions, and behaviors toward AR applications in educational practices is essential. A positive attitude, perception, and behavior towards AR are influenced by factors such as perceived enjoyment, perceived ease of use, and the relative merit of AR over traditional teaching methods. Teachers with a positive attitude toward AR are more likely to experiment with and integrate it into their pedagogical practices. Research has shown that AR technology can enhance teaching and learning outcomes in areas such as achievement, attitude, confidence, motivation, interest, engagement, and overall student satisfaction (Akcayir & Akcayir, 2017; Weng et al., 2020). The relationship among perception, attitude, and behavior is cyclical: perception influences attitude, which in turn impacts behavior. For example, if teachers perceive AR as user-friendly and pedagogically valuable, they are likely to develop a positive attitude, leading to increased use of AR in their teaching. This behavior can reinforce positive perceptions and attitudes, creating a feedback loop that promotes the continued use of AR in education. In this context, research revealed that teachers can be compared to expedition leaders, guiding students on a journey of discovery that expands their understanding of the world and prepares them to become knowledgeable, curious, and empathetic global citizens (AlGerafi et al., 2023; Zuo et al., 2024). AR facilitates discovery and self-exploratory learning, making the educational experience both engaging and enjoyable.
1.1. Review of Literature
Research on teachers' perceptions of Mobile Augmented Reality (MAR) consistently highlights generally positive attitudes and a readiness to integrate this technology into educational practices. Studies indicate that educational mobile AR apps can significantly enhance teaching performance, effectiveness, and productivity (Pasalidou & Fachantidis, 2021). Teachers, particularly those in biology and language education, view MAR as a tool that makes their teaching more engaging and interesting (Ashley-Welbeck & Vlachopoulos, 2020; Schmidthaler et al., 2023). This positive perception extends to various applications, including interactive, experiential, and authentic learning, as well as the visualization of complex concepts (Perifanou et al., 2023). However, challenges such as technological errors, Global Positioning System (GPS) issues, software lags, and students' unfamiliarity with AR can hinder its effective use (Mundy et al., 2019; Youm et al., 2024). Despite these challenges, teachers generally feel knowledgeable about AR technology and are willing to learn more to better integrate it into their classrooms (Dsouza & Hemmige, 2023; Mohamad & Husnin, 2023). Factors such as perceived usefulness, attitude, and behavioral intention significantly influence AR adoption, while perceived ease of use plays a moderate role (Ibili et al., 2019; Salmee & Majid, 2022). Notably, gender and geographical disparities exist, with female and urban teachers displaying more positive attitudes towards AR compared to their male and rural counterparts (Castaño-Calle et al., 2022; Putiorn et al., 2018). Teachers also express concerns about institutional support, teacher training, and the availability of AR educational applications, yet remain hopeful about the technology's potential to bridge gaps between learners and educators, and enhance student motivation (Manna, 2023). Overall, teachers are enthusiastic about AR's potential, particularly with adequate training and resources, and are eager to implement it in their curricula (Alkhabra et al., 2023; Jamrus & Razali, 2021). The assessment of teachers' attitudes towards MAR applications at the school level reveals diverse findings across various studies. A strong positive correlation between ease of use and positive attitudes towards AR in teaching at different educational stages was observed (Asiri & El-aasar, 2022; Cabero-Almenara et al., 2019b) although no such correlation was found between attitudes towards AR and science and technology (Kececi et al., 2021). Meanwhile, Wyss and Bäuerlein (2024) demonstrated about teachers’ high motivation and their strong link between positive attitudes towards AR and technology acceptance. Future teachers, particularly those in pre-service education, developed favorable attitudes towards AR, contributing to deeper learning (Hervás-Gómez et al., 2017; Meccawy, 2023). In higher education, faculty members generally displayed positive attitudes towards AR, influenced by factors like crisis response (Alqahtani, 2023; Kamarudin et al., 2023). The impact of teaching experience on AR attitudes varied, with some studies showing positive effects (Amores-Valencia et al., 2023; Banerjee & Walunj, 2019; Koutromanos & Jimoyiannis, 2022; Liu et al., 2023; Rahmat et al., 2023; Romano et al., 2020), while others found no significant impact (Al-Shahrani & Asiri, 2023b; Mundy et al., 2019). Both teachers and students exhibited high positive attitudes towards using AR in biology lessons, leading to enhanced attitudes towards science (Berame et al., 2022; Lham et al., 2020). However, despite moderate readiness, teachers with limited IT experience showed low attitudes towards AR in teaching Arabic (Asbulah et al., 2022). Positive correlations between attitudes and acceptance were also noted in chemistry teaching (Ripsam & Nerdel, 2024), though the influence of interface style and ease of use on enjoyment was weak (Wojciechowski & Cellary, 2013). Student attitudes towards AR were generally positive, particularly in science and technology subjects (Al-Anazi & Khalaf, 2023; Alqarni, 2021; Kamarainen et al., 2013; Sahin & Yilmaz, 2020; Sirakaya & Cakmak, 2018; Stojsic et al., 2022), although some studies reported negative attitudes at the university level and no significant impact on laboratory skills (Akçayır et al., 2016; Cao & Yu, 2023). Overall, AR applications were found to improve students' academic achievement, motivation, spatial thinking, creativity, and attitudes towards science lessons (Cetin, 2022; Ibáñez et al., 2020; Sökmen et al., 2024). Correspondingly, the exploration of teachers' behavior towards MAR applications at the school level reveals a wide range of insights across several studies. Research has consistently shown that MAR significantly impacts knowledge acquisition and behavioral changes among teachers (Chang et al., 2014; Do et al., 2020; Lin et al., 2013). Several studies have also highlighted that factors such as attitude, subjective norms, and behavioral control play a critical role in influencing the use of MAR in both research and higher secondary education (Buchner et al., 2022; Cheon et al., 2012; Marín-Marín et al., 2023; Vaida & Pongracz, 2022). Abdelmagid et al. (2021) found that both teachers and students acknowledged the purposefulness and potential of AR in education. Additionally, Georgiou and Kyza (2017) demonstrated that AR not only enhances cognitive processes such as information collection it also work on problem-solving. However, Wijnen et al. (2023) pointed out challenges in identifying the specific effects of MAR on teachers' higher-order thought processes. Ozdamli and Hursen (2017) noted that while AR applications might encounter barriers due to international connections, both teachers and students were generally satisfied with AR-guided teaching. Further research has established that AR applications can significantly improve the learning of challenging topics, foster exploitative behavior, and enhance perceived utility and positive attitudes, providing valuable insights for policymakers (Alalwan et al., 2020; Alzahrani, 2020; Mena et al., 2023).
The study of the relationship among perceptions, attitudes, and behaviors towards MAR applications offers varied insights from numerous studies. Prospective teachers generally had positive perceptions of AR technology, with their acceptance of this technology significantly increasing after hands-on experience (Jiang et al., 2025; Jung & tom-Dieck, 2018; Karthick & Shanmugam, 2024; Okumuş & Savaş, 2024). However, no significant difference or correlation was found in their self-efficacy, attitudes, or performance when using AR technology (Elford et al., 2022). Other studies (Cai et al., 2013; Giard & Guitton, 2016; Milad & Fayez, 2025) highlighted differing attitudes, behaviors, and perceptions among students and teachers regarding mobile device usage, with AR tools serving as complementary learning aids, proving effective across a range of student performance levels. The comparison between male and female school teachers' perceptions, attitudes, and behaviors towards MAR applications shows largely positive attitudes across both groups. Studies (Kudale & Buktar, 2022; Tiede et al., 2022) indicate that most teachers are favorable towards using AR in the teaching-learning process, with only a few expressing negative views. Nikou (2024) found that teachers' perceptions of educational AR apps were strongly linked to their views on the apps' usefulness, with perceived usefulness and ease of use being key factors influencing the intention to adopt MAR (Papakostas et al., 2022). Ghobadi et al. (2023) reported no significant differences between male and female teachers, as both groups exhibited positive attitudes and behaviors toward AR. Kazakou and Koutromanos (2022), and McNair and Green (2016) highlighted that teachers had positive perceptions of AR, especially in online and distance learning settings. In science education, smartphone applications and marker-based content were the most popular AR tools among both genders (Arici et al., 2021; Atalay, 2022). However, Dirin et al. (2019) observed that female teachers had a more favorable perception of AR, noting its role in enhancing enjoyment and memorability in the classroom.
1.2. Rationale of the Study
The integration of Augmented Reality (AR) technology into educational practices offers transformative potential in enhancing the teaching-learning process. In the context of Indian education, where traditional methods still dominate, the adoption of innovative technologies like Mobile Augmented Reality (MAR) presents both opportunities and challenges (Kumari & Polke, 2019; Mirza et al., 2025; Thangavel et al., 2025). In the present study it is motivated by the need to understand how Indian school teachers perceive, approach, and behave towards AR applications within the classroom setting. Previous studies have highlighted the generally positive attitudes of teachers worldwide towards Augmented Reality Application (ARA), recognizing its ability to make learning more engaging, interactive, and effective. However, it has also uncovered challenges such as technological limitations, lack of familiarity, level of interest, and the need for institutional support, which can hinder the full adoption of AR. In India, where there is a diverse educational landscape with significant variations in resources, teacher training, and technological access, understanding these dynamics becomes crucial (Shivani & Chander, 2023). Thus, the rationale for this study lies in the need to fill the existing gap in the literature regarding the perceptions, attitudes, and behaviors of Indian educators towards AR technology, specifically at the school level. As India continues to push for digital transformation in education, it is essential to assess whether teachers, the key facilitators of learning, are ready to embrace this change. Consequently, this study seeks to explore how Indian teachers perceive the usefulness, ease of use, and overall impact of AR applications on their teaching practices and students' learning experiences. By examining attitudes, the study search for to determine the level of enthusiasm or resistance among teachers towards incorporating AR in their curricula (Palada et al., 2024). Understanding teachers' behaviors towards AR whether they are actively using it, reluctant to adopt it, or somewhere in between will provide insights into the practical challenges they face and the support they require. Similarly, a critical aspect of this research is the comparison between male and female teachers' perceptions, attitudes, and behaviors towards AR applications. Gender disparities in the adoption of educational technologies have been noted in various studies, and this research is contributed to understanding whether such differences exist in the Indian context and what factors might influence them. Additionally, the study is explored the relationship among teachers' perceptions, attitudes, and behaviors towards AR, offering a comprehensive view of how these elements interact and shape teachers' willingness to integrate AR into their teaching. By investigating these factors, the study aims to identify the key enablers and barriers to AR adoption in Indian schools. Finally, the research will examine the broader factors influencing teachers' perceptions, attitudes, and behaviors, including technological readiness, professional development opportunities, and institutional support. The findings from this study would not only provide valuable insights into the current state of AR adoption in Indian schools but also offer recommendations for policymakers, educational leaders, and technology developers on how to better support teachers in embracing AR. This research is timely and significant as it addresses the need for evidence-based strategies to enhance the integration of innovative technologies in Indian education, ultimately contributing to improved educational outcomes and a more future-ready learning environment.
1.3. Statement of the Study
The study titled "Exploring Indian Educators' Perception, Attitude and Behaviour Regarding Augmented Reality Applications in School Settings: A Comprehensive Mixed-Methods Study" aims to investigate the research problem. The goal of this research is to comprehend Indian educators' attitudes, behaviors, and thoughts on the use of augmented reality (AR) in the classroom. Utilizing gadgets like smartphones or AR glasses, augmented reality technology incorporates digital components, such as sounds or images, into the physical world. The study examines the key issues, such as instructors' opinions of augmented reality. Do they think it's helpful or not? What do they think of implementing augmented reality in the classroom? Are they apprehensive, intrigued, or perhaps thrilled? In what ways do they employ augmented reality in their teaching? Are they using it frequently, infrequently, or never? The study also looks at whether male and female instructors have different ideas, emotions, and behaviors in this regard, as well as what aspects of the school may have an impact on how they use AR. A variety of techniques are used in the research to obtain a complete picture of the circumstances.
1.4. Objectives
- To study the Indian teachers' perception on augmented reality applications at school level.
- To assess the Indian teachers' attitudes on augmented reality applications at school level.
- To investigate the Indian teachers' overall behavior on augmented reality applications at school level.
- To explore the relationship among perceptions, attitudes and behaviors of Indian school teachers towards augmented reality applications.
- To examine the factors of having perceptions, attitudes and behaviour of Indian school teachers towards augmented reality applications at school level.
1.5. Hypotheses
- H1: There would have a significant level of perception among the teachers on augmented reality applications at school level.
- H2: Significant level of attitudes would be explored among the teachers on augmented reality applications at school level.
- H3: There would be a significant level of practices in terms of behaviour among educators towards augmented reality applications at school level.
- H4: Significant level of relationship among perception, attitudes and behaviour would be found among educators towards augmented reality applications.
- H5: Multiple factors would be observed of having perceptions, attitudes and behaviour of Indian school teachers towards augmented reality applications at school level.
1.6. Research Questions
- What are the key factors that influence Indian school teachers' perceptions of augmented reality applications in educational settings?
- How do various demographic factors (e.g., age, gender, teaching experience) influence teachers' attitudes towards the use of augmented reality in schools?
- In what ways do school-level factors (e.g., availability of resources, administrative support, training opportunities) affect teachers' behaviors in implementing augmented reality in their teaching practices?
- Are there any external factors (e.g., curriculum requirements, peer influence, student engagement) that significantly impact the adoption of augmented reality by Indian school teachers?
2. Methodology
2.1. Design
Researchers used a descriptive mixed-method strategy for this investigation. In order to provide a comprehensive understanding of the study subject, this approach integrates qualitative and quantitative research approaches. With regard to this hybrid methodology, the study aims to emphasize the benefits of qualitative and quantitative data by offering a more thorough and nuanced perspective than could be acquired from either technique alone. The quantitative component involves gathering and analyzing numerical data in order to identify patterns, trends, and correlations. This information provides a thorough summary of the research issue and enables the extrapolation of research findings to a larger population (Creswell & Clark, 2023; Schoonenboom & Johnson, 2017). The qualitative component, on the other hand, focuses on gathering detailed narrative data that sheds light on the underlying attitudes, beliefs, and intentions that underlie the observed trends. Closed-ended surveys and interviews methods that enable a detailed analysis of participants' experiences and points of view are used to achieve this. The integration of these two approaches into a descriptive mixed-method design facilitates data triangulation, hence enhancing the validity and coherence of the study's findings (Creswell & Clark, 2017; Dejonckheere et al., 2019). According to Johnson and Onwuegbuzie (2004) this type of design provides a thorough, complex, and varied understanding that informs recommendations and findings, ensuring that the study covers the full breadth and depth of the research topic.
2.2. Sample
Figure 1.
Sampling procedure.
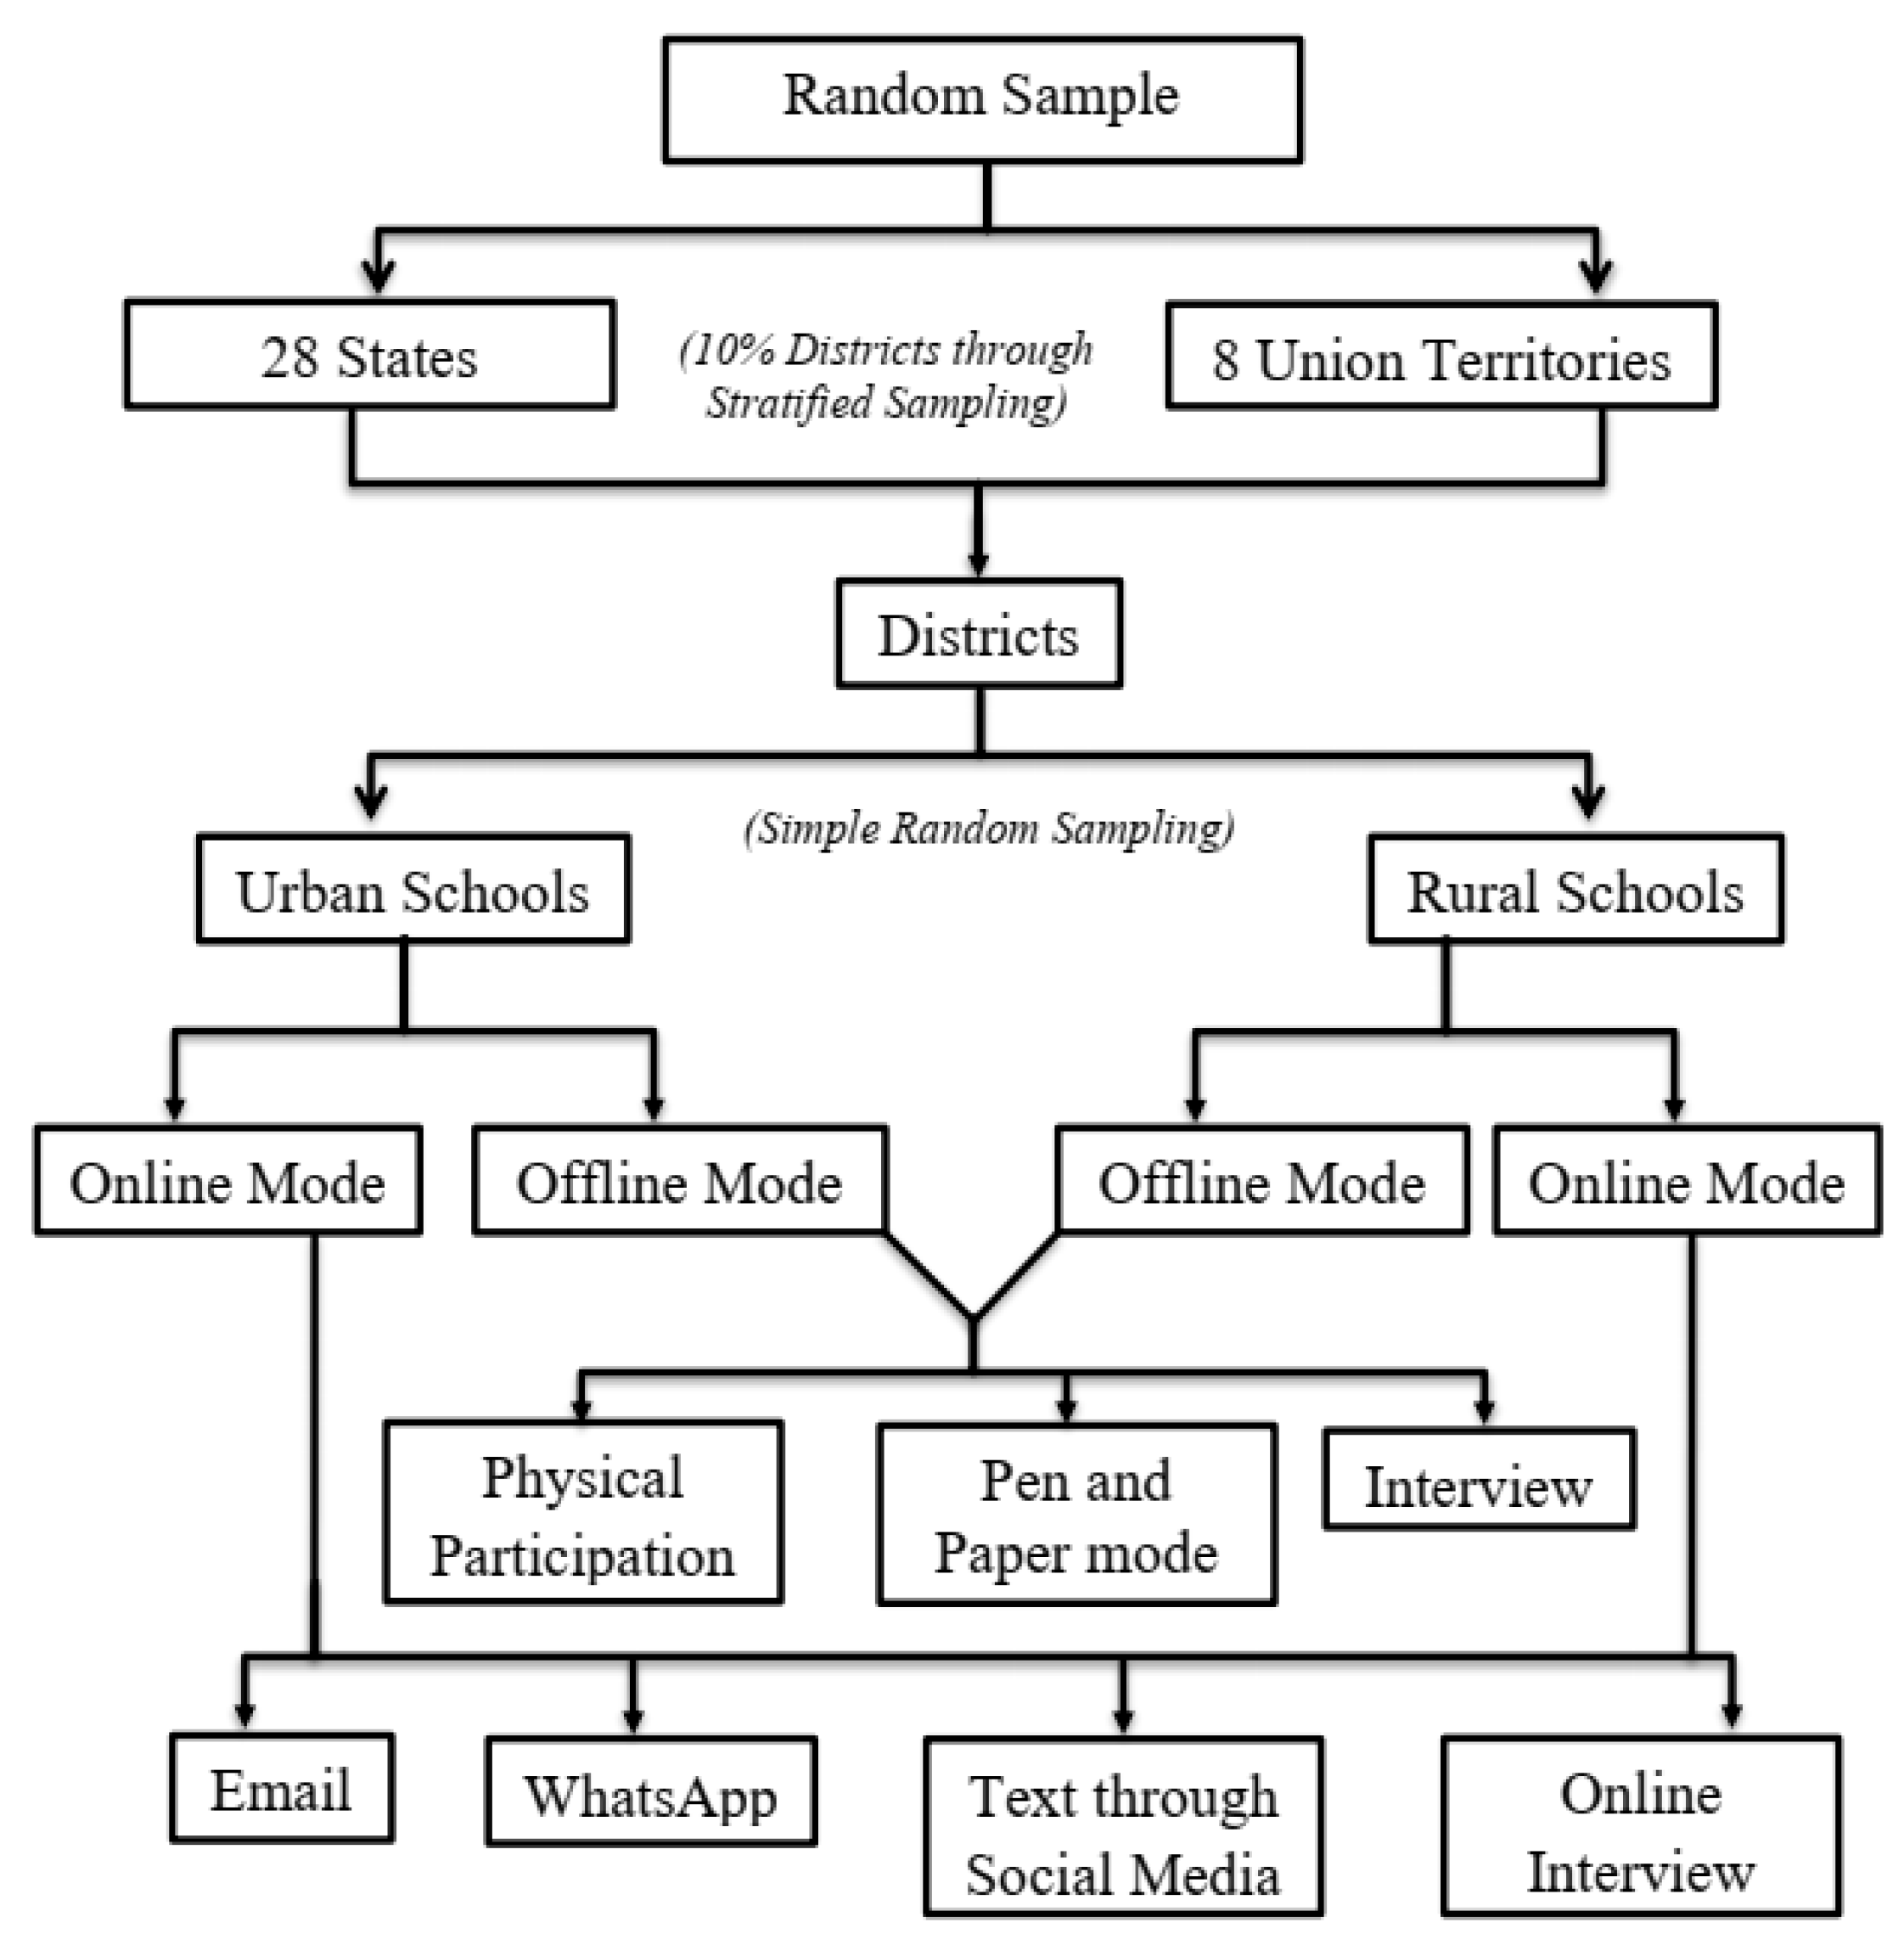
In this study, a comprehensive sampling process was conducted, involving teachers from both urban and rural schools across India. The process began with random sampling to select participants from all 28 states and 8 union territories. This was followed by the selection of 10% of districts within each region using stratified sampling to ensure a representative sample (Makwana et al., 2023; Tipton, 2013). Within these districts, schools were chosen through simple random sampling. As a result, 531 urban school teachers participated in the study, contributing both online via email, WhatsApp and offline through physical participation using pen-and-paper methods. Additionally, 199 rural school teachers participated in offline through pen-and-paper methods and online via social media texts. The total sample size for the study was 730 teachers. Of these, only 52 interviews were conducted in both online and offline modes, depending on the convenience of the participants. This approach ensured that diverse perspectives from both urban and rural educators were well-represented in the study.
2.3. Tools
In this research we developed standardized, self-designed questionnaires to gather data, comprising sixty closed-ended items (twenty per variable) and nine open-ended items. These instruments were designed to assess educators' perceptions, attitudes, and behaviors concerning the use of Augmented Reality (AR) applications in school settings. The perception assessment included 20 multiple-choice questions, each with four response options, awarding 5 marks for correct answers and 0 mark for incorrect ones (Scharf & Baldwin, 2007; Yaneva et al., 2022). To identify the most significant attitudes and behaviors towards AR applications, two sets of twenty statements were used, based on a five-point Likert scale. The first set ranged from Strongly Agree (SA), Agree (A), Undecided (UD), Disagree (D), to Strongly Disagree (SD), while the second set ranged from Always (A), Often (OF), Occasionally (OC), Rarely (R), to Never (N). Educators selected their responses by circling one of the five options. For positive statements, the responses were scored as 5, 4, 3, 2, and 1, respectively, while for negative statements, the scoring was reversed: 1, 2, 3, 4, and 5 (Alhassn et al., 2022; Joshi et al., 2015; Tanujaya et al., 2022). Additionally, nine open-ended interview questions were designed to delve deeper into educators' perceptions, attitudes, and behaviors regarding AR applications.
A total of 60 minutes was allotted to administer all three sets of questionnaires, each consisting of 20 items, making 60 items in total and this was clearly stated in the instructions. The total scores for perceptions ranged from 0 to 100, while the scores for attitudes and behaviors ranged from 20 to 100. These were categorized into five levels—Very High, High, Moderate, Low, and Very Low—each approximately divided into equal intervals using the stratification method employed by Ascher-Svanum et al. (2013), and Naveau et al. (2016). To standardize the questionnaires, a thorough validation process was undertaken, emphasizing content and face validity, with the involvement of nine field experts. The questionnaires were administered to a sample of 30 participants. The Kuder-Richardson reliability coefficient for perceptions was calculated at 0.79, appropriate due to the dichotomous nature of the responses, where each question had only two possible answers either correct or incorrect, scored as 0 and 5, respectively. Similarly, Cronbach's alpha was used to assess the reliability for attitudes and behaviors, yielding coefficients of 0.78 and 0.84, respectively, reflecting the internal consistency of responses on a standardized 1 to 5 scale (Garratt et al., 2011; Wadkar et al., 2016).
2.4. Procedure of Data Collection
The data collection process for this study involved distributing survey questionnaires to educators from various private and government (Public) schools across India, regardless of age, gender, qualifications, or the educational boards of their institutions. These schools and institutes were situated in rural and urban areas of India. To ensure a diverse and representative sample of teachers, we employed both physical and digital communication methods. For the physical distribution, we conducted one-on-one sessions with participants, followed by sending the survey questionnaires via email and WhatsApp. This approach ensured efficient and widespread distribution of the survey tools. Before administering the questionnaires, we provided detailed information to all potential participants regarding the survey’s nature, the study's purpose, and the time required to complete the questionnaire. This information was crucial to ensure that participants were well-informed and could make an informed decision about their participation. For online data collection, we utilized Google Forms, a convenient platform for gathering and organizing responses (Bhalerao, 2015; Hsu & Wang, 2017), similarly participants were given clear instructions and a timeline for submission, which helped facilitate timely and accurate data collection (Belisario et al., 2015; Rayhan et al., 2013). By the conclusion of the data collection period, we had received a total of 730 responses, 237 from male and 493 from female participants, with 531 responses from urban areas and 199 from rural areas. For the open-ended items, we conducted interviews with participants at their convenience, either online or offline, with each session lasting 10 to 15 minutes. In analyzing the responses, we identified a noticeable gap based on gender and location, possibly influenced by the combination of online and offline data collection methods (Contreras et al., 2024; Sethuraman et al., 2005). Throughout the process, we placed significant emphasis on obtaining informed consent from all participants, reflecting our ethical commitment. Instead of seeking formal ethical approval from an institutional review board, we focused on securing explicit consent from each participant. This ensured that all participants voluntarily agreed to participate, fully understanding their rights and the nature of their involvement. This approach underscored the researchers' dedication to maintaining ethical standards and respecting participants' autonomy.
The collected dataset comprises both categorical and continuous variables. To assess the normality of the continuous data, the Shapiro-Wilk Test was employed. The Shapiro-Wilk test showed a significant departure from normality, W(730) = .97, p < .001. Although the result indicated that the data were not normally distributed, a combination of statistical tests was applied to analyze the dataset appropriately. Given the mixed nature of the variables, Chi-square (χ²) tests were used for categorical data analysis, while t-tests and F-tests were employed to compare means across groups. Additionally, correlation analysis was conducted to examine the relationships among continuous variables (Bandla et al., 2024; Lee & Lee, 2022; Shapiro & Wilk, 1965).
3. Result and Analysis
3.1. Hypothesis1
The result of Hypothesis1 examined the significance of teachers' perceptions of augmented reality applications (ARA) at the school level. This was done by analyzing the range, frequencies, and percentages of respondents based on their gain scores. Additionally, the hypothesis examined the significant differences in the levels of perception and the variables associated with teachers’ views on augmented reality applications. These differences were analyzed using the Chi-square test and t-test, based on the respondents' gain scores.
Table 1 represents the distribution of teachers’ perception scores regarding the use of Augmented Reality Applications (ARA) at the school level. The findings indicate that the majority of teachers fall within the moderate perception category. Specifically, 248 female and 148 male teachers scored between 41 to 60, resulting in gain scores of 8,055 and 13,215, respectively. This category accounts for a combined total of 29.14% of the overall gain scores. Additionally, 14.34% of teachers are categorized as having a high level of perception and their scores ranging from 61 to 80, including 125 female and 28 male teachers. Their corresponding gain scores are 1,940 and 8,525, respectively (Dirin et al., 2019; Habig, 2020). In contrast, a smaller proportion of teachers fall into the low category, contributing 8.24% to the total gain scores, with 116 females and 54 males scoring within the 21 to 40 range. Notably, a negligible number of teachers, just 0.25%, are found in the very low category and their scores ranging between 0 and 20. Importantly, no teachers scored within the very high category (scores ranging from 81 to 100), indicating the absence of exceptionally high perceptions. Overall, the data suggest that while a moderate to high level of perception toward the use of ARA exists among teachers, there remains significant scope for improvement. Efforts should focus on enhancing teachers’ knowledge, awareness, and understanding of ARA to elevate perceptions into the higher categories and promote more effective integration of these technologies in educational settings (Alkhabra et al., 2023; Di-Fuccio et al., 2024).
The line graph (Figure 2) illustrates the percentage of gain scores of male and female teachers across five perception levels (Very High, High, Moderate, Low, and Very Low) regarding augmented reality applications.
The results of the Chi-square (χ²) tests are shown in Table 2, which shows significant differences in teachers’ perceptions of ARA across different demographic variables, such as gender, school location, school category, teaching stream, qualification, and age group. In this analysis, the degrees of freedom for the Chi-square test are reported as 3 instead of 4 because categories with zero frequency counts are excluded. In a contingency table, a row or column that contains all zero values contributes no variability to the dataset and is therefore excluded from the degrees of freedom calculation. Including such categories can distort the statistical result and result in incorrect conclusions. This approach is consistent with normal statistical standards, as endorsed by Bock et al. (2010) and Finkler (2010), who underlined the necessity of only using legitimate, non-zero data in Chi-square computations.
There is a gender-based variation that shows (Table 2 and Figure 3) a statistically significant difference in the level of perception (χ²=23.26, df=3, p=0.00004). Overall, male teachers exhibit marginally lower levels of perception compared to their female counterparts, particularly in terms of the number of instructors reporting high or extremely high perceptions. Higher and intermediate levels of perception are more commonly observed among female teachers. This suggests that perceptions of ARA are influenced by gender, with female teachers generally holding a more favourable view (Abdusselam & Karal, 2020; Uderbayeva et al., 2025).
The calculated result of teachers' perception levels on ARA across different school locations (rural vs. urban) reveals no statistically significant difference (χ²=4.814, df=3, p=0.1859), as the p-value exceeds the threshold of 0.05 (Table 2 and Figure 4). In rural schools, the observed frequencies for perception levels are slightly different from the expected values: 33 teachers describe high perceptions (expected=41.71), 114 describe moderate (expected=107.95), 47 state low (expected=46.34), and 5 convey very low (expected=3), while none describe very high perceptions. In urban schools, 120 teachers indicate high perception levels (expected=111.29), 282 moderate (expected=288.05), 123 low (expected=123.66), and 6 very low (expected=8); again, no teachers report very high perceptions. These minor deviations between observed and expected frequencies contribute to a relatively low chi-square value, indicating that the location of the school does not significantly influence teachers’ perceptions of ARA (Al-Shahrani & Asiri, 2023a).
Teachers' perceptions of ARA are statistically significant (χ²=27.30, df=3, p<0.00001) according to the chi-square test, which examines the relationship between school category (private vs. government) and teachers' perceptions (Table 2 and Figure 5). There are no teachers who report extremely high perceptions among the teachers in government schools; 50 report high perceptions (anticipated=64.13), 199 moderate (expected=165.99), 51 low (expected=71.26), and 6 very low (expected=4.61). None of the instructors in private schools have very high perceptions, while 103 report high perceptions (expected=88.87), 197 moderate perceptions (expected=230.01), 119 low perceptions (expected=98.74), and 5 very low perceptions (expected=6.39). For both school types, there are notable differences, especially in the moderate and low categories. These findings imply that there are notable differences in the perceptions of ARA between government and private school teachers, with the former exhibiting comparatively higher views in some categories. This could be due to variations in exposure, resources, or institutional support for integrating technology (Akinradewo et al., 2025; Liao et al., 2024).
The chi-square test examines the relationship between teachers' perceptions of ARA and their academic streams, such as Science and Arts. It finds a statistically significant difference (χ²=27.91, df=3, p<0.00001), suggesting that perception is significantly influenced by the teaching stream (Table 2 and Figure 6). None of the teachers in the Science stream indicate very high or very low perceptions (anticipated=4.7), while 77 report high perceptions (expected=65.39), 143 moderate perceptions (expected=169.25), and 92 low perceptions (expected=72.66). However, no teachers in the Arts stream indicate extremely high opinions; instead, they express 76 high (anticipated=87.61), 253 intermediate (expected=226.75), 78 low (expected=97.34), and 11 very poor (expected=6.3) perceptions. The overall chi-square value was influenced by significant deviations from expected frequencies, especially in the moderate and low categories (Ibáñez et al., 2020; Nikou et al., 2024a). According to these findings, teachers of the arts and sciences have different perspectives on ARA. These discrepancies may result from exposure to digital technologies in their various fields of education, subject-specific pedagogical techniques, or disparities in technological familiarity (Meng et al., 2024; Ventrella & Cotnam-Kappel, 2024).
The chi-square test reveals a statistically significant result (χ²=19.31, df=3, p=0.00024) indicating that teachers' qualifications, such as Trained Graduate Teachers (TGT) and Post Graduate Teachers (PGT), have a meaningful influence on their perception levels of ARA (Table 2 and Figure 7). Among TGTs, 135 report high perceptions (anticipated=124.5), 327 moderate (expected=322.22), 121 low (expected=138.33), and 11 very low (expected=8.95), while none express very high impressions. Among PGTs, 18 have high perceptions (expected=28.5), 69 have moderate perceptions (anticipated=73.78), 49 have low perceptions (expected=31.67), and none have very high or very low perceptions (expected=2.05). The most noticeable variances are found in the low perception group, where PGTs are overrepresented, and the high category, when TGTs outperform expectations. These data imply that TGTs have typically more positive impressions of ARA than PGTs, which could be due to differences in training emphasis, classroom responsibilities, or comfort with integrating modern technology (Alalwan et al., 2020; Uygur et al., 2018).
Teachers' perceptions of ARA and their age groups are compared using chi-square analysis. The results show no statistically significant difference (χ²=1.4751, df=6, p=0.961), since the p-value is significantly higher than the 0.05 threshold (Table 2 and Figure 8). The three age groups for teachers are 20–33, 34–47, and 48–60 years old and older. None of the age groups attest to a very high degree of perception. Within the 20–33 age range, there are only minor departures from expected frequencies: 102 instructors express high perceptions (expected=104.17), 272 moderate (expected=269.61), 115 low (expected=115.74), and 8 extremely low (expected=7.49). Similar trends are seen in the 34-47 and 48-60+ groups, with no significant differences between observed and expected counts across all perceptual levels. These data demonstrate that age has no significant influence on teachers' perceptions of ARA, indicating a reasonably consistent attitude regarding the use of augmented reality in education throughout age groups (Cyril et al., 2022; Nikou et al., 2024b; Schlomann et al., 2022) but it was differed from the study of Castaño-Calle et al. (2022) due to the reasons of versatility, adaptability and positive perception of AR.
Figure 8.
Age wise teachers’ perception towards ARA through Chi-square distribution.
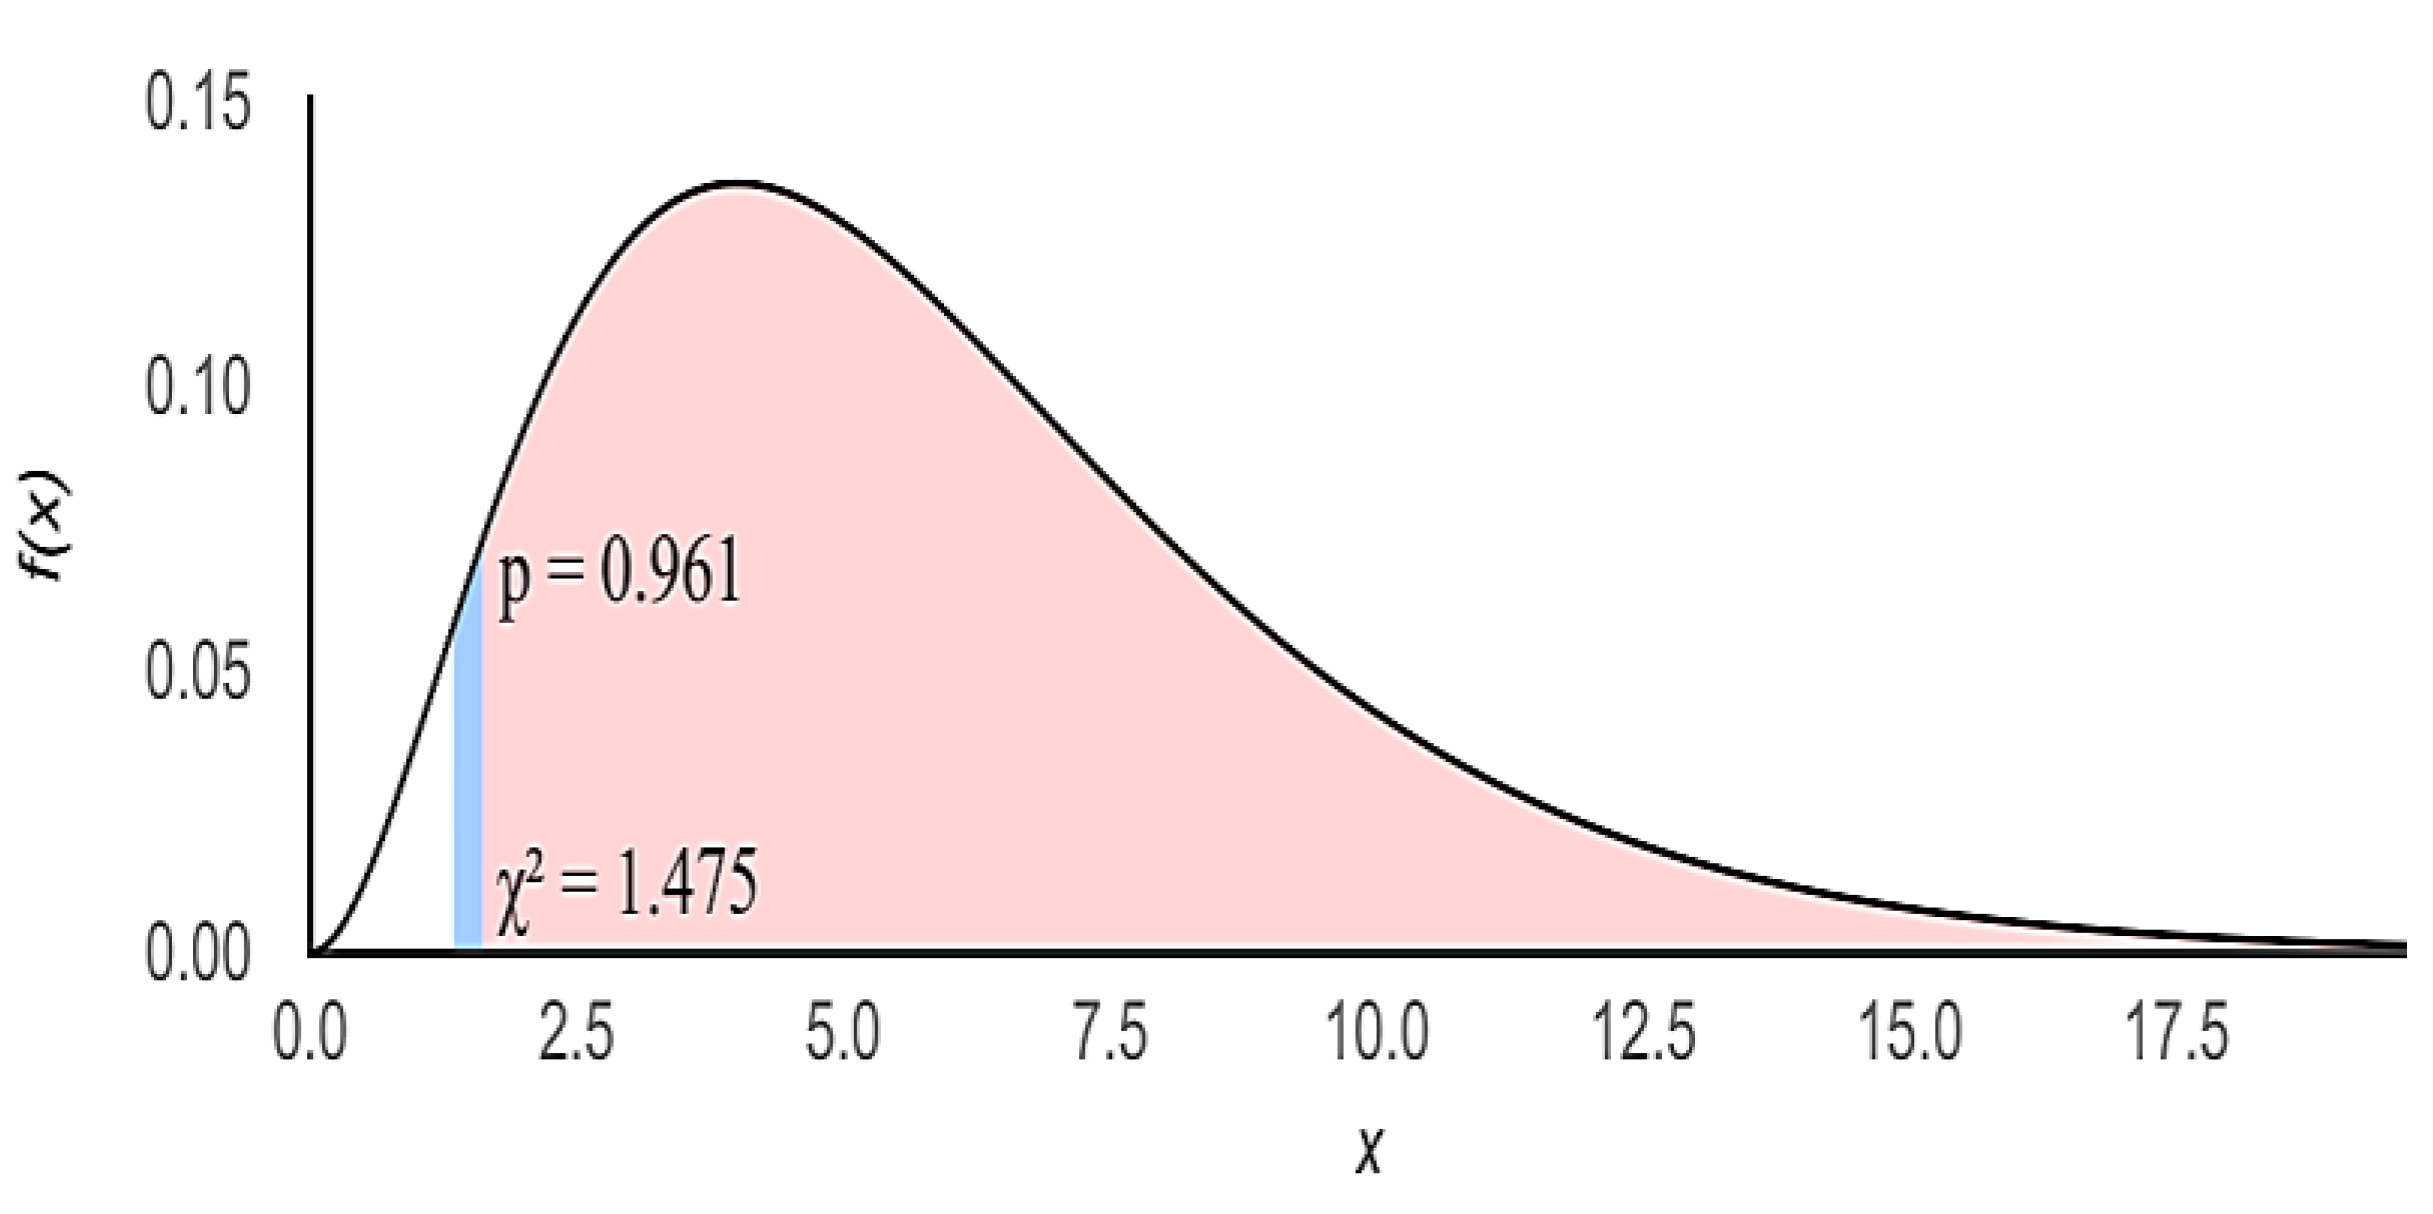
Figure 9.
Chi-square test of teachers’ perception level on ARA across different demographic variables.
Figure 9.
Chi-square test of teachers’ perception level on ARA across different demographic variables.
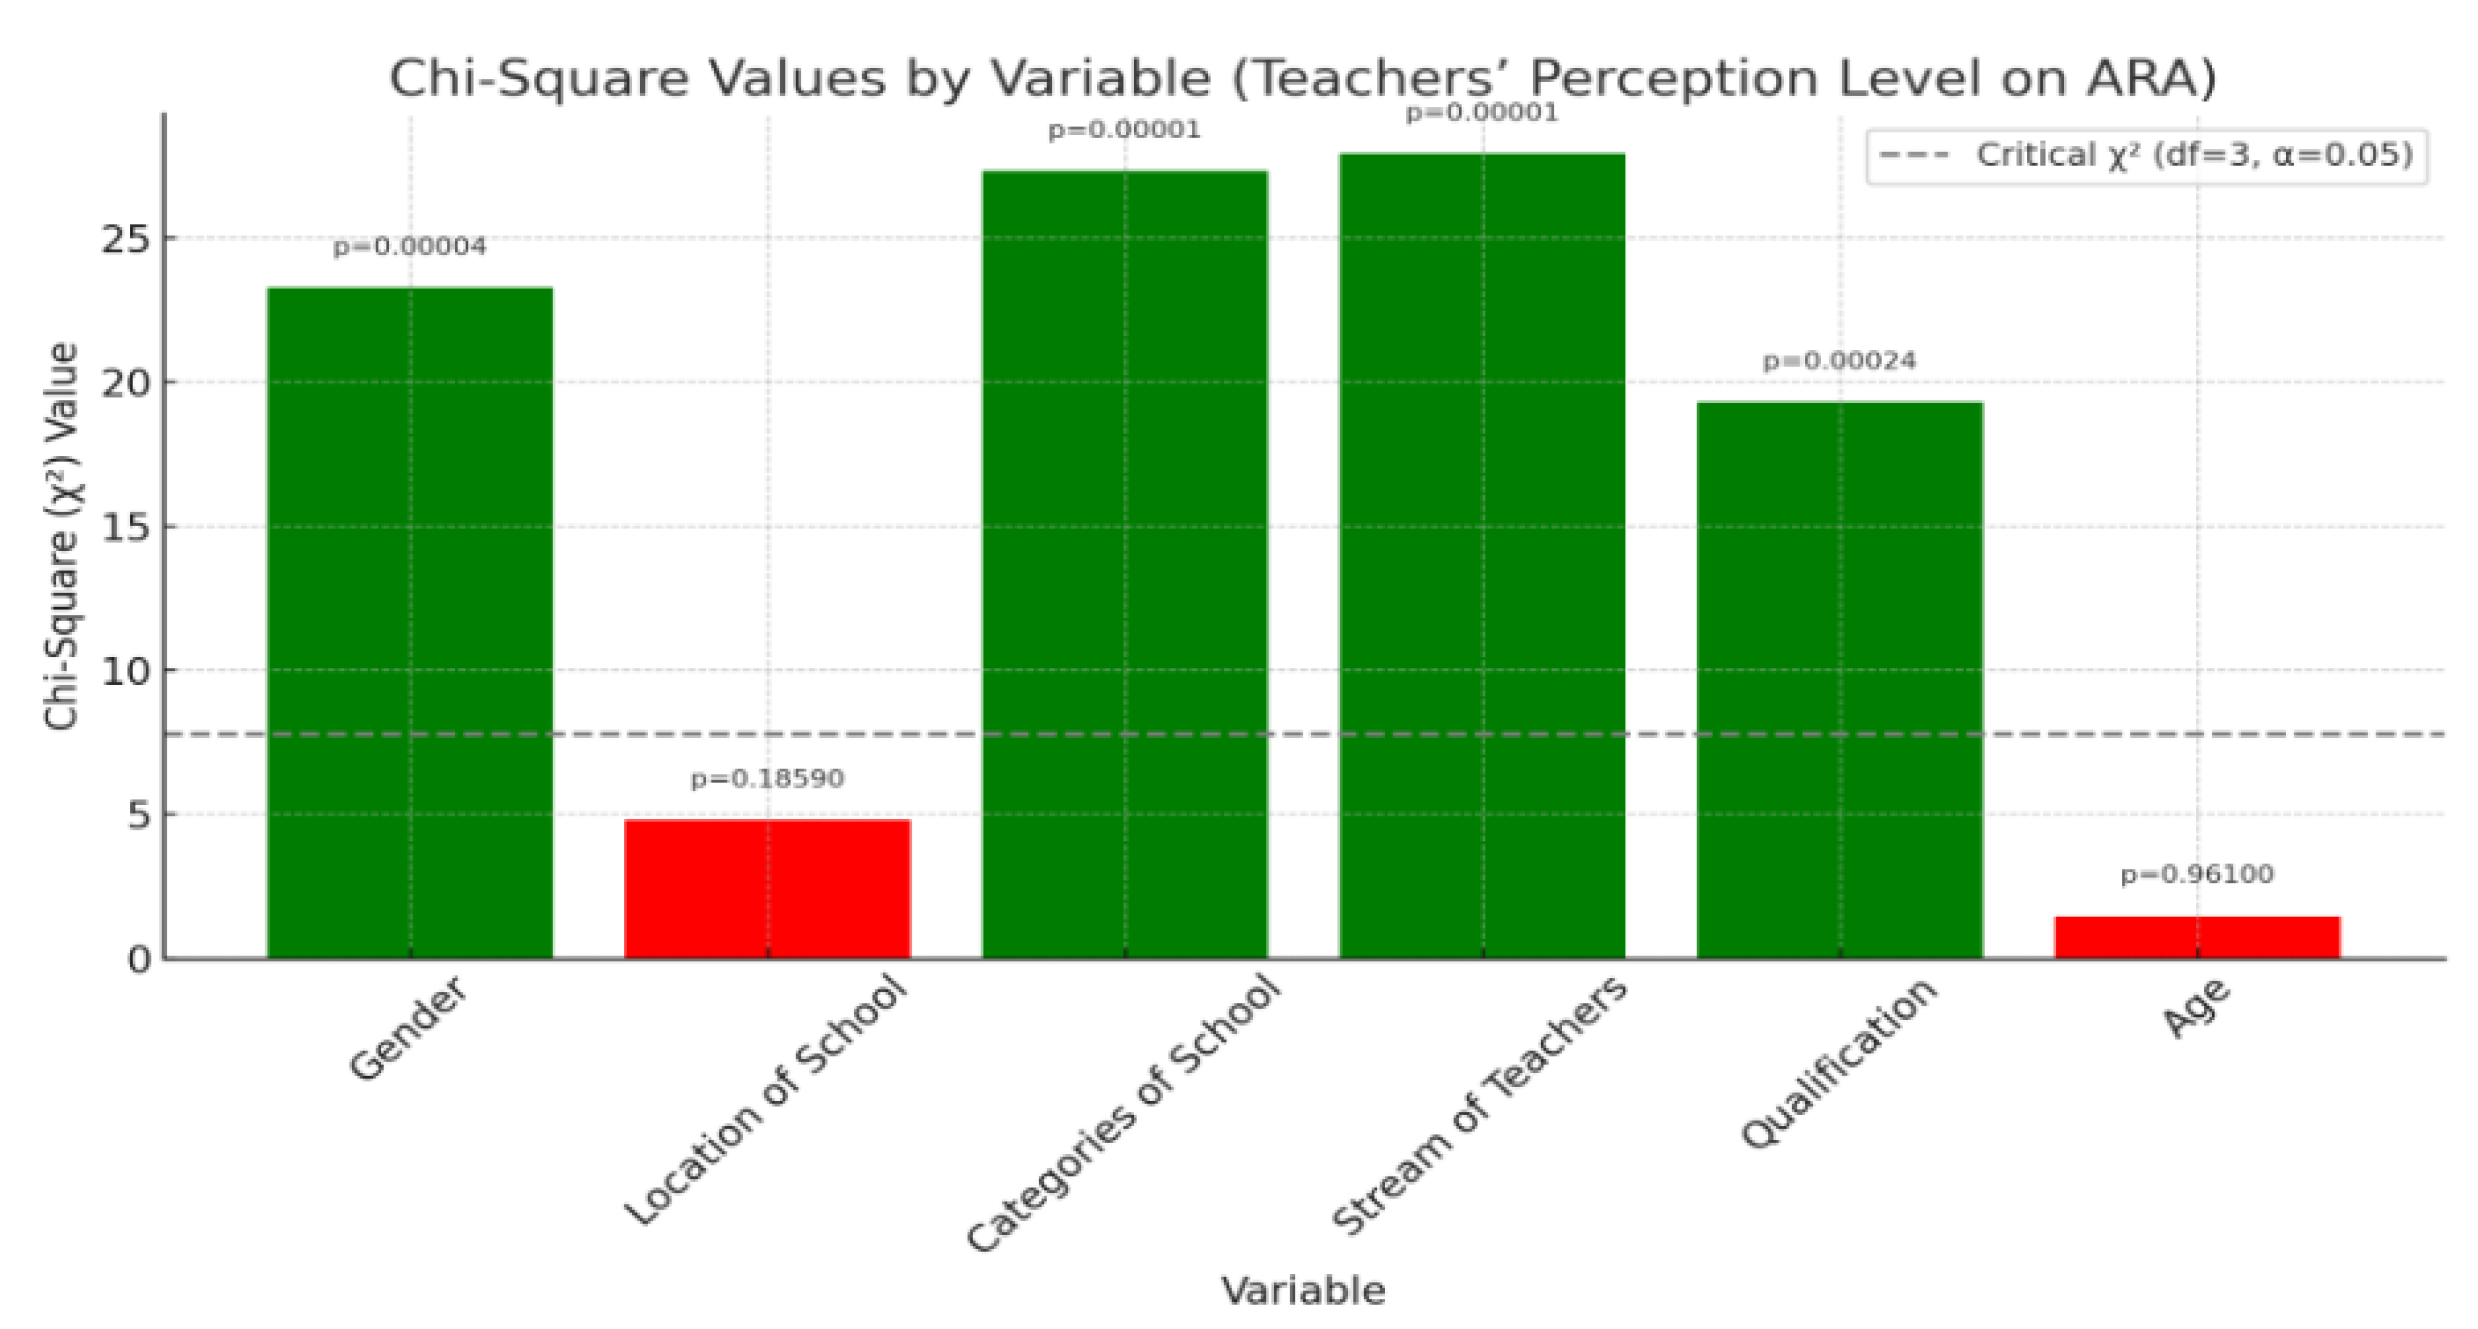
Overall, according to conventional statistical criteria, the difference is highly significant (χ²=416.553, df=3, p=0.00001), indicating a marked variation in teachers' perceptions of augmented reality (AR) applications at the school level. Notably, significant differences in perception were observed based on individual variables such as gender, type of school, teaching stream, and academic qualifications and findings were supported by Faqih and Jaradat (2021). In contrast, factors like geographical location and, particularly, age did not show a significant impact (Turan et al., 2018). These findings suggest that professional background and institutional context play a more influential role in shaping teachers' perceptions and engagement with AR in education than demographic factors like age or school location (Dahri et al., 2024; Sahin & Yilmaz, 2020).
Table 3 demonstrates whether there are any significant changes in teachers’ impressions of ARA depending on various background characteristics using t-tests. Here's an unswerving explanation for each variable along with graphs:
The sample consists of 237 male and 493 female teachers (Table 3). The mean perception score for male educators is 50.76 (SD1=12.67, SEM1=0.82), whereas female teachers have a slightly higher score of 52.54 (SD2=12.86, SEM2=0.58). The standard error of the difference (SED) is 1.012, while there exist 728 degrees of freedom (df). The computed t-value is 1.755, with a matching p-value of 0.079 (p>.05). Although female teachers have a slightly higher mean perception score, the difference between the two groups is not statistically significant at the traditional 0.05 level (Figure 10), demonstrating that gender has no meaningful influence on teachers' perceptions of ARA, and it does not play a major role in shaping perceptions of augmented reality in educational contexts (Nikou et al., 2024a; Qirom & Sukma, 2024).
There is a contrast of how rural and urban teachers see ARA (Table 3 and Figure 11). The average score for rural teachers is 51.18, while urban instructors score somewhat better at 52.25. However, the difference between the two groups is marginal and not statistically significant (t=1.004, df=728, p=0.315, p>.05). This means that whether a teacher is from a rural or urban area does not make a meaningful difference in how they perceive the use of augmented reality in education (Salmee & Majid, 2022).
The test measures teachers' perceptions toward ARA in both government and private schools (Table 3 and Figure 12). Government school teachers have an average score of 52.24, but private school teachers have a slightly lower average of 51.76. However, this tiny difference is not statistically significant (t=0.501, df=728, p>.05), implying that the type of organization whether government or private has no meaningful impact on teachers' attitudes toward employing augmented reality in education (Bhattacharya et al., 2025; Wyss et al., 2022).
Teachers in the arts and science streams' opinions of ARA are displayed in the Table 3. The average score for science educators is slightly higher (52.18) than that of art teachers (51.79). At t=0.401, df=728, p>.05, this difference is negligible and not statistically significant (Figure 13). This indicates that a teacher's perception of the employment of augmented reality in the classroom is not much influenced by their academic background, whether it be in the arts or sciences (Almaleki, 2022; Grinshkun et al., 2021).
The Table 3 indicates that Trained Graduate Teachers' (TGTs') and Post Graduate Teachers' (PGTs') perceptions of ARA differ significantly. With an average score of 52.93, PGTs outperform TGTs, which have a lower average score of 47.07. It is highly improbable that this difference is the result (Figure 14) of chance because it is statistically significant p <.05, .01 (t = 4.662, df = 728, p = 0.0001). As a result, classification matters hence, PGTs' perceptions of augmented reality in the classroom are noticeably more favourable than TGTs' thoughts (Al-Akloby, 2023).
The perspectives of teachers with varying degrees of experience about ARA are validated in the Table 3. The mean score for teachers with more experience (41–60 years and beyond) is 54.02, whereas the mean score for teachers with less experience (20–40 years) is 51.66. This implies that teachers with more experience would have a more favourable perceptions of ARA, although the difference (Figure 15) is not statistically significant p>.05,.01 (t=1.653, df=728, p=0.098). This means that the variation in perception based on years of experience is not strong enough to draw a firm conclusion, and experience level does not significantly influence teachers' views on the use of augmented reality in education (Bangga-Modesto, 2024; Nikou et al., 2024a).
3.2. Hypothesis2
The result of Hypothesis2 assessed the significance of teachers' attitudes toward augmented reality applications (ARA) in schools. This analysis involved examining the range, frequencies, and percentages of respondents according to their gain scores. Furthermore, the hypothesis explored significant differences in attitude levels and the variables related to teachers' attitudes toward ARA. These differences were identified through Chi-square and t-tests, based on the respondents' gain scores.
Table 4 shows the distribution of teachers' attitudes of augmented reality applications (ARA) across five categories like very high, high, moderate, low, and very low, according to their scores. Most male and female educators displayed a high attitude level, with 204 males and 387 females scoring between 61–80, resulting in gain scores of 14,840 and 27,970 respectively, making up 20.33% and 38.32% of the overall gain scores. A lesser number of respondents exhibit a very high attitude (score range 81–100), consisting of 24 males and 66 females, leading to gain scores of 1,975 and 5,437, which account for 2.71% and 7.45%, respectively. Only a small number of educators (9 men and 40 women) are classified in the moderate range (scores 41–60), while no one is noted in the low or very low categories, signifying a generally favourable attitude towards ARA. In total, male and female educators contribute 23.67% and 48.86% to the overall percentage of gain scores, providing a combined total of 72.52%, which emphasizes a largely positive perception of ARA among the participants (Dahri et al., 2024).
The line graph (Figure 16) shows the percentage of gain scores of male and female teachers across five attitudes levels (Very High, High, Moderate, Low, and Very Low) regarding Augmented Reality Applications.
The results of the chi-square test, which explores the consequences of different demographic factors on teachers' attitudes toward the use of Augmented Reality Applications (ARA) in schools, including gender, school location, school category, teacher stream, qualification, and age, are shown in Table 5. However, in this table low and very low categories were excluded from the test since all values are zero. At the classroom level, the chi-square (χ²) test examines gender variations in teachers' attitudes about ARA. With two degrees of freedom, the calculated chi-square value of 6.960 is higher than the critical value at the 5% significance level (5.99) but lower than the critical value at the 1% level (9.21). At the 95% confidence level (p<.05), the matching p-value of 0.0308 indicates statistical significance; however, at the 99% level (p>.01), it does not. According to the results, male teachers are overrepresented in the moderate attitude group and marginally underrepresented in the very high and high attitude categories. In contrast, female teachers show a slightly higher than expected presence in both the very high and moderate categories. Notably, no male or female respondents reported low or very low attitudes toward ARA. These results suggest that gender has a statistically significant, albeit moderate, influence on teachers’ attitudes toward the use of augmented reality in educational settings (Ewais & Troyer, 2019; Suhaimi et al., 2022). On the other hand, the location of school (rural vs. urban) shows no significant difference in attitude levels (χ²=3.185, p=0.2034), suggesting that the geographical context does not significantly influence teachers’ perceptions of ARA (Li et al., 2023; Sánchez-Obando & Duque-Méndez, 2023).
However, the table also presents a chi-square (ꭕ²) test assessing whether teachers’ attitudes toward ARA, differ significantly based on school category (Government vs. Private). The observed frequencies (f₀) and expected frequencies (fe) for attitude levels (Very High to Very Low) have been compared, and the chi-square statistic has been calculated by summing the squared differences between f₀ and fe, divided by fe, for each category. The calculated chi-square value is 8.235 with 2 degrees of freedom. According to the chi-square distribution table, the critical values are 5.991 at the 5% level and 9.210 at the 1% level. Since 8.235 exceeds 5.991 but not 9.210, the result is statistically significant at the 5% level (p=0.0163<0.05) but not at the more stringent 1% level. This indicates that there is a statistically significant difference in teachers’ attitudes toward ARA between Government and Private schools, meaning school category does have an influence on teachers' attitudes (Tzima et al., 2019). The chi-square analysis examines the association between teachers’ academic stream (Science vs. Arts) and their attitudes toward ARA in schools, reveals no statistically significant difference. The computed chi-square value is 1.063 with 2 degrees of freedom and a p-value of 0.5879, which is greater than the 0.05 threshold (p>.05), indicating that the variation in attitudes between Science and Arts stream teachers is not significant. Both groups showed similar distributions across the very high, high, and moderate attitude levels, with no responses falling into the low or very low categories. These results suggest that a teacher's academic background whether in Science or Arts does not significantly influence their attitude toward adopting ARA in the school setting (Mohamad & Husnin, 2023).
The chi-square investigation of the link between teachers' qualifications (TGT vs. PGT) and attitudes toward ARA found no statistically significant association. The computed chi-square value is 0.0031 with 2 degrees of freedom and a p-value of 0.9986, which is significantly greater than the 0.05 significance criterion (p>.05. This implies that Trained Graduate Teachers (TGT) and Postgraduate Teachers (PGT) have virtually equal views regarding ARA, with observed frequencies closely matching expected values across the very high, high, and moderate categories. Neither group expressed low or very low attitudes. As a result, the data suggest that teachers' qualifications have no substantial influence on their attitudes on the use of augmented reality in the classroom (Salleh et al., 2023). Interestingly, at the end of the table a chi-square test shows the relationship between teachers’ age groups and their attitudes toward ARA. The observed and expected frequencies have been compared across three age categories (20–33, 34–47, and 48–60) and three attitude levels (Very High, High, and Moderate), with low and very low categories exclude due to zero values. The calculated chi-square value reveals 9.62 with 4 degrees of freedom. When compare to the chi-square distribution table, this value slightly exceeds the critical value of 9.488 at the 5% significance level but remains below the 1% critical value of 13.277. The associate p-value is 0.047, which is less than 0.05, indicating a statistically significant association at the 5% level. Thus, the alternative hypothesis is accepted, suggesting that teachers’ age has a meaningful influence on their attitudes toward ARA, although the result is not significant at the more rigorous 1% level (Antonioli et al., 2014).
Overall, the findings advocate that gender, category of school, and age are significant factors influencing teachers’ attitudes toward the adoption of augmented reality in educational settings alike (Giasiranis & Sofos, 2016; Habig, 2020), while location, academic stream, and qualification level are not (Radosavljevic et al., 2020; Tzima et al., 2019). However, the total chi-square value of 748.558 with a p-value of 0.00001 (p<.05) confirms that significant differences exist among various demographic groups regarding their attitudes toward the implementation of Augmented Reality in school education.
The graph in the Figure 17 showing both the Chi-Square (ꭕ²) values and corresponding p-values for each variable. A green dashed line at p=0.05 indicating statistical significance.
The t-test results present in Table 6, highlighting the comparison of teachers' attitudes towards Augmented Reality Applications (ARA) across various demographic variables. The aim of this analysis is to determine whether there are statistically significant differences in attitude scores among different groups of educators.
The data presents the attitudes towards ARA between male and female teachers. The mean attitude score for male teachers is 72.90, with a standard deviation (SD1) of 7.01 and a standard error of the mean (SEM1) of 0.46, based on a sample size of 237. The mean attitude score for female teachers is 72.34, with a standard deviation (SD2) of 7.60 and a standard error of the mean of 0.34, based on a larger sample size of 493. The t-value for the difference between the two groups is 0.9524, and the p-value is 0.3412, which is greater than 0.05, indicating that there is no statistically significant difference between the attitudes of male and female teachers towards ARA. The p-value suggests that the observed difference in means (0.56) could be due to random variation, and we fail to accept the alternative hypothesis. Therefore, gender does not seem to have a significant impact on teachers’ attitudes toward the use of augmented reality applications in this sample, although this finding is not consistent with the results reported by Tondeur et al. (2016). Table also shows that the urban teachers have a mean score of 72.54 (SEM1=0.33, N1=531, SD1=7.61), while rural teachers have a mean score of 72.49 (SEM2= 0.49, N2=199, SD2=6.87). The t-test (t=0.0811, p=0.9354, df=728) shows no significant difference (p >0.05), suggesting that location (urban vs. rural) does not significantly affect the outcome (Heintz et al., 2021).
On the other hand, the Government school teachers (M1=72.526, SEM1=0.40, N1=306, SD1=6.95) and private school teachers (M2=72.5259, SEM2=0.38, N2=424, SD2=7.74) have nearly identical mean scores. The t-test (t=0.0004, p=0.9997, df=728) confirms no significant difference (p>0.05), meaning the type of school does not influence the measured variable. Similarly, the Science teachers had a slightly higher mean score (M1=72.79, SEM1=0.41, N1=312, SD1=7.19) compared to arts teachers (M2=72.22, SEM2=0.37, N2=418, SD2=7.58). However, the t-test (t=1.0273, p=0.3046, df=728) indicates no statistically significant difference (p>0.05), suggesting that subject specialization does not play a major role in the outcome. Likewise, the Trained Graduate Teachers (TGT) have a mean score of 72.17 (SEM1=0.71, N1=131, SD1=7.81), while Post Graduate Teachers (PGT) have a mean of 72.60 (SEM2=0.30, N2=609, SD2=7.34). The t-test (t=0.6013, p=0.5478, df=728) shows no significant difference (p>0.05), meaning teaching level (TGT vs. PGT) does not significantly impact the results. Table also shows that the teachers with high experience (41-60 years) have a mean score of 72.72 (SEM1=0.30, N1=92, SD1=7.54), while those with low experience (20-40 years) have a mean of 72.50 (SEM2=0.68, N2=638, SD2=6.48). The t-test (t=0.2979, p=0.7659, df=728) reveals no significant difference (p>0.05), indicating that years of experience do not significantly affect the measured variable (Salleh et al., 2023).
However, the teachers' attitudes about augmented reality applications do not differ statistically significantly across all demographic characteristics (gender, locality, institution type, topic background, teaching position, and experience level) which is similar to the studies of Al-Shahrani (2021), and Bangga-Modesto (2024). This implies that ARA is perceived universally positively or neutrally across varied educator profiles, implying that any future training or implementation of AR-based solutions can be implemented generally and without regard for specific demographic groupings (Mena et al., 2023; Oliveira et al., 2021; Zhu & Chen, 2022).
The bell-shaped normal distribution curve with vertical dashed lines shows in Figure 18, representing the t-values for each variable, each in a different color. This graph is clearly screening how far t-values of each variable's deviates from the mean of the standard normal distribution in which closer to the centre indicates weaker statistical significance.
3.3. Hypothesis3
The results of Hypothesis3 evaluated the significance of teachers' behavior in terms of practices towards augmented reality applications (ARA) in schools. This evaluation included an analysis of the range, frequencies, and percentages of respondents based on their gain scores. Additionally, the hypothesis investigated significant differences in behavior levels and the factors associated with teachers' behavior toward ARA. These differences were determined using Chi-square and t-tests, derived from the respondents' gain scores.
Table 7 illustrates the levels of practice reflects in the behavior of teachers both male and female towards Augmented Reality Applications (ARA), categorized by score ranges corresponding to five behavioral levels: Very High, High, Moderate, Low, and Very Low. Each level is defined by a specific range of scores: very high (81–100), high (61–80), moderate (41–60), low (21–40), and very low (<20). The table lists the number of male and female teachers within each category, along with their respective gain scores and percentages of total gain scores.
In the very high behavior category, 22 male and 86 female teachers are recorded, contributing gain scores of 1,849 and 7,265 respectively. This corresponds to 2.533% for males and 9.950% for females, totalling 12.483% of the overall gain score. The high category have the largest number of participants, with 183 males and 322 females, contributing the highest gain scores: 13,341 and 23,162, making up 18.275% and 31.728% respectively, totalling a significant 50.003%. This indicates that a majority of teachers, especially females, exhibit high-level behavioral engagement with ARA. In the Moderate behavior range, 32 male and 75 female teachers account for gain scores of 1,651 and 4,128, which represent 2.260% and 5.655% respectively, totalling 7.915%. The low behavior level has no male participants, and only 10 females with a collective gain score of 375, representing just 0.514%. Notably, no teacher either male or female fell into the very low behavior category, indicating a baseline level of positive engagement with ARA across the board.
Overall, the total percentage of gain scores across all behavior levels is 70.915%, with females contributing a higher share (47.847%) compare to males (23.068%). This suggests that female teachers, in general, show more active and positive behavioral engagement with ARA than their male counterparts (Aboudahr et al., 2023). The data highlights a strong inclination toward higher levels of behavioral adoption of ARA, especially among female educators, and provides valuable insight into gender-based engagement trends in educational technology practices (Nizar et al., 2020; Peikos & Sofianidis, 2024).
The line graph (Figure 19) shows the percentage of gain scores of male and female teachers across five behavioral levels (Very High, High, Moderate, Low, and Very Low) regarding Augmented Reality Applications.
This Table 8 contains a detailed analysis of teachers' behavioural practice of using Augmented Reality Applications (ARA) by means of the Chi-square test (using multiple demographic and institutional variables: gender, school location, educational categories, teachers’ streams, education qualification, age). The variable very low has been excluded from the statistical analysis due to its zero frequency across all subgroups, which would result in computational distortion in the Chi-square test.
The table presents the associations between gender and teachers’ behavioural levels in relation to ARA. The observed frequencies (fo) are compared with the predicted frequencies (fe) for each level of behaviour: very high, high, moderate and low. Male teachers have significantly lower counts of students with a very high behavioural level (22) than are predicted (37. 57%), and high-frequency behaviour (183) is reported more frequently than the predicted (163. 97%) and low-frequency behavior has been reported rarely (with an expected count of 3.25%). These differences contribute to the Chi-square statistic for males and individual components such as 4.87 (for very high) and 3.25 (for low) indicate their substantial deviation. However, results from females are similar and more participants than expected report very high behaviour (386 vs. 72.93), and slightly fewer participants than expected engage in the high category (322 vs. 341.03). The cumulative Chi-square value is 15.63, calculated with 3 degrees of freedom. This is significantly higher than the critical values at the 0.05 level (7.015) and the 0.01 level (11.334). The corresponding p-value of 0.00135 confirms that the result is statistically significant (Ghobadi et al., 2023). Similarly, the table also provides information on the association between school location (rural vs. urban) and teacher behavioural levels in relation to the use of ARA. Total Chi-square value is 11.03 with 3 degrees of freedom; The p-value of 0.0116 is statistically significant at the 0.05 level (critical value=7.815), but slightly below the statistical significance threshold at the 0.01 level (critical value=11.345). This advocates that there is a significant association between school location and teacher behavioural levels in relation to the use of ARA and that rural and urban teachers have significantly different approaches and behavioural practices with respect to augmented reality in classrooms (Suhaimi et al., 2022).
In another case, the table also shows chi-square (χ²) value i.e. 12.94, which is compared against the critical values of chi-square at different significance levels for 3 degrees of freedom (df=3). At the 0.05 level, the critical value is 7.815, and at the 0.01 level, it is 11.345. Since 12.94>7.815, the result is statistically significant at the 0.05 level, indicating that there is a significant association between the categories of school (government or private) and teachers’ behavioural levels on ARA. This means that teachers’ behavioural responses towards ARA significantly differ between government and private schools. However, because 12.94 is only slightly higher than 11.345, the result is borderline significant at the 0.01 level suggesting a stronger association but not one that meets the stricter criterion of p<0.01. The p-value of 0.0048 confirms this significance, as it is less than 0.05, reinforcing that the observed differences are unlikely to have occurred by chance alone (Lampropoulos et al., 2022). In case of stream of teachers, the calculated chi-square (χ²) value is 26.03 with 3 degrees of freedom, which is significantly higher than the critical values at both the 0.05 level (7.815) and the 0.01 level (11.345). This indicates a highly significant association between the stream of teachers (Science vs. Arts) and their behavioural levels regarding ARA. The very low p-value of 0.0001 further confirms that the differences observed are statistically significant and not due to chance. Therefore, teachers’ behavioural responses towards ARA differ markedly between the Science and Arts streams (Nizar et al., 2020).
On the basis of teachers’ qualifications, the calculated chi-square (χ²) value is 9.54 with 3 degrees of freedom, which is greater than the critical value at the 0.05 level (7.815) but less than that at the 0.01 level (11.345). This indicates a statistically significant association between teachers’ qualifications (TGT vs. PGT) and their behavioural levels towards ARA at the 5% level of significance. The p-value of 0.023, being less than 0.05, confirms that the observed differences are unlikely due to chance (Peikos & Sofianidis, 2024). However, the result is not significant at the stricter 1% level (p>.01), suggesting a moderate level of association between qualification and behavioural response to ARA (Sáez-López et al., 2020). In this context, several possibilities could be considered, such as differences in learning styles, comfort and interest in using technology, level of technological understanding, or teachers’ prior experience in similar areas. Similarly, the calculated chi-square (χ²) value for teachers' age is 15.32 with 6 degrees of freedom, exceeding the critical value at the 0.05 level (12.592) but significantly below the critical value at the 0.01 level (16.812). This shows a statistically significant relationship between age groups and teachers' attitudes about ARA at the 0.05 level (Alalwan et al., 2020), but not at the severer 0.01 level (Sulisworo et al., 2021). The p-value of 0.018 confirms this significance, indicating that there are significant differences in behavioral reactions to ARA across age groups, though the significance of the relationship is mild. Factors such as age-related differences in teachers' interest in adopting technology, along with concerns or fears related to digital fraud, could also contribute to this variation.
The overall chi-square analysis in the table (χ²=800.47, df=3, p<0.00001) with the p-value being practically zero (≈2.2×10⁻¹⁷³) reveals an overwhelmingly significant departure from a uniform distribution of teachers’ behavioural levels, far exceeding the critical thresholds at both the 0.05 (7.815) and 0.01 (11.345) significance levels. When combined across all demographic factors like gender, school location, school type, academic stream, qualification, and age, the uniformly large chi-square value underscores that these characteristics exert a powerful influence on how teachers adopt and engage with augmented-reality applications in educational settings (Alalwan et al., 2020; Ghobadi et al., 2023; Nizar et al., 2020; Peikos & Sofianidis, 2024; Sáez-López et al., 2020; Suhaimi et al., 2022; Sulisworo et al., 2021).
The bar and line graph of Figure 20 is showing the comparison of Chi-square and p-values for six variables. Stream of school shows the strongest association (χ²=26.03, p=0.0001), indicating high statistical significance. All p-values are below 0.05, suggesting significant relationships between each variable and the outcome being analyzed.
The well-structured explanation of the data presented in Table 9 regarding the significant differences in the behaviors of teachers toward Augmented Reality Applications (ARA), using independent-sample t-tests to compare across various demographic groups:
The table shows behavioral scores of male and female teachers regarding the use of ARA, are compared using an independent-sample t-test. The mean score of male teachers is 71.06, while female teachers score slightly lower with a mean of 70.85. The calculated t-value is 0.2503, which is significantly lower than the critical values at both 0.05 and 0.01 significance levels (1.96 and 2.58 respectively), with 728 degrees of freedom. Additionally, the p-value of 0.8024 is much greater than 0.05, indicating that the difference is statistically non-significant. This suggests that gender does not have a significant impact on teachers’ behavior toward AR applications (Mercader & Duran-Bellonch, 2021). In terms of residential background, rural teachers shows a higher mean behavioral score (72.49) compare to urban teachers (70.33). The calculated t-value in this comparison is 2.4879, which exceeds the critical value at the 0.05 level (1.96) but falls slightly below the threshold at the 0.01 level (2.58) which is similar to the study of Dutta et al. (2022). With 728 degrees of freedom, the p-value is 0.0131, which is less than 0.05. This indicates a statistically significant difference at the 5% level, suggesting that rural teachers exhibit more favourable behaviors toward the adoption of AR applications than urban teachers (Asokan & Ponnusamy, 2023). So far the type of school are concerned, the government and private school teachers reveal a negligible difference in behavior toward ARA, with mean scores of 71.27 and 70.67 respectively. The t-value is calculated at 0.7721, which is much lower than the critical values at both 0.05 and 0.01 levels. The p-value is 0.4403, which is considerably greater than 0.05, thereby indicating that the observe difference is not statistically significant. Hence, the type of school affiliation does not appear to influence teachers’ behavioral responses to AR (Asiri & El-aasar, 2022). Similarly, the teachers with academic backgrounds in Science and Arts shows almost identical behavior toward AR applications, with mean scores of 70.90 and 70.93 respectively. The t-value is extremely low at 0.0413, and the p-value is 0.9670—well above the standard significance thresholds. These results strongly suggest no significant difference between Science and Arts teachers in terms of their behavioral engagement with AR, reflecting a uniform attitude across disciplines (Meccawy, 2023). Correspondingly, behavioral responses based on teaching designations (TGTs and PGTs) also reveal minimal differences. TGTs have a mean score of 70.63, whereas PGTs score 70.98. The t-value of 0.3348 is much lower than the critical values, and the p-value of 0.7378 far exceeds 0.05. Thus, no significant difference is observed between TGTs and PGTs, indicating that teachers' designation levels do not substantially affect their behavioral orientation toward AR usage (Anju & Thiyagu, 2023). The final comparison examine the role of teaching experience. Teachers with higher experience (41–60 years) have a mean score of 68.95, slightly lower than those with less experience (20–40 years), who score 71.20. The t-value of 1.9389 is just below the critical value at the 0.05 level (1.96), and the p-value of 0.0529 is just above 0.05. This places the result in a marginal or borderline non-significant zone. Although not statistically significant, the finding does suggest a possible trend where less experienced teachers may be somewhat more open or favourable toward AR applications, possibly due to higher digital exposure or training (da Silva et al., 2019).
However, only the statistically significant difference observed in this study and was based on residential background, with rural teachers showing more positive behavior toward ARA use than urban teachers (Liao et al., 2024; Wang et al., 2024). All other variables; gender, school type, academic background, designation, and experience does not show significant differences, although teaching experience approaches significance. These findings suggest that while demographic factors may play some role, particularly geographical location, most teachers across groups share similar behavioral tendencies toward adopting AR in education (Berson et al., 2018; Buchner et al., 2022; Dickmann et al., 2019; Ratmaningsih et al., 2024).
The graph in the Figure 21 showing bell-shaped curve in which vertical dashed lines representing the t-values for each variable in different colours. This visualization clearly representing how extreme each t-value is, indicating the strength of statistical evidence.
3.4. Hypothesis4
The results of Hypothesis4 evaluated the significant level of relationship among the teachers' in terms of practices attitudes and behaviour on augmented reality applications (ARA). This evaluation included an analysis of the correlation of respondents based on their gain scores.
Table 10 presents the results of multiple correlation analysis among teachers’ perception, attitudes, and behaviors regarding the use of ARA. The findings reveal significant positive correlations between all three domains. Specifically, teachers’ perception of ARA is moderately correlated with their attitudes (r=0.34, p<.001) and shows a weaker but still significant correlation with their behaviors (r=0.21, p<.001). The strongest relationship observed is between teachers’ attitudes and their behaviors (r=0.63, p<.001), suggesting that more favourable attitudes are closely linked to higher engagement or positive behavioral responses toward ARA. These results imply that attitudes may serve as a key mediator between perception and behavior (Nikou et al., 2024b; Şakir, 2025). The overall coefficient of multiple correlation (R) is 0.39, indicating a moderate combined effect of perception and attitudes in predicting teachers' behavioral tendencies towards using AR. This suggests that while both perception and attitude are important, additional factors may also influence behavior, warranting further exploration (Castaño-Calle et al., 2022; Khukalenko et al., 2022; Mota et al., 2018).
In the Figure 22, line graph showing the correlations between teachers' perception, attitudes, and behaviour on ARA. Each line represents how one domain correlates with the others. The strongest correlation is between attitudes and behaviour (r=0.63), indicating a strong relationship between what teachers feel and how they act.
Table 11 presents the results of independent samples t-tests conducted to assess whether there are significant differences between the three core variables—perception, attitudes, and behaviour of teachers towards augmented reality applications (ARA). These comparisons offer insights into how distinct or aligned these psychological constructs are in the context of educational technology adoption.
The comparison between perception and attitudes of teachers towards ARA reveals a substantial and statistically significant difference. The mean score for perception is 51.96 (SD=12.82, SEM=0.47), while for attitudes, the mean is much higher at 72.53 (SD=7.41, SEM=0.27). The calculated t-value is 44.6612, which is far greater than the critical values at both the 0.05 and 0.01 significance levels (1.96 and 2.58 respectively). The associated p-value is <0.0001, indicating a highly significant difference between perception and attitudes. This implies that while teachers may be aware of or perceive AR in a certain way, their attitudes toward its actual implementation are far more positive and favourable. The comparison between teachers' perception and their actual behaviour regarding ARA use also shows a statistically significant difference. The mean for perception remains at 51.96 (SD=12.82, SEM=0.47), while the mean for behaviour is significantly higher at 70.92 (SD=10.46, SEM=0.39). The calculated t-value is 34.6312, which again surpasses the critical thresholds of significance, and the p-value is <0.0001. This suggests that although teachers may have moderate perceptions of AR, their actual behaviors or engagement with AR tools are considerably more active or positive, possibly due to institutional support, peer influence, or personal interest once the technology is experienced which is similar to the study of Abed (2021). The final comparison—between attitudes and behaviour reveals a moderate yet significant difference. Attitudes (M=72.53, SD=7.41, SEM=0.27) are slightly higher than behaviour (M=70.92, SD=10.46, SEM=0.39), with a t-value of 5.2867 and a p-value <0.0001. Though this difference is statistically significant, it is less pronounced compared to the previous two comparisons. This result indicates a closer alignment between what teachers feel about ARA and how they actually use it, suggesting that attitudes are a stronger predictor of behavior in this context (Asokan & Ponnusamy, 2023; Dirin et al., 2019).
Overall, the findings from Table 11 highlight significant gaps between teachers’ perceptions, attitudes, and behaviors toward ARA. The most notable gap exists between perception and both attitudes and behavior, suggesting that initial understanding or awareness of AR might be limited or cautious. However, once attitudes are formed possibly through exposure or training they tend to translate more directly into behavior. These results underscore the importance of improving awareness and training programs that can positively shift perception and, in turn, support favourable attitudes and active usage of AR tools in educational settings (Anju & Thiyagu, 2023; da Silva et al., 2019).
The bell curve of Figure 23 shows t-values for teacher comparisons on ARA. High t-values 44.66 (Perception and Attitudes), 34.63 (Perception and Behaviour), and 5.29 (Attitudes and Behaviour) indicate statistically significant differences. All lie far in the tails, showing strong evidence of differences in perceptions, attitudes, and behaviours regarding ARA.
Table 12 presents the results of a one-way ANOVA conducted to examine whether there are statistically significant differences among teachers’ perception, attitudes, and behaviour regarding ARA. The analysis compare the means of these three domains across 2,190 observations. The F-value computed is 871.5964, which is far greater than the critical F-value at both the 0.05 and 0.01 significance levels for degrees of freedom (df) between groups=2 and within groups=2187. The given F(2, 2187)=871.60, p<0.001 (p=0.000) associated values, indicating an extremely low probability of obtaining such a result by chance, and effectively confirming that the differences among the group means are highly statistically significant. Since the p-value is less than the conventional alpha level of 0.05, the null hypothesis (H₀), which posits that there is no difference in the means of the three variables, is rejected. This implies that at least one of the variables perception, attitude, or behaviour differs significantly from the others in terms of mean score. Moreover, the very small p-value strongly supports the alternative hypothesis (H₁), suggesting that the observed differences are not due to random variation (Suhaimi et al., 2022; Tzima et al., 2019). The F-value of 871.6 lies far outside the acceptance region (which ranges from 0 to approximately 2.9998 at 95% confidence), further reinforcing the statistical significance of the result. However, this test provides robust evidence that teachers’ perceptions, attitudes, and behaviours regarding ARA are significantly different from one another, highlighting the need to address these domains independently in training or implementation strategies (Abed, 2021; Ewais & Troyer, 2019; Faqih & Jaradat, 2021; Habig, 2020; Ibáñez et al., 2020; Lampropoulos et al., 2022; Meng et al., 2024; Uygur et al., 2018; Ventrella & Cotnam-Kappel, 2024).
This graph (Figure 24) illustrates the results of ANOVA for teachers’ perceptions, attitudes, and behaviours on ARA. The Between Groups variation (SS=191,036) is substantial compared to Within Groups (SS=239,673), resulting in a highly significant F-value (871.60, p<0.001), indicating strong group differences.
3.5. Hypothesis5 and Research Questions
Qualitative Analysis of Research Questions
To gain insights into the research questions, various open-ended questions were posed to teachers through semi-structured interviews. The primary emphasis was placed on four key questions that aligned with the core objectives of the study. Both in-person and online interview methods were employed to ensure wider participation, covering all 28 states and 8 Union Territories of India, with a minimum of three participants from each region. A total of 88 teachers participated in the interviews, consisting of 31 males and 57 females. The participants were selected based on their willingness to contribute and represented diverse academic streams, geographic locations, and types of schools. While some interviews were conducted face-to-face, others were facilitated online through invitations sent via email. Each interview, whether conducted in person or virtually, lasted between 20 to 30 minutes. The responses were analyzed using a qualitative research method known as thematic analysis, which helped in identifying and interpreting key themes across the data (Turhan et al., 2022). A detailed profile of the interview participants is provided in Table 13.
Table 13 (RQ1) clearly reflects the basic factors and suitable strategies for using Augmented Reality (AR) applications in the classroom. The interview data reveal that Indian school teachers’ perceptions, attitudes, and behaviors toward AR integration are significantly shaped by limited knowledge, lack of interest, and low motivation (Marrahi-Gomez & Belda-Medina, 2022). This is especially evident among educators in rural areas, who often express uncertainty about the practical application of AR despite having encountered related content online (Asokan & Ponnusamy, 2023). Some teachers admitted facing barriers to AR adoption, primarily due to the absence of support and encouragement from school administrators and colleagues (Theodorio et al., 2024). Nonetheless, several participants indicated that while implementing AR in regular classroom settings is challenging, it is achievable when teachers are self-motivated and resourceful. Effective strategies included the use of personal smartphones, dividing students into small groups, and implementing group-based AR activities to navigate infrastructural and technological constraints. These findings underscore the urgent need for structured professional development and institutional backing, particularly in underserved regions (Mena et al., 2023; Rawat, 2025). Passionate and tech-savvy teachers often employed flexible approaches such as Bring Your Own Device (BYOD) or Use Your Own Gadget (UYOG) to facilitate AR use. In areas with poor internet connectivity, some teachers pre-downloaded AR content in advance to ensure uninterrupted classroom use. The data highlight the critical role of intrinsic motivation in successful AR integration. Even without formal training, a basic understanding of AR tools, coupled with personal interest and adaptability, enabled teachers to incorporate AR effectively. Moreover, many educators emphasized the importance of parental awareness and involvement in reinforcing AR-based learning at home. They recommended proper Parent-Teacher Meetings (PTMs) as opportunities to demonstrate AR tools and foster parental support (Nitza & Roman, 2017).
Table 13 (RQ2) presents the various challenges and limitations experienced by teachers while using AR applications in educational settings. The data clearly reveals that numerous barriers hinder the effective integration of AR in classrooms, significantly influencing teachers’ perceptions, attitudes, and behaviors toward its adoption like the study conducted by Alkhattabi (2017). One of the primary challenges is the lack of infrastructure in schools. Many institutions do not have the required devices or technological resources to support AR applications. The unavailability of essential hardware, projection tools, sound systems, and other equipment prevents teachers from even considering the use of ICT-based tools. Additionally, software and hardware malfunctions, network connectivity problems, and power shortages further disrupt the learning process. In several instances, even interested teachers become demotivated due to unstable internet connections and unreliable power supply. Some teachers resort to using their personal mobile data to keep the technology functioning during class, which is neither sustainable nor encouraged. The high cost of AR implementation is another major constraint. Most schools lack funding and administrative support to bear the expenses of infrastructure development and technological tools. The cost of creating customized AR content is particularly high, and due to a lack of in-house expertise, aligning content with the curriculum becomes a significant challenge. Resource scarcity, competing academic priorities, and budgetary constraints contribute to the limited adoption of AR in classrooms. Teacher readiness and demographic disparities also influence AR adoption. The data suggests that younger teachers tend to be more tech-savvy and open to using AR-based teaching methods (Gajbhiye, 2024). However, many older and more experienced teachers struggle to update their skills alike (Thakur & Sulaiman, 2024; Theodorio et al., 2024) and show little interest in learning new technologies like the studies of Köroğlu (2025), and Ateş and Garzón (2023). Several educators avoid training programs and self-study, resulting in a persistent technology gap, some even express fear or discomfort in using basic devices like smartphones, highlighting a lack of confidence in integrating technology into their teaching practices (Iqbal & Bhatti, 2020). Administrative support is often lacking, leaving teachers without the necessary encouragement or training opportunities. In many schools, a traditional mindset prevails where educators prefer conventional teaching methods and resist innovation. Furthermore, classroom arrangements often do not support the use of AR tools effectively, creating practical difficulties in lesson execution. Additional concerns raised by participants include data privacy, health and safety risks, technological dependence, and the potential for social isolation (Alagood et al., 2023). Teachers worry that students may become overly reliant on technology, leading to reduced interest in reading books and writing answers. Excessive screen time may also contribute to distractions, binge-watching habits, and a decline in academic performance (Chakraborty & Thakur, 2024; Raza et al., 2021). The integration of diverse learners within a single AR-based lesson is another significant challenge, often requiring advanced customization and support that is currently unavailable in most schools. However, while some teachers demonstrate enthusiasm and potential for using AR in education, the lack of infrastructure, high costs, skill gaps, administrative indifference, and socio-psychological concerns act as significant barriers to the widespread adoption of AR in Indian classrooms (Chavez-Perez & Iparraguirre-Villanueva, 2025; Gasteiger et al., 2022).
Table 13 (RQ3) presents a variety of suggestions and expectations shared by participants regarding the integration of AR in classroom settings. A common theme that emerges is the necessity for adequate institutional resources, such as supportive devices and up-to-date software, to enable the effective implementation of AR regardless of geographical location. Participants emphasize the importance of administrative support, consistent availability of resources, and regular training opportunities to encourage and sustain positive teacher behavior towards AR. Many believe that teachers must receive continuous training to stay updated and proficient in using AR tools in real classroom scenarios. Some participants suggest that institutions can utilize school funds to purchase tablets or mobile devices, which can be rotated among students to deliver interactive lessons. Others highlight the need to improve technological infrastructure in rural schools, advocating for more affordable devices, reliable internet connectivity, and structured training programs. Administrators are encouraged to support educators by organizing focused training on AR application and implementation. Participants also point out that with proper planning and institutional backing, AR can significantly enrich teaching and learning experiences. There is a call to enhance digital involvement among educators and to foster peer influence and student engagement, ensuring that AR remains interactive and meaningful for learners across all age groups. Additionally, awareness programs addressing health concerns, data security, and privacy are recommended for both teachers and students to promote responsible and secure technology usage. This includes ensuring adherence to ethical standards while addressing potential risks such as technology addiction and misinformation. Several participants underscore the need to raise awareness about the appropriate use of AR in classrooms and believe schools should actively encourage its adoption. Furthermore, there is a strong consensus that AR and technology-based programs should be embedded into the curriculum as vital components of contemporary education (Thanya, 2025). A few contributors argue that AR applications should not only be part of the curriculum but also allow for customization, enabling educators to tailor AR content to meet specific instructional objectives. Overall, participants express a shared vision that through institutional commitment, strategic planning, and educator empowerment, AR has the potential to become a transformative educational tool that enhances curriculum delivery and fosters more engaging and effective learning environments (Liu et al., 2023; Radu et al., 2022).
Table 13 (RQ4) highlights subject-wise major issues in using AR, revealing that teachers hold mixed views on its integration into the teaching-learning process. While some educators across disciplines like Mathematics, Science, Social Science, and Language report successful implementation of AR without significant challenges, others teaching the same subjects face notable difficulties, especially when dealing with practical or application-based topics. In Mathematics, for instance, several teachers note that AR is helpful for visualizing geometric shapes and facilitating interactive problem-solving, though aligning AR content precisely with specific curriculum concepts remains a common challenge. In Science, some participants express concerns about the accuracy of virtual models and simulations, particularly in conducting virtual experiments or illustrating scientific processes. Biology teachers, however, mention using technology occasionally and report no major difficulties in classroom implementation. In Language teaching, a few educators identify difficulties in sourcing effective AR content that supports literacy development, such as immersive storytelling and vocabulary enhancement. Social Science teachers raise concerns regarding the accuracy of historical content and the need for cultural sensitivity, especially when using AR for virtual tours or reenactments of historical events. Music teachers, on the other hand, acknowledge that AR is particularly useful when addressing theoretical aspects, such as historical background or conceptual discussions, especially in the absence of physical instruments. In such cases, AR serves as an effective tool to bridge gaps and convey abstract ideas more vividly. Overall, the subject-wise application of AR presents varying experiences, influenced by both content-specific requirements and available resources (Gusteti et al., 2025).
The qualitative findings in Table 13 clearly focused on a multifaceted view of AR integration in Indian classrooms, especially through the lens of teacher perceptions, attitude and behaviour. The first and second research questions (RQ1, RQ2) were not only reflecting rural and semi-urban teachers' significant engagement with AR, rather it was also showing how it was influenced by their limited awareness, low motivation, institutional readiness, insufficient institutional support along with infrastructural inadequacies, high implementation costs, lack of technical training, and institutional inertia. These systemic barriers were enough to prove teachers gap in professional development comparable to the studies (Oke & Arowoiya, 2021; Thangavel et al., 2025; Theodorio et al., 2024) therefore, unless teachers are encouraged to develop their foundational knowledge and practical exposure to AR, its adoption will remain shallow and unreliable. Equally, these broader challenges in EdTech integration in developing regions need to reinforce about policy-level interventions and sustainable investment in digital infrastructure (Huang et al., 2016; Jamrus & Razali, 2021; Manna, 2023). Interestingly, despite these all gaps, some teachers validated resilience and innovation by employing adaptive strategies such as the Bring Your Own Device (BYOD), Use Your Own Gadget (UYOG) approaches and group-based collaborative activities. These self-motivated practices pointed out to the potential of grassroots-level agency in overcoming technological and monetary barricades, although their scalability remains limited without proper institutional support and sustained funding (Aggarwal, 2018; Holzmann & Gregori, 2023). The data related to RQ3 not only highlighted the growing consensus on the need for administrative support, funding, teacher training programs, parental involvement, and curricular integration for effective AR implementation, but also emphasized how collaboration among stakeholders such as school leaders, families, and policymakers can foster the development of a holistic and supportive educational ecosystem (Schina et al., 2025). However, discipline-specific disparities in the use of AR were evident in the data corresponding to RQ4. Subjects like Science and Geography reflected more positive perceptions, attitudes, and behaviors toward AR, likely due to their inherently visual and spatial nature. In contrast, other disciplines faced significant challenges, such as the lack of culturally relevant content, model inaccuracies, and poor alignment with learning outcomes, which have limited AR's overall effectiveness. To address these issues, there is a need for the development of context-sensitive content and increased research in cross-disciplinary areas to optimize AR tools for diverse subjects and varied learner needs (Basumatary & Maity, 2024; De-Lima et al., 2022; Marrahi-Gomez & Belda-Medina, 2022).
3.6. Major Findings
- Majority of the teachers showed moderate to high perception levels toward ARA in which females revealed higher gain scores than males, indicating significant gender differences. Similarly significant perception differences were also observed by school category, stream, designation and qualification, while age, location, and experience showed no effect.
- Maximum number of teachers exhibited high to very high attitudes toward ARA, with females scoring significantly higher, reflecting gender-based differences. Attitudes also varied significantly by school category, and age, favoring females and private schools. However, no significant differences were found across stream, qualification, designation, or experience, indicating overall uniformity.
- Highest number of teachers demonstrated moderate to high behavior levels towards ARA, with females showing higher engagement. Behavior significantly varied by gender, school location, category, stream, qualification, and age, highlighting their influence on AR adoption. However, only school location showed significant mean score differences; other factors showed no significant impact.
- Significant positive correlations exist among teachers’ perception, attitudes, and behaviour on ARA, indicating interconnectedness. Additionally, distinct mean differences were found across these domains, reflecting varied levels of perception, attitude, and behaviour. Overall, a highly significant difference highlights meaningful variation in how teachers engage with ARA across these areas.
- Qualitative findings reveal that AR integration in Indian classrooms faces barriers like limited awareness, low motivation, poor infrastructure, and lack of training. Despite this, teachers show resilience through adaptive strategies. Effective AR use requires administrative support, funding, training, collaboration, and development of discipline-specific, culturally relevant content.
4. Discussion
In the preliminary calculation the data revealed (Tables 1, 2, 4, 5, 7 and 13 RQ1,2,3) that across the different level, the female teachers’ perception, attitude and behaviour were higher compare to the male (Köroğlu, 2025; Putiorn et al., 2018; Şakir, 2025). This trend was reflecting through quantitative as well as qualitative insight by indicating that the female teachers were not only more interested rather they were too curios to accept the integration of technology in the form of AR and this is similar to other researches such as Asokan and Ponnusamy (2023), Cabero-Almenara et al. (2019a), and, Dirin et al. (2019). Though few studies revealed greater openness, sincerity, seriousness and adaptability among male teachers towards adopting AR tools (Tripathy & Panda, 2021; Wyss et al., 2022). Surprising study also found (Tables 3, 6 and 9) no knowledge gap and no diverse perception, attitudes and behaviour level among both male and female teachers regarding the use of AR and technology due to the imbalanced distribution of scores in the groups e.g., more males in low perception and close mean scores (Asiri & El-aasar, 2022; Dembe, 2024; Mercader & Duran-Bellonch, 2021). Since the male teachers were showing and reflecting lower engagement compare to female teachers of using AR, and this gap about perception, attitude and behavior level truly guiding us to apply gender-sensitive intervention strategies focusing on enhancing male teachers’ engagement with incipient technologies (Gomez-Trigueros & Aldecoa, 2021; Meenakshi & Indu, 2025; Nikou et al., 2024a).
However, this highly favourable or extremely skeptical positions of teachers strongly recommending personalized capacity-building initiatives and supportive infrastructure more positive engagement for male and female both the teachers (Abed, 2021; Tripathy & Panda, 2021).
So far the government and private schools are concerned, the teachers who were from private schools showed higher perception, attitude and behaviour levels, especially in the high and moderate ranges, compared to their government counterparts (Tables 2, 5, 8 and 13 RQ3). On the other hand, study (Tables 3, 6 and 9) found nearly identical perceptions and attitudes between government and private teachers as the categories were diverse, the average perception levels showed minimal variation (Akinradewo et al., 2025; Tzima et al., 2019). In this connection qualitative insight declared the reasons like better infrastructure, access to digital tools, professional development opportunities, and greater autonomy in private institutions. Therefore, there must have more investment and awareness programs in government schools to enhance AR adoption (Liao et al., 2024; Mohamad & Husnin, 2023; Wyss et al., 2022). Meanwhile study also revealed (Tables 2, 8 and 13RQ4) that who were science teacher, they demonstrated positive perceptions and stronger behaviour toward ARA in contract to the arts teachers (Cabero-Almenara et al., 2019b). Oddly the study found (Tables 3, 5, 6 and 9) no gap based on academic stream due to similar mean regarding the perception and attitudes of Science/Arts teachers in different categorical levels (Almaleki, 2022; Dembe, 2024; Grinshkun et al., 2021; Meccawy, 2023). Though the study clearly found that because of naturally aligns of AR with visual and spatial content used in science education and limited AR content aligned with humanities topics. Therefore, it is very much needed to promote AR content in non-science subjects by developing AR tools with cross-disciplinary relevance and ensure cultural and pedagogical alignment (Alkhabra et al., 2023; Alqahtani, 2023; Chen, 2022; Thanya, 2025). Perception and behavior level also influenced by qualification of the teachers in which TGTs revealed their higher usage and openness toward AR whereas PGTs showed low level on perception and behaviour (Tables 2, 3, 8 and 13 RQ2,4) similar with the studies of Alalwan et al. (2020), and da Silva et al. (2019) but this present study also found uniformity among the science and arts teachers regarding attitudes and behaviour Tables 5, 6 and 9 (Salleh et al., 2023). However, this perception and behaviour level was undoubtedly portraying the skills and training gap in digital pedagogy along with the lesser exposure at higher qualification levels (Lampropoulos et al., 2022; Meenakshi & Indu, 2025; Thangavel et al., 2025; Uygur et al., 2018). Teachers in both rural and urban settings along with all age groups (Tables 2, 3, 6 and 13RQ1) revealed similar levels of perception and attitudes toward AR (Li et al., 2023; Sánchez-Obando & Duque-Méndez, 2023). Though the urban and young teachers’ behaviour was too higher (Al-Shahrani & Asiri, 2023a) whereas perception and attitudes had slightly higher frequencies in the high category (Basumatary & Maity, 2024), and rural and older teachers were less adaptable about the acceptance of educational technology, Tables 5, 8, 9 and 13RQ2 (Alamäki & Suomala, 2021; Liao et al., 2024; Miller & Liu, 2023). Since less experienced teachers revealed slightly greater behaviour to apply AR due to being more open to and trained in newer technologies and it was similar to the studies (Chang et al., 2022; Romano & Aedo, 2020). These advocates that geographical location and age to be a determining factor about the use of AR. Though the combined result revealed highly significant, indicating demographic factors especially gender, school type, academic stream, and qualification which play a key role in shaping teachers' perceptions, attitudes and behaviour regarding AR applications through integration (Bhattacharya et al., 2025; Dirin et al., 2019; Mercader & Duran-Bellonch, 2021; Rahmiati et al., 2025). On the other hand, meaningful insights into the significant relationships among teachers’ perceptions, attitudes, and behaviors regarding AR were also revealed, Table 10 (Martín-Gutiérrez et al., 2015; Robles, 2017). In this context, teachers’ understanding of AR was found to have a moderately positive influence on their attitude but only a weak positive relationship with their behavior. Attitude emerged as a key mediator between perception and behavior, suggesting that a positive mindset alone was insufficient for implementing AR, Table 11 (Eutsler & Long, 2021; Holly et al., 2021; Linus et al., 2025). Additionally, despite favourable attitudes, a lack of deep perception and lagging behavior highlighted that the differences between the domains (perception, attitude, behavior) were more significant than the variations within each domain (Tables 12 and 13RQ3). Furthermore, external barriers such as technological limitations, policy gaps, poor infrastructure, lack of training, absence of peer support, and inadequate administrative encouragement contributed to the relatively low-to-moderate multiple correlation coefficient, which may have dampened behavioral outcomes (Aguayo et al., 2017; Albishri & Blackmore, 2025; De-Lima et al., 2022; Radosavljevic et al., 2020; Ratmaningsih et al., 2024; Sırakaya & Sırakaya, 2022). Therefore, raising awareness about AR through comprehensive strategies could foster more positive impacts on both attitude and behavior.
5. Conclusion
Undoubtedly, we have become increasingly technology-centric in today's world, and there is no scope to deny this reality. Therefore, it is almost impossible to think of anything excluding technology. In the present age, if students at the foundational level fail to develop a clear understanding of subject concepts, they will not only lose interest in studying but also lose respect for the learning process itself. Since all of us are connected to technology in some way, if we do not incorporate technology-based approaches to teach different subject concepts to our students or children, they will miss out on the joy of learning. On the other hand, using technology we will not only foster greater interest and curiosity among them, rather it will enhance both their engagement and academic motivation. From our study, it is clearly evident that across the country, it is not just a lack of knowledge but also a lack of interest among teachers that hinders the use of technology in education. Therefore, to enhance teachers’ interest in using technology, it is essential first to raise their awareness. This awareness will gradually improve their perception levels, which in turn will strengthen their attitudes and positively influence their behavior. Ultimately, this will help foster a mindset among teachers that is more open and willing to integrate technology into teaching. However, to achieve this, proper training, institutional initiatives, motivation, and government support are crucial. Our study makes a valuable contribution in this area and provides insights that can inform implementation strategies and further research efforts. Additionally, investigating the perspectives of both teachers and students, as well as the availability and usage of resources, will be beneficial. These elements are interdependent and can significantly shape the success of technology implementation. By enhancing our understanding of these issues, we can better support schools, educators, policymakers, and educational technology developers. This will help promote the use of Augmented Reality (AR) and other digital media tools for educational entertainment, thereby contributing significantly to the broader goal of digitalizing education through edutainment. Still, more research focusing on teachers’ perspectives is essential. Future studies should not only explore internal and external factors affecting teachers but also consider in-depth peripheral factors at the school and government level that influence the integration of technology in education. These include support from school and government-level actors such as fellow teachers and administrators, and policy makers whose assistance is vital for effective change.
References
- Abdelmagid, M., Abdullah, N. & Aldaba, A. M. A. (2021). Exploring the acceptance of augmented reality among tesl teachers and students and its effects on motivation level: A case study in Kuwait. Advances in Social Sciences Research Journal, 8(12). 23-34. [CrossRef]
- Abdusselam, M., & Karal, H. (2020). The effect of using augmented reality and sensing technology to teach magnetism in high school physics. Technology, Pedagogy, and Education, 29(4), 407-424. [CrossRef]
- Abed, S. S. (2021). Examining augmented reality adoption by consumers with highlights on gender and educational-level differences. Review of International Business and Strategy, 31(3), 397-415. [CrossRef]
- Aboudahr, S. M. F. M., Govindarajoo, M. V., Olowoselu, A., & Sani, R. M., (2023). Investigating moderating influence of gender on augmented reality and students satisfaction: Experiences in cultures and linguistic diversity. Asian Journal of University Education (AJUE), 19(3), 447-461.
- Aggarwal, D. (2018). Bring your own device (BYOD) to the classroom: A technology to promote green education. International Journal of Research and Analytical Reviews (IJRAR), 5(3).
- Aguayo, C., Cochrane, T., & Narayan, V. (2017). Key themes in mobile learning: Prospects for learner-generated learning through AR and VR. Australasian Journal of Educational Technology, 33(6), 27-40. [CrossRef]
- Akcayır, M., & Akcayır, G. (2017). Advantages and challenges associated with augmented reality for education: A systematic review of the literature. Educational Research Review, 20, 1–11. [CrossRef]
- Akçayır, M., Akçayır, G., Pektaş, H. M., & Ocak, M. A. (2016). Augmented reality in science laboratories: The effects of augmented reality on university students’ laboratory skills and attitudes toward science laboratories. Computers in Human Behavior, 57, 334-342. [CrossRef]
- Akinradewo, O., Hafez, M., Aliu, J., Oke, A., Aigbavboa, C., & Adekunle, S. (2025). Barriers to the adoption of augmented reality technologies for education and training in the built environment: A developing country context. Technologies, 13(2), 62. [CrossRef]
- Alagood, J., Prybutok, G., & Prybutok, V. R. (2023). Navigating privacy and data safety: The implications of increased online activity among older adults post-covid-19 induced isolation. Information, 14(6), 346. [CrossRef]
- Al-Akloby, S. B. S. F. (2023). The degree of using augmented reality technology among students of the optimum investment project for teaching personnel program and the difficulties they face at Al-Shaqra University. Journal of the College of Education for Women, 34(2), 30-47. [CrossRef]
- Alalwan, N., Cheng, L., Al-Samarraie, H., Yousef, R., Alzahrani, A. I., & Sarsam, S. M. (2020). Challenges and prospects of virtual reality and augmented reality utilization among primary school teachers: A developing country perspective. Studies in Educational Evaluation, 66, 100876. [CrossRef]
- Alam, A., & Mohanty, A. (2023). Educational technology: Exploring the convergence of technology and pedagogy through mobility, interactivity, AI, and learning tools. Cogent Engineering, 10(2), 2283282. [CrossRef]
- Alamäki, A., Dirin, A., & Suomala, J. (2021). Students' expectations and social media sharing in adopting augmented reality. The International Journal of Information and Learning Technology, 38(2), 196-208. [CrossRef]
- Al-Anazi, M. N., & Khalaf, M. H. R. (2023). The effect of using augmented reality technology on the cognitive holding power and the attitude towards it among middle school students in Al-Qurayyat Governorate, Saudi Arabia. Information Sciences Letters, 12(2), 1053-1067. [CrossRef]
- Albishri, B., & Blackmore, K. L. (2025). Duality in barriers and enablers of augmented reality adoption in education: A systematic review of reviews. Interactive Technology and Smart Education, 22(2), 167-191. [CrossRef]
- AlGerafi, M. A. M., Zhou, Y., Oubibi, M., & Wijaya, T. T. (2023). Unlocking the potential: A comprehensive evaluation of augmented reality and virtual reality in education. Electronics, 12(18), 3953. [CrossRef]
- Alhassn, I., Asiamah, N., Opuni, F. F., & Alhassan, A. (2022). The Likert scale: Exploring the unknowns and their potential to mislead the world. UDS International Journal of Development, 9(2), 867-880. [CrossRef]
- Alkhabra, Y. A., Ibrahem, U. M., & Alkhabra, S. A. (2023). Augmented reality technology in enhancing learning retention and critical thinking according to STEAM program. Humanities and Social Sciences Communications, 10(1), 1-10. [CrossRef]
- Alkhattabi, M. (2017). Augmented reality as e-learning tool in primary schools’ education: Barriers to teachers’ adoption. International Journal of Emerging Technologies in Learning, 12(2). [CrossRef]
- Almaleki, D. (2022). Designing a tool for evaluating employing augmented reality technology to distinguish between similar alphabets. International Journal of education and science, 39, 1-3. [CrossRef]
- Alqahtani, E. (2023). Augmented reality facilitates teachers ‘teaching and students' learning in higher education. Advances in Social Sciences Research Journal, 10(11). 86-90. [CrossRef]
- Alqarni, T. (2021). Comparison of augmented reality and conventional teaching on special needs students’ attitudes towards science and their learning outcomes. Journal of Baltic Science Education, 20(4), 558-572. [CrossRef]
- Al-Shahrani, H. A. (2021). Examining Saudi secondary school teachers’ acceptance of augmented reality technology. Islamic University Journal for Educational and Social Sciences, 5(2), 153-179.
- Al-Shahrani, H. A. M., & Asiri, A. M. S. (2023a). The degree of secondary school teachers’ use of augmented reality technology in education from their point of view and their attitudes towards it and its relationship to some variables. Alustath Journal for Human and Social Sciences, 62(3), 56-80. [CrossRef]
- Al-Shahrani, H. A. M., & Asiri, A. M. S. (2023b). The reality of using augmented reality technology by secondary school female teachers in Abha city in teaching from their point of view. Journal of Educational and Social Research 13(3), 46-59. https://DOI:10.36941/jesr-2023-0056.
- Alzahrani, N. M. (2020). Augmented reality: A systematic review of its benefits and challenges in e-learning contexts. Applied sciences, 10(16), 5660. [CrossRef]
- Amores-Valencia, A., Burgos, D., & Branch-Bedoya, J. W. (2023). The impact of augmented reality (AR) on the academic performance of high school students. Electronics, 12(10), 2173. [CrossRef]
- Anju, V., & Thiyagu, K. (2023). Pre-service teachers’ perceptions about augmented reality (AR) applications in science learning. Indian Journal of Educational Technology, 5(2), 115–132.
- Antonioli, M., Blake, C., & Sparks, K. (2014). Augmented reality applications in education. The Journal of technology studies, 40(2), 96-107. [CrossRef]
- Arena, F., Collotta, M., Pau, G., & Termine, F. (2022). An overview of augmented reality. Computers, 11(2), 28. [CrossRef]
- Arici, F., Yilmaz, R. M., & Yilmaz, M. (2021). Affordances of augmented reality technology for science education: Views of secondary school students and science teachers. Hum Behav & Emerg Tech, 3(5), 1153-1171. [CrossRef]
- ARToolKit. (2024, October 9). In Wikipedia. https://en.wikipedia.org/wiki/ARToolKit.
- Asbulah, L. H., Sahrim, M., Soad, N. F. A. M., Rushdi, N. A. A. M., & Deris, M. A. H. M. (2022). Teachers’ attitudes towards the use of augmented reality technology in teaching Arabic in primary school Malaysia. International Journal of Advanced Computer Science and Applications,13(10), 465-474. [CrossRef]
- Ascher-Svanum, H., Novick, D., Haro, J. M., Aguado, J., & Cui, Z. (2013). Empirically driven definitions of “good,” “moderate,” and “poor” levels of functioning in the treatment of schizophrenia. Quality of Life Research, 22(8), 2085-2094. [CrossRef]
- Ashley-Welbeck, A., & Vlachopoulos, D. (2020). Teachers’ perceptions on using augmented reality for language learning in primary years programme (PYP) education. International Journal of Emerging Technologies in Learning (iJET), 15(12), 116-135. [CrossRef]
- Asiri, M. M., & El-aasar, S. A. (2022). Employing technology acceptance model to access the reality of using augmented reality applications in teaching from teachers’ point of view in Najran. Journal of positive school psychology, 6(2), 5241-5255.
- Asokan, V., & Ponnusamy, P. (2023). Mobile augmented reality in teaching upper primary school science: Perspectives of subject handling teachers. Indian Journal of Educational Technology, 5(2), 67–74.
- Atalay, N. (2022). Augmented reality experiences of preservice classroom teachers in science teaching. International Technology and Education Journal, 6(1), 28-42.
- Ateş, H., & Garzón, J. (2023). An integrated model for examining teachers’ intentions to use augmented reality in science courses. Education and Information Technologies, 28(2), 1299-1321. [CrossRef]
- Bandla, S., Lella, S., Kola, A., Parvathaneni, K. M., & Rani, J. (2024). Association of anxiety, depression and sleep quality with binge-watching behavior in college students–An observational study. Archives of Mental Health, 25(2), 107-111. [CrossRef]
- Banerjee, G., & Walunj, S. (2019, December 09-11). Exploring in-service teachers' acceptance of augmented reality. In 2019 IEEE Tenth international conference on technology for education (T4E) (pp. 186-192). IEEE. [CrossRef]
- Bangga-Modesto, D. (2024). Examining student perception on mobile augmented reality integration, gender differences, learning styles, feedback, challenges, and opportunities in an online physics class. Science Education International, 35(1), 2-12.
- Basumatary, D., & Maity, R. (2024). The potential of augmented reality in Indian rural primary education. IEEE Potentials, 43(4), 26-31. [CrossRef]
- Belisario, J. S. M., Jamsek, J., Huckvale, K., O'Donoghue, J., Morrison, C. P., & Car, J. (2015). Comparison of self-administered survey questionnaire responses collected using mobile apps versus other methods. Cochrane database of systematic reviews, 7, 1-99. [CrossRef]
- Berame, J. S., Bulay, M. L., Mercado, R. L., Ybanez, A. R. C., Aloyon, G. C. A., Dayupay, A. M. F., ... & Jalop, N. J. (2022). Improving grade 8 students’ academic performance and attitude in teaching science through augmented reality. American Journal of Education and Technology, 1(3), 62-72. [CrossRef]
- Berson, M., Ng, D., Shin, J., & Jenkinson, J. (2018). Assessing augmented reality in helping undergraduate students to integrate 2D and 3D representations of stereochemistry. The Journal of Biocommunication, 42(1), e4. [CrossRef]
- Bhalerao, A. K. (2015). Application and performance of Google Forms for online data collection and analysis: A case of North Eastern Region of India. Indian Journal of Extension Education, 51(3 & 4), 49-53.
- Bhattacharya, S., Sau, A., Bera, P., Sardar, C., Chaudhuri, S., & Thakur, N. (2025). Teachers and technology: A comprehensive study on augmented reality awareness among school educators in India. Journal of Information Systems Engineering and Management, 10(45s), 233-252. [CrossRef]
- Bock, D. E., Velleman, P. F., & Veaux, R. D. D. (2010). Stats: Modeling the world: AP Edition. Addison Wesley, Boston, MA.
- Buchner, J., Krüger, J. M., Bodemer, D., & Kerres, M. (2022). Teachers’ use of augmented reality in the classroom: Reasons, practices, and needs. In Proceedings of the 16th international conference of the learning sciences-ICLS 2022, (pp. 1133-1136). International Society of the Learning Sciences. [CrossRef]
- Cabero-Almenara, J., Barroso-Osuna, J., Llorente-Cejudo, C., & Fernández-Martínez, M. D. M. (2019a). Educational uses of augmented reality (AR): Experiences in educational science. Sustainability, 11(18), 4990. [CrossRef]
- Cabero-Almenara, J., Fernández-Batanero, J. M., & Barroso-Osuna, J. (2019b). Adoption of augmented reality technology by university students. Heliyon, 5(5), 1-9. [CrossRef]
- Cai, S., Chiang, F. K., & Wang, X. (2013). Using the augmented reality 3D technique for a convex imaging experiment in a physics course. International Journal of Engineering Education, 29(4), 858-865.
- Cao, W., & Yu, Z. (2023). Retracted article: The impact of augmented reality on student attitudes, motivation, and learning achievements—a meta-analysis (2016–2023). Humanities and Social Sciences Communications, 10,352, 1-12. [CrossRef]
- Castaño-Calle, R., Jiménez-Vivas, A., Castro, R. P., Álvarez, M. I. C., & Jenaro, C. (2022). Perceived benefits of future teachers on the usefulness of virtual and augmented reality in the teaching-learning process. Education Sciences, 12(12), 855. [CrossRef]
- Cepeda-Galvis, P. A., Mendoza-Moreno, M. A., & Rodriguez-Hernandez, A. A. (2017). Educational and cultural environments enriched using augmented reality technology. New Trends and Issues Proceedings on Humanities and Social Sciences, 4(8), 52-59.
- Cetin, H. (2022). a systematic review of studies on augmented reality based applications in primary education. International Journal of Education and Literacy Studies, 10(2), 110-121. [CrossRef]
- Chakraborty, S., & Thakur, N. (2024). Reflections of adult learners on binge-watching and its detrimental impact on the environment in West Bengal, India. Cogent Education, 11(1), 2428895. [CrossRef]
- Chang, H. Y., Binali, T., Liang, J. C., Chiou, G. L., Cheng, K. H., Lee, S. W. Y., & Tsai, C. C. (2022). Ten years of augmented reality in education: A meta-analysis of (quasi-) experimental studies to investigate the impact. Computers & Education, 191, 104641. [CrossRef]
- Chang, K. E., Chang, C. T., Hou, H. T., Sung, Y. T., Chao, H. L., & Lee, C. M. (2014). Development and behavioral pattern analysis of a mobile guide system with augmented reality for painting appreciation instruction in an art museum. Computers & education, 71(1), 185-197. [CrossRef]
- Chavez-Perez, J., & Iparraguirre-Villanueva, O. (2025). Digital inclusion and accessibility through augmented reality mobile technologies in education: A systematic review. International Journal of Interactive Mobile Technologies, 19(4), 48-64. https://10.3991/ijim.v19i04.52845.
- Chen, S. Y. (2022). To explore the impact of augmented reality digital picture books in environmental education courses on environmental attitudes and environmental behaviors of children from different cultures. Frontiers in psychology, 13, 1063659. [CrossRef]
- Cheng, K. H., & Tsai, C. C. (2014). Children and parents' reading of an augmented reality picture book: Analyses of behavioral patterns and cognitive attainment. Computers & Education, 72, 302-312. [CrossRef]
- Cheon, J., Lee, S., Crooks, S. M., & Song, J. (2012). An investigation of mobile learning readiness in higher education based on the theory of planned behavior. Computers & Education, 59(3), 1054-1064. [CrossRef]
- Cipresso, P., Meriggi, P., Carelli, L., Solca, F., Meazzi, D., Poletti, B., ... & Silani, V. (2011, May 23). The combined use of brain computer interface and eye-tracking technology for cognitive assessment in amyotrophic lateral sclerosis. In 2011 5th International conference on pervasive computing technologies for healthcare (Pervasive Health) and workshops (pp. 320-324). IEEE. [CrossRef]
- Contreras, G., de Cabo, R. M., & Gimeno, R. (2024). Women who LinkedIn: The gender networking gap among executives. European Management Journal, 43(3), 383-398. [CrossRef]
- Creswell, J. W., & Clark, V. L. P. (2017). Designing and conducting mixed methods research. Sage publications.
- Creswell, J. W., & Clark, V. L. P. (2023). Revisiting mixed methods research designs twenty years later. In Poth C. (Ed.), Sage handbook of mixed methods designs (pp. 623–635). Sage Publications.
- Cyril, N., Thoe, N. K., Sinniah, D. N., Rajoo, M., Sinniah, S., Adzmin, W. N.,... & Shukor, S. A. (2022). Exploring the effect of science teachers’ age group on technological knowledge, technological content and pedagogical knowledge in augmented reality. Dinamika Jurnal Ilmiah Pendidikan Dasar, 14(1), 1-11. [CrossRef]
- da Silva, M. M. O., Teixeira, J. M. X. N., Cavalcante, P. S., & Teichrieb, V. (2019). Perspectives on how to evaluate augmented reality technology tools for education: A systematic review. Journal of the Brazilian Computer Society, 25(3), 1-18. [CrossRef]
- Dahri, N. A., Yahaya, N., Al-Rahmi, W. M., Noman, H. A., Alblehai, F., Kamin, Y. B., ... & Al-Adwan, A. S. (2024). Investigating the motivating factors that influence the adoption of blended learning for teachers’ professional development. Heliyon, 10(15). [CrossRef]
- Dejonckheere, M., Lindquist-Grantz, R., Toraman, S., Haddad, K., & Vaughn, L. M. (2019). Intersection of mixed methods and community-based participatory research: A methodological review. Journal of Mixed Methods Research, 13(4), 481-502. [CrossRef]
- De-Lima, C. B., Walton, S., & Owen, T. (2022). A critical outlook at augmented reality and its adoption in education. Computers and Education Open, 3, 100103. [CrossRef]
- Dembe, H. A. (2024). The integration of virtual reality (VR) and augmented reality (AR) in classroom settings. Research Invention Journal of Engineering and Physical Sciences, 3(1), 102-113.
- Dickmann, T., Opfermann, M., Dammann, E., Lang, M., & Rumann, S. (2019). What you see is what you learn? The role of visual model comprehension for academic success in chemistry. Chemistry Education Research and Practice, 20(4), 804-820. [CrossRef]
- Di-Fuccio, R., Kic-Drgas, J., & Woźniak, J. (2024). Co-created augmented reality app and its impact on the effectiveness of learning a foreign language and on cultural knowledge. Smart Learning Environments, 11(1), 21. [CrossRef]
- Dirin, A., Alamäki, A., & Suomala, J. (2019). Gender differences in perceptions of conventional video, virtual reality and augmented reality. International Journal of Interactive Mobile Technologies (iJIM), 13(6), 93-102. [CrossRef]
- Do, H. N., Shih, W., & Ha, Q. A. (2020). Effects of mobile augmented reality apps on impulse buying behavior: An investigation in the tourism field. Heliyon, 6(8). https://10.1016/j.heliyon.2020.e04667.
- Dsouza, N. P., & Hemmige, B. D. (2023). Teacher’s perspective on using augmented reality in the classroom to teach scientific concepts. Iconic Research And Engineering Journals, 6(7), 207-213.
- Dunleavy, M., Dede, C., & Mitchell, R. (2009). Affordances and limitations of immersive participatory augmented reality simulations for teaching and learning. Journal of Science Education and Technology, 18(1), 7-22. [CrossRef]
- Dutta, R., Mantri, A., & Singh, G. (2022). Assess teachers’ attitude towards mobile augmented reality systems for teaching digital electronics course. ECS transactions, 107(1), 7631-7638. [CrossRef]
- Egunjobi, D., & Adeyeye, O. J. (2024). Revolutionizing learning: The impact of augmented reality(AR) and artificial intelligence (AI on education). International Journal of Research Publication and Reviews, 5(10), 1157-1170. [CrossRef]
- Elford, D., Lancaster, S. J., & Jones, G. A. (2022). Exploring the effect of augmented reality on cognitive load, attitude, spatial ability, and stereochemical perception. Journal of Science Education and Technology, 31(3), 322-339. [CrossRef]
- Eutsler, L., & Long, C. S. (2021). Preservice teachers’ acceptance of virtual reality to plan science instruction. Educational Technology & Society, 24(2), 28-43.
- Ewais, A., & Troyer, O. D. (2019). A usability and acceptance evaluation of the use of augmented reality for learning atoms and molecules reaction by primary school female students in Palestine. Journal of Educational Computing Research, 57(7), 1643-1670. [CrossRef]
- Faqih, K. M., & Jaradat, M. I. (2021). Integrating TTF and UTAUT2 theories to investigate the adoption of augmented reality technology in education: Perspective from a developing country. Technology in Society, 67, 101787. [CrossRef]
- Finkler, A. (2010). Goodness of fit statistics for sparse contingency tables. arXiv preprint arXiv:1006.2287. [CrossRef]
- Gajbhiye, D. R. S. (2024). Virtual reality (VR) and augmented reality (AR) in libraries. Royal International Global Journal of Advance and Applied Research, 1(5), 8–10. [CrossRef]
- Garratt, A. M., Helgeland, J., & Gulbrandsen, P. (2011). Five-point scales outperform 10-point scales in a randomized comparison of item scaling for the patient experiences questionnaire. Journal of clinical epidemiology, 64(2), 200-207. [CrossRef]
- Gasteiger, N., van der Veer, S. N., Wilson, P., & Dowding, D. (2022). How, for whom, and in which contexts or conditions augmented and virtual reality training works in upskilling health care workers: realist synthesis. JMIR serious games, 10(1), e31644. [CrossRef]
- Georgiou, Y., & Kyza, E. A. (2017, June). Investigating immersion in relation to students’ learning during a collaborative location-based augmented reality activity [Paper presentation]. International conference of computer supported collaborative learning, PA, International Society of the Learning Sciences, Philadelphia.
- Ghobadi, M., Shirowzhan, S., Ghiai, M. M., Ebrahimzadeh, F. M., & Tahmasebinia, F. (2023). Augmented reality applications in education and examining key factors affecting the users’ behaviors. Education Sciences, 13(1), 10. [CrossRef]
- Giard, F., & Guitton, M. J. (2016). Spiritus ex machina: Augmented reality, cyberghosts and externalised consciousness. Computers in Human Behavior, 55(B), 614-615. [CrossRef]
- Giasiranis, S., & Sofos, L. (2016). Production and evaluation of educational material using augmented reality for teaching the module of “representation of the information on computers” in junior high school. Creative Education, 7(9), 1270-1291. [CrossRef]
- Gomez-Trigueros, I. M., & Aldecoa, C. Yde. (2021). The digital gender gap in teacher education: The TPACK framework for the 21st century. European Journal of Investigation in Health, Psychology and Education, 11(4), 1333-1349. [CrossRef]
- Grinshkun, A. V., Perevozchikova, M. S., Razova, E. V., & Khlobystova, I. Y. (2021). Using methods and means of the augmented reality technology when training future teachers of the digital school. European Journal of Contemporary Education, 10(2), 358-374. [CrossRef]
- Gusteti, M. U., Musdi, E., Dewata, I., & Rasli, A. M. (2025). A ten-year bibliometric study on augmented reality in mathematical education. European Journal of Educational Research, 14(3), 723-741. [CrossRef]
- Habig, S. (2020). Who can benefit from augmented reality in chemistry? Sex differences in solving stereochemistry problems using augmented reality. British Journal of Educational Technology, 51(3), 629-644. [CrossRef]
- Heintz, M., Law, E .L. C., & Andrade, P. (2021). Augmented reality as educational tool: Perceptions, challenges, and requirements from teachers. In: T. De Laet, R. Klemke, C. Alario-Hoyos, I. Hilliger, & A. Ortega-Arranz (Eds.), Technology-Enhanced Learning for a Free, Safe, and Sustainable World, EC-TEL 2021, Lecture Notes in Computer Science, (pp 315–319), 12884. Springer, Cham. [CrossRef]
- Hervás-Gómez, C., Toledo-Morales, P., & Díaz-Noguera, M. D. (2017). Augmented reality applications attitude scale (ARAAS): Diagnosing the attitudes of future teachers. The New Educational Review, 50(4), 215-226. [CrossRef]
- Holly, M., Pirker, J., Resch, S., Brettschuh, S., & Gütl, C. (2021). Designing VR experiences–expectations for teaching and learning in VR. Educational Technology & Society, 24(2), 107-119.
- Holzmann, P., & Gregori, P. (2023). The promise of digital technologies for sustainable entrepreneurship: A systematic literature review and research agenda. International Journal of Information Management, 68, 102593. [CrossRef]
- Hsu, H. Y., & Wang, S. K. (2017). Integrating technology: Using Google Forms to collect and analyze data. Science Scope, 40(8), 64-67. [CrossRef]
- Huang, T. C., Chen, C. C., & Chou, Y. W. (2016). Animating eco-education: To see, feel, and discover in an augmented reality-based experiential learning environment. Computers & Education, 96, 72-82. [CrossRef]
- Ibáñez, M. B., Portillo, A. U., Cabada, R. Z., & Barrón, M. L. (2020). Impact of augmented reality technology on academic achievement and motivation of students from public and private Mexican schools. A case study in a middle-school geometry course. Computers & Education, 145, 103734. [CrossRef]
- Ibili, E., Resnyansky, D., & Billinghurst, M. (2019). Applying the technology acceptance model to understand maths teachers’ perceptions towards an augmented reality tutoring system. Education and Information Technologies, 24(5), 2653-2675. [CrossRef]
- Iqbal, S., & Bhatti, Z. A. (2020). A qualitative exploration of teachers’ perspective on smartphones usage in higher education in developing countries. International Journal of Educational Technology in Higher Education, 17(1), 29. (2020). [CrossRef]
- Jamrus, M. H. M., & Razali, A. B. (2021). Acceptance, readiness and intention to use augmented reality (AR) in teaching English reading among secondary school teachers in Malaysia. Asian Journal of University Education (AJUE), 17(4), 312-326. [CrossRef]
- Jiang, H., Zhu, D., Chugh, R., Turnbull, D., & Jin, W. (2025). Virtual reality and augmented reality-supported K-12 STEM learning: Trends, advantages and challenges. Education and Information Technologies, 30, 12827–12863. [CrossRef]
- Johnson, R. B., & Onwuegbuzie, A. J. (2004). Mixed Methods Research: A Research Paradigm Whose Time Has Come. Educational Researcher, 33,(7) 14-26. [CrossRef]
- Joshi, A., Kale, S., Chandel, S., & Pal, D. K. (2015). Likert scale: Explored and explained. British journal of applied science & technology, 7(4), 396-403. [CrossRef]
- Jung, T., & tom-Dieck, M. C. (Eds.). (2018). Augmented reality and virtual reality: Empowering human, place and business. Springer Cham. [CrossRef]
- Kamarainen, A. M., Metcalf, S., Grotzer, T., Browne, A., Mazzuca, D., Tutwiler, M. S., & Dede, C. (2013). Eco mobile: Integrating augmented reality and probeware with environmental education field trips. Computers and Education, 68, 545-556. [CrossRef]
- Kamarudin, S., Shoaib, H. M., Jamjoom, Y., Saleem, M., & Mohammadi, P. (2023). Use of Augmented Reality Application in E-learning System During COVID-19 Pandemic. In: B. Alareeni, & A. Hamdan (Eds.), Explore business, technology opportunities and challenges after the Covid-19 pandemic, ICBT 2022, lecture notes in networks and systems, (pp. 241-251), 495. Springer, Cham. [CrossRef]
- Karthick, M., & Shanmugam, P. N. L. (2024). Exploring prospective teachers' awareness and perception of augmented reality (AR): A survey-based study. Educational Administration: Theory and Practice, 30(3), 2984-2991. https://Doi:10.53555/kuey.v30i3.8808.
- Kazakou, G., & Koutromanos, G. (2022). Augmented reality smart glasses in education: Teachers’ perceptions regarding the factors that influence their use in the classroom. In: M. E. Auer, & T. Tsiatsos (Eds.), New realities, mobile systems and applications, IMCL 2021, lecture notes in networks and systems, (pp. 145-155), 411. Springer, Cham. [CrossRef]
- Kececi, G., Yildirim, P., & Zengin, F. K. ( 2021). Determining the effect of science teaching using mobile augmented reality application on the secondary school students’ attitudes of toward science and technology and academic achievement. Science Education International, 32(2), 137-148. [CrossRef]
- Khan, T., Johnston, K., & Ophoff, J. (2019). The impact of an augmented reality application on learning motivation of students. Advances in Human-Computer Interaction, 2019(1), 1-14. [CrossRef]
- Khukalenko, I. S., Kaplan-Rakowski, R., An, Y., & Iushina, V. D. (2022). Teachers’ perceptions of using virtual reality technology in classrooms: A large-scale survey. Education and Information Technologies, 27(8), 11591-11613. [CrossRef]
- Köroğlu, M. (2025). Pioneering virtual assessments: Augmented reality and virtual reality adoption among teachers. Education and Information Technologies, 30(8), 9901-9948. [CrossRef]
- Koutromanos, G., & Jimoyiannis, A. (2022). Augmented reality in education: Exploring Greek teachers’ views and perceptions. In Reis, A., Barroso, J., Martins, P., Jimoyiannis, A., Huang, R.YM., Henriques, R. (Eds.), Technology and Innovation in Learning, Teaching and Education. TECH-EDU 2022. Communications in Computer and Information Science, 1720, (pp. 31-42).. Springer, Cham. [CrossRef]
- Kudale, P., & Buktar, R. (2022). Investigation of the impact of augmented reality technology on interactive teaching learning process. International Journal of Virtual and Personal Learning Environments (IJVPLE), 12(1), 1-16. [CrossRef]
- Kumari, S., & Polke, N. (2019). Implementation issues of augmented reality and virtual reality: A survey. In International Conference on Intelligent Data Communication Technologies and Internet of Things (ICICI) 2018 (pp. 853-861). Springer International Publishing. [CrossRef]
- Lampropoulos, G., Keramopoulos, E., Diamantaras, K., & Evangelidis, G. (2022). Augmented reality and virtual reality in education: Public perspectives, sentiments, attitudes, and discourses. Education Sciences, 12(11), 798. [CrossRef]
- Lee, J., & Lee, C. F. (2022). Analysis of variance and chi-square tests. In: John, L. & Cheng-Few, L. (Eds.), Essentials of Excel VBA, Python, and R (pp. 331-352). Springer, Cham. [CrossRef]
- Lham, T., Jurmey, P., & Tshering, S. (2020). Augmented reality as a classroom teaching and learning tool: Teachers’ and students’ attitude. Asian Journal of Education and Social Studies, 12(4), 27-35. https://10.9734/AJESS/2020/v12i430318.
- Li, Q., Liu, Q., & Chen, Y. (2023). Prospective teachers’ acceptance of virtual reality technology: a mixed study in rural China. Education and Information Technologies, 28(3), 3217-3248. [CrossRef]
- Liao, C. H. D., Wu, W. C. V., Gunawan, V., & Chang, T. C. (2024). Using an augmented-reality game-based application to enhance language learning and motivation of elementary school EFL students: A comparative study in rural and urban areas. Asia-Pacific Edu Res, 33(2), 307–319. [CrossRef]
- Lin, T. J., Duh, H. B. L., Li, N., Wang, H. Y., & Tsai, C. C. (2013). An investigation of learners' collaborative knowledge construction performances and behavior patterns in an augmented reality simulation system. Computers & Education, 68, 314-321. [CrossRef]
- Linus, A. A., Monsuir, I. A., Elizabeth, F. J., & Justina, A. A. (2025). Teachers' ICT competency and their attitude towards integrating virtual reality (VR) and augmented reality (AR) in the classroom in IJEBU-ODE local government area of OGUN state. Journal of Contemporary Research (JOCRES), 4(1), 32-48.
- Liu, E., Cai, S., Liu, Z., & Liu, C. (2023). WebART: Web-based augmented reality learning resources authoring tool and its user experience study among teachers. IEEE Transactions on learning technologies, 16(1), 53-65. https://10.1109/TLT.2022.3214854.
- Makwana, D., Engineer, P., Dabhi, A., & Chudasama, H. (2023). Sampling methods in research: A review. International Journal of Trend in Scientific Research and Development, 7(3), 762-768.
- Manna, M. (2023). Teachers as Augmented reality designers: A study on Italian as a foreign language-teacher perception. International Journal of Mobile and blended learning, 15(2), 1-16. [CrossRef]
- Marín-Marín, J. A., López-Belmonte, J., Pozo-Sánchez, S., & Moreno-Guerrero, A. J. (2023). Attitudes towards the development of good practices with augmented reality in secondary education teachers in Spain. Technology, Knowledge and Learning, 28(4), 1443-1459. [CrossRef]
- Marrahi-Gomez, V., & Belda-Medina, J. (2022). The integration of augmented reality (AR) in education. Advances in Social Sciences Research Journal, 9(12), 475-487. [CrossRef]
- Martín-Gutiérrez, J., Fabiani, P., Benesova, W., Meneses, M. D., & Mora, C. E. (2015). Augmented reality to promote collaborative and autonomous learning in higher education. Computers in human behavior, 51,Par B, 752-761. [CrossRef]
- McNair, C. L., & Green, M. (2016). Preservice teachers’ perceptions of augmented reality. In E. E. Martinez, & J. Pilgrim (Eds.), Literacy Summit Yearbook (2nd ed., pp. 74-81). Specialized Literacy Professionals and Texas Association for Literacy Education.
- Meccawy, M. (2023). Teachers’ prospective attitudes towards the adoption of extended reality technologies in the classroom: Interests and concerns. Smart Learning Environments, 10(36). [CrossRef]
- Meenakshi, P. K., & Indu, H. (2025). Understanding the potential of augmented reality to improve mathematical education. Indian Journal of Educational Technology, 7(1), 190-121.
- Mena, J., Estrada-Molina, O., & Pérez-Calvo, E. (2023). Teachers’ professional training through augmented reality: A literature review. Education Sciences, 13(5), 517. [CrossRef]
- Meng, Y., Xu, W., Liu, Z., & Yu, Z. G. (2024). Scientometric analyses of digital inequity in education: problems and solutions. Humanities and Social Sciences Communications, 11(1), 1-13. [CrossRef]
- Mercader, C., & Duran-Bellonch, M. (2021). Female Higher Education teachers use digital technologies more and better than they think. Digital Education Review, 40, 172-184. [CrossRef]
- Milad, M., & Fayez, F. (2025). Perception and attitudes towards augmented reality (AR) enhanced academic writing: Satisfaction levels. World Journal of English Language, 15(6), 268-288. [CrossRef]
- Miller, R., & Liu, K. (2023). After the virus: Disaster capitalism, digital inequity, and transformative education for the future of schooling. Education and Urban Society, 55(5), 533-554. [CrossRef]
- Mirza, T., Dutta, R., Tuli, N., & Mantri, A. (2025). Leveraging augmented reality in education involving new pedagogies with emerging societal relevance. Discover Sustainability, 6(1), 1-15. [CrossRef]
- Mohamad, S., & Husnin, H. (2023). Teachers’ perception of the use of augmented reality (AR) modules in teaching and learning. International Journal of Academic Research in Business and Social Sciences, 13(9), 9-34. [CrossRef]
- Mota, J. M., Ruiz-Rube, I., Dodero, J. M., & Arnedillo-Sánchez, I. (2018). Augmented reality mobile app development for all. Computers & Electrical Engineering, 65, 250-260. [CrossRef]
- Mundy, M., Hernandez, J., & Green, M. (2019). Perceptions of the effects of augmented reality in the classroom. Journal of Instructional Pedagogies, 22, 1-15.
- Naveau, P., Huser, R., Ribereau, P., & Hannart, A. (2016). Modeling jointly low, moderate, and heavy rainfall intensities without a threshold selection. Water Resources Research, 52(4), 2753-2769. [CrossRef]
- Nikou, S. A. (2024). Factors influencing student teachers’ intention to use mobile augmented reality in primary science teaching. Education and Information Technologies, 29(12), 15353-15374. [CrossRef]
- Nikou, S. A., Perifanou, M., & Economides, A. A. (2024a). Development and validation of the teachers’ augmented reality competences (TARC) scale. J. Comput. Educ., 11(4), 1041–1060. [CrossRef]
- Nikou, S. A., Perifanou, M., & Economides, A. A. (2024b). Exploring teachers’ competences to integrate augmented reality in education: Results from an international study. Tech Trends, 68(6), 1208–1221 (2024). [CrossRef]
- Nitza, D., & Roman, Y. (2017). Who needs parent-teacher meetings in the technological era?. International Journal of Higher Education, 6(1), 153-162. [CrossRef]
- Nizar, N. N. M., Rahmat, M. K., & Damio, S. M. (2020). Evaluation of pre-service teachers’ actual use towards augmented reality technology through MARLCardio. The International Journal of Academic Research in business and social sciences, 10(11), 1091-1101. [CrossRef]
- Oke, A. E., & Arowoiya, V. A. (2021). Critical barriers to augmented reality technology adoption in developing countries: a case study of Nigeria. Journal of Engineering, Design and Technology, 20(5), 1320-1333. [CrossRef]
- Okumuş, A., & Savaş, P. (2024). Investigating EFL teacher candidates’ acceptance and self-perceived self-efficacy of augmented reality. Education and Information Technologies, 29(13), 16571-16596. [CrossRef]
- Oliveira, G., Teixeira, J. G., Torres, A., & Morais, C. (2021). An exploratory study on the emergency remote education experience of higher education students and teachers during the COVID-19 pandemic. British Journal of Educational Technology, 52(4), 1357-1376. [CrossRef]
- Ozdamli, F., & Hursen, Ç. (2017). An emerging technology: Augmented reality to promote learning. Int. J. Emerg. Technol. Learn., 12(11), 121-137. [CrossRef]
- Palada, B., Chandan, V. S., Gowda, C. P., & Nikitha, P. (2024). The Role of Augmented Reality (AR) in Education. International Journal for Research in Applied Science & Engineering Technology (IJRASET), 12(3), 1400-1408. [CrossRef]
- Paladini, M. (2018, August 14). 3 different types of AR explained: Marker-based, markerless & location. Blippar. https://www.blippar.com/.
- Panakaje, N., Rahiman, H. U., Parvin, S. M. R., Shareena, P., Madhura, K., Yatheen, & Irfana, S. (2024). Revolutionizing pedagogy: Navigating the integration of technology in higher education for teacher learning and performance enhancement. Cogent Education, 11(1), 2308430. [CrossRef]
- Papakostas, C., Troussas, C., Krouska, A., & Sgouropoulou, C. (2022). Exploring users’ behavioral intention to adopt mobile augmented reality in education through an extended technology acceptance model. International Journal of Human–Computer Interaction, 39(6), 1294–1302. [CrossRef]
- Pasalidou, C., & Fachantidis, N. (2021). Teachers’ perceptions towards the use of mobile augmented reality: The case of Greek educators. In Internet of Things, Infrastructures and Mobile Applications: Proceedings of the 13th IMCL Conference 13 (pp. 1039-1050). Springer International Publishing. [CrossRef]
- Pasalidou, C., Fachantidis, N., & Koiou, E. (2023). Using augmented reality and a social robot to teach geography in primary school. In P. Zaphiris, & A. Ioannou (Eds.), Learning and collaboration technologies HCII 2023, lecture notes in computer science, (pp. 371-385), 14041. Springer, Cham. [CrossRef]
- Peikos, G., & Sofianidis, A. (2024). What is the future of augmented reality in science teaching and learning? An exploratory study on primary and pre-school teacher students’ views. Education Sciences, 14(5), 480. [CrossRef]
- Perifanou, M., Economides, A. A., & Nikou, S. A. (2023). Teachers’ views on integrating augmented reality in education: Needs, opportunities, challenges and recommendations. Future Internet, 15(1), 20. [CrossRef]
- Putiorn, P., Nobnop, R., Buathong, P., & Soponronnarit, K. (2018, November 25-28). Understanding teachers' perception toward the use of an augmented reality-based application for astronomy learning in secondary schools in Northern Thailand. In 2018 Global Wireless Summit (GWS) (pp. 77-81). IEEE. [CrossRef]
- Qirom, M. S., & Sukma, L. R. G. (2024). The effect of augmented reality in mathematics education: Gender perspective. In AIP Conference Proceedings, 3220(1). AIP Publishing. [CrossRef]
- Radosavljevic, S., Radosavljevic, V., & Grgurovic, B. (2020). The potential of implementing augmented reality into vocational higher education through mobile learning. Interactive Learning Environments, 28(4), 404-418. [CrossRef]
- Radu, I., Joy, T., Bott, I., Bowman, Y., & Schneider, B. (2022, May 30-June 4). A Survey of Educational Augmented Reality in Academia and Practice: Effects on Cognition, Motivation, Collaboration, Pedagogy and Applications. In 2022 8th International Conference of the Immersive Learning Research Network (iLRN) (pp. 1-8). IEEE. [CrossRef]
- Rahmat, A. D., Kuswanto, H., Wilujeng, I., Putranta, H., & Ilma, A. Z. (2023). Teachers' perspective toward using augmented reality technology in science learning. Cypriot Journal of Educational Science. 18(1), 215-227. [CrossRef]
- Rahmiati, D., Sarwi, S., Sudarmin, S., & Cahyono, A. N. (2025). The use of augmented reality diorama media in natural and social sciences subjects for fourth grade elementary school. Journal La Edusci, 6(1), 61-78. [CrossRef]
- Ratmaningsih, N., Abdulkarim, A., Sopianingsih, P., Anggraini, D. N., Rahmat, R., Juhanaini, J., Halimatussadiah, R., & Adhitama, F. Y. (2024). Gender equality education through augmented reality (AR)-based flashcards in learning social studies education in schools as an embodiment of sustainable development goals (SDGs). Journal of Engineering Science and Technology, 19(4), 1365-1388.
- Rawat, A. (2025, March 12). AR in education- Use cases, benefits, challenges and more. Appinventiv. https://appinventiv.com/blog/ar-in-education/.
- Rayhan, R. U., Zheng, Y., Uddin, E., Timbol, C., Adewuyi, O., & Baraniuk, J. N. (2013). Administer and collect medical questionnaires with Google documents: a simple, safe, and free system. Applied medical informatics, 33(3), 12-21.
- Raza, S. H., Yousaf, M., Sohail, F., Munawar, R., Ogadimma, E. C., & Siang, J. M. L. D. (2021). Investigating binge-watching adverse mental health outcomes during Covid-19 pandemic: Moderating role of screen time for web series using online streaming. Psychology Research and Behavior Management, 14, 1615–1629. [CrossRef]
- Ripsam, M., & Nerdel, C. (2024). Teachers’ attitudes and self-efficacy toward augmented reality in chemistry education. Front. Educ., 8:1293571. [CrossRef]
- Robles, B. F. (2017). La utilización de objetos de aprendizaje de realidad aumentada en la enseñanza universitaria de educación primaria. IJERI: International Journal of Educational Research and Innovation, 9, 90–104.
- Romano, M., Diaz, P., & Aedo, I. (2020). Empowering teachers to create really experiences: The effects on the educational experience. Interactive learning environments, 31(3), 1546-1563. [CrossRef]
- Sáez-López, J. M., Cózar-Gutiérrez, R., González-Calero, J. A., & Gómez-Carrasco, C. J. (2020). Augmented reality in higher education: An evaluation program in initial teacher training. Education Sciences, 10(2), 26. [CrossRef]
- Sahin, D., & Yilmaz, R. M. (2020). The effect of augmented reality technology in middle school students’ achievements and attitudes towards science education. Computers and Education, 144, 103710. [CrossRef]
- Şakir, A. (2025). Augmented reality in preschool settings: a cross-sectional study on adoption dynamics among educators. Interactive Learning Environments, 33(4), 2954-2977. [CrossRef]
- Salleh, A. B., Phon, D. N. E., Rahman, N. S. A., Hashim, S. B., & Lah, N. H. C. (2023, August 25-27). Examining the correlations between teacher profiling, ICT skills, and the readiness of integrating augmented reality in education. In 2023 IEEE 8th International Conference On Software Engineering and Computer Systems (ICSECS) (pp. 303-308). IEEE. [CrossRef]
- Salmee, M. S. A., & Majid, A. F. (2022). A study on in-service English teachers’ perceptions towards the use of augmented reality (AR) in ESL classroom: Implications for TESL programme in higher education institutions. Asian Journal of University Education, 18(2), 499-509. [CrossRef]
- Sánchez-Obando, J. W., & Duque-Méndez, N. D. (2023). Augmented reality strategy as a didactic alternative in rural public schools in Colombia. Computer Applications in Engineering Education, 31(3), 552-573. [CrossRef]
- Scharf, E. M., & Baldwin, L. P. (2007). Assessing multiple choice question (MCQ) tests – a mathematical perspective. Active Learning in Higher Education, 8(1), 31-47. [CrossRef]
- Schina, D., Kalemaki, I., Miron, M. I., Patsias, A., Vlachopoulos, D., Thorkelsdóttir, R. B., & Jónsdóttir, J. G. (2025). Promoting sustainable digital behaviors: Evaluation of the ecodigital curriculum in schools in Greece and Romania. In L. G. Chova, C. G. Martínez, & J. Lees (Eds.), INTED2025 Proceedings (pp. 5011-5019). IATED. [CrossRef]
- Schlomann, A., Memmer, N., & Wahl, H. W. (2022). Awareness of age-related change is associated with attitudes toward technology and technology skills among older adults. Frontiers in Psychology, 13, 905043. [CrossRef]
- Schmidthaler, E., Anđic, B., Schmollmüller, M., Sabitzer, B., & Lavicza, Z. (2023). Mobile augmented reality in biological education: Perceptions of Austrian secondary school teachers. Journal on Efficiency and Responsibility in Education and Science, 16(2), 113-127. [CrossRef]
- Schoonenboom, J., & Johnson, R. B. (2017). How to construct a mixed methods research design. Kolner Zeitschrift fur Soziologie und Sozialpsychologie, 69(2), 107-131. https://DOI10.1007/s11577-017-0454-1.
- Sensorama. (2024, May 26). In Wikipedia. https://en.wikipedia.org/wiki/Sensorama.
- Sethuraman, R., Kerin, R. A., & Cron, W. L. (2005). A field study comparing online and offline data collection methods for identifying product attribute preferences using conjoint analysis. Journal of Business Research, 58(5), 602-610. [CrossRef]
- Shapiro, S. S., & Wilk, M. B. (1965). An analysis of variance test for normality (complete samples). Biometrika, 52(3/4), 591–611. [CrossRef]
- Shivani, & Chander, Y. (2023). Effect of online learning augmented reality programme on academic achievement in science. Indian Journal of Educational Technology, 5(2), 8-23.
- Singh, R. (2025, April 21). Types of AR experiences: Marker-based, markerless, and location-based. Twin Reality. https://twinreality.in/.
- Sirakaya, M., & Cakmak, E. K. (2018). Investigating student attitudes toward augmented reality. Malaysian Online Journal of Educational Technology, 6(1), 30-44.
- Sırakaya, M., & Sırakaya, D. A. (2022). Augmented reality in STEM education: A systematic review. Interactive Learning Environments, 30(8), 1556-1569. [CrossRef]
- Sökmen, Y., Sarikaya, İ., & Nalçacı, A. (2024). The effect of augmented reality technology on primary school students’ achievement, attitudes towards the course, attitudes towards technology, and participation in classroom activities. International Journal of Human–Computer Interaction, 40(15), 3936-3951. [CrossRef]
- Stojsic, I., Ostojic, N., & Stanisavljevic, J. (2022). Students’ acceptance of mobile augmented reality applications in primary and secondary biology education. International Journal of cognitive Research in Science, Engineering and Education, 10(3), 129-138. [CrossRef]
- Suhaimi, H., Aziz, N. N., Ibrahim, E. N. M., & Isa, W. A. R. W. M. (2022). Technology acceptance in learning history subject using augmented reality towards smart mobile learning environment: Case in Malaysia. Journal of Automation, Mobile Robotics and Intelligent Systems, 16(2), 20-29. [CrossRef]
- Sulisworo, D., Drusmin, R., Kusumaningtyas, D. A., Handayani, T., Wahyuningsih, W., Jufriansah, A., ... & Prasetyo, E. (2021). The Science teachers’ optimism response to the use of marker-based augmented reality in the global warming issue. Education Research International, 2021(1), 7264230. [CrossRef]
- Syahputri, D. (2019). The effect of multisensory teaching method on the students’ reading achievement. Budapest International Research and Critics in Linguistics and Education, 2(1), 124-131. [CrossRef]
- Tanujaya, B., Prahmana, R. C. I., & Mumu, J. (2022). Likert scale in social sciences research: Problems and difficulties. FWU Journal of Social Sciences, 16(4), 89-101. [CrossRef]
- Thakur, N., & Sulaiman, Z. K. (2024). A study on the influence of social media on forming the social skills among adolescents. Tuijin Jishu/Journal of Propulsion Technology, 45(4), 554-570. [CrossRef]
- Thangavel, S., Sharmila, K., & Sufina, K. (2025). Revolutionizing education through augmented reality (AR) and virtual reality (VR): Innovations, challenges and future prospects. Asian Journal of Interdisciplinary Research, 8(1), 1-28. [CrossRef]
- Thanya, R. (2025). AR vs. VR in education: A comparative study of their impact on academic learning. Bodhi International Journal of Research in Humanities, Arts and Science, 9(2), 81-88.
- The sword of damocles (virtual reality). (2024, April 1). In Wikipedia. https://en.wikipedia.org/wiki/The_Sword_of_Damocles_(virtual_reality).
- Theodorio, A. O., Waghid, Z., & Wambua, A. (2024). Technology integration in teacher education: challenges and adaptations in the post-pandemic era. Discover Education, 3(1), 242. [CrossRef]
- Tiede, J., Grafe, S., & Mangina, E. (2022, May 30-June 4). Teachers’ attitudes and technology acceptance towards AR apps for teaching and learning. In 2022 8th International Conference of the Immersive Learning Research Network (iLRN), Vienna, Austria, (pp. 1-8). IEEE Xplore. [CrossRef]
- Tipton, E. (2013). Stratified sampling using cluster analysis: A sample selection strategy for improved generalizations from experiments. Evaluation Review, 37(2), 109-139. [CrossRef]
- Tondeur, J., Van-de Velde, S., Vermeersch, H., & Van-Houtte, M. (2016). Gender differences in the ICT profile of University students: a quantitative analysis. Journal of Diversity and Gender Studies, 3(1), 57–77. [CrossRef]
- Tripathy, M. K., & Panda, B. N. (2021). Adaptability and awareness of augmented reality in teacher education. Educational Quest: An Int. J. of Education and Applied Social Sciences, 12(2), 107-114. [CrossRef]
- Turan, Z., Meral, E., & Sahin, I. F. (2018). The impact of mobile augmented reality in geography education: achievements, cognitive loads, and university students' views. Journal of Geography in Higher Education, 42(3), 427-441. [CrossRef]
- Turhan, M. E., Metin, M., & Çevik, E. E. (2022). A content analysis of studies published in the field of augmented reality in education. Journal of Educational Technology and Online Learning, 5(1), 243–262. [CrossRef]
- Tzima, S., Styliaras, G., & Bassounas, A. (2019). Augmented reality applications in education: Teachers point of view. Education Sciences, 9(2), 99. [CrossRef]
- Uderbayeva, N., Karelkhan, N., Zharlykassov, B., Radchenko, T., & Imanova, A. (2025). Developing future teachers’ competences in IT and robotics using virtual and augmented reality: A study of teaching effectiveness. Journal of Technical Education and Training, 17(1), 119-132. [CrossRef]
- Uygur, M., Yelken, T. Y., & Akay, C. (2018). Analyzing the views of pre-service teachers on the use of augmented reality applications in education. European Journal of Educational Research, 7(4), 849-860. [CrossRef]
- Vaida, S., & Pongracz, G. A. (2022). Mobile augmented reality applications in higher education. Educatia, 21(23), 70-76. [CrossRef]
- Ventrella, F. M., & Cotnam-Kappel, M. (2024). Examining digital capital and digital inequalities in Canadian elementary schools: Insights from teachers. Telematics and Informatics, 86, 102070. [CrossRef]
- Wadkar, S. K., Singh, K., Chakravarty, R., & Argade, S. D. (2016). Assessing the reliability of attitude scale by Cronbach’s alpha. Journal of Global Communication, 9(2), 113-117. [CrossRef]
- Wang, X., Young, G. W., Iqbal, M. Z., & Guckin, C. M. (2024). The potential of extended reality in rural education’s future–perspectives from rural educators. Education and Information Technologies, 29(7), 8987-9011. [CrossRef]
- Weng, C., Otanga, S., Christianto, S., & Chu, R. (2020). Enhancing student’s biology learning by using augmented reality as a learning supplement. Journal of Educational Computing, 58(4), 747-770. [CrossRef]
- Wijnen, F., Molen, J. W. V. D., & Voogt, J. (2023). Primary school teachers’ attitudes toward technology use and stimulating higher-order thinking in students: A review of the literature. Journal of research on technology in education, 55(4), 545-567. [CrossRef]
- Wojciechowski, R., & Cellary, W. (2013). Evaluation of learners’ attitude toward learning in ARIES augmented reality environments. Computers & Education, 68, 570-585. [CrossRef]
- Wu, H. K., Lee, S. W. Y., Chang, H. Y., & Liang, J. C. (2013). Current status, opportunities and challenges of augmented reality in education. Computers & Education, 62, 41-49. [CrossRef]
- Wyss, C., & Bäuerlein, K. (2024). Augmented reality in the classroom—mentor teachers’ attitudes and technology use. Virtual Worlds, 3(4), 572-585. [CrossRef]
- Wyss, C., Degonda, A., Buhrer, W., & Furrer, F. (2022). The impact of student characteristics for working with AR technologies in higher education-findings from an exploratory study with Microsoft HoloLens. MDPI, 13, 112. [CrossRef]
- Yaneva, V., Clauser, B. E., Morales, A., & Paniagua, M. (2022). Assessing the validity of test scores using response process data from an eye-tracking study: a new approach. Advances in Health Sciences Education, 27(5), 1401-1422. [CrossRef]
- Youm, S., Jung, N., & Go, S. (2024). GPS-induced disparity correction for accurate object placement in augmented reality. Applied Sciences, 14(7), 2849. [CrossRef]
- Zhu, G., & Chen, M. (2022). Positioning preservice teachers’ reflections and I-positions in the context of teaching practicum: A dialogical-self theory approach. Teaching and Teacher Education, 117, 103734. [CrossRef]
- Zuo, R., Wenling, L., & Xuemei, Z. (2025). Augmented reality and student motivation: A systematic review (2013-2024). Journal of Computers for Science and Mathematics Learning, 2(1), 38-52. [CrossRef]
- Zuo, T., Hu, J., Spek, E. V., & Birk, M. (2024). Understanding the effect of fantasy in augmented reality game-based learning from a player journey perspective. In CHCHI '23: proceedings of the eleventh international symposium of Chinese CHI (pp. 55-60). Association for Computing Machinery, Inc. [CrossRef]
Figure 2.
Teachers’ perception level on augmented reality applications (ARA).
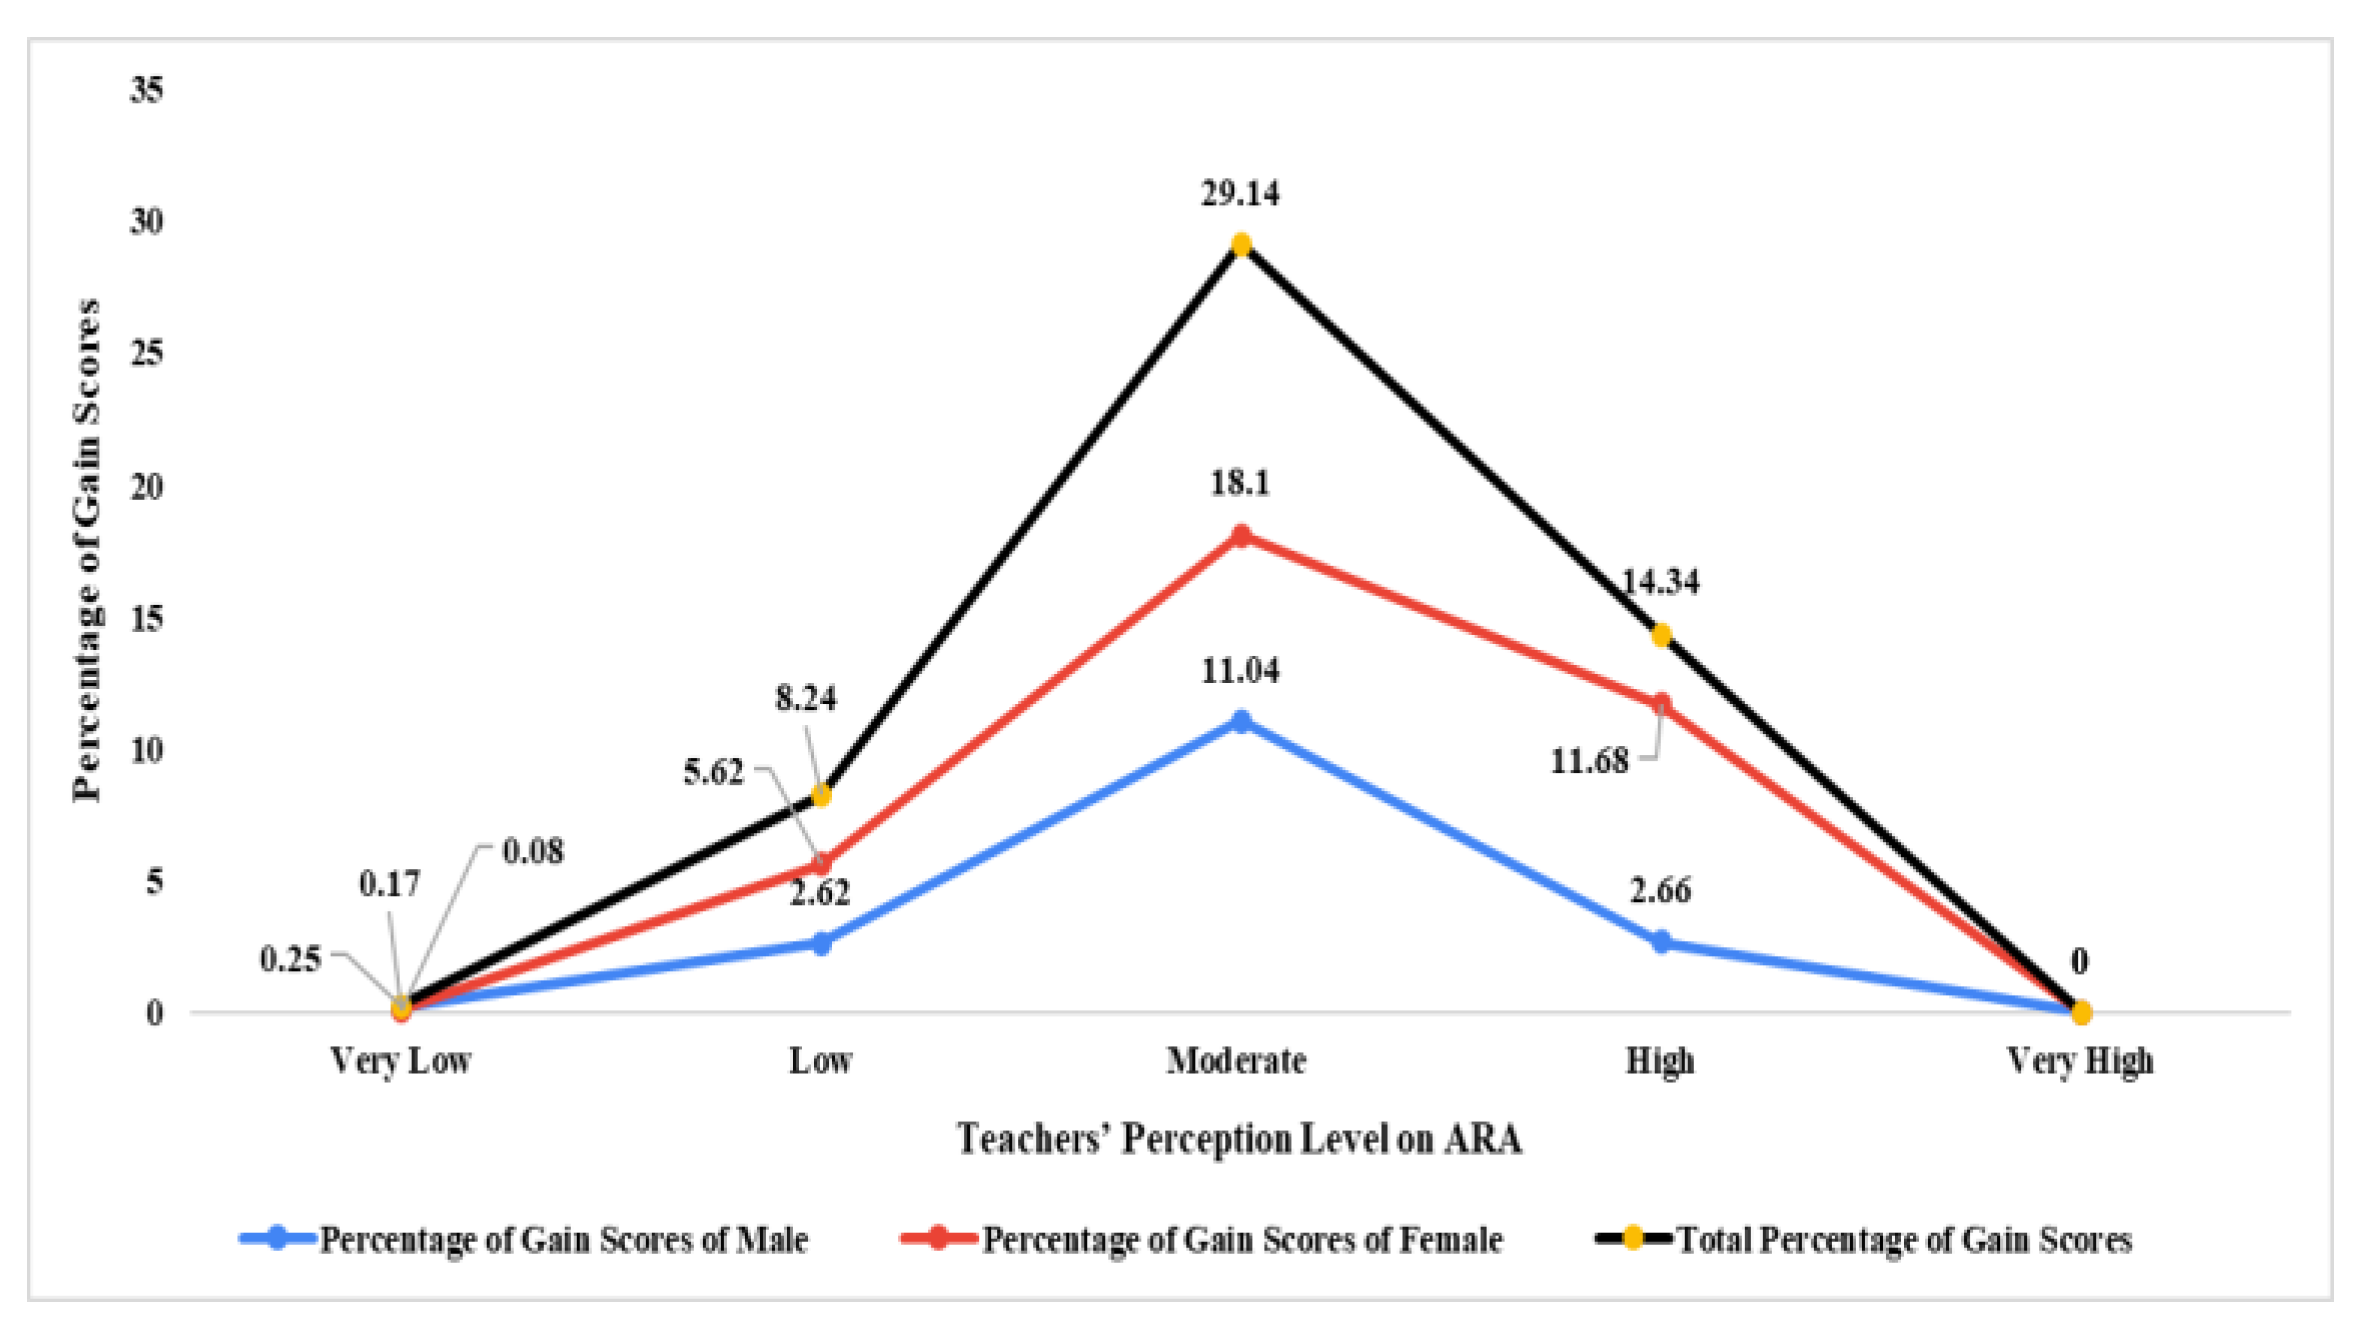
Figure 3.
Chi-square distribution of teachers’ perception towards ARA based on gender.
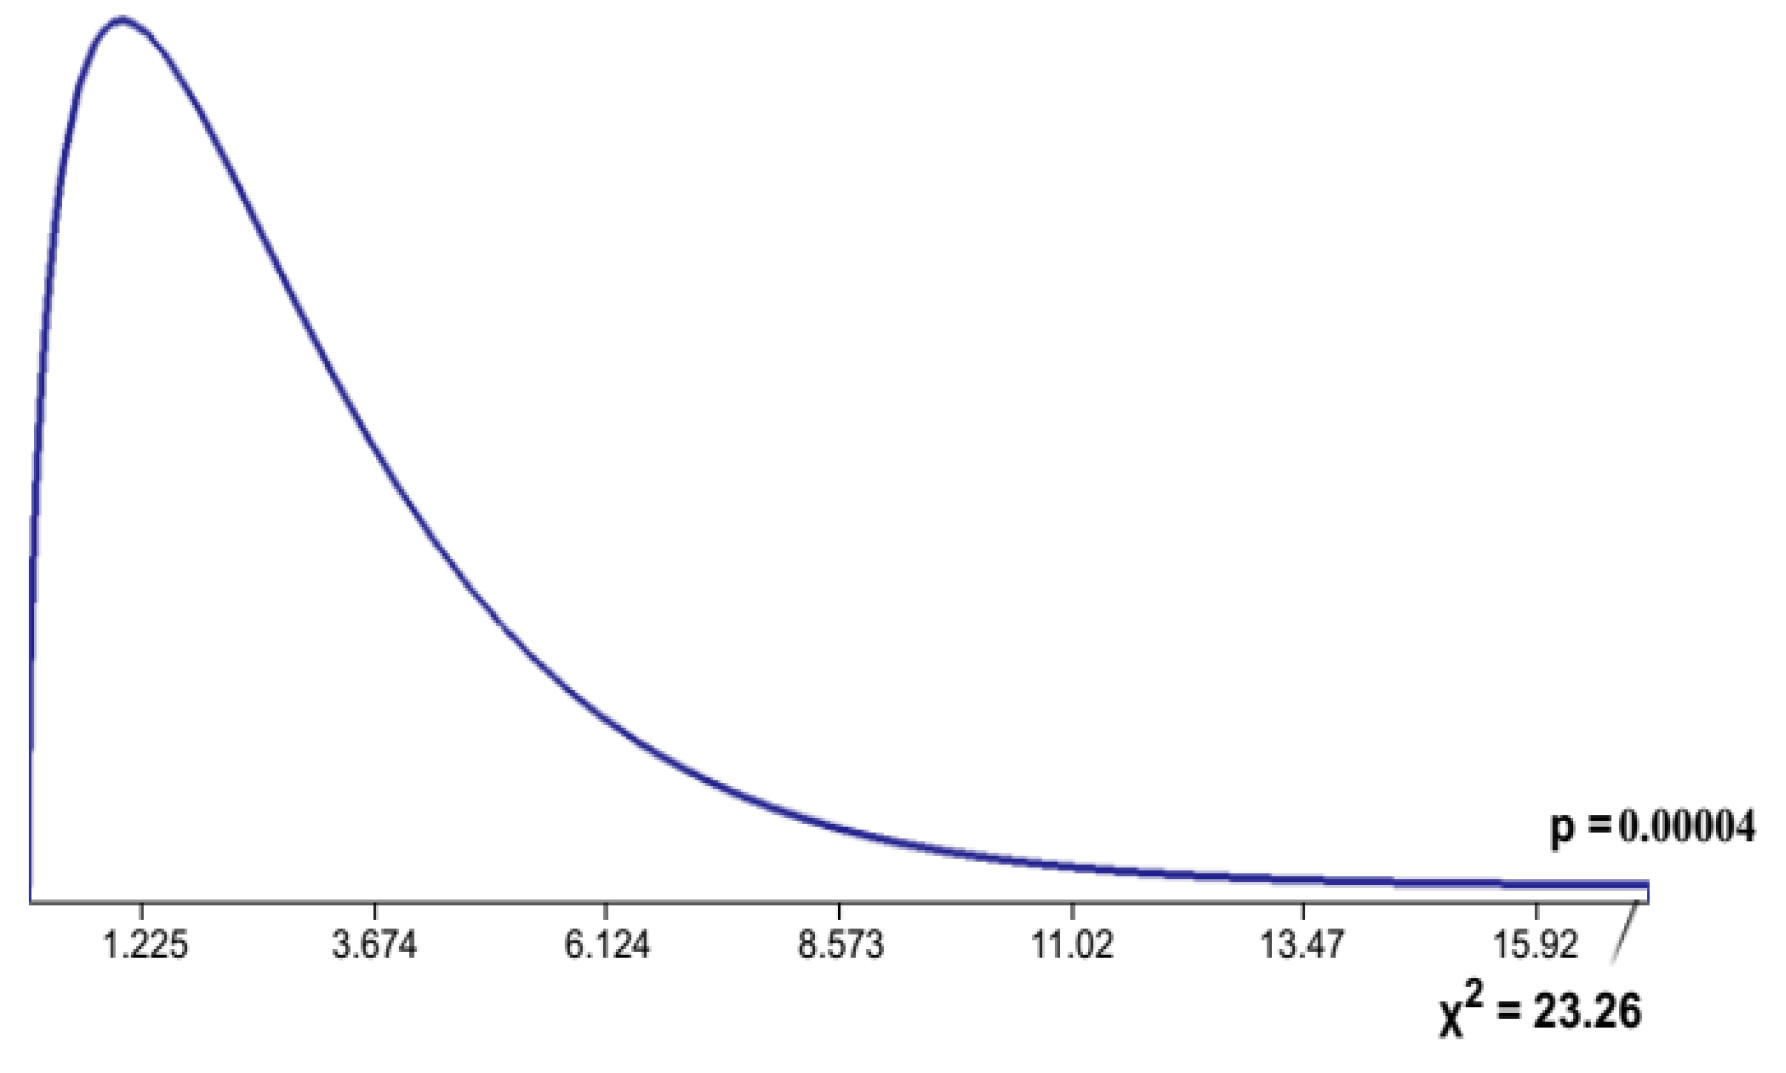
Figure 4.
Location of school wise Chi-square analysis of teachers’ perception regarding ARA.
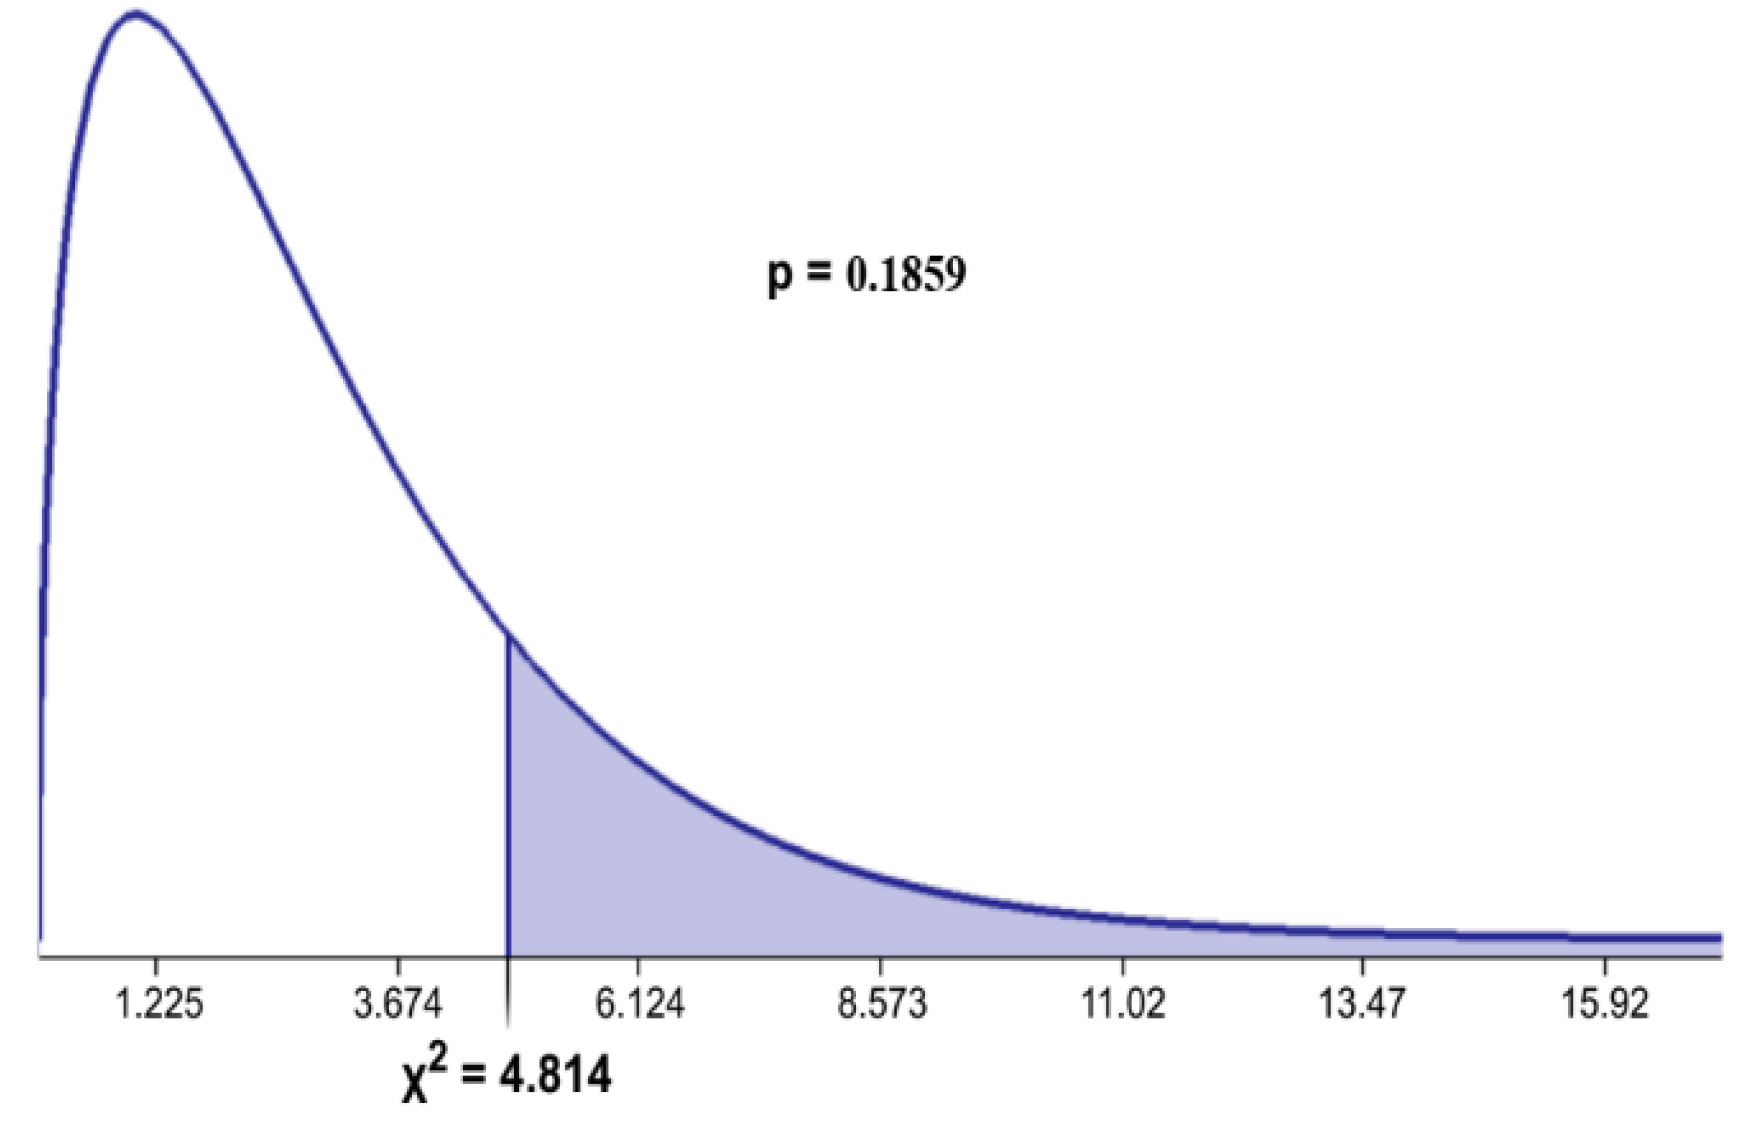
Figure 5.
Chi-square distribution of teachers’ perception towards ARA based on Category of School.
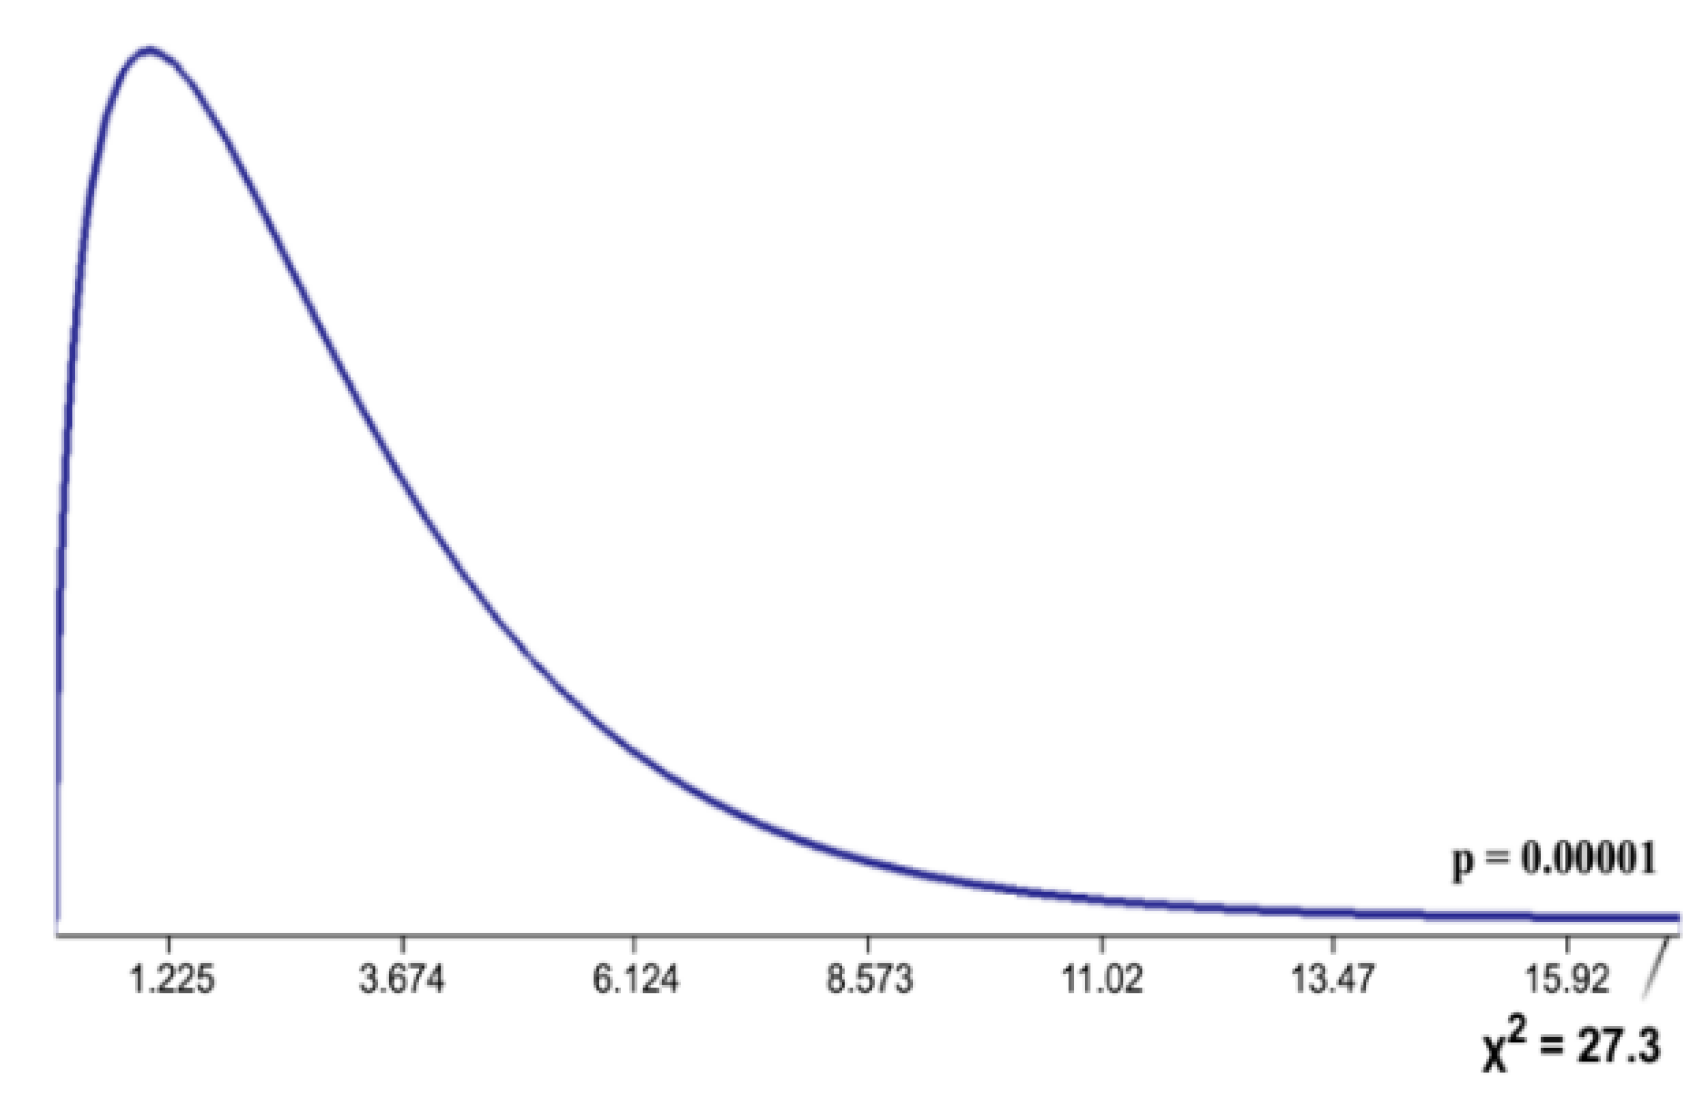
Figure 6.
Chi-square distribution based on stream of teachers’ perception towards ARA.
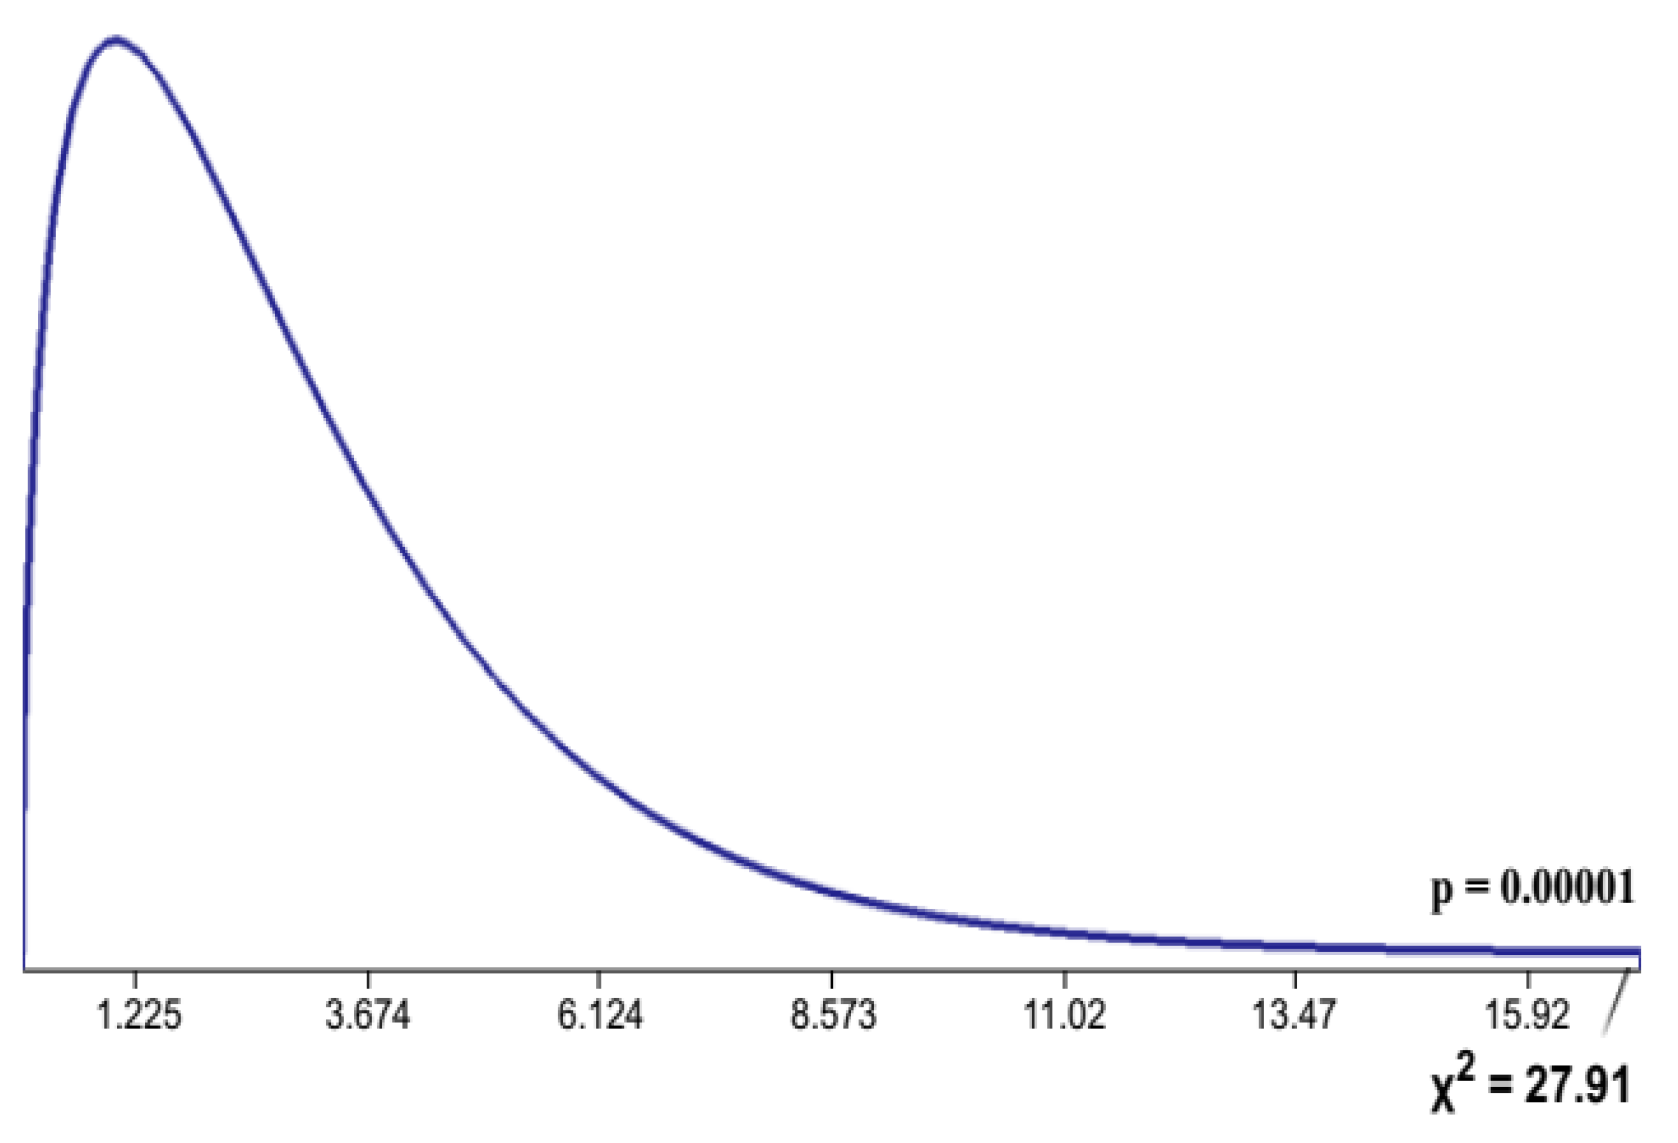
Figure 7.
Teachers’ perception on ARA using Chi-square distribution across qualification.
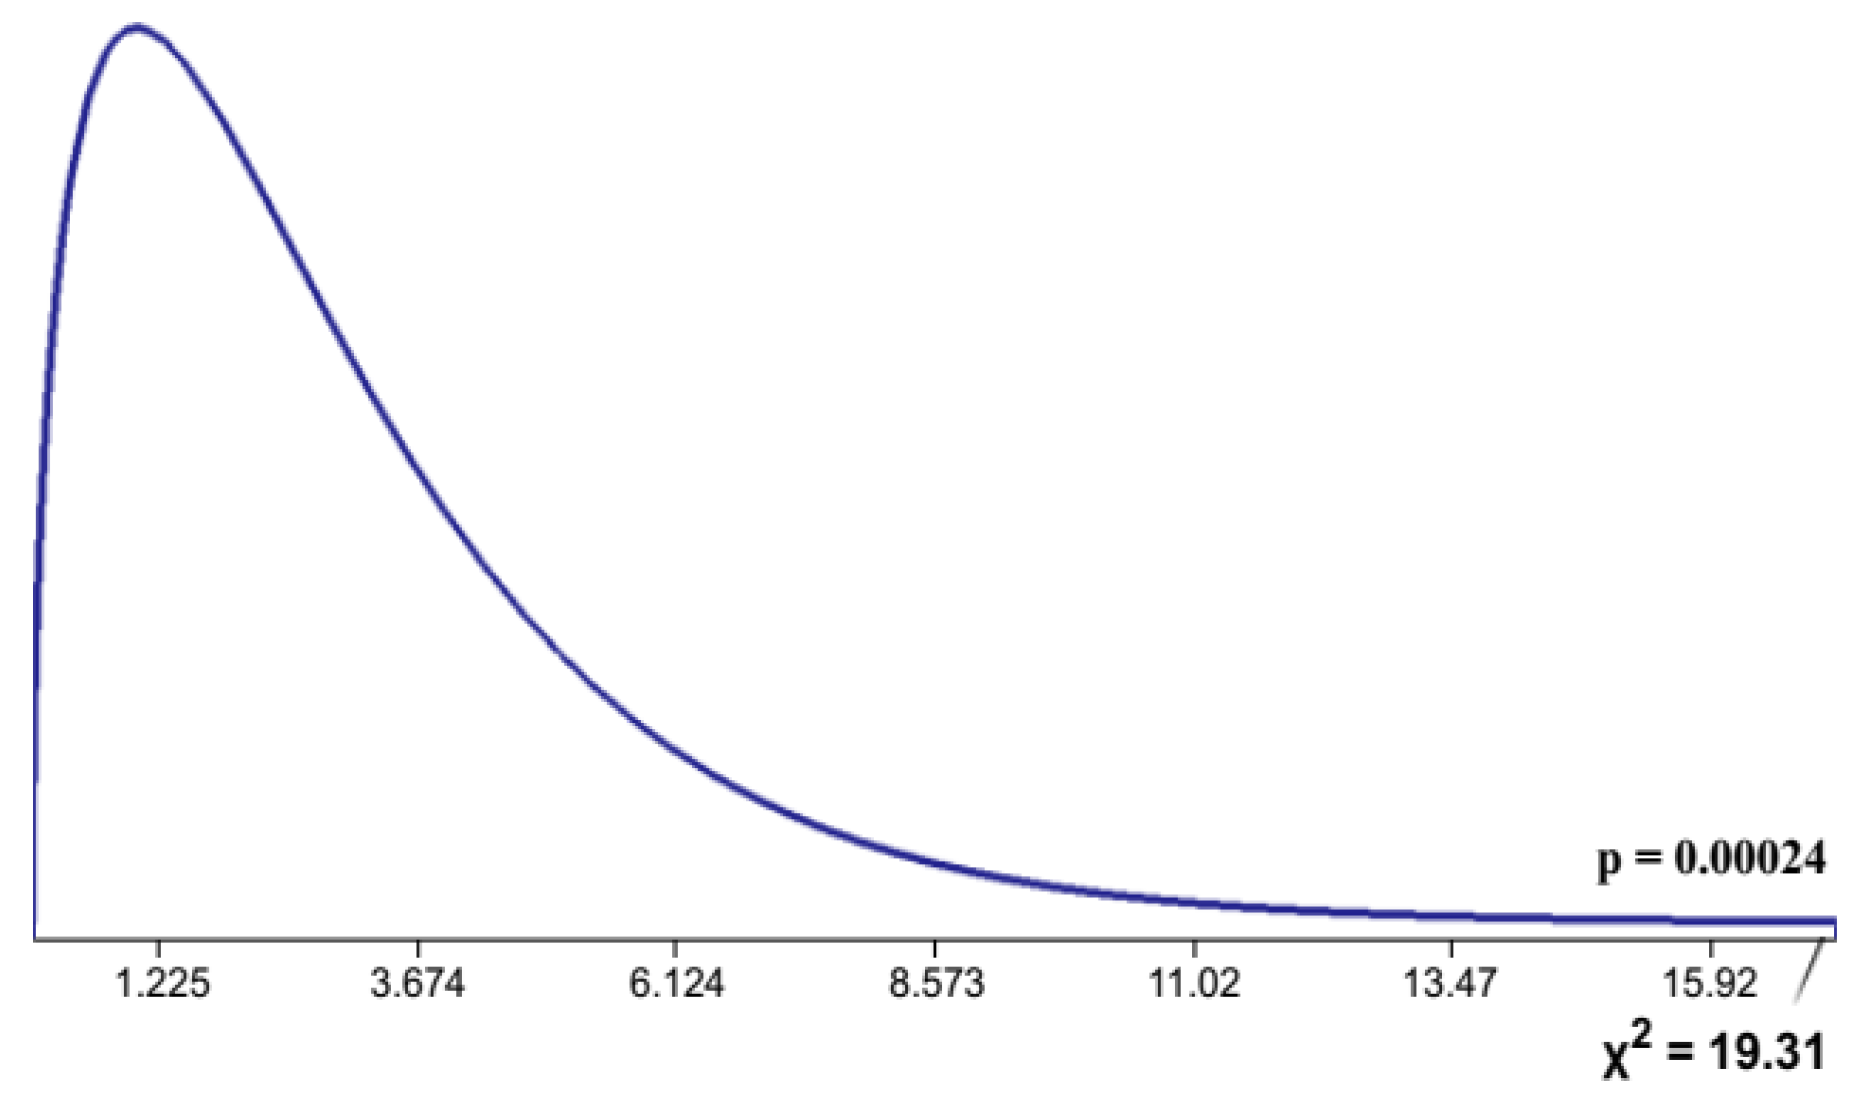
Figure 10.
Gender-wise t-test analysis of teachers’ perception towards ARA.
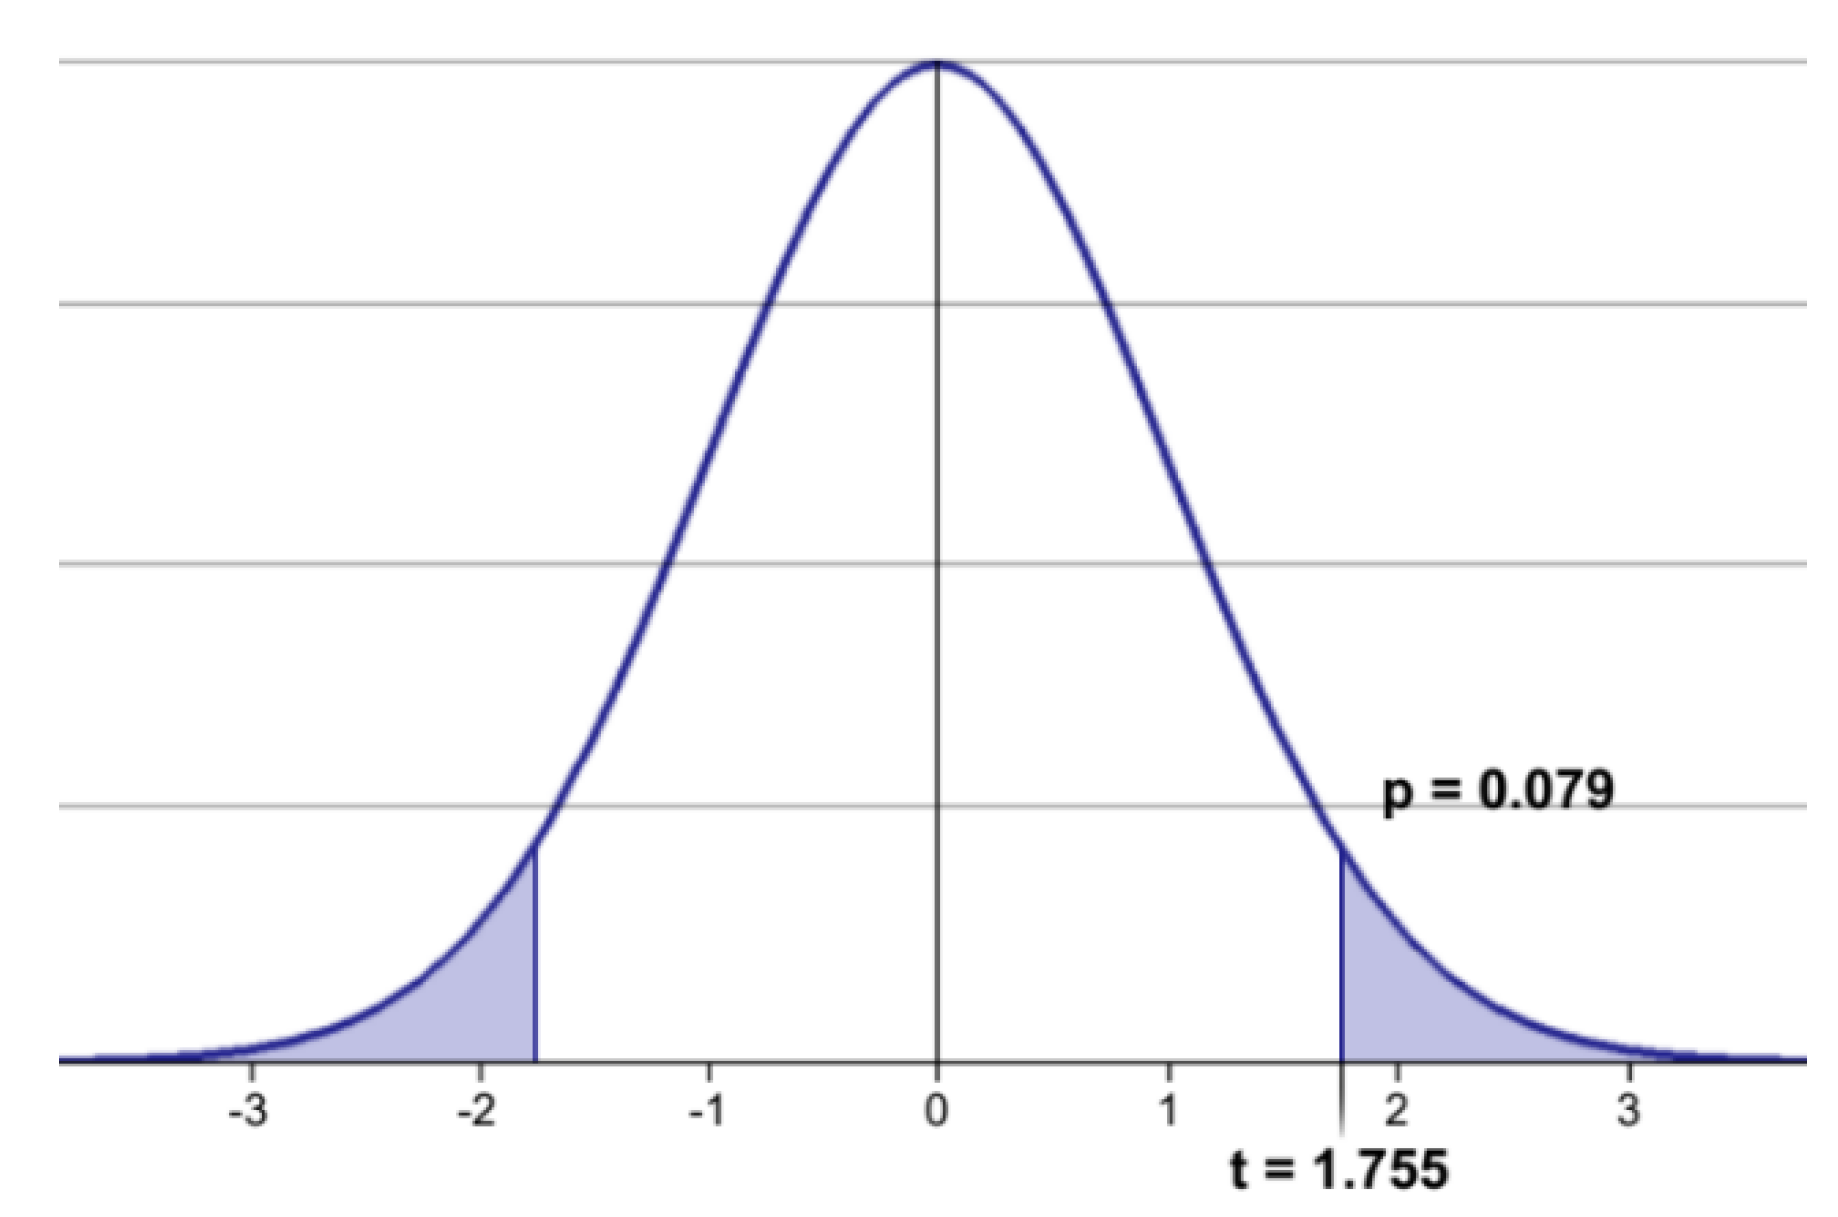
Figure 11.
Teachers’ perception on ARA by location using t-test.
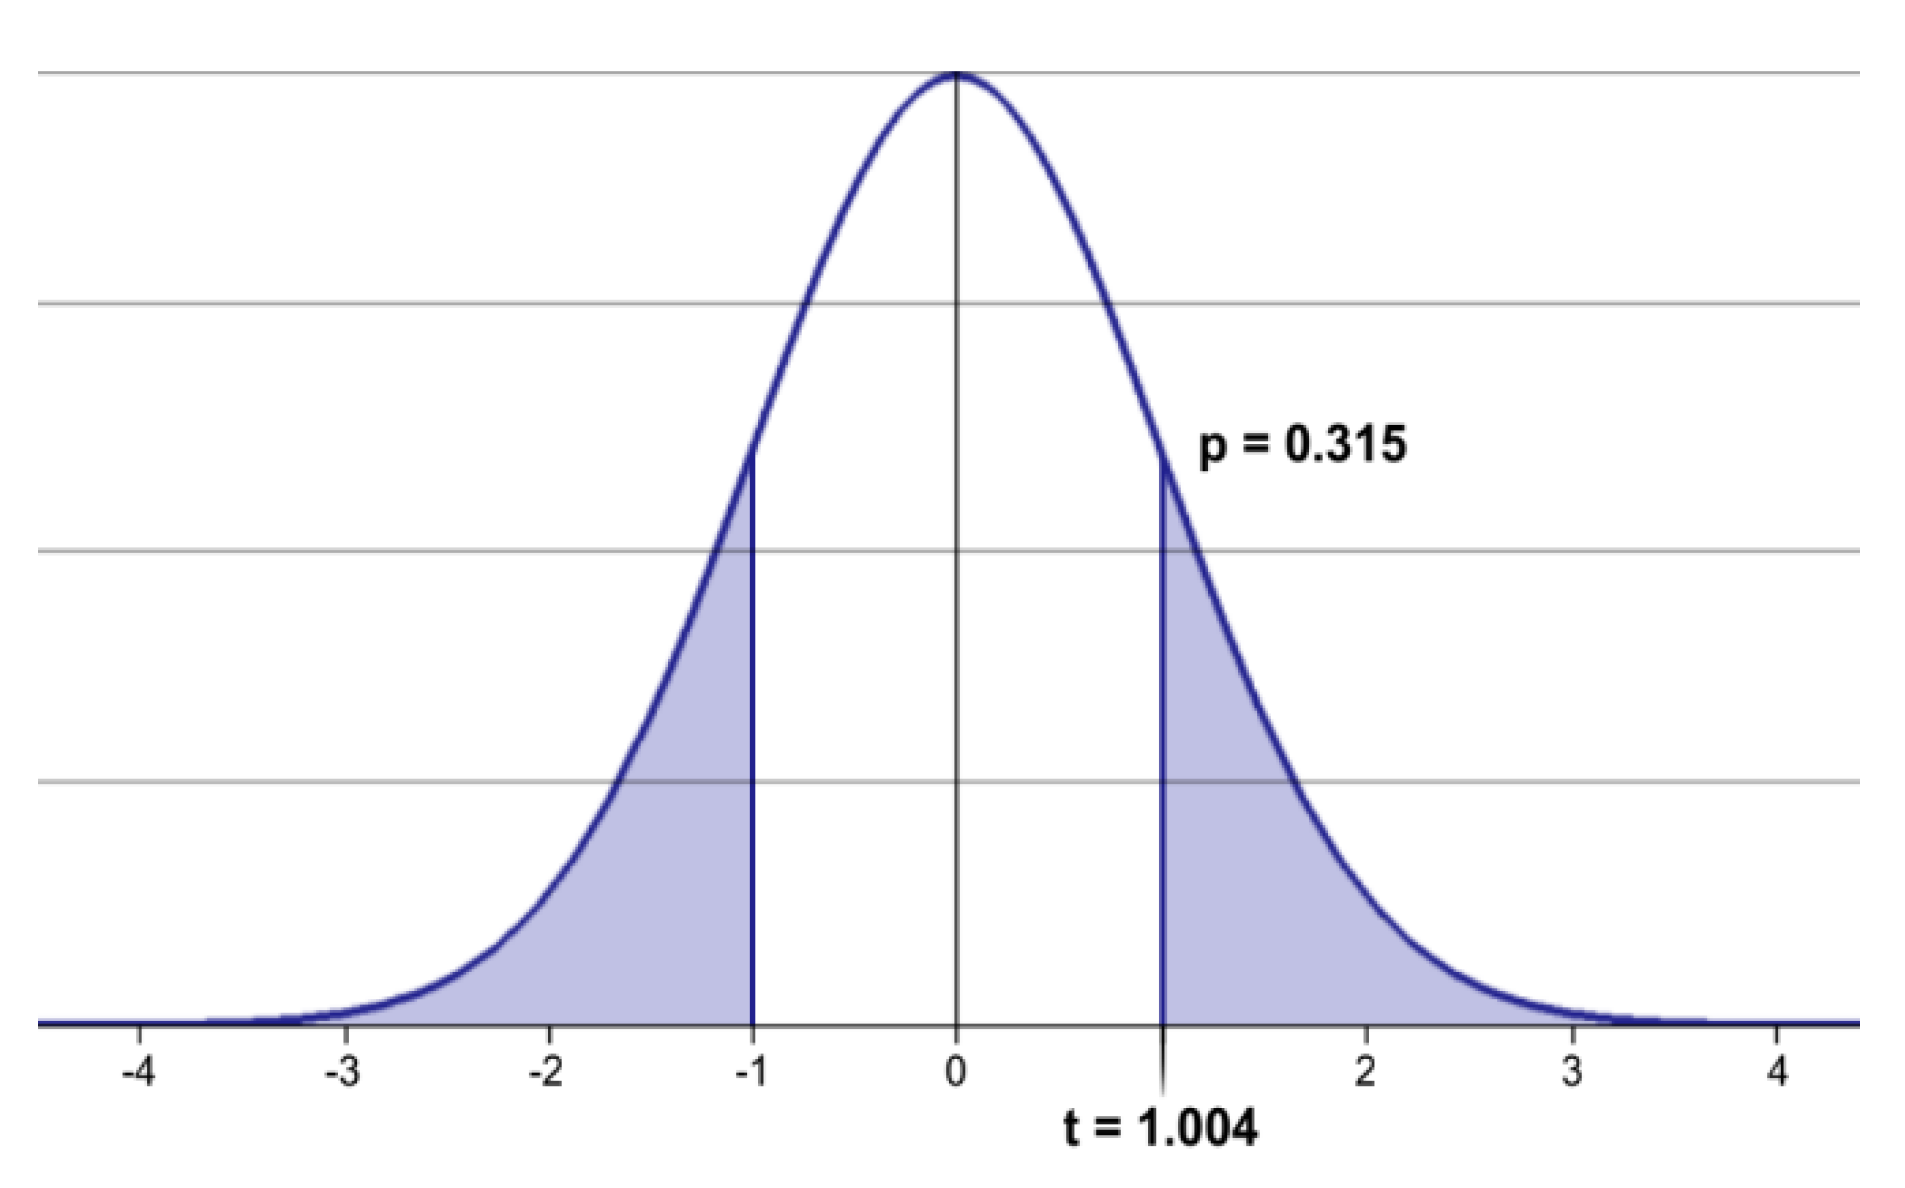
Figure 12.
Teachers’ perception on ARA through t-test by type of organisation.
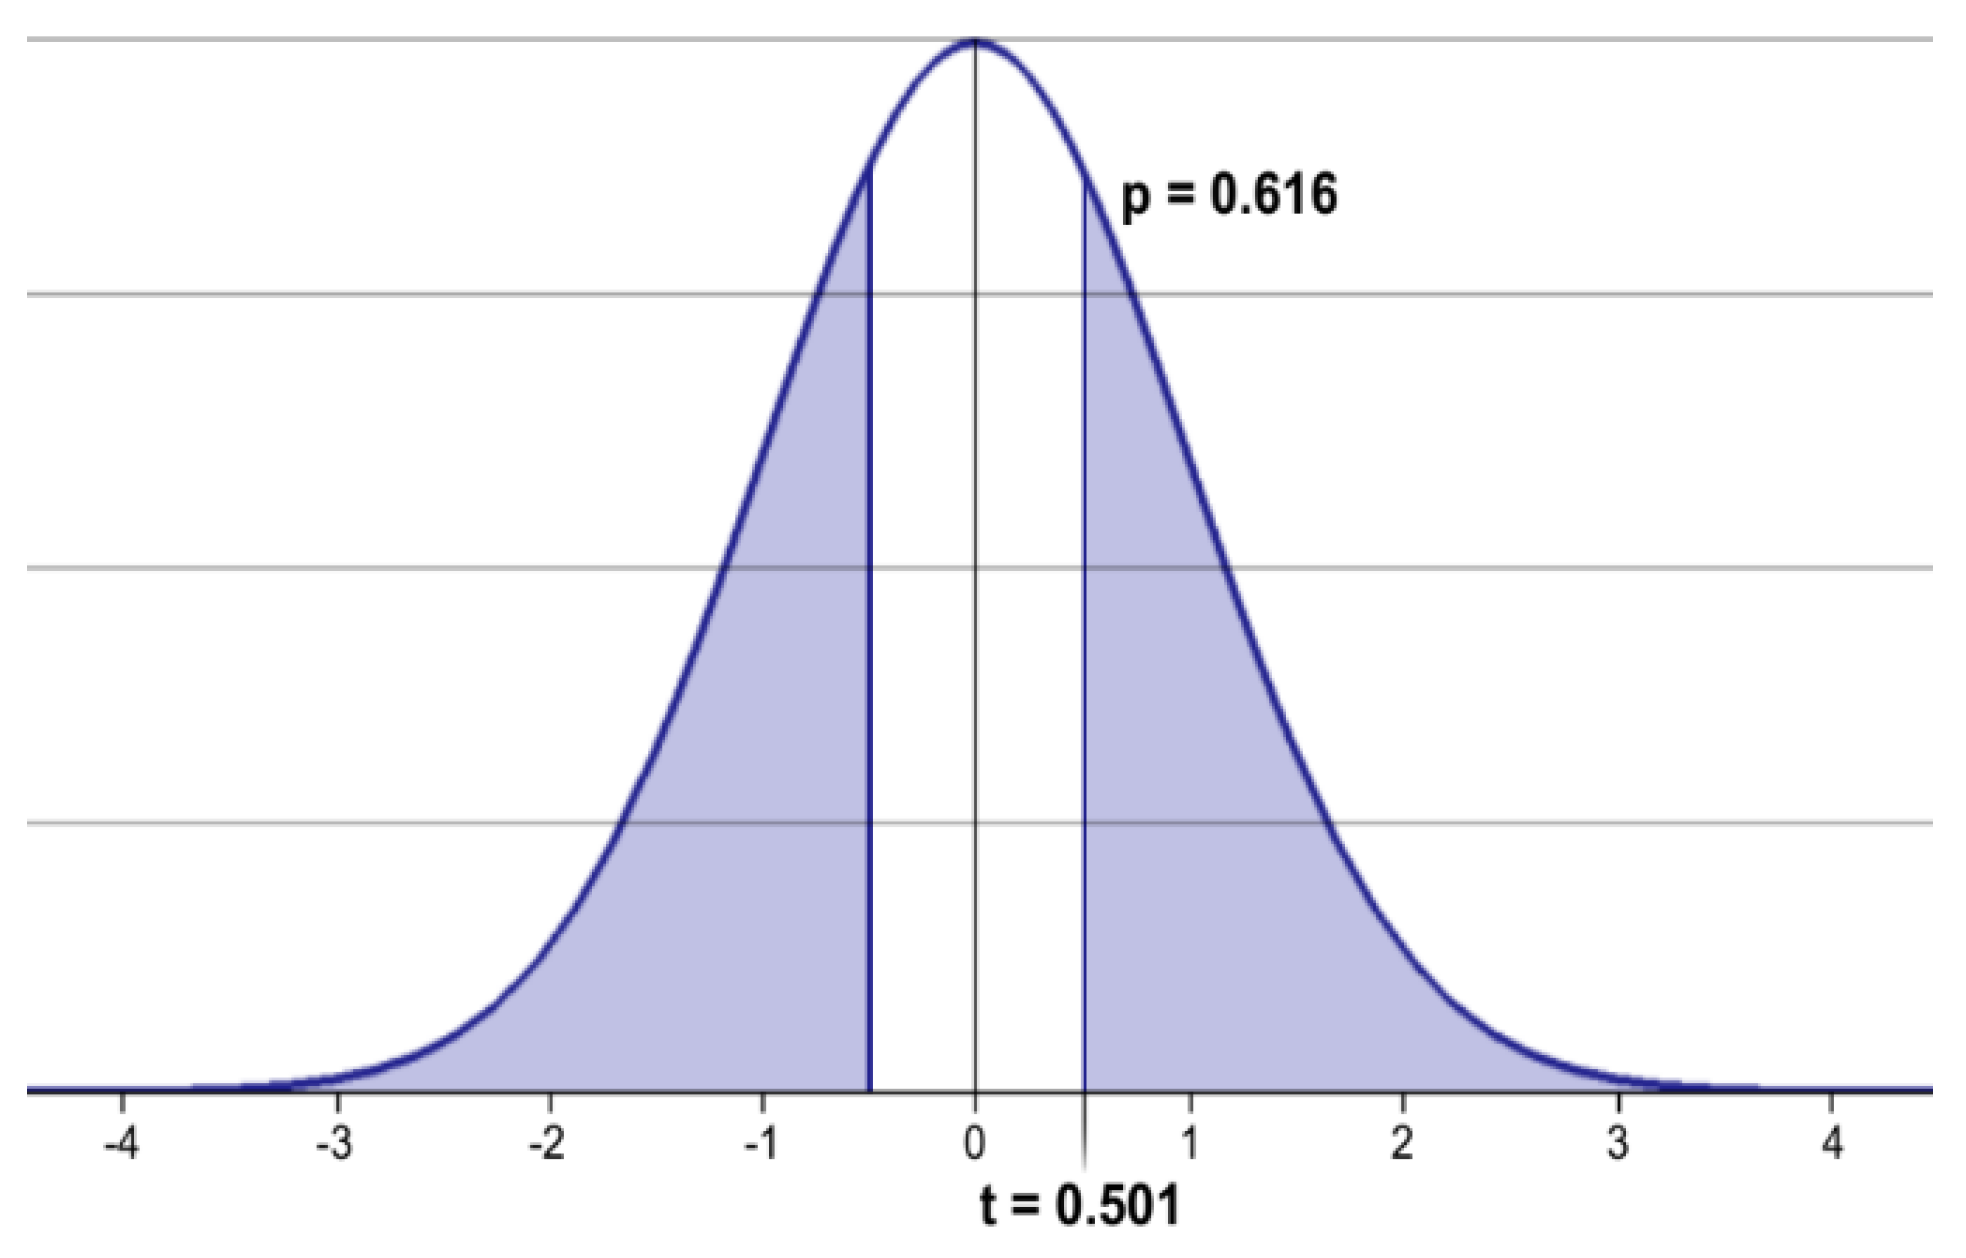
Figure 13.
Academic stream wise t-test of teachers’ perception towards ARA.
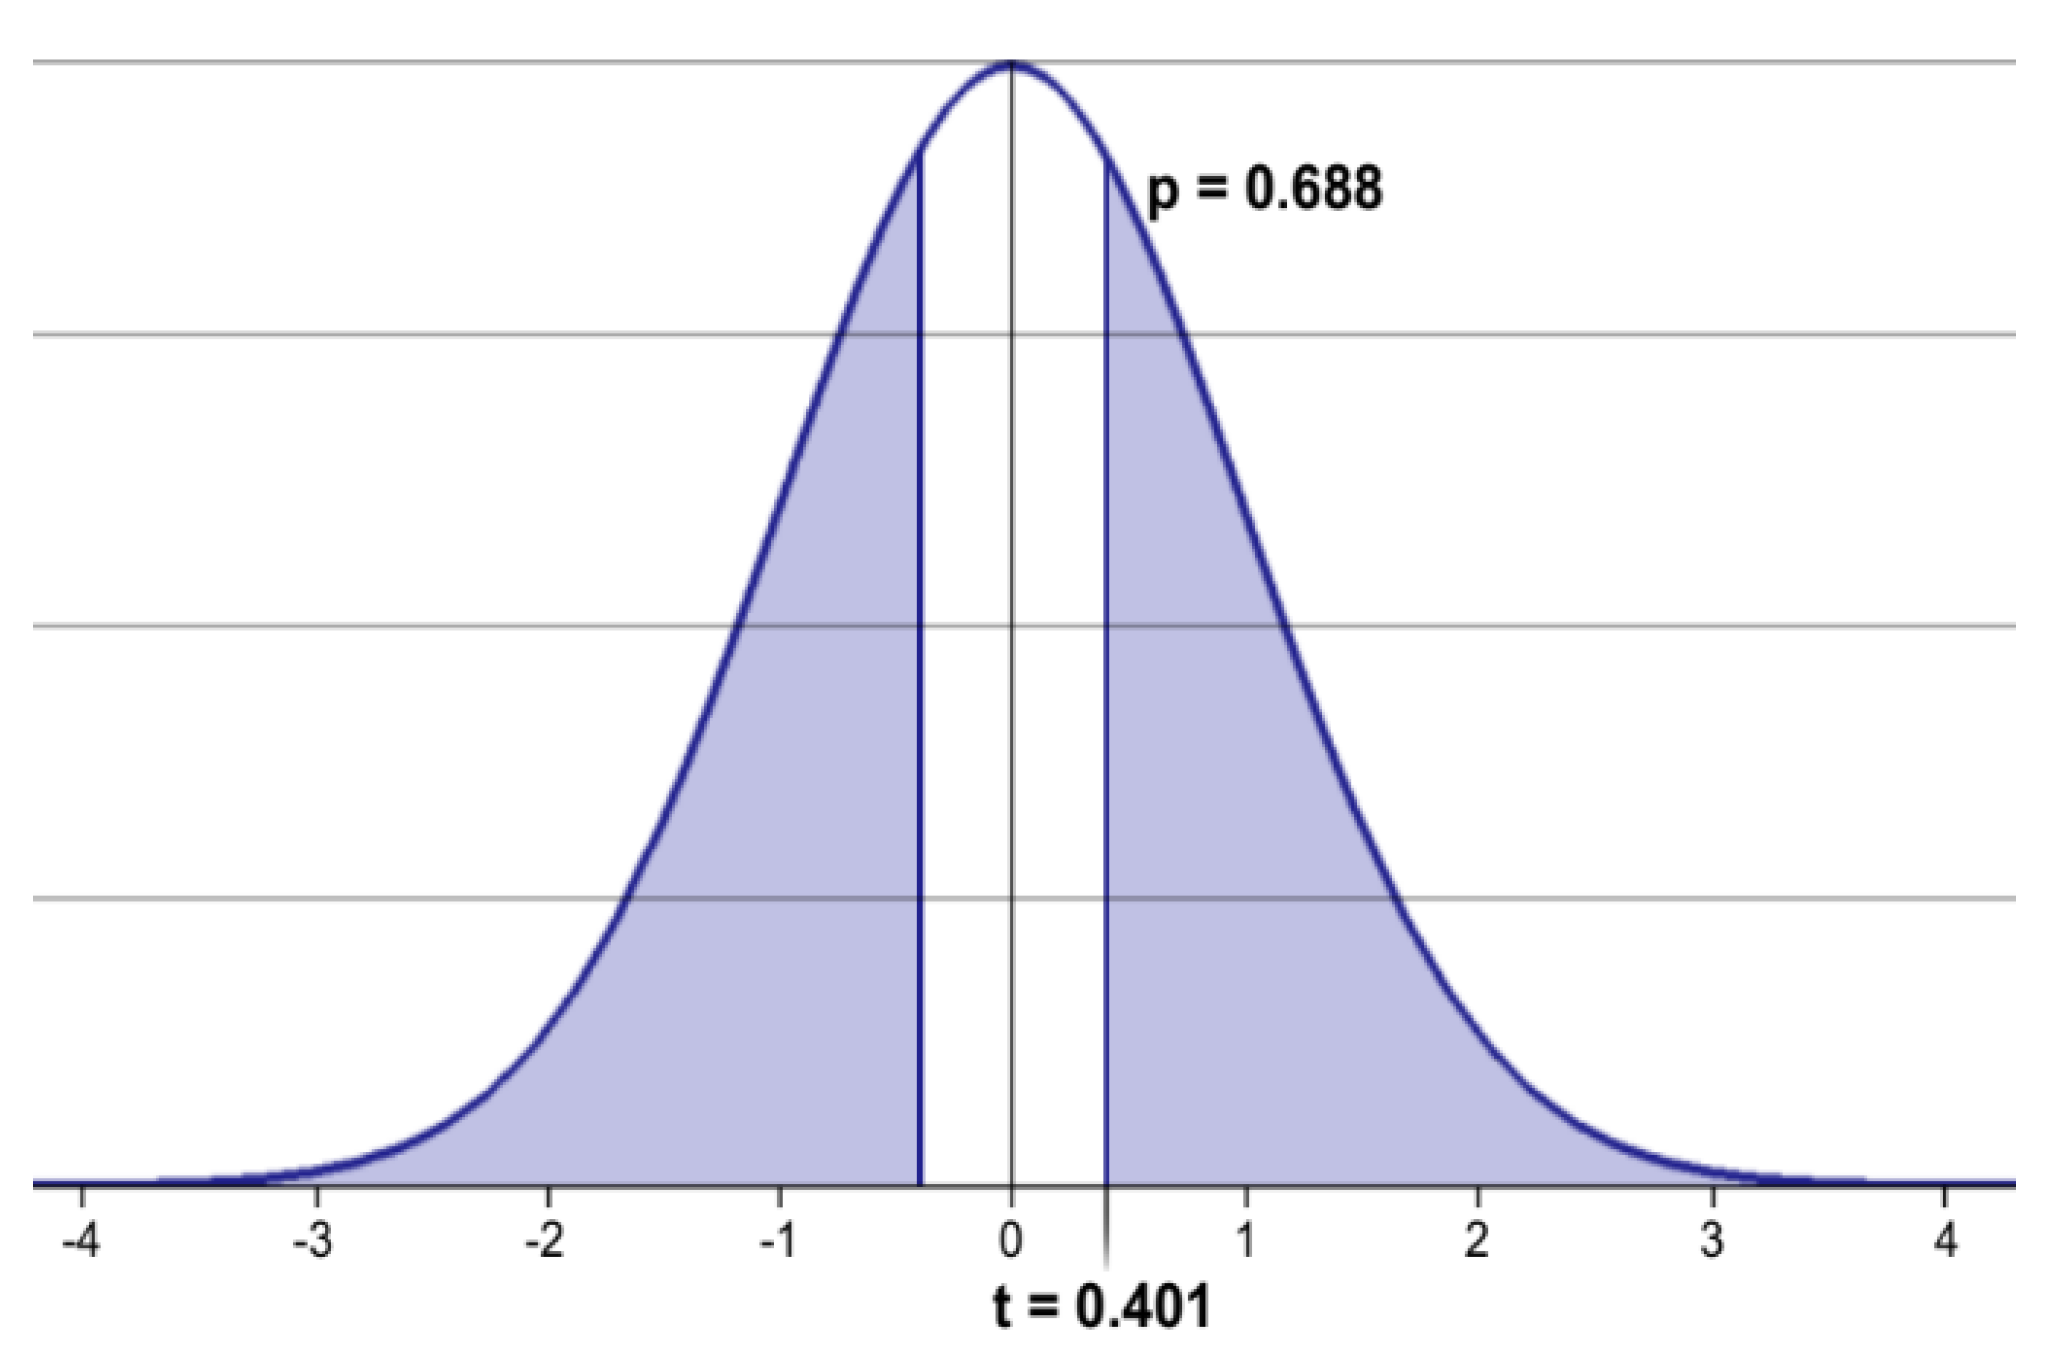
Figure 14.
Teachers’ perception on ARA through t-test by designation.
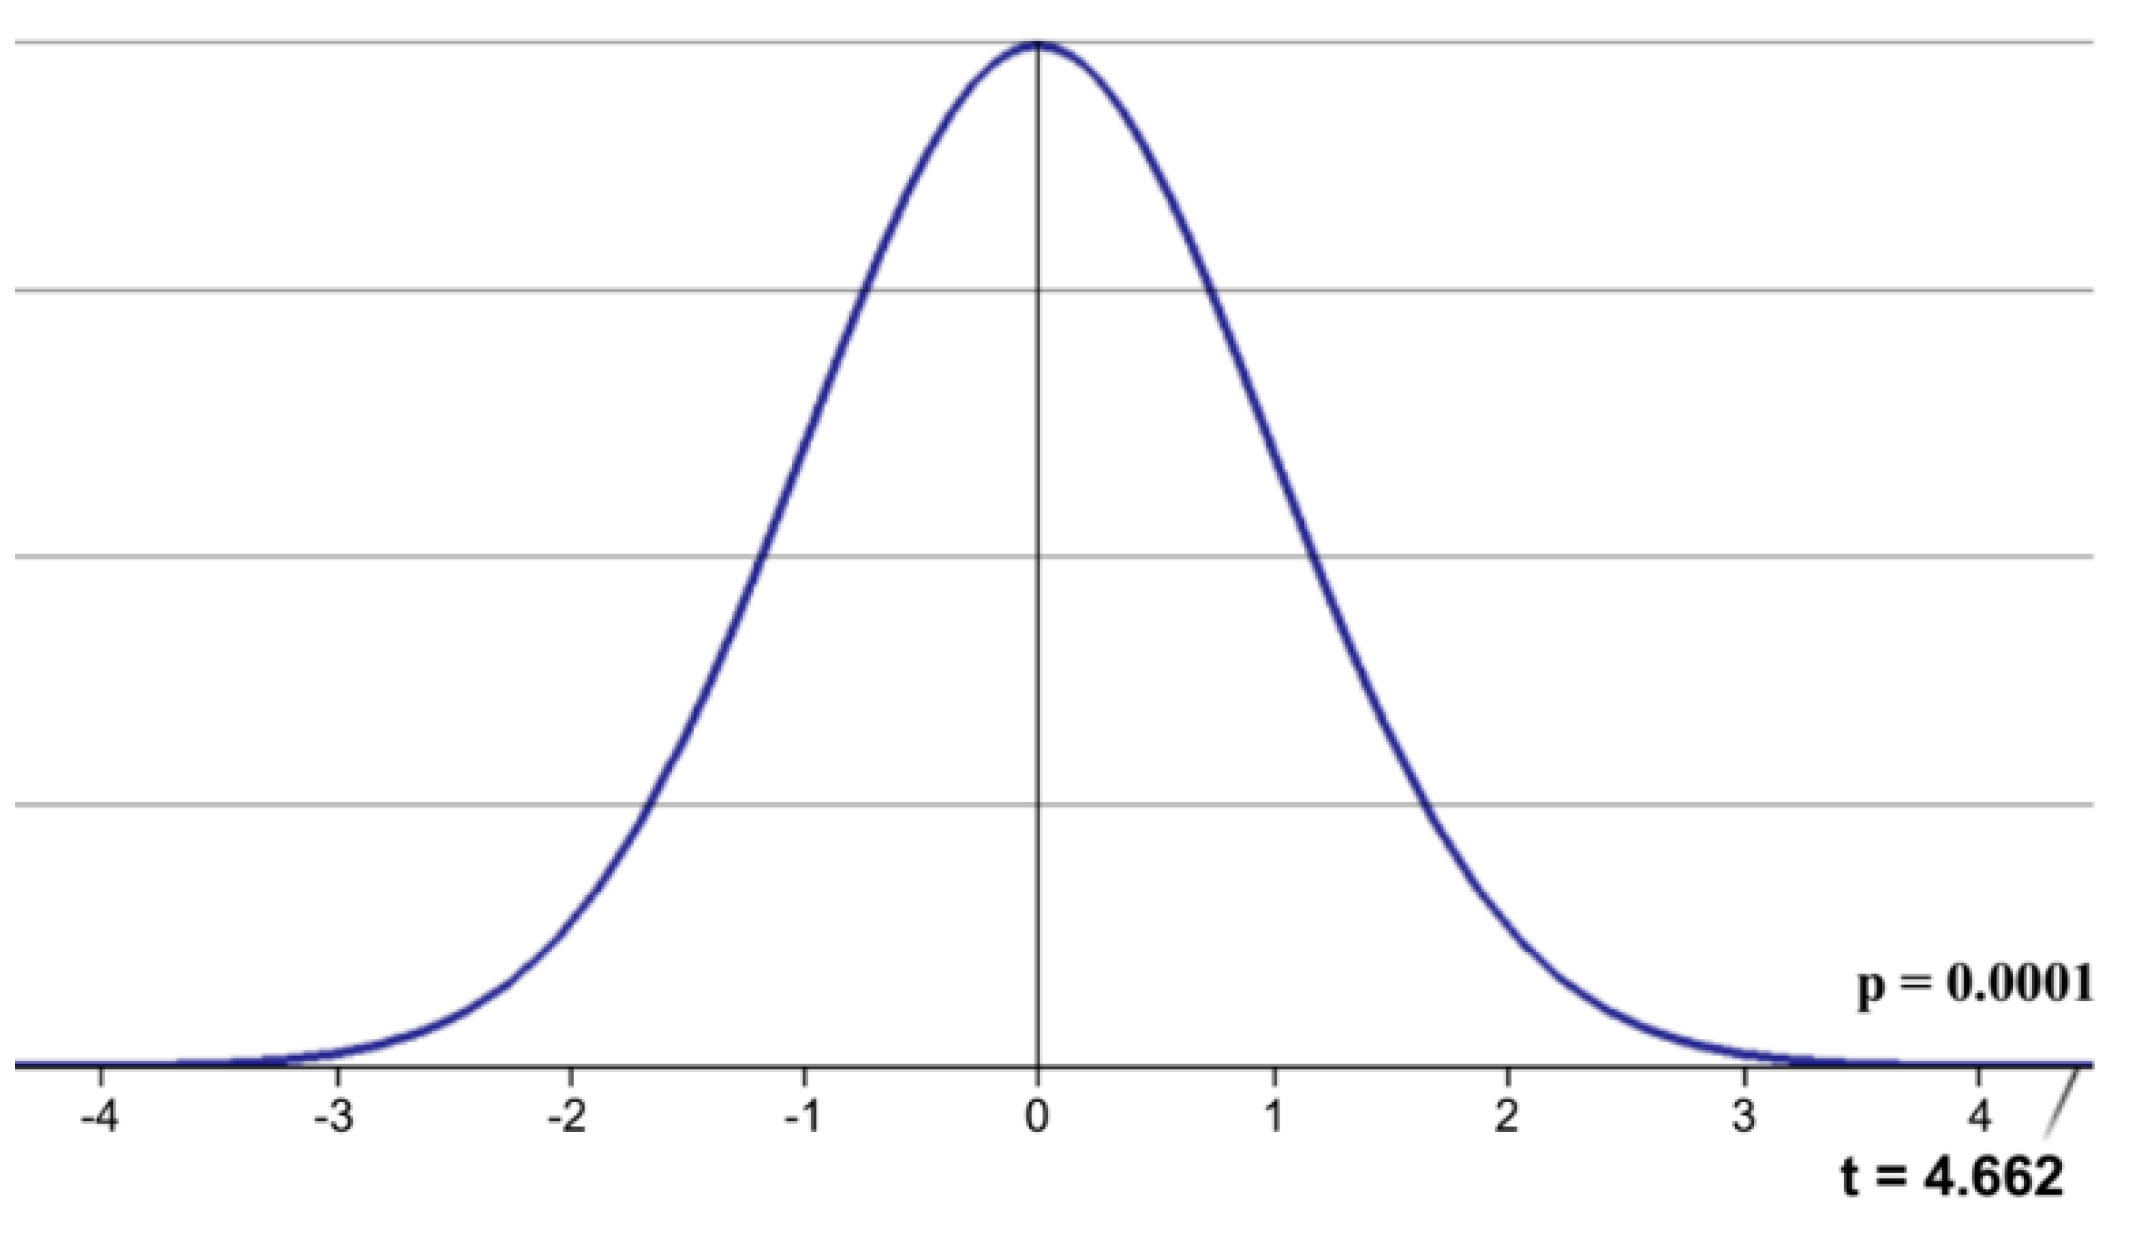
Figure 15.
Teachers’ perception on ARA through t-test by experience.
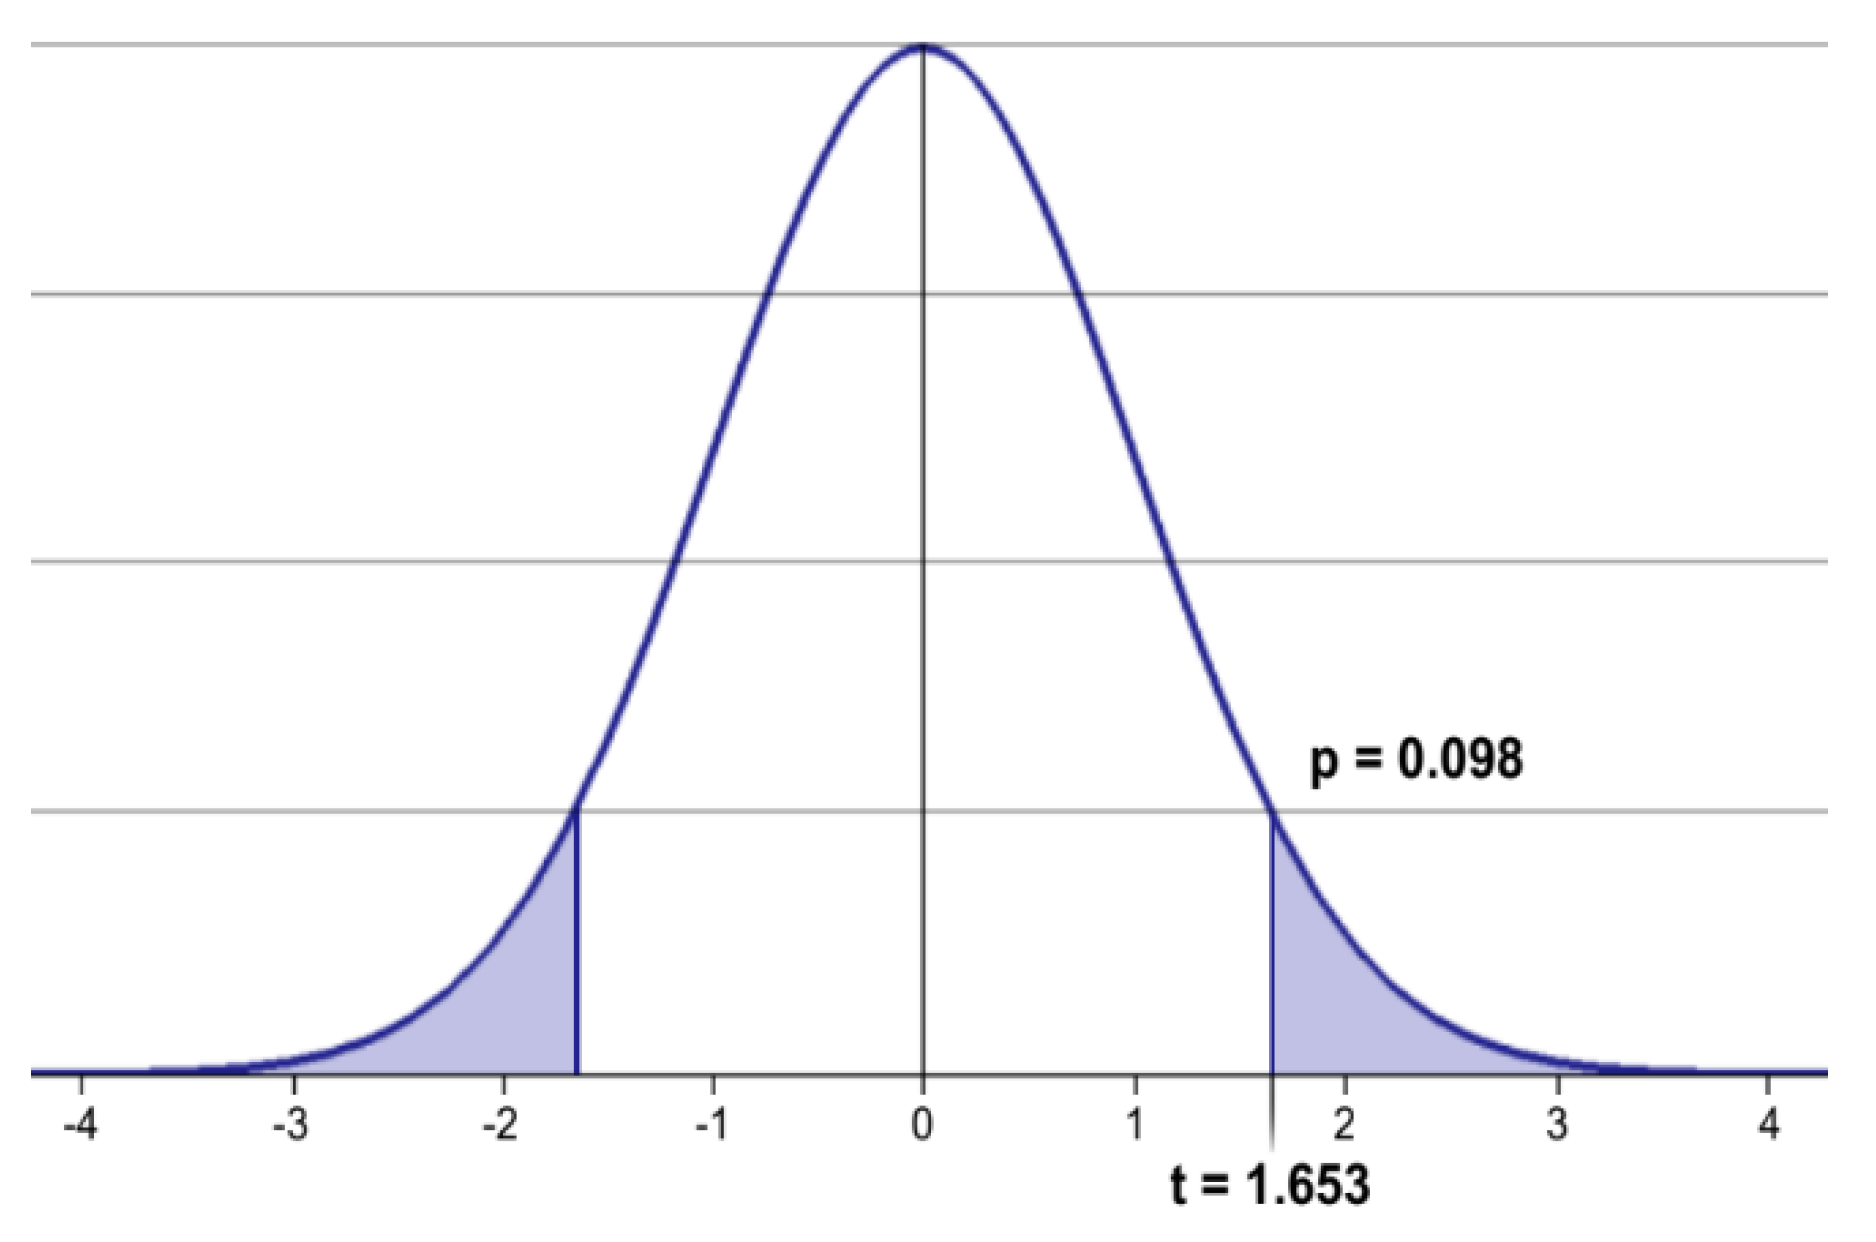
Figure 16.
Teachers’ attitudes level on augmented reality applications (ARA).
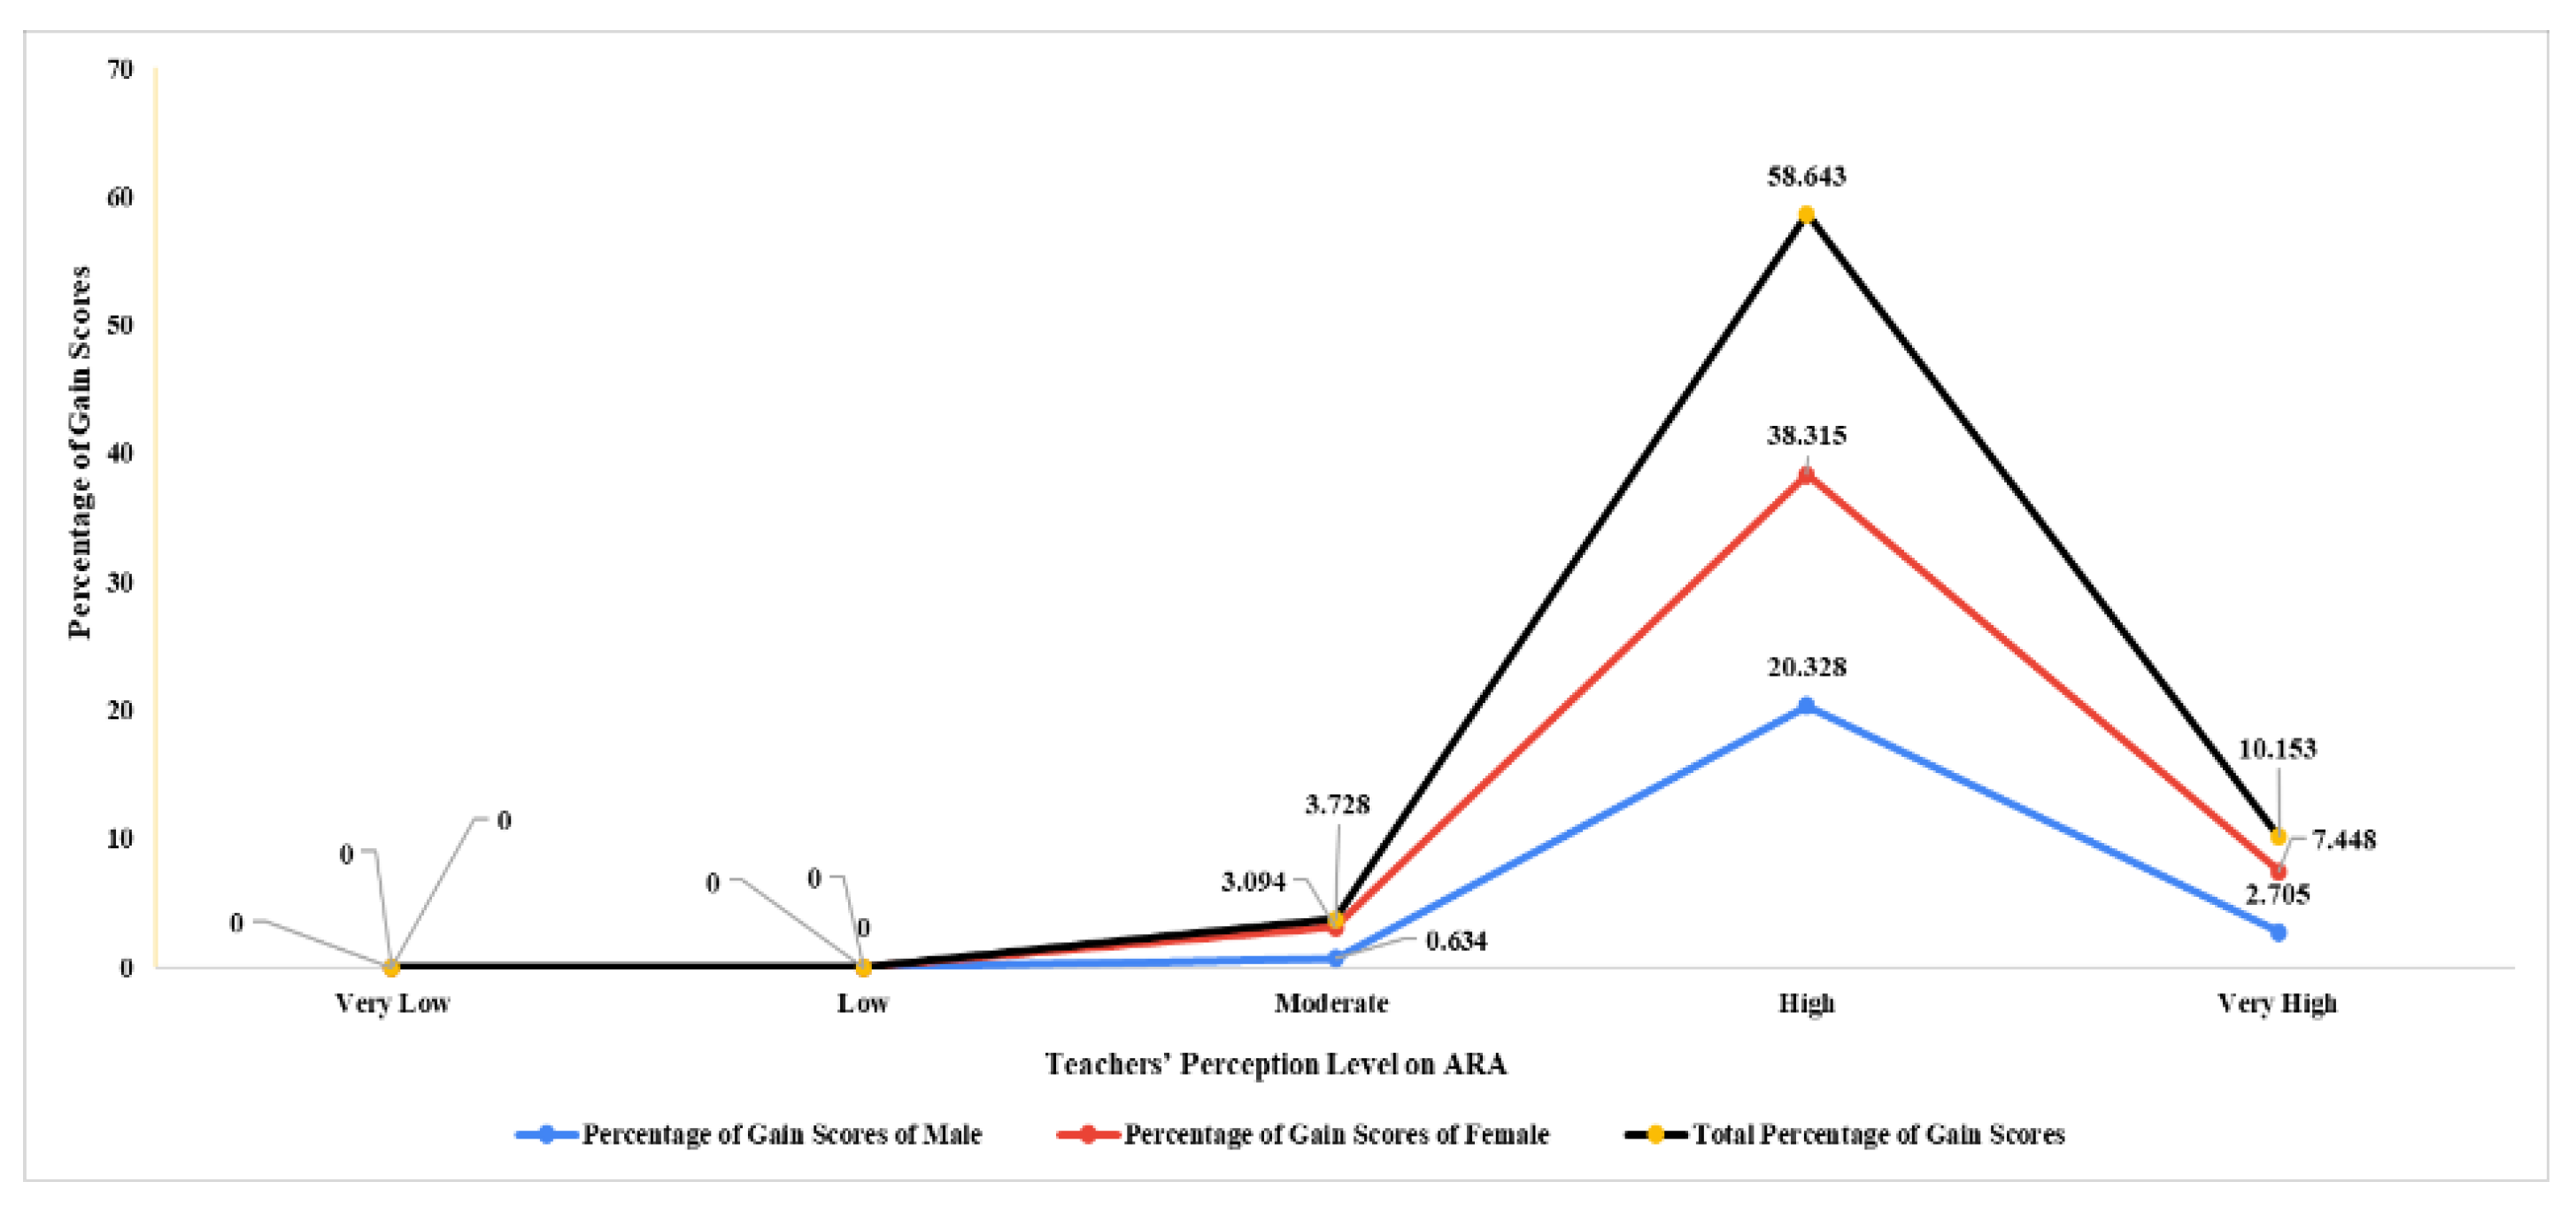
Figure 17.
Chi-square and p-values of various variables of teachers’ attitudes towards ARA.
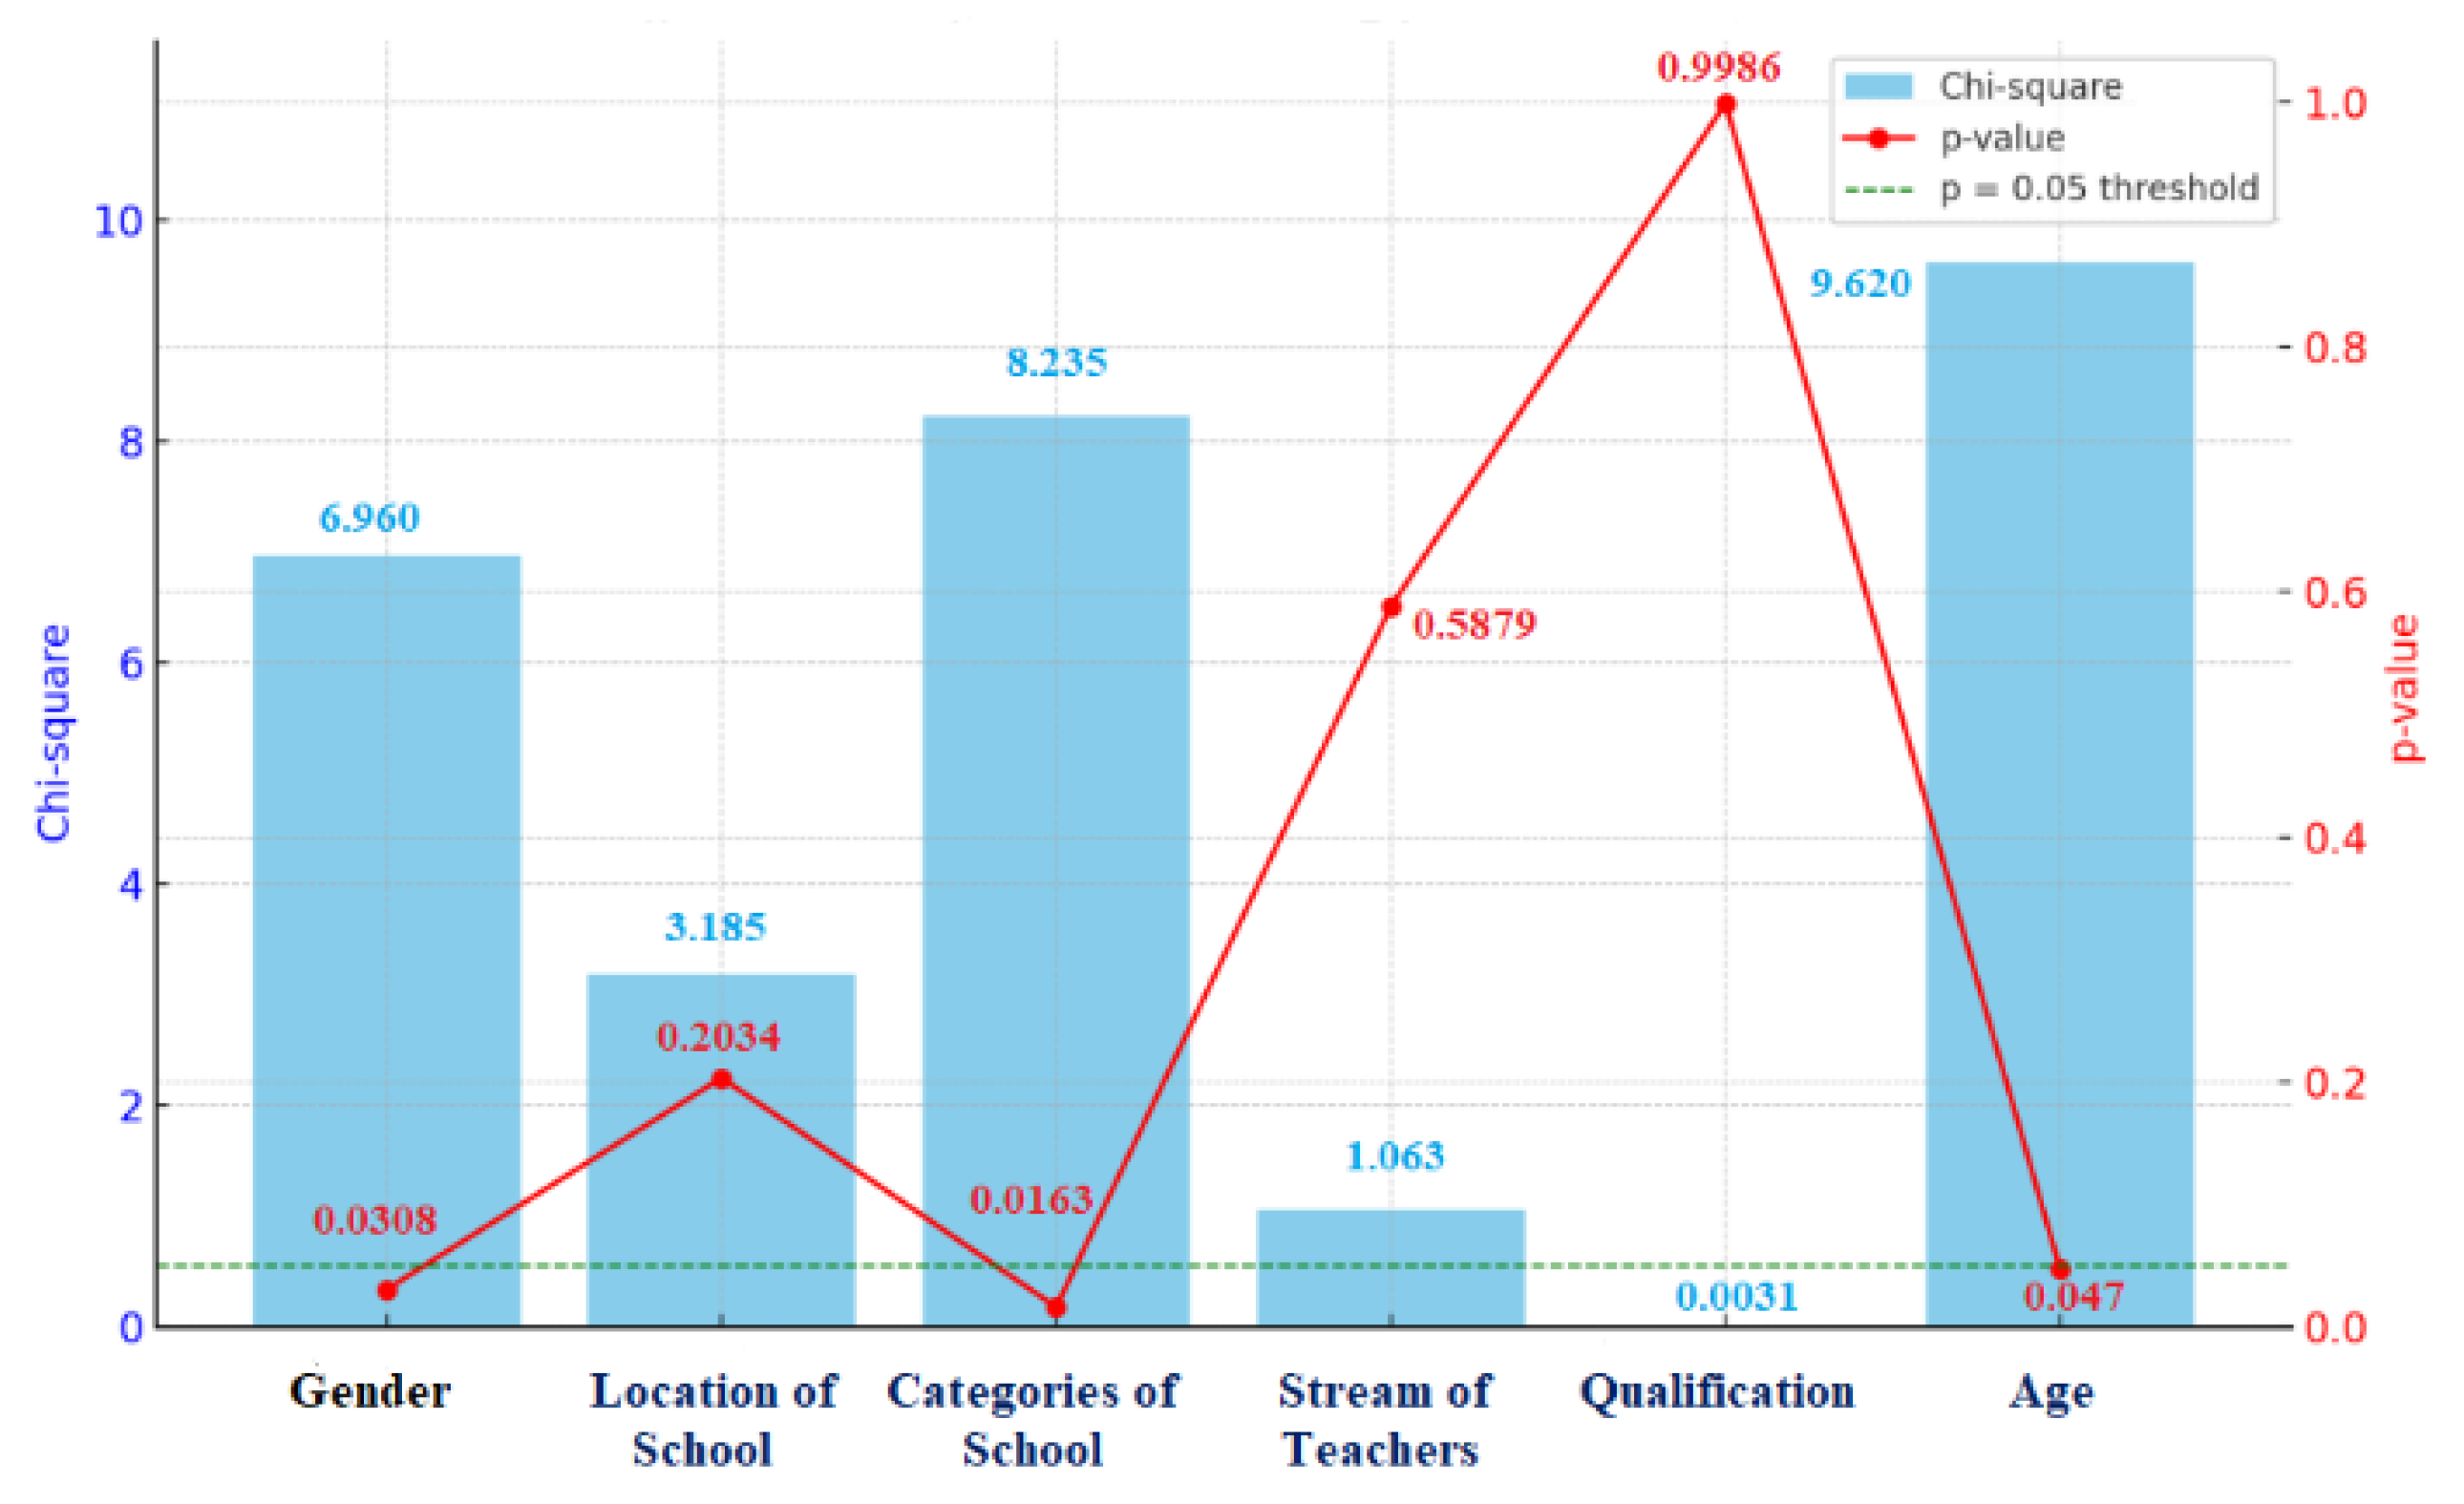
Figure 18.
Teachers’ attitudes on ARA through t-test across gender, location of schools, categories of school, streams of school, qualification and experience.
Figure 18.
Teachers’ attitudes on ARA through t-test across gender, location of schools, categories of school, streams of school, qualification and experience.
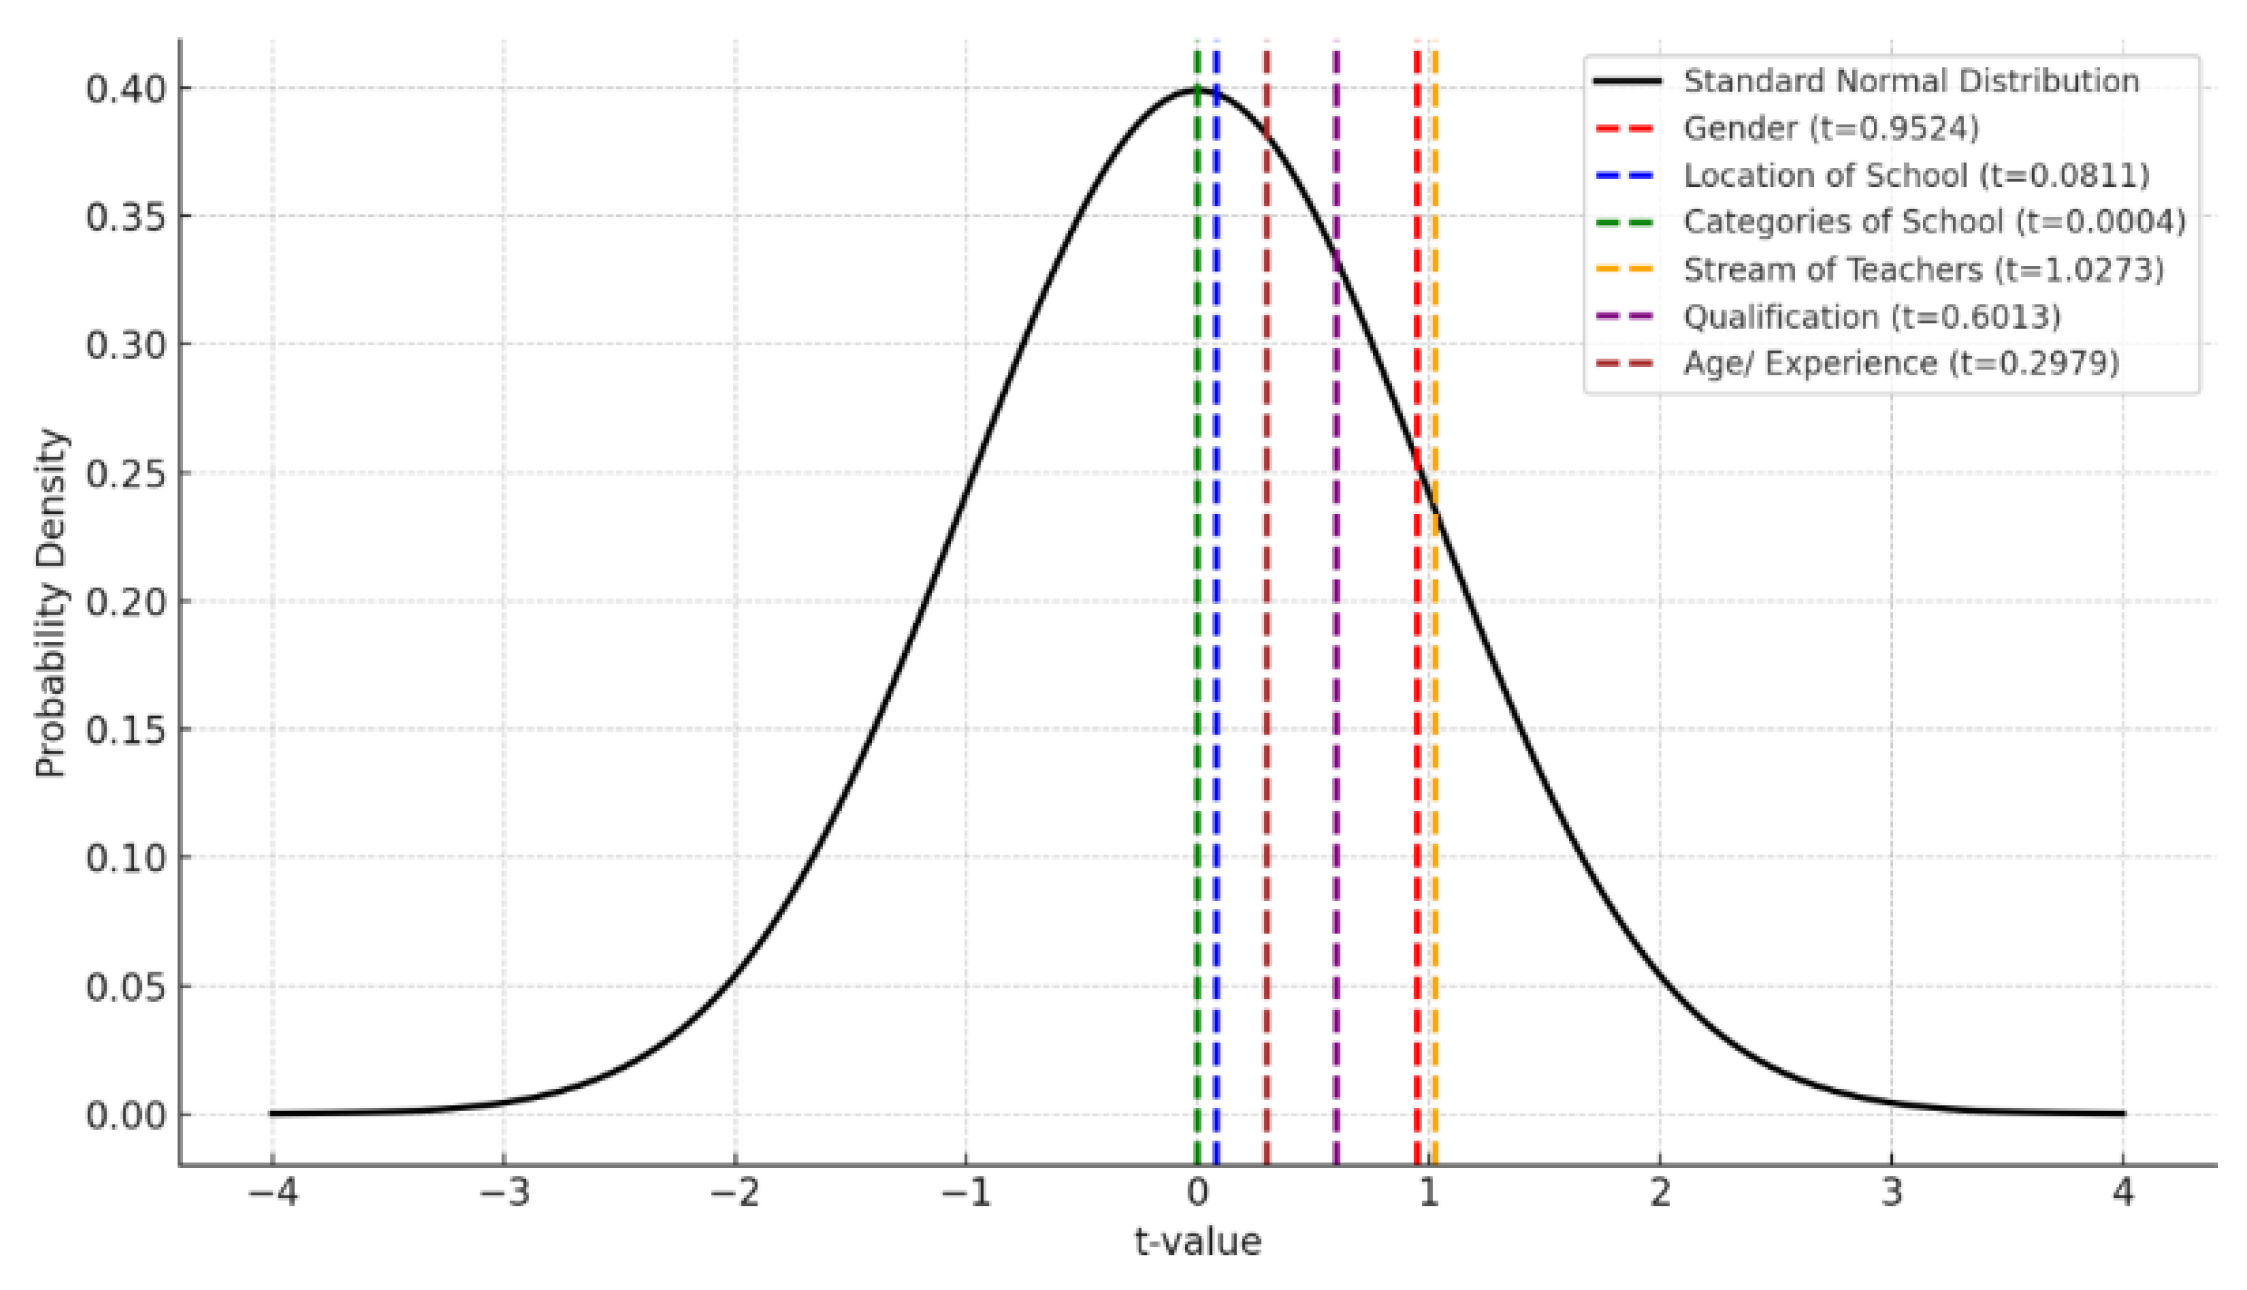
Figure 19.
Teachers’ behavioural level on augmented reality applications.
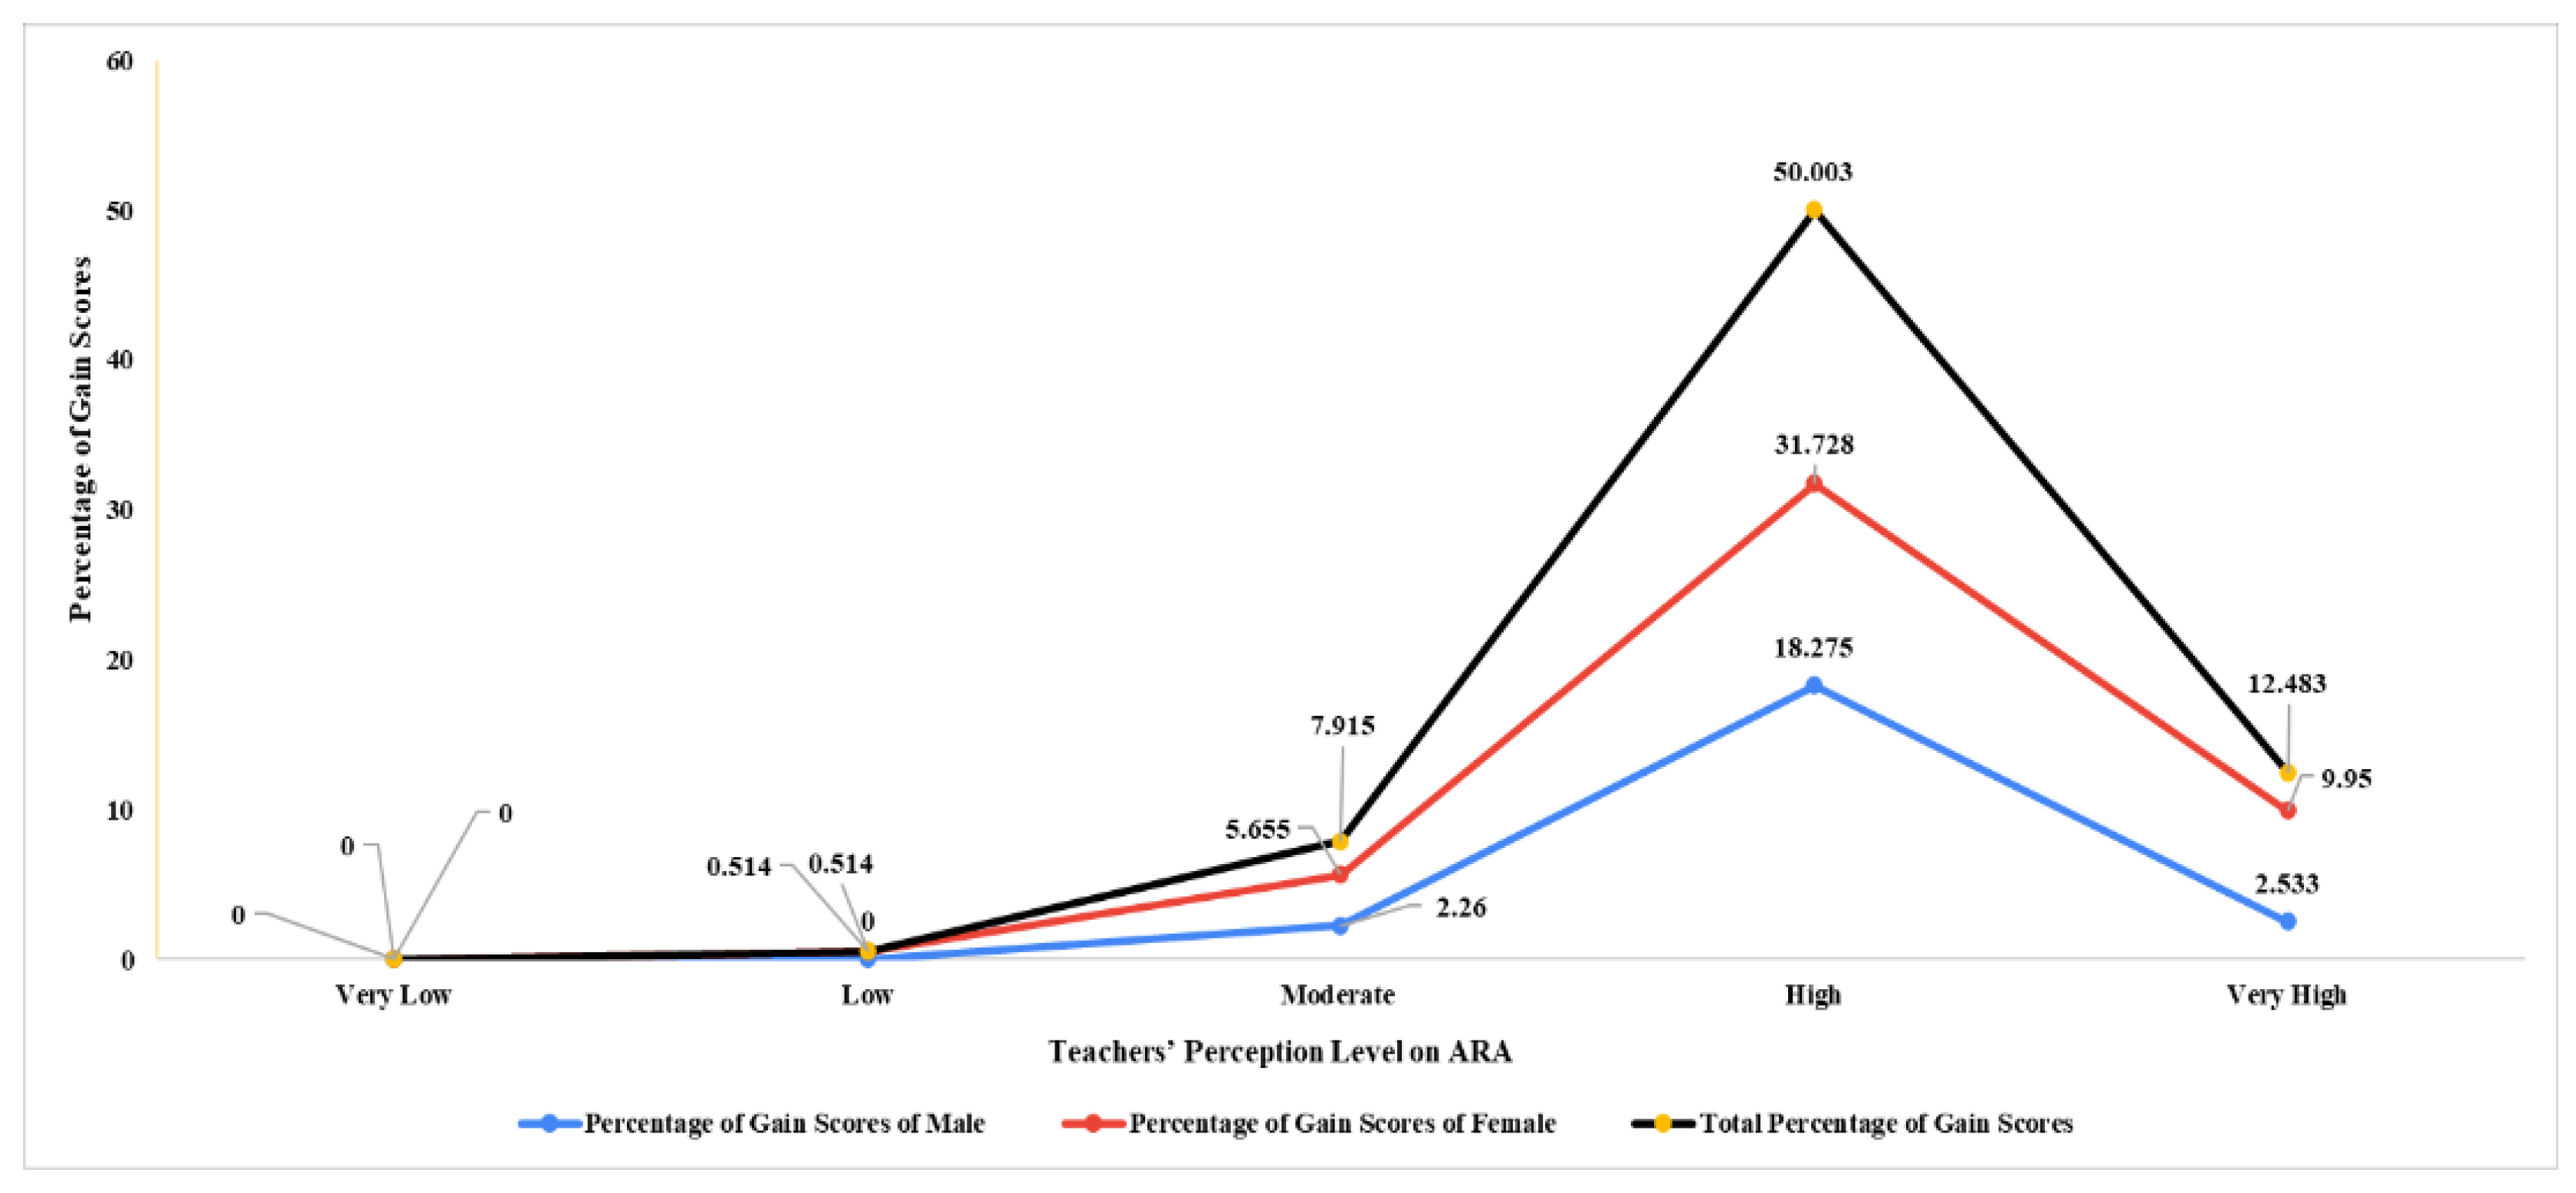
Figure 20.
Chi-square and p-values of various variables of teachers’ behaviours towards ARA.
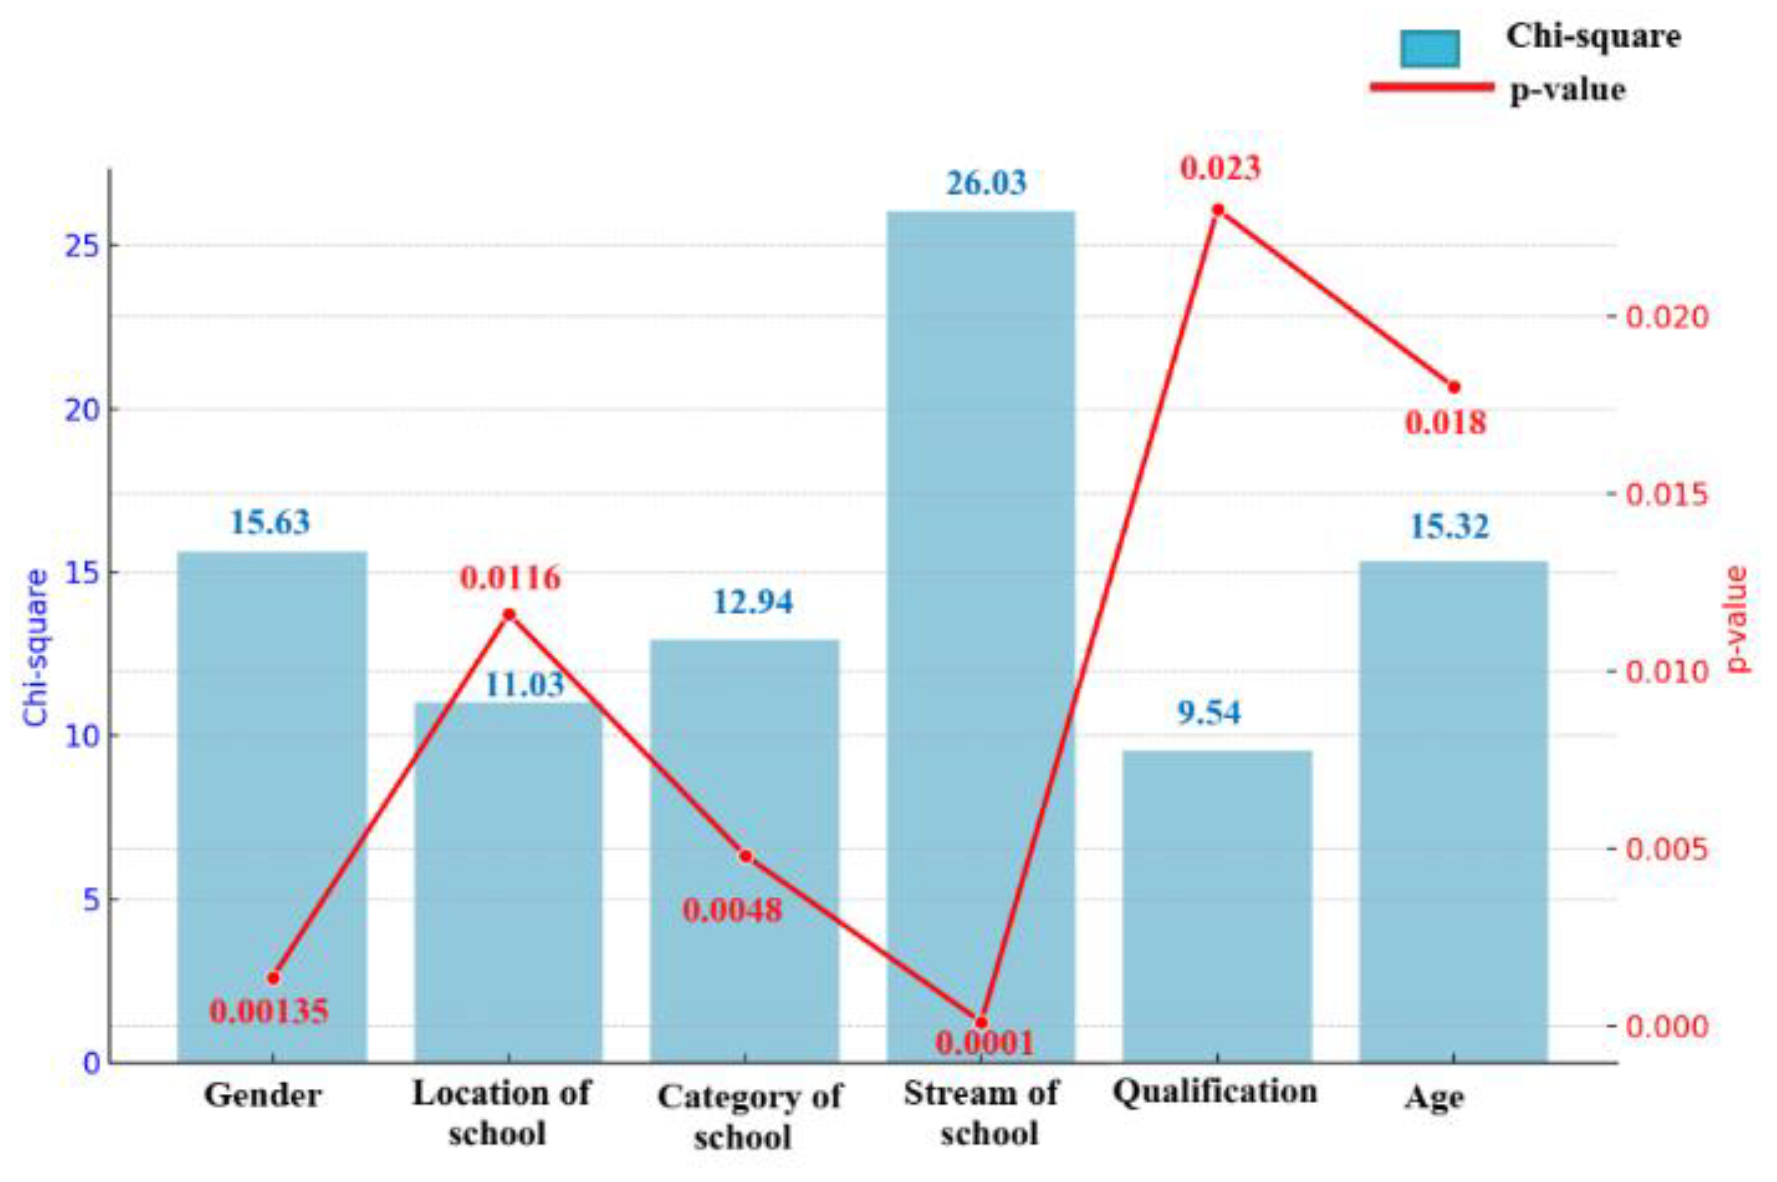
Figure 21.
Teachers’ behaviour on ARA through t-test across gender, location of schools, categories of school, streams of school, qualification and experience.
Figure 21.
Teachers’ behaviour on ARA through t-test across gender, location of schools, categories of school, streams of school, qualification and experience.
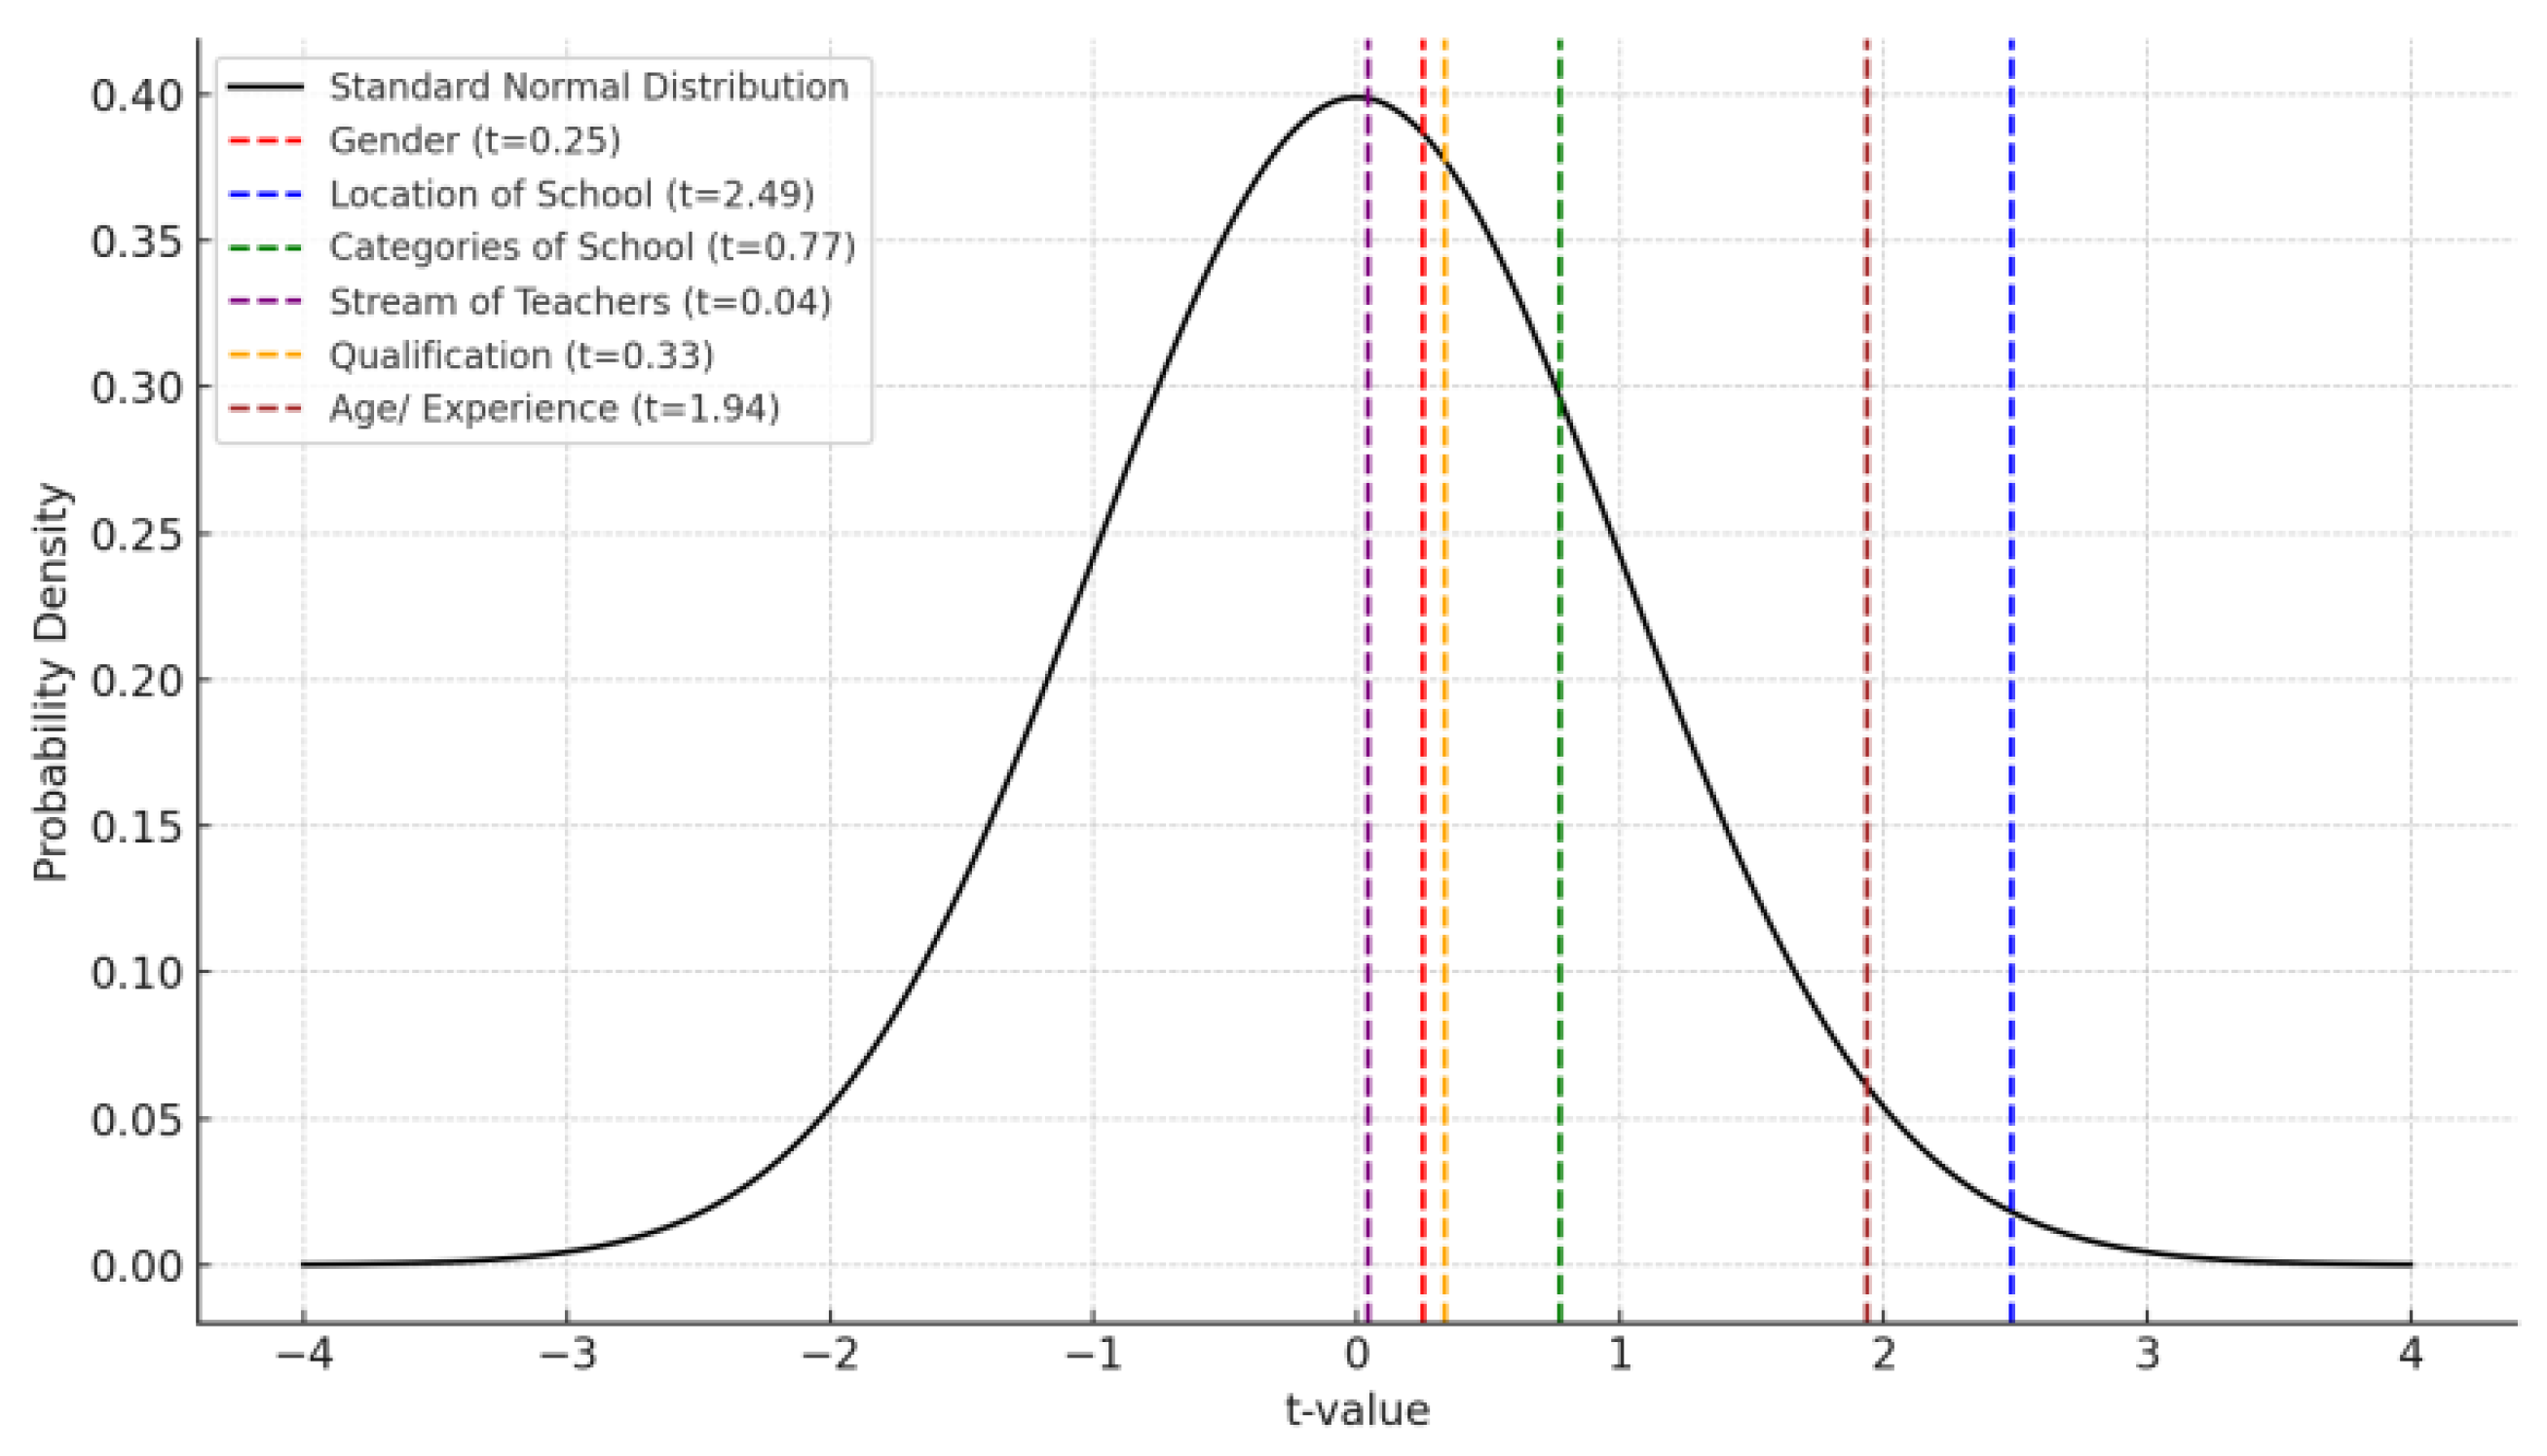
Figure 22.
Correlations between teachers' perception, attitudes, and behaviour on ARA.
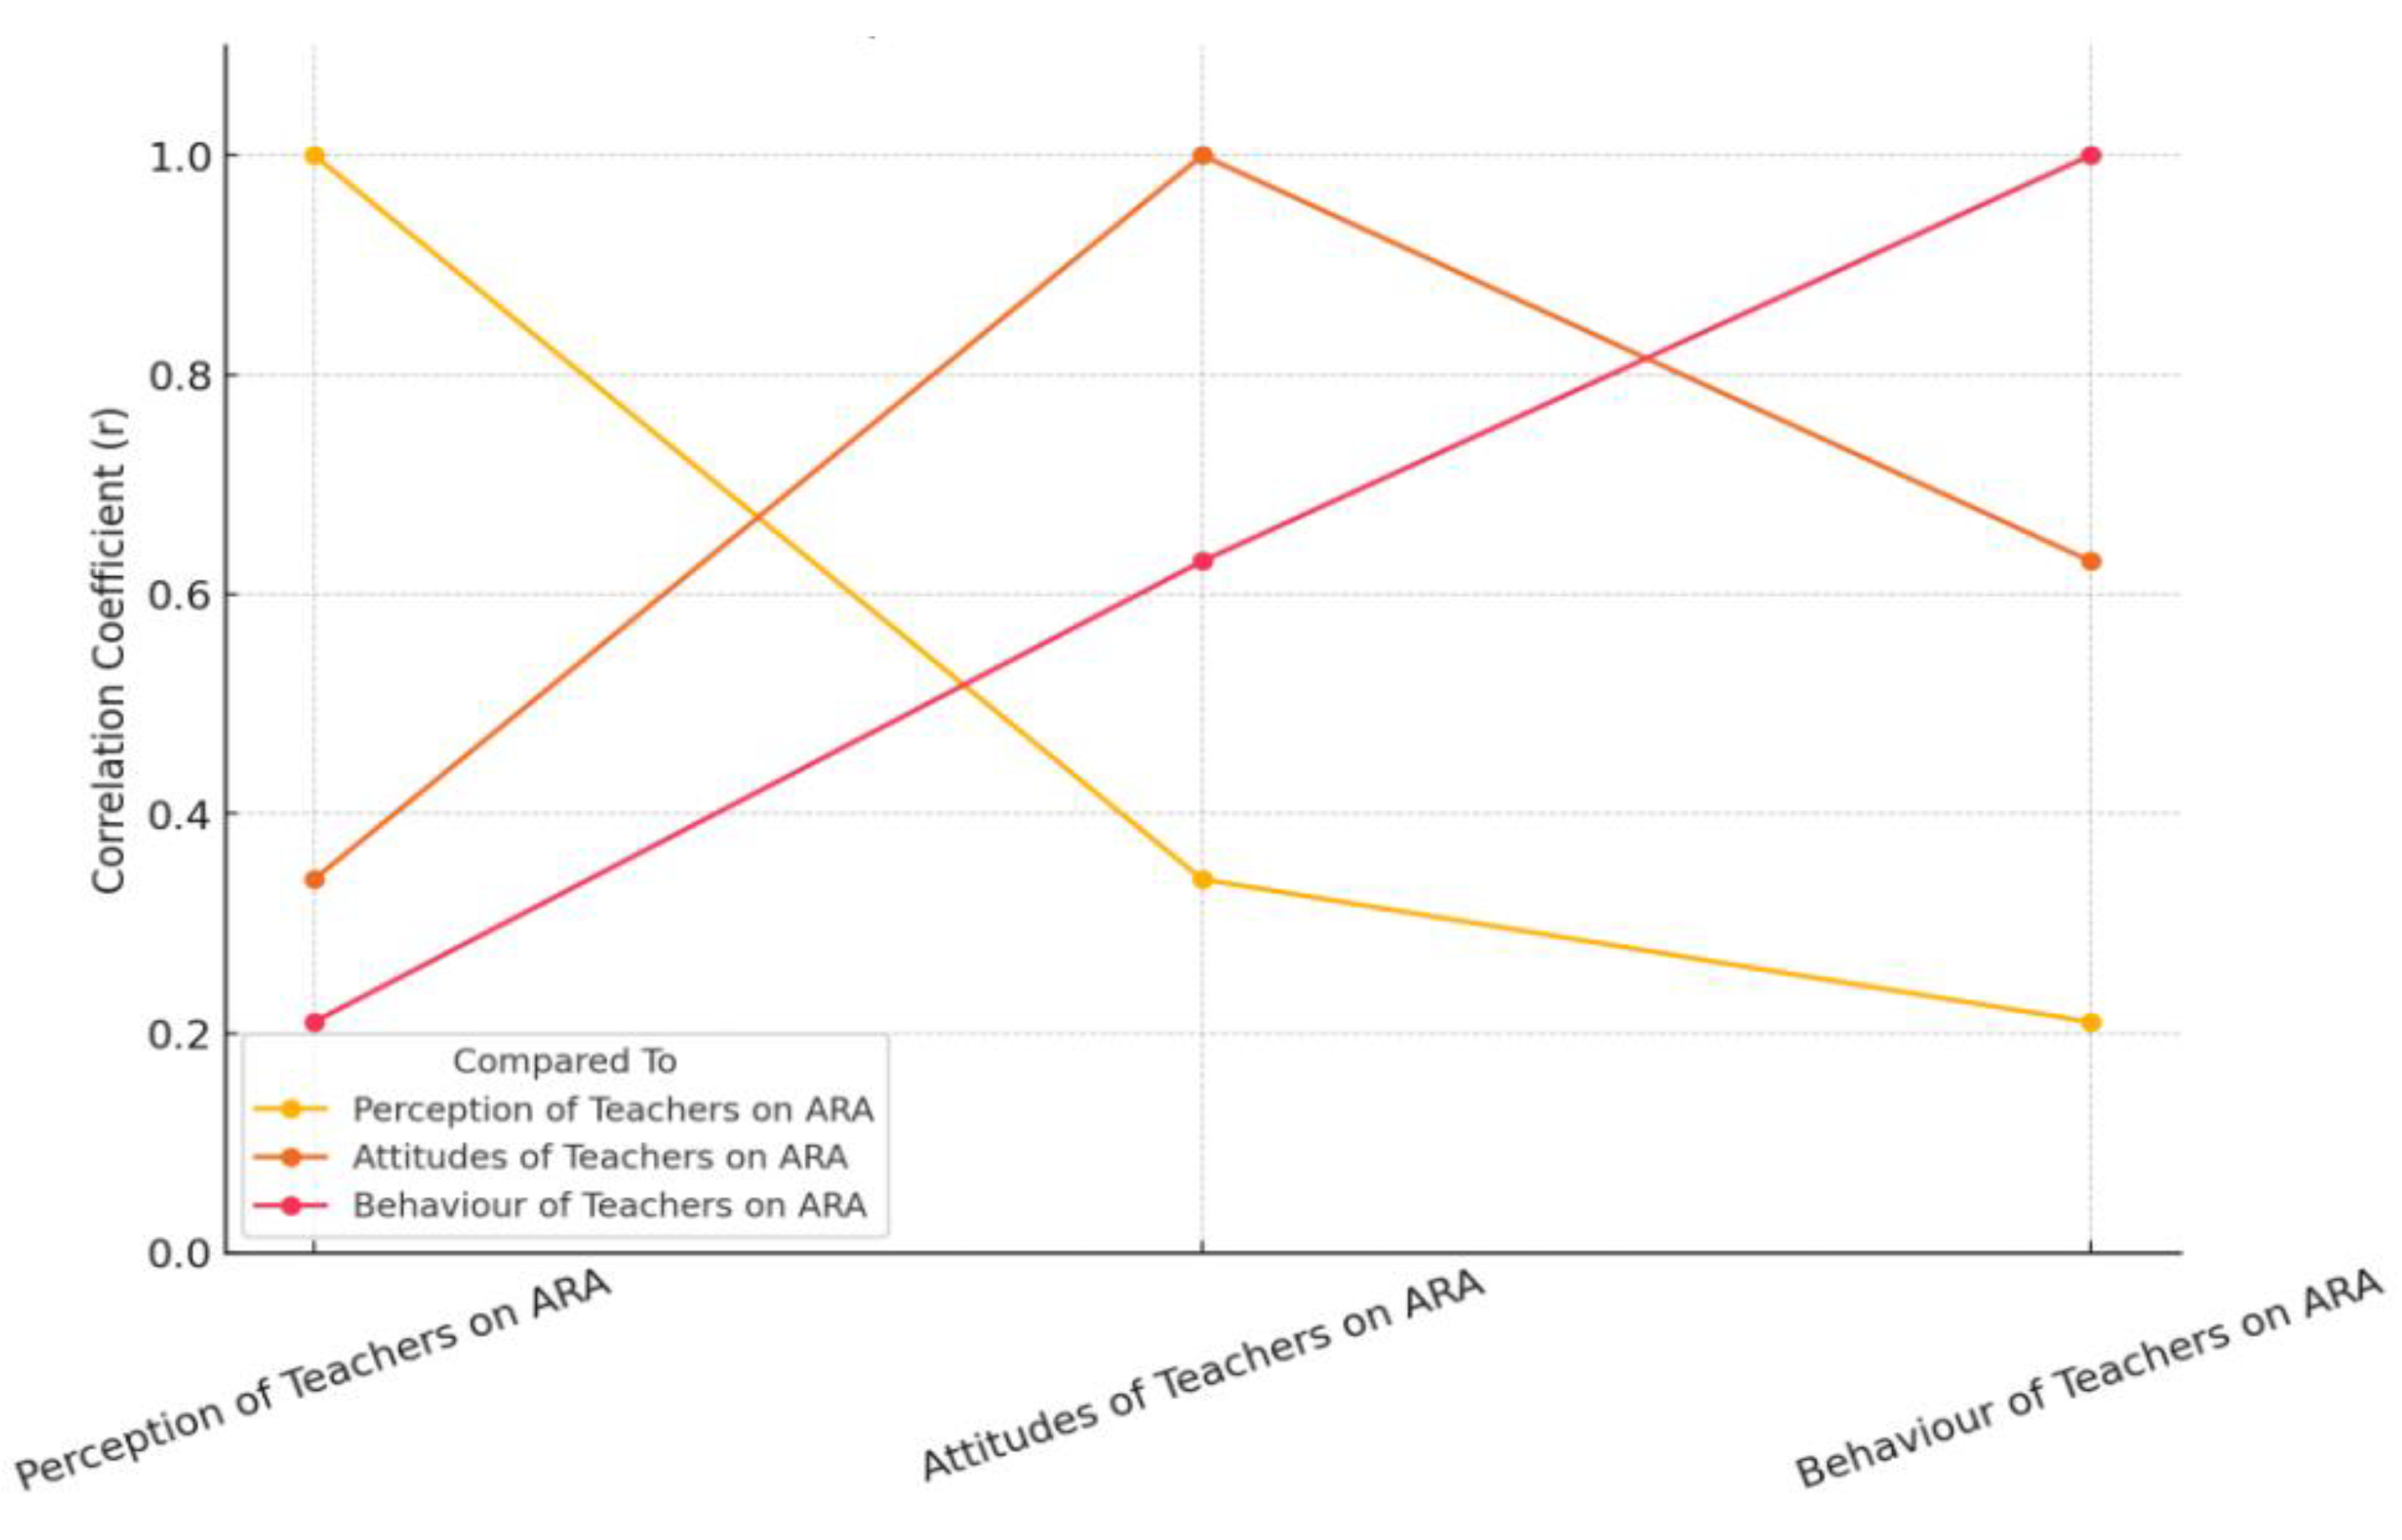
Figure 23.
Teachers’ perception, attitudes and behaviour on ARA through t-test.
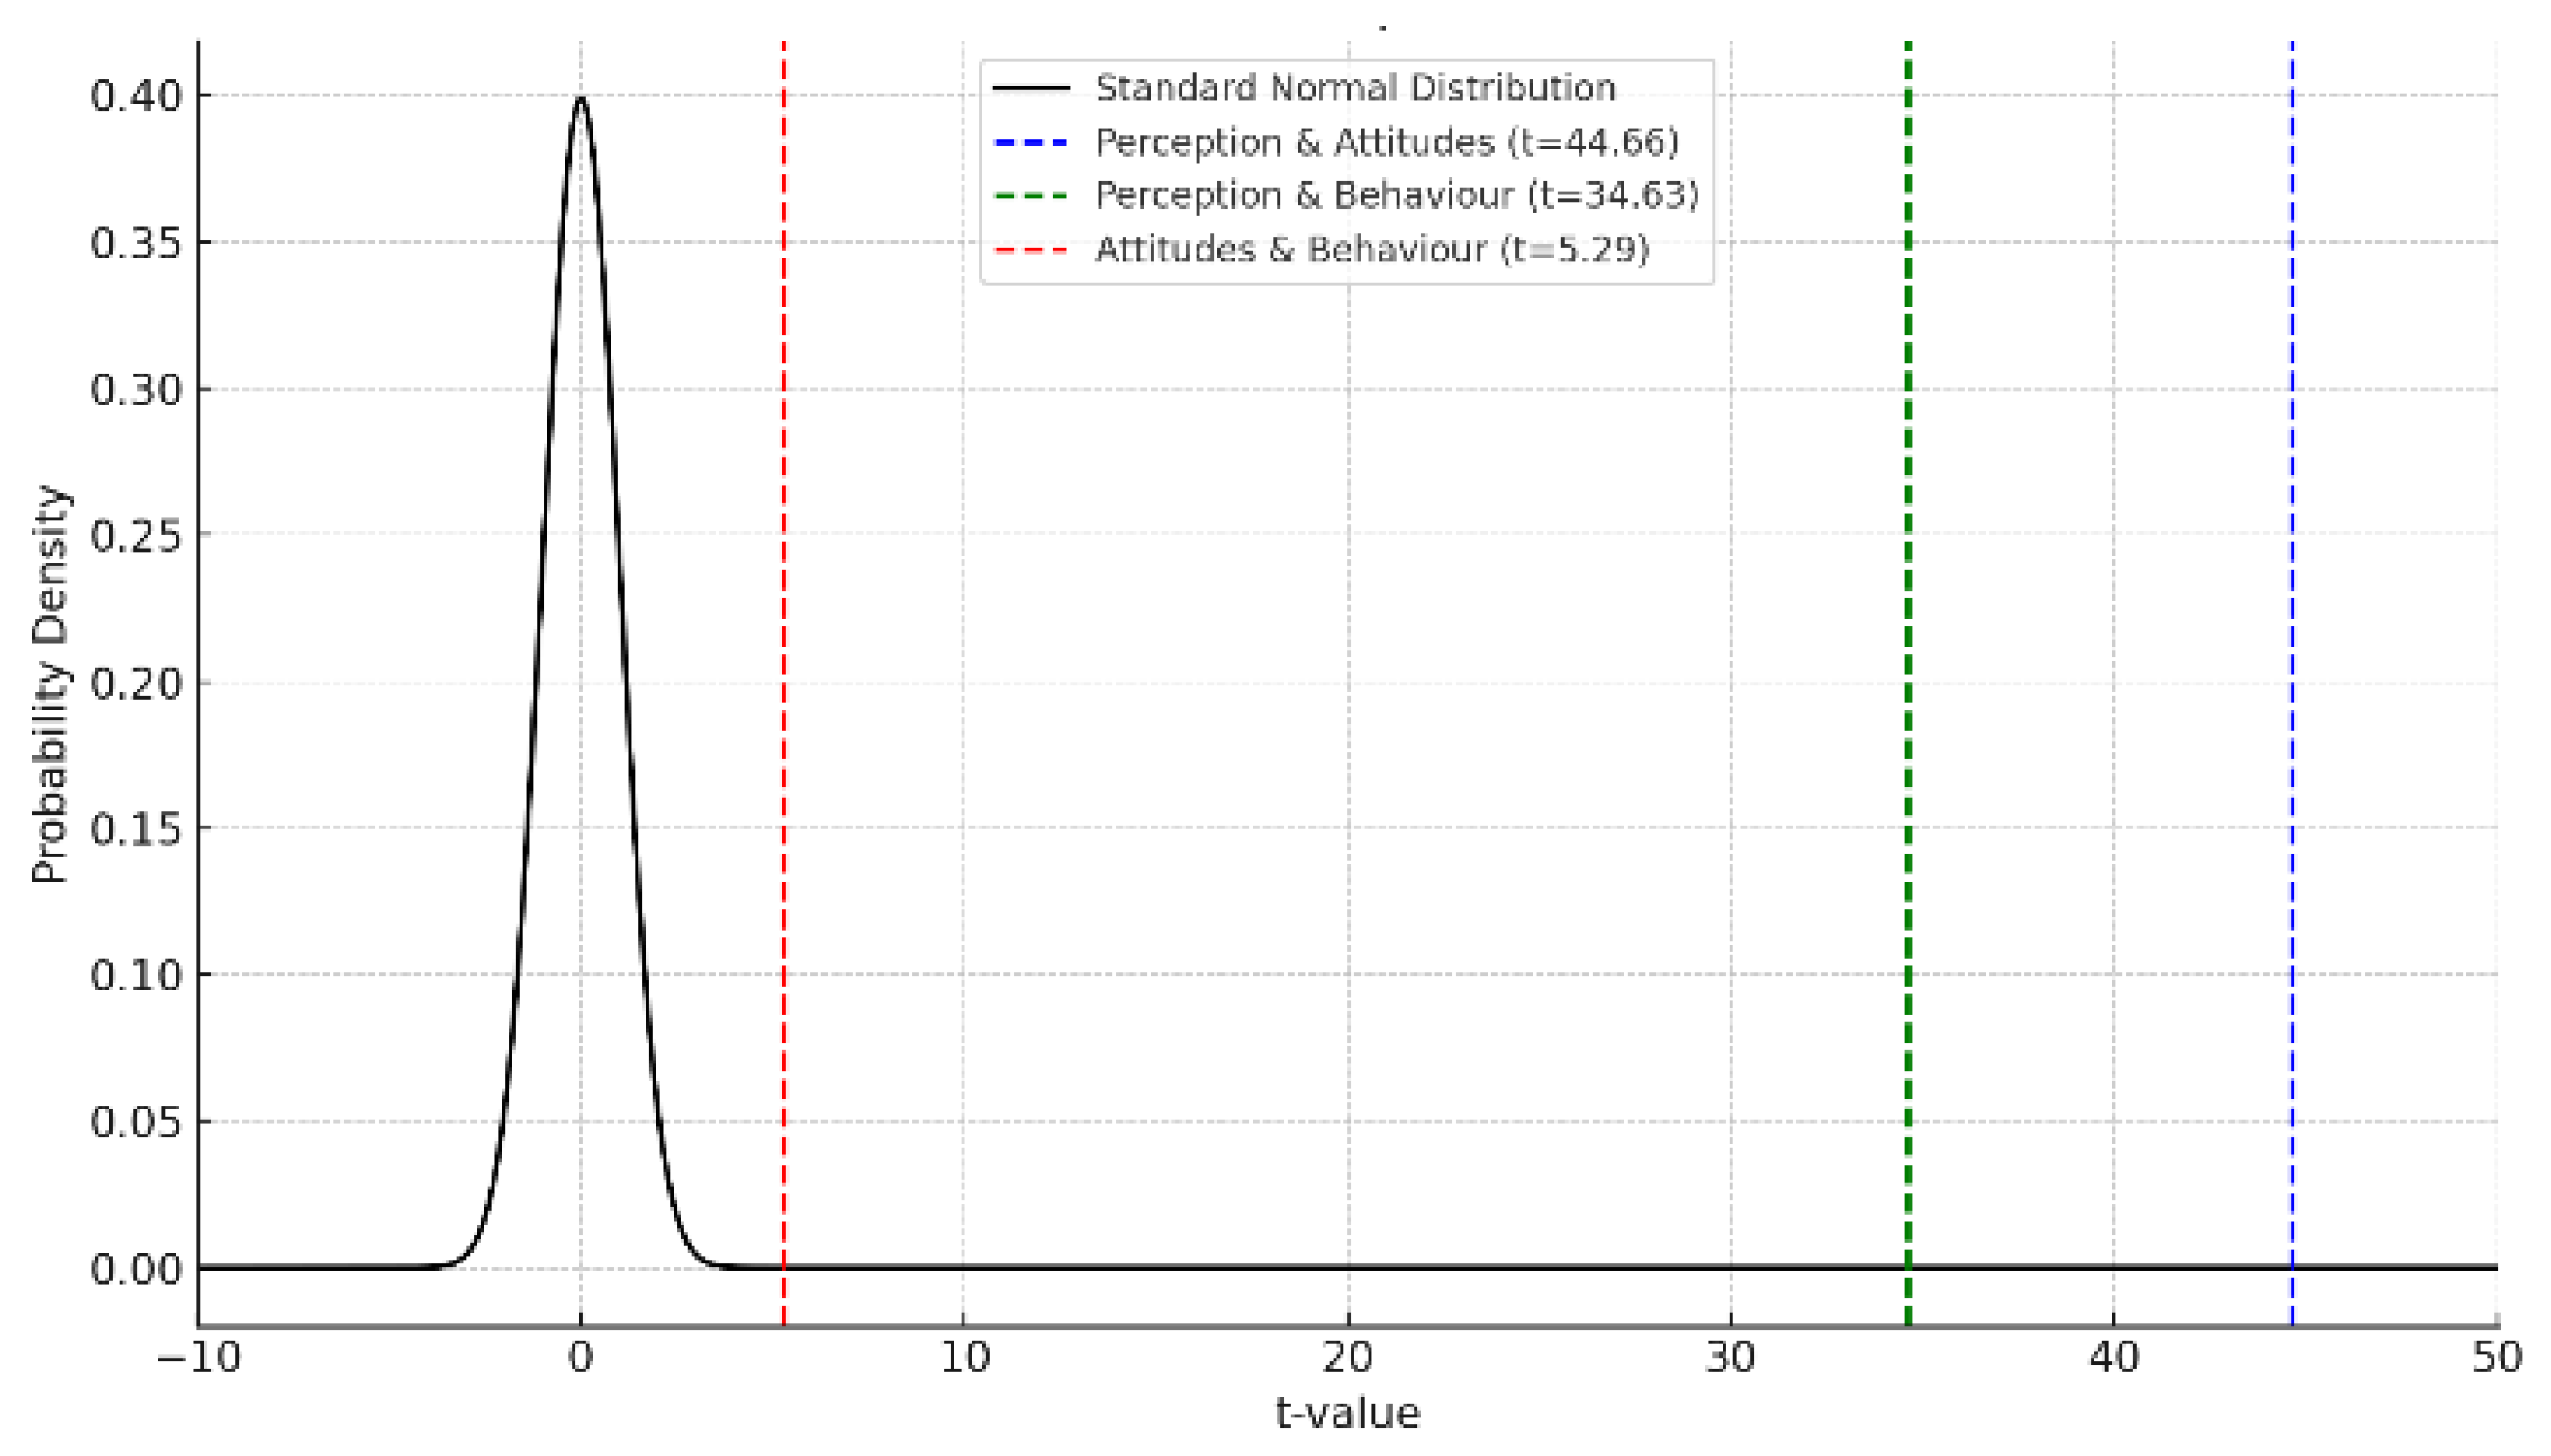
Figure 24.
One Way ANOVA test, using F distribution.
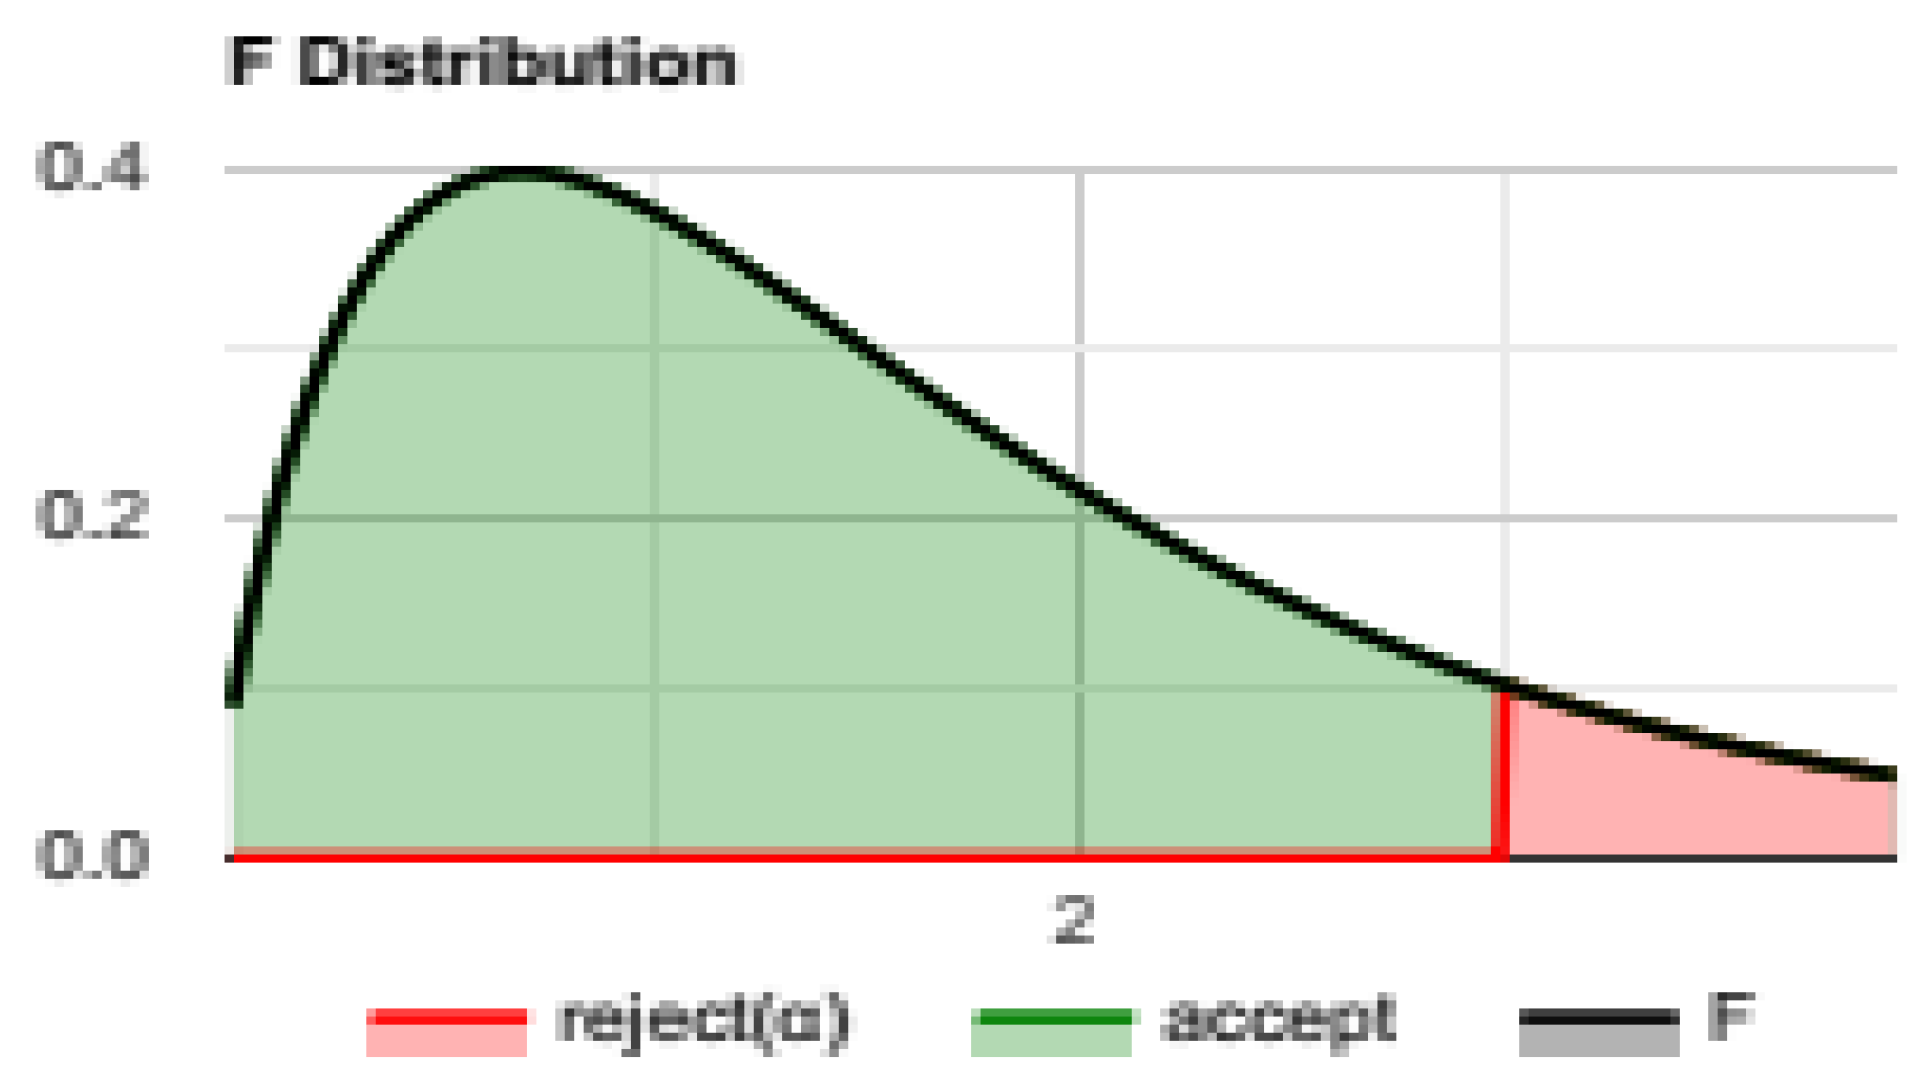

Table 1.
Level of perception on augmented reality applications (ARA) among the teachers.
| Teachers’ Perception Level on ARA | Range of Scores | Frequencies | Gain Scores | Percentage of Gain Scores | Total Percentage of Gain Scores | |||
| Male | Female | Male | Female | Male | Female | |||
| Very High | 81-100 | 0 | 0 | 0 | 0 | 0 | 0 | 0 |
| High | 61-80 | 28 | 125 | 1940 | 8525 | 2.66 | 11.68 | 14.34 |
| Moderate | 41-60 | 148 | 248 | 8055 | 13215 | 11.04 | 18.10 | 29.14 |
| Low | 21-40 | 54 | 116 | 1910 | 4100 | 2.62 | 5.62 | 8.24 |
| Very Low | < 20 | 7 | 4 | 125 | 60 | 0.17 | 0.08 | 0.25 |
| Total | 730 | 12030 | 25900 | 16.49 | 35.48 | 51.97 | ||
Table 2.
Significant difference regarding the level of perception on Augmented Reality Applications (ARA) among the teachers in which Observed Frequency (f0), Expected Frequency (fe), Difference (f0-fe), Difference Sq. (f0-fe)2, Diff. Sq. / Exp Fr. (f0-fe)2/fe, Degrees of Freedom (df), Chi-square (ꭕ2) and p value of gain scores regarding the level of perception of respondents on augmented reality applications.
| Variables | Teachers’ Perception Level on ARA | (f0) | (fe) | (f0 - fe)2 /fe | df | ꭕ2 | p Value | |
|---|---|---|---|---|---|---|---|---|
| Gender | Male | Very High | 0 | 0 | 0 | 3 | 23.26 | 0.00004 p < .05 |
| High | 28 | 49.67 | 9.45 | |||||
| Moderate | 148 | 128.56 | 2.94 | |||||
| Low | 54 | 55.19 | 0.03 | |||||
| Very Low | 7 | 3.57 | 3.3 | |||||
| Female | Very High | 0 | 0 | 0 | ||||
| High | 125 | 103.33 | 4.54 | |||||
| Moderate | 248 | 267.44 | 1.41 | |||||
| Low | 116 | 114.81 | 0.01 | |||||
| Very Low | 4 | 7.43 | 1.58 | |||||
| Location of School | Rural | Very High | 0 | 0 | 0 | 3 | 4.814 | 0.1859 p > .05 |
| High | 33 | 41.71 | 1.82 | |||||
| Moderate | 114 | 107.95 | 0.34 | |||||
| Low | 47 | 46.34 | 0.01 | |||||
| Very Low | 5 | 3 | 1.33 | |||||
| Urban | Very High | 0 | 0 | 0 | ||||
| High | 120 | 111.29 | 0.68 | |||||
| Moderate | 282 | 288.05 | 0.13 | |||||
| Low | 123 | 123.66 | 0.004 | |||||
| Very Low | 6 | 8 | 0.5 | |||||
| Categories of School | Government | Very High | 0 | 0 | 0 | 3 | 27.30 | 0.00001 p<.05 |
| High | 50 | 64.13 | 3.11 | |||||
| Moderate | 199 | 165.99 | 6.56 | |||||
| Low | 51 | 71.26 | 5.76 | |||||
| Very Low | 6 | 4.61 | 0.42 | |||||
| Private | Very High | 0 | 0 | 0 | ||||
| High | 103 | 88.87 | 2.25 | |||||
| Moderate | 197 | 230.01 | 4.74 | |||||
| Low | 119 | 98.74 | 4.16 | |||||
| Very Low | 5 | 6.39 | 0.30 | |||||
| Stream of Teachers | Science | Very High | 0 | 0 | 0 | 3 | 27.91 | 0.00001 p<.05 |
| High | 77 | 65.39 | 2.06 | |||||
| Moderate | 143 | 169.25 | 4.07 | |||||
| Low | 92 | 72.66 | 5.15 | |||||
| Very Low | 0 | 4.7 | 4.7 | |||||
| Arts | Very High | 0 | 0 | 0 | ||||
| High | 76 | 87.61 | 1.54 | |||||
| Moderate | 253 | 226.75 | 3.04 | |||||
| Low | 78 | 97.34 | 3.84 | |||||
| Very Low | 11 | 6.3 | 3.51 | |||||
| Qualification | TGT | Very High | 0 | 0 | 0 | 3 | 19.31 | 0.00024 p<.05 |
| High | 135 | 124.5 | 0.89 | |||||
| Moderate | 327 | 322.22 | 0.07 | |||||
| Low | 121 | 138.33 | 2.17 | |||||
| Very Low | 11 | 8.95 | 0.47 | |||||
| PGT | Very High | 0 | 0 | 0 | ||||
| High | 18 | 28.5 | 3.87 | |||||
| Moderate | 69 | 73.78 | 0.31 | |||||
| Low | 49 | 31.67 | 9.48 | |||||
| Very Low | 0 | 2.05 | 2.05 | |||||
| Age | 20-33 | Very High | 0 | 0 | 0 | 6 | 1.4751 | 0.961 p>.05 |
| High | 102 | 104.17 | 0.045 | |||||
| Moderate | 272 | 269.61 | 0.02 | |||||
| Low | 115 | 115.74 | 0.005 | |||||
| Very Low | 8 | 7.49 | 0.03 | |||||
| 34-47 | Very High | 0 | 0 | 0 | ||||
| High | 47 | 44.85 | 0.10 | |||||
| Moderate | 112 | 116.09 | 0.14 | |||||
| Low | 52 | 49.84 | 0.09 | |||||
| Very Low | 3 | 3.22 | 0.015 | |||||
| 48-60 & Above | Very High | 0 | 0 | 0 | ||||
| High | 4 | 3.98 | 0.0001 | |||||
| Moderate | 12 | 10.31 | 0.28 | |||||
| Low | 3 | 4.42 | 0.46 | |||||
| Very Low | 0 | 0.29 | 0.29 | |||||
| Overall | 3 | 416.553 | .00001 p < .05. |
|||||
Table 3.
Significant difference regarding the perception of teachers on Augmented Reality Applications (ARA) in which t-tests were used to calculate the significant difference between the two groups (variables). The table presents the Mean (M), Standard Deviation (SD), Standard Error of the Mean (SEM), Number of Adolescents (N), Standard Error of the Difference (SED), Degrees of Freedom (df), and the t and p values for the gain scores of variables of teachers.
| Variables | Mean | SEM | N | SD | SED | Df | t-value | p-value | |||||
|---|---|---|---|---|---|---|---|---|---|---|---|---|---|
| Gender | Male | M1 | 50.76 | SEM1 | 0.82 | N1 | 237 | SD1 | 12.67 | 1.012 | 728 | 1.755 | 0.079 |
| Female | M2 | 52.54 | SEM2 | 0.58 | N2 | 493 | SD2 | 12.86 | |||||
| Location | Rural | M1 | 51.18 | SEM1 | 0.89 | N1 | 199 | SD1 | 12.59 | 1.065 | 728 | 1.004 | 0.315 |
| Urban | M2 | 52.25 | SEM2 | 0.56 | N2 | 531 | SD2 | 12.90 | |||||
| Types of Organisations | Government | M1 | 52.24 | SEM1 | 0.70 | N1 | 306 | SD1 | 12.23 | 0.962 | 728 | 0.501 | 0.616 |
| Private | M2 | 51.76 | SEM2 | 0.64 | N2 | 424 | SD2 | 13.24 | |||||
| Academic Streams | Science | M1 | 52.18 | SEM1 | 0.77 | N1 | 312 | SD1 | 13.61 | 0.960 | 728 | 0.401 | 0.688 |
| Arts | M2 | 51.79 | SEM2 | 0.60 | N2 | 418 | SD2 | 12.21 | |||||
| Designation | TGT | M1 | 47.07 | SEM1 | 1.26 | N1 | 121 | SD1 | 13.84 | 1.258 | 728 | 4.662 | 0.0001 |
| PGT | M2 | 52.93 | SEM2 | 0.50 | N2 | 609 | SD2 | 12.39 | |||||
| Experience | High Experience (41-60 years & above) | M1 | 54.02 | SEM1 | 1.06 | N1 | 92 | SD1 | 10.14 | 1.428 | 728 | 1.653 | 0.098 |
| Low Experience (20-40 years) | M2 | 51.66 | SEM2 | 0.52 | N2 | 638 | SD2 | 13.14 | |||||
Table 4.
Level of Teachers' attitudes towards augmented reality applications (ARA).
| Teachers’ Attitudes Level on ARA | Range of Scores | Frequencies |
Gain Scores |
Percentage of Gain Scores | Total Percentage of Gain Scores | |||
| Male | Female | Male | Female | Male | Female | |||
| Very High | 81-100 | 24 | 66 | 1975 | 5437 | 2.705 | 7.448 | 10.153 |
| High | 61-80 | 204 | 387 | 14840 | 27970 | 20.328 | 38.315 | 58.643 |
| Moderate | 41-60 | 9 | 40 | 463 | 2259 | 0.634 | 3.094 | 3.728 |
| Low | 21-40 | 0 | 0 | 0 | 0 | 0 | 0 | 0 |
| Very Low | < 20 | 0 | 0 | 0 | 0 | 0 | 0 | 0 |
| Total | 730 | 17278 | 35666 | 23.667 | 48.857 | 72.524 | ||
Table 5.
Significant difference in teachers' attitudes towards Augmented Reality Applications (ARA) was examined using various statistical measures, including Observed Frequency (f0), Expected Frequency (fe), the Difference (f0-fe), the Square of the Difference (f0-fe)², the Ratio of the Squared Difference to the Expected Frequency (f0-fe)²/fe, Degrees of Freedom (df), the Chi-square (ꭕ²), and the p-value based on respondents' gain scores.
| Variables | Teachers’ Attitudes Level on ARA | (f0) | (fe) | (f0 - fe)2 /fe | df | ꭕ2 | p Value | |
|---|---|---|---|---|---|---|---|---|
| Gender | Male | Very High | 24 | 29.22 | 0.932 | 2 |
6.960 |
0.0308 p < .05 |
| High | 204 | 191.87 | 0.767 | |||||
| Moderate | 9 | 15.91 | 3.001 | |||||
| Low | 0 | 0 | 0 | |||||
| Very Low | 0 | 0 | 0 | |||||
| Female | Very High | 66 | 60.78 | 0.448 | ||||
| High | 387 | 399.13 | 0.369 | |||||
| Moderate | 40 | 33.09 | 1.443 | |||||
| Low | 0 | 0 | 0 | |||||
| Very Low | 0 | 0 | 0 | |||||
| Location of School | Rural | Very High | 21 | 24.53 | 0.508 | 2 | 3.185 | 0.2034 p > .05 |
| High | 169 | 161.11 | 0.386 | |||||
| Moderate | 9 | 13.36 | 1.423 | |||||
| Low | 0 | 0 | 0 | |||||
| Very Low | 0 | 0 | 0 | |||||
| Urban | Very High | 69 | 65.47 | 0.190 | ||||
| High | 422 | 429.89 | 0.145 | |||||
| Moderate | 40 | 35.64 | 0.533 | |||||
| Low | 0 | 0 | 0 | |||||
| Very Low | 0 | 0 | 0 | |||||
| Categories of School | Government | Very High | 26 | 37.73 | 3.647 | 2 | 8.235 | 0.0163 p < .05 |
| High | 262 | 247.73 | 0.822 | |||||
| Moderate | 18 | 20.54 | 0.314 | |||||
| Low | 0 | 0 | 0 | |||||
| Very Low | 0 | 0 | 0 | |||||
| Private | Very High | 64 | 52.27 | 2.632 | ||||
| High | 329 | 343.27 | 0.593 | |||||
| Moderate | 31 | 28.46 | 0.227 | |||||
| Low | 0 | 0 | 0 | |||||
| Very Low | 0 | 0 | 0 | |||||
| Stream of Teachers | Science | Very High | 35 | 38.47 | 0.313 | 2 | 1.063 | 0.5879 p > .05 |
| High | 258 | 252.59 | 0.116 | |||||
| Moderate | 19 | 20.94 | 0.180 | |||||
| Low | 0 | 0 | 0 | |||||
| Very Low | 0 | 0 | 0 | |||||
| Arts | Very High | 55 | 51.53 | 0.234 | ||||
| High | 333 | 338.41 | 0.086 | |||||
| Moderate | 30 | 28.06 | 0.134 | |||||
| Low | 0 | 0 | 0 | |||||
| Very Low | 0 | 0 | 0 | |||||
| Qualification | TGT | Very High | 15 | 14.92 | 0.0004 | 2 | 0.0031 | 0.9986 p > .05 |
| High | 98 | 97.96 | 0.00002 | |||||
| Moderate | 8 | 8.12 | 0.0021 | |||||
| Low | 0 | 0 | 0 | |||||
| Very Low | 0 | 0 | 0 | |||||
| PGT | Very High | 75 | 75.08 | 0.0001 | ||||
| High | 493 | 493.04 | 0.000003 | |||||
| Moderate | 41 | 40.88 | 0.0005 | |||||
| Low | 0 | 0 | 0 | |||||
| Very Low | 0 | 0 | 0 | |||||
| Age | 20-33 | Very High | 51 | 61.27 | 1.721 | 4 | 9.620 | 0.047 p < .05 |
| High | 413 | 402.37 | 0.290 | |||||
| Moderate | 33 | 33.36 | 0.010 | |||||
| Low | 0 | 0 | 0 | |||||
| Very Low | 0 | 0 | 0 | |||||
| 34-47 | Very High | 35 | 26.38 | 2.817 | ||||
| High | 166 | 173.25 | 0.303 | |||||
| Moderate | 13 | 14.36 | 0.140 | |||||
| Low | 0 | 0 | 0 | |||||
| Very Low | 0 | 0 | 0 | |||||
| 48-60 | Very High | 4 | 2.34 | 1.178 | ||||
| High | 12 | 15.38 | 0.850 | |||||
| Moderate | 3 | 1.28 | 2.311 | |||||
| Low | 0 | 0 | 0 | |||||
| Very Low | 0 | 0 | 0 | |||||
| Overall | 2 | 748.558 | 0.00001 p < .05 |
|||||
Table 6.
Significant difference regarding the attitudes of teachers on Augmented Reality Applications (ARA) in which t-tests were used to calculate the significant difference between the two groups (variables). The table presents the Mean (M), Standard Deviation (SD), Standard Error of the Mean (SEM), Number of Adolescents (N), Standard Error of the Difference (SED), Degrees of Freedom (df), and the t and p values for the gain scores of variables of teachers.
| Variables | Mean | SEM | N | SD | SED | df | t-value | p-value | |||||
|---|---|---|---|---|---|---|---|---|---|---|---|---|---|
| Gender | Male | M1 | 72.90 | SEM1 | 0.46 | N1 | 237 | SD1 | 7.01 | 0.586 | 728 | 0.9524 |
0.3412 p >0.05 |
| Female | M2 | 72.34 | SEM2 | 0.34 | N2 | 493 | SD2 | 7.60 | |||||
| Location | Urban | M1 | 72.54 | SEM1 | 0.33 | N1 | 531 | SD1 | 7.61 | 0.617 | 728 | 0.0811 | 0.9354 p >0.05 |
| Rural | M2 | 72.49 | SEM2 | 0.49 | N2 | 199 | SD2 | 6.87 | |||||
| Types of Organisations | Government | M1 | 72.526 | SEM1 | 0.40 | N1 | 306 | SD1 | 6.95 | 0.556 |
728 | 0.0004 | 0.9997 p >0.05 |
| Private | M2 | 72.5259 | SEM2 | 0.38 | N2 | 424 | SD2 | 7.74 | |||||
| Academic Streams | Science | M1 | 72.79 | SEM1 | 0.41 | N1 | 312 | SD1 | 7.19 | 0.555 | 728 | 1.0273 | 0.3046 p >0.05 |
| Arts | M2 | 72.22 | SEM2 | 0.37 | N2 | 418 | SD2 | 7.58 | |||||
| Designation | TGT | M1 | 72.17 | SEM1 | 0.71 | N1 | 131 | SD1 | 7.81 | 0.715 | 728 | 0.6013 | 0.5478 p >0.05 |
| PGT | M2 | 72.60 | SEM2 | 0.30 | N2 | 609 | SD2 | 7.34 | |||||
| Experience | High Experience (41-60 years) | M1 | 72.72 | SEM1 | 0.30 | N1 | 92 | SD1 | 7.54 | 0.738 | 728 | 0.2979 | 0.7659 p >0.05 |
| Low Experience (20-40 years) | M2 | 72.50 | SEM2 | 0.68 | N2 | 638 | SD2 | 6.48 | |||||
Table 7.
Level of practices in terms of behaviour of teachers towards augmented reality applications (ARA).
Table 7.
Level of practices in terms of behaviour of teachers towards augmented reality applications (ARA).
| Teachers’ Behaviour Level on ARA | Range of Scores | Frequencies |
Gain Scores |
Percentage of Gain Scores | Total Percentage of Gain Scores | |||
| Male | Female | Male | Female | Male | Female | |||
| Very High | 81-100 | 22 | 86 | 1849 | 7265 | 2.533 | 9.950 | 12.483 |
| High | 61-80 | 183 | 322 | 13341 | 23162 | 18.275 | 31.728 | 50.003 |
| Moderate | 41-60 | 32 | 75 | 1651 | 4128 | 2.260 | 5.655 | 7.915 |
| Low | 21-40 | 0 | 10 | 0 | 375 | 0 | 0.514 | 0.514 |
| Very Low | < 20 | 0 | 0 | 0 | 0 | 0 | 0 | 0 |
| Total | 730 | 16841 | 34930 | 23.068 | 47.847 | 70.915 | ||
Table 8.
The significant difference in teachers' behavioral practices regarding Augmented Reality Applications (ARA) was analyzed using various statistical methods. These included Observed Frequency (f0), Expected Frequency (fe), the Difference (f0-fe), the Square of the Difference (f0-fe)², the Ratio of the Squared Difference to the Expected Frequency (f0-fe)²/fe, Degrees of Freedom (df), the Chi-square (ꭕ²), and the p-value based on respondents' gain scores.
| Variables | Teachers’ Behavioural Level on ARA | (f0) | (fe) | (f0 - fe)2 /fe | df | ꭕ2 | p Value | |
|---|---|---|---|---|---|---|---|---|
| Gende | Male | Very High | 22 | 35.07 | 4.87 | 3 | 15.63 | 0.00135 p< .05 |
| High | 183 | 163.97 | 2.22 | |||||
| Moderate | 32 | 34.74 | 0.22 | |||||
| Low | 0 | 3.25 | 3.25 | |||||
| Very Low | 0 | 0 | 0 | |||||
| Female | Very High | 86 | 72.93 | 2.34 | ||||
| High | 322 | 341.03 | 1.06 | |||||
| Moderate | 75 | 72.26 | 0.10 | |||||
| Low | 10 | 6.75 | 1.57 | |||||
| Very Low | 0 | 0 | 0 | |||||
| Location of School | Rural | Very High | 36 | 29.44 | 1.46 | 3 | 11.03 | 0.0116 p<0.05 |
| High | 144 | 137.66 | 0.29 | |||||
| Moderate | 19 | 29.17 | 3.54 | |||||
| Low | 0 | 2.73 | 2.73 | |||||
| Very Low | 0 | 0 | 0 | |||||
| Urban | Very High | 72 | 78.56 | 0.55 | ||||
| High | 361 | 367.34 | 0.11 | |||||
| Moderate | 88 | 77.83 | 1.33 | |||||
| Low | 10 | 7.27 | 1.02 | |||||
| Very Low | 0 | 0 | 0 | |||||
| Categories of School | Government | Very High | 39 | 45.27 | 0.88 | 3 | 12.94 | 0.0048 p<0.05 |
| High | 229 | 211.68 | 1.41 | |||||
| Moderate | 38 | 44.85 | 1.05 | |||||
| Low | 0 | 4.19 | 4.19 | |||||
| Very Low | 0 | 0 | 0 | |||||
| Private | Very High | 69 | 62.73 | 0.63 | ||||
| High | 276 | 293.32 | 1.02 | |||||
| Moderate | 69 | 62.15 | 0.75 | |||||
| Low | 10 | 5.81 | 3.01 | |||||
| Very Low | 0 | 0 | 0 | |||||
| Stream of Teachers | Science | Very High | 62 | 46.14 | 5.47 | 3 | 26.03 | 0.0001 p<0.05 |
| High | 198 | 215.67 | 1.44 | |||||
| Moderate | 42 | 45.73 | 0.30 | |||||
| Low | 10 | 4.27 | 7.71 | |||||
| Very Low | 0 | 0 | 0 | |||||
| Arts | Very High | 46 | 61.86 | 4.08 | ||||
| High | 307 | 289.33 | 1.07 | |||||
| Moderate | 65 | 61.27 | 0.23 | |||||
| Low | 0 | 5.73 | 5.73 | |||||
| Very Low | 0 | 0 | 0 | |||||
| Qualification | TGT | Very High | 20 | 17.90 | 0.25 | 3 | 9.54 | 0.023 p < .05 |
| High | 76 | 83.66 | 0.71 | |||||
| Moderate | 20 | 17.73 | 0.29 | |||||
| Low | 5 | 1.66 | 6.70 | |||||
| Very Low | 0 | 0 | 0 | |||||
| PGT | Very High | 88 | 90.10 | 0.05 | ||||
| High | 429 | 421.34 | 0.14 | |||||
| Moderate | 87 | 89.27 | 0.06 | |||||
| Low | 5 | 8.34 | 1.34 | |||||
| Very Low | 0 | 0 | 0 | |||||
|
Age |
20-33 | Very High | 81 | 73.47 | 0.77 | 6 | 15.32 | 0.018 p<0.05 |
| High | 339 | 343.44 | 0.057 | |||||
| Moderate | 67 | 72.77 | 0.458 | |||||
| Low | 10 | 6.80 | 1.507 | |||||
| Very Low | 0 | 0 | 0 | |||||
| 34-47 | Very High | 26 | 31.64 | 1.005 | ||||
| High | 155 | 148.04 | 0.327 | |||||
| Moderate | 33 | 31.33 | 0.088 | |||||
| Low | 0 | 2.93 | 2.93 | |||||
| Very Low | 0 | 0 | 0 | |||||
| 48-60 & Above | Very High | 1 | 2.81 | 1.164 | ||||
| High | 11 | 13.16 | 0.354 | |||||
| Moderate | 7 | 2.78 | 6.35 | |||||
| Low | 0 | 0.26 | 0.26 | |||||
| Very Low | 0 | 0 | 0 | |||||
| Overall | 3 | 800.47 |
0.00001 p<0.05 |
|||||
Table 9.
Significant difference regarding the behaviours of teachers on Augmented Reality Applications (ARA) in which t-tests were used to calculate the significant difference between the two groups (variables). The table presents the Mean (M), Standard Deviation (SD), Standard Error of the Mean (SEM), Number of Adolescents (N), Standard Error of the Difference (SED), Degrees of Freedom (df), and the t and p values for the gain scores of variables of teachers.
| Variables | Mean | SEM | N | SD | SED | df | t-value | p-value | |||||
|---|---|---|---|---|---|---|---|---|---|---|---|---|---|
| Gender | Male | M1 | 71.06 | SEM1 | 0.63 | N1 | 237 | SD1 | 9.77 | 0.828 | 728 | 0.2503 | 0.8024 |
| Female | M2 | 70.85 | SEM2 | 0.49 | N2 | 493 | SD2 | 10.79 | |||||
| Location | Urban | M1 | 70.33 | SEM1 | 0.47 | N1 | 531 | SD1 | 10.93 | 0.867 | 728 | 2.4879 | 0.0131 |
| Rural | M2 | 72.49 | SEM2 | 0.63 | N2 | 199 | SD2 | 8.93 | |||||
| Types of Organisations | Government | M1 | 71.27 | SEM1 | 0.56 | N1 | 306 | SD1 | 9.88 | 0.785 | 728 | 0.7721 | 0.4403 |
| Private | M2 | 70.67 | SEM2 | 0.53 | N2 | 424 | SD2 | 10.87 | |||||
| Academic Streams | Science | M1 | 70.90 | SEM1 | 0.64 | N1 | 312 | SD1 | 11.22 | 0.783 | 728 | 0.0413 | 0.9670 |
| Arts | M2 | 70.93 | SEM2 | 0.48 | N2 | 418 | SD2 | 9.87 | |||||
| Designation | TGT | M1 | 70.63 | SEM1 | 1.01 | N1 | 121 | SD1 | 11.13 | 1.042 | 728 | 0.3348 | 0.7378 |
| PGT | M2 | 70.98 | SEM2 | 0.42 | N2 | 609 | SD2 | 10.33 | |||||
| Experience | High Experience (41-60 years) | M1 | 68.95 | SEM1 | 1.03 | N1 | 92 | SD1 | 9.89 | 1.165 | 728 | 1.9389 | 0.0529 |
| Low Experience (20-40 years) | M2 | 71.20 | SEM2 | 0.42 | N2 | 638 | SD2 | 10.52 | |||||
Table 10.
Multiple Correlation among the teachers' perception, attitudes and behaviours regarding augmented reality applications (ARA).
Table 10.
Multiple Correlation among the teachers' perception, attitudes and behaviours regarding augmented reality applications (ARA).
| Multiple Correlations Coefficient | ||||
|---|---|---|---|---|
| Domain of Teachers | Perception of Teachers on ARA | Attitudes of Teachers on ARA | Behaviour of Teachers on ARA | |
| Perception of Teachers on ARA | Correlation r | 1.00 | 0.34 | 0.21 |
| Sig. (2-tailed) | - | p <.001 | p<.001 | |
| N | 730 | 730 | 730 | |
| Attitudes of Teachers on ARA | Correlation r | 0.34 | 1.00 | 0.63 |
| Sig. (2-tailed) | p<.001 | - | p<.001 | |
| N | 730 | 730 | 730 | |
| Behaviour of Teachers on ARA | Correlation r | 0.21 | 0.63 | 1.00 |
| Sig. (2-tailed) | p<.001 | p<.001 | - | |
| N | 730 | 730 | 730 | |
| Coefficient of Multiple Correlation (R) = 0.39 | ||||
Table 11.
Significant difference regarding the perception, attitudes and behaviour of teachers on Augmented Reality Applications (ARA) in which t-tests and F test were used to calculate the significant difference between the two groups and among the three groups (variables). The table presents the Mean (M), Standard Deviation (SD), Standard Error of the Mean (SEM), Number of Adolescents (N), Standard Error of the Difference (SED), Degrees of Freedom (df), and the t and p values for the gain scores of variables of teachers.
| Variables | Mean | SEM1 | N | SD | SED | df | t-value | p-value | |||
|---|---|---|---|---|---|---|---|---|---|---|---|
| Perception | M1 | 51.96 | SEM1 | 0.47 | 730 | SD1 | 12.82 | 0.461 | 729 | 44.6612 | <0.0001 |
| Attitudes | M2 | 72.53 | SEM1 | 0.27 | SD2 | 7.41 | |||||
| Perception | M1 | 51.96 | SEM1 | 0.47 | 730 | SD1 | 12.82 | 0.547 | 729 | 34.6312 | <0.0001 |
| Behaviour | M2 | 70.92 | SEM1 | 0.39 | SD2 | 10.46 | |||||
| Attitudes | M1 | 72.53 | SEM1 | 0.27 | 730 | SD1 | 7.41 | 0.304 | 729 | 5.2867 | <0.0001 |
| Behaviour | M2 | 70.92 | SEM1 | 0.39 | SD2 | 10.46 | |||||
Table 12.
The Sum of Squares (SS), Degrees of Freedom (df), Mean Square (MS), F-values, and critical values were obtained from the scores of teachers regarding their perception, attitudes and behaviour on augmented reality application (ARA).
Table 12.
The Sum of Squares (SS), Degrees of Freedom (df), Mean Square (MS), F-values, and critical values were obtained from the scores of teachers regarding their perception, attitudes and behaviour on augmented reality application (ARA).
| Domain | Source of Variation | SS | df | MS | F value | p value |
| Teachers’ perception, attitudes and behaviour on ARA | Between Groups | 191036.2556 | 2 | 95518.1278 | 871.5964 | < 0.001 |
| Within Groups | 239673.0137 | 2187 | 109.59 | |||
| Corrected Total | 430709.2693 | 2189 | 196.76 |
Table 13.
This table presents the thematic analysis of participants’ statements regarding their perceptions, attitudes, and behaviors toward the use of Augmented Reality (AR) applications.
Table 13.
This table presents the thematic analysis of participants’ statements regarding their perceptions, attitudes, and behaviors toward the use of Augmented Reality (AR) applications.
| Theme | Summary | Sample data as examples |
|---|---|---|
| Thematic analysis of the participant’s based on the given questions | ||
| RQ1. What are the strategies that you think suitable for using Augmented Reality applications in the classroom situation? | ||
| Basic factors and suitable strategies for using Augmented Reality applications in the classroom. | Limited knowledge, lack of interest, and low motivation influence Indian school teachers' perceptions, attitudes and behaviours of augmented reality applications in educational settings. |
R19, R33: ‘I have seen AR being used in various videos several times, but I still don’t fully understand how it is applied in practice……since I teach in a rural school, neither the administration nor my fellow teachers show much interest in exploring new ideas or technologies.’ R1, R11, R70: ‘…. strategies for using AR in normal classroom is difficult… …..according to me teachers can use their own mobile if they are familiar to use AR in the class room situation… ...it totally depends upon the will power and interest of the teachers….’ R20, R81, R88, R57: ‘….in my school, most teachers are not interested in exploring new knowledge…...since I have some basic understanding of using AR…….I use my own smartphone and divide the class into small groups, allowing each group 5 minutes with the AR activity…….group-based approach by using a single device, I am able to make my classes more engaging and interactive with AR.’ R79, R31: ‘Although using AR in our school is challenging, I make an effort to incorporate it whenever possible……due to poor internet connectivity, I download AR models for my subject in advance, allowing me to teach without relying on an internet connection.’ |
| Passionate teachers can apply various approaches in the classroom, such as Bring Your Own Device (BYOD) or Use Your Own Gadgets (UYOG), group activities using a single device, and pre-downloading AR content. | R5, R61: ‘If a teacher is personally interested in using AR, they can effectively use their own mobile device…..any compatible gadget to benefit the students.’ R2, R10: ‘……if teachers are aware about the AR then they can simply use BYOD (Bring Your Own Device) approach for their learners……it’s all about how passionate you are in the teaching profession…’ R12: ‘Instead of having traditional way of teaching teachers can easily use their own smartphone i.e. UYOG (Use Your Own Gadgets) for applying AR in their class room situation.’ R4, R87: ‘…there are many free Apps for AR for all types of subjects…….if teachers are aware they can without difficulty use it by their smartphone in the class….’ |
|
| Through parent-teacher meetings (PTMs), teachers can raise awareness and encourage parents to use AR at home. | R53, R38: ‘….teachers who are aware about the use of AR they can use it in many ways; …..I believe smartphone is the suitable way to make friendly use of AR for teaching process in the class.’ R28, R65, R47: ‘…..teachers' knowledge alone is not enough for the effective use of AR with students; …..I believe parents should also be aware of AR…..we can invite parents to attend AR demonstrations during parent-teacher meetings (PTMs)…’ |
|
| RQ2. What types of disadvantages or challenges do you face while using Augmented Reality (AR) applications? | ||
| Challenges and limitations that faced by teachers while using AR applications in the classroom. |
Multiple challenges faced by the teachers in using AR, including poor infrastructure, software and hardware issues, power shortages, and lack of proper equipment which significantly influence their perceptions, attitudes, and behaviors toward augmented reality applications in Indian educational settings. | R26, R3: ‘…the main problem of using AR in our school is unavailability of required devices which support to run AR…….in our school there is a big problem of lack of infrastructure, no one is ready to support implementation cost.’ R80, R36, R63: ‘………no doubt it is infrastructural issues including network……infrastructure is not available…..technological challenges can disrupt the learning process…..’ R9, R83: ‘In our school few teachers are interested to use AR or other technology-based teaching approach but due to power shortages internet does not work properly and the interested teacher become demotivated……..teachers use their own internet which are there in their smartphone.’ R55, R7: ‘due to lack of proper equipment in the classroom we cannot even think to use any ICT based tools………technological issues, projection problems, light or sound system issues etc.’ R84, R25, R8: ‘High costs of implementation…..high cost of technological inhibitions, privacy and security…….software glitches, hardware malfunctions and connectivity problems.’ |
| Younger teachers are generally tech-savvy, many older teachers struggle to updating their skills and these demographic factors influence teachers’ attitudes towards adopting new educational technologies. | R42, R66: ‘In our school the young teachers are quite aware about the use of technology like AR……they have been using based on their own interest but many experienced and old teachers they do not want to update their knowledge in any sphere.’ R31, R19, R70: ‘….the high implementation cost, along with technology and skill gaps, makes AR use uncommon in many cases………resource scarcity and competing priorities further limit its adoption……….creating AR content is often customized and expensive, and the lack of expertise makes it difficult to align with specific topics. Currently, I have no experience using AR in the classroom….’ R82, R14: ‘The presence of skilled teachers who can effectively use technology is absolutely essential……..our school faces a significant lack of administrative support for implementing such technological initiatives.’ |
|
| Administrative support is lacking, and some teachers fear using technology—even smartphones. | R39, R86, R71: ‘At our school, most teachers prefer traditional teaching methods and show little interest in updating their knowledge…….neither participate in training programs nor engage in self-study, which leaves them unfamiliar with modern technology………many are even afraid to use their smartphones and struggle to build the confidence needed to integrate technology into their teaching.’ R77, R44: ‘Classroom arrangement is a major issue when using AR in my class…...the disadvantages I have faced while teaching with Augmented Reality (AR) include data privacy concerns, hardware storage limitations, and potential social isolation, along with compatibility issues.’ |
|
| Teachers are concerned about data privacy, personal safety, health issues, completing the syllabus on time, and effectively integrating diverse learners within the same classroom. | R6: ‘While using augmented reality in the classroom, it becomes quite difficult to integrate all types of learners into a single lesson.’ R29, R52: ‘…due to health, safety, and data privacy concerns, I often avoid using technology-based teaching-learning materials (TLMs)……the use of technology can also have societal impacts and may lead to social isolation…..’ R62, R75: ‘……my concerns include technical limitations, hardware issues, health and safety risks, high costs…….technological barriers, and privacy and security concerns….’ |
|
| Teachers’ are also worry about students will be getting distracted from their academic goals due to excessive screen time, developing binge-watching habits, Social isolation, and showing reduced interest in reading books and writing answers. | R49, R78: ‘The use of AR technology often promotes distractions among learners…….diverting them from their academic goals……’ R34, R16: ‘….I believe such applications pose a risk of creating dependency on technology, resulting in reduced interest in reading books and…….writing answers among the learners….’ R76, R60: ….to the best of my knowledge, it may lead to addiction to digital devices……raise cost-related concerns…..’ |
|
| RQ3. Do you have any suggestions or expectations regarding Augmented Reality (AR) applications for the improvement of their overall usage? | ||
| Suggestions and expectations regarding the use of Augmented Reality in classroom settings. | Adequate resources include supportive devices and updated software necessary to run AR-based programs effectively in institutions regardless of their place or location to foster teachers’ behaviour on AR. | R21, R40: ‘Institution need to focus on availability of resources, administrative support, training opportunities etc…..there must have the need for teacher training…..’ R45, R73: …Teacher should be trained to use AR in the class room situation….updated always…..’ R15, R59: ‘….private institution can easily purchase tablet or mobile from the school fund……can teach by different topic in interesting way by using AR through tablets in rotation wise….’ R17, R58, R85: ‘….in rural schools technology and education system must be improved……..the devices should be more affordable…..keep strong internet and trainings……’ |
| Administrators should provide support by organizing training programs focused on the use and implementation of Augmented Reality (AR) in education. | R35, R69: ‘….proper planning and support, AR can still be a valuable tool for enhancing teaching and learning experiences…..’ R56: ‘Increase digital involvement among the teachers.’ R67, R30: ‘We need to propagate peer influence, student engagement…….engaging and interactive for students of all ages.’ |
|
| Awareness programs on health, data security, and privacy should be conducted not only for teachers but also for learners to ensure responsible and safe use of technology. | R24, R50: ‘…..by addressing technology-based aspects, AR applications can continue to evolve and improve, providing users with more engaging, accessible, and effective learning experiences………..prioritize user privacy and data security, adhere to ethical guidelines, and mitigate potential risks associated with AR technology, such as addiction and misinformation……..’ R13, R74: ‘…..awareness should be spread about the proper use of AR in the classroom, Schools and institutions should encourage the use of this technology……we should aware of AR and how to use it in the classroom situation ….’ |
|
| Technology and AR-based programs should be integrated into the curriculum as essential components of modern education. | R32, R68: ‘…..it has to be the part of curriculum for learning the plugin points……make it an essential part of curriculum…..’ R43: ‘..….provide educators with the ability to customize AR content to better suit their specific curriculum and instructional goals….’ R51: ‘I think Augmented Reality app should be more reliable on knowledge and easy to use.’ |
|
| RQ4. Specify your area of specialization (Subject) & mention the problems and prospects, if any, regarding the use of Augmented Reality applications in your specific area of teaching. | ||
| Subject-wise major issues in using Augmented Reality. |
Teachers express mixed opinions about integrating AR into the teaching-learning process. Some teachers of Mathematics, Science, Social Science, and Language use AR without facing major issues, while others in the same subjects’ encounter challenges, particularly when applying AR to practical or application-based topics. |
R18, R64: ‘In Mathematics I do not face problem of using AR……problem includes aligning AR content with specific concepts. Prospects include visualizing shapes and interactive problem-solving…’ R27: ‘Issues of ensuring accurate models and content in my science subject in terms of virtual experiments and historical simulations.’ R72, R41: ‘…..my mother subject is biology, as I am not using these technologies on daily basis…….I am not facing major problems regarding classroom teaching…..’ R37, R46: ‘There is a big challenge of finding effective literacy-enhancing AR regarding immersive storytelling and vocabulary building……..while teaching my subject use of AR can be quite useful.’ R22, R54: ‘….sourcing accurate content and cultural sensitivity are the major challenges of using AR on social science subjects……….focusing on virtual tours and historical event simulations….’ R23, R48: ‘….since music is a bit of a practical work, it's a matter of the need of the AR in the music class that some theoretical ones that may be the historical context or they need it when discussing that topic……if there is no such equipment in the class to think about those things, it becomes an easier to give that idea….’ |
Disclaimer/Publisher’s Note: The statements, opinions and data contained in all publications are solely those of the individual author(s) and contributor(s) and not of MDPI and/or the editor(s). MDPI and/or the editor(s) disclaim responsibility for any injury to people or property resulting from any ideas, methods, instructions or products referred to in the content. |
© 2025 by the authors. Licensee MDPI, Basel, Switzerland. This article is an open access article distributed under the terms and conditions of the Creative Commons Attribution (CC BY) license (http://creativecommons.org/licenses/by/4.0/).
Copyright: This open access article is published under a Creative Commons CC BY 4.0 license, which permit the free download, distribution, and reuse, provided that the author and preprint are cited in any reuse.


