Submitted:
27 June 2025
Posted:
01 July 2025
You are already at the latest version
Abstract
Background/Objectives: Gut microbial metabolism of choline and related quaternary amines to trimethylamine (TMA) is the first step in production of trimethylamine N-oxide (TMAO), a circulating metabolite that contributes to the development of atherosclerosis and other forms of cardiovascular disease (CVD). No data exist on regional differences in TMA production within the colon due to difficulties studying gut regions in vivo. A better understanding of TMA production by gut microbiota is needed to develop strategies to limit TMA production in the gut and TMAO levels in circulation with the goal of reducing CVD risk.
Methods: We employed our novel 3-compartment MiGut in vitro model, which establishes three distinct microbial ecologies mimicking the proximal, mid and distal colon to study conversion of choline to TMA by human gut microbiota using isotopically labelled substrate.
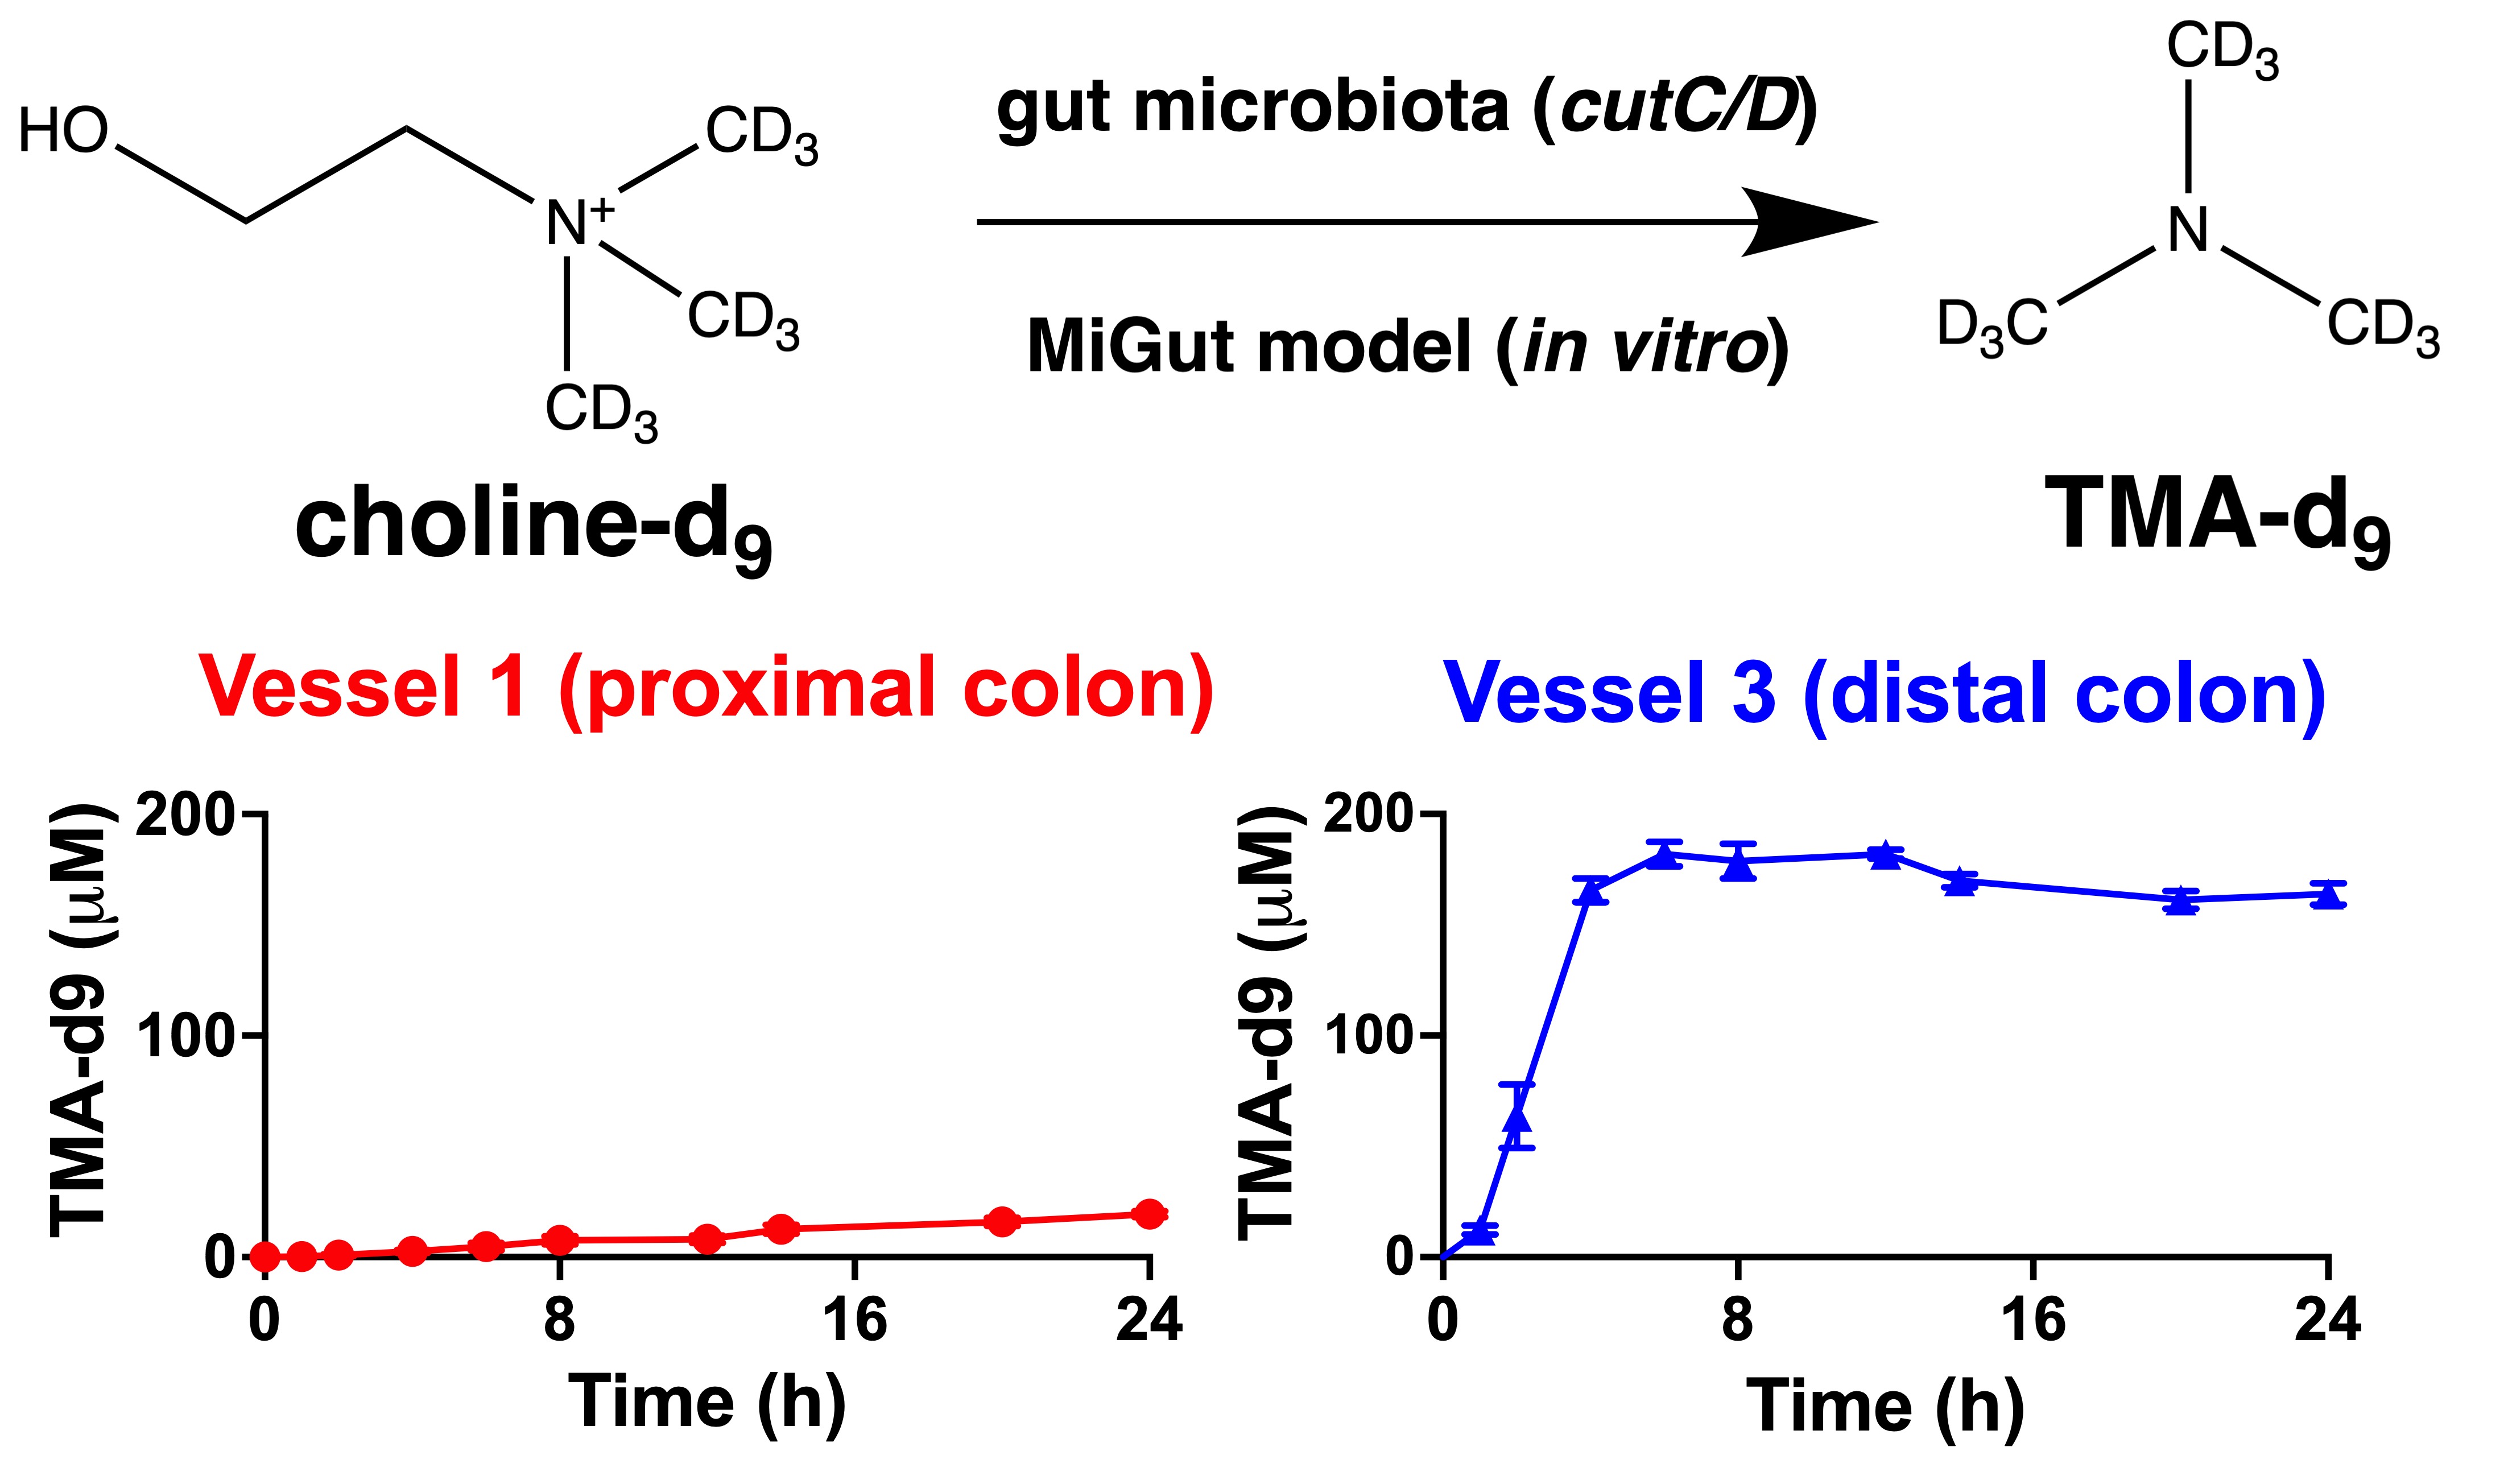
Results: Choline-d9 was almost completely converted to TMA-d9 in vessels 2-3 (mimicking the mid and distal colon) within 6-8 h, but little conversion occurred in vessel 1 (mimicking the proximal colon). Abundance of cutC, part of the cutC/D gene cluster responsible for choline conversion to TMA, was highest in vessel 1 vs 2/3, suggesting that its expression or activity (or the viability/activity of bacteria expressing cutC) may be suppressed in the proximal colon.
Conclusions: This novel finding suggests that, while bacteria capable of converting choline to TMA exist throughout the colon, their activity may be different in distinct colon regions. The regional specificity of TMA production, if confirmed in vivo, has implications for both basic microbial ecology related to CVD and development of strategies to control TMA and TMAO production with the goal of lowering CVD risk. These findings warrant further study in vitro and in vivo.
Keywords:
gut microbiome
; trimethylamine
; trimethylamine N-oxide’ cutC
; choline
; TMA lyase
1. Introduction
Cardiovascular disease (CVD) is a global public health crisis[1] and is the leading cause of death worldwide[2,3]. Recently, interest has grown in the epidemiological and mechanistic relationships between the gut microbiome and CVD[4,5,6]. In 2011, the metabolite trimethylamine N-oxide (TMAO) was first associated with CVD[7]. TMAO is formed by sequential metabolism by select members of the commensal gut microbiome and the host[7,8]. First, trimethylamine (TMA) is released from dietary choline by specific bacteria containing the cutC/D gene cluster, which encodes choline TMA lyase. TMA that is absorbed into the circulation and then oxidized to TMAO by hepatic flavin-containing monooxygenase 3 (FMO3)[7,8]. Other quaternary amines such as carnitine and betaine, from exogenous (i.e., diet) or endogenous (phospholipid membranes, etc.) can also be converted to TMA by related bacterial TMA lyases[9,10,11,12]. Strategies to limit TMAO concentrations in circulation include reduced substrate intake, targeting bacterial TMA production, and targeting FMO3 conversion of TMA to TMAO. For various reasons, reducing bacterial production of TMA in the gut appears to be the most promising[13,14,15,16,17]. Given the lack of approved pharmacological interventions to prevent or reverse elevated TMAO concentrations or reduce bacterial TMA production, there is continuing interest in developing both drugs and lifestyle interventions (diet, etc.) to achieve this outcome to lower CVD incidence and burden. Such approaches are progressing in areas such as development of pharmaceutical choline TMA lyase inhibitors[16,17], as well as exploration of dietary compounds that lower TMA production by various as-yet unknow mechanisms[18,19,20,21].
Given the interest in strategies to reduce TMA generation in the colon, there is a need for in vitro models of conversion of choline and other quaternary amines to TMA with suitable fidelity to in vivo conditions, sufficient throughput to meet experimental needs, and comparative ease of use. Various in vitro models have been proposed for studying choline conversion to TMA, including ex vivo fecal fermentation[16,22,23], pure bacterial culture of TMA producers such as Proteus mirabilis[16,17] or bacteria transfected with cutC/D[16,17], or non-viable lysates of such bacteria[16,17]. Finally, purified choline TMA lyase (CutC/D proteins) have been utilized[24]. We previously developed and validated a high-throughput 96-well anaerobic fecal fermentation method to study bacterial TMA production[18,19]. Using fecal inocula and isotopically labelled substrate (choline-d9), this method shows absolute dependence on the presence of fecal bacteria, no background interference (substrate or product) and essentially 1:1 conversion of choline-d9 to TMA-d9, with ~100% conversion in untreated controls within 12-24 hours depending upon the inoculum and other experimental parameters. We have employed this system to study the capacity of individual bioactive compounds as well as foods to reduce TMA production[18,19,20,21]. The advantages of this system are the use of labelled substrates and high-throughput capacity. However, there are significant drawbacks to this approach. First, this model uses reanimated fecal inocula without allowing the system to stabilize. Second, our model is a single-compartment model that does not establish nor differentiate the distinct ecological regions of the lower gut. Finally, ours is a static batch model that does not involve continuous flow of nutrients and fluid into, through, and then out of the system. Thus, our system is ideal for rapid, high-throughput screening to identify promising lead compounds, but a system with greater fidelity to in vivo conditions is required for further in-depth investigation of TMA formation and its inhibition for translation to animal models and human trials.
There are various rigorous and well-characterized stabilized and multi-compartment in vitro models of the colon, including the TNO in vitro model of the colon (TIM-2)[25] and Simulator of the Human Intestinal Microbial Ecosystem (SHIME®)[26]. These systems are fully stabilized, have regional differences, and successfully model the microbiome ecologies of the colon. The drawbacks of these models are their size, cost, and most importantly, their very low throughput. These models are ideal for final validation of in vitro results prior to human studies, but are not well suited to studying the gut microbiome with multiple treatments and significant replication. We recently published validation of the MiGut model[27], a 3-stage model mimicking conditions in the proximal, mid and distal colon with continuous flow from proximal → distal. The model is seeded with human feces and stabilized for ~12 days prior to experiments. The system is monitored by automated data collection and tracking of resident microbial populations. The model is small and scalable: each MiGut platform has 4 parallel guts with 3 regions each. To the best of our knowledge, no data exist on regional differences in cutC/D abundance and/or spatial-temporal TMA production in vivo. The MiGut model represents an opportunity to perform gut microbiome modelling of the various regions of the colon with greater fidelity to in vivo conditions than our previous 96-well static model, but with greater throughput than the SHIME model. This model may be particularly useful for studying TMA production and strategies to inhibit the same, with a view to translating experimental findings to preclinical models. The objective of the present study was to characterize the spatial-temporal metabolism of choline-d9 to TMA-d9 in MiGut to demonstrate this model’s utility for studying regional differences in colonic TMA production.
2. Materials and Methods
2.1. Preparation of Faecal Slurry
Single faecal samples from healthy donors (aged >30 years with no history of antimicrobial usage in the previous 6 months) were used to make a faecal slurry (10% w/v) using pre-reduced PBS and filtered to remove large particulate matter. Faecal samples were kept anaerobic using anaerobic sachets (Oxoid, UK) inside the collection zip bag and were used within 24 hours of production. Each vessel of each MiGut model was seeded with 35 mL of this faecal slurry to start the experiment. The collection and use of human faeces in our gut model has been approved by the Business, Environment, Social Sciences (BESS+ FREC) Ethics Committee, University of Leeds (0624 - The interplay between nutrition and the gut microbiota). Participants were provided with a participant information sheet (PIS) detailing a lay summary of the in vitro gut model and the scientific work they are contributing to by providing a faecal donation. Within this PIS, it is explained that by providing the sample, the participant is giving informed consent for that sample to be used in the gut model.
2.2. MiGut Model Setup
MiGut models were set up as described previously[27]. Briefly, each MiGut reactor base was fitted with a lid, sampling ports, media/acid/alkaline/nitrogen connectors, and tubing, then autoclaved as a single unit prior to use. The EasyFerm Plus PHI Arc 120 pH probes (Hamilton Company, Switzerland) were sterilised and calibrated prior to inserting into the MiGut models. Each vessel is pH controlled at V1=5.5 (± 0.1), V2=6.25 (± 0.1), and V3=6.75 (±0.1), with 0.1 M HCl or 0.1 M NaOH was used to maintain these pH ranges. Each MiGut reactor is temperature controlled at 36.5 °C (± 0.5 °C), sparged with nitrogen (99% purity), and a media flow rate equivalent to (D=0.015 h-1) to reflect in vivo colonic conditions (Supplementary Figure S1). Media composition is outlined in Supplementary Table S1.
2.3. Choline-d9 Fermentations
2.3.1. Experiment 1 Timeline
To determine if MiGut could be used to assess the microbial metabolism of choline to TMA, 4 MiGut models were seeded with the same faecal slurry from a single donor, which assessed between model reproducibility. The microbial populations were allowed to stabilise for two-weeks, which allowed different microbiota profiles to establish in each vessel based on the physiochemical conditions of that vessel (Supplementary Figure S2). At this point, the media was turned off, which kept the microbial ecologies in the three vessels separated due to the media flow restriction, but the other environmental parameters were unchanged. Choline-d9 chloride (Cambridge Isotope Laboratories, Tewksbury, MA, USA) was added to each vessel of each model at a final concentration of 150 µM. Samples were collected at 0 (before choline-d9 addition), 1, 2, 3, 4, 5, 6, 8, 12, 14, 20 and 24 hr after choline addition. Each sample was immediately mixed 1:1 with acetonitrile and snap frozen.
2.3.1. Experiment 2 Timeline
To determine if choline metabolism could be detected using a different faecal microbial ecology, and to sample earlier timepoints after choline installation, we performed a further 2 MiGut models seeded with a different faecal slurry to the first experiment. Similar to the first experiment, a faecal slurry from a single donor was used to seed each vessel of 2 MiGut models, and the microbial populations allowed to stabilise for two-weeks. The media pump was stopped before the addition of choline -d9 chloride at a final concentration of 150 µM. Samples were collected at 0 (before choline-d9 addition), 5, 15, 30 and 45 min, 1, 1.5, 2, 3, 4, 5, 6, 8, and 24 h. Each sample was immediately mixed with 1:1 with acetonitrile and snap frozen.
2.4. Measurement of Choline-d9 and TMA-d9
Choline-d9 and TMA-d9 were quantified in fermentation samples as described previously[18,20,21]. To extract choline-d9, 25 μL of fermentation sample were mixed with 10 μL of ZnSO4 solution (5 % w/v in water), 100 μL acetonitrile and 20 μL choline-1-13C-1,1,2,2-d4 chloride [internal standard (IS) 10 μM, MilliporeSigma, Burlington, MA, USA] in 96-well plates. After sonication for 5 min in a water bath, samples were filtered through AcroprepAdv 0.2 μm WWPTFE 96-well filtering plates (Pall Corporation, Port Washington, NY, USA) by centrifugation (10 min, 3,400 x g), collected in a fresh 96-well collection plate and frozen at –80 °C until UPLC-MS/MS analysis. TMA-d9 requires a derivatization process to the quaternary amine compound ethyl betaine-d9 to facilitate LC-MS/MS ionization. Briefly, 25 μL of fermentation sample were mixed with 20 μL of TMA-13C3-15N chloride IS solution (20 μM, MilliporeSigma) for derivatization of TMA-d9 (to ethyl betaine-d9) or TMA-13C3-15N (to ethtylbetaine-13C3-15N), 8 μL 32% ammonia and 120 μL aqueous ethyl bromoacetate (20 mg/mL, MilliporeSigma), and let sit for 30 min. Then, 120 μL 50 % acetonitrile/0.025 % formic acid in distilled water were added. TMA-d9 samples were filtered and stored as described above. Refer to Supplementary Figure S2 for structures and derivatization schemes.
After extraction, choline-d9, ethylbetaine-d9, and their respective IS compounds (choline-1-13C-1,1,2,2-d4 and ethtylbetaine-13C3-15N) were analyzed by UPLC-ES-MS/MS. TMA-d9 and TMA-13C3-15N were analyzed separately from choline-d9 and choline-1-13C-1,1,2,2-d4, but with the same UPLC-ESI-MS/MS method. Briefly, separation was achieved on a Waters Acquity UPLC system (Milford, MA, USA) with an ACQUITY BHE HILIC column (1.7 μm, 2.1x100 mm) coupled to a Waters ACQUITY BHE HILIC guard column (1.7 μm, 2.1x5 mm) (Waters). Mobile phases consisted of 5 mM ammonium formate in water (pH 3.5) (A) and acetonitrile (B). The gradient was isocratic at 80 % B for 3 min, with a flow rate of 0.65 mL/min. Colum temperature was 30°C, and autosampler at 10°C. Quantification was achieved with a Waters Acquity triple quadrupole mass spectrometer. Source and capillary temperatures were 150 and 400°C, respectively. Capillary voltage was +0.60 kV, and desolvation and cone gas flows (both N2) were set at 800 and 20 L/h, respectively. Electrospray ionization (ESI) was operated in positive mode, and data were acquired by multiple reaction monitoring (MRM) in MS/MS mode. MRM fragmentation conditions of analytes and IS compounds can be found in Table 1.
For sample quantification, serial dilutions (0-400 µM) of choline-d9 and TMA-d9 standards were prepared to obtain external calibration curves in a relevant background matrix. Standards were then prepared by the same extraction (and derivatization) methods used for fermentation samples and analyzed by UPLC-MS/MS. Samples were quantified by interpolating the analyte/IS peak abundance ratio using the standard curves. Data acquisition was carried out using MassLynx software (V4.1, Waters).
2.5. Microbiome Analysis
In a separate MiGut experiment using the same faecal donor as experiment 1, we determined the spatial microbial ecologies between the first and last vessels in the MiGut system, using taxonomic analysis via shotgun metagenomic sequencing to identify the microbial differences.
2.5.1. DNA Extraction and Sequencing
Upon reaching steady state, 1 mL samples from vessels 1 and 3 were added into Lysis matrix E bead tubes (Qiagen), and the microbial cells were harvested by centrifugation at 14,000 rpm for 10 minutes. The DNA was extracted from these microbial pellets using the FastDNA spin kit for soil (MP Biomedicals) following manufacturer’s instructions. DNA was stored at -80 °C for downstream analysis. Metagenomic library preparation and sequencing was done by the University of Leeds Genomics Facility. Extracted DNA was diluted to 500 ng and sheared to 200-300 bp using an E220 focused ultrasonicator (Covaris, U.K.). NEBNext Ultra DNA Library prep kit for Illumina was used for adaptor ligation and to PCR enrichment following manufacturer’s instructions. Libraries were sequenced using Illumina HiSeq 3000 sequencer (University of Leeds).
2.5.2. Metagenomic Sequence Analysis
Sequence reads underwent quality control (using FastQC; v0.11.9) before removing the adapter sequences and low-quality bases (Trimmomatic; v0.39). Forward and reverse reads were paired (PEAR; v0.96) and aligned against the NCBI non-redundant sequence database (NCBI-nr database) using DIAMOND (v2.0.8), and MEGAN6 (v6.22.2) used for taxonomic analysis.
2.6. cutC Quantitative PCR
Primers N24 (AACTTAACGAGGCGCTCAAA) and N27 (AGTATGCTGGCAGAGCGAAT) were used to determine the presence of cutC in vessels 1, 2, and 3 as described by Wang et al. [28]. Briefly, extracted DNA was diluted to 5 ng/µL by Qubit dsDNA BR assay for use in SYBR green quantitative PCR (qPCR) (QIAGEN QuantiNOVA SYBR master mix) following manufacturer’s instructions. The qPCR programme [initial denaturation: 95 °C for 5 min; amplification: 45 cycles (95 °C 30s, 54 °C 30s, 72 °C 2 min)] was designed for amplification of low abundance targets on a QTower3 Thermocycler (Analytik Jena). A melt curve was used to determine specificity. Results are expressed as mean ±SD Ct values from 3 technical replicates on the same qPCR plate.
2.7. Data Analysis and Statistics
For choline-d9 and TMA-d9 kinetics data, area-under-the-curve (AUC) values were calculated for each replicate and vessel using Microsoft Excel plugins. Any negative values were converted to 0 prior to AUC calculation. AUC values were analyzed by 1-way ANOVA with Tukey’s post hoc test to compare group means. Data analysis and graphing were performed using Prism version 10.3.1 (GraphPad, La Jolla, CA)
3. Results
3.1. Choline-d9 Conversion to TMA-d9 Differs by Simulated Colon Region
Allowing the microbiota to reach steady state within the three vessels resulted in a differentiated microbiome established between the vessels with shared and unique bacterial taxa (genera) amongst the three compartments (Supplementary Figure S3). This metagenomics approach identified 70 different bacterial genera in vessel 1, 28 of which were uniquely found in vessel 1. The number of different bacterial genera increased in the other vessels, where vessel 3 supported 182 bacterial genera, of which 140 were unique to vessel 3 compared with vessel 1. Stopping the media flow, we were able to isolate these ecologies to assess the microbial choline-d9 conversion to TMA-d9 in each region of the MiGut model over 24 h. The results of Experiment 1, using n=4 parallel gut models, are shown in Figure 1. Choline-d9 was rapidly utilized in vessels 2-3 (representing the mid and distal colon) with most choline-d9 used within the first 6 h, but little choline-d9 metabolism was observed in vessel 1 (proximal) (Figure 1A). TMA-d9 appearance kinetics mirrored choline-d9 utilization kinetics, with TMA-d9 rapidly reaching maximal levels in 6 h in vessels 2-3, with very little TMA-d9 production over 24 h in vessel 1 (Figure 1B). AUC values for choline-d9 and TMA-d9 are shown in Figure 1C,D, respectively. AUCs agree with the kinetic curves, indicating that vessel 1 had significantly greater choline-d9 concentrations (i.e., little utilization) and lower TMA-d9 production compared to vessels 2-3, which were essentially identical. The only difference between vessels 2-3 was that choline-d9 utilization appeared to be more rapid in vessel 3 than in vessel 2 in the first 2 h (Figure 1A), with slightly increased TMA-d9 appearance in vessel 3 in the first 1 h (Figure 1B).
Due to the unexpected finding that choline-d9 conversion to TMA-d9 was much lower in vessel 1 compared to vessels 2-3, we repeated the experiment in n=2 gut models using a different faecal ecology (Experiment 2). An additional goal of this second experiment was to focus in on the earlier time period where rapid choline-d9 utilization was observed in the first experiment, and so sampling was concentrated in the first 8 h. The results of Experiment 2 are shown in Figure 2. Again, choline-d9 conversion to TMA-d9 was significantly lower in vessel 1 compared to vessels 2-3 (Figure 2A,B). AUC values shown in Figure 2C,D reflected the corresponding kinetic curves. Some differences were observed between the two experiments. First, vessel 2 appeared to more rapidly convert choline-d9 to TMA-d9 compared to vessel 3 (Figure 2A,B), which is the opposite of the observations in Experiment 1 where vessel 3 was slightly more rapid than vessel 2 (Figure 1A,B). In both experiments, choline-d9 was completely used up in vessels 2-3 at 24 h (Figures 1A and 2A), and TMA-d9 concentrations were similar in vessels 2-3 at 24 h (Figures 1B and 2B). Choline-d9 AUCs did not differ between vessels 2-3 in either experiment (Figures 1C and 2C), nor did TMA-d9 AUCs (Figures 1D and 2D). The extent of choline-d9 metabolism to TMA-d9 differed between the two experiments. In Experiment 1, vessels 2-3 appeared to completely metabolize choline-d9 metabolism to TMA-d9 (Figure 1A,B), whereas conversion was less complete in Experiment 2 (Figure 2A,B). Furthermore, in Experiment 1, very little choline-d9 metabolism was observed in vessel 1, whereas ~50% metabolism was observed in vessel 1 during Experiment 2. Despite these differences in choline-d9 metabolism, TMA-d9 production in vessel 1 did not appear to differ between the two experiments.
3.2. Microbiome Characterization
Given the differences in choline-d9 metabolism, and subsequent TMA-d9 production, between the vessel 1 vs vessel 2/3 in our MiGut system, we investigated if we could detect cutC abundance. Surprisingly, we detected the presence of cutC in vessel 1; there was a Ct of 40.1, which indicates low abundance of cutC (consistent with the literature[29]); however, vessels 2 and 3 had even lower abundances of this gene, Ct of 41.1 and 44.9, respectively, compared with vessel 1 (Figure 3). This prompted us to investigate the specific microbial taxa that reside in vessel 1. The microbial ecology in vessel 1 has microbial taxa that are known to convert choline-TMA through the presence of cutC (Supplementary Table S2). These findings suggest that the bacteria possessing the genes required to convert choline to TMA are present in vessel 1, but that some factor such as poor gene expression or enzyme activity, may limit this process locally.
4. Discussion
The results presented here in this multi-compartment in vitro model suggest that choline conversion to the proatherogenic microbial metabolite trimethylamine may primarily occur in the more distal regions of the colon. There are multiple potential explanations for the comparatively low conversion of choline-d9 to TMA-d9 in V1 (the region modelling the proximal colon) compared to V2-V3 (the regions modelling the mid and distal colon). First, the greater nutrient density in the V1 region may favor bacterial metabolism of more energy-dense substrates compared to V2-3, where such substrates may be depleted and thus choline-d9 is more readily metabolized. Bresciani et al. showed that the presence of energy-dense nutrients such as sugars causes gut bacteria to deprioritize metabolism of quaternary amines to TMA[22]. Second, the differential ecologies along the colon may be such that the bacterial genera possessing the cutC/D gene cluster encoding for choline TMA lyases are present at lower relative and absolute abundance in V1. Third, genera carrying the gene cluster may be present in V1, but their metabolic activity and/or viability may be suppressed by other competitors. Fourth, gene expression and/or enzyme activity may be suppressed for some reason in V1. Differences in choline-d9 metabolism to TMA-d9 between vessels (colon regions) may be due to differences in cutC/D abundance and expression, or abundance/viability of bacteria that carry cutC/D, between experiments[9,30,31,32]. Additionally, variations in the presence of bacteria[33] or methanogenic Archaea[34] that utilize choline (but do not produce TMA), or which utilize TMA[35], may also be a plausible explanation. These questions can be addressed initially through the novel, high-throughput capabilities of the MiGut platform and are logical next steps in this line of investigation.
Most importantly, this intriguing finding of regional differences in TMA production raises the critical question of whether the same phenomenon is observed in animals and human in vivo. To our knowledge, there are no data in the literature on regional differences in TMA production in vivo. Experiments to study regional differences in metabolism are currently nearly impossible in humans. However, multiple approaches could be used in rodent models. The colon could be exteriorized and maintained in warm anaerobic (reduced) saline in live but sedated animals, facilitating direct micro sampling over time with tuberculine syringes from various regions following oral gavage of choline-d9 (or direct introduction into ileum or proximal colon). Alternatively, animals could be euthanized, and the ileum and colon could be immediately excised in an anaerobic chamber, the regions separated, their contents and/or mucosa extracted and exposed to choline-d9 with subsequent sampling over time. Finally, a large number of rodents could be gavaged with choline-d9 and cohorts euthanized over time for regional sampling, an approached we have used previously to characterize regional phenolic metabolism by the microbiome[36], but this has ethical implications.
The implications of maximal choline TMA lyase activity occurring in the more distal regions of the colon are physiologically significant. First, there may be many species that carry cutC/D (encoding choline TMA lyase), but which reside or are active primarily in specific gut regions. An understanding of where TMA lyase action occurs may allow us to focus on specific cutC/D-carrying bacteria that reside in the high activity regions, with less focus on those who carry the gene but are primarily in low activity regions. Second, if the conditions that suppress TMA production in the proximal colon can be identified, interventions such as diet, prebiotics, probiotics, or pharmaceuticals may be employed to alter conditions in more distal regions to become less favorable to TMA lyase expression and activity. This may include alteration of pH, selective promotion of suppressor bacterial species, etc. Third, targeted delivery strategies could be employed to precisely deliver TMA lyase inhibitors such as 3,3-dimethyl-1-butanol (DMB)[17,37] or dietary phenolics[18,19] specifically to the needed regions to avoid dilution or degradation of the inhibitors in regions with low TMA lyase activity. Such delivery strategies may include pH-responsive polymers (as we have previously reported for phenolics and antibiotics[38,39], encapsulation of inhibitors with fermentable material whose degradation and thus release rate can be controlled, etc. One such example of interest to us are dietary phenolic compounds. These compounds are metabolized by commensal gut bacterial to smaller compounds[36,40]. We have performed some initial work to identify the comparative TMA-lowering properties of native phenolics in food and their microbial metabolites[18,19,20,21]. Targeted delivery could be designed to protect the native food phenolics from bacterial metabolism until they reach the high TMA lyase activity regions. Conversely, postbiotics (preformed microbial metabolites) could also be delivered similarly if these metabolites are found to be the most effective at lower TMA production.
Finally, an understanding of regional differences in microbial community composition and associated TMA lyase activity may help us understand cutC/D as a marker of TMA production capacity and cardiovascular disease risk. Fecal samples are the only readily available sample from humans from which gut microbiome can be studied. However, feces is a composite of living, inactive and dead cells from across all regions of the gut. Studies have indicated that fecal composition and cutC/D copy numbers are poor predictors of TMA/TMAO production and disease risk due to differences in metabolic activity, viability and gene expression (potentially confounded by the fact that each region cannot be studied individually in humans)[32], although there remains some disagreement on this point[31].
This work has limitations. Firstly, our MiGut models are microbiome models and do not replicate the complexity and regional differences of host cellular responses of the in vivo human gut and its associated metabolome. While provocative, the present finding must eventually be confirmed in vivo. Second, any in vitro gut microbiome model is inherently limited by the human fecal samples used to colonize it. The present observations may not be generalizable to humans. Further studies are needed using samples from more diverse donors to validate these findings. This weakness is somewhat mitigated by the fact that different faecal donors were used for Experiments 1 and 2, with similar results. Another limitation is the cutC primers used. Although these are degenerate primers that have been used before[28], more comprehensive degenerate primers may provide better amplification of a broader swath of cutC from multiple species[41]. Finally, other quaternary amines from the diet (carnitine and betaine) can be metabolized into pro-atherogenic TMA[11,12], and the regional dependence of these pathways remains unknown.
As outlined above, additional studies are needed to validate and expand upon this finding. In the near-term, additional studies using different donors must be performed to further confirm our finding. The next iteration of experiments will then be “full-flow” studies in MiGut where choline-d9 is added only to V1 and media flow is allowed from V1→V3 for enhanced physiological relevance. Another immediate priority will be to fully characterize the abundance and metabolic activity of cutC/D-bearing bacteria, cutC/D gene copy number, and cutC/D expression in V1-V3 to understand how these factors may influence TMA production. Finally, initial in vivo confirmatory experiments in rodents are a priority.
5. Conclusions
In conclusion, the present study reports the first known finding that choline conversion to the pro-atherogenic metabolite TMA by human gut bacteria may vary by colonic region. This finding has implications for understanding TMA production in vivo, as well as the design of strategies to control TMA (and TMAO) levels with the end goal of reducing long-term CVD risk. This discovery warrants further study in vitro and in vivo.
Supplementary Materials
The following supporting information can be downloaded at the website of this paper posted on Preprints.org.
Author Contributions
Anthony M. Buckley: Conceptualization, Methodology, Validation, Formal analysis, Investigation, Resources, Writing - Original Draft, Writing - Review & Editing, Visualization, Supervision, Project administration, Funding acquisition; Sarah Zaidan: Investigation, Writing - Review & Editing; Michael G. Sweet: Formal analysis, Investigation, Writing - Review & Editing, Visualization, Duncan J. Ewin: Formal analysis, Writing – Original Draft, Writing - Review & Editing; Juanita G. Ratliff: Formal analysis, Investigation, Writing - Review & Editing, Visualization; Aliyah Alkazemi: Methodology; Ashley M. McAmis: Formal analysis, Investigation, Writing - Review & Editing, Andrew P. Neilson: Conceptualization, Methodology, Validation, Formal analysis, Resources, Writing - Original Draft, Writing - Review & Editing, Visualization, Supervision, Project administration, Funding acquisition.
Funding Sources
DE was supported by the Basil Jarvis Studentship from Applied Microbiology International. AMB was supported by grants from Biotechnology and Biological Sciences Research Council, OIRC INFORM hub, and the Medical Research Council. Support for APN was provided by the North Carolina Agricultural Research Service (NCARS) and the Hatch Program of the National Institute of Food and Agriculture (NIFA), U.S. Department of Agriculture.
Acknowledgements
N/A.
Conflicts of Interest
The authors declare no conflicts of interest.
References
- Amini, M.; Zayeri, F.; Salehi, M. Trend Analysis of Cardiovascular Disease Mortality, Incidence, and Mortality-to-Incidence Ratio: Results from Global Burden of Disease Study 2017. BMC Public Health 2021, 21, 401. [Google Scholar] [CrossRef] [PubMed]
- Roth, G.A.; Mensah, G.A.; Johnson, C.O.; Addolorato, G.; Ammirati, E.; Baddour, L.M.; Barengo, N.C.; Beaton, A.Z.; Benjamin, E.J.; Benziger, C.P.; et al. Global Burden of Cardiovascular Diseases and Risk Factors, 1990–2019: Update From the GBD 2019 Study. J. Am. Coll. Cardiol. 2020, 76, 2982–3021. [Google Scholar] [CrossRef] [PubMed]
- Calazans, J.A.; Permanyer, I. Levels, Trends, and Determinants of Cause-of-Death Diversity in a Global Perspective: 1990–2019. BMC Public Health 2023, 23, 650. [Google Scholar] [CrossRef] [PubMed]
- Witkowski, M.; Weeks, T.L.; Hazen, S.L. Gut Microbiota and Cardiovascular Disease. Circ. Res. 2020, 127, 553–570. [Google Scholar] [CrossRef]
- Talmor-Barkan, Y.; Bar, N.; Shaul, A.A.; Shahaf, N.; Godneva, A.; Bussi, Y.; Lotan-Pompan, M.; Weinberger, A.; Shechter, A.; Chezar-Azerrad, C.; et al. Metabolomic and Microbiome Profiling Reveals Personalized Risk Factors for Coronary Artery Disease. Nat. Med. 2022, 28, 295–302. [Google Scholar] [CrossRef]
- Kazemian, N.; Mahmoudi, M.; Halperin, F.; Wu, J.C.; Pakpour, S. Gut Microbiota and Cardiovascular Disease: Opportunities and Challenges. Microbiome 2020, 8, 36. [Google Scholar] [CrossRef]
- Wang, Z.; Klipfell, E.; Bennett, B.J.; Koeth, R.; Levison, B.S.; DuGar, B.; Feldstein, A.E.; Britt, E.B.; Fu, X.; Chung, Y.-M. Gut Flora Metabolism of Phosphatidylcholine Promotes Cardiovascular Disease. Nature 2011, 472, 57–63. [Google Scholar] [CrossRef]
- Tang, W.W.; Wang, Z.; Levison, B.S.; Koeth, R.A.; Britt, E.B.; Fu, X.; Wu, Y.; Hazen, S.L. Intestinal Microbial Metabolism of Phosphatidylcholine and Cardiovascular Risk. N. Engl. J. Med. 2013, 368, 1575–1584. [Google Scholar] [CrossRef]
- Jameson, E.; Quareshy, M.; Chen, Y. Methodological Considerations for the Identification of Choline and Carnitine-Degrading Bacteria in the Gut. Methods 2018, 149, 42–48. [Google Scholar] [CrossRef]
- Koeth, R.A.; Wang, Z.; Levison, B.S.; Buffa, J.A.; Org, E.; Sheehy, B.T.; Britt, E.B.; Fu, X.; Wu, Y.; Li, L. Intestinal Microbiota Metabolism of L-Carnitine, a Nutrient in Red Meat, Promotes Atherosclerosis. Nat. Med. 2013, 19, 576–585. [Google Scholar] [CrossRef]
- Koeth, R.A.; Levison, B.S.; Culley, M.K.; Buffa, J.A.; Wang, Z.; Gregory, J.C.; Org, E.; Wu, Y.; Li, L.; Smith, J.D.; et al. γ-Butyrobetaine Is a Proatherogenic Intermediate in Gut Microbial Metabolism of L-Carnitine to TMAO. Cell Metab. 2014, 20, 799–812. [Google Scholar] [CrossRef] [PubMed]
- Seim, H.; Löster, H.; Claus, R.; Kleber, H.-P.; Strack, E. Formation of γ-Butyrobetaine and Trimethylamine from Quaternary Ammonium Compounds Structure-Related to l-Carnitine and Choline by Proteus Vulgaris. FEMS Microbiol. Lett. 1982, 13, 201–205. [Google Scholar] [CrossRef]
- Meyer, K.A.; Shea, J.W. Dietary Choline and Betaine and Risk of CVD: A Systematic Review and Meta-Analysis of Prospective Studies. Nutrients 2017, 9, 711. [Google Scholar] [CrossRef] [PubMed]
- Cashman, J.R.; Camp, K.; Fakharzadeh, S.S.; Fennessey, P.V.; Hines, R.N.; Mamer, O.A.; Mitchell, S.C.; Preti, G.; Schlenk, D.; Smith, R.L. Biochemical and Clinical Aspects of the Human Flavin-Containing Monooxygenase Form 3 (FMO3) Related to Trimethylaminuria. Curr. Drug Metab. 2003, 4, 151–170. [Google Scholar] [CrossRef]
- Shimizu, M.; Koibuchi, N.; Mizugaki, A.; Hishinuma, E.; Saito, S.; Hiratsuka, M.; Yamazaki, H. Genetic Variants of Flavin-Containing Monooxygenase 3 (FMO3) in Japanese Subjects Identified by Phenotyping for Trimethylaminuria and Found in a Database of Genome Resources. Drug Metab. Pharmacokinet. 2021, 38, 100387. [Google Scholar] [CrossRef]
- Roberts, A.B.; Gu, X.; Buffa, J.A.; Hurd, A.G.; Wang, Z.; Zhu, W.; Gupta, N.; Skye, S.M.; Cody, D.B.; Levison, B.S.; et al. Development of a Gut Microbe–Targeted Nonlethal Therapeutic to Inhibit Thrombosis Potential. Nat. Med. 2018, 24, 1407–1417. [Google Scholar] [CrossRef]
- Wang, Z.; Roberts, A.B.; Buffa, J.A.; Levison, B.S.; Zhu, W.; Org, E.; Gu, X.; Huang, Y.; Zamanian-Daryoush, M.; Culley, M.K. Non-Lethal Inhibition of Gut Microbial Trimethylamine Production for the Treatment of Atherosclerosis. Cell 2015, 163, 1585–1595. [Google Scholar] [CrossRef]
- Iglesias-Carres, L.; Krueger, E.S.; Herring, J.A.; Tessem, J.S.; Neilson, A.P. Potential of Phenolic Compounds and Their Gut Microbiota-Derived Metabolites to Reduce TMA Formation: Application of an In Vitro Fermentation High-Throughput Screening Model. J. Agric. Food Chem. 2022, 70, 3207–3218. [Google Scholar] [CrossRef]
- Iglesias-Carres, L.; Essenmacher, L.A.; Racine, K.C.; Neilson, A.P. Development of a High-Throughput Method to Study the Inhibitory Effect of Phytochemicals on Trimethylamine Formation. Nutrients 2021, 13, 1466. [Google Scholar] [CrossRef]
- Iglesias-Carres, L.; Bruno, A.; D’Antuono, I.; Linsalata, V.; Cardinali, A.; Neilson, A.P. In Vitro Evidences of the Globe Artichoke Antioxidant, Cardioprotective and Neuroprotective Effects. J. Funct. Foods 2023, 107, 105674. [Google Scholar] [CrossRef]
- Iglesias-Carres, L.; Racine, K.C.; Neilson, A.P. Phenolic-Rich Beverages Reduce Bacterial TMA Formation in an Ex Vivo–in Vitro Colonic Fermentation Model. Food Funct. 2022, 13, 8022–8037. [Google Scholar] [CrossRef] [PubMed]
- Bresciani, L.; Dall’Asta, M.; Favari, C.; Calani, L.; Rio, D.D.; Brighenti, F. An in Vitro Exploratory Study of Dietary Strategies Based on Polyphenol-Rich Beverages, Fruit Juices and Oils to Control Trimethylamine Production in the Colon. Food Funct. 2018, 9, 6470–6483. [Google Scholar] [CrossRef] [PubMed]
- Day-Walsh, P.; Shehata, E.; Saha, S.; Savva, G.M.; Nemeckova, B.; Speranza, J.; Kellingray, L.; Narbad, A.; Kroon, P.A. The Use of an In-Vitro Batch Fermentation (Human Colon) Model for Investigating Mechanisms of TMA Production from Choline, l-Carnitine and Related Precursors by the Human Gut Microbiota. Eur. J. Nutr. 2021, 60, 3987–3999. [Google Scholar] [CrossRef]
- Orman, M.; Bodea, S.; Funk, M.A.; Campo, A.M.-D.; Bollenbach, M.; Drennan, C.L.; Balskus, E.P. Structure-Guided Identification of a Small Molecule That Inhibits Anaerobic Choline Metabolism by Human Gut Bacteria. J. Am. Chem. Soc. 2019, 141, 33–37. [Google Scholar] [CrossRef]
- Venema, K. The TNO In Vitro Model of the Colon (TIM-2). In The Impact of Food Bioactives on Health: in vitro and ex vivo models; Verhoeckx, K., Cotter, P., López-Expósito, I., Kleiveland, C., Lea, T., Mackie, A., Requena, T., Swiatecka, D., Wichers, H., Eds.; Springer: Cham (CH), 2015 ISBN 978-3-319-15791-7.
- Van de Wiele, T.; Van den Abbeele, P.; Ossieur, W.; Possemiers, S.; Marzorati, M. The Simulator of the Human Intestinal Microbial Ecosystem (SHIME®). In The Impact of Food Bioactives on Health: in vitro and ex vivo models; Verhoeckx, K., Cotter, P., López-Expósito, I., Kleiveland, C., Lea, T., Mackie, A., Requena, T., Swiatecka, D., Wichers, H., Eds.; Springer: Cham (CH), 2015 ISBN 978-3-319-15791-7.
- Davis Birch, W.A.; Moura, I.B.; Ewin, D.J.; Wilcox, M.H.; Buckley, A.M.; Culmer, P.R.; Kapur, N. MiGut: A Scalable in Vitro Platform for Simulating the Human Gut Microbiome—Development, Validation and Simulation of Antibiotic-Induced Dysbiosis. Microb. Biotechnol. 2023, 16, 1312–1324. [Google Scholar] [CrossRef]
- Wang, Z.; Hazen, J.; Jia, X.; Org, E.; Zhao, Y.; Osborn, L.J.; Nimer, N.; Buffa, J.; Culley, M.K.; Krajcik, D.; et al. The Nutritional Supplement L-Alpha Glycerylphosphorylcholine Promotes Atherosclerosis. Int. J. Mol. Sci. 2021, 22, 13477. [Google Scholar] [CrossRef]
- Rath, S.; Heidrich, B.; Pieper, D.H.; Vital, M. Uncovering the Trimethylamine-Producing Bacteria of the Human Gut Microbiota. Microbiome 2017, 5, 1–14. [Google Scholar] [CrossRef]
- Jameson, E.; Doxey, A.C.; Airs, R.; Purdy, K.J.; Murrell, J.C.; Chen, Y. Metagenomic Data-Mining Reveals Contrasting Microbial Populations Responsible for Trimethylamine Formation in Human Gut and Marine Ecosystems. Microb. Genomics 2016, 2, e000080. [Google Scholar] [CrossRef]
- Ramireddy, L.; Tsen, H.-Y.; Chiang, Y.-C.; Hung, C.Y.; Chen, F.-C.; Yen, H.-T. The Gene Expression and Bioinformatic Analysis of Choline Trimethylamine-Lyase (CutC) and Its Activating Enzyme (CutD) for Gut Microbes and Comparison with Their TMA Production Levels. Curr. Res. Microb. Sci. 2021, 2, 100043. [Google Scholar] [CrossRef]
- Ferrell, M.; Bazeley, P.; Wang, Z.; Levison, B.S.; Li, X.S.; Jia, X.; Krauss, R.M.; Knight, R.; Lusis, A.J.; Garcia-Garcia, J.C. Fecal Microbiome Composition Does Not Predict Diet-Induced TMAO Production in Healthy Adults. J. Am. Heart Assoc. 2021, 10, e021934. [Google Scholar] [CrossRef]
- Kashyap, J.; Ringiesn, J.R.; Schwab, N.; Ferguson, D.J. Isolation and Characterization of a Novel Choline Degrading Citrobacter Amalonaticus Strain from the Human Gut. Curr. Res. Microb. Sci. 2022, 3, 100157. [Google Scholar] [CrossRef] [PubMed]
- Ramezani, A.; Nolin, T.D.; Barrows, I.R.; Serrano, M.G.; Buck, G.A.; Regunathan-Shenk, R.; West, R.E.; Latham, P.S.; Amdur, R.; Raj, D.S. Gut Colonization with Methanogenic Archaea Lowers Plasma Trimethylamine N-Oxide Concentrations in Apolipoprotein E−/− Mice. Sci. Rep. 2018, 8, 14752. [Google Scholar] [CrossRef] [PubMed]
- de la Cuesta-Zuluaga, J.; Spector, T.D.; Youngblut, N.D.; Ley, R.E. Genomic Insights into Adaptations of Trimethylamine-Utilizing Methanogens to Diverse Habitats, Including the Human Gut. mSystems 2021, 6, 10.1128–msystems.00939. [Google Scholar] [CrossRef] [PubMed]
- Goodrich, K.M.; Smithson, A.T.; Ickes, A.K.; Neilson, A.P. Pan-Colonic Pharmacokinetics of Catechins and Procyanidins in Male Sprague–Dawley Rats. J. Nutr. Biochem. 2015, 26, 1007–1014. [Google Scholar] [CrossRef]
- Casso, A.G.; VanDongen, N.S.; Gioscia-Ryan, R.A.; Clayton, Z.S.; Greenberg, N.T.; Ziemba, B.P.; Hutton, D.A.; Neilson, A.P.; Davy, K.P.; Seals, D.R.; et al. Initiation of 3,3-Dimethyl-1-Butanol at Midlife Prevents Endothelial Dysfunction and Attenuates in Vivo Aortic Stiffening with Ageing in Mice. J. Physiol. 2022, 600, 4633–4651. [Google Scholar] [CrossRef]
- Winslow, C.J.; Nichols, B.L.B.; Novo, D.C.; Mosquera-Giraldo, L.I.; Taylor, L.S.; Edgar, K.J.; Neilson, A.P. Cellulose-Based Amorphous Solid Dispersions Enhance Rifapentine Delivery Characteristics in Vitro. Carbohydr. Polym. 2018, 182, 149–158. [Google Scholar] [CrossRef]
- Gilley, A.D.; Arca, H.C.; Nichols, B.L.B.; Mosquera-Giraldo, L.I.; Taylor, L.S.; Edgar, K.J.; Neilson, A.P. Novel Cellulose-Based Amorphous Solid Dispersions Enhance Quercetin Solution Concentrations in Vitro. Carbohydr. Polym. 2017, 157, 86–93. [Google Scholar] [CrossRef]
- Goodrich, K.M.; Neilson, A.P. Simultaneous UPLC-MS/MS Analysis of Native Catechins and Procyanidins and Their Microbial Metabolites in Intestinal Contents and Tissues. J. Chromatogr. B.
- Martínez-del Campo, A.; Bodea, S.; Hamer, H.A.; Marks, J.A.; Haiser, H.J.; Turnbaugh, P.J.; Balskus, E.P. Characterization and Detection of a Widely Distributed Gene Cluster That Predicts Anaerobic Choline Utilization by Human Gut Bacteria. MBio 2015, 6, e00042–15. [Google Scholar] [CrossRef]
Figure 1.
Kinetics of choline-d9 metabolism (A) and trimethylamine (TMA-d9) production (B) with corresponding area-under-the-curve (AUC) values for choline-d9 (C) and TMA-d9 (D) in the MiGut model following addition of 150 μM choline-d9 in each of the 3 vessels, with no flow between vessels (Experiment 1). Values represent the mean ± SEM from n=4 parallel gut models. AUC values were calculated for each replicate and vessel separately. Any negative values were converted to 0 prior to AUC calculation. AUC values were analyzed by 1-way ANOVA with Tukey’s post hoc test to compare group means. Bars not sharing a common superscript letter are significantly different (P<0.05).
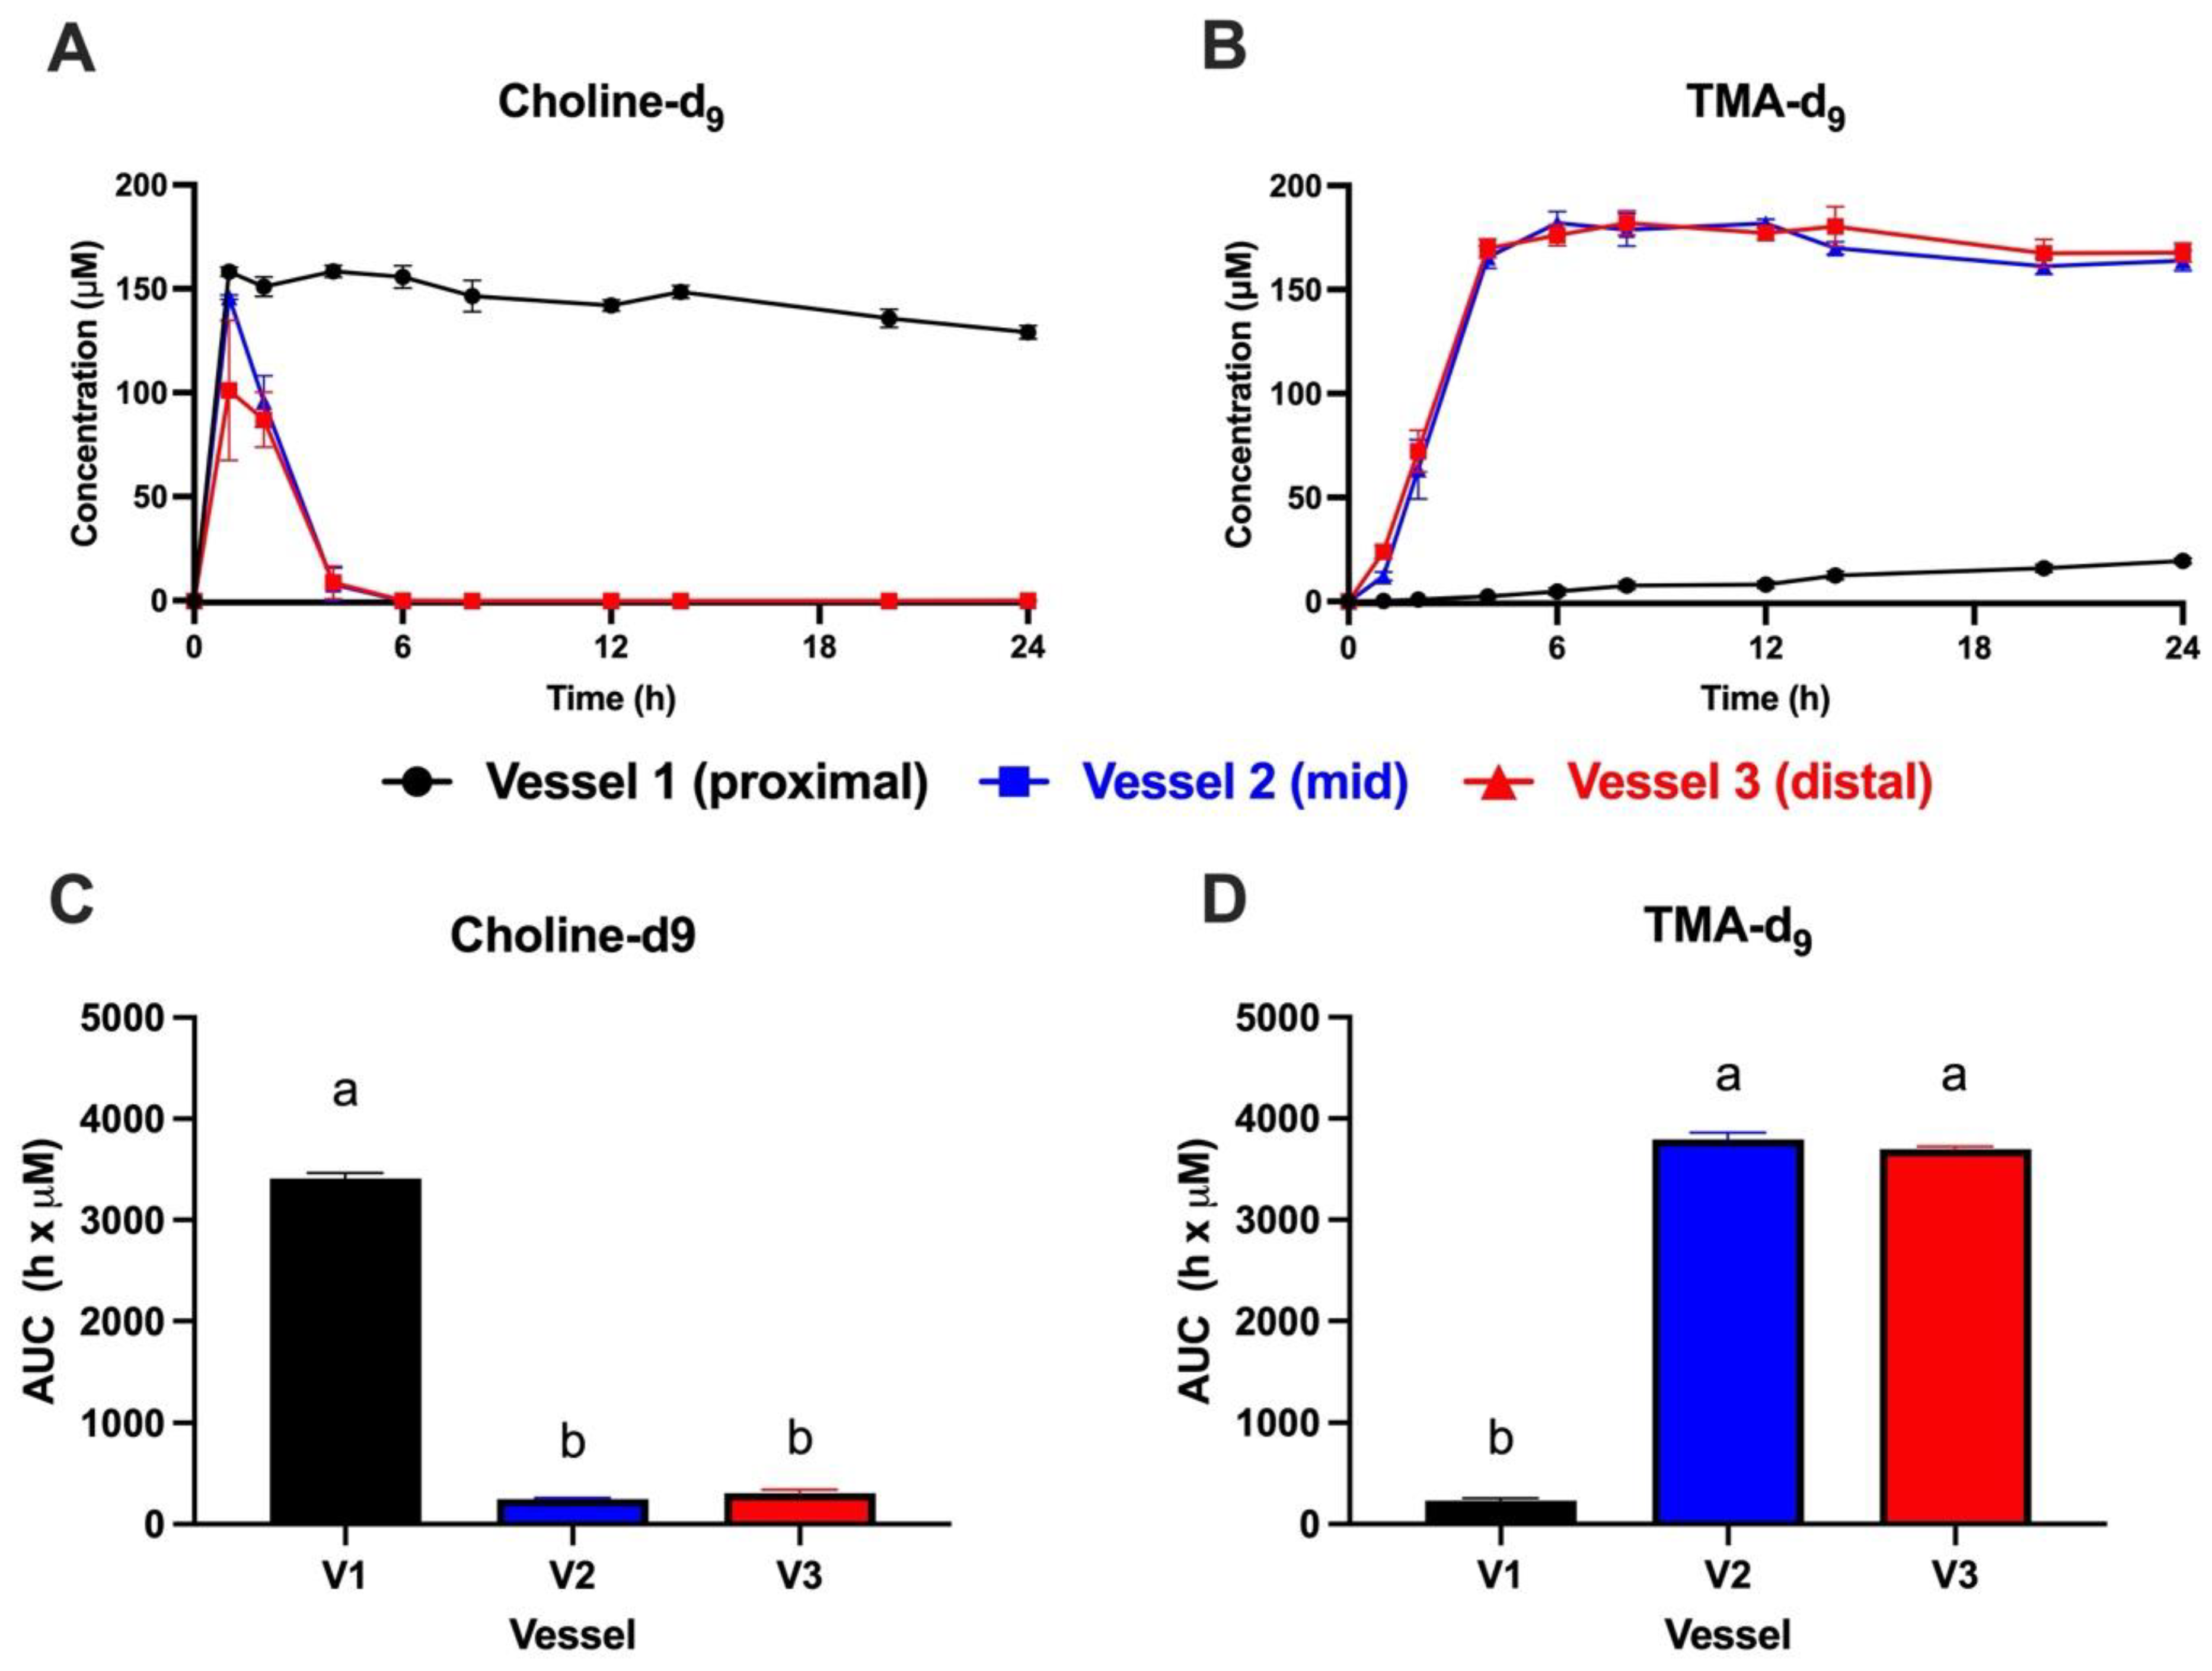
Figure 2.
Kinetics of choline-d9 metabolism (A) and trimethylamine (TMA-d9) production (B) with corresponding area-under-the-curve (AUC) values for choline-d9 (C) and TMA-d9 (D) in the MiGut model following addition of 150 μM choline-d9 in each of the 3 vessels, with no flow between vessels (Experiment 2). Values represent the mean ± SEM from n=2 parallel gut models. AUC values were calculated for each replicate and vessel separately. Any negative values were converted to 0 prior to AUC calculation. AUC values were analyzed by 1-way ANOVA with Tukey’s post hoc test to compare group means. Bars not sharing a common superscript letter are significantly different (P<0.05).
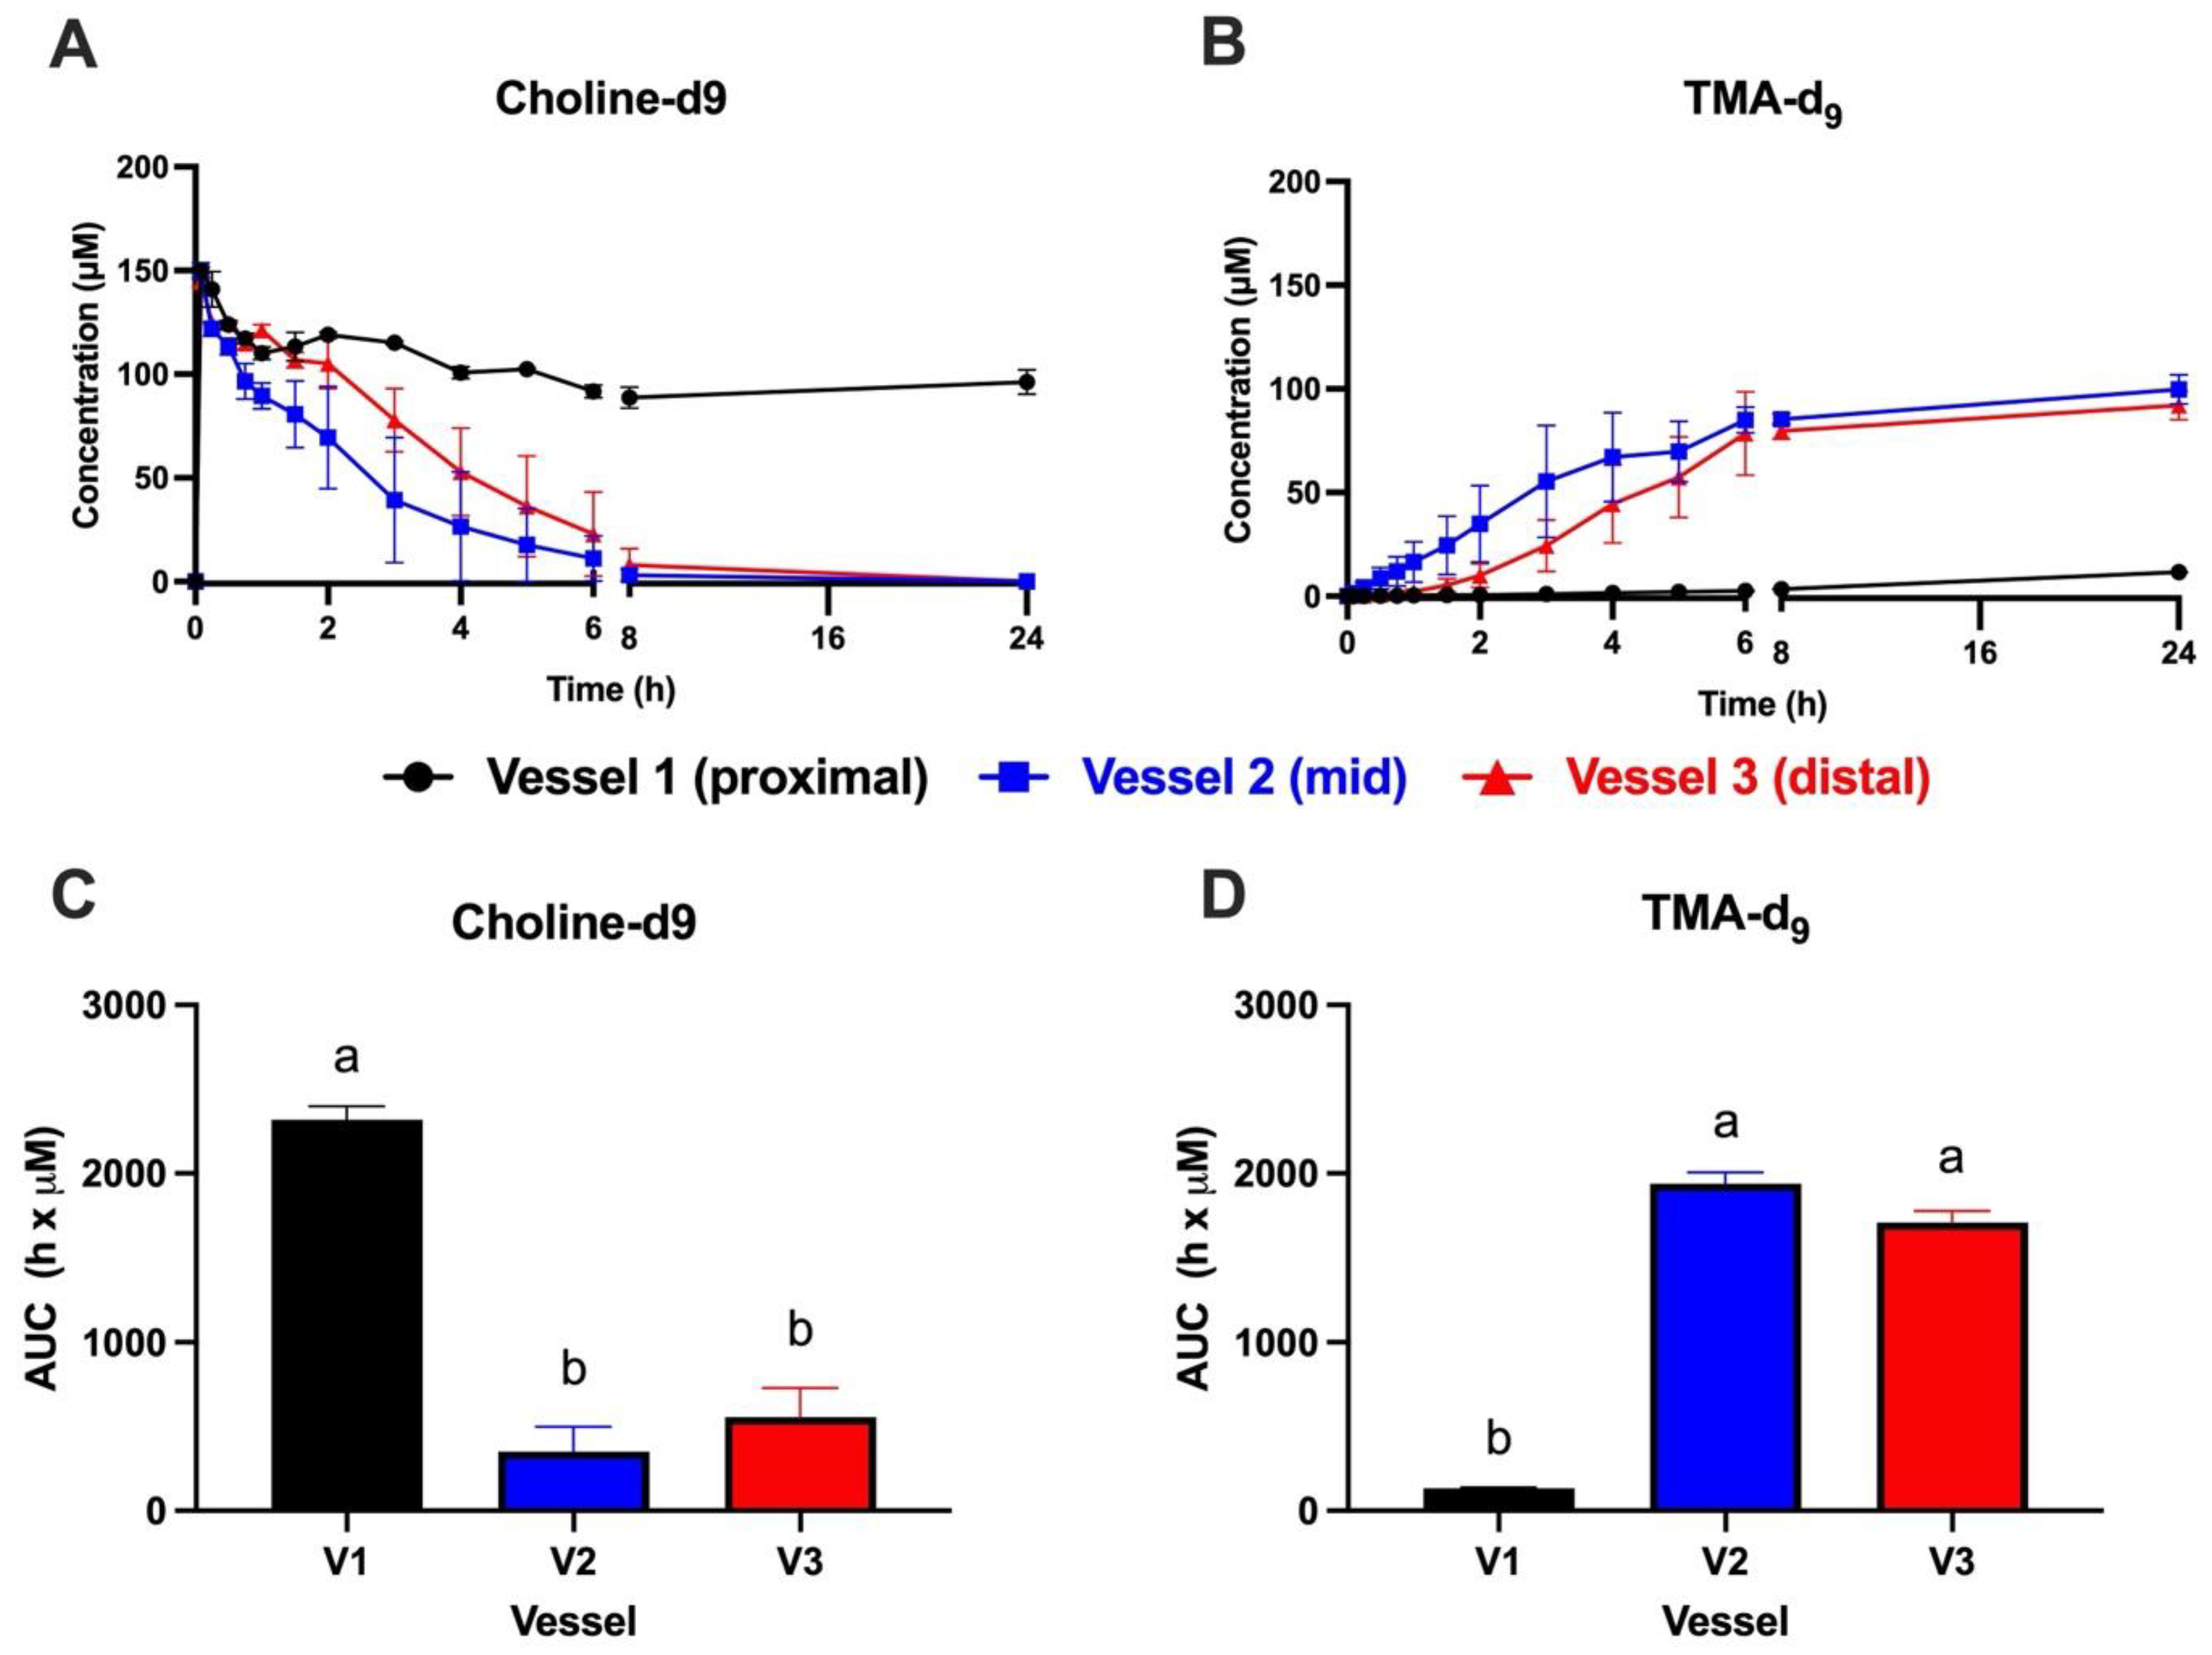
Figure 3.
Abundance of the choline metabolism gene, cutC, in vessel 1, 2, and 3 of MiGut, as determined by qPCR. Results expressed as mean cycle number (± SD) from 3 technical replicates on the same qPCR run.
Figure 3.
Abundance of the choline metabolism gene, cutC, in vessel 1, 2, and 3 of MiGut, as determined by qPCR. Results expressed as mean cycle number (± SD) from 3 technical replicates on the same qPCR run.
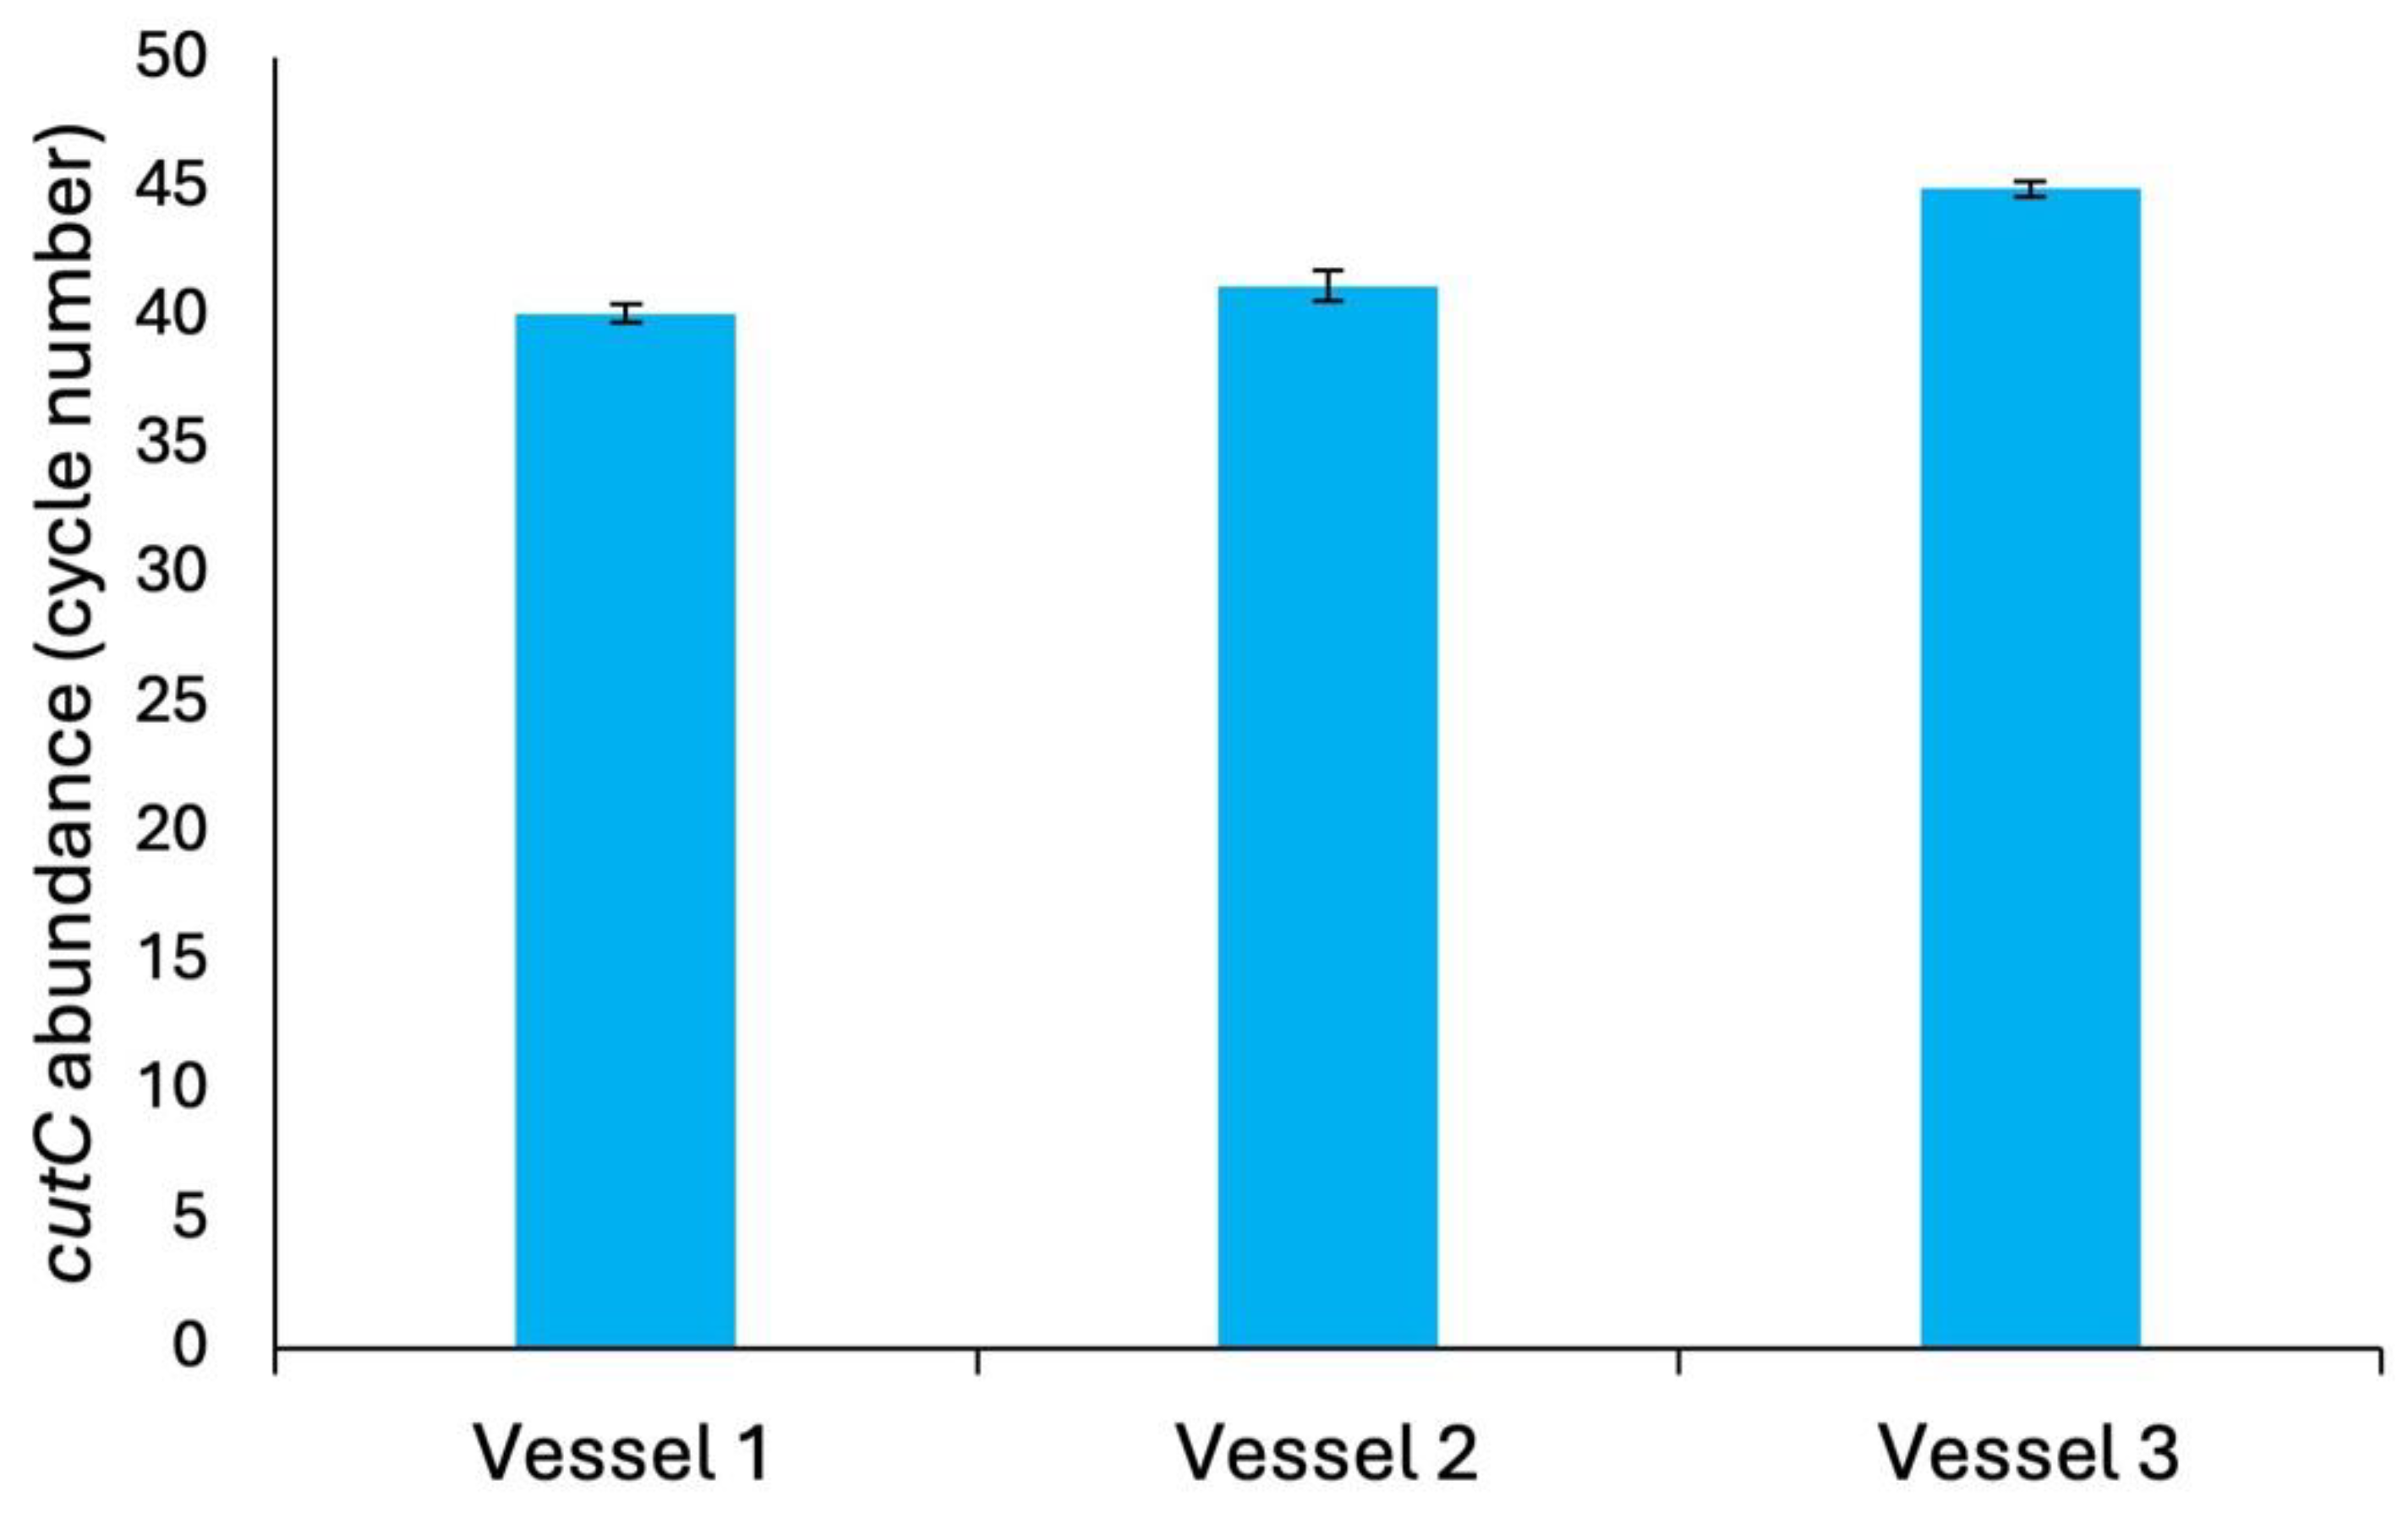

Table 1.
Multi-reaction monitoring parameters for detection of choline-d9, TMA-d9, and their internal standards.
Table 1.
Multi-reaction monitoring parameters for detection of choline-d9, TMA-d9, and their internal standards.
| Compound | MW | MS/MS transition |
CV (V) |
CE (eV) |
| Choline-d9 | 113.2 | 113.3>69.1 | 40 | 16 |
| Choline-1-13C-1,1,2,2-d4 | 109.2 | 109.3>60.3 | 36 | 18 |
| Ethyl betaine-d9a | 155.2 | 155.3>127.2 | 34 | 20 |
| Ethyl betaine-13C3-15Na | 150.2 | 150.3>122.2 | 34 | 18 |
Abbreviations: TMA, trimethylamine; MW, molecular weight; CV, cone voltage; and CE, collision energy. aTMA derivatives for ionization.
Disclaimer/Publisher’s Note: The statements, opinions and data contained in all publications are solely those of the individual author(s) and contributor(s) and not of MDPI and/or the editor(s). MDPI and/or the editor(s) disclaim responsibility for any injury to people or property resulting from any ideas, methods, instructions or products referred to in the content. |
© 2025 by the authors. Licensee MDPI, Basel, Switzerland. This article is an open access article distributed under the terms and conditions of the Creative Commons Attribution (CC BY) license (http://creativecommons.org/licenses/by/4.0/).
Copyright: This open access article is published under a Creative Commons CC BY 4.0 license, which permit the free download, distribution, and reuse, provided that the author and preprint are cited in any reuse.


