
Submitted:
27 June 2025
Posted:
30 June 2025
You are already at the latest version
Abstract
The planetary environmental crisis, perceptible through climate change, has affected the security and food sovereignty of various vulnerable ethnic groups. We identified the relationship between climate change and the poverty conditions of the population of Chota Valley in the Republic of Ecuador. Their relationships are identified and characterized quantitatively, through the PMT index; and, qualitatively, the adaptations of the population to climate change, through focus groups. The population's knowledge about climate change is based on their daily experiences as farmers, rather than on training, closely relating to the education levels of the head of household and its members. The higher the PMT (non-poor) the less interest in adaptive actions. However, climate change has led to the substitution of traditional products for mangoes, allowing them to survive and/or temporarily improve the living conditions of families in the area.
Keywords:
climate change
; poverty
; adaptation
; resilience
; Proxy Means Testing
1. Introduction
Climate change is a phenomenon that causes a gradual increase in global temperature on the planet, derived from the application of certain models of development and human activities, which have not considered the fragility of ecosystem processes or the finitude of natural resources. The phenomenon can be easily perceived in any place when comparisons are made of what the climate was like years ago and the current manifestations of the weather. Only there is it evident that the climate is no longer the same, there are extreme variations in rainfall regimes, with prolonged periods of drought, the increase in local temperature, or even in the decrease in natural water flows.
Climate change and its relationship with food production, especially agriculture, is an increasingly sensitive issue. Farmers face many difficulties, they no longer know when to plant or when to harvest, the rain is excessive in historically dry seasons or scarce in seasons of high rainfall, affecting production and putting food security and sovereignty at risk.
Given the finitude of natural resources on the planet, they maintain ecosystem processes in permanent cycles. Climate change is not cyclical, but rather is a slow and constant increase in the average temperature of the Earth, a phenomenon that in the opinion of some scientists is already irreversible, and being the product of human activities, it is said that climate change is anthropogenic (Martínez & Fernández, 2005) .
The main effects of climate change include: decreased crop productivity, rapid disappearance of mountain glaciers, extinction of species of flora and fauna, reduction in rainfall in certain areas and increase in others. In the Republic of Ecuador, the Ministry of the Environment has identified problems such as: an increase in extreme weather events, an increase in sea level and beach erosion, a decrease in annual runoff, a decrease in snow-capped glaciers, an increase in the areas where it transmits dengue and other tropical diseases, loss of biodiversity, decrease in agricultural areas and greater need for water for irrigation and for human consumption (UNICEF, 2020) .
The greatest effect of climate change in some locations of the country is the difficulty that families have in obtaining water and food, and meeting their needs, as well as in maintaining better health and sanitation conditions. Women are in charge of achieving safe water, being the most affected by climate change. Under these conditions, crops and livestock will be lost and therefore food will be scarce, there will be a change in planting and harvesting periods, seeds and local varieties will be lost, there will be a different distribution of animals and plants, the lack of production increases the cost of products. All this contributing to increase the conditions of poverty of the local population.
Some actions that contribute to the reduction of the new environmental conditions generated by climate change constitute mitigation, which represents the effort made to reduce the amount of greenhouse gases produced by human activities; for instance, avoiding the burning of fossil fuels or the burning of firewood or crop stubble.
These measures do not allow us to see immediate changes, so adaptation is necessary, which is the set of efforts that are made to minimize the vulnerability and damage that climate change can have on ecosystems and on the lives of populations, allowing natural and human systems to adjust to new climatic conditions. Adaptation does not mean resigning but being informed, organizing and making decisions to face the adverse effects of climate change. (CEPAL, 2017)
These adaptation measures allow communities and ecosystems to be resilient; that is, capable of facing adversity, being able to recover and achieve sustainability over time; adapting conditions to react to climate change, whose incidence occurs slowly, but causing very severe damage.
In Chota Valley, the proposed research will seek to take a look at community-based adaptation, which is based on knowing their needs, perceptions, knowledge and experiences. It is proposed to reflect on vulnerability to climate change and disasters, in order to then induce work to improve living conditions and overcome conditions of poverty, with emphasis on the right, generational, ethnic and gender approaches.
Adaptation to the effects of climate change based on the community is a process in which the community appropriates and leads it, based on the needs and potentialities, on the knowledge and dialogue of knowledge of the community itself. This strengthens their capacities to prepare for the impacts of climate change and to be able to face them. This approach also includes risk management, so that the investigative processes will demand greater appropriation of the problem, on the part of local governments, leaders and the entire community in general. (Servant & Rigal, 2012)
From this perspective, vulnerability to climate change; that is, the degree to which the ecosystem and the communities can withstand the alterations and effects depends not only on the phenomenon itself, but also on factors of social inequity.
Climate change is a silent cause of many changes not only in geography but also in demography and the socioeconomic conditions of the population, among them, of course, poverty. There are references that climate change, for instance, causes mass migrations, either due to desertification of the soil, extreme temperatures or lack of water. At a micro level, climate change is causing harvests to decrease, animals to die and therefore families to increase their level of poverty.
Poverty is a phenomenon tied to human existence, to their behavior, to their power relations. Adam Smith (1776) defined poverty as “...a lack of those necessities which the custom of a country makes it indecent, both for the wealthy and for the lower class, to lack them”; however, the quantification of poverty, despite having been a concern, was not visible until 1885 when Charles Booth (1897) carried out a work that documented the life of the working class in London and produced a poverty map of the city.
Some methodologies have been used to measure poverty, including monetary, Unsatisfied Basic Needs (UBN) and multidimensional. The most widespread are undoubtedly the monetary ones, where the measurement of poverty by income (expenditure) has been generalized because it is easy to include in household surveys and the results are simply interpreted. This type of poverty measurement has been consolidated as the basis for policy decision-making.
Poverty by UBN measures in a certain way how the state covers the needs of infrastructure in health, education, basic services to households. In Ecuador, its use is linked to the first phase of the targeting of social programs (geographical targeting) and mainly to the allocation of resources to the Decentralized Autonomous Governments (GADs).
However, poverty has a multidimensional character and that it can be thought of more than the possibility of having monetary resources to satisfy needs as a set of "capacity deprivations" of people to be able to develop their lives in the best possible way, despite not having been measured in that way (Sen, 2011) . Historically, studies have been developed that deal with the measurement of poverty in a multidimensional way, including Tsui (2002) , Townsend (2011) , Bourguignon & Chakravarty (2008) , Alkire & Foster (2008) . The initiative for calculating multidimensional poverty that has prospered is the one proposed by Alkire and Foster, since at the moment there are some countries that have calculated the multidimensional poverty index, including Mexico, Colombia, Buthan, and Ecuador.
2. A look at the Chota Valley
The ancestral territory of Chota Valley, Concepción and Salinas, located in the Mira River Basin (González et al., 2010) , comprises a group of localities located on the border between the provinces of Imbabura and Carchi (González et al. , 2010) . Figure 1 shows the location of the Chota Valley study area.
The population that inhabits the Chota Valley is eminently Afro-Ecuadorian. The presence of black people in Ecuador dates back to colonial times, specifically to the 17th century when they were brought from Africa to work as slaves. They were taken to the Chota Valley by the Jesuits and Mercedarians to work in the mines and on the sugar cane plantations (Coronel, 1987) .
The main economic activity of the people of Chota Valley has traditionally been agriculture, being its main products: eggs, beans, tomato, avocado, cucumber and vegetables. At present, although it is true that most of the people continue to dedicate themselves to agriculture; however, the star product is the mango. In other words, there has been a substitution of products that may incidentally be caused by climate change.
In order to better identify the Afro-Ecuadorian population, and in particular the Chota Valley, the Integrated System of Social Indicators of Ecuador SIISE has defined seven socio-cultural areas: 1. North Coast, made up of the provinces of Esmeraldas and Manabí; 2. Chota Valley, formed by the provinces of Carchi and Imbabura; 3. Pichincha, formed only by the province of the same name; 4. North Amazon, formed by the provinces of Napo, Sucumbíos and Orellana; 5. Central-South Coast, made up of the provinces of Guayas, Los Ríos, El Oro and Loja, 6. Central-South Sierra, made up of the provinces of Azuay, Bolívar, Cañar, Cotopaxi, Chimborazo, and Tungurahua; and, 7. Rest of the Country, made up of the provinces of Morona Santiago, Pastaza, Zamora Chinchipe, Galapagos and the Undelimited Zones.
According to the classification in Table 1, the population of Chota Valley , understood as the Afro-Ecuadorian population of the provinces of Imbabura and Carchi (Guerrero, 2005) , in 2001 was 24,783 people, while in 2010 it was of 26,262 people, representing 5% and 4.8% of the total population of the sociocultural area, respectively. This indicates that the population of the Valley has not undergone drastic percentage changes, that is, there are no external or internal factors that affect the natural growth of the population.
3. Poverty and Climate Change
Poverty
In general terms, poverty refers to the inability of people to live a tolerable life (UNDP, 1997) . Among the aspects that compose it are mentioned leading a long and healthy life, having an education and enjoying a decent standard of living, in addition to other elements such as political freedom, respect for human rights, personal security, access to work productive and well-paid and participation in community life. However, given the natural difficulty of measuring some constituent elements of "quality of life", the study of poverty has been restricted to the quantifiable and general material aspects of it.
The term “poverty” has different meanings in the social sciences. Spiker et al. (2009) identifies eleven possible ways of interpreting this word: need, standard of living, insufficient resources, lack of basic security, lack of entitlements, multiple deprivation, exclusion, inequality, class, dependency, and unacceptable suffering. All these interpretations would be mutually exclusive, although several of them can be applied at the same time, and some of them may not be applicable in all situations.
In Latin America, two methodological approaches are preferably used to measure and characterize poverty: the indirect method called "income method" or "poverty lines" and the direct method of "social indicators", whose most widespread modality in the recent years has been the UBN.
As is known, both methods respond to different conceptual approaches, to the point that "they do not really constitute alternative ways of measuring the same thing, but rather represent two different conceptions of poverty" (Mendelsohn et al., 2010) ; these conceptions are based, in one case, on the notion of the capacity to satisfy essential needs and, in the other –the direct method–, on the observation of the real consumption of people in relation to certain conventions on minimum needs. However, the two methods are of great interest and contribute significantly to poverty diagnostic tasks.
The main source of information on unsatisfied basic needs (UBN) are the population and housing censuses, while the estimates by poverty lines are made on the basis of household surveys. In both cases, naturally, there is a methodological scheme and a certain operational matrix. However, the specific application of them usually goes through variants that are not always fully explained by the usual limitations in terms of information. This means that in some cases the results of studies that apparently use the same method and the same data sources, especially under the poverty lines approach, differ in the magnitude of estimated poverty (sometimes to a considerable extent) to the obvious bewilderment of analysts and public opinion. Such discrepancies affect the credibility and technical reliability of these measurements, call into question the evaluations of the level and evolution of poverty, and make international comparisons difficult (Feres & Mancero, 2001) .
The Consumption or Income method is an indirect method that classifies as poor those people who do not have sufficient resources to satisfy their basic needs (they are below the poverty line). It measures the standard of living based on the income or consumption of individuals or households. Although consumption (or income) reflects the ability to satisfy material needs, it does not necessarily reflect the standard of living achieved over time, nor those needs that do not directly and immediately depend on money (for example, the provision of public services).
“Poor” is defined as a person who belongs to a household whose per capita consumption, in a given period, is less than the value of the poverty line. The poverty line is the monetary equivalent of the cost of a basic basket of goods and services per person per period of time (generally fortnight or month).
The UBN method, or social indicators, is a method of direct measurement of poverty, it defines a household (or person) as poor when it has not been able to satisfy a group of needs classified as priority as basic, generally related to access to education, health, nutrition, housing, urban services and employment opportunities (Feres & Mancero, 2001) .
Ecuador has adopted the definition of poverty by UBN of the Andean Community (CAN), which is composed of 5 "dimensions", as described below:
- The dwelling has inadequate physical characteristics
- The house has inadequate services
- The household has high economic dependence
- In the home there are children who do not attend school
- The household is critically overcrowded
A household (or person) is placed in a situation of poverty if it maintains one of the dimensions, or in a situation of extreme poverty if it presents two or more.
Climate Change and Poverty
The relationship between climate change and poverty is not a recent issue. Historically, it is known that according to geographic location, people with many resources have the opportunity to choose the “best lands”. Therefore, in cold places like the Ecuadorian highlands, rich people choose to live in the lower part because it is warmer and they have the most productive land, while the rest must settle in the upper part. On the contrary, in warm places, wealthy people choose the highest places that are ventilated while the rest must settle in the lower part. Not being able to choose both the site for their housing and the land for production makes poor people highly vulnerable to the effects of climate change.
From a theoretical point of view, the relationship between climate change reflected in temperature and poverty measured through income has been proposed as an inverted U shape as shown in Figure 2. If indeed this inverted U relationship exists between temperature and income, then poor countries will be more sensitive to climate change than rich countries, because the slope of this relationship is steeper at the extremes; therefore, a small change in temperature, at the level where the slope is relatively flat, would cause a small change in income, while a small change in the extremes could cause large changes in income (Andersen & Verner, 2010) .
The vulnerability of people living in poverty to climate change is due to the fact that they generally have limited access to basic services such as drinking water, sewage, roads, and telecommunications, due to the costs of providing them, as a result of the area of residence. Likewise, they suffer a higher incidence of diseases because higher levels of humidity and temperature stimulate the spread of infectious diseases. Finally, they receive low income or in many cases do not receive it.
In the long term, the impact of climate change on poverty will be seen in phenomena such as food security, productivity and the very viability of the world's agricultural ecosystems.
According to Sánchez et al. (2011) in reference to the pronouncements of the Food and Agriculture Organization of the United Nations (FAO)
“…changes in agricultural production models, derived from climate change, will affect food security in two ways. First, the food supply locally and globally will be affected. In many low-income countries, with limited financial capacity to trade and relying largely on their own production to meet their food needs, it may be impossible to make up for the decline in local supply without increasing their reliance on food aid. Second, all traditional forms of agricultural production will be affected and the ability to access food will be reduced.
It is important to mention that in addition to agricultural production, other processes of the food system are equally important with respect to food security and poverty, such as the processing, distribution, acquisition, preparation and consumption of food. With climate change, the risk of damage to transport by storms and distribution infrastructure increases with the consequent disorganization in food production chains. In addition to the above, current projections for 2030 show that the share of groceries in the average expenditure of a family will continue to increase, due, among other factors, to the growing scarcity of water, land and fuel that exert progressive pressure on food prices generating higher levels of poverty”.
In short, although the climate can have various effects on individuals, it is considered that with a general warming of the atmosphere, the greatest impact would be manifested above all in an increase in mortality and a decrease in the levels of well-being of the population. That is, existing poverty and vulnerability would be strengthened and the difficulties faced by the poorest inhabitants of the planet to improve their development possibilities would increase. It should be noted that the effects of climate change would be especially devastating for populations living in developing countries; since these economies have few economic, human, technical resources and weak or non-existent institutions to deal with the effects of climate change. This supposes, therefore, a serious obstacle to eradicate poverty and also influences the search for solutions to the main problems such as universal education, health and food (García et al., 2010) .
To the extent that countries and communities are unable to adapt effectively to climate change, poverty reduction will become increasingly difficult, and existing adaptation “deficits” could widen into significant adaptation “gaps”. The artificial difference created between adaptation and development in the areas of politics and negotiations must be put aside, and investment in climate resilience must be made, in such a way that it allows the identification and implementation of policy instruments that can effectively counteract the impacts of climate change in poverty reduction (UNDP, 2007) .
- Methodology
- Quantitative Approach:
3.1. Relationship Between Poverty and Climatic Variables
According to Lopez-Feldman (2014) , existing studies on the impacts of climate change on inequality and poverty within a country have used either general equilibrium models and social accounting matrices (Mideksa, 2010) or cross-sectional regressions and aggregate data at the subnational level (Andersen & Verner, 2010) ; however, as Mideksa (2010) argues, an ideal study on income distribution as a poverty proxy should be based on income distribution at the household or individual level.
Lopez-Feldman (2014) propose two procedures to estimate the relationship between climatic variables and income.
The first consists of directly establishing the relationship between total income and climatic variables as proposed (Andersen & Verner, 2010) . In this procedure it is not necessary to detail the transmission channels of climate change at the income and therefore it is sufficient to analyze the total income; however, this approach is not exempt from criticism, as several authors argue that the potential impacts of climate change should include extreme events and indirect impacts (Schelling, 1992) and (Mideksa, 2010) .
The second consists of making estimates that are not based on total income but on agricultural income, assuming that this is where most of the direct impacts are expected, which is especially true when the unit of analysis is a rural household. This is not to say that the only impact of climate change on households is due to changes in farm income; however, this is the clearest direct transmission channel and the one that has been most studied. An approach to this procedure is followed in the first part of this document, under the assumption that the Chota Valley is clearly rural and that all the families surveyed are engaged in agriculture either as their main or secondary economic activity.
The methodology used in the first part of this study seeks to capture the relationship between climatic variables and agricultural income using cross-sectional regressions with microdata at the household level. The econometric model proposed is a non-linear relationship between agricultural income and climatic variables (temperature and precipitation) controlled by factors of household characteristics, which could affect the levels of agricultural production. The equation proposed econometrically in this study takes the following form:
where:
- Household (agricultural) income per capita i
- Average temperature in the home location i
- Monthly average precipitation per quarter (taking the central month as a proxy for the quarter, that is, February, May, August, November)
- Home features vector i
- error term
The estimation is done using ordinary least squares. It is important to highlight that mathematical expression 1 has been adequate to econometrically model the relationship between agricultural income and climate in developing countries (Mendelsohn et al., 2010) and furthermore, there are no alternative studies in the literature that suggest other functional forms or other methods of econometric estimation of said relationship using cross-section data. The model is estimated only for agricultural households (that is, those households that devoted most of their time or resources to agricultural production during the year).
3.2. Relationship Between Poverty, Knowledge About Climate Change, Actions and Adaptation to Climate Change
An analysis of the relationship between poverty, measured through the PMT index, with knowledge regarding climate change and its consequences is carried out; as well as the analysis of the relationship between poverty, measured through the PMT index, with actions against climate change and adaptation measures. The tool used is a logit regression, where the binary dependent variable is knowledge about climate change. The independent variable is the PMT index.
The mathematical expression proposed to calculate the probability of knowledge about climate change is:
where:
- is a binary dependent variable (with two possible values, 0 and 1).
- are a set of k independent variables, observed in order to predict or explain the value of .
To do this, we seek to determine from the construction of the model ), where:
depends on a vector of parameters .
For the case study, referring to knowledge about climate change, the variables are defined as follows:
- Y Knowledge about climate change
- Vector of independent variables, including the PMT variable
- Probability of knowing about climate change explained by the PMT poverty rate and household characteristics variables
- Regression coefficients (Parameters to be estimated)
As a result, the probabilities on the knowledge of climate change based on poverty are obtained.
Qualitative approach
In order to contrast the quantitative results obtained from the application of the EVCH survey, a focus group was held with actors from the intervention localities. For this purpose, a basic guide of questions was built for the invited people who were farmers in the area.
This part of the research seeks to qualitatively contrast the answers to the relationships between poverty, knowledge, actions and adaptation to climate change.
4. Data
For the analysis of the relationship between poverty and climate change, two primary sources are used, the first is a survey carried out in a representative sample of households in the Chota Valley, and the second is a focus group carried out with residents of the study localities.
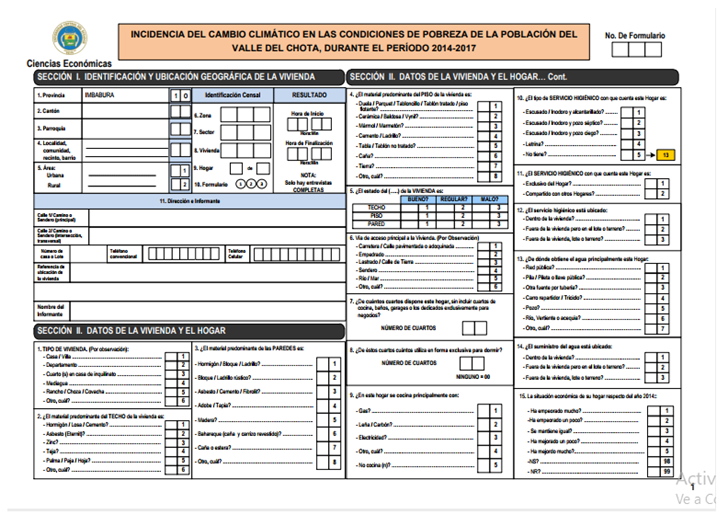
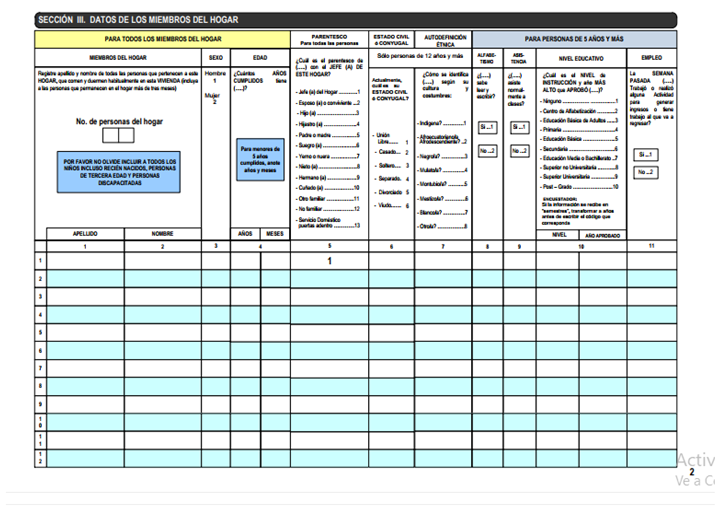
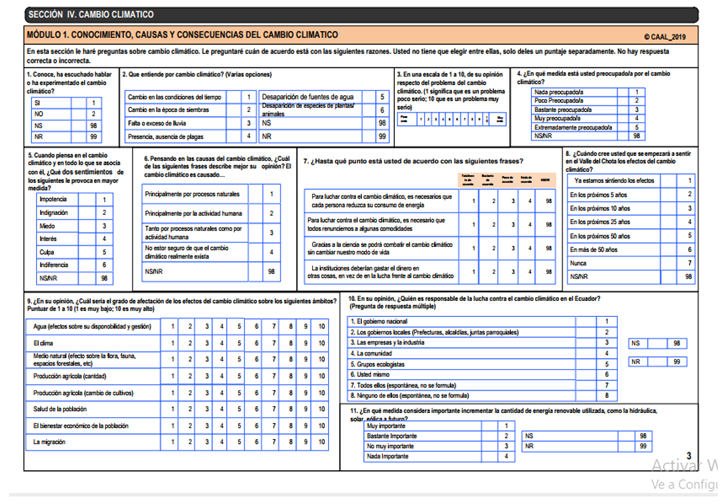
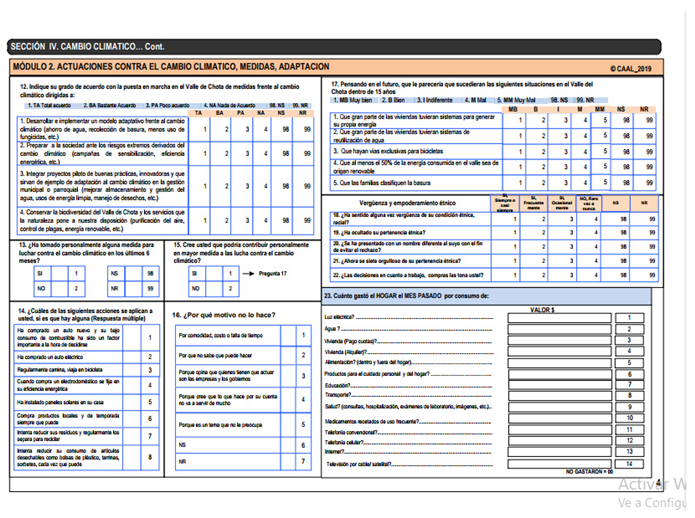
The survey " Incidence of climate change in the conditions of poverty of the population of Chota Valley, during the period 2014-2017 EVCH -" was carried out through a representative probabilistic sample in 224 households. The survey contains information on: identification and geographic location of the dwelling; housing and household data; household member data; knowledge, causes and consequences of climate change; actions against climate change, measures and adaptation. This survey made it possible to estimate aspects related to thinking about climate change, income and poverty measured by the PMT index. Appendix A.1 shows the form used, and Appendix A.2 shows the sample design.
The results of the quantitative study were contrasted with the responses of the focus group, which allowed a better understanding of the statistical interpretations and served as the basis for the discussion of this document. The guiding questions used in the focus group are presented in Appendix A.3.
5. Empirical Results
This section shows the results obtained from the descriptive analysis of the variables and the analysis of the relationships between poverty and climate change variables, obtained from mathematical expressions 1 and 2.
5.1. Descriptive Analysis of the Variables of the EVCH
The descriptions of the variables of housing and household, of the head of the household and of the perceptions regarding climate change are shown.
- a.
- Housing and household variables
Table 2 shows the descriptions of the housing and household variables
62.5% of the dwellings are of the House/Villa type, while 33.5% are of the Mediagua type.
40.2% of the houses have a Concrete/Slab/Cement roof, while 42% have a Zinc roof and 11.6% have an Asbestos/Eternit roof.
The walls of the houses are mostly Concrete/Block/Brick, 64.7%, while 29.5% are rustic Block/Brick.
The floor of the houses is Cement/Brick in 46.4% of the cases, followed by Ceramic/Tile/Vynil in 36.2% and Stave/Parquet/Plank/Floating floor in 12.9%. The state of the roof, in 54% of the cases, is good, while in 41.1% it is regular. Likewise, the state of the floor in 53.6% of the cases is good, while 42.4% is regular. Similarly, the condition of the walls is 52.7% good and 40.6% fair.
Access to housing, in 89.3% of cases, is through paved or cobbled roads/streets.
97.8% of homes cook with gas.
98.2% of households have a toilet/toilet and sewage system. 89.3% of households have an exclusive toilet service for the household. 80% of households have toilets inside the house.
Household water is obtained from the public network in 98.2%, in 79.9% of cases the water supply is inside the home.
When asked about a comparison of the economic situation of households with respect to the year 2014, 70.1% answered that it had gotten much worse, while 12.1% said that it had gotten a little worse.
- b.
- Head of household variables
Table 3 shows the descriptions of the variables of the head of the household
58% of households are headed by men and 42% by women.
37.5% of household heads are married, 19.2% single, 17% widower, and 14.3% live in a free union.
73.2% of household heads identify themselves as Afro-Ecuadorian, while 25% as mestizo.
86.2% of household heads know how to read and write; however, 66.5% only have primary education.
41% of household heads have 6 years of schooling, that is, complete primary school. 76.8% of household heads say they have a job.
Table 4 shows the statistics of the household and its members in terms of summary statistics.
Households have sizes ranging from 1 to 8 members, on average the number of members is 3.03.
The age of the head of household varies between 18 and 92 years old. On average, the age of the head of household is 53.3 years old.
The years of schooling of the head of household vary from 0 to 17 years and on average the value is 5.36 years.
The number of people in the household with secondary education varies from 0 to 5. On average, the number of people in the household with secondary education is 0.83
- c.
- Climate change variables
The section that investigates climate change is divided into two parts, the first regarding knowledge, causes and consequences of climate change, and the second on actions on climate change, measures and adaptation.
- c1. Knowledge, causes and consequences of climate change
Table 5 shows the descriptions regarding the knowledge, causes and consequences of climate change
93.3% of those interviewed state that they know, have heard or have experienced climate change.
When asked about what they understand by climate change, 78.1% associate it with changes in weather conditions, 37.1% associate it with a change in the planting season, 23.7% associate it with a lack or excess of rains, 18.8% associate with the presence or absence of pests, 14.7% related to the disappearance of water sources, finally in 11.2% associated with the disappearance of plant/animal species.
80.4% of people consider that climate change is a serious problem (categories from 6 to 10) and of these, 26.8% (category 10) think that it is a very serious problem.
63.8% of those surveyed are concerned about climate change, while 31.7% of people are not concerned at all.
As for the feeling caused by climate change, 31% are outraged, 23.7% fear, 20.5% impotence, while 10.7% feel indifference.
For 30.4% of people, climate change is due to natural processes, 27.2% believe that it is caused by human activity, while 33% have a mixed opinion, that is, climate change is due both to natural processes as to human activity. 4% answered not knowing what climate change is about.
58% of people agree that, to fight climate change, it is necessary for each person to reduce their energy consumption. 58.9% agree to give up some comforts. 53.1% of people believe that thanks to science it will be possible to combat climate change without changing our way of life. Finally, 60.7% think that the institutions should spend the money on other things, instead of fighting climate change.
To the question about the time in which the effects of climate change will begin to be felt in the Chota Valley, 85.7% respond that they are already feeling it now, while 5.7% say that it will begin to be felt in a time between 5 and 50 years and 3.6% say never.
Regarding the impact of climate change on some environmental factors, the informants respond:
Regarding water, its availability and management, 52.2% state that climate change affect it. Regarding the weather, 57.1% believe that climate change is affecting it. About the natural environment, this is flora, fauna, forest spaces, 61.6% believe that climate change has an effect. When looking at agricultural production, 66.1% of people agree that climate change has an effect on agriculture, particularly on the amount harvested, which is much less than in previous times. Likewise, 66.5% state that climate change has effects on agriculture, above all, it has forced them to abandon traditional crops such as ovo or beans and switch to mango crops. Regarding the impact of climate change on the health of the population, 58.9% of those surveyed accept that climate change has effects on the health of the population. When talking about the effect of climate change on the economic well-being of the population, 54.9% state that there is an effect. What is new in the case of Chota Valley is that it forced them to change their crops and this made the economic conditions of many families improve. Climate change has not had a great effect on the migration of the population of Chota Valley, 67.9% of those surveyed answered that the effect is low.
According to the results of the survey, those who must fight against climate change are the national government (45.1%), local governments (4%) and environmental groups (1.3%). The respondents do not attach responsibility to the companies or the industry, to the community itself or to each one of the people, nor is there that collective feeling that we all must fight against climate change.
When asking about the importance of increasing the use of renewable energy in the future, such as hydraulic, wind, 84.9% consider that it is very important to go towards the change from the use of fossil energies to renewable energies.
- c2. Actions against climate change and adaptation measures
Table 6 shows the descriptions regarding actions against climate change and adaptation measures.
When asked who is responsible for the fight against climate change in Ecuador, the majority answered is the national government with 45.1%. The responsibility of local governments, industry and including self-responsibility reaches 14.3%. The shared responsibility between all the actors is 33.9%.
84.8% of those surveyed consider it important to increase the amount of renewable energy used, such as hydraulic, solar, wind. To 7.1% it does not seem very important and to 8% it does not seem important at all or they do not know.
When asked if they agree with developing and implementing an adaptive model to face climate change (saving water, garbage collection, less use of fungicides, etc.), 83.1% said yes.
Regarding the implementation in the Chota Valley of measures aimed at preparing society for the extreme risks derived from climate change (awareness campaigns, energy efficiency, etc.), 82.6% agreed.
With respect to integrating pilot projects of good, innovative practices that serve as an example of adaptation to climate change in municipal or parish management (improving water storage and management, clean energy uses, waste management, etc.), 83% of the population agreed.
82.6% of those surveyed agreed to conserve the biodiversity of the Chota Valley and the services that nature makes available to us (air purification, pest control, renewable energy, etc.)
When asked about having personally taken some measure to fight climate change in the last 6 months, 69.2% said yes.
Regarding the actions that people apply, the first option is to regularly walk, travel by bicycle with 68.3%, followed by the options of trying to reduce the consumption of disposable items such as plastic bags, tubs, straws, whenever you can with a 26.3%, try to reduce their waste and regularly separate it for recycling with 23.7%, the rest of the options have very low percentages.
65.6% of those surveyed agreed that they could personally contribute more to the fight against climate change. 27.2% responded that they do not do it because they do not know what they can do.
Regarding the approach to the future in a period of 15 years of various situations in the Chota Valley, the answers were: Agreed that a large part of the houses had systems to generate their own energy in 80.4%. That a large part of the houses had water reuse systems in 84.4%. That there are exclusive paths for bicycles in 81.7%. That at least 50% of the energy consumed in the valley be of renewable origin in 82.1% and finally that families classify garbage in 86.6%.
5.2. Poverty and Climatic Variables
According to the proposed methodology, a regression model is developed that relates poverty and climatic variables.
- a.
- Variable selection
According to the theoretical model described in the mathematical expression (1), the variables to be used are:
- - the average temperature in each location of data collection (taking the central month as a proxy for the quarter, that is, February, May, August and November)
- - the temperature of each locality squared
- - Monthly average precipitation per quarter (taking the central month as a proxy for the quarter, that is, February, May, August and November)
- - average monthly precipitation squared
- – Vector of household characteristics
Within the vector of variables , depending on the model, the following are incorporated: years of schooling, experience, sex, ethnicity, people in the household with at least secondary education, and interactions between temperature and precipitation.
Data for the study period were obtained from the websites accuweather.com (Accuweather, nd) and freemeteo.org (Freemeteo.org, nd) . The statistics of the variables are shown in Table 7.
- b.
- The regression model
The regression model proposed in mathematical expression 2 was run using three models: The first takes into account only the climatic variables: temperature and precipitation. The second model takes into account the climatic variables: temperature and precipitation; and, household characteristics variables. The third model takes into account all the variables of model 2 and additionally the interactions between climatic variables.
Linear regression was performed by ordinary least squares to find relationships between climatic variables and poverty. To ensure better results, the natural logarithm of per capita income was used as the dependent variable and those corresponding to the three models described were used as independent variables. The presence of squared variables explains the non-linearity of the relationships between the variables. The vector of control characteristics Z includes: sex, age, education of the household head, number of members with secondary education in the household and ethnicity (dummy). The inclusion of these variables seeks to control the impact on income due to the characteristics of the household.
The results obtained are shown in Table 8:
In Model 1 it is observed that with the exception of temperature in the first quarter and rainfall in the first and second quarters, the rest of the variables are significant at 90%; that is, the effect on income of the climatic variables corresponding to the first and second quarters is not significant.
The results of Model 2 allow us to determine that the climatic variables of the third and fourth quarters and the variables years of schooling of the head of household and persons in the household with secondary education are significant, which indicates that the variables of household characteristics, in particular the level of education, have a greater effect on income.
The results of Model 3 indicate that the climatic variables: fourth quarter temperature and fourth quarter precipitation are significant. Likewise, the variables years of schooling of the head of household and number of people with high school education mainly explain the behavior of income. Additionally, it is observed that the interaction temperature*precipitation in the fourth quarter is significant. Therefore, it has a greater effect on income.
The marginal effects of the variables are shown in Table 9:
The marginal effects of Model 1 explain with a 90% confidence level, that a 1 °C increase in temperature in the first quarter positively influences agricultural production and, therefore, income. Likewise, a 1 °C increase in temperature in the third quarter has a negative influence on agricultural production and, therefore, on income. The effect of a 1 °C temperature increase in the fourth quarter is positive but small. Likewise, the 1 mm increase in precipitation in the fourth quarter negatively affects agriculture and, therefore, household income. The rest of the climatic variables are not significant and have no effect on agricultural production and, therefore, on income.
The climate variables in Model 2, with a 90% confidence level, cause similar effects on agricultural production and, therefore, on household income as in Model 1. It should be noted that the years of schooling of the household head have a positive effect on agricultural production and, therefore, on income. In addition, the number of persons with high school education in the household has a negative but small effect.
Unlike models 1 and 2 where it was possible to confirm with 90% reliability a positive but small effect on the income of the increase in rainfall in the quarter, model 3 shows the negative effect of the increase in temperature and level of precipitation on the income. Significant variables are also the level of education of the boss and the number of employees with secondary education at home.
5.3. The Proxy Poverty Index
Although questions were asked about household income, on many occasions the direct inquiry, without the detail that an Income and Expenditure survey could have or a survey to evaluate consumption such as the ECV Living Conditions Survey, can lead to a certain bias. That is why a proxy poverty index was calculated, regularly called the "Proxy Means Testing" index - PMT. A PMT is an index of observable and verifiable characteristics of households that serves as an approximation of their well-being. The PMT index is commonly used in situations where verifiable earnings data is not available. In our case, this index was calculated with the aim of having an alternative value for the poverty measure.
- a.
- Variable selection
The variables used to calculate the PMT index come from the EVCH survey. There are two groups of variables: the characteristics of the household and the people.
The variables of household characteristics, recoded for the calculation, can be seen in Table 10:
Likewise, the recoded person variables are presented in Table 11.
- b.
- The PMT Index
The technique used is CATPCA categorical principal component analysis. This procedure simultaneously quantifies the categorical variables while reducing the dimension of the data.
The goal of principal components analysis is to reduce an original set of variables into a smaller set of uncorrelated components that represent most of the information found in the original variables. The technique is most useful when a large number of variables prevents an efficient interpretation of the relationships between objects (subjects and units). By reducing the dimension, a small number of components are interpreted instead of a large number of variables.
Standard principal components analysis assumes linear relationships between numerical variables. On the other hand, the optimal scaling method allows variables to be scaled at different levels. Categorical variables are optimally quantified on the specified dimension. As a result, nonlinear relationships between variables can be modeled (IBM, 2015) .
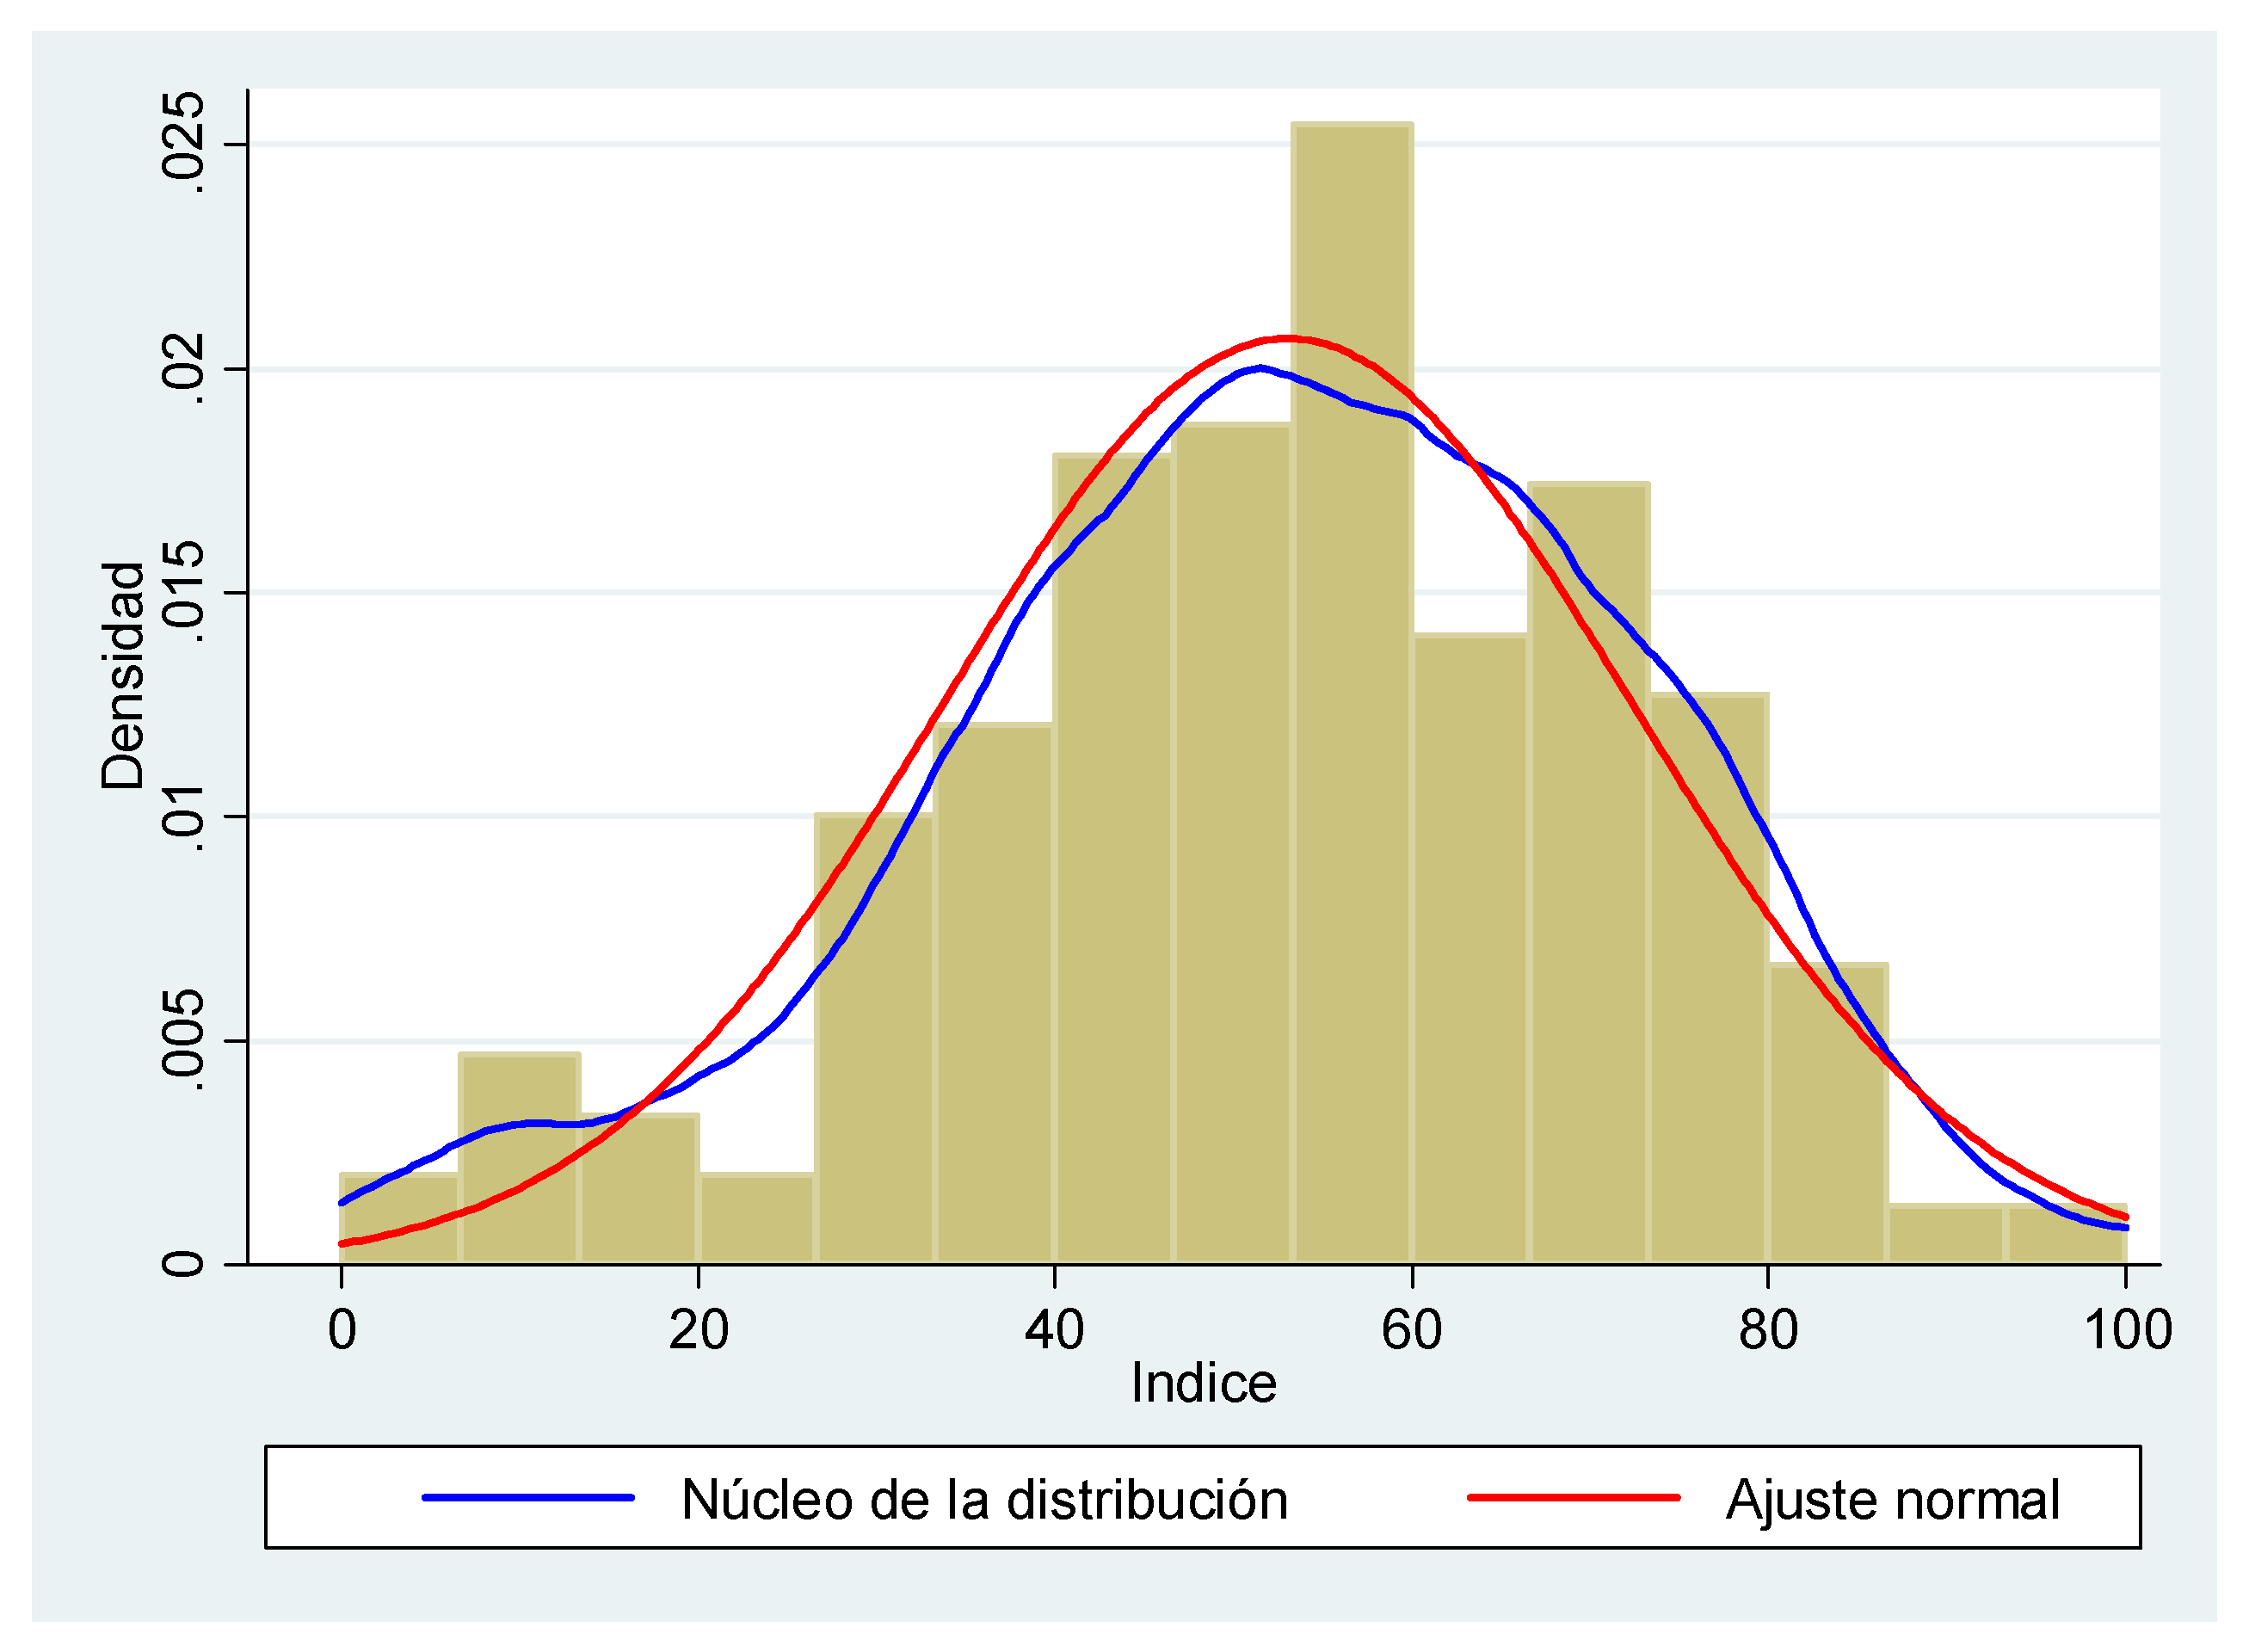
The technique used allows the calculation of two indexes, one of characteristics of the household (from 10 variables) and another of people (from 6 variables). Finally, using principal components, the PMT index is calculated. The PMT index, like the component index, has been expressed on a scale ranging from 0 to 100 points, where 0 represents total deprivation while 100 represents no deprivation.
Table 12 shows statistics of the component indexes and the PMT index.
As can be seen in Graph 3, the PMT index meets the required statistical conditions; that is, its shape fits a normal distribution, likewise the nucleus of the distribution is very close to the density graph.
Figure 3.
Proxy Poverty Index- PMT. Source: EVCH. Own elaboration.
The objective of calculating this index is to use it as an independent variable in the relationships between knowledge about climate change and poverty.
5.4. Poverty and Knowledge About Climate Change
It seeks to establish relationships between poverty expressed in the PMT index and knowledge of climate change.
- a.
- Variable selection
The variables on which it is sought to establish the relationships with poverty embodied in the PMT index are those that inquire about the knowledge of climate change. To measure the knowledge, causes and consequences of climate change, the variables represented in Table 13 are proposed.
From this list of variables, those that are effectively related to poverty are chosen.
To determine the variables that explain knowledge of climate change as a function of poverty, since they are categorical, Cramer's V coefficient matrix (equivalent to the correlation matrix) is calculated. The analysis of Cramer's V coefficient matrix allows to eliminate redundant variables (those whose coefficient is greater than |0.5|); and, eliminate variables with very low explanatory power (coefficient less than |0.1|). The final matrix with the four selected variables is shown in Table 14.
- Where:
- PMT Proxy Poverty Index
- C1 Knows, has heard about or has experienced CC
- C2 What do you mean by CC: Change in weather conditions
- C3 What do you understand by CC: Change in the planting season
- C4 To fight CC it is necessary for each person to reduce energy consumption
- b.
- The regression model
According to the methodology proposed in equation (2), logit -type regressions were carried out that allowed determining the relationships between knowledge about climate change and poverty.
The logit regression between knowledge about climate change as a function of the PMT index and variables of household characteristics, when the question "knows, has heard about or experienced climate change" is evaluated as a dependent variable, does not yield significant results. When evaluating knowledge about climate change understood as the change in the planting season, the results are significant, which from a practical point of view makes sense, because it is a simpler and clearer form of knowledge about climate change for informants. The two additional variables that explain knowledge about climate change are the education of the head of the household and the number of people with secondary education in the household. The results of the regression are shown in Table 15:
Knowledge about climate change, understood as the change in the planting season is related to poverty. The higher the PMT index, the greater the knowledge about climate change. In the same sense, the variables education of the head of household and people with secondary education contribute.
The LR chi 2 coefficient ensures that the model variables are adequate to explain the probability of knowledge of climate change. Individually, the regression coefficients are significant at 95%. Additionally, by calculating classification statistics, the model correctly predicts 70.1% of the cases.
As a result of the model, the average probability of knowledge about climate change in Chota Valley is 62.39%. The marginal effects of Table 16 show that the change in one point in the PMT index contributes 1.0105 times in knowledge about climate change. Similarly, the change of one year in the education of the head of the household contributes 1,028 times the knowledge about climate change, and the increase of a person with secondary education in the household contributes 1,135 times in the knowledge about climate change. The results of this regression are shown in Table 16:
With the model described, if a person had an index of 90 (not poor) and had 15 years of schooling, the probability of knowledge about climate change would be 97.56%, while if a person had an index of 30 (poor) and 2 years of schooling, their probability of knowing about climate change would be 37.36%.
5.5. Poverty and Actions Against Climate Change, Measures and Adaptation
It seeks to establish relationships between poverty expressed in the PMT index and actions against climate change, measures taken and adaptation.
- a.
- Variable selection
The variables on which it is sought to establish the relationships with poverty embodied in the PMT index are those that inquire about actions against climate change, measures and adaptation. To measure actions against climate change, measures and adaptation, the variables represented in Table 17 are proposed.
From this list of variables, those that are effectively related to poverty are chosen.
To determine the variables that explain actions against climate change, measures and adaptation as a function of poverty, being categorical, Cramer's V coefficient matrix is calculated. The final matrix with the two selected variables is shown in Table 18.
- Where:
- PMT Proxy Poverty Index
- A1 Agreement to develop and implement in the Chota Valley an adaptive model against CC (Saving water, garbage collection, less use of fungicides, etc.)
- A2 People believe that they could contribute to a greater extent to the fight against CC
- b.
- The regression model
In the development of the logit regression between the actions against climate change as a function of the PMT index, the variables do not turn out to be significant: years of education of the head of household and number of people in the household with secondary education, the results of the regression are shown in Table 19.
The model shows that actions against climate change, measures and adaptation, understood as "implementing an adaptive model in the face of climate change" is related to poverty. It is surprising that, in this model, a higher PMT index increases the lack of interest in acting on climate change.
The LRchi 2 coefficient ensures that the PMT Index variable is adequate to explain the probability of actions against climate change. Individually, the regression coefficients are significant at 95%. Additionally, by calculating classification statistics, the model correctly predicts 91.96% of the cases. Something that should be noted is that the negative sign of the coefficient of the PMT Index variable indicates that there is an inverse relationship between poverty and actions against climate change.
As a result of the model, the average probability of having actions against climate change in the Chota Valley is 92.65%. The marginal effects of Table 20 show that the change in one point in the poverty index causes the actions against climate change to decrease by 1.0017 times.
According to the model, if a person had an index of 90 (not poor), the probability of actions against climate change would be 81.24%, while if a person had an index of 30 (poor), their probability of actions against climate change would be 95.05%.
5.6. Focus Group
Through qualitative analysis, an approximation is sought to the feelings and reactions of people regarding the research topics: on one hand, knowledge about climate change and, on the other, actions against climate change, measures and adaptation. The topic is addressed through the use of one of the qualitative techniques suitable for our purposes, which is the focus group. From this perspective, the question guide was designed, the sample and the groups of invited people were chosen, the focus group was carried out, the results were systematized and interpreted, and an attempt was made to complement and contrast the quantitative results.
The focus group developed in the town of Chalguayacu, Ambuquí canton, was made up of farmers selected through contact with leaders of the area. The group showed a lot of interest in the topic and a great willingness to dialogue and present their criteria. They spoke enthusiastically and showed a formed opinion on climate change. Most had at least secondary school education and had experienced climate change in their own way.
Two of the participants were leaders of groups of fruit producers from Chota Valley.
Repeated topic in the conversation: The transition that they have had to make from traditional products such as eggs, prickly pears and cucumbers, among others, towards the massive production of mangoes.
Consensus: The climate has changed and is reflected in the planting and harvesting seasons; as well as, in the gradual reduction of the production of traditional crops that has prompted them to look for other products that are more productive and that is why they are now dedicated to the cultivation of mangoes.
Disagreements: In general, there were no differentiated positions in the group on the issues addressed.
Changes of opinion in the group: There were no changes of opinion caused by the group interaction.
Several opinions on a topic by the same participant: each participant had a defined position on the topics, which they held throughout the group discussion.
Presence of dominant participants: There were two participants, leaders of the farmers in the area who took the initiative to respond and, in some way, installed the bases of the interaction. This does not mean that the others did not speak, but that they complemented each other.
Figure 4 shows the word cloud that represents the thinking of the group participants regarding climate change, from the point of view of people dedicated to agriculture.
It can be seen that what stands out is the clear relationship between climate change and the type of products they are dedicated to, mainly mangoes. The mango is the star product to which they have migrated, leaving aside traditional products such as beans, ovo, cucumber, avocado due to the decrease in production precisely caused by climate change.
The full transcript of the focus group is shown in Appendix A.4.
6. Conclusions
Poverty, lack of adequate infrastructure, the provision of basic services, lack of social organization and ignorance of climate change are determining factors in the way in which climate change affects a social group. For this reason, the ability of communities to adapt is closely linked to local social and economic development, confirming the findings of Hanna et al. (2021) in his study on pollution.
Climate change seen as the change in temperature in the different quarters of the year shows a relationship with production, and as families are eminently dedicated to agriculture, the effect on income is evident. Model 1, developed only taking into account climatic variables, shows negative effects of temperature in the third quarter and positive effects of precipitation in the fourth quarter.
Model 2, which takes into account climatic variables and characteristics of the household, shows that more than the climatic variables, it is the variables of the characteristics of the people that influence household income. This result shows that the education of the head of the household as well as of its members is important in generating income for the families of the Chota Valley that dedicate themselves almost exclusively to agricultural activities. It can be inferred that access to education ensures access to information that improves cultivation techniques and procedures that lead to better income.
Model 3, which takes into account climatic variables, household characteristics and interactions between climatic variables, shows that only the climatic variables of the fourth quarter have effects on income. Likewise, it is ratified that the educational characteristics of the household members are determining factors in the behavior of income.
The construction of a PMT proxy poverty index based on 10 household variables and 6 individual variables contributes to a better identification of the poverty level of the population of Chota Valley.
When talking about the relationship between poverty and knowledge about climate change, the descriptive statistics show encouraging results (93.3% say they know); however, this "knowledge" is related to understanding climate change not for what it is but for the consequences that are perceived, the main ways of understanding being the change in weather conditions, the change in the planting season.
The variables that explain knowledge about climate change, understood as the change in weather conditions, are poverty (PMT index), the education level of the household head, and the number of people with at least secondary education in the household. The marginal effect of each of the explanatory variables is positive with respect to the increase in knowledge of climate change. Therefore, the increase in one point in the PMT index contributes 1.01 times in knowledge about climate change, the increase in one year in the schooling of the head of the household causes knowledge about climate change to increase by 1.03 times and the increase of a person with a secondary education in the household increases knowledge about climate change by 1.13 times.
The variable that explains the actions against climate change, measures and adaptation, understood as the "Agreement to develop and implement in the Chota Valley an adaptive model against CC (Saving water, garbage collection, less use of fungicides, etc.)” is poverty. The variables of schooling characteristics of the head of the household and its members are not significant in this case. The marginal effect of the PMT index on actions against climate change, measures and adaptation yields a "new" result, contrary to what one would think. The one-point increase in the PMT index contributes to a 1,025-fold decrease in actions against climate change. If this result could be extrapolated, it would be said that non-poor people are not interested in taking action against climate change.
A combination of results of knowledge and actions against climate change in Chota Valley could be summed up in that poor people lack knowledge about the phenomenon and with that knowledge they would be willing to fight and adapt to climate change, while people non-poor have the knowledge, but are averse to adaptation.
From the qualitative side, it can be concluded that the people of Chota Valley have experienced climate change in their own way, in changes in the weather, planting and harvesting times, in the disappearance of water sources, the low productivity of their products and the need to replace them with the handle.
From the economic point of view, the people of Chota Valley see climate change as the impetus towards migration to the production of more profitable fruits, particularly mangoes. However, they do not think about the long-term effects, where radical changes can occur that cause their current star product to no longer produce, as happened with ovos or cucumbers.
When asked about the changes in the living conditions of the Chota families between 2014 and 2017, all say that they have improved due to the transition to mango production.
As public policy measures, it is recommended to implement training for community members on knowledge of climate change; as well as take urgent measures at a personal and collective level to address these challenges, implementing various mitigation and adaptation actions to climate change in the Chota Valley; such as: the promotion of sustainable agricultural practices, the conservation of natural resources, education on climate change and the implementation of innovative technologies to improve the resilience of the population in the face of impacts.
As future research, the following are proposed: 1) To delve into a study where the levels of precipitation and temperatures are taken directly in each of the study locations, as well as investigate more precisely the pure income from agriculture that allow the construction of a Ricardian model (Mendelsohn et al., 2010) of the value of the land in the Chota Valley. 2) It is important to continue researching and monitoring the relationship between climate change and poverty in the Afro-Ecuadorian population in the Chota Valley and to continue implementing effective actions to mitigate its impacts and improve the lives of these communities. 3) Carry out a study at the regional or national level from the one developed in the Chota Valley.
Appendix A
Appendix A.1. Form
 |
 |
 |
 |
Appendix A.2. Sample
The study population is located in the Chota Valley, mainly in the Urcuquí canton.
The samples have been defined as follows:
- ⇨
- Sample quantitative part: 175 households (95% reliability, d=6% error). The calculation formula used is that of proportions with p=q=0.5
| POVERTY AND CLIMATE CHANGE IN THE CHOTA VALLEY | ||
| SAMPLE | ||
| Salinas | 14 | 14 |
| El Chota | 14 | 28 |
| Ambuquí | 14 | 42 |
| El Juncal | 14 | 14 |
| Chalguayacu | 14 | 14 |
| Caldera | 14 | 14 |
| Cuasquer | 14 | 14 |
| Carpuela | 14 | 28 |
| Pusir Chiquito | 14 | 14 |
| Tumbatú | 14 | 14 |
| San Vicente de Pusir | 14 | 14 |
| Mascarilla | 14 | 14 |
| TOTAL | 224 | |
- ⇨
- Sample qualitative part: Initially, the development of 2 focus groups of 10 people (Adults and youth represented equally by gender, authorities, leaders and local leaders, for each of the communities) is planned. Fewer or more focus groups may be held depending on the achievement of “component saturation”.
Appendix A.3. Guide to Questions
PROJECT CONDITIONS OF POVERTY AND CLIMATE CHANGE
QUESTION GUIDE
- Core Question
- How has climate change affected the poverty conditions of the population of Chota Valley, during the period 2014-2017?
- We are going to ask you to answer some questions about it:
- Big Topics:
- 1.
- Brief presentation of the topic and rules
- 2.
- Presentation of the participants
- 3.
-
Climate change knowledge
- 1-
- Have you heard or know about what climate change is?
- 2-
- From 2014 to now, have you seen changes in the local climate (I mean changes in rainfall, dry weather, hotter, colder)?
- 3-
- Regarding plants, have you seen or heard of the disappearance of some wild plants and the appearance of others?
- 4.
-
Opinion on changes in production
- 4-
- An indicator of climate change is said to be the presence or absence of bees. From your memories have you seen more bees before (2014) than now?
- 5-
- From 2014 to now, have you seen changes in the production of mangoes (I mean improvements, damage to the plants, have they had to apply more fungicides, do they no longer produce the same amount?
- 6-
- From 2014 to now, have you seen changes in the production of ovos (I mean improvements, damage to the plants, have they had to apply more fungicides, do they no longer produce the same amount?
- 7-
- From 2014 until now, have you seen changes in the production of tunas (I mean improvements, damage to the plants, have they had to apply more fungicides, do they no longer produce the same amount?
- 8-
- From 2014 to now, have you seen changes in the production of peppers (I mean improvements, damage to the plants, have they had to apply more fungicides, do they no longer produce the same amount?
- 5.
-
Opinion on water sources and irrigation
- 9-
- The sources of water for irrigation between 2014 and now remain the same (I mean that they all exist, their flow has been reduced, there were springs)
- 10-
- Regarding irrigation for the production of mangoes, if we compare between 2014 and now. Today it needs more irrigation, less irrigation or the same.
- 11-
- Regarding irrigation for the production of ovos, if we compare between 2014 and now. Today it needs more irrigation, less irrigation or the same.
- 12-
- Regarding irrigation for the production of tunas, if we compare between 2014 and now. Today it needs more irrigation, less irrigation or the same.
- 13-
- Regarding irrigation for the production of peppers, if we compare between 2014 and now. Today it needs more irrigation, less irrigation or the same.
- 6.
-
Perception of their standard of living
- 14-
- If you remember your standard of living in 2014, now it has improved, worsened or remains the same (understanding your standard of living as your income conditions, access to education, health, housing)
- 15-
- What is the main factor that has influenced the change in your standard of living?
- 16-
- Do you think that the change in your standard of living has to do with changes in climatic conditions (due to the change in production, in your health, etc...)
- 7.
-
Reaction to climate change
- 17-
- How you have been adapting to the effects of climate change in terms of yourself, the cultivation of your land
- 18-
- Knowing about the effects of climate change, you would be willing to take measures that are within your reach to counteract them (recycle garbage, do not waste so much water, do not use so much plastic...)
- 19-
- If there are stronger effects of climate change in the future, they are willing to react to them or they would stop farming.
- 8.
- Gratitude
Appendix A.4. Focus Group Transcript
Good day, we are going to talk about a project in which we investigate how the weather conditions of climate change have influenced the living conditions of the people of the Valley, so for that I am going to ask you a group of questions and I ask you all to respond with ease. These questions are related to some topics: knowledge about climate change, if they have observed changes in production, opinions about water sources and irrigation, if they are still valid, have they changed or no longer exist, a perception about their standard of living and what reactions would you have about climate change, those are some of the big issues, within those there are other questions that I would like you to answer for me. The first thing I am going to ask you is that each one of you tell me your name and what production you are dedicated to and how long you have been in that type of work.
My name is RA, I have been planting mango for about 18 or 19 years
Are you only dedicated to mango?
Yes, only mango. We have left the short-cycle, the collegues still plant it but I don’t anymore.
My name is ACh and I have been in the mango business for 12 years. The rest not anymore
Only mango too?
Yes, indeed
Until the colleague comes, I am going to ask you something about knowledge about climate change, if you live here, surely you are perceiving this climate change more closely
My name is LUP and I have more or less 10 years of mango cultivation
And you have no additional crops?
I still have sugar cane, lemon and short-cycle plants, beans.
Now I would like to ask you about knowledge of climate change if you have heard or know about climate change?
Climate change has also affected us, we realized in the production of ovo. The production of ovo before was that we used to take 40, 50 boxes per catch, then a time came that it no longer gave, if we caught 10-15 was a lot, it began to lower half by half, the mango itself is also affecting the flower right now if we don't spend enough on fumigations, the flower burns.
What is this due to, is the climate that has become colder, hotter, drier, more humid, what has happened?
There are times when it seems that it does not rain and when there is a lot of water the flower burns, because the water accumulates, the sun comes and there it burns us, so we have to maintain and give insecticides so that the flower does not burn
Alright, and in the other types of crops do you see some additional things?
Yes, and even worse. This occurs in all types of cultivation
Bean for example? Yes, there is a bird that eats it
Due to the summertime, we are in now, the mango is running out. The bird does eat it, too much
But was there that bird here before or not?
It is that we did not have the fruit
Where the fruit is, is where it appears more and more
Climate change is also easily seen or noticed in the appearance of some new plants and the disappearance of others, have you seen? Of the wild plants that have disappeared or have others appeared here?
You see, for example, earlier in beans we took up to 40 per 1, 35 quintals per one. Right now, if the farmer takes about 7 it's luck, it has dropped quite a lot. The tomato, for example, here in our area is no longer grown.
Even if you put fungicide?
Doesn’t matter what you put to the tomato, it will rise and change its color. In other words, in the market it is no longer desired because it is green, one side is red, the other side is green, so they no longer buy in the valley, tomatoes are no longer planted in the open air. They are planted in the highlands in Pimampiro, over there in San Rafael in greenhouses, no longer in an open field.
But before it was sown?
Before, we used to sow many hectares like this in the open field of other varieties, not of this seed that there is now.
So now it definitely doesn't happen here anymore? Now here everything is changed
When one speaks of climate change, another indicator is also implied is the presence of bees. Have you seen?
No, we don't have
There has never been?
Sometime yes. We wanted to put it on purpose but they died because we fumigated. How does the fertilization of the trees take place?
We have stationary pumps, so we have a reed, it is taken, it goes to the top, and it leaves with the reed.
Why, of course, if there haven't been bees here for a long time, I can't see the change, but in other places that's a good indicator before there were a lot of bees and now, they don't show up anymore, that's why the trees don't produce?
That's why we fumigated, a man from Cotacachi brought each of us four hives that died because the fumigation took place. Before a lot of bees came, now there is any because of the fumigation
So, you are obligated to put fungicides here?
In other words, a month before we start to harvest, we put something soft that doesn’t affect the mango
They are more dedicated to mangoes, but I am going to ask them about other products that they obviously know about.
Regarding the production of mangoes, the plants have been affected, they have had to apply more fungicides for them to produce. If we take into account four years before, what has happened is production still the same or do you have to add more fungicides, more water?
No, the same thing, because you see, we go to Guayaquil every two years to an international congress, so here they come, those who are prepared, more technical, have more technology, so they give us new technology, talks, and we come with that modern technology and we apply it ourselves.
Has that technology worked for you? Yes
Is having a mango on the Coast the same as having a mango here? It's the same, but the mango from here is better than the mango from the Coast
I 'm referring to the treatment they give on the coast because it's more humid there, right?
But on the other hand, here we have more hours of sun, we have more brick grade. And we have two harvests because we have more time in the sun, here we have from dawn until sunset.
The same question for ovos is to say if we take into account four years ago someone who had ovos now says that they no longer have it, has it decreased?
Yes, it decreased and affected a lot. I don't know if it was the weather or the plants got sick, I don't know, but what one more plant used to give before is no longer.
Isn't it also that people saw that the most profitable is the mango and that's why they left the ovos?
That is another feasible thing because I realized right now I took about 50 to 60 drawers of mango. For the ovo I have to get about 10 people to get 10 boxes and that is if it is fast to get
But also the same plant no longer produces the same as it did before?
It no longer produces, but before it was nice to see how it loaded the ovo
As for tunas, do you have any knowledge?
I have no knowledge because I don't know how to sow it, is very laborious you should have more knowledge because you need to dig
And maybe peppers or something else?
Yes, pepper and pickle
The question is: has there been more production from four years ago to now or is it still the same?
It seems that because by putting organic fertilizer, I am going to tell what those above in San Rafael say because they are experienced with organic fertilizer that is giving more results in peppers and pickles.
But it's good that they put organic fertilizer? We all put organic fertilizers on the mango, it is also time to put organic fertilizer
And what organic fertilizer do you use for the mango?
It’s called “gallinazo”. There are some who are sending gallinazo, others are doing it in Cotacachi. We know that it is giving results, I do not know if they are aware, they say that this fertilizer is very good
What is that fertilizer?
It's a fertilizer made up of one another. I still haven't use it. Mr. Cristian Paz told me about that fertilizer in Cotacachi, he has it and does irrigation as well.
About irrigation, would you like them to tell me if they remember 2014, are the water sources still the same, have they decreased, others have appeared or there were springs of water that have dried up rivers that were there and now there are no more, what has happened?
Currently there are no longer those springs that there were before there were quite a few, I remembered seeing three springs
How many were there before?
Quite a lot, but where I had walked there was a good amount, right now there are about five. There is a spring of water that’s always wet, also here in the juncal in the restaurant “Las Peñas” on the right side there is still a spring coming out, is not useful for consumption only to wash anything. Close to my land there is another eye of a hill just like that.
But is that used for irrigation?
No because it's just a little bit. On the other hand, because of something called Tutatis, there are still some springs from there, from the others I know that they have dried up, now it is less
Is it a process that is taking place now if we compare or remember four years ago in the production of mangoes, the mango needs more irrigation less irrigation, what happened?
If it needs a lot of water, yes, we say, if they say that it can withstand dryness, yes, but the more water they put on it, it becomes spongy, it grows and loads more
I mean, are you putting more water?
Of course, where there is water, there is permanent water, day and night and nothing happens, the more water there is when it is already in production, the better. For us it gives more weight. Water weighs a lot
What about the ovos, do you still need a lot of water?
Yes because, for example, if you are going to catch on Tuesday, it is time to collect water on Monday, from there it can be put from Thursday or Friday until Sunday and it is removed so that it is not so wet with mud because the catchers won’t be there
Is it not for the fruit itself if not for the space?
It is because of the space where people walk, the mango itself also has to be drained of water a day or two before so as not to walk in the mud so that it is not wet
Alright, now the relationship between what you think of your standard of living, understanding the standard of living as access to health, education, income from you if you remember from 2014 to here has improved your living conditions have worsened or remain the same or have you felt no change?
We have totally improved. Before with the agriculture of the ovo or the pepper, the beans, the tomato, we no longer existed, we disappeared. It was very hard work
I mean, this change that they gave to the mango that made their conditions improve, improve their income from what they had?
It turned upside down, if the situation is calmer, you realize that when it comes to beans, catch and sell a tomato for 20 or 30 dollars, suddenly for a dollar, that was the time to stop voting, I left the cement plants dumping, it did not go out to the collectors or for the drawers then it was time to leave that thrown there
Better to leave there than risk doing something? Yeah, but what do you think is the main factor that has improved living conditions?
It is the change of product, from fumigating tomatoes every eight or twice a week to fumigating mangoes every 15 days or a month, depending on whether there is no disease
Now, then, in a certain part, you would be grateful for climate change because it has made you change your product?
To some extent yes
Why or if it had not changed production?
It was time to change
Or was it already something that was coming?
You see, I remembered about 50 years ago my great grandparents had national avocado they harvested well because they harvested every eight days and they had money. Later that was thrown away because an illness came. It's over, they called it the moth and there was no more money.
Moth in the avocado?
Yes, the moth arrived in the avocado and all the avocado was gone
I mean, did there came a time when you left the avocado?
Yes, our ancestors knocked everything down because that moth arrived and got sick, then the avocado was no longer worth eating
Now these reactions to change, the latest reactions to climate change, how have you been adapting to the changes caused by the weather, by the lack of water, by all the aspects that have damaged the aspects of your form? traditional farming? What have you done to adapt to the new weather? Because if there has been a change, one of these is the one that you just told me, that you changed to mango cultivation, which on the one hand is more resistant, another thing that you have done?
I mean, I think that this has been our source and we are fine from there, otherwise, as Don Ramón said, only with tomato, beans, but thanks here to this little plant that is a mango and avocado, we are still subsisting here and we are healthy and we are not so old anymore
On what do you spend the most time on?
Now for the other point? If I tell you, knowing about this climate change, would you be willing to take measures so that it doesn't affect us so much, for example, no longer using a lot of plastic in your mango packaging, no longer using those plastic jars, recycling things, could you do that or definitely not? could they do that?
But in this case, for example, the mango, the tomato is now in cardboards, they were putting that greenhouse tomato in those drawers, there it was changed to cardboards, the mango is in drawers or it is in cardboards
Are you already taking some measure that you can carry in those cardboards?
Yes, in those cardboards
Have you taken into account that the plastic and all that is harmful? Now, if in the future the climate changes more radically, would you continue to stay here in Chota, cultivating what you are doing or what you would do?
We have nowhere else to go, we were born here and here we have to die, at least with our beloved little plants, we cannot go out at any time because we already have planting our money factor so that it is very clear this is what we live for
So you would continue adapting to what continues to happen if an African fruit appears out there that is better than the mango and it grows here, would you dedicate yourself to that?
The problem is that we no longer have land to plant a fruit that comes out sooner but unfortunately we no longer have space
Why is that?
All the little we have is already covered with trees
I mean now they already have mangoes and everything they produce?
If someone wants to help the association by getting us more land there would be no problem
You mean lands around here?
Yes around here, we would have to expropriate the rich people
Are there people who have farms around here?
There are people, Yachay for instance, we expropriated the big ones, but there are none here.
Yachay is another country house then?
Well, thank you that was all the conversation we wanted to have with you all.
References
- Accuweather. Accuweather. n.d. Available online: https://www.accuweather.com/.
- Alkire, S.; Foster, J. Recuento y medición multidimensional de la pobreza. Documento de Trabajo OPHI No. 7 2008, 1–46. [Google Scholar]
- Andersen, L.; Verner, D. Word Bank, Ed.; Simulating the Effects of Climate Change on Poverty and Inequality. In Reducing Poverty, Protecting Livelihoods, and Building Assets in a Changing Climate Social Implications of Climate Change for Latin America and the Caribbean; 2010; pp. 249–266. [Google Scholar]
- Boltvinik, J. Peter Townsend y el rumbo de la investigación sobre pobreza en Gran Bretaña, 2011.
- Booth, C. LIFE AND LABOUR OF THE PEOPLE IN LONDON.
- Bourguignon, F.; Chakravarty, S. Inequality, Polarization and Poverty. Inequality, Polarization and Poverty 2008, 25–49. [Google Scholar] [CrossRef]
- CEPAL. Medidas de mitigación y adaptación al cambio climático en América Latina y el Caribe. CEPAL. 2017.
- Coronel, R. El Valle Sangriento 1580-1700: De los señoríos de la coca y el algodón a la cañera jesuita, 1987.
- Feres, J. C.; Mancero, X. Enofoque para la medición de la pobreza. Breve revisión de la literatura. In Estudios estadísticos y prospectivos. 2001. Available online: http://www.cepal.org/publicaciones/xml/8/14038/lc2024e.pdf.
- Freemeteo.org. Freemeteo.org freemeteo.org. n.d.
- García, A.; Responsable, G.; Barbero, C.; Técnica, S.; Educación, D. Cambio climático y Pobreza: Retos y Falsos Remedios, 2010.
- González, M.; Burguete, A.; Ortiz-t, P. La autonomía a debate Autogobierno indígena y Estado plurinacional en América Latina; S., E., FLACSO, Eds.; flacso, 2010. [Google Scholar]
- Guerrero, F. Población indígena y afroecuatoriana en Ecuador: diagnóstico sociodemográfico a partir del censo de 2001. Santiago: BID/Cepal 2005, 1–13. Available online: http://www.cepal.org/id.asp?id=22276.
- Hanna, R.; Schneider, J.; Hanna, R.; Hoffmann, B.; Oliva, P.; Schneider, J. The Power of Perception Limitations of Information in Reducing Air Pollution Exposure The Power of Perception Limitations of Information in Reducing Air Pollution Exposure. IDB Publications (Working Papers), 2021.
- IBM. Análisis de componentes principales categórico (CATPCA). SPSS Manual. 2015. Available online: https://www.google.com/url?sa=t&rct=j&q=&esrc=s&source=web&cd=&cad=rja&uact=8&ved=2ahUKEwjjze--wZ_wAhUsmeAKHWLXDjwQFjAAegQIAhAD&url=https%3A%2F%2Fwww.ibm.com%2Fdocs%2Fes%2FSSLVMB_subs%2Fstatistics_mainhelp_ddita%2Fspss%2Fcategories%2Fidh_cpca.html&usg=AOv.
- López-Feldman, A. Cambio climático, distribución del ingreso y la pobreza. El caso de México. Comisión Económica Para América Latina y El Caribe (CEPAL 2014, 40. [Google Scholar]
- Martínez, J.; Fernández, A. Cambio climático: una visión desde México. In SEMARNAT. 2005. wars_12December2010.pdf%0Ahttps://think-asia.org/handle/11540/8282%0Ahttps://www.jstor.org/stable/41857625. Available online: https://www.researchgate.net/publication/269107473_What_is_governance/link/548173090cf22525dcb61443/download%0Ahttp://www.econ.upf.edu/~reynal/Civil.
- Mendelsohn, R.; Arellano-Gonzalez, J.; Christensen, P. A Ricardian analysis of Mexican farms. Environment and Development Economics 2010, 15(2), 153–171. [Google Scholar] [CrossRef]
- Mideksa, T. K. Economic and distributional impacts of climate change: The case of Ethiopia. Global Environmental Change 2010, 20(2), 278–286. [Google Scholar] [CrossRef]
- PNUD. Informe sobre desarrollo humano 1997. In Revista de Fomento Social 1997. [Google Scholar] [CrossRef]
- PNUD. Informe sobre Desarrollo Humano años 2007-2008. 2007. Available online: http://hdr.undp.org.
- Sánchez, A.; Gay, C.; Estrada, F. Cambio climático y pobreza en el Distrito Federal. Investigacion Economica 2011, 70(278), 45–74. [Google Scholar] [CrossRef]
- Schelling, T. Some Economics of Global Warming. American Economic Association 1992, 80(1), 298–304. [Google Scholar]
- Sen, A. Desarrollo y Libertad, 2011.
- Sirvent, M.; Rigal, L. Investigación Acción Participativa; Flacsoandes, 2012. [Google Scholar]
- Smith, A. AN INQUIRY INTO THE NATURE AND CAUSES OF THE WEALTH OF by.
- Spicker, P.; Álvarez, S.; Gordon, D. Pobreza Un glosario internacional. 2009. Available online: http://biblioteca.clacso.edu.ar/ar/libros/clacso/crop/glosario/glosario.pdf.
- Tsui, K. Y. Social Choice and Welfare. In Social Choice and Welfare; Number 1-SpringerLink, 2002; Volume 19, pp. 69–93. Available online: http://www.springerlink.com/index/9XJGK6DD7DFWMLW9.pdf.
- UNICEF. Diagnóstico de la situación. Niñas, niñas y adolescentes de Ecuador frente al cambio climático, 2020.
Figure 1.
Location of the Chota Valley. Source: INEC and Ancestral Territory of Chota Valley, La Concepción and Salinas. Own Elaboration.
Figure 1.
Location of the Chota Valley. Source: INEC and Ancestral Territory of Chota Valley, La Concepción and Salinas. Own Elaboration.
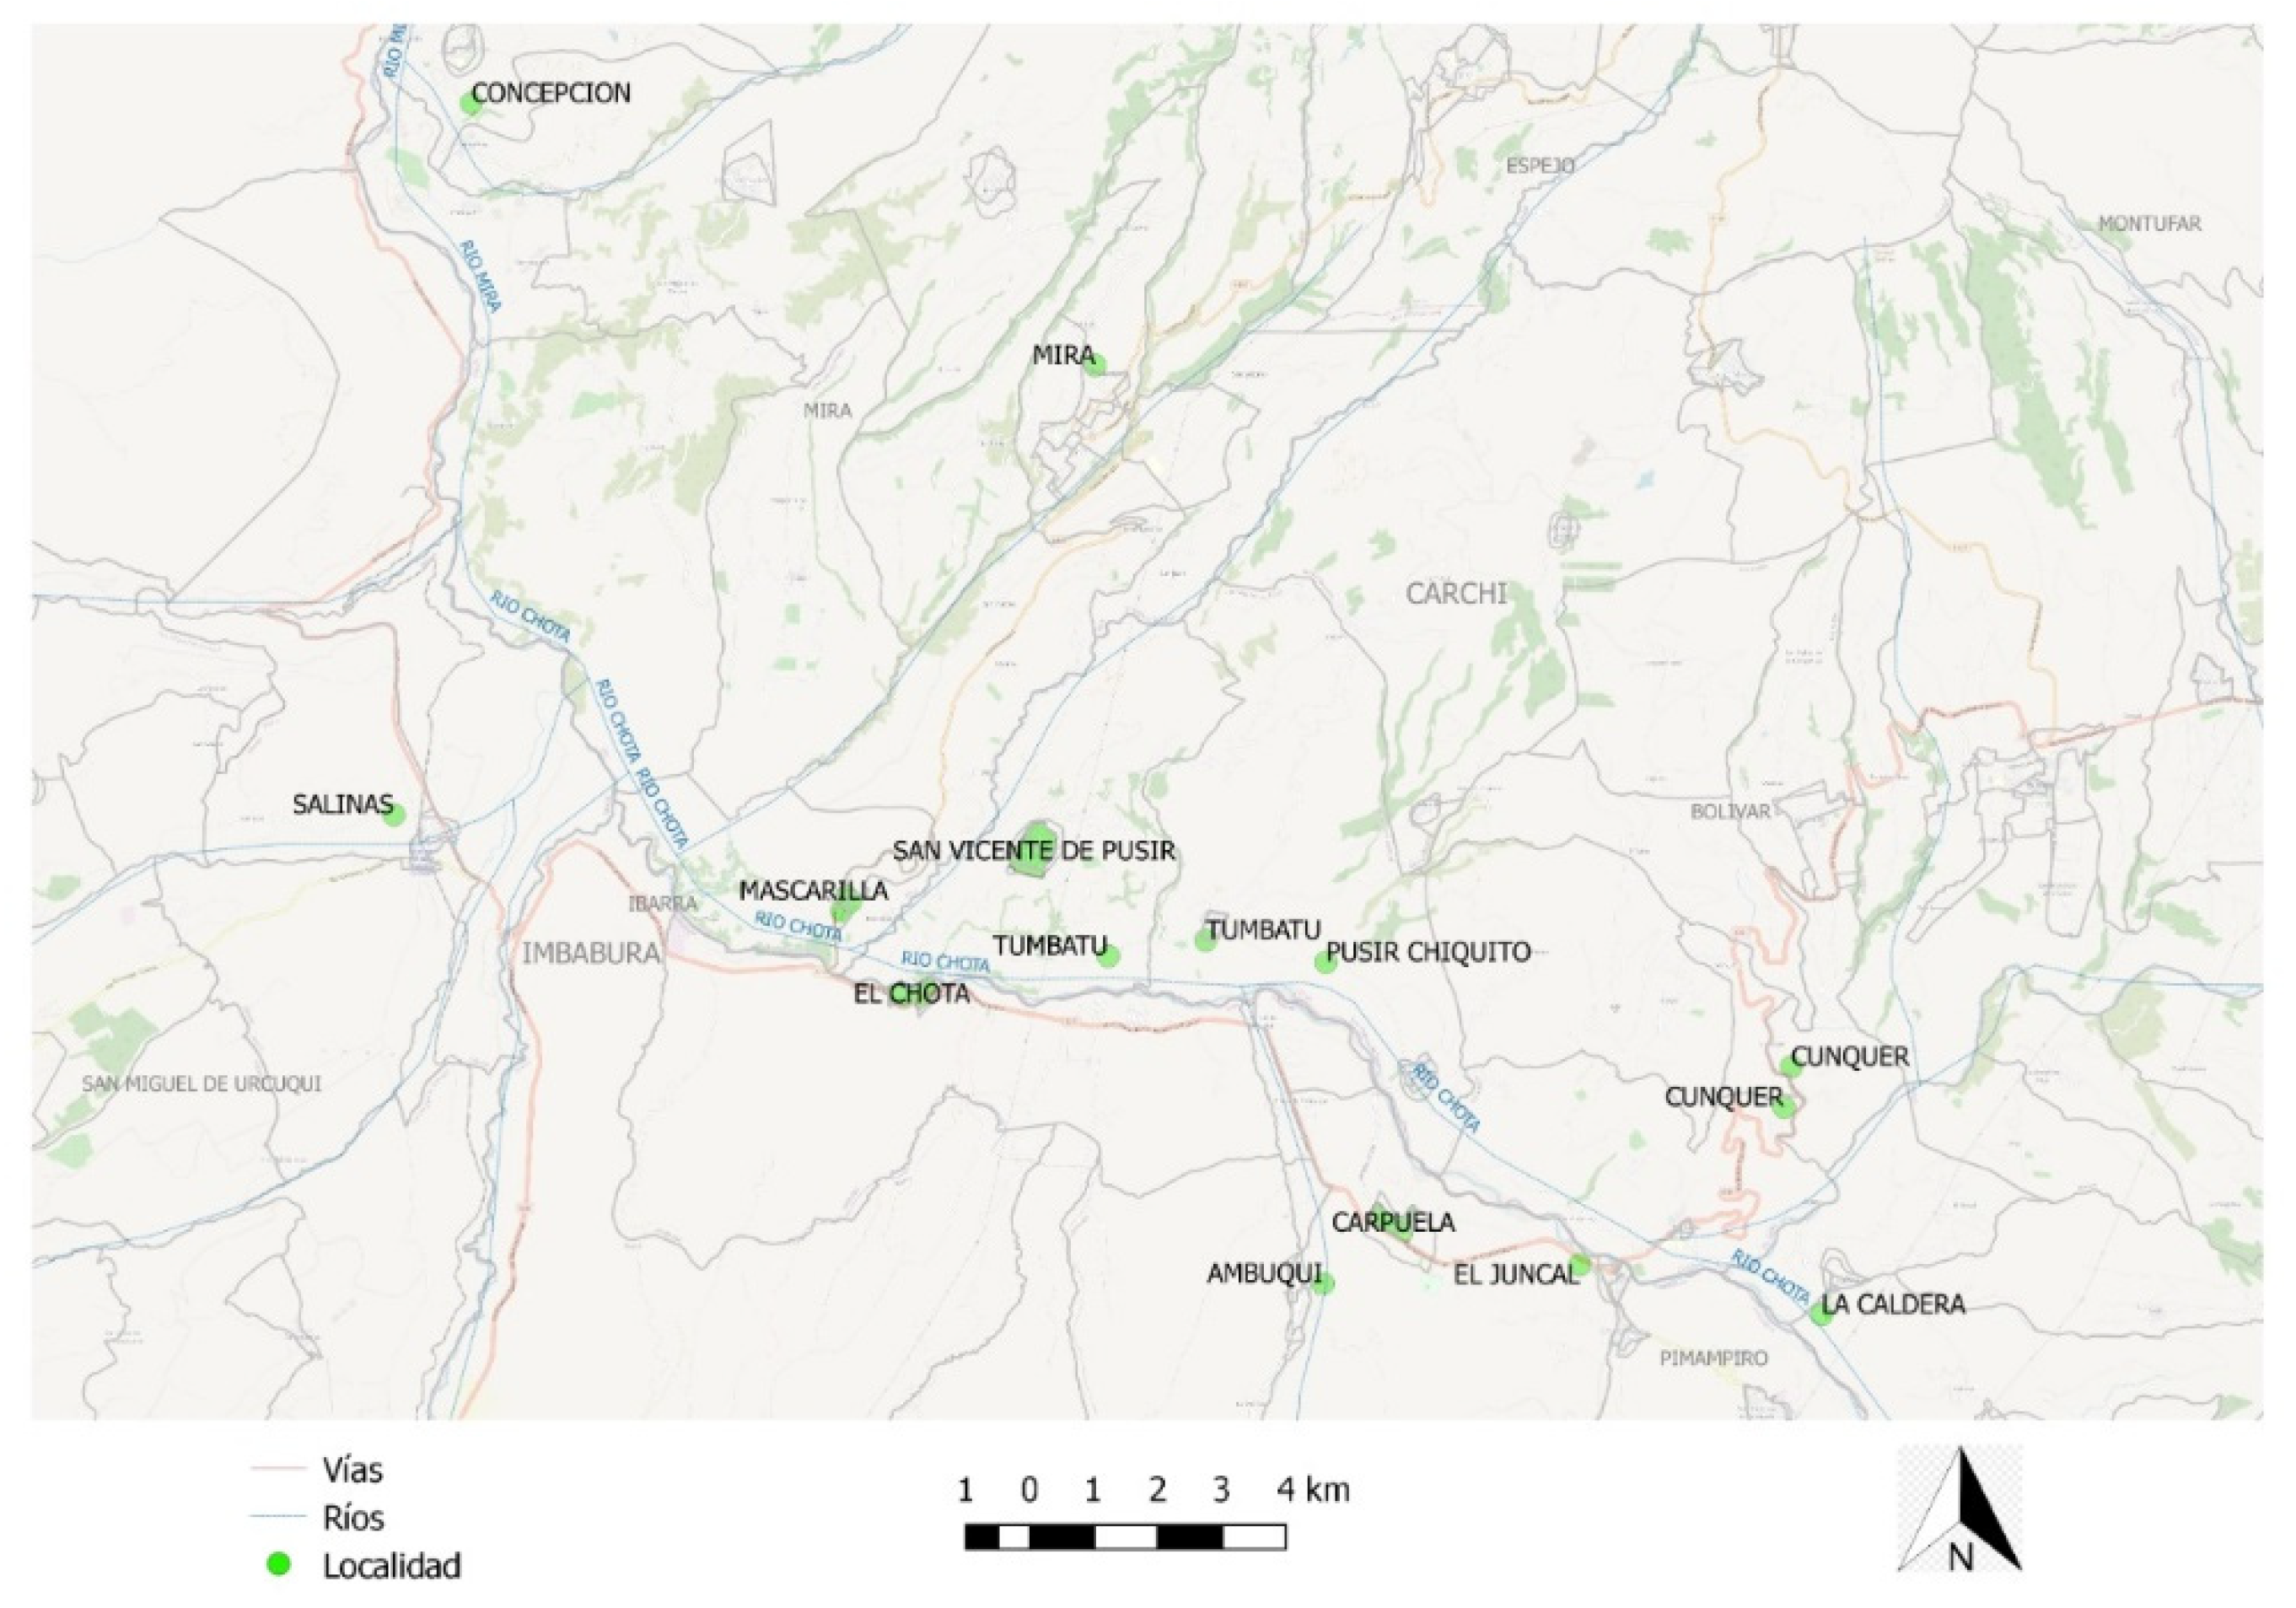
Figure 2.
Theoretical relationship between temperature and income. Source: (Andersen & Verner, 2010). Own elaboration.
Figure 2.
Theoretical relationship between temperature and income. Source: (Andersen & Verner, 2010). Own elaboration.
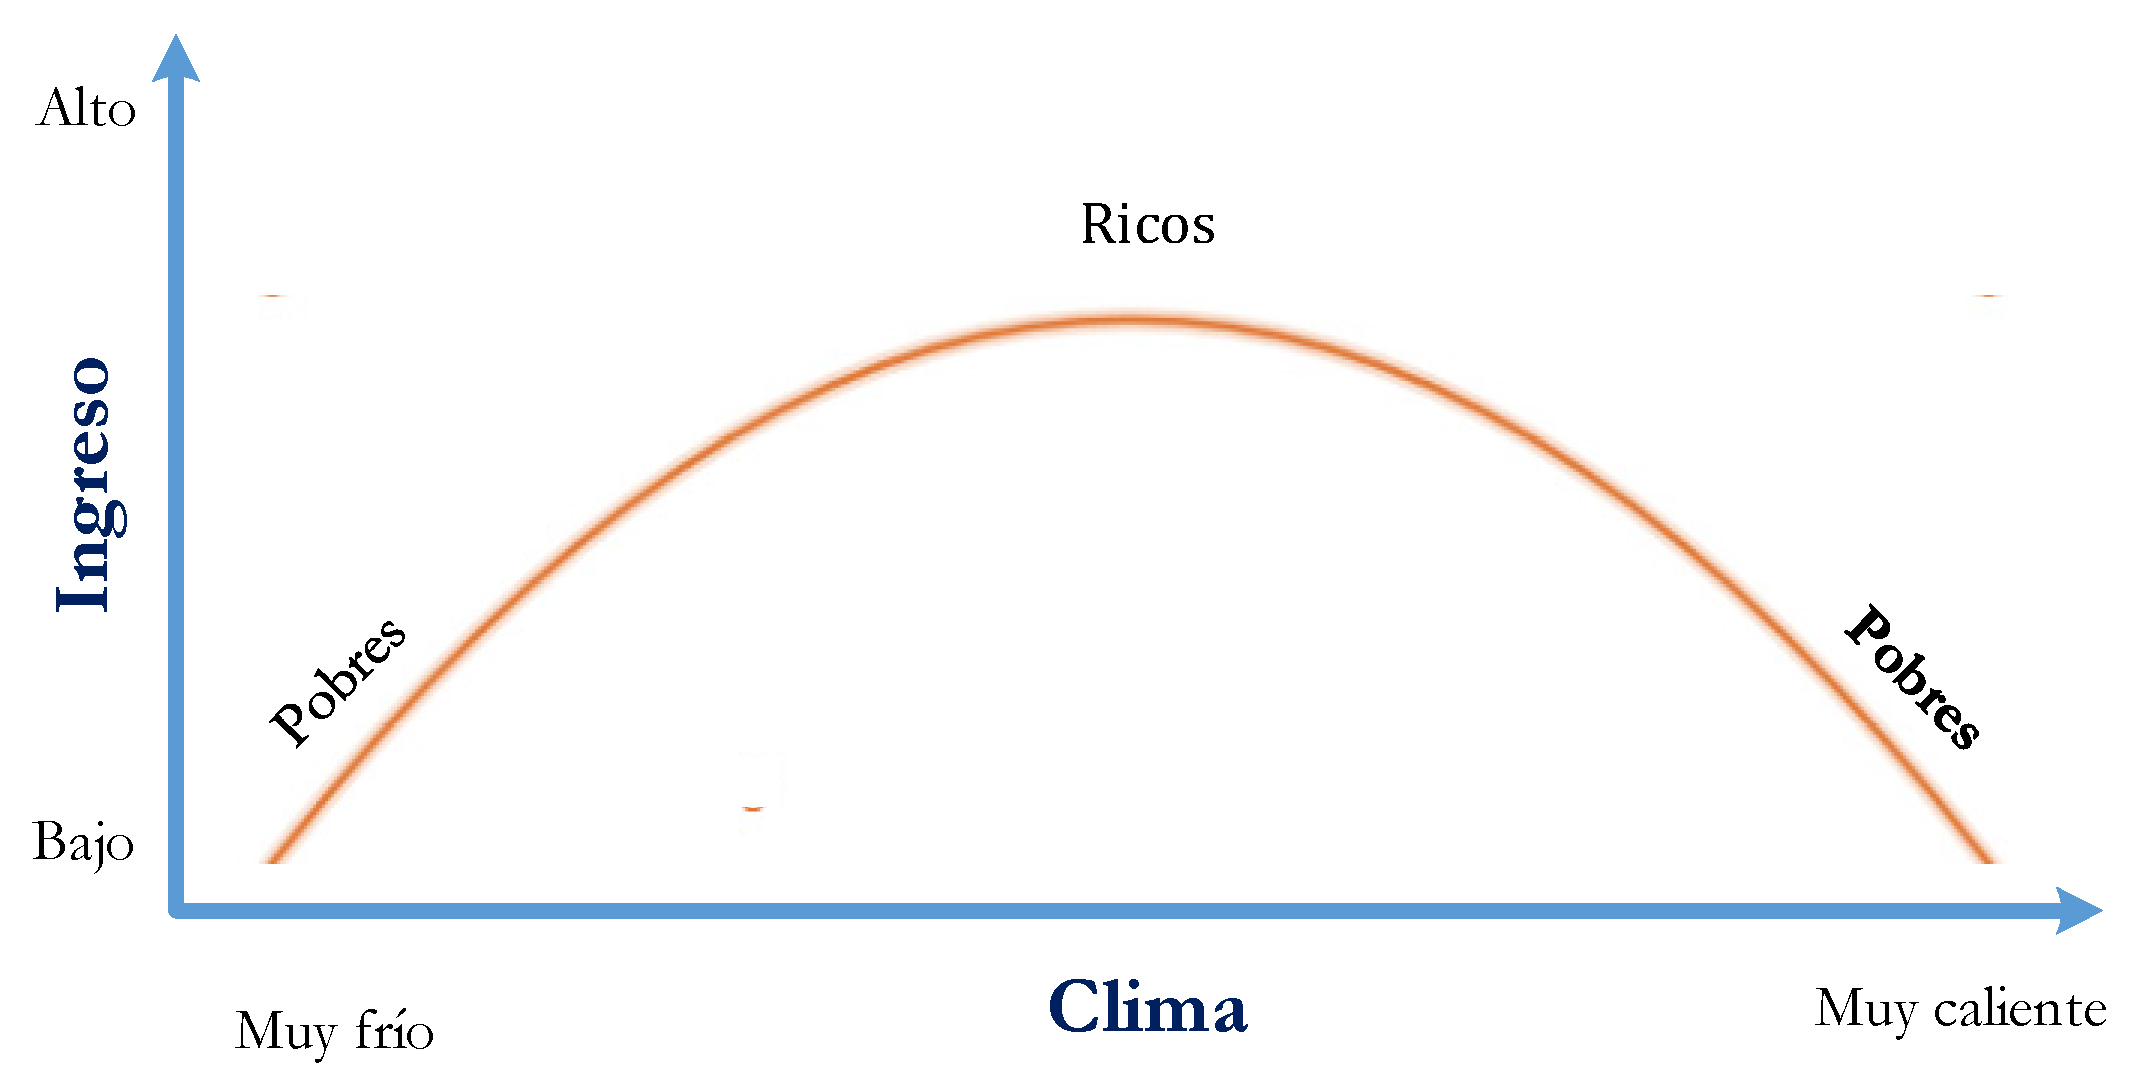
Figure 4.
Word Cloud - Focus Group. Source: Focus Group. Own elaboration.
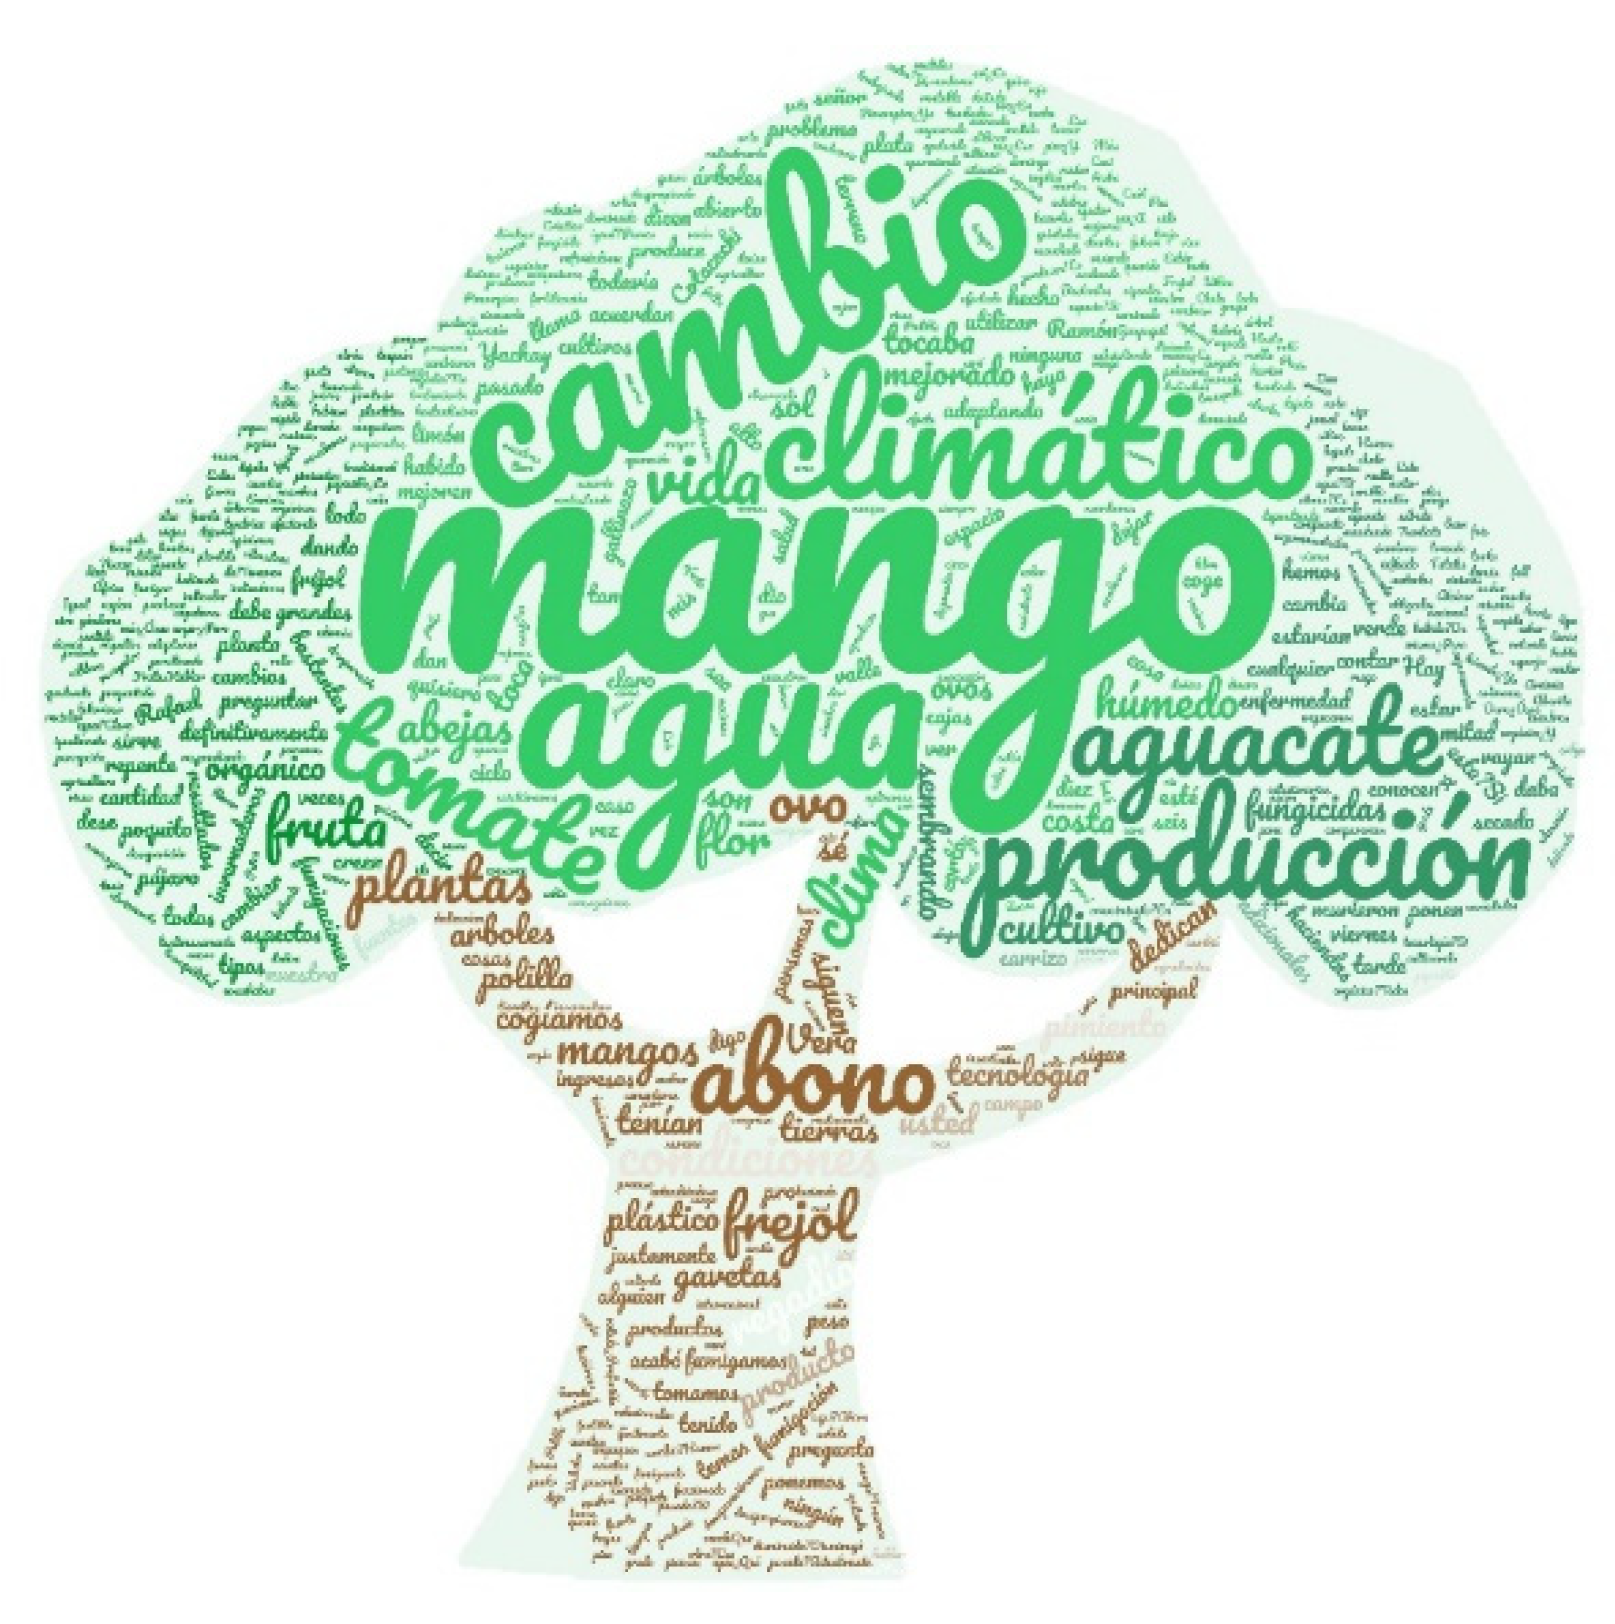

Table 1.
Afro-Ecuadorian population according to sociocultural area.
| Sociocultural Area (*) | Afro-Ecuadorian population | Total population | Percentages | |||
| 2001 | 2010 | 2001 | 2010 | 2001 | 2010 | |
| North Coast | 183,113 | 251,562 | 1,571,248 | 1,802,814 | 11.7% | 14.0% |
| Chota Valley | 24,783 | 26,262 | 496,983 | 546,535 | 5.0% | 4.8% |
| Pichincha | 78,621 | 128,327 | 2,388,817 | 2,745,575 | 3.3% | 4.7% |
| North Amazon | 10,884 | 14,631 | 294,627 | 398,799 | 3.7% | 3.7% |
| Central-South Coast | 275,452 | 428,210 | 4,889,810 | 5,286,021 | 5.6% | 8.1% |
| Center-South Sierra | 23,700 | 39,997 | 2,170,103 | 2,401,944 | 1.1% | 1.7% |
| Rest of the country | 7,456 | 7,172 | 345,020 | 366,074 | 2.2% | 2.0% |
| Total | 604,009 | 896,161 | 12,156,608 | 13,547,762 | ||
(*) To be comparable, in 2010 Santo Domingo in Pichincha and Santa Elena in the Central-South Coast area are included. Source: INEC-Censuses 2001 and 2010. Own elaboration.
Table 2.
EVCH- Housing and Home Descriptives.
| Type of Housing | House/Villa | 62.5% |
| Mediagua | 33.5% | |
| Apartment/Room in each tenancy/Ranch-Shack-Covacha | 4.0% | |
| House Roof | Concrete/Slab/Cement | 40.2% |
| Zinc | 42.0% | |
| Asbestos/Eternit | 11.6% | |
| Tile/Other | 6.2% | |
| House Walls | Concrete/Block/Brick | 64.7% |
| Rustic Block/Brick | 29.5% | |
| Adobe/Wood | 5.8% | |
| Apartment Floor | Cement/Brick | 46.4% |
| Ceramic/Tile/Vynil | 36.2% | |
| Stave/Parquet/Plank/Floating Floor | 12.9% | |
| Board/Untreated Plank/Cane/Dirt | 4.5% | |
| State of the Roof of the House | Okay | 54.0% |
| Regular | 41.1% | |
| Bad | 4.9% | |
| Condition of the Walls of the House | Okay | 52.7% |
| Regular | 40.6% | |
| Bad | 6.7% | |
| State of the Apartment Floor | Okay | 53.6% |
| Regular | 42.4% | |
| Bad | 4.0% | |
| Access to Housing | Paved or Paved Road/Street | 89.3% |
| Cobbled / Ballasted / Dirt Road / Path | 10.7% | |
| Cooking Fuel | Gas | 97.8% |
| Wood/Coal/Electricity/No cooking | 2.2% | |
| Excreta Disposal Type | Toilet/Toilet and Sewer | 98.2% |
| Toilet / Toilet and Septic Tank / Does not have | 1.8% | |
| Type of Toilet Service | Home exclusive | 89.7% |
| Shared with others | 10.3% | |
| Location of the Toilet | Inside the house | 80.7% |
| Outside the house | 19.3% | |
| Water Source | Public network | 98.2% |
| Other source by pipeline/River slope or ditch | 1.8% | |
| Water Source Location | Inside the house | 79.9% |
| Outside the house | 20.1% | |
| Economic Situation of the Household compared to 2014 | It's gotten a lot worse/It's gotten a little worse | 82.1% |
| It remains the same | 12.5% | |
| It has improved a little/It has improved a lot | 5.4% |
Source: EVCH. Own elaboration.
Table 3.
EVCH- Descriptives of the head of the household.
| Sex | Men | 58.04% |
| Woman | 41.96% | |
| Marital Status | Married | 37.50% |
| Single | 19.20% | |
| Widower | 16.96% | |
| Free Union | 14.29% | |
| Separate | 7.59% | |
| Divorced | 4.46% | |
| Ethnic Self-Definition | Afro-Ecuadorian/Black/Mulatto | 73.22% |
| Half Blood | 25.00% | |
| Montubio | 0.89% | |
| Indigenous | 0.45% | |
| White | 0.45% | |
| Knows how to Read and Write | Yes | 86.16% |
| No | 13.84% | |
| Level of Instruction | Primary | 66.52% |
| None | 15.63% | |
| Middle school or high school | 7.14% | |
| Secondary | 6.25% | |
| University superior | 2.23% | |
| Basic education | 1.34% | |
| Basic ed. for adults | 0.45% | |
| Non-university higher | 0.45% | |
| Years of schooling of the person for the population aged 15 or over | 0 | 15.63% |
| 1 to 5 | 26.34% | |
| 6 | 41.07% | |
| 7 and over | 16.96% | |
| Employment | Yes | 76.79% |
| No | 23.21% |
Source: EVCH. Own elaboration.
Table 4.
EVCH- Household Summary Statistics.
| Variable | Obs. | Half | Std. Dev. | Min. | Max. |
| Household Size | 224 | 3,027 | 1,599 | 1 | 8 |
| Head of Household Age | 224 | 53,295 | 16,564 | 18 | 92 |
| Head's Schooling | 224 | 5,366 | 3,795 | 0 | 17 |
| People in the Household with High School | 224 | 0.830 | 1,163 | 0 | 5 |
Source: EVCH. Own elaboration.
Table 5.
EVCH- Knowledge, causes and consequences of climate change.
| Have you heard of climate change? | Yes | 93.3% |
| No | 6.3% | |
| NS | 0.4% | |
| According to you what is climate change? (Not exclusive) | Change in weather conditions | 78.1% |
| Change in planting season | 37.1% | |
| Lack or excess of rain | 23.7% | |
| Presence, absence of pests | 18.8% | |
| Disappearance of water sources | 14.7% | |
| Disappearance of plant/animal species | 11.2% | |
| On a scale of 1 to 10, your opinion regarding the problem of climate change. (1 means that it is not a serious problem; 10 means that it is a very serious problem) | From 1 to 5 | 19.6% |
| From 6 to 9 | 51.8% | |
| 10 | 28.6% | |
| How concerned are you about climate change? | Nothing/Little | 31.7% |
| Quite/Very/Extremely | 63.8% | |
| NS/NR | 4.5% | |
| How does climate change make you feel? | Impotence | 20.5% |
| Indignation | 31.3% | |
| Fear | 23.7% | |
| Interest | 7.1% | |
| Fault | 1.3% | |
| Indifference | 10.7% | |
| NS/NR | 5.4% | |
| Thinking about the causes of climate change, which of the following sentences best describes your opinion? Climate change is caused... | Mainly by natural processes | 30.4% |
| Mainly due to human activity | 27.2% | |
| Both by natural processes and by human activity | 33.0% | |
| I'm not sure climate change really exists | 4.0% | |
| NS/NR | 5.4% | |
| To what extent do you agree with the following statements: (options totally agree + quite agree) Non-exclusive responses |
To fight climate change, it is necessary for each person to reduce their energy consumption | 58% |
| To fight climate change, we all need to give up some comforts | 58.9% | |
| Thanks to science, it will be possible to combat climate change without changing our way of life | 53.1% | |
| Institutions should spend the money on other things, instead of in the fight against climate change |
60.7% | |
| When do you think the effects of climate change will begin to be felt in the Chota Valley? | We are already feeling the effects | 85.7% |
| Between 5 and more than 50 years | 5.8% | |
| Never | 3.6% | |
| NS/NR | 4.9% | |
| What would be the degree of affectation of the effects of climate change on the following areas? Score from 1 to 10 (1 is very low; 10 is very high) (Options 6 to 10) Non-exclusive responses |
Water (effects on its availability and management) | 52.2% |
| The weather | 57.1% | |
| Natural environment (effect on flora, fauna, forest areas, etc.) | 61.6% | |
| Agricultural production (quantity) | 66.1% | |
| Agricultural production (change of crops) | 66.5% | |
| Population health | 58.9% | |
| The economic well-being of the population | 54.9% | |
| The migration | 32.1% |
Source: EVCH. Own elaboration.
Table 6.
EVCH- Actions against climate change and adaptation measures.
| Who is responsible for the fight against climate change in Ecuador |
National government | 45.1% |
| Local Governments/Business and Industry/The Community/Environmental Groups/Yourself | 14.3% | |
| All of them | 33.9% | |
| None/NS/NR | 6.7% | |
| To what extent do you consider it important to increase the amount of renewable energy used, such as hydro, solar, wind in the future |
Very important/Fairly important | 84.8% |
| Not very important | 7.1% | |
| Nothing important/NS | 8.0% | |
| Indicate your degree of agreement with the implementation in the Chota Valley of measures against climate change aimed at: (Options total agreement + quite a lot of agreement) |
Develop and implement an adaptive model in the face of climate change (saving water, garbage collection, less use of fungicides, etc.) | 83.1% |
| Prepare society for the extreme risks arising from climate change (awareness campaigns, energy efficiency, etc.) | 82.6% | |
| Integrate pilot projects of good practices, innovative and that serve as an example of adaptation to climate change in municipal or parish management (improve storage and management of water, uses of clean energy, waste management, etc.) | 83% | |
| Conserve the biodiversity of the Chota Valley and the services that nature makes available to us (air purification, pest control, renewable energy, etc.) | 82.6% | |
| Have you personally taken any action to combat climate change in the last 6 months? | Yes | 69.2% |
| No | 25.4% | |
| NS | 5.4% | |
| Which of the following actions apply to you, if any (Not exclusive answers) |
Regularly walks, rides a bike | 68.3% |
| Try to reduce your consumption of disposable items such as plastic bags, tubs, straws, whenever you can | 26.3% | |
| Try to reduce your waste and regularly separate it for recycling | 23.7% | |
| Do you think you could personally contribute more to the fight against climate change? | Yes | 65.6% |
| No | 34.4% | |
| Why don't you do it? | For comfort | 6.3% |
| Because they don’t know what to do | 27.2% | |
| Because those who have to act are companies and governments | 0.4% | |
| NS | 0.4% | |
| Thinking about the future, what would you think if the following situations happened in the Chota Valley in 15 years? (Answers not exclusive) |
That a large part of the houses had systems to generate their own energy | 80.4% |
| That a large part of the houses has water reuse systems | 84.4% | |
| That there are exclusive bicycle lanes | 81.7% | |
| That at least 50% of the energy consumed in the valley be of renewable origin | 82.1% | |
| Let families sort the trash | 86.6% |
Source: EVCH. Own elaboration.
Table 7.
EVCH- Climate variables per quarter.
| Variable | Half | Typical deviation |
| First trimester temperature (°C) | 26.13 | .30 |
| Second trimester temperature (°C) | 25.99 | .22 |
| Third trimester temperature (°C) | 25.40 | .25 |
| Fourth trimester temperature (°C) | 26.43 | .25 |
| First quarter rainfall (mm/month) | 175.98 | .25 |
| Second quarter rainfall (mm/month) | 171.09 | .47 |
| Third Quarter Precipitation (mm/month) | 110.24 | 6.04 |
| Fourth Quarter Precipitation (mm/month) | 189.73 | .97 |
Source: EVCH, Accuweather, Freemeteo. Own elaboration.
Table 8.
Results of the regression poverty and climatic variables.
| Variable | Model 1 | Model 2 | Model 3 | |||
| Coefficient | Est. t | Coefficient | Est. t | Coefficient | Est. t | |
| First trimester temperature squared | -0.00034 | -0.134 | 0.00418 | 1.026 | 0.00343 | 0.850 |
| Second quarter temperature | 51.68860 | 1.824 | 81.77212 | 1.627 | ||
| Second quarter temperature squared | -1.00478 | -1.807 | -1.58593 | -1.608 | -0.42233 | -1.159 |
| Third trimester temperature | -20.82325* | -1.994 | -30.55873 | -1.978 | ||
| Third quarter temperature squared | 0.42512* | 1.979 | 0.61855 | 1.955 | 0.02271 | 1.413 |
| Fourth quarter temperature squared | 0.01389* | 2.464 | .02418** | 2.875 | -2.02820* | -2.255 |
| First quarter precipitation squared | -0.02516 | -0.362 | -0.00452 | -0.043 | 0.00320 | 0.029 |
| Second Quarter Precipitation Squared | 0.00259 | 0.149 | 0.02338 | 0.723 | -0.90740 | -1.185 |
| Third quarter precipitation | -2.94455 | -1.814 | -6.76236** | -2.687 | ||
| Third Quarter Precipitation Squared | 0.13142 | 1.786 | 0.30525** | 2.661 | 0.12315 | 1.237 |
| Fourth Quarter Precipitation Squared | 0.03029* | 2.225 | 0.03769 | 1.959 | -4.30757* | -2.261 |
| Years of schooling | 0.09591 | 1.956 | 0.09591 | 1.956 | ||
| Experience | -0.00334 | -1.120 | -0.00334 | -1.120 | ||
| Gender1 (1=Male) | 0.04718 | 0.320 | 0.04718 | 0.320 | ||
| Ethnicity1 (1=Afro-Ecuadorian) | -0.12947 | -0.807 | -0.12947 | -0.807 | ||
| Ethnicity3 (1=Other) | -0.18041 | -0.506 | -0.18041 | -0.506 | ||
| People with high school in the home | -0.10905 | -1.786 | -0.10905 | -1.786 | ||
| Temperature*Precipitation second quarter | 1.22594 | 1.159 | ||||
| Temperature*Precipitation third quarter | -0.10909 | -1.221 | ||||
| Temperature*Precipitation fourth quarter | 5.97558* | 2.264 | ||||
| Constant | -403.44520 | -1.484 | -676.13010 | -1.342 | -26.82548 | -0.571 |
| R-squared | 0.08540 | 0.27499 | 0.27499 | |||
| Cases | 224 | |||||
| * p<0.05, ** p<0.01, *** p<0.001 Source: EVCH. Own elaboration |
||||||
Table 9.
Marginal effects of the regression poverty and climatic variables.
| Variable | Model 1 | Model 2 | Model 3 | |||
| dy/dx | z | dy/dx | z | dy/dx | z | |
| First trimester temperature squared | -0.00034 | -0.13 | 0.00418 | 1.03 | 0.00343 | 0.85 |
| Second quarter temperature | 51.68860 | 1.82 | 81.77213 | 1.63 | ||
| Second quarter temperature squared | -1.00478 | -1.81 | -1.58593 | -1.61 | -0.42233 | -1.16 |
| Third trimester temperature | -20.82325 | -1.99 | -30.55874 | -1.98 | ||
| Third quarter temperature squared | 0.42512 | 1.98 | 0.61855 | 1.96 | 0.02271 | 1.41 |
| Fourth quarter temperature squared | 0.01389 | 2.46 | 0.02418 | 2.88 | -2.02820 | -2.25 |
| First quarter precipitation squared | -0.02516 | -0.36 | -0.00452 | -0.04 | 0.00320 | 0.03 |
| Second quarter precipitation squared | 0.00259 | 0.15 | 0.02338 | 0.72 | -0.90740 | -1.18 |
| Third quarter precipitation | -2.94455 | -1.81 | -6.76236 | -2.69 | ||
| Third quarter precipitation squared | 0.13142 | 1.79 | 0.30524 | 2.66 | 0.12315 | 1.24 |
| Fourth quarter precipitation squared | 0.03029 | 2.23 | 0.03769 | 1.96 | -4.30757 | -2.26 |
| Years of schooling | 0.09591 | 1.96 | 0.09591 | 1.96 | ||
| Experience | -0.00334 | -1.12 | -0.00334 | -1.12 | ||
| Gender1 (1=Male) | 0.04718 | 0.32 | 0.04718 | 0.32 | ||
| Ethnicity1 (1=Afro-Ecuadorian) | -0.12947 | -0.81 | -0.12947 | -0.81 | ||
| Ethnicity3 (1=Other) | -0.18041 | -0.51 | -0.18041 | -0.51 | ||
| People with high school in the home | -0.10905 | -1.79 | -0.10905 | -1.79 | ||
| Temperature*Precipitation second quarter | 1.22594 | 1.16 | ||||
| Temperature*Precipitation third quarter | -0.10909 | -1.22 | ||||
| Temperature*Precipitation fourth quarter | 5.97559 | 2.26 | ||||
Source: EVCH. Own elaboration.
Table 10.
Variables of household characteristics for the PMT.
| Variable | Categories |
| Predominant material on the FLOOR | 1 Untreated Board/Plank-Cane-Soil-Other, which one |
| 2 Cement/Brick | |
| 3 Stave/Parquet/Plank/Floating floor-Ceramic/Tile/Vynil-Marble | |
| Location of the BATHROOM | 1 Outside the home but on the lot- Outside the home, lot or land |
| 2 Inside the house | |
| Main material of the CEILING | 1 Zinc/Palm/Straw/Leaf-Other, which one |
| 2 Asbestos/Tile | |
| 3 Concrete/Slab/Cement | |
| State of the FLOOR of the house | 1 Bad |
| 2 Fair | |
| 3 Good | |
| WATER supply location | 1 Outside the home but on the lot- Outside the home, lot or land |
| 2 Inside the house | |
| ROAD of access to the house | 1 Path- River/Sea -Other |
| 2 Cobbled - Ballast/Soil street | |
| Road/Street paved or cobblestone | |
| BATHROOM Type | 1 Latrine-Does not have |
| 2 Toilet / Toilet and cesspool | |
| 3 Toilet / Toilet and septic tank | |
| 4 Toilet/Toilet and sewer | |
| Main source of household WATER | 1 Delivery car/Tricycle-Well/River, spring or ditch-Other, which one |
| 2 Other source by pipeline | |
| 3 Public network- Battery/pool or public key | |
| Predominant material of the WALLS | 1 Adobe/Tapia-Wood-Bahareque-Cane or mat-Other, which one |
| 2 Block/Rustic brick- Asbestos/Cement/Fibrolit | |
| 3 Concrete/Block/Brick | |
| HOUSING type | 1 Room in a tenancy house-Mediagua-Ranch/Shack/Covacha-Other, which one |
| 2 House/Villa-Apartment |
Source: EVCH. Own elaboration.
Table 11.
Variables of people for the PMT.
| Variable | Categories |
| Number of illiterate people in the household | 1 One or more |
| 2 There are no illiterate people | |
| Years of schooling of the household head | 1 Up to 6 years |
| 2 Between 7 and 12 years | |
| 3 13 years and over | |
| 4 Under 5 years | |
| Number of people from 5 to 17 years old in the household who do not attend to school | 1 One or more |
| 2 No children 5-17/Everyone attends | |
| Number of people aged 5 to 17 employed | 1 One or more |
| 2 There are no children between the ages of 5 and 17 employed | |
| Children under 6 years old in the household | 1 Two or more |
| 2 One | |
| 3 There are no children in that age | |
| Number of people aged 65 and over in the household | 1 Two or more |
| 2 One | |
| 3 There are no older adults |
Source: EVCH. Own elaboration.
Table 12.
Statistics of the partial indexes and the PMT.
| Variable | Obs | Mean | Std. Dev. | Min | Max |
| Household Characteristics Index | 224 | 69.19 | 15.32 | 0 | 100 |
| People Index | 224 | 38.04 | 18.29 | 0 | 100 |
| PMT Index | 224 | 53.05 | 19.30 | 0 | 100 |
Source: EVCH. Own elaboration.
Table 13.
Variables of knowledge, causes and consequences on Climate Change CC.
| Know, have heard of or have experienced CC | 1 Yes |
| 0 No, don't know | |
| What do you mean by CC? | 1 Change in weather conditions |
| 0 Other | |
| What do you mean by CC? | 1 Change in planting time |
| 0 Other | |
| What do you mean by CC? | 1 Lack or excess of rain |
| 0 Other | |
| What do you mean by CC? | 1 Presence, absence of pests |
| 0 Other | |
| What do you mean by CC? | 1 Disappearance of water sources |
| 0 Other | |
| What do you mean by CC? | 1 Disappearance of species |
| 0 Other | |
| CC is a problem | 1 Very serious |
| 0 Nothing serious | |
| To what extent are you concerned about CC | 1 Concerned, very concerned about CC |
| 0 Little or not at all worried about CC | |
| When talking about CC, what feelings does it provoke? | 1 Helplessness, indignation, fear, interest, guilt |
| 0 Indifference | |
| Climate change is caused by | 1 Natural processes, human activity |
| 0 Does not exist | |
| How far is it | 1 Agree to reduce energy consumption |
| 0 I do not agree to reduce energy consumption | |
| How far is it | 1 Agree to give up comforts |
| 0 I do not agree to give up comforts | |
| How far is it | 1 Agree that science will help fight CC. |
| 0 I do not agree that science will help fight CC. | |
| To what extent do you think | 1 Institutions must spend in the fight against CC |
| 0 Institutions should NOT spend in the fight against CC | |
| When do you think the effects of CC will begin to be felt? | 1 Short-term effects |
| 0 Long-term effects or never | |
| What is the degree of affectation on the water | 1 High impact of CC on water |
| 0 Low affectation of the CC on the water | |
| What is the degree of impact on the weather | 1 High impact of CC on weather |
| 0 Low impact of the CC on the weather | |
| What is the degree of impact on the natural environment | 1 High impact of the CC on the natural environment |
| 0 Low impact of the CC on the natural environment | |
| What is the degree of affectation on agricultural production (quantity) | 1 High impact of CC on the amount of agricultural production |
| 0 Low impact of CC on the amount of agricultural production | |
| What is the degree of affectation on agricultural production (change of crops) | 1 High impact on CC that drives crop change |
| 0 Low impact on CC that drives crop change | |
| What is the degree of affectation on the health of the population | 1 High impact of CC on health |
| 0 Low effect of CC on health | |
| What is the degree of impact on the economy | 1 High impact of CC on the economy |
| 0 Low impact of the CC on the economy | |
| What is the degree of affectation on migration | 1 High impact of CC on migration |
| 0 Low impact of CC on migration | |
| Who should fight CC | 1 Who must fight against CC is the government, the company |
| 2 Those who must fight against CC are the people | |
| 3 Everyone Must Fight against CC | |
| Considers it important to increase the amount of renewable energy | 1 Important to increase renewable energy |
| 0 Little or not at all important to increase renewable energy |
Source: EVCH. Own elaboration.
Table 14.
Cramer's V Coefficient Matrix - CC Knowledge.
| PMT | C1 | C2 | C3 | C4 | |
| PMT | 1 | ||||
| C1 | 0.1318 | 1 | |||
| C2 | 0.157 | 0.3767 | 1 | ||
| C3 | 0.1755 | 0.1686 | 0.406 | 1 | |
| C4 | -0.1272 | 0.3501 | 0.1587 | -0.1134 | 1 |
Source: EVCH. Own elaboration.
Table 15.
Regression results.
| Logistic regression | Number of obs | = | 224 | |||
| LR chi 2 (3) | = | 13.06 | ||||
| prob > chi2 | = | 0.0045 | ||||
| Loglikelihood = -58.412319 | Pseudo -R2 | = | 0.1006 | |||
| Change in planting season | Coef. | Std. Err. | z | P>z | [95% Setting Interval] | |
| PMT Index | 0.044680 | 0.016209 | 2.76 | 0.006 | 0.01291 | 0.07645 |
| Scholarship | 0.117339 | 0.057898 | 2.03 | 0.043 | 0.00386 | 0.23082 |
| People with high school | 0.573630 | 0.261232 | 2.2 | 0.028 | 0.06162 | 1.08564 |
| Constant | -3.191815 | 1.122963 | -2.84 | 0.004 | -5.39278 | -0.99085 |
Source: EVCH. Own elaboration.
Table 16.
Marginal Effects.
| Marginal effects after logit | |||||||
| y = | Pr(knowledge about climate change) (Predict) | ||||||
| 0.62386 | |||||||
| Variable | dy/dx | Std. Err. | z | P>z | [95% Setting Interval] | X | |
| PMT Index | 0.01048 | 0.00378 | 2.77 | 0.006 | 0.00307 | 0.01790 | 38.75810 |
| Scholarship | 0.02753 | 0.01353 | 2.04 | 0.042 | 0.00102 | 0.05405 | 7.38144 |
| People with high school | 0.13461 | 0.06082 | 2.21 | 0.027 | 0.01541 | 0.25381 | 1.91753 |
Source: EVCH. Own elaboration.
Table 17.
Variables of actions against CC to evaluate the relationship with poverty.
| Actions against climate change | |
| Start up in the Chota Valley an adaptive model against CC | 1 Adaptive Model Agreement versus CC |
| 0 No agreement on adaptive model versus CC | |
| Prepare society for the risks derived from CC | 1 Agreement to prepare society for CC risks |
| 0 I do not agree to prepare society for CC risks | |
| Integrate pilot projects of good adaptation practices against CC | 1 Agreement to integrate pilot projects of good practices against CC |
| 0 I do not agree to integrate pilot projects of good practices against CC | |
| Conserve the biodiversity of Chota Valley | 1 Agreement to conserve biodiversity of Chota Valley |
| 0 No agreement to conserve biodiversity of Chota Valley | |
| Has personally taken any measure or action against the CC | 1 If you have personally taken action against CC |
| 0 Has not personally taken action against CC | |
| What actions | 1 Regularly walks, rides a bike |
| 0 Other actions against the CC | |
| They believe that they could contribute to a greater extent in the fight against CC | 1 If you can contribute more against the CC |
| 0 Cannot contribute further against CC | |
| Why don't you do it | 1 No because they don’t know what to do |
| 0 For other reasons | |
| What do you think that future homes have systems to generate their own energy? | 1 Very good or good |
| 0 Bad, very bad NS NR | |
| What do you think about future homes having water reuse systems? | 1 Very good or good |
| 0 Bad, very bad NS NR | |
| What do you think that in the future there will be exclusive bicycle lanes? | 1 Very good or good |
| 0 Bad, very bad NS NR | |
| What do you think that in the future at least 50% of the energy consumed in the Chota Valley is renewable? | 1 Very good or good |
| 0 Bad, very bad NS NR | |
| What do you think about families sorting garbage in the future? | 1 Very good or good |
| 0 Bad, very bad NS NR | |
Source: EVCH. Own elaboration.
Table 18.
Cramer's V coefficient matrix - Actions against CC.
| PMT | A1 | A2 | |
| PMT | 1 | ||
| A1 | 0.1352 | 1 | |
| A2 | 0.1415 | 0.3393 | 1 |
Source: EVCH. Own elaboration.
Table 19.
Regression results.
| Logistic regression | Number of obs | = | 224 | |||
| LR chi 2 (3) | = | 3.97 | ||||
| prob > chi2 | = | 0.0463 | ||||
| Loglikelihood = -60.654332 | Pseudo -R2 | = | 0.0317 | |||
| Implement an adaptive model in the face of climate change | Coef. | Std. Err. | z | P>z | [95% Setting Interval] | |
| PMT Index | -0.02482 | 0.01244 | -2.00 | 0.046 | -0.0492 | -0.0004 |
| Constant | 3.70035 | 0.72512 | 5.10 | 0.000 | 2.2791 | 5.1216 |
Source: EVCH. Own elaboration.
Table 20.
Marginal Effects.
| Marginal effects after logit | |||||||
| y = | Pr(actions against climate change) (Predict) | ||||||
| 0.92654 | |||||||
| variable | dy/dx | Std. Err. | z | P>z | [95% Setting Interval] | X | |
| PMT Index | -0.00169 | 0.00079 | -2.13 | 0.033 | -0.00324 | -0.00014 | 46.95490 |
Source: EVCH. Own elaboration.
Disclaimer/Publisher’s Note: The statements, opinions and data contained in all publications are solely those of the individual author(s) and contributor(s) and not of MDPI and/or the editor(s). MDPI and/or the editor(s) disclaim responsibility for any injury to people or property resulting from any ideas, methods, instructions or products referred to in the content. |
© 2025 by the authors. Licensee MDPI, Basel, Switzerland. This article is an open access article distributed under the terms and conditions of the Creative Commons Attribution (CC BY) license (http://creativecommons.org/licenses/by/4.0/).
Copyright: This open access article is published under a Creative Commons CC BY 4.0 license, which permit the free download, distribution, and reuse, provided that the author and preprint are cited in any reuse.


