
Submitted:
29 June 2025
Posted:
30 June 2025
You are already at the latest version
Abstract
The PV solar energy development has already emerged as both framework and keystone to sustainable development in 21st century which is being offered as a boon for a clean pathway of renewable sustainable source amid mounting climate change concerns. With rapid advancement in solar panel efficiency and declining product cost and its widespread adoption in developing nations, its pivotal role in shaping the global economy with transition to low carbon economy changed drastically. However, with the present scenario of rapid climate change and rising global energy demand concerns are being raised regarding the efficiency of solar panels and susceptibility to major factors of environment including dust accumulation, humidity, temperature fluctuation and reduced light intensity. In view of the prevailing condition and present circumstance with alignment to global current trend the following research paper presents and exhibits a novel solution of real time intelligent automated system of PV panel health monitoring and automated cleaning utilizing multimodal data fusion algorithms with embedded IOT control architecture. The proposed solution exhibits panel dirt detection and cleaning system as smart solution towards panel efficiency optimal maintenance through automated monitoring. The following system sites and classifies panel cleanliness in 2 categories namely clean and dirty using lightweight (YOLOv5) model with a webcam feed as aid for capturing and feeding visual input. As complementary to this scenario sensor data with embedded Arduino architecture is being captured with increased reliability and both former and latter data is being fused via Large Language model (LLM) to improve prediction. By this current approach of fusing visual data with sensor input, the system accurately determines when a panel is dirty or not. Upon detection, it alerts the user and can automatically trigger a cleaning mechanism via a relay module. By minimizing manual inspection and mitigating energy loss concerns this method of approach enhances its contribution towards more sustainable solar power systems though timely and intelligent data driven maintenance strategy ultimately promoting sustainable integration at global energy landscape.
Keywords:
YOLO
; IoT
; Sensor Fusion
; Solar Panel
; Arduino
; Raspberry Pi
; Object Detection
; PV Cleaning System
I. Introduction
In view of global context understanding solar panel, their importance and challenges plays a vital role in researchers point of view. Solar panels also known as photovoltaic modules (PV) are devices that convert sunlight directly into electricity using photovoltaic effect [1].Their prime composition involves silicon which is a semiconductor that absorbs solar radiation and release electrons which results in DC generation. This clean and silent conversion process requires no fuel and emits no greenhouse gases during operation, making solar energy one of the most promising renewable energy sources in the global effort to mitigate climate change and reduce reliance on fossil fuels [2].With current trend as global energy demand continues to peak and grow driven by urbanization, industrial expansion and population growth solar energy has emerged as a sustainable and scalable alternative to conventional energy sources. Its decentralized nature allows for implementation in remote areas, agricultural fields, rooftops, and solar farms, thus empowering both off grid and urban communities to a great extent [3,4].
However, despite its widespread potential and adoption this source of energy also pave way for new persistent challenges with overlooked series of critical issues involving soiling, dust accumulation, dirt, bird dropping and other airborne particles on surface of solar panels [5].This results in a significant sunlight amount reduction from reaching the panels thereby decreasing power output by up to 30% in high-dust regions. In order to counter this problem in arid and industrial zones there has been wide adoption of manual cleaning method in the 20th and 21st centuries. Manual cleaning methods which often involve labour, water usage, and downtime are inefficient and impractical for large or remote installations. [6]. Existing monitoring systems mostly rely on environmental sensors such as temperature or irradiance, but they lack visual context or automated cleaning mechanisms. This gap between efficiency generation and maintenance limitation creates chance for a compelling need for new approach that combines visual intelligence, environmental awareness and autonomous control. To address this limitation and shift in current trend of solar technology this research paper presents a powered integration of multimodal fusion through integration of some part of AI, internet of things. These modern technologies enable real-time monitoring, automated diagnostics, and autonomous actuation without human intervention [7].
The modern IoT foundation layer already finds its position in standalone system enabling its seamless connectivity between widely used multiple physical sensors [8] and control unit for wide data collection and real time processing and monitoring with latency reduction and cloud data transmission. In modern days real time monitoring IoT systems are being developed to diagnose dust and string faults within panel. These smart system includes series of current, voltage connected to NodeMCU, Arduino with ESP8266 followed by TCP/IP stack connection with cloud data transmission across blynk and Ubidots IoT platform for visualization to draw conclusion of solar functioning [9].However IoT present certain drawback in isolation and lack visual feedback which means Iot system generate false negatives, where a panel appears functional from sensor data but is in fact partially obstructed. Thus, YOLO object detection model becomes a powerful supplement to the IoT framework in this scenario as an aid to visually distinguish different surface level conditions where sensors fail. Pretrained on large-scale datasets like COCO or custom solar datasets, YOLO can accurately identify dust coverage, cracks, hot spots, or other physical anomalies through direct image analysis This provides a high-resolution contextual understanding that complements numerical sensor readings [10]. These models are typically trained on large, generic datasets which do not include domain-specific features such as subtle dust patterns, partial soiling, or weather-induced surface changes on photovoltaic panels. As a result, their accuracy in detecting fine-grained dust coverage is limited, and retraining or fine-tuning them requires substantial computational resources and high memory GPUs, which increases the system's complexity and cost. Thus, under this scenario raspberry integration with YOLO blank model can be achieved with setup ensurance with lightweight and edge compatibility [11] thus hosting a smart cleaning automated system with autonomous activation of the cleaning pump via Arduino and relay control through raspberry with real time YOLO algorithm [12,13].
Enlightening the above scenario this research paper develops a proposed model with insight to a hybrid framework that begins with real-time environmental and performance monitoring using IoT components. Multiple physical sensors including humidity, light, both current-voltage sensors are being used as an aid with microcontroller for data acquisition and local processing. These sensor values are continuously monitored to detect any drop in environmental or electrical performance that may indicate panel inefficiency. Achieving this real time health monitoring is not enough as an additional layer of automated cleaning action is deployed where a camera module, connected to a Raspberry Pi 4, captures real-time images of the solar panel surface. These images are analysed using a YOLOv5 blank model optimized for capturing real time panel images unique to the deployment environment.
The raspberry pi functioning as the central hub fuses the visual insights from YOLO with the environmental sensor data received from the Arduino through serial communication. A lightweight Large Language Model (LLM) deployed on the raspberry Pi interprets this combined data based on wide range of environmental thresholds condition according to sensor data and decides the output of relay whether the cleaning action needs to be executed or not. Upon confirmation, the Pi sends an activation signal back to the Arduino, which in turn triggers a relay module to power a submersible water pump, initiating the cleaning process. This closed-loop system ensures that cleaning occurs only when needed, based on both visual and sensor-based evidence, thus conserving energy and water. By transitioning seamlessly from IoT sensing to AI-driven decision-making and physical actuation, the model delivers a scalable, cost-effective, and autonomous solar panel maintenance solution suitable for both urban and remote installations.
Drawn towards the conclusion the main contribution cited in this research work involves the following as orderly listed below
- The work designs and implements a cost effective embedded solar panel health monitoring and cleaning system using open-source hardware and software tools used in every IoT projects including microcontroller Arduino, Raspberry with sensor kit for measuring real time factors like humidity, light intensity, temp, voltage, current and power efficiency. [14]
- The project develops an open integration of computer vision (YOLO) with the Iot framework sensor data for panel surface condition and performance degradation diagnosis. The system employs a custom-trained blank YOLOv5 model for real-time image analysis, allowing the detection of surface-level dust or obstructions on the panel. This visual data is fused with environmental sensor data) to provide a comprehensive understanding of the panel’s operational condition. This fusion enables context-aware decision-making, reducing false positives that might arise from sensor only monitoring
- The work executes automated cleaning process using relay-based control of submersible pump with sprinkler triggered by real time sensor thresholds. Upon detecting both dust accumulation (via camera and YOLO) and supporting evidence of performance drop from sensor readings, the system automatically activates a relay module, which controls pump. his automation replaces the need for manual intervention, making the cleaning process intelligent, resource-efficient, and timely—only activating, when necessary, based on real-time data. [15]
- To capture and analyse operational and environmental data for long-term performance monitoring, visualization, and predictive maintenance using tools like Jupyter Notebook and R Studio web application. Real time data collected including is logged and stored in structured formats (CSV or Excel). This data is then used for graphical visualization, trend analysis, and regression modelling using platforms like Jupyter Notebook, R Studio, and Excel dashboards.
II. Literature Review
The use of IoT based sensor systems has become a foundational approach in solar panel performance tracking. As by now the integration of both intelligence and automation in solar energy systems has already become vital as global dependence on renewable sources accelerates. Researchers have looked into a number of solutions for photovoltaic (PV) panel monitoring, diagnosis, and maintenance in order to guarantee sustainability and peak performance. These initiatives cover a wide range of topics, including relay-driven control mechanisms, machine learning for fault classification, IoT-based remote monitoring, and environmental sensor fusion. Thus, the aforementioned publications that are pertinent to these domains are critically examined in this literature review, with an emphasis on the methods used, their advantages, and disadvantages. Studies involving embedded systems, vision-based diagnostics (like YOLO), and real-time cleaning mechanisms are given special attention because these are the cornerstones of the suggested smart solar panel maintenance system.
IoT based sensor with embedded systems plays a major role in its transition to fully IoT technology. Researchers in [16] designed a wireless real time solar health monitoring system with 6 PV panels with connected SMA electrical inverters for DC-AC conversion with equipped measurement, processing systems and data retrieval via Bluetooth and data storage in Raspberry PI3 module. This results in a high scalable, low power consumption system using IOT with access to open-source application. Similar work has been cited in [17]with a developed IoT system of Node-MCU microcontroller having ESP8266 Wi-Fi module with real time monitoring sensors for voltage and current in cloud platform.This tech enabled instantaneous data retrieval from control centre for real time environment parameter tracking via GUI.The author [18] developed a reliable solar PV system using LABVIEW software which uses a CC3200 microcontroller along with connected pyranometer and sensors were the proposed work facilitated a DAQ(data acquisition unit) unit for sensor data storage and cloud platform Blynk for data visualization.Similarly [19] implemented a comprehensive IoT-based healthcare monitoring system built on a Wireless Body Area Network (WBAN).This enabled a wearable solar panel which captures sunlight with power stored in supercapacitor followed by ATmega328 microcontroller achieving a connection of different wearable sensor nodes which are low powered for body wear with Zig bee transmission as low-power wireless communication for data transmission alerting medical emergencies and displaying real-time health information.
It is noticed that Raspberry Pi plays a pivotal role in the transition to IoT-based systems by acting as the bridge between physical sensing and cloud/network-based intelligence. Researchers in [20] developed a remote monitoring system on standalone PV system using Raspberry pi.The system integrates sensors data collection to Raspberry through MCP3008 chip for ADC data conversion.These parameters are displayed through GUI provided by Node.js cloud platform furthermore developing system flexibility and scalability in remote analyzation.Similar work has been cited in [21] where researcher demonstrates a robust IoT-based solar panel monitoring framework using analog sensors, ADC, and web-based data visualization via Raspberry Pi.The tech leverages raspberry controller with embedded RTC DS3231 clock module for accurate timekeeping without internet, MCP3008 ADC to digitize analog signals followed by sensor installation for real time data collection which is being logged every 10 seconds and stored in CSV files, which are then displayed on a real-time, PHP-based web interface hosted on an Apache server installed on the Raspberry Pi. This setup enables users to remotely analyse the performance of each panel, track environmental influence and observe real-time voltage and current changes. The author [22] developed a panel health monitoring system to calculate power efficiency of panel in different optimal tilt angle in different seasons of year. The tech was achieved through microcontroller for ADC with raspberry where communication between former-latter was achieved through UART protocol. MYSQL relational database accompanied by python interpreter on Debian Linux database was used in recording and reading real time data enabling real time informing to administrator in case of system failure maintaining data consistency.
Researcher in [23] showed conceptual development of IoT based PV monitoring with raspberry pi zero wireless with 4 K-type thermocouple sensors with MAX31855 thermocouple amplifiers with Adafruit ina219 volt-current sensor for monitoring real time temperature distribution and electrical output of panel.The panel temp collected by thermocouple sensor is amplified by MAX31855 which is then fed onto raspberry as central controller along with the current data reading with respect to I2C protocol.The data stored in raspberry SD card are then recorded to google cloud for real time visualization making this monitoring system non-invasive,costeffective in detecting early signs of panel damage, dust accumulation. Unlike simpler microcontrollers, the Raspberry Pi can process data locally using Python or C/C++ scripts, or even run lightweight machine learning models enabling noise filtering and preliminary decision making. The author [24] enables a system model for enhancing the prediction of future solar power prediction using Iot and hidden Markov ML model. The system combines IOT based monitoring with raspberry as central controller followed by sensor and panel. The system uses a Hidden Markov Model (HMM), a statistical model that works well with time-series data which learns from historical solar power data on observed stats including cloudy and sunny day with their probabilities over time to predict future energy output. The system enhances prediction on future power usage enabling a smart weather station for solar panels.
Although Internet of Things (IoT)-based systems are quite good at gathering electrical and environmental data from solar installations, they are limited in their ability to visually assess physical conditions, such as dust, stains, bird droppings, or partial shading on the panel surface.Thus YOLO(you only look once) plays its role in training and classifying clean and dusty images of solar panel.The author [25] presents a multistage computer vision pipeline to detect dust and bird droppings on solar photovoltaic (PV) panels using drone-captured images. The approach Detect and localize soiling (dust, bird droppings) only within solar panel regions, avoiding false positives from similar rooftop structures using canny edge detection with its features of smoothing(gaussian filter),gradient calculation(sobel),Non max suppression to isolate rectangular panel shapes followed by soiling detection(SDS-YOLO) and data augmentation using lightweight YOLOv5s with CSPDarknet53 for feature extraction combining FPN and PANet for multi-scale feature fusion. This multistage pipeline effectively reduces background interference, improves detection accuracy, and supports targeted cleaning, making it a scalable solution for UAV-assisted solar panel maintenance. Similar work is being cited in [26] where study presents deep learning-based approach for solar panel defect detection using the YOLO detection model including YOLOv5, YOLOv8, and YOLOv11.The dataset comes from Roboflow Universe with 6493 annotated images of solar panels labelled in four defect categories which are split into training (70%), validation (20%), and testing (10%) sets with diverse YOLOv5,v8,v11 used with balance between accuracy and speed, uses CSPDarknet53 and feature pyramid networks. The training setup involved High-performance workstation with RTX 3060 GPU with pre trained weights and hyperparameters along with evaluation metrices drawing towards the outcome in comparative analysis of the three YOLO versions showed how well each model detects different defect types in terms of accuracy and speed. The research work [27] includes hot spot detection of solar PV panel using its thermal images using real time YOLOv10 object detection model. Thermal images were captured using drones in different day times of PV farms of Kelantan, Malaysia with a total of 888images and 390 annotated hotspot images with bounding boxes. The labelled images were used to train YOLOv10 to recognize hotspots with image resizing, normalization, tuning settings including batch size and learning rate followed by the model testing with corresponding metrices including precision, recall, and mAP for precision classification. This final model instantly detects hotspots in thermal images, making it useful for real-time solar panel monitoring with immediate fault response and reduction in manual inspection.
In recent years, combining automated cleaning systems with Internet of Things (IoT) technology has become a transformative approach. Very few research has converted image-based and environmental data into real-time cleaning actions.
The author [28] in his work designed and implemented solar panel cleaning mechanism with IoT integration and sensing hardwares. The setup included a mix of physical sensors connected to ESP32 microcontroller written in C/C+ using Arduino IDE with built-in Wi-Fi to send data to the cloud for storage and analysis. The setup involves Two LDRs placed at different angles detect sunlight intensity. The difference in light intensity between the LDRs is used to rotate the solar panel towards the brighter direction using a stepper motor which in time triggers water pump and nozzles via relay to spray water on panel. Similar work is cited in [29] which presents both solar tracking and cleaning system for PV panels using Arduino UNO and ESP8266 (NodeMCU) with sensor integration. The system components include a solar single-axis tracking system with 2 LDR connected to Arduino through voltage divider method which compares the 2 LDR voltages to control 30RPM gear motor through motor driver module for panel rotation in direction of maximum light capture. The simultaneous cleaning system includes the dust sensor (GP2Y1010AU0F) that detects dust particle concentration in the air near the panel with a set threshold limit which in turns triggers windscreen wiper mechanism controlled by relay via arduino which is then connected to NodeMCU (ESP8266) for sending real time voltage and dust level data to mobile device using telegram. Similar system is being designed in Proteus software [30] as solar cleaning system with servo motor, RTC and sensor integration. The system presented batch testing method for sensor accuracy followed by dust detection sensor that triggers relay to activate pump with simultaneous RTC interface with servo motor for moving the wiper across panel surface for every 2 hours. The research work [31] designs a panel cleaning system at daily scheduled time using a combination of brush and water-spray mechanisms which operates at real-time clock information received through a GSM module, allowing the cleaning process to be initiated automatically without manual intervention. The system core controller ATmega16A microcontroller is connected to GSM for providing real time signal for scheduled cleaning which activates the relay circuit which includes the submersible pump for water spraying with simultaneous brush motor for rotating brushes while the linear actuators (driven by two motors) move the entire cleaning unit across the panel. This is followed by limit switches for determining the panel edges and brush movement to these edges thus triggering a reverse system direction movement thus ensuring daily automated cleaning with future scalability and remote monitoring potential.
IoT-enabled robotic systems are revolutionizing solar panel upkeep by delivering precision cleaning with minimal human intervention. It is observable fact that the fusion of IoT technology with robotic cleaning systems has ushered in a new era of smart, efficient, and autonomous maintenance for solar panels. In research work [32] the author developed and designed cleaning robot for industrial solar panels (CRISP) at BHEL R&D, Hyderabad, with both mechanical and electrical automation features integrated into a smart wireless network system using IoT technologies. It sits motionless in its parking station during the day, while a specialized solar panel charges its batteries. The robot moves horizontally across the panel borders and raises and lowers the trolley with revolving microfiber brushes to remove dust at night when the PLC or NodeMCU controller initiates the cleaning cycle. Robot movement is guided and accurate cleaning is ensured by sensors such as limit switches, proximity detectors, infrared sensors, and encoders. The robot uses the NodeMCU (ESP8266) for IoT integration to provide sensor data, such as temperature and humidity from the DHT11, to a web or mobile HMI via Wi-Fi. Through the use of access point and station modes, the NodeMCUs create a wireless network that enables users to submit orders, monitor and manage several robots remotely, and gather performance data in real time. Research work had been also implemented with development of dual-unit automated solar panel cleaning system [33] with a robotic unit and an autonomous unit—communicating through the UBIDOTS IoT platform.The robotic unit(slave unit) responsible for physical cleaning of the panel surface and moves along rails using motorized wheels with rotational brush driven by a motor to remove dust, with limit switches installed at both ends of the panel array to detect boundary limits. The former unit responds to the autonomous latter and cloud which in turn is enhanced and equipped with dust, light, current sensor connected to particle photon microcontroller for deriving real time slope and drawing its relationship to reference slope to initiate the corresponding cleaning command. The regression model was developed through outdoor experiments comparing clean and dusty panels under varying sunlight conditions. Data collected was processed and analysed using linear regression, resulting in different equations of best fit for clean and dusty panels. Similar autonomous panel cleaning robot [34] operates through the coordinated actions of hardware components managed by an Arduino Uno microcontroller. This model complete setup involves an ultrasonic sensor which measures the robot movement fitted with 2-wheel-drive (2WD) chassis powered by DC motors within the threshold forward and backward movement within 5cm and time delay set of arduino of 1000ms which concurrently trigger cleaning mechanism output with both static brushes mounted at the front and back of the robot and water pump pumping water to the brushes at appropriate intervals and pressure to aid in dust removal of panel surface. The robot’s movement ensures that dust is wiped off while water softens and removes stubborn particles. Thus, the system successfully detects boundaries through ultrasonic sensing and triggers cleaning mechanism concurrently ensuring extended path-planning logic for larger solar farms.

Table 1.
Overview of IoT methods merits gaps and platform.
| Ref | Field Used | Proposed Method | Merits | Research Gap | Platform | |
| [16] | IoT, Embedded Systems | Wireless monitoring using SMA inverter, Raspberry Pi3, Bluetooth for data retrieval and storage. | Scalable, low power, open-source system. | Lacks advanced environmental sensing. | Raspberry Pi3, Bluetooth | |
| [17] | IoT, Cloud Monitoring | NodeMCU with ESP8266 Wi-Fi and sensors for real-time voltage and current monitoring. | Enables real-time cloud-based GUI monitoring. | No visual or predictive fault diagnosis. | ESP8266, Cloud | |
| [18] | DAQ, Cloud Monitoring | CC3200 with LABVIEW and pyranometer for sensor data acquisition and cloud visualization. | Reliable DAQ system with visualization. | Not scalable or intelligent. | CC3200, Blynk | |
| [19] | Wearable IoT, Healthcare | ATmega328-based wearable sensors with solar-powered WBAN and Zigbee communication. | Enables low-power health monitoring via PV. | Not focused on panel diagnostics. | Zigbee | |
| [20] | Remote Monitoring | Raspberry Pi with MCP3008 ADC for sensor input and Node.js-based GUI. | Flexible remote analysis of solar metrics. | No ML or predictive insights. | Raspberry Pi, Node.js | |
| [21] | Web Visualization | Raspberry Pi using analog sensors and RTC module with web dashboard for real-time monitoring. | Web-based, real-time performance visualization. | Limited to logging and basic analytics. | PHP, Raspberry Pi | |
| [22] | Data Analytics | Microcontroller and Raspberry Pi with MYSQL and Python for tilt-based efficiency tracking. | Real-time alerts and seasonal optimization. | No integration with advanced ML. | Python, MYSQL, Debian | |
| [23] | Thermal Sensing, Cloud | Raspberry Pi Zero with thermocouples and INA219 for temperature and current sensing. | Non-invasive, cost-effective damage detection. | Focused only on thermal indicators. | Google Cloud, Python | |
| [24] | ML Prediction | Hidden Markov Model with historical solar data and Raspberry Pi for forecasting output. | Predicts future energy generation trends. | Limited real-time adaptability. | HMM, Raspberry Pi | |
| [25] | Computer Vision | YOLOv5s with edge detection and UAV images to identify dust and bird droppings. | Accurate soiling detection, scalable pipeline. | Relies heavily on drone imaging. | YOLOv5s, CSPDarknet53 | |
| [26] | Defect Detection | YOLOv5, YOLOv8, YOLOv11 trained on defect-labelled datasets to detect panel issues. | Comparative model accuracy for defect types. | High computational resource demand. | Roboflow, YOLO | |
| [27] | Thermal Imaging | YOLOv10 trained on thermal images for hotspot detection using UAV photography. | Real-time detection of thermal anomalies. | Requires thermal imaging hardware. | YOLOv10 | |
| [28] | IoT Cleaning | ESP32 with LDRs, stepper motor, and water pump to track sunlight and clean panels. | Integrates tracking and automated cleaning. | Basic decision logic; no fault prediction. | ESP32, Arduino IDE | |
| [29] | IoT Cleaning and Tracking | Arduino with LDRs and dust sensor triggering cleaning via relay and mobile updates. | Simultaneous tracking and dust-based cleaning. | Simple threshold-based logic. | ESP8266, Telegram | |
| [30] | Simulated IoT Cleaning | Simulated design using servo, RTC, and dust detection in Proteus environment. | Demonstrates scheduled cleaning automation. | Limited to simulation; no physical prototype. | Proteus | |
| [31] | GSM-Controlled Cleaning | ATmega16A with GSM-triggered brush and water spray based on real-time scheduling. | Fully automated daily cleaning operation. | Depends on GSM network reliability. | ATmega16A, GSM | |
| [32] | Robotic Cleaning | Cleaning robot with NodeMCU and sensors for autonomous panel maintenance. | Efficient automated cleaning at scheduled times. | Only operates during nighttime. | NodeMCU, Web HMI | |
| [33] | Dual Cleaning Units | IoT-enabled regression-based control with one robot cleaning unit and one autonomous unit. | Smart slope-based cleaning command system. | Requires large dataset calibration. | UBIDOTS, Particle Photon | |
| [34] | Autonomous Robot | Arduino robot with ultrasonic sensor, brushes, and water pump for panel cleaning. | Real-time cleaning with simple path logic. | Limited scalability and intelligence. | Arduino Uno | |
| [35] | Smart Irrigation | NodeMCU-based smart irrigation system using solar energy and environmental data. | Promotes solar-powered precision irrigation. | Not specifically designed for PV panels. | NodeMCU, Blynk |
The author [35] enabled the design and implementation of IoT–Smart Irrigation System with Solar-Powered Water Pump (IoT–SIS–SPWP) in NX10 Siemens software for automating irrigation by utilizing solar energy and real-time environmental data in Malaysia. The setup includes solar charge controller that uses two 50W solar panels to charge a 12V, 7.5Ah Panasonic lead-acid battery and power a high-pressure diaphragm water pump. Even when watering at night, this configuration guarantees uninterrupted operation. A NodeMCU ESP8266 microprocessor is linked to environmental sensors, such as a soil moisture sensor and a DHT11 temperature-humidity sensor. The microcontroller gathers and sends sensor data over Wi-Fi to the Blynk IoT cloud platform thus initiating the allowance for farmers to remotely monitor soil and weather conditions and control the pump using the Blynk mobile app. When moisture levels drop below a defined threshold, the user can activate the pump through the app, which triggers a 4-channel relay module connected to the NodeMCU. Water is then delivered through a hose with multi-nozzle spray heads, and a built-in hollow fiber membrane filter ensures clean water supply thus making the current setup suitable for off-grid agricultural areas, reducing operational costs and promoting sustainable farming.
III. METHODOLOGY
- A.
- Proposed System
Figure 1.
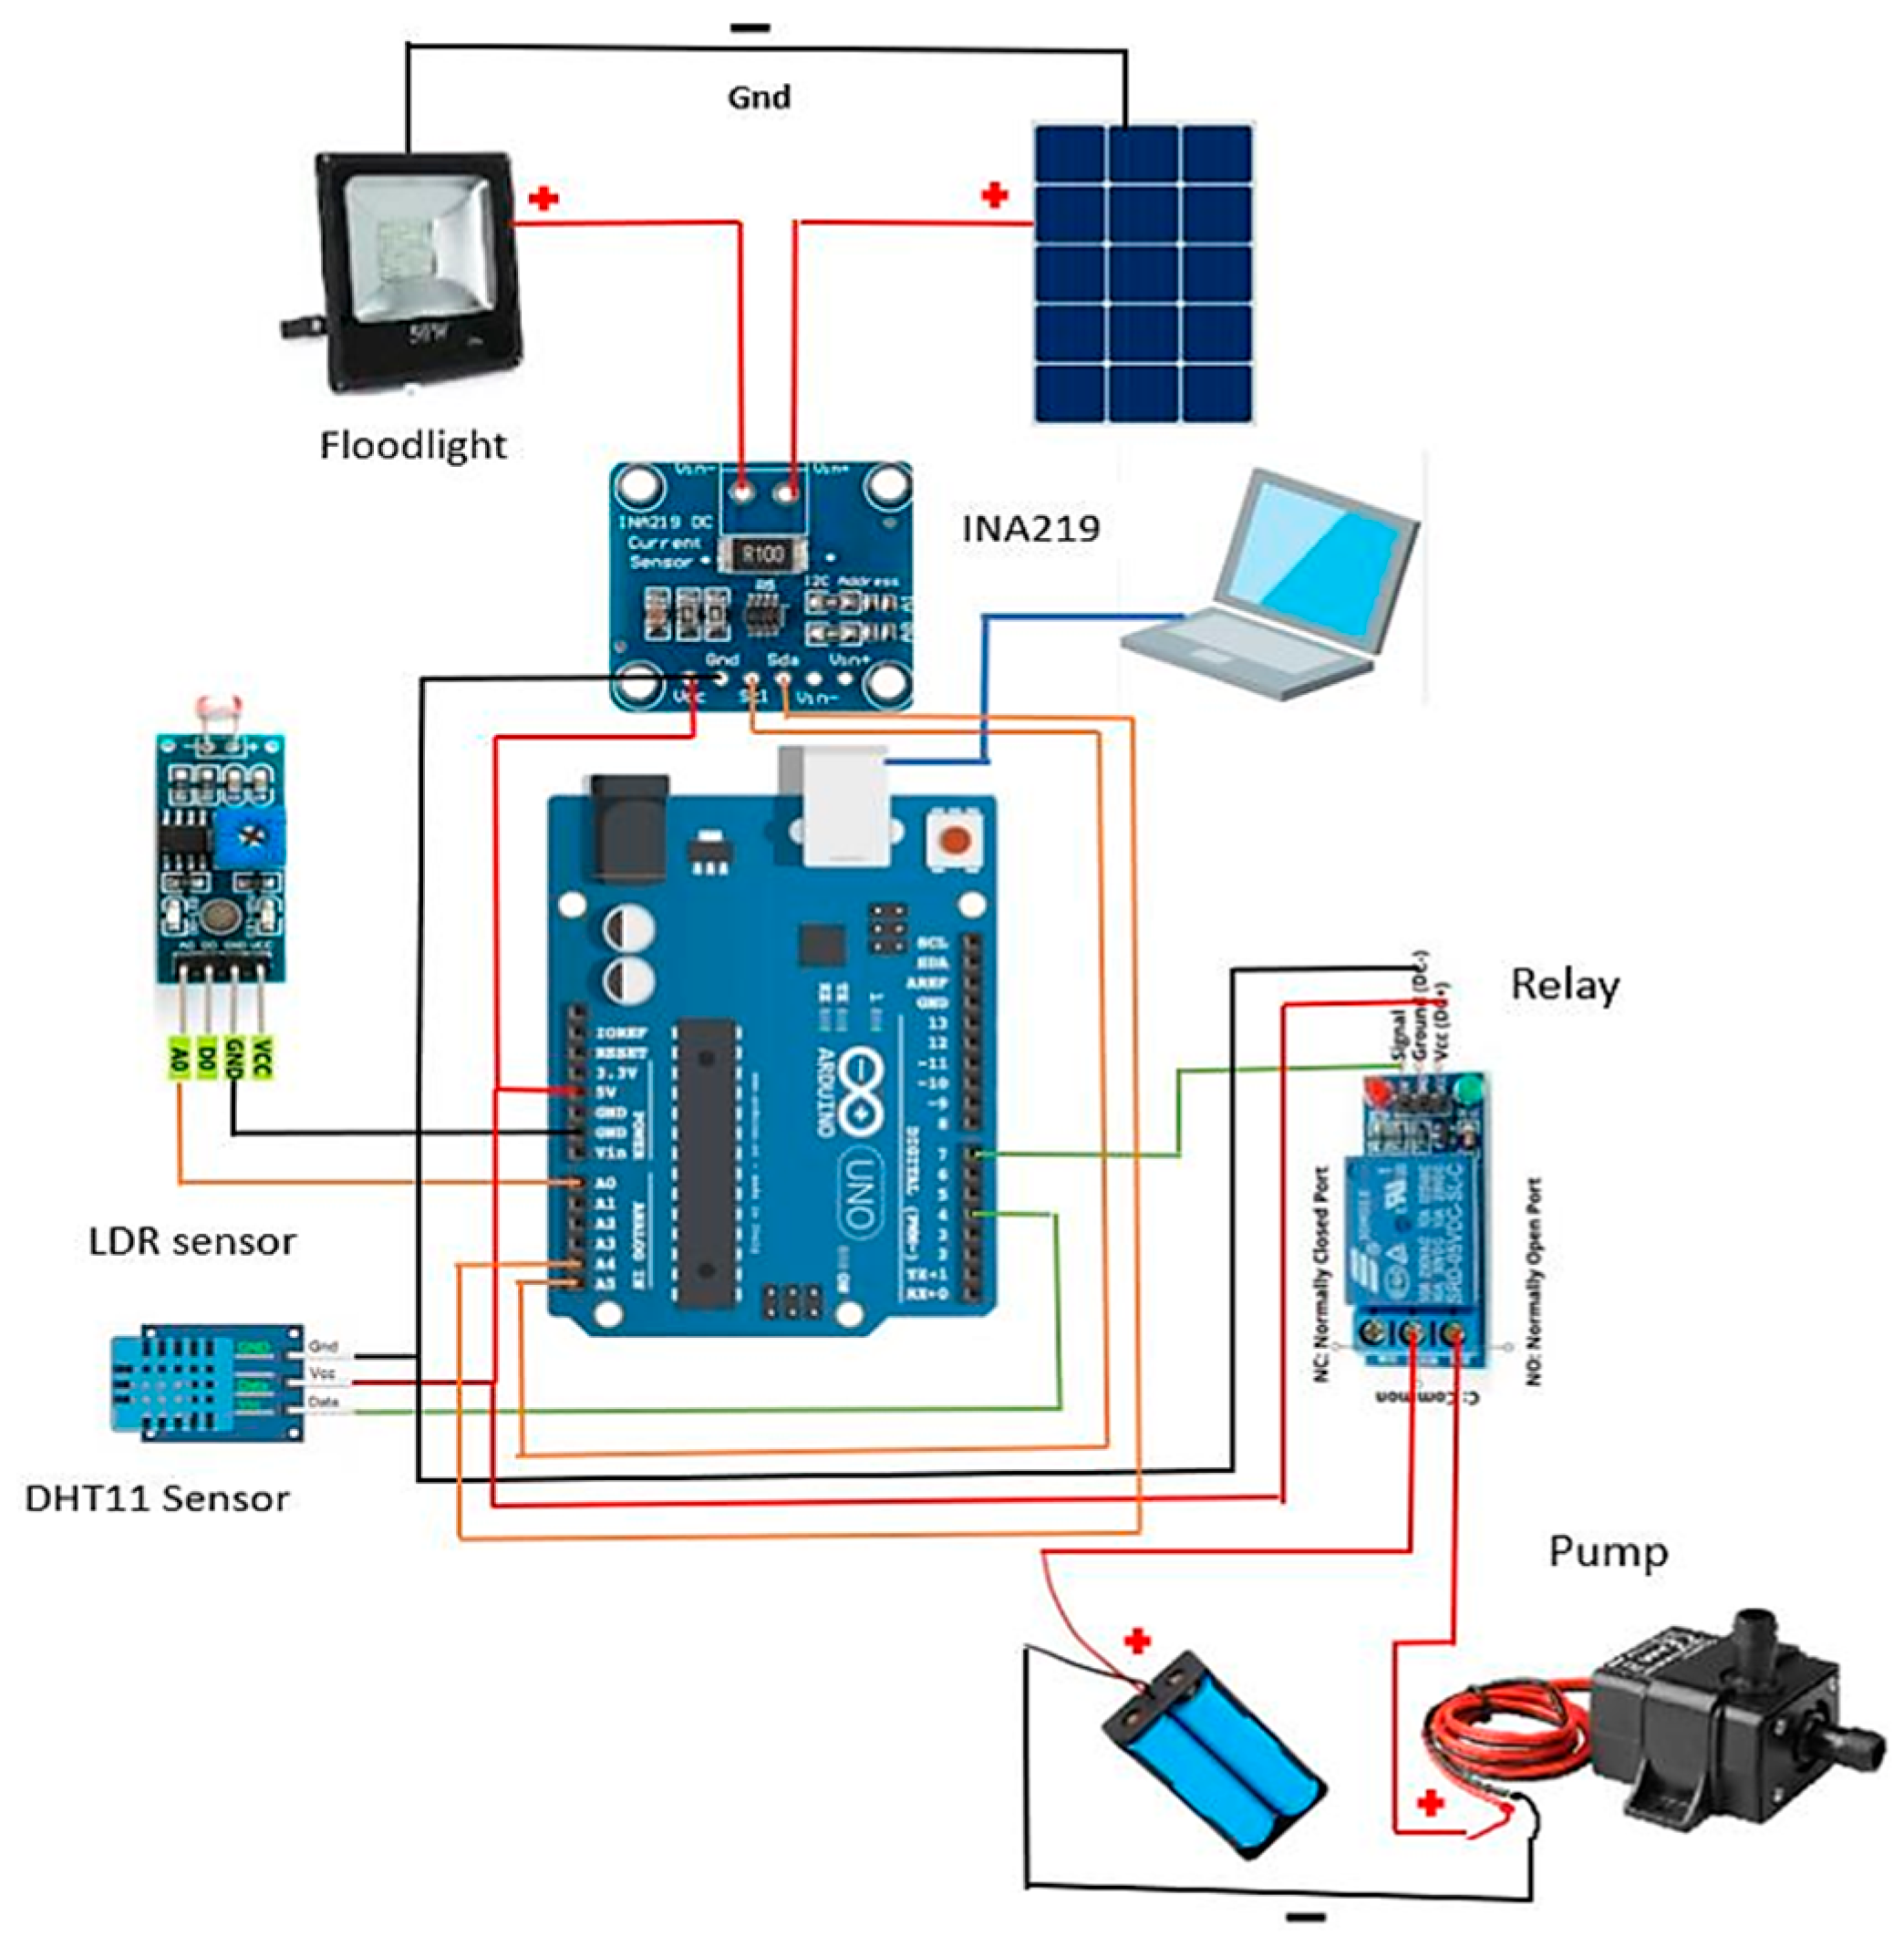
Proposed model for Arduino based relay control system.
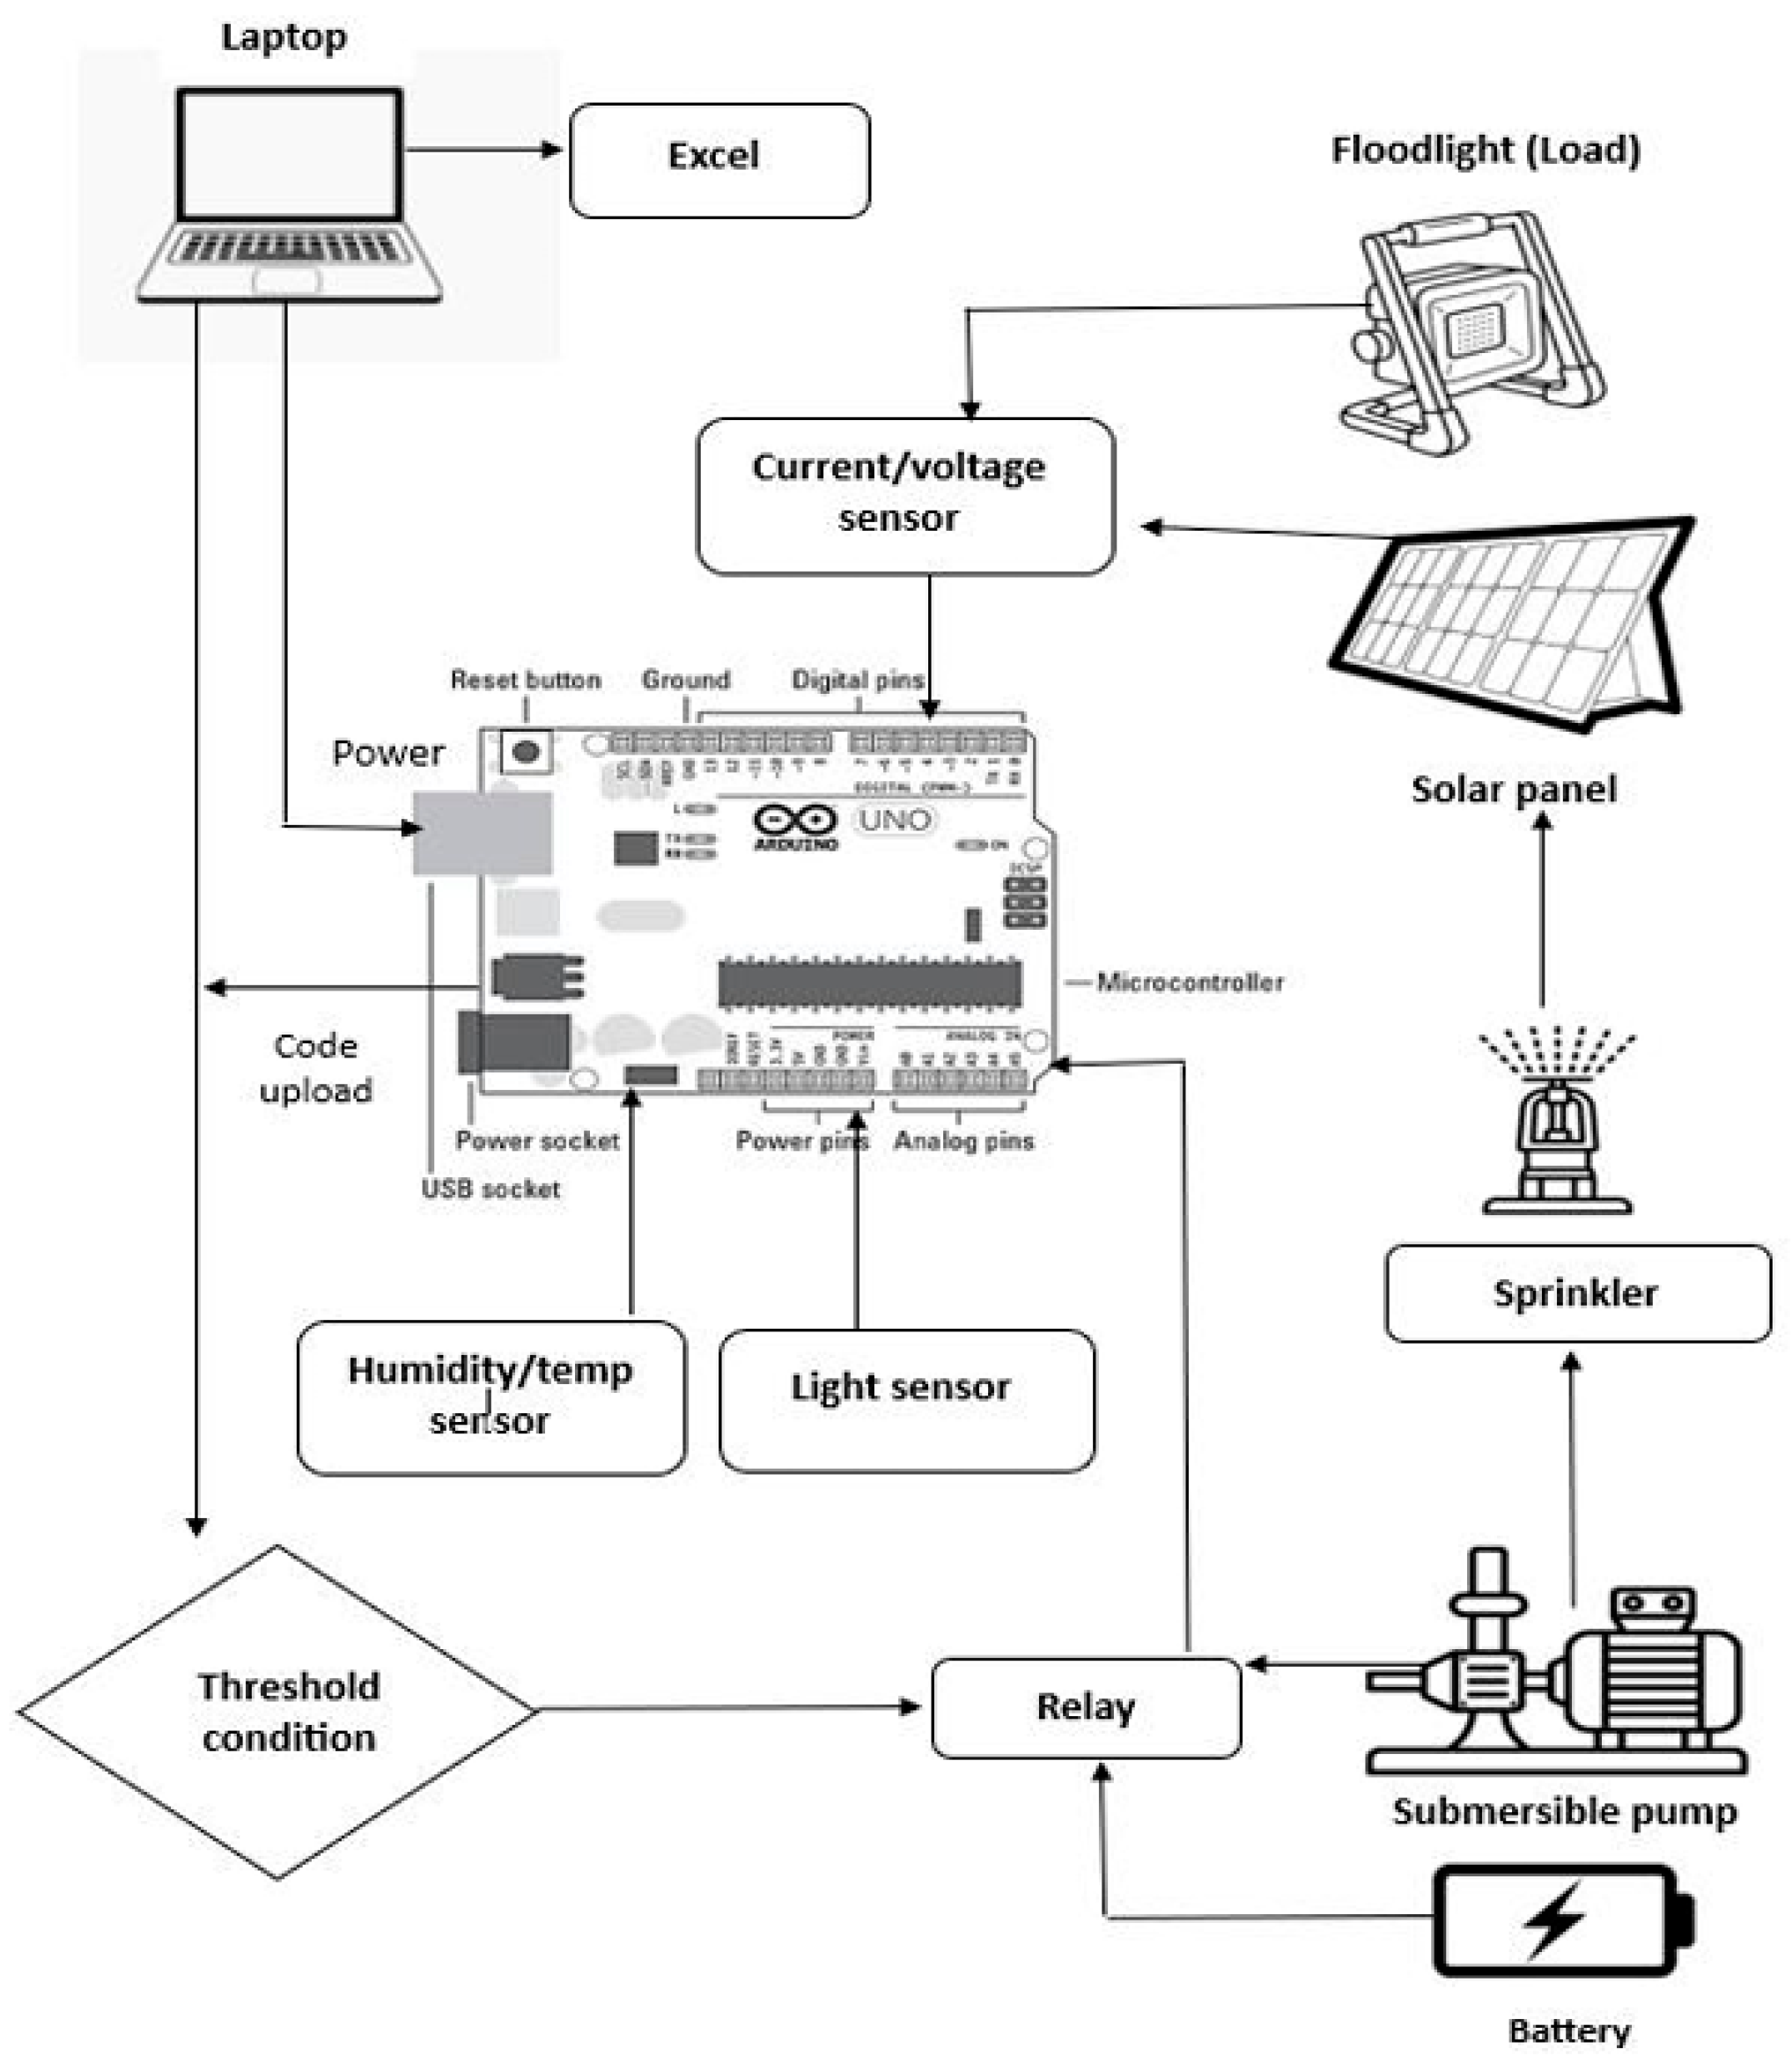
The proposed system presents an intelligent and cost-effective architecture for real-time photovoltaic (PV) panel health monitoring and automated cleaning using a fusion of IoT sensor data and image-based analysis through YOLO. The system is composed of two tightly integrated subsystems: an Arduino Uno-based sensor and control unit, and a Raspberry Pi-based AI and IoT communication module. The Arduino is connected to a set of sensors including a DHT11 for temperature and humidity, an LDR for light intensity, and an INA219 sensor for voltage, current, and power measurement of the panel and connected floodlight load. Based on predefined threshold conditions, the Arduino controls a relay module that activates a battery-powered submersible pump to clean the panel surface through a sprinkler mechanism.
Figure 2.
Raspberry pi IoT integration model.
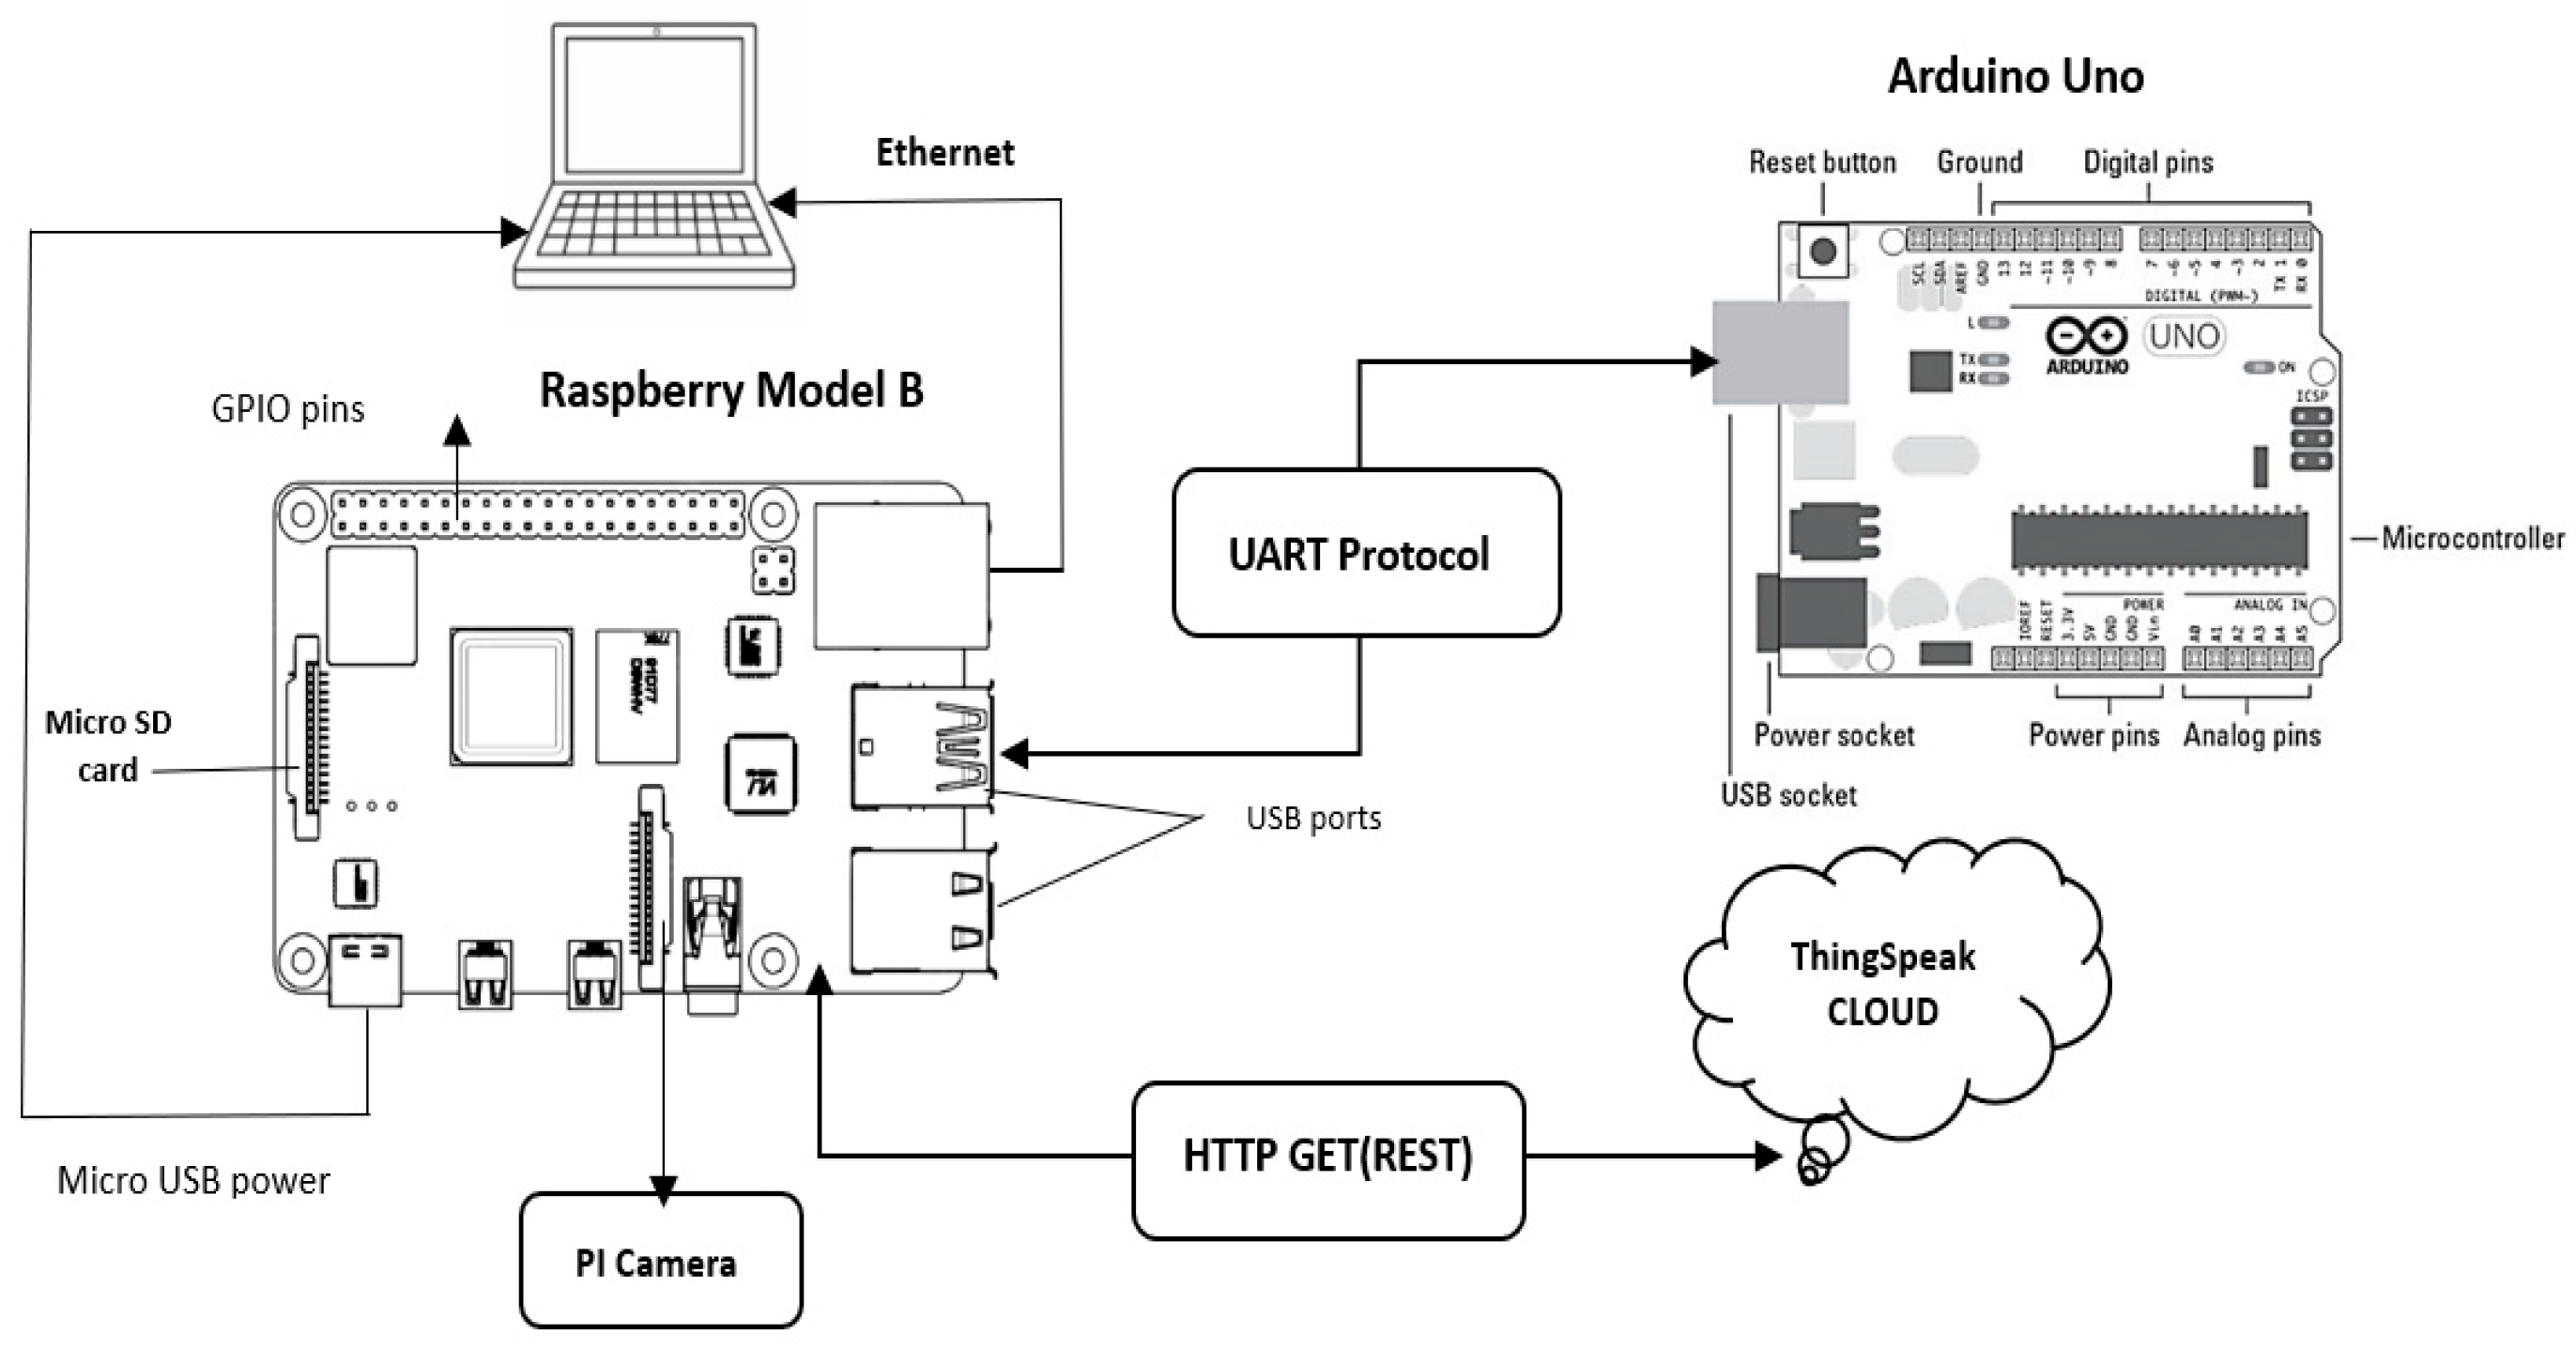
The Arduino also interfaced with the Raspberry Pi Model B via UART serial communication, acts as the edge processor for advanced decision-making. The Raspberry Pi captures real-time panel images using the Pi Camera and performs brightness analysis and object detection using the YOLOv8 model. When dusty conditions are confirmed by both sensor data and visual evidence, the Pi sends a control signal back to the Arduino to trigger the relay. Additionally, the Raspberry Pi uploads sensor and panel condition data to the ThingSpeak cloud platform using HTTP GET (REST) protocol and provides real-time visualization of key metrics. This integrated setup ensures autonomous, accurate, and energy-efficient maintenance of solar panels, reducing manual intervention and enhancing long-term performance in varying environmental conditions.
- B.
- Hardware Setup
Table 2.
List of Hardware.
| No | Component | Description |
| 1 | Arduino Uno | Acts as the main microcontroller to read sensor data and control the relay module. |
| 2 | DHT11 Sensor | Measures ambient temperature and humidity around the solar panel. |
| 3 | LDR (Light Sensor) | Detects sunlight intensity to estimate solar irradiance conditions. |
| 4 | INA219 Sensor | Monitors the voltage, current, and power output of the solar panel and floodlight. |
| 5 | Relay Module (1-Channel) | Switches ON/OFF the submersible pump based on cleaning decisions. |
| 6 | Submersible Water Pump | Sprays water on the panel through a sprinkler when cleaning is triggered. |
| 7 | Battery Pack (4 × 3.7V) | Powers the submersible pump independently of the Arduino board. |
| 8 | Floodlight (12V, 25W) | Acts as a load connected to the panel for simulating real-time energy usage. |
| 9 | Solar Panel (20W, 12V) | Generates power and serves as the primary surface being monitored and cleaned. |
| 10 | Raspberry Pi Model B (4GB) | Serves as the edge AI processor running YOLOv8 and communicating with Arduino. |
| 11 | Raspberry Pi Camera Module | Captures real-time images of the solar panel for brightness analysis and detection. |
| 12 | VM Elite 64GB MicroSD Card | Stores the Raspberry Pi OS, Python scripts, YOLO model, and logging data. |
| 13 | Ethernet Cable | Connects the Raspberry Pi to the laptop or network for IoT data transmission. |
| 14 | Laptop | Used for Arduino IDE programming, serial monitoring, Excel data logging, and remote VNC access. |
- 1)
- Arduino Uno
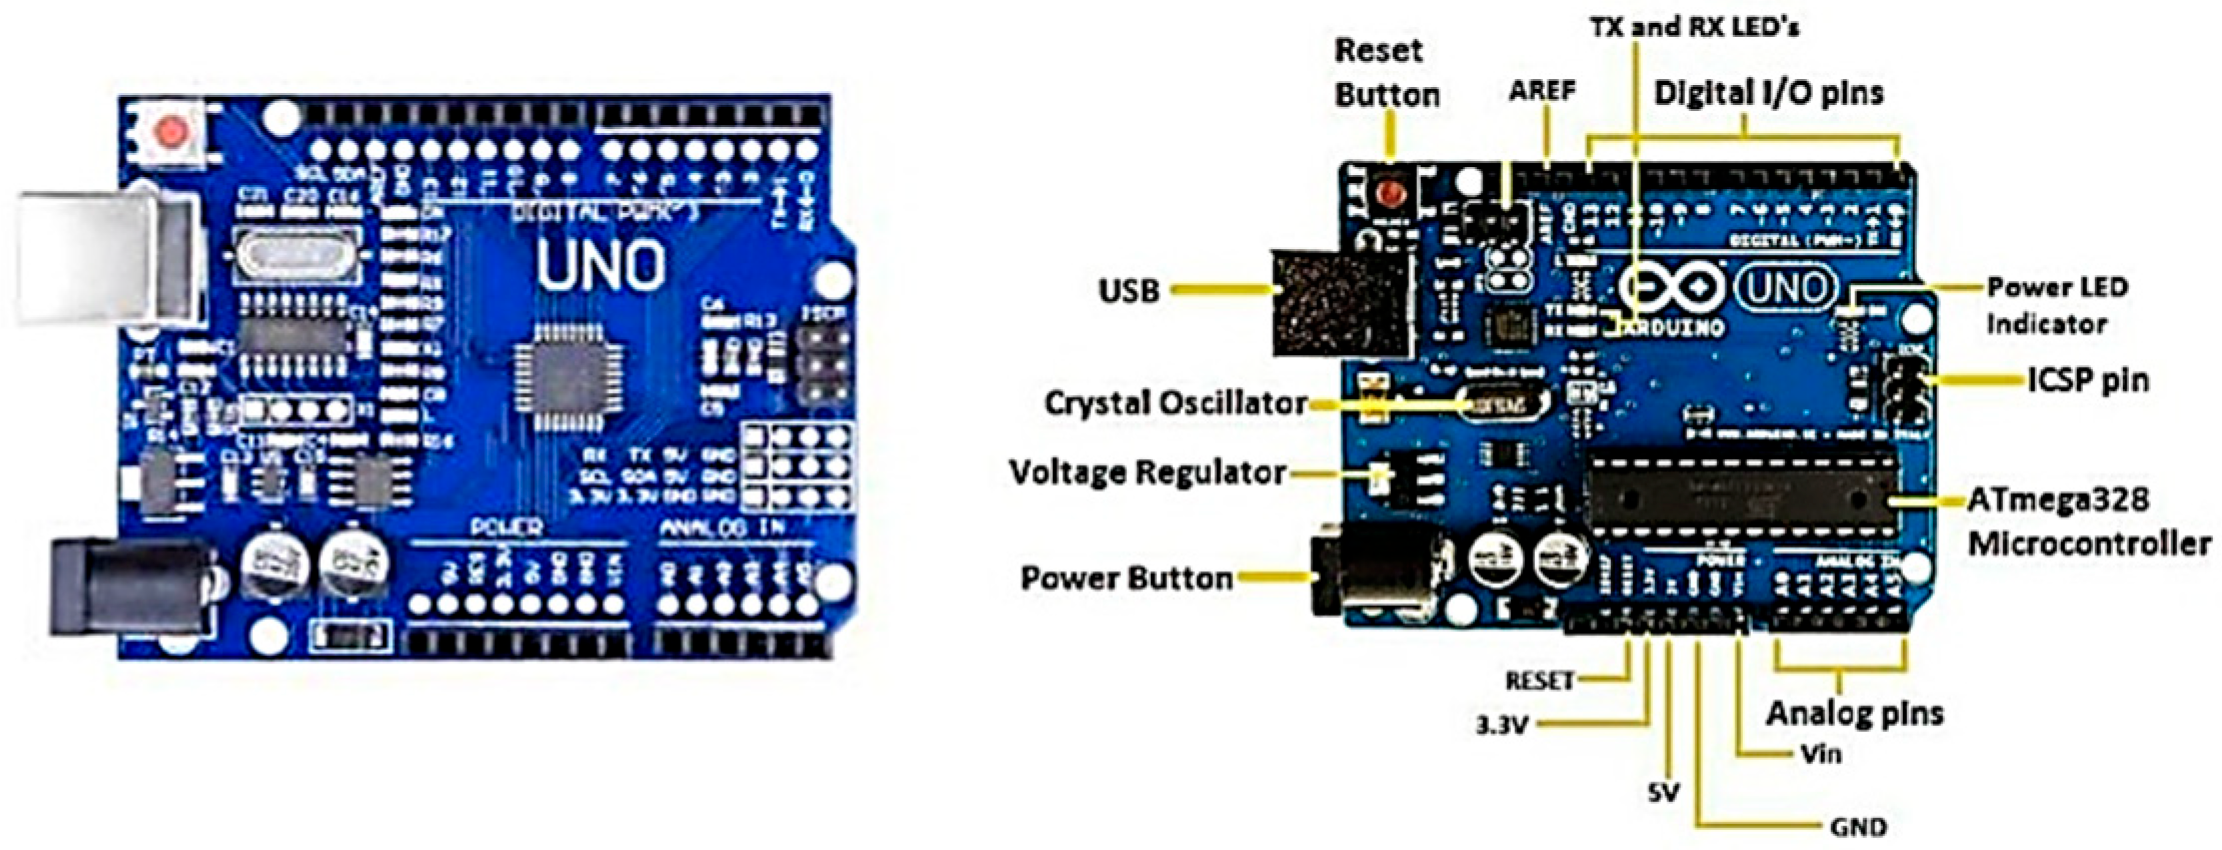
The Arduino Uno serves as the core microcontroller for the embedded control unit. It processes real-time data from environmental and electrical sensors, applies threshold-based logic, and controls peripheral devices such as the relay module. With its digital and analog, I/O capabilities, the Arduino is well-suited for sensor interfacing and is programmed via USB using the Arduino IDE. It also supports serial communication with external devices, such as the Raspberry Pi, enabling data transmission and command reception. All sensor and module interfaces, data processing, logic application, and output control are under its purview. It contains enough analog and digital input/output pins to support a number of devices, including the relay module, DHT11, LDR, and INA219 sensor. Continuous data collection from the sensors is done by the microcontroller, which then compares the data with preset threshold values kept in its program memory and acts appropriately. In order to log data in real time, it also controls serial communication with the linked laptop. The Arduino, which may be powered by an external power source via USB, is essential to automating the system's cleaning and environmental monitoring processes.
Figure 3.
Arduino uno with pin configuration.
- 2)
- Humidity and Temperature sensor (DHT11)
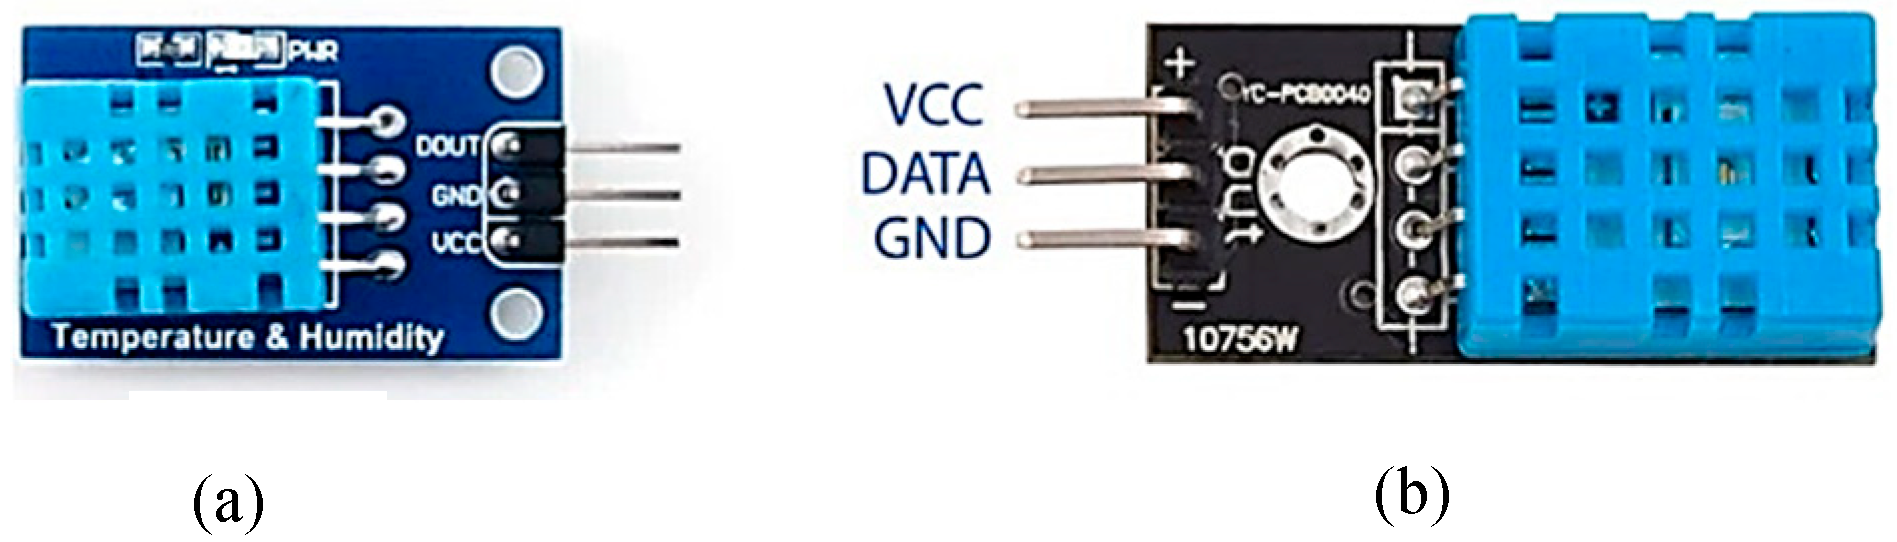
By monitoring both relative humidity and ambient temperature, the DHT11 sensor offers dual functionality. These factors are crucial in assessing the possibility of dust buildup on the solar panel. For example, dry and dusty conditions are frequently indicated by high temperatures and low humidity, which can reduce solar efficiency. The Arduino receives digital data from the sensor and evaluates it to determine whether cleaning is necessary. Because of its small size, affordability, and adequate precision, the DHT11 is the best option for environmental monitoring in this project.
Figure 4.
(a) DHT11 (b) Pin configuration.
- 3)
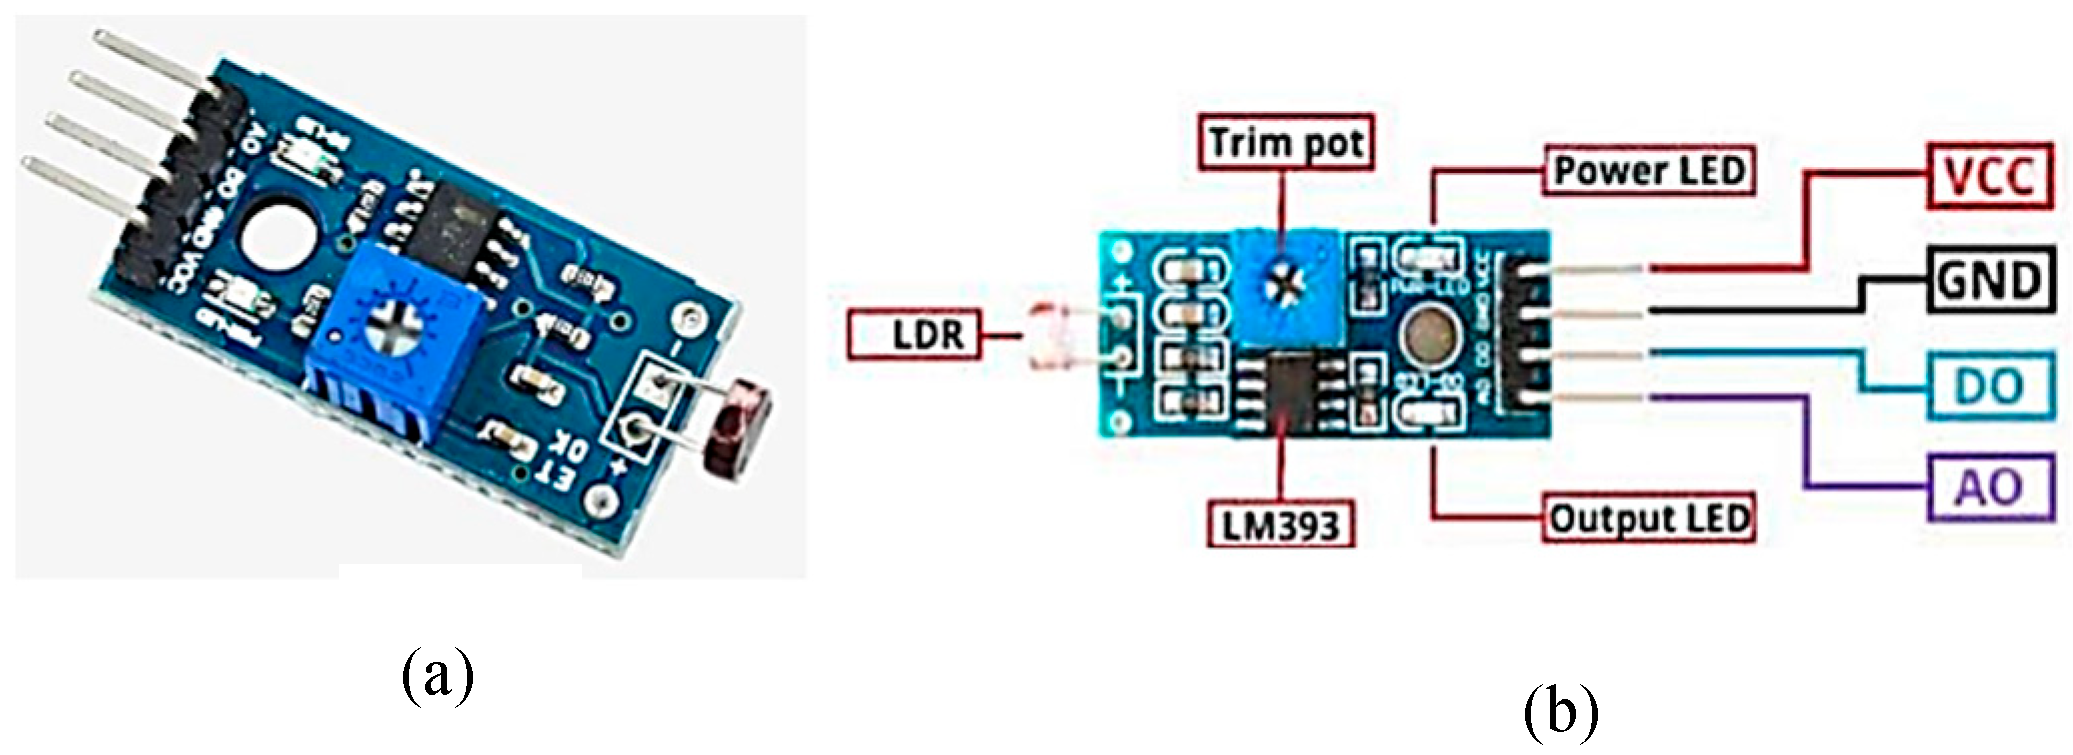
- Light Sensor (LDR Module)
Ambient light intensity is sensed using a Light Dependent Resistor (LDR). Variations in light levels cause the resistance of the LDR to change; this change is translated into a voltage and read using the analog input pin on the Arduino. If the light intensity drops below a certain point, it may be a sign of dust buildup or shadowing on the panel. The LDR aids in more precise decision-making about the necessity for cleaning when combined with information from the temperature and humidity sensors. Value is added by this straightforward but efficient sensor, which makes it possible to monitor panel performance optically. Connected to the analog input pin of the Arduino, this sensor plays a crucial role in determining sunlight availability. It helps detect scenarios where a drop in light may indicate dust accumulation or partial shading of the panel.
Figure 5.
(a) Light sensor(b) Pin configuration.
- 4)
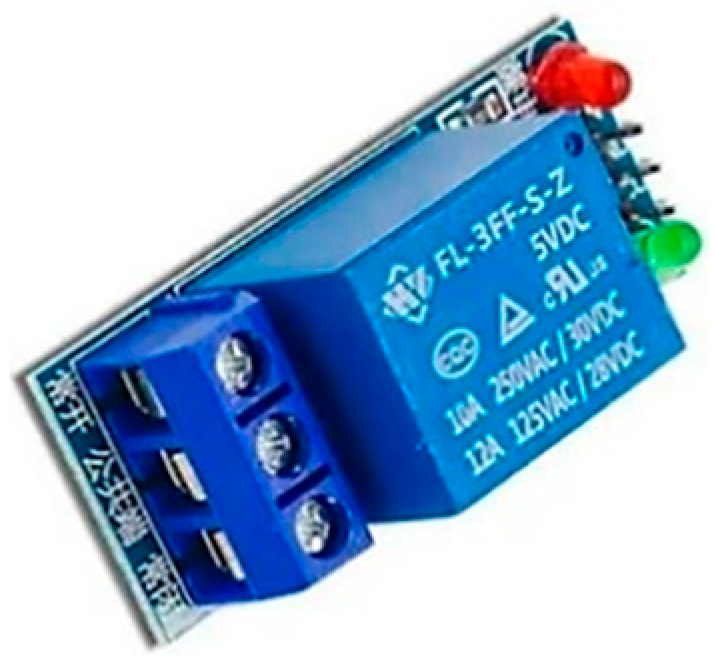
- Relay Module (1-Channel)
The relay module acts as a digital switch controlled by the Arduino. It is used to activate or deactivate the submersible water pump based on sensor and image fusion logic. Operating at 5V, the relay can safely control higher-voltage loads without exposing the microcontroller to high currents, ensuring reliable hardware-level automation. The low-power microcontroller circuit and the high-power pump circuit are separated by the 5V single-channel relay, which functions as an electrically actuated switch. The relay module receives a signal from the Arduino that activates the pump when the ambient conditions reach the threshold. By enabling automation without the need for human interaction, this mechanism guarantees the cleaning system operates safely and effectively.
Figure 6.
Relay module single channel.
- 5)
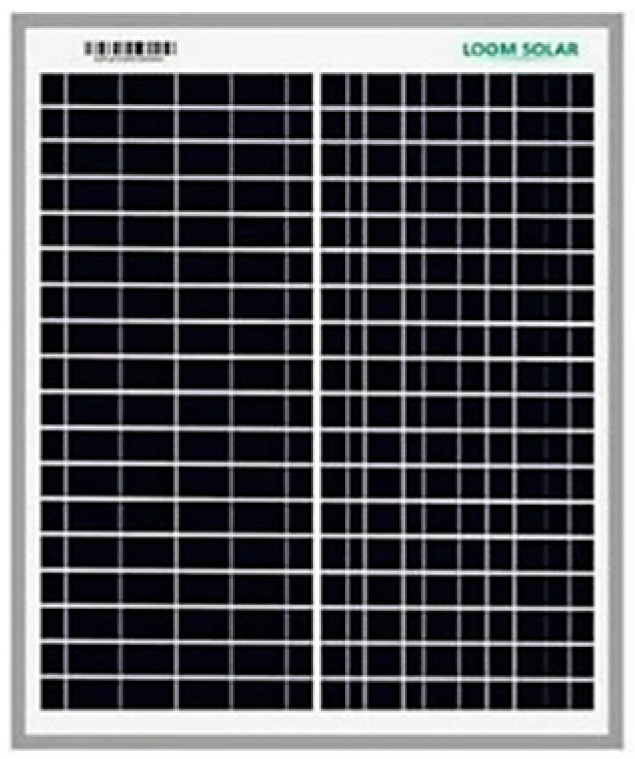
- Solar Panel (20W,12V Polycrystalline)
The system's main renewable energy source is a 20-watt, 12-volt Loom Solar photovoltaic (PV) panel. Under typical test settings, this panel can generate a peak open-circuit voltage of 19.25 volts and a maximum current of roughly 1.04 amperes. It is tiny, effective, and appropriate for research-based energy applications or small-scale do-it-yourself projects. In this configuration, during daylight hours, the solar panel powers the battery charging circuit in addition to the 12V LED lighting. The strategy guarantees off-grid, environmentally friendly power generation by directly utilizing solar energy, which makes it sustainable and financially feasible for long-term deployment, particularly in rural or isolated places. Any drop in output voltage or current, due to dirt or environmental interference, is detected and used as part of the cleaning decision logic.
Figure 7.
Solar panel.
- 6)
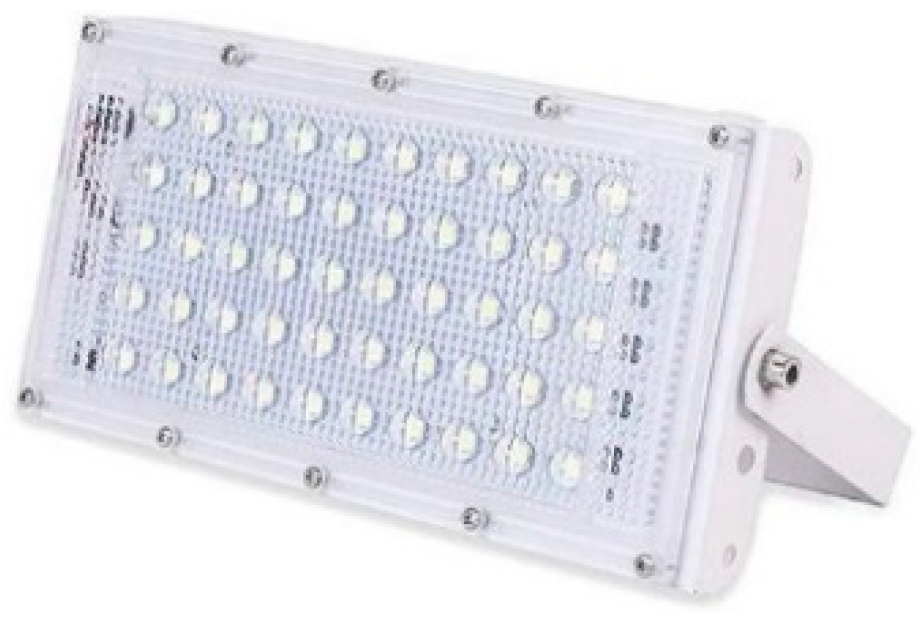
- Floodlight (12V,25W)
To show how much power the system uses, a 12-volt, 25-watt direct current LED floodlight is utilized as the main load. This floodlight mimics real-world solar illumination configurations in order to replicate realistic energy usage circumstances. It demonstrates the solar panel's capacity to drive resistive loads since it is driven directly by the panel throughout the day or whenever enough power is available. The floodlight's operation aids in testing the system's voltage drop and current draw, which are tracked by the INA219 sensor. This permits testing of the system's energy management capabilities under various load levels and guarantees that the panel is efficiently supplying power.
Figure 8.
Floodlight.
- 7)
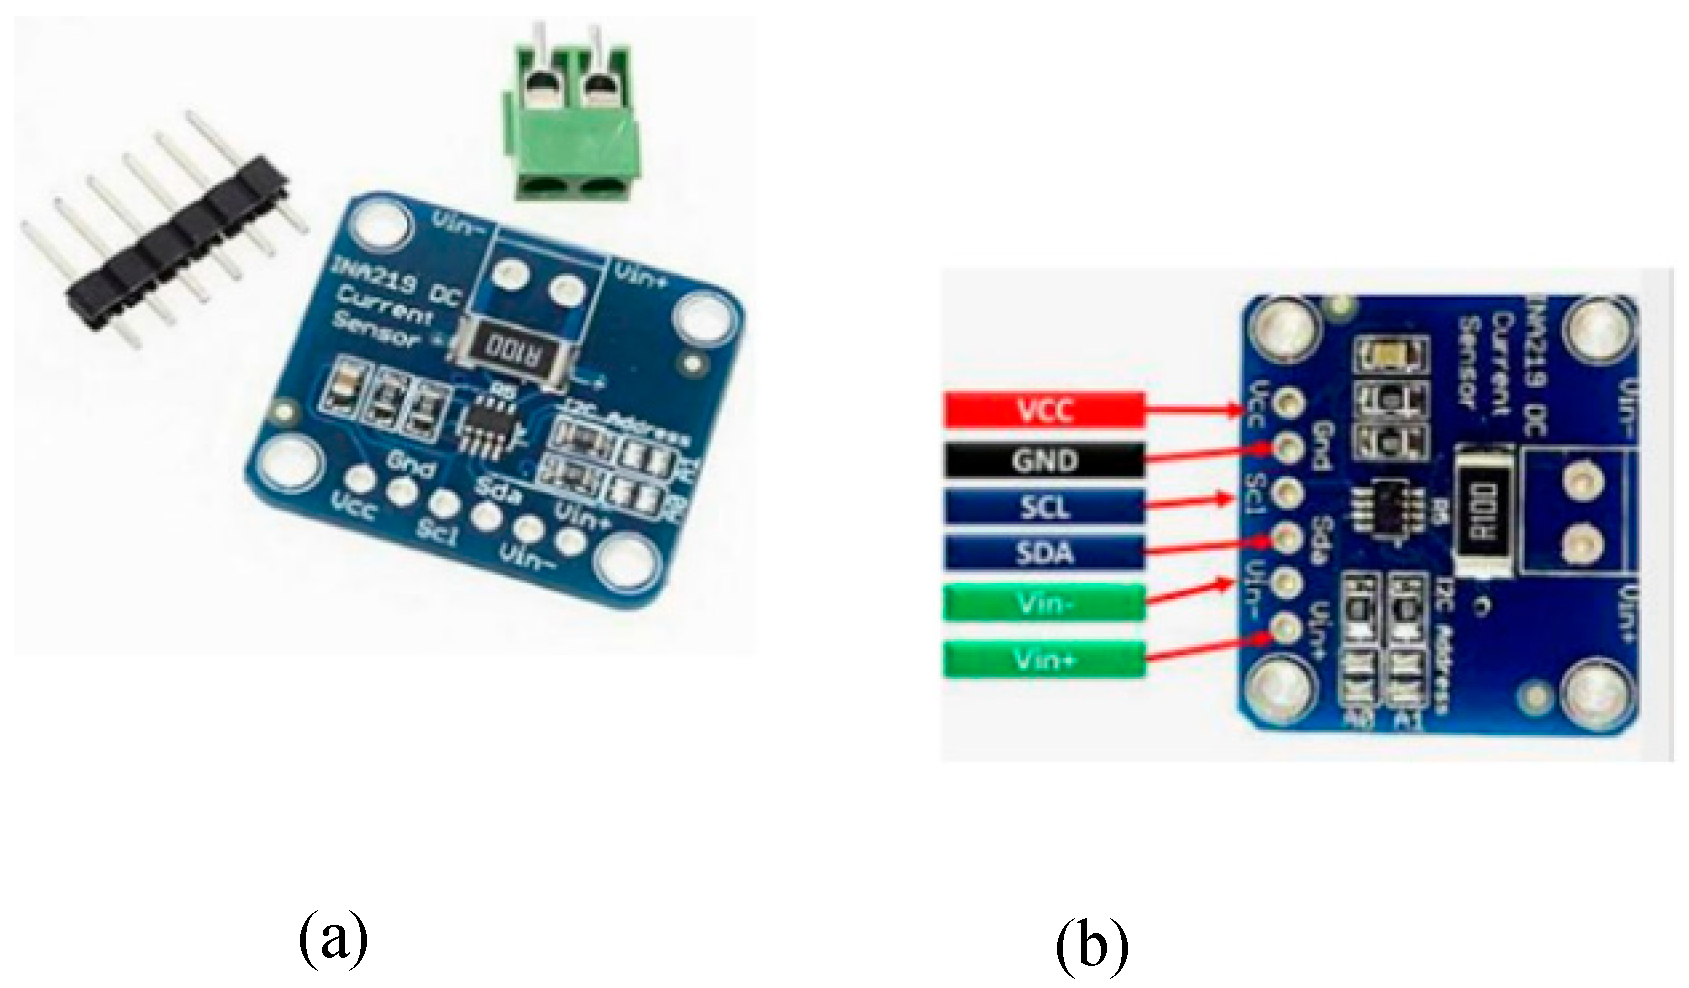
- Current-Voltage Sensor (INA219)
The INA219 current and voltage sensor is incorporated between the load (battery or floodlight) and the power source (solar panel) to provide real-time electrical parameter monitoring. High-side current sensing is possible with this I2C-enabled sensor module, which also enables accurate power (in watts), voltage (in volts), and current (in amperes) measurements. These measurements are essential for evaluating load behaviour, energy efficiency, and system performance in a variety of environmental circumstances. The Arduino Uno receives the data collected by the INA219, processes it, and then uses pre-programmed logic to initiate control actions. Additionally, over time, the data recorded by the INA219 aids in system diagnostics and energy profiling.
Figure 9.
(a)INA219(b)pin configuration.
- 8)
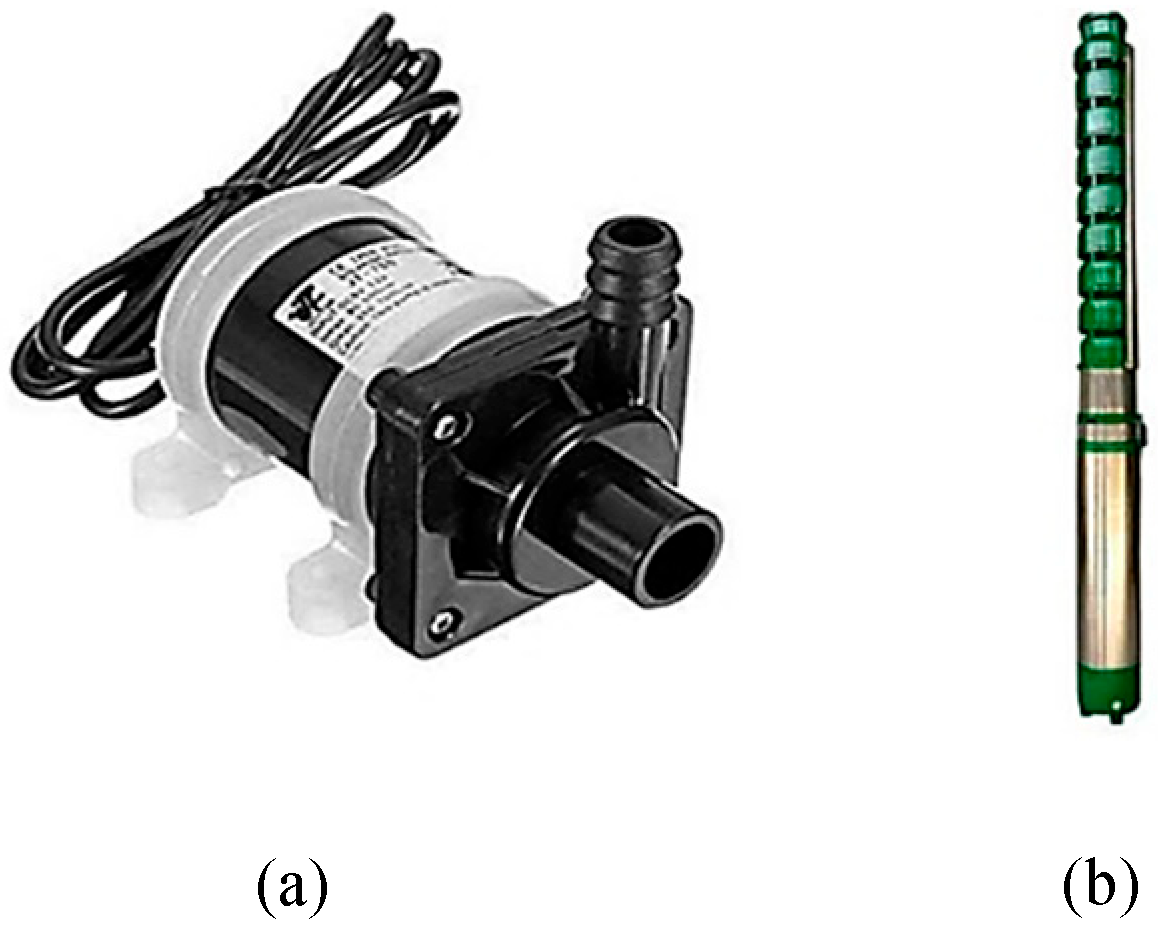
- Submersible water pump with sprinkler
When cleaning is necessary, a 12V brushless DC water pump with a 700 liters per hour (L/H) flow rate is triggered. In order to improve the efficiency of energy absorption, the pump is connected to a sprinkler mechanism that sprays water over the surface of the solar panel to clear dust and debris. The relay, which gets signals from the Arduino based on sensor evaluations, controls the pump, which runs on the battery power that has been stored. For panel cleaning applications, a submersible pump is the best option because it guarantees adequate water pressure and velocity. This part shows how automation can be used for PV system maintenance in real time. This DC-powered water pump is used to physically clean the surface of the solar panel by spraying water through a sprinkler attachment. It is triggered by the relay when dust accumulation is detected. The pump operates on a separate power source to prevent interference with control circuitry and is optimized for small-scale panel cleaning applications.
Figure 10.
(a) DC submersible pump (b) water sprinkler.
- 9)
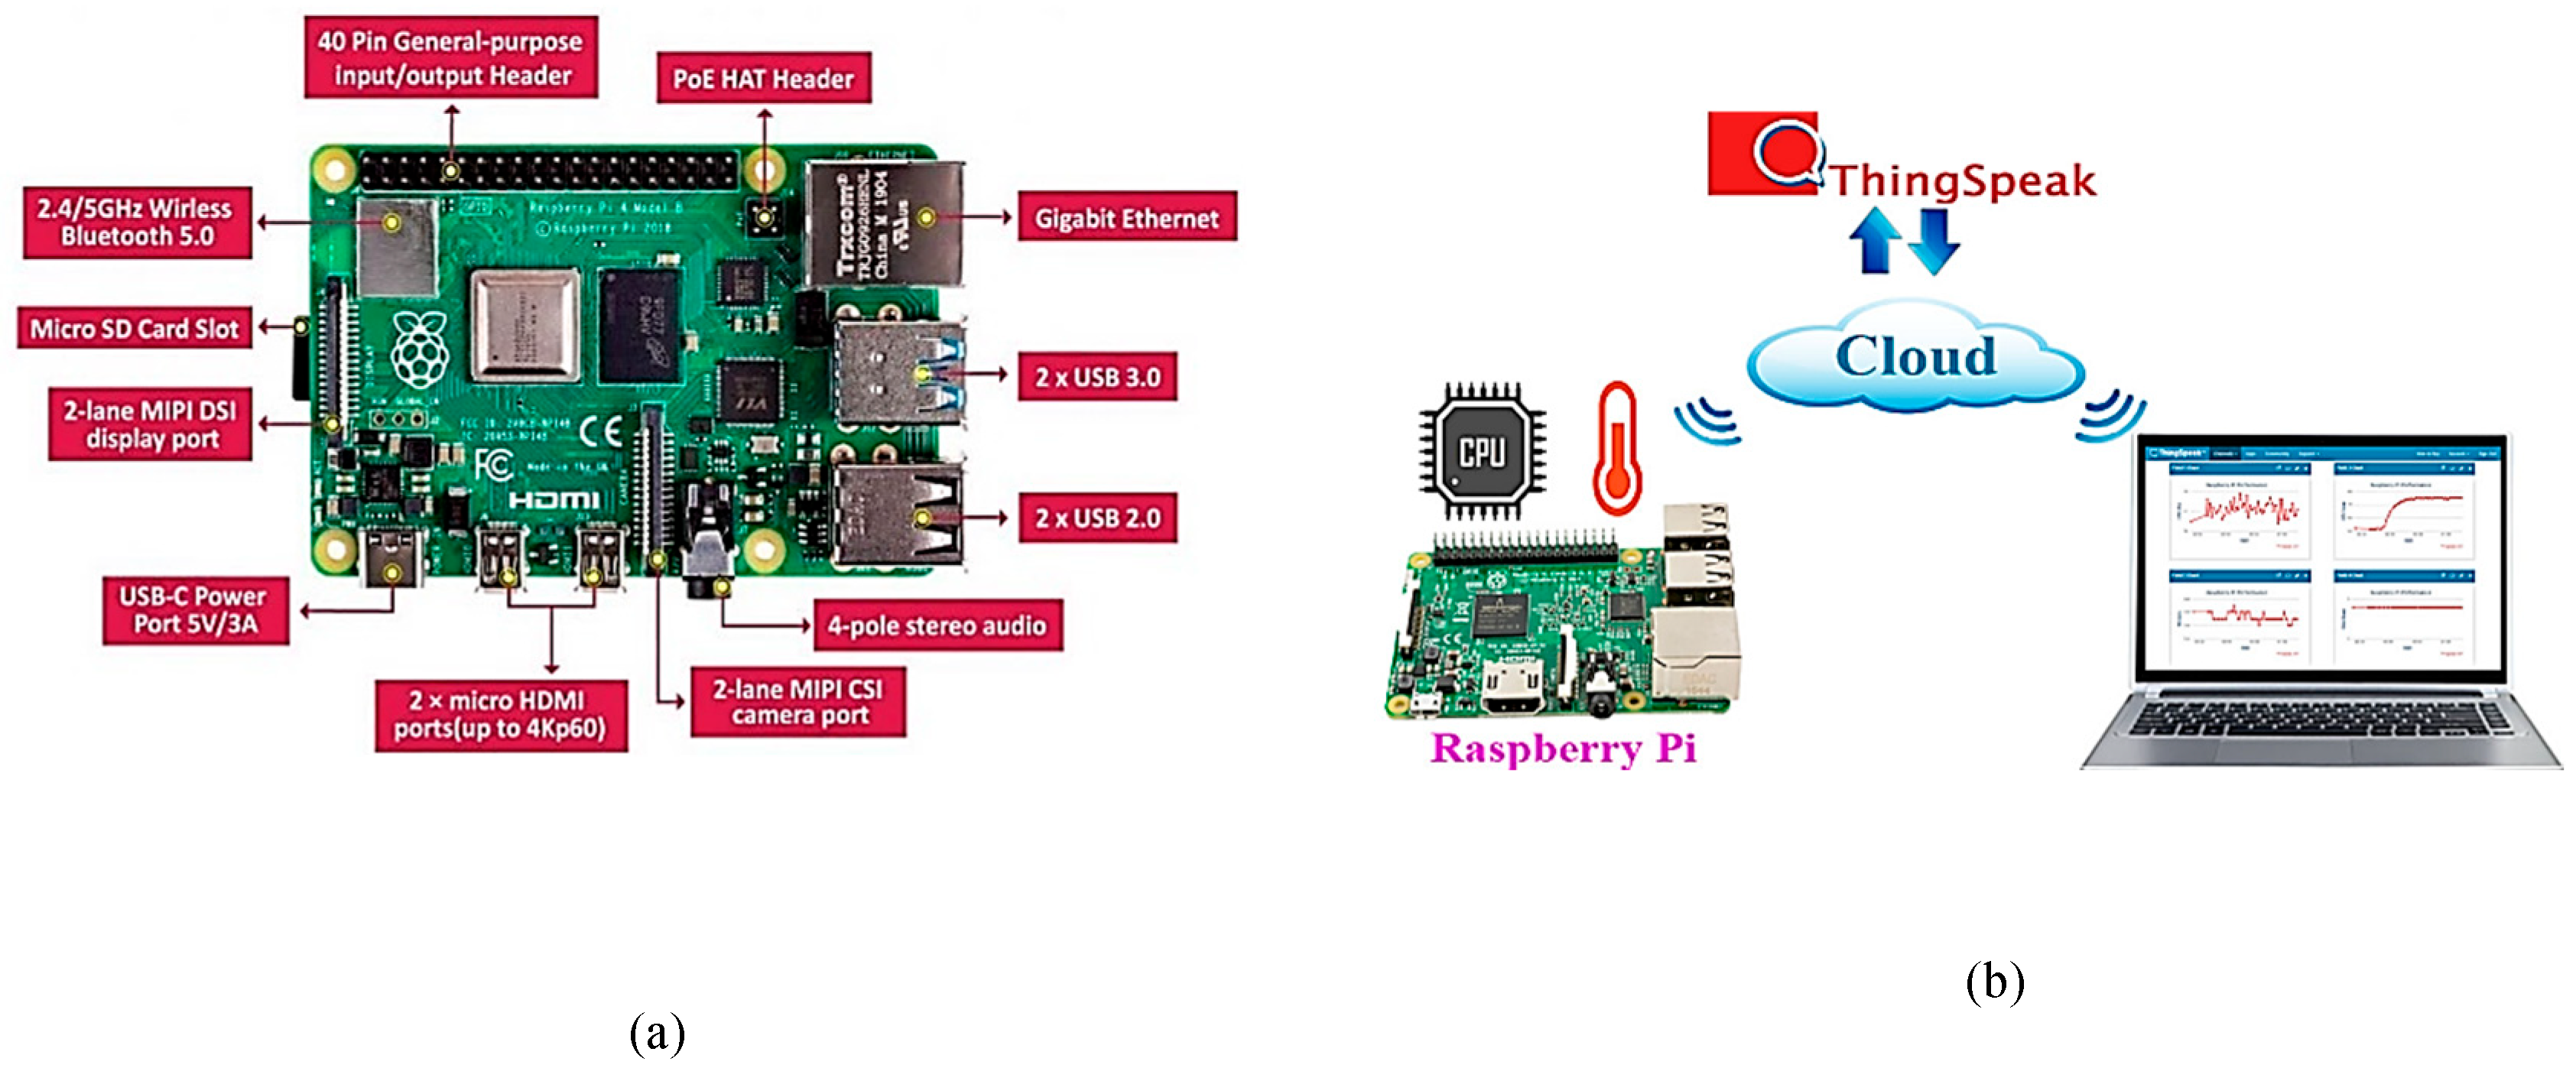
- Raspberry Pi Model B (4GB RAM)
The core edge computing node in the suggested system is the Raspberry Pi Model B (4GB RAM), which handles cloud connectivity, decision-making, and real-time processing. Through UART serial communication, it obtains electrical and environmental sensor data from the Arduino Uno. This enables it to combine sensor readings with visual input to make informed cleaning decisions. Sensor parsing, OpenCV brightness calculation, YOLOv8 model object detection, and integration with IoT cloud platforms are all included in the Python-based script that the Pi runs. The Raspberry Pi's capacity to manage local AI inference operations, which allows it to evaluate panel images taken with the Pi Camera without the need for external servers, is one of its main advantages. The Pi is equipped with a 64GB VM Elite microSD card, which holds the Raspberry Pi OS, YOLOv8 model weights, Python libraries (e.g., OpenCV, NumPy, ultralytics), and logs for offline diagnostics. To facilitate live monitoring and remote system control, the Raspberry Pi is accessed wirelessly using RealVNC, which mirrors its desktop interface onto a laptop or mobile device. This allows researchers to observe the terminal output, debug the code, and visually inspect the classification results in real time without needing physical access.
Figure 11.
(a) Pi camera module (b) Pi camera connection with raspberry.
- 10)
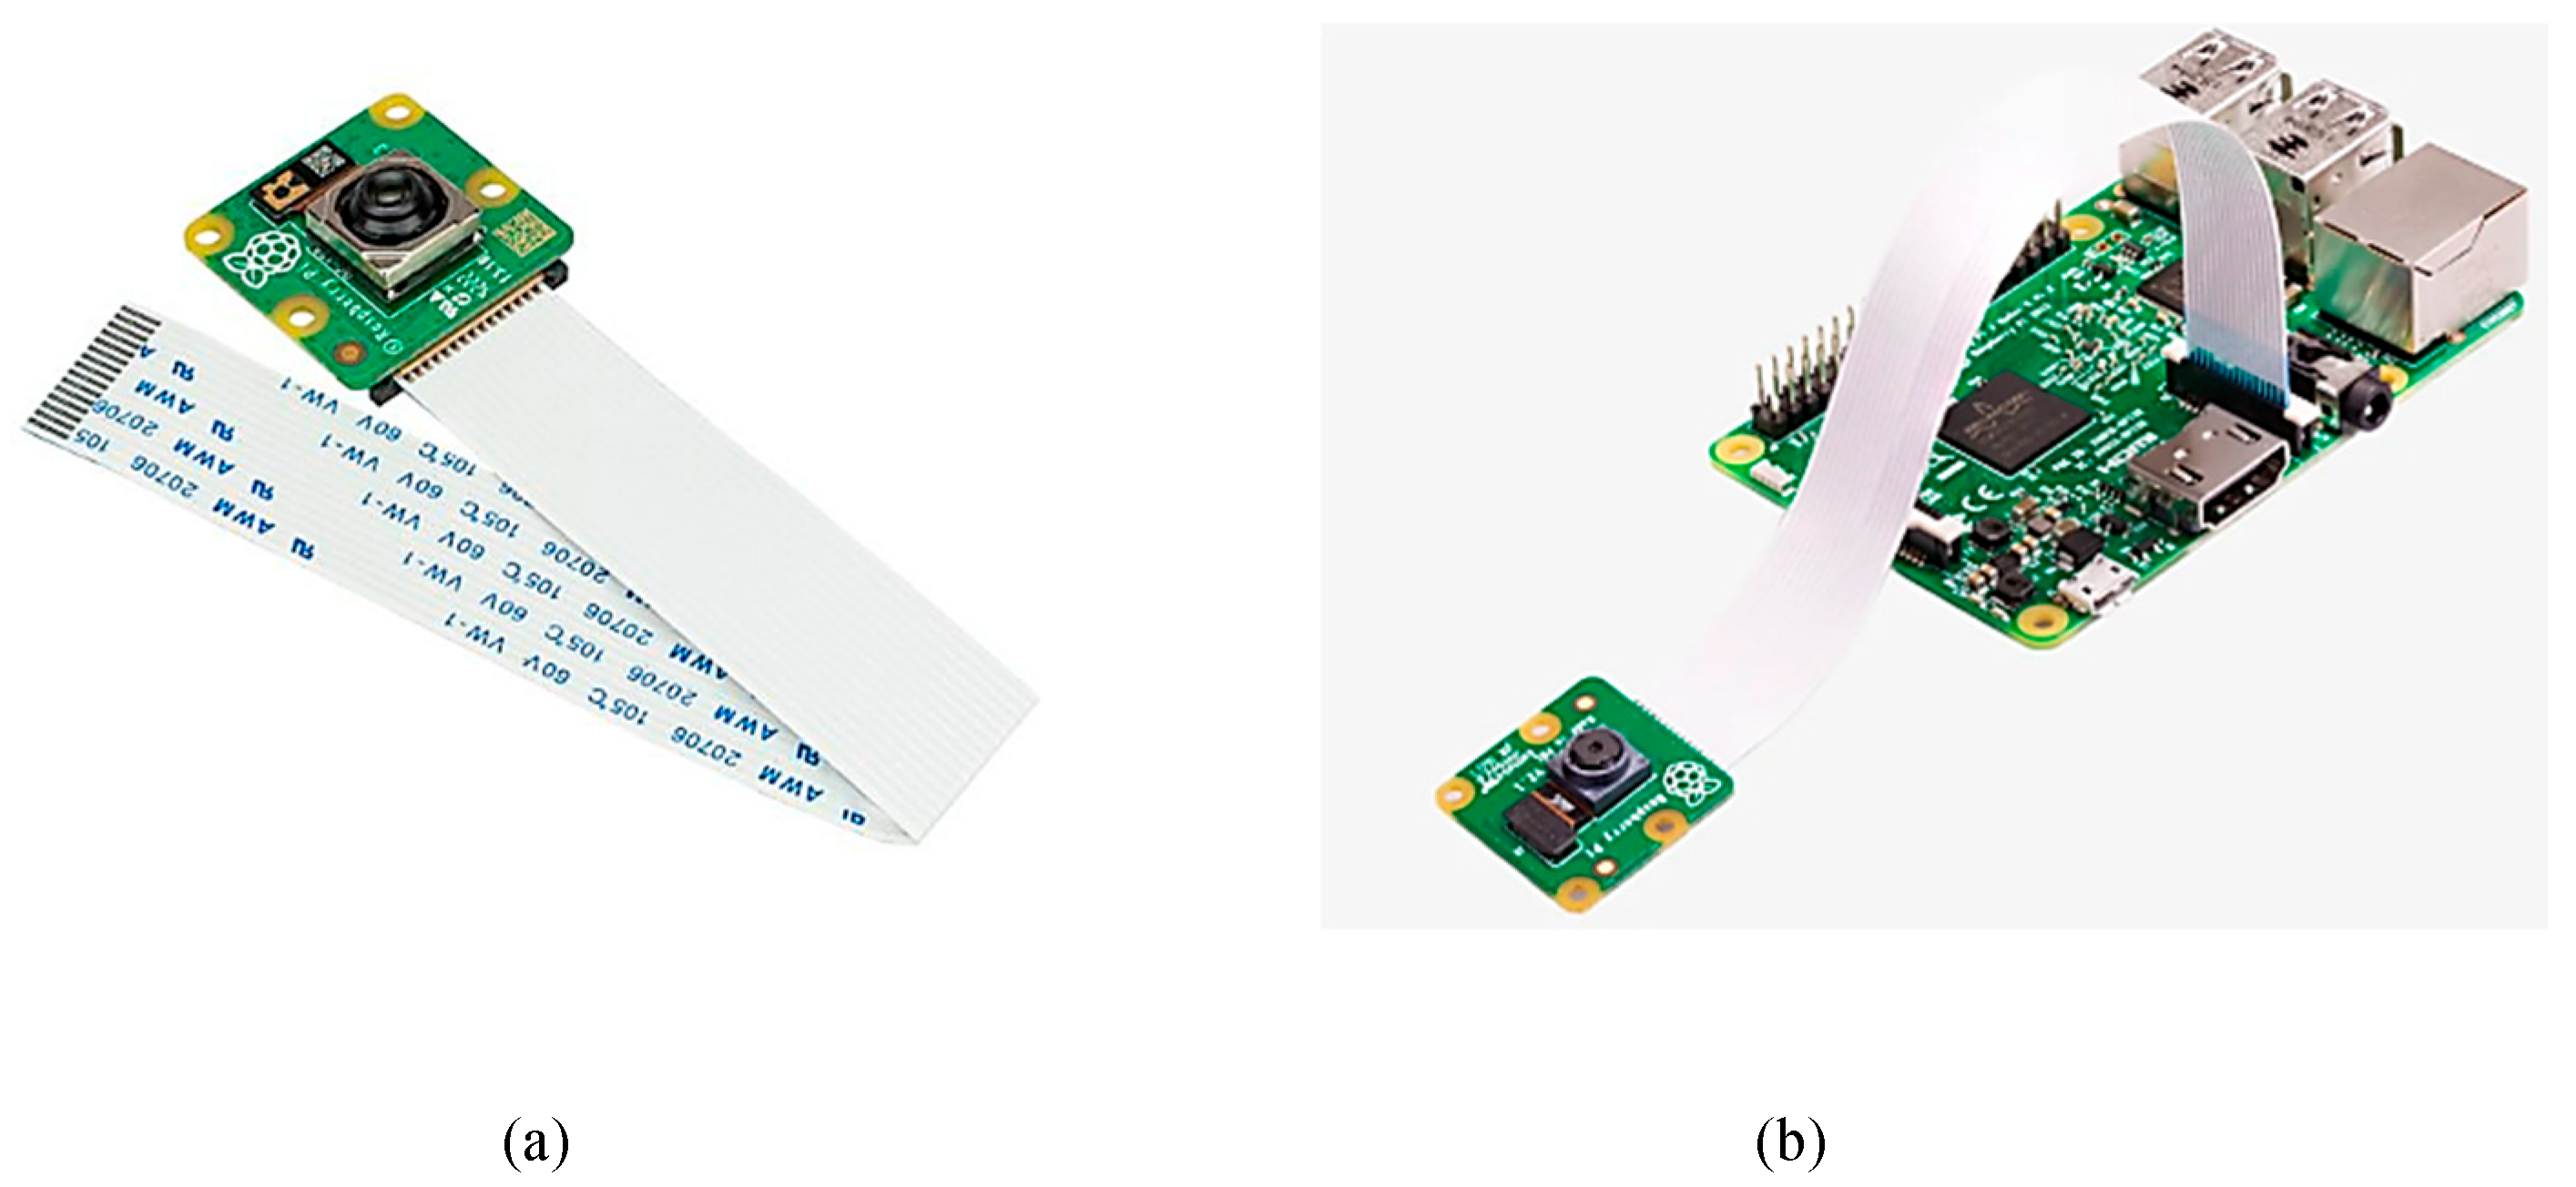
- Raspberry Pi-Camera Module
The Raspberry Pi Camera Module is directly connected to the Pi’s CSI (Camera Serial Interface) port and is responsible for capturing real-time images of the solar panel surface. This camera plays a critical role in enabling the visual analytics layer of the system. Images are captured periodically using libcamera-still commands, stored locally, and then processed using OpenCV to calculate image brightness. This is used to estimate surface clarity, detect shadowing, or identify potential dust layers. Additionally, a YOLOv8 object identification pipeline that runs on the Raspberry Pi processes the camera images. Its output, along with brightness thresholds, helps determine whether the panel is in a "dusty" or "clean" state, even though the model being used is a blank YOLOv8 model. By combining real-time sensor data with image-based detection, the system is able to minimize false triggers brought on by transient environmental changes and make more accurate decisions. Thus, the Pi Camera acts as the system's visual eye, allowing for intelligent automation that is based on both numerical sensor inputs and real-world physical observations of the panel's condition.
Figure 12.
(a) Pi camera module (b) Pi camera connection with raspberry.
- C.
- Flowchart
Figure 13.
Flowchart of proposed YOLO-IoT panel cleaning system.
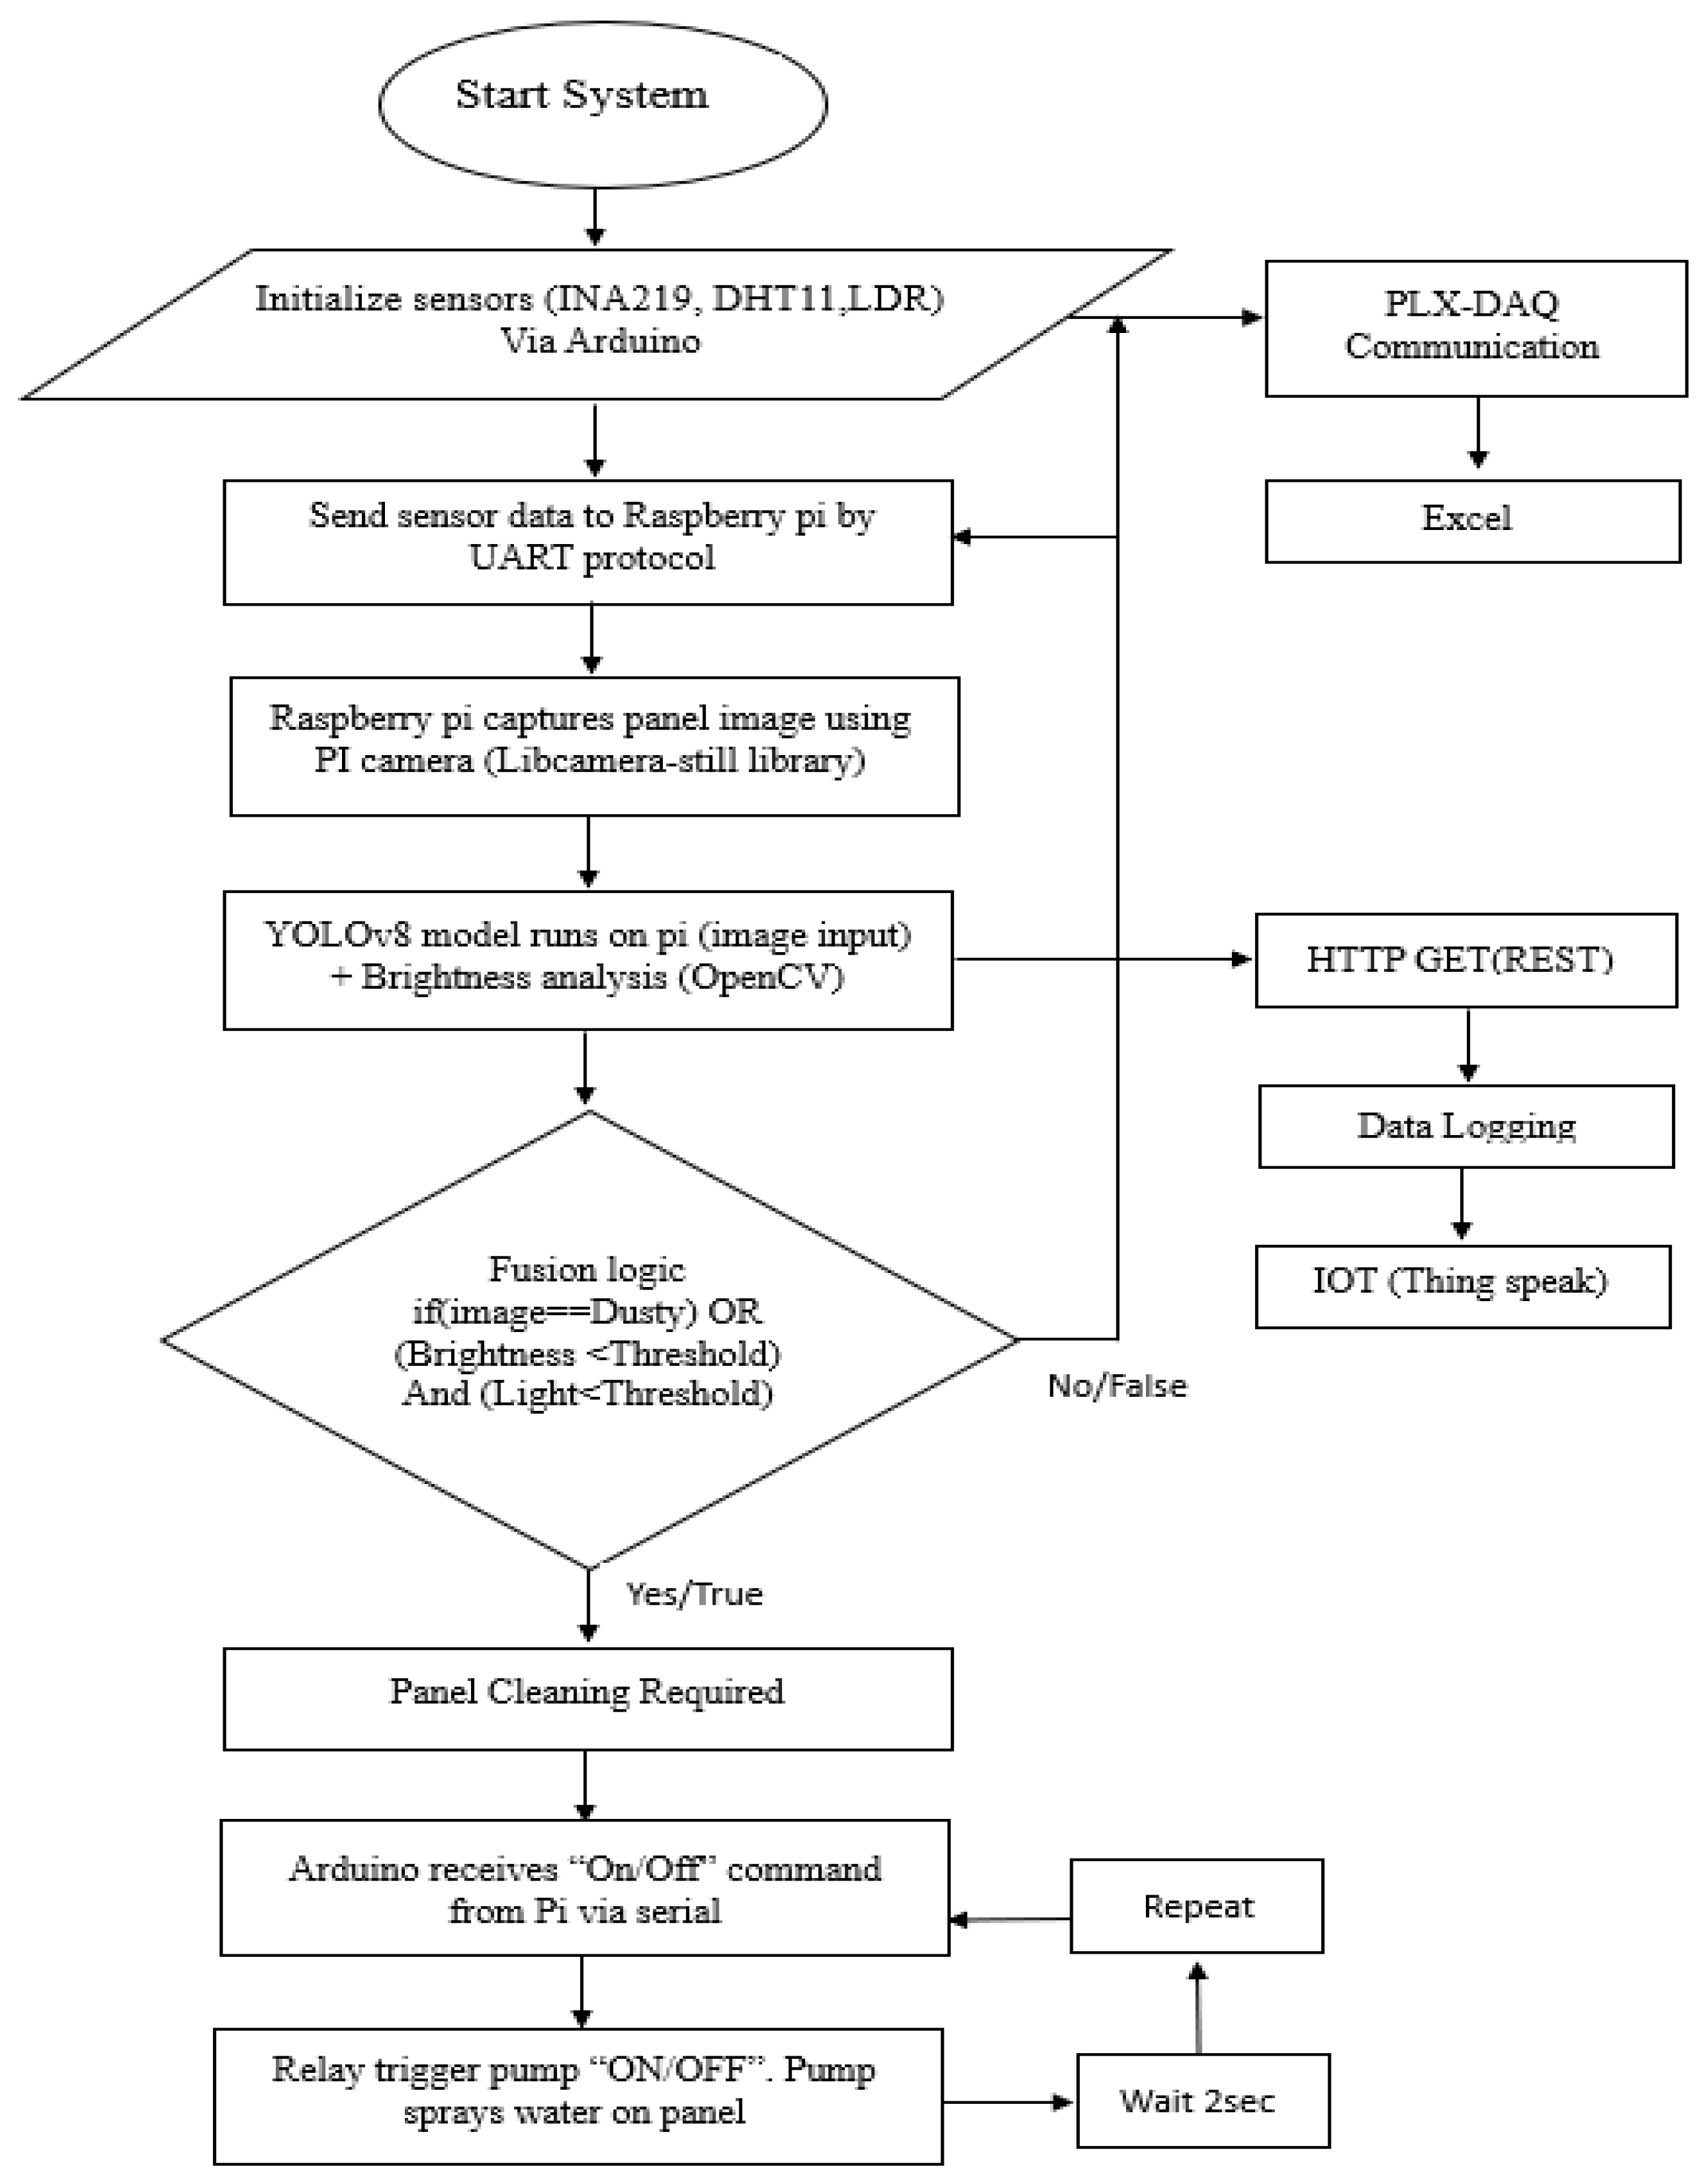
The flowchart illustrates the complete operational workflow of the proposed YOLO-integrated photovoltaic (PV) health monitoring and automated cleaning system. The process begins with the initialization of environmental and electrical sensors—namely, the INA219 (for voltage, current, and power), DHT11 (for temperature and humidity), and LDR (for light intensity)—all interfaced to the Arduino Uno. Once initialized, these sensors begin collecting real-time data from the solar panel environment and the connected electrical load (floodlight). This sensor data is simultaneously directed to PLX-DAQ macros in Microsoft Excel through serial communication, enabling live visualization and timestamped data logging during initial testing calibration phases.
The same sensor data is then transmitted via UART protocol to the Raspberry Pi Model B, which acts as the system’s edge processing unit. Concurrently, the Raspberry Pi captures real-time images of the solar panel using the Pi Camera, controlled by the libcamera-still command-line utility. The captured image is processed locally on the Pi using the YOLOv8 object detection model, and further analysed using OpenCV for brightness evaluation using thonny IDE in Real VNC viewer. This two-layered analysis provides both physical surface assessment and contextual lighting conditions, essential for accurate detection of dust accumulation or shading on the panel. Following the image and data acquisition, the fusion logic is applied, wherein the system checks whether the YOLO model identifies a “dusty” condition OR if the image’s brightness is below a specified threshold in conjunction with low LDR light readings. If the logic returns a negative result, the system continues monitoring and loops back after a short delay. However, if the logic confirms a dirty or low-performance panel, it proceeds to the cleaning stage.
At this point, the Raspberry Pi sends a control command ("ON" or "OFF") via serial interface to the Arduino, instructing it to activate the relay module. This relay energizes the submersible pump, which is powered independently by a battery pack and connected to a sprinkler system that sprays water on the solar panel surface. The system waits for two seconds to complete the cleaning action before resetting and returning to the monitoring state. Meanwhile, all relevant data—sensor values, brightness level, and panel status—is uploaded to ThingSpeak cloud using the HTTP GET (REST) protocol for real-time IoT-based monitoring and historical visualization. This integrated workflow enables intelligent, energy-aware, and automated panel cleaning based on multi-modal analysis, offering a significant improvement over traditional threshold-only or manually operated maintenance systems.
- D.
- Experimental Setup
Figure 14.
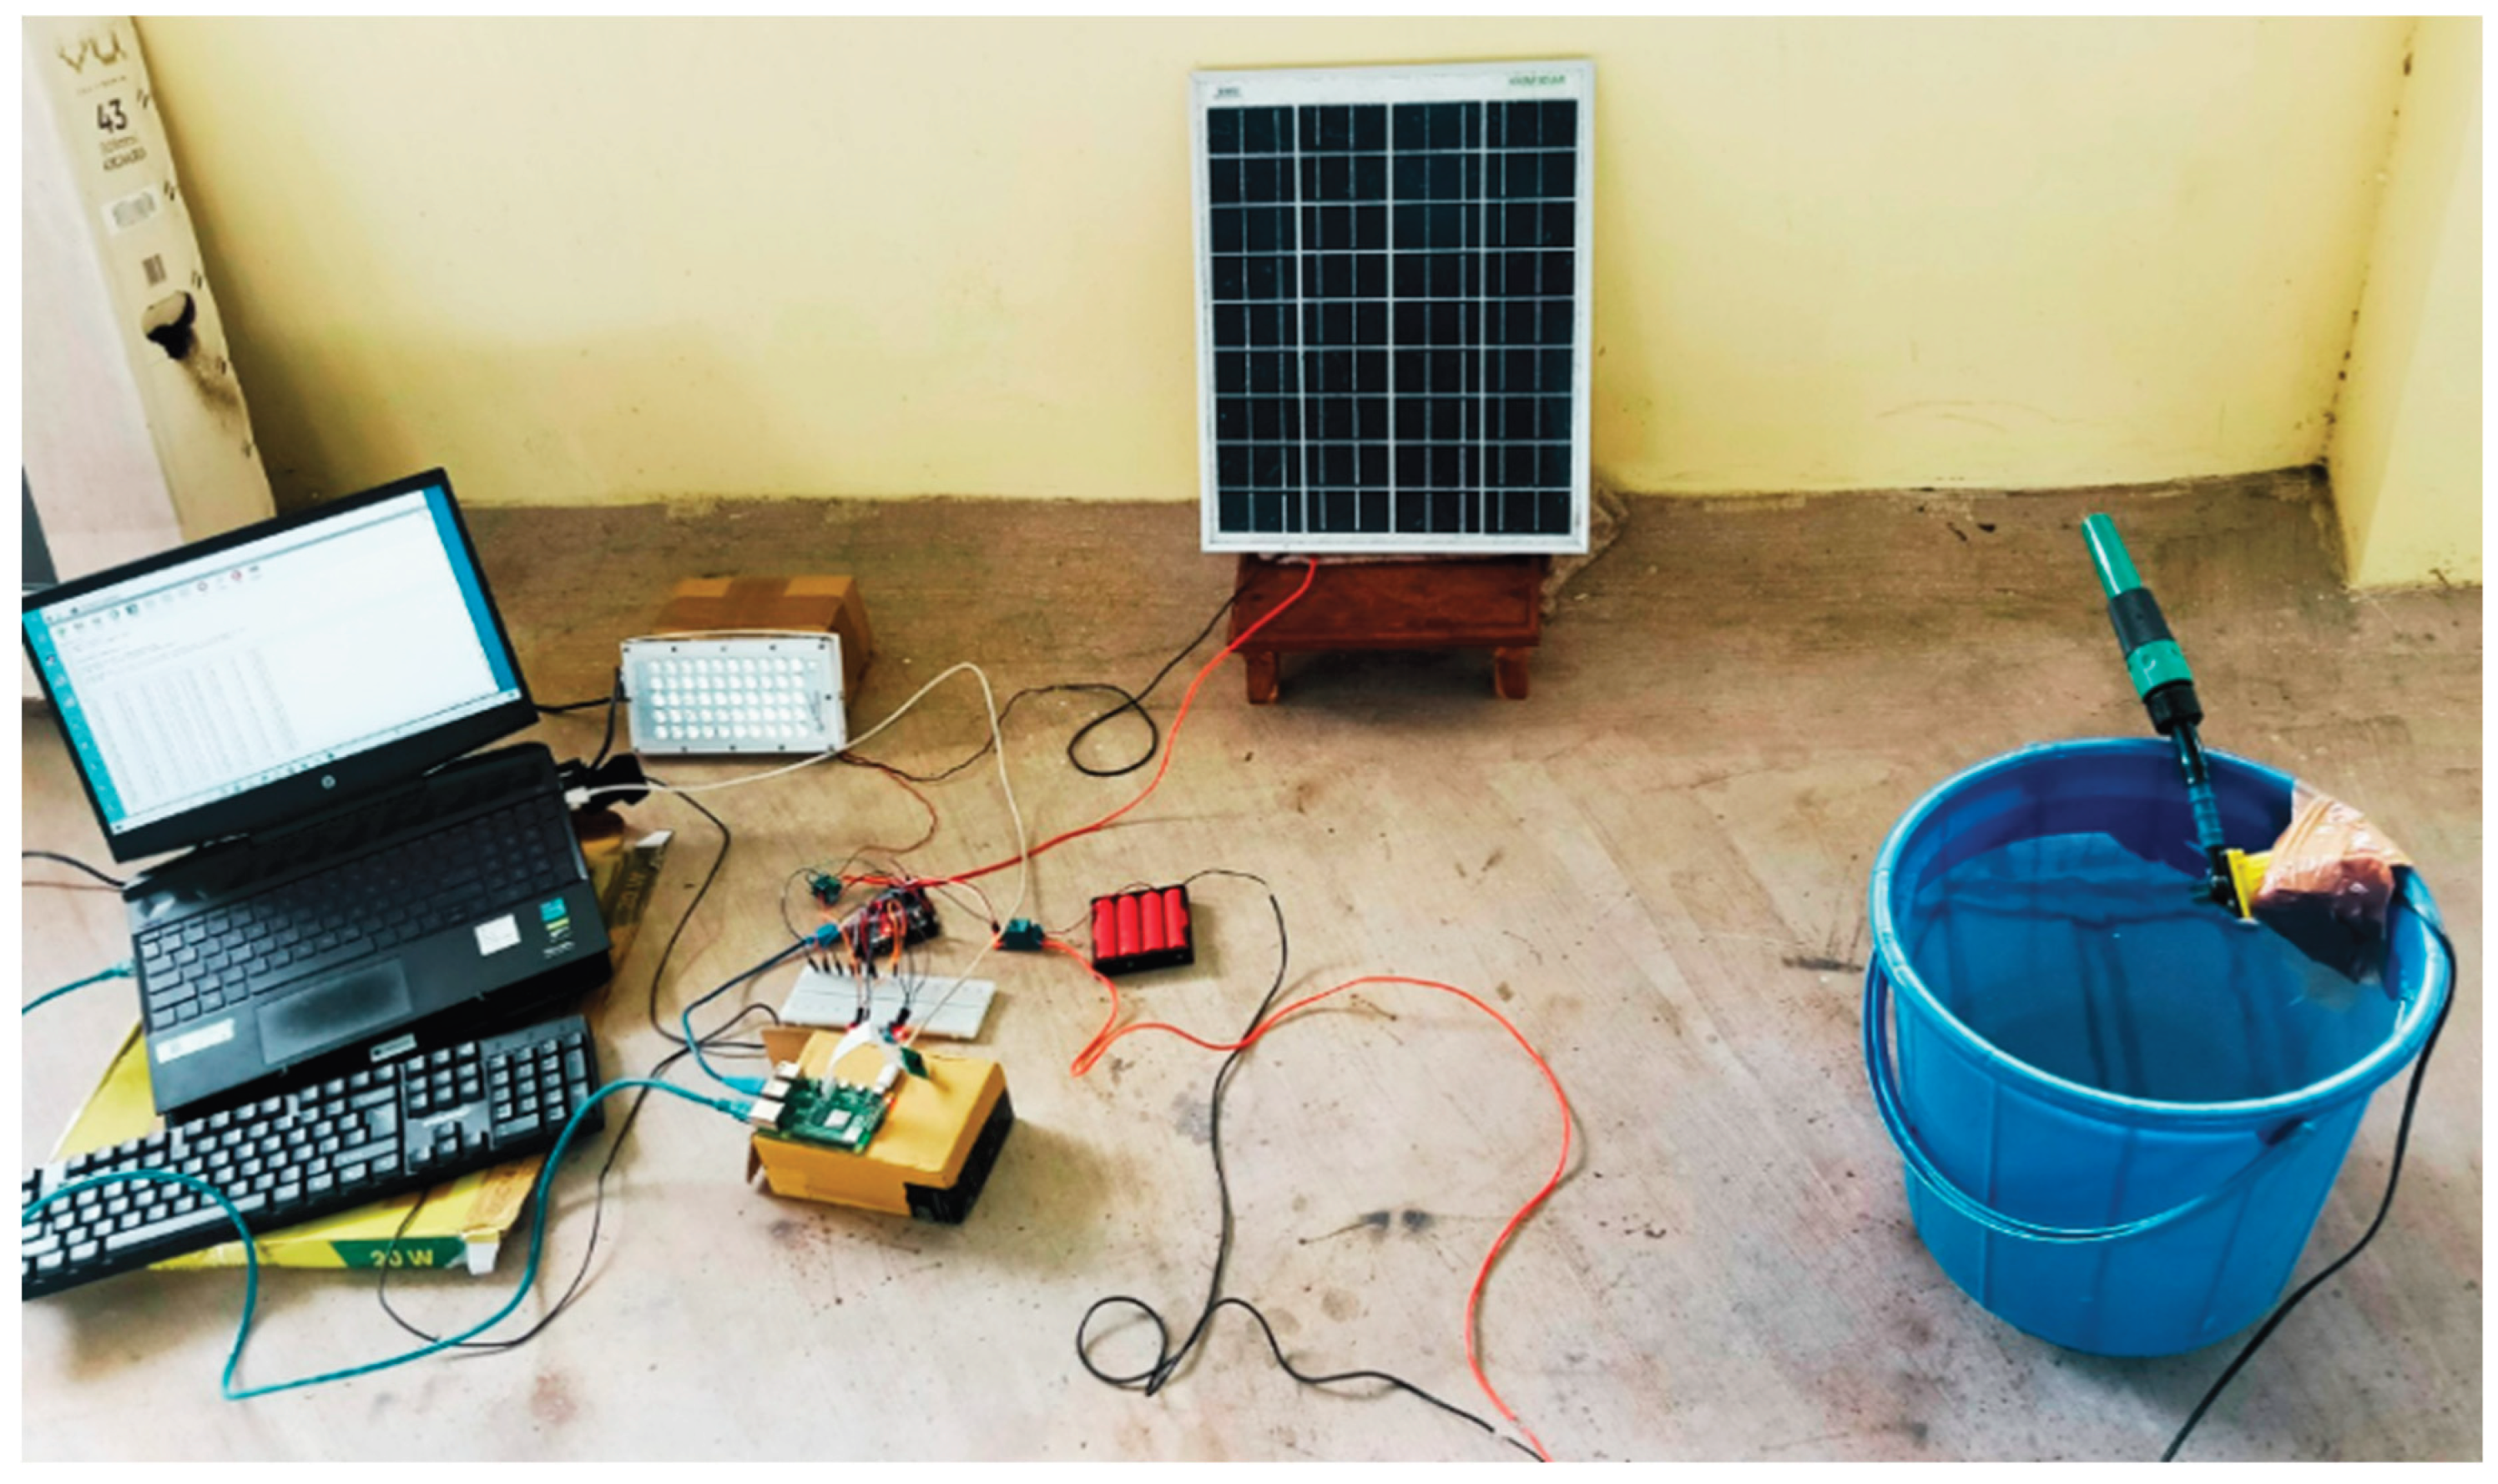
Experimental Setup for Arduino based hardware integration.
The experimental setup of the proposed system involves a comprehensive integration of environmental sensors, power monitoring modules, image capture hardware, automation controls, and cloud connectivity. The setup is divided into two interconnected subsystems: one based on the Arduino Uno for real-time data acquisition and control, and another based on the Raspberry Pi Model B for image processing, decision-making, and IoT communication.
In the Arduino subsystem, the following hardware connections are established: a DHT11 sensor is connected to a digital pin to measure temperature and humidity, an LDR is connected to the analog pin (A0) to sense ambient light intensity, and the INA219 current and voltage sensor is interfaced via I²C protocol to monitor the power output from a 20W solar panel supplying a 12V floodlight as load. These sensors are powered via the Arduino’s 5V and GND pins, and the entire board is initially connected to a laptop for serial communication and code uploading through the Arduino IDE. A 1-channel 5V relay module is connected to a digital output pin of the Arduino and used to control a DC submersible pump. This pump is powered by an external 4-cell 3.7V lithium battery pack, ensuring that its high-current operation is isolated from the sensor and control circuitry. The relay activation is governed by the Arduino based on the threshold conditions defined in the program logic, including low light, high humidity, and poor panel output.
Figure 15.
Block diagram of IoT based system with raspberry and cloud link.
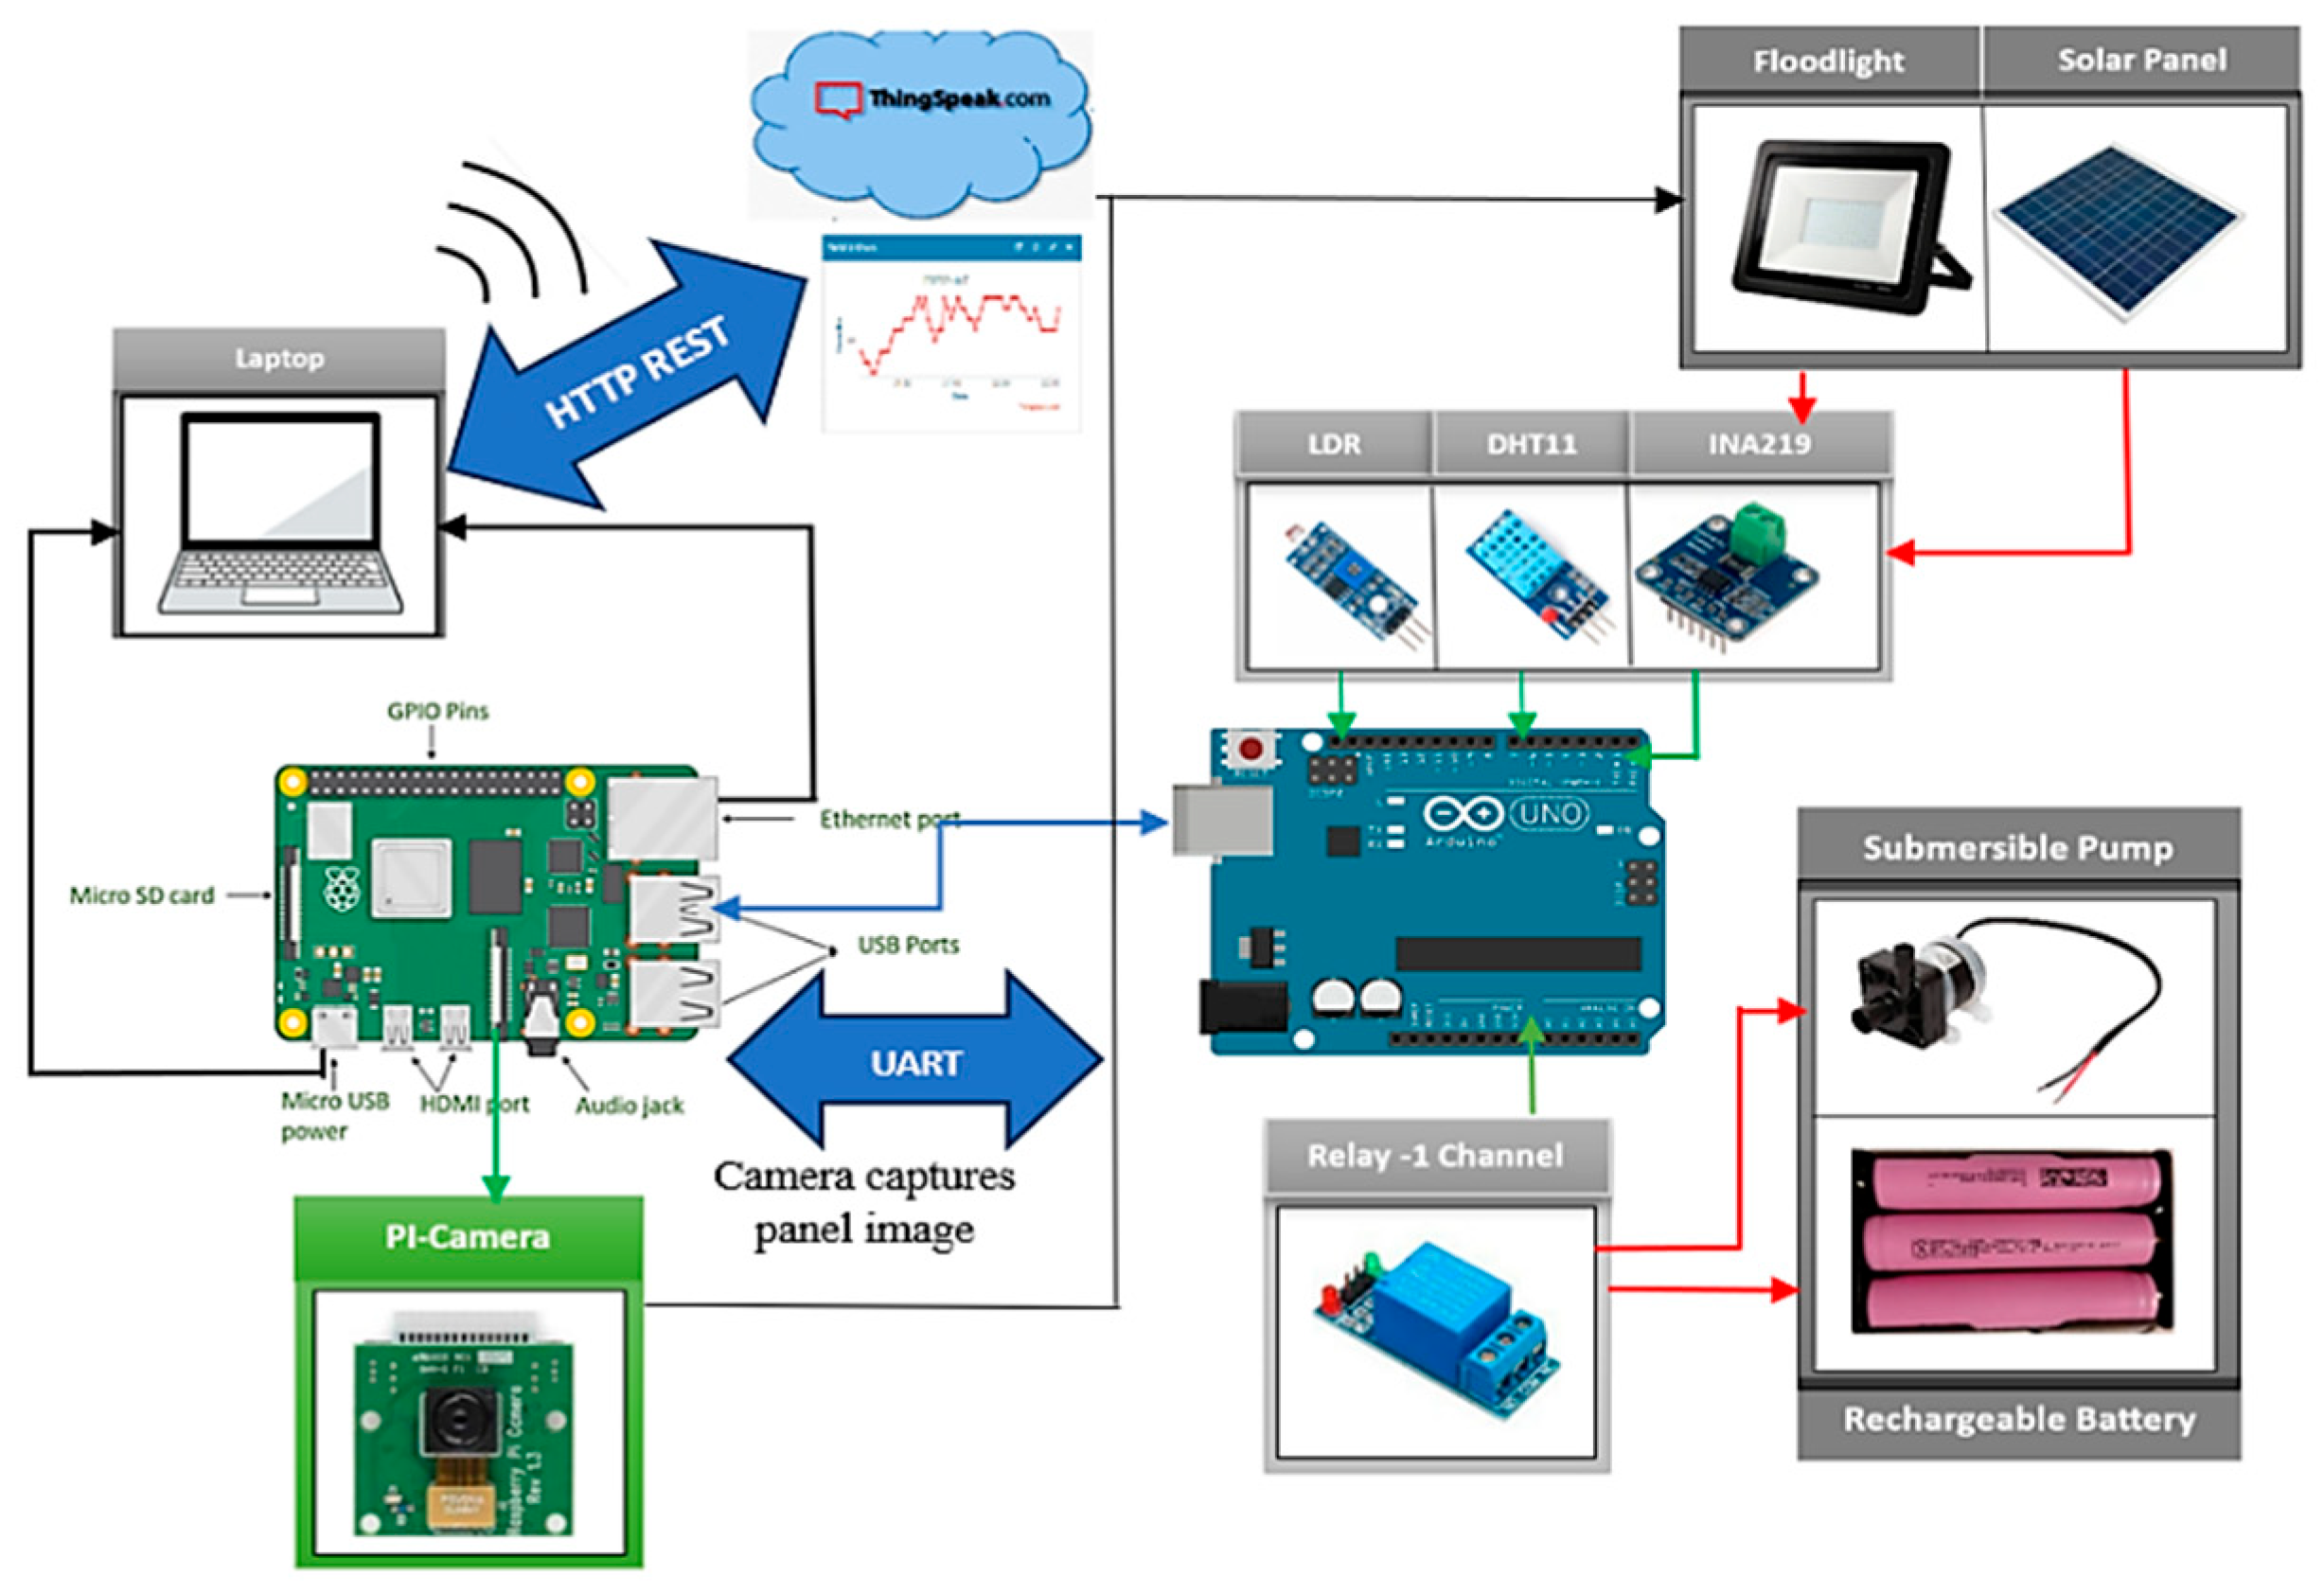
The second subsystem involves Raspberry Pi Model B connection to the Arduino via UART (USB serial communication) and operates as the decision-making and cloud communication node. A Pi Camera module is connected to the Pi’s CSI interface and is used to capture live images of the solar panel at regular intervals using the libcamera-still command. These images are analyzed locally using OpenCV for brightness measurement and processed through a YOLOv8 object detection model to classify the panel condition. If the image indicates low clarity or detects potential dust, and the brightness or light level also falls below set thresholds, the Pi sends a command to the Arduino to trigger the relay and initiate the cleaning cycle.
Simultaneously, the Pi uploads all processed sensor data and image-derived brightness values to the ThingSpeak IoT cloud using HTTP GET (REST) API calls, enabling real-time online visualization of system parameters like temperature, humidity, brightness, voltage, current, and power. The Raspberry Pi is powered through its micro-USB port from the laptop and connected to the internet via Ethernet for stable cloud transmission. The laptop also serves as a remote interface via RealVNC, allowing users to access the Pi’s desktop environment, monitor logs, and visualize the processing pipeline live. This complete experimental setup replicates a real-world edge-enabled IoT environment, demonstrating autonomous decision-making for solar panel maintenance based on multi-modal data fusion. The circuit was tested under varying light conditions using both real solar exposure and artificial lighting, and the relay-actuated cleaning system was validated using a functional submersible pump and water spray mechanism, confirming the feasibility of the proposed intelligent PV maintenance framework.
- E.
- Hardware Installation
- Arduino uno microcontroller setup: Powered via USB port from laptop during programming and via Raspberry Pi during real-time execution which serves as the central unit for interfacing sensors and controlling the relay.
- DHT11 Temperature and humidity sensor: VCC pin connected to 5V pin of Arduino followed by GND pin and DATA pin connected to GND and digital pin D8 of the Arduino microcontroller.
- LDR light sensor: The VCC, GND and analog pin A0 of the light sensor is connected to 5V, GND and A0 of the Arduino.
- INA219 Voltage-current sensor: The VCC pin of the sensor is connected to 5V on Arduino followed by the connection of GND pin to GND of Arduino. Corresponding SDA and SCL pins connected to A4 (SDA) and A5 (SCL) of Arduino for I²C communication. Vin+ and Vin− terminals connected in series between solar panel and floodlight (load) for power measurement.
- Floodlight (12V Load): The positive terminal of the floodlight load is connected to Vin+ of INA219 with its corresponding negative Vin− terminal connection to solar panel negative output. This Acts as real-time load to simulate energy consumption.
- Solar panel (20W,12V): The positive output connected to INA219 Vin+ terminal. Negative output connected to GND/common of system and INA219 Vin− thus enhancing provision for power and serves as the surface for cleaning and analysis.
- Relay Module (1-Channel, 5V): The module VCC is connected to 5V on microcontroller followed by the connection of GND and digital signal pin to GND and digital pin D3 of the Arduino. The COM and NO (Normally opened) terminals connected to positive terminal of submersible pump circuit.
- Submersible pump: - The pump is powered by separate 4 × 3.7V Li-ion battery pack where the positive terminal of battery connected to the COM of the relay. The NO terminal connected to pump positive wire. Pump GND wire connected directly to battery GND with 1N4007 diode placed across the relay and pump terminals to prevent back-EMF.
- Raspberry Pi Model B(4GB) : The board is powered using micro-USB from laptop or external adapter which is connected to Arduino via USB cable for serial UART communication. The former is also Connected to laptop or router via Ethernet cable for internet access and ThingSpeak connectivity.
- Pi camera Module: The pi camera setup connected to CSI port of Raspberry Pi witch use libcamera-still command for capturing static images. The camera is mounted to face solar panel for real-time image capture.
- VM Elite 64GB Micro SD card: Inserted into Raspberry Pi to boot Raspberry Pi OS which Stores Python scripts, YOLOv8 model, OpenCV packages, and log files.
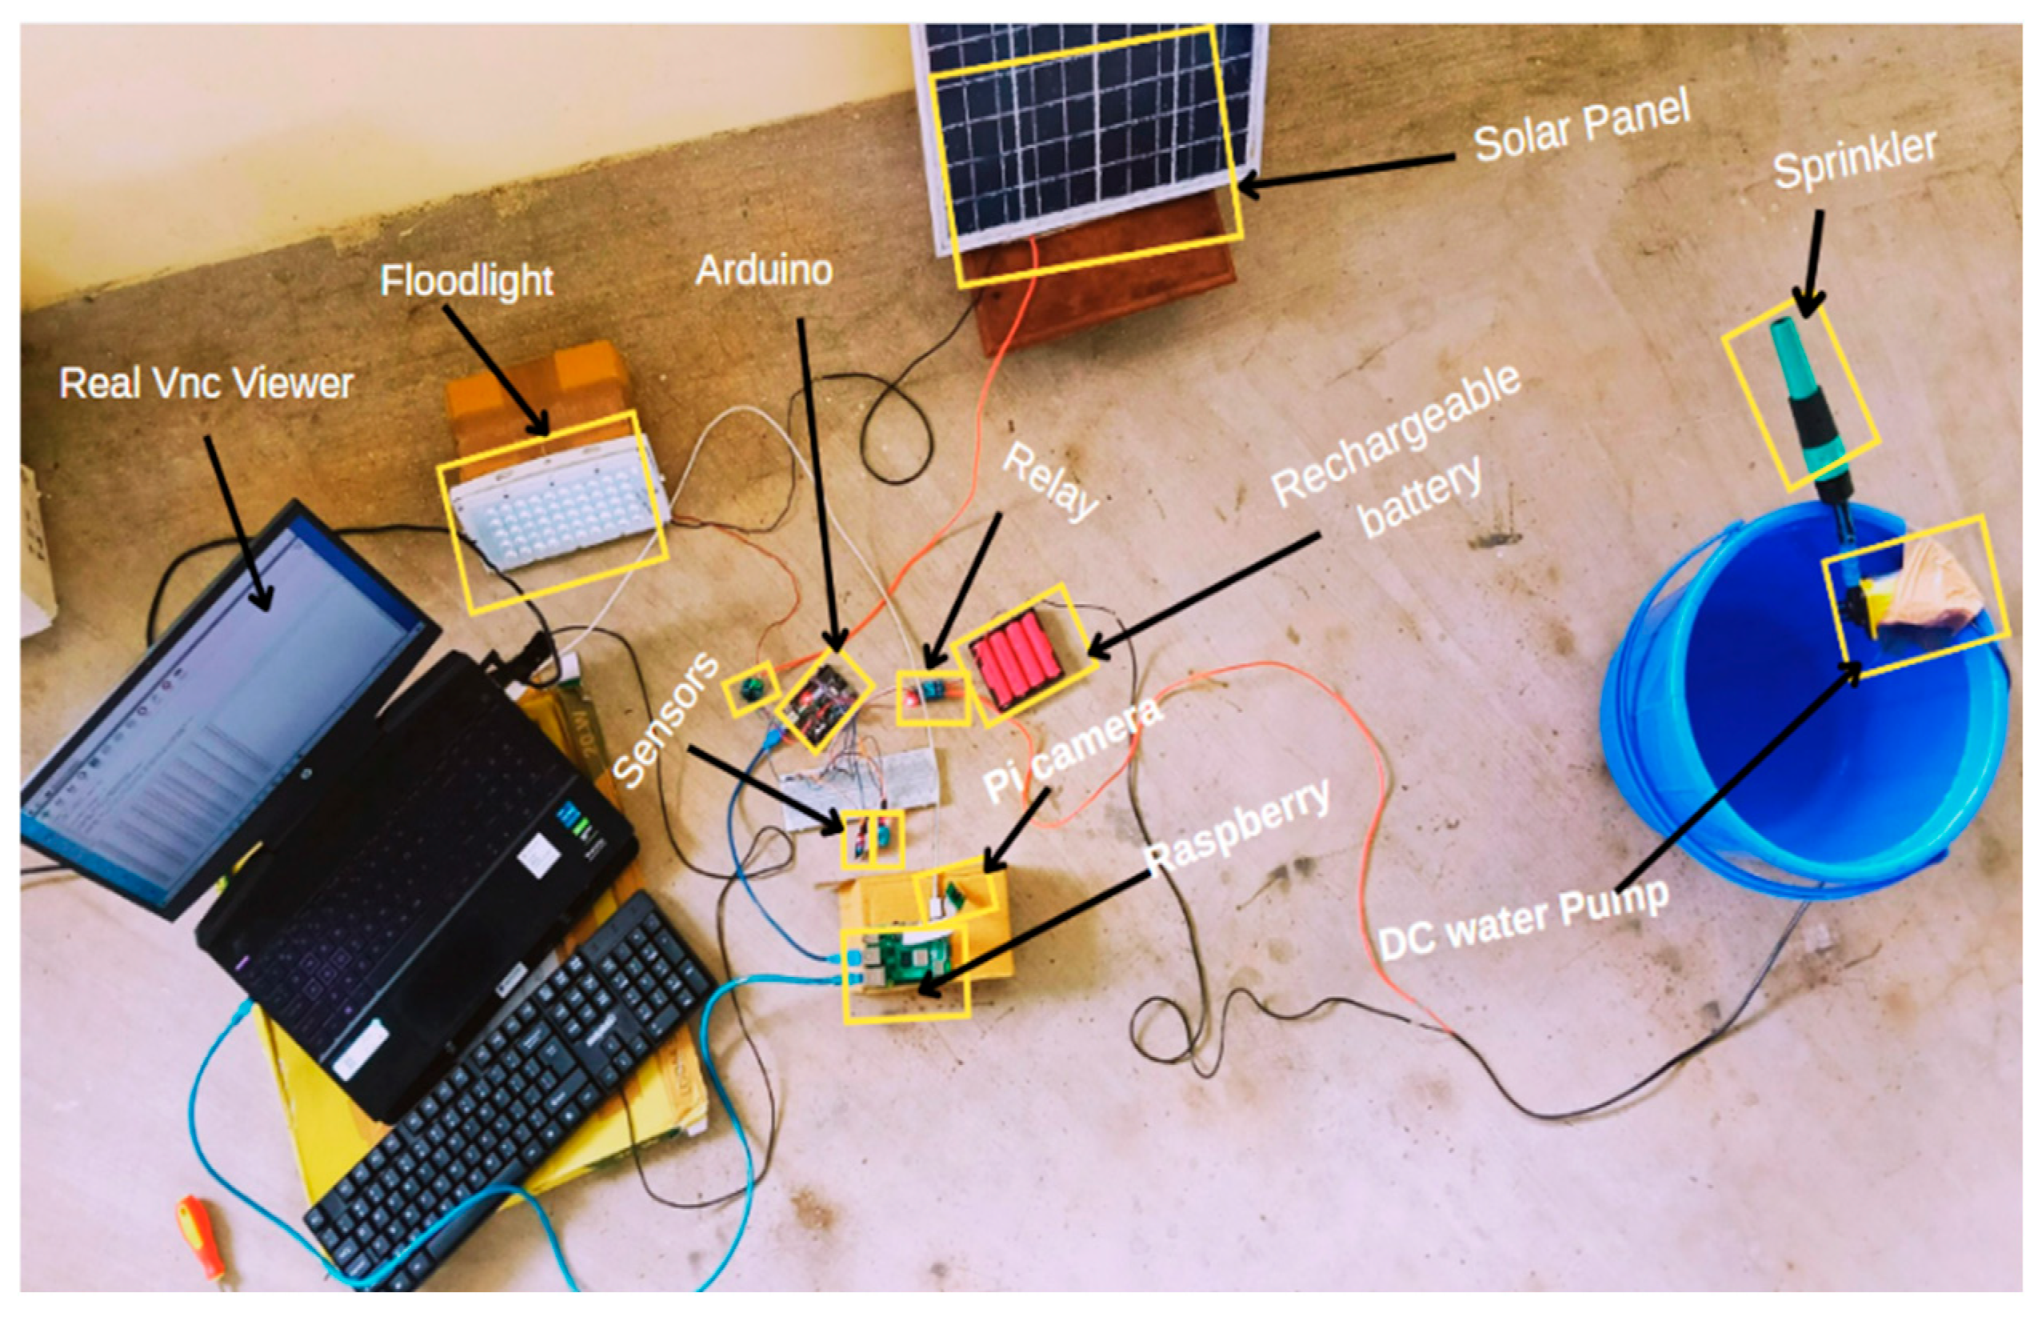
Figure 16.
Labeled hardware setup showing complete system components.
- F.
- Software Setup
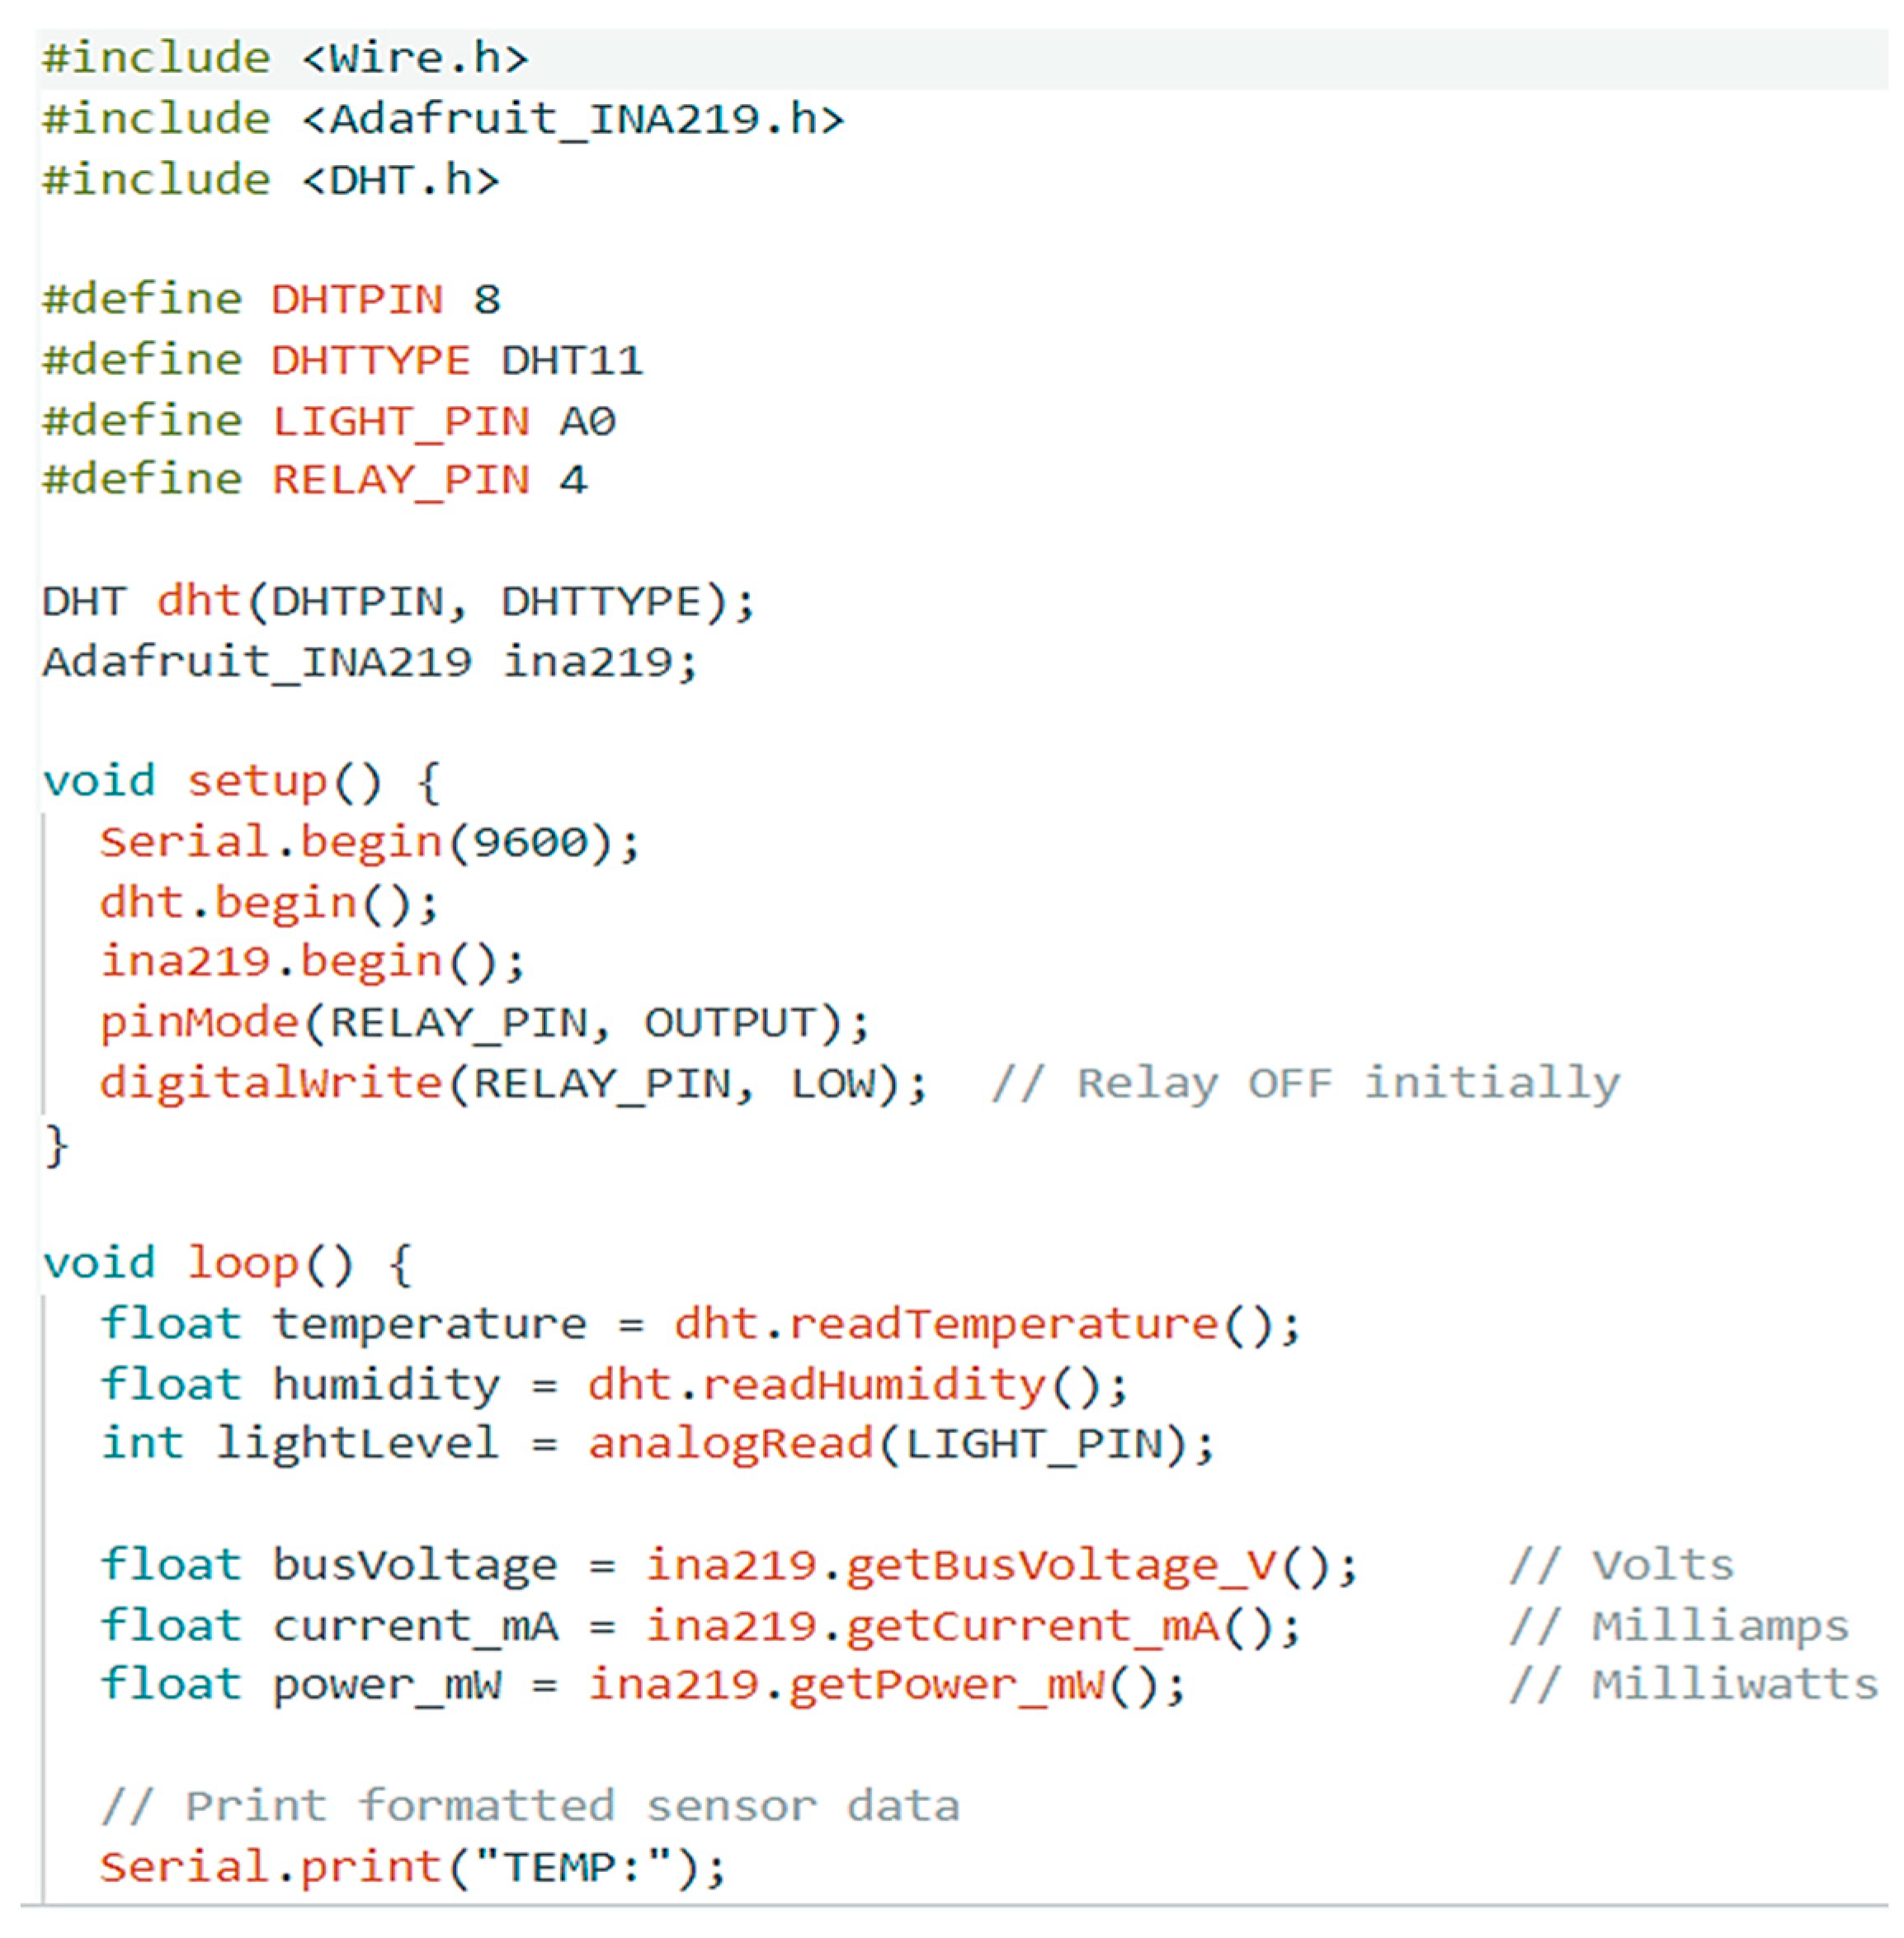
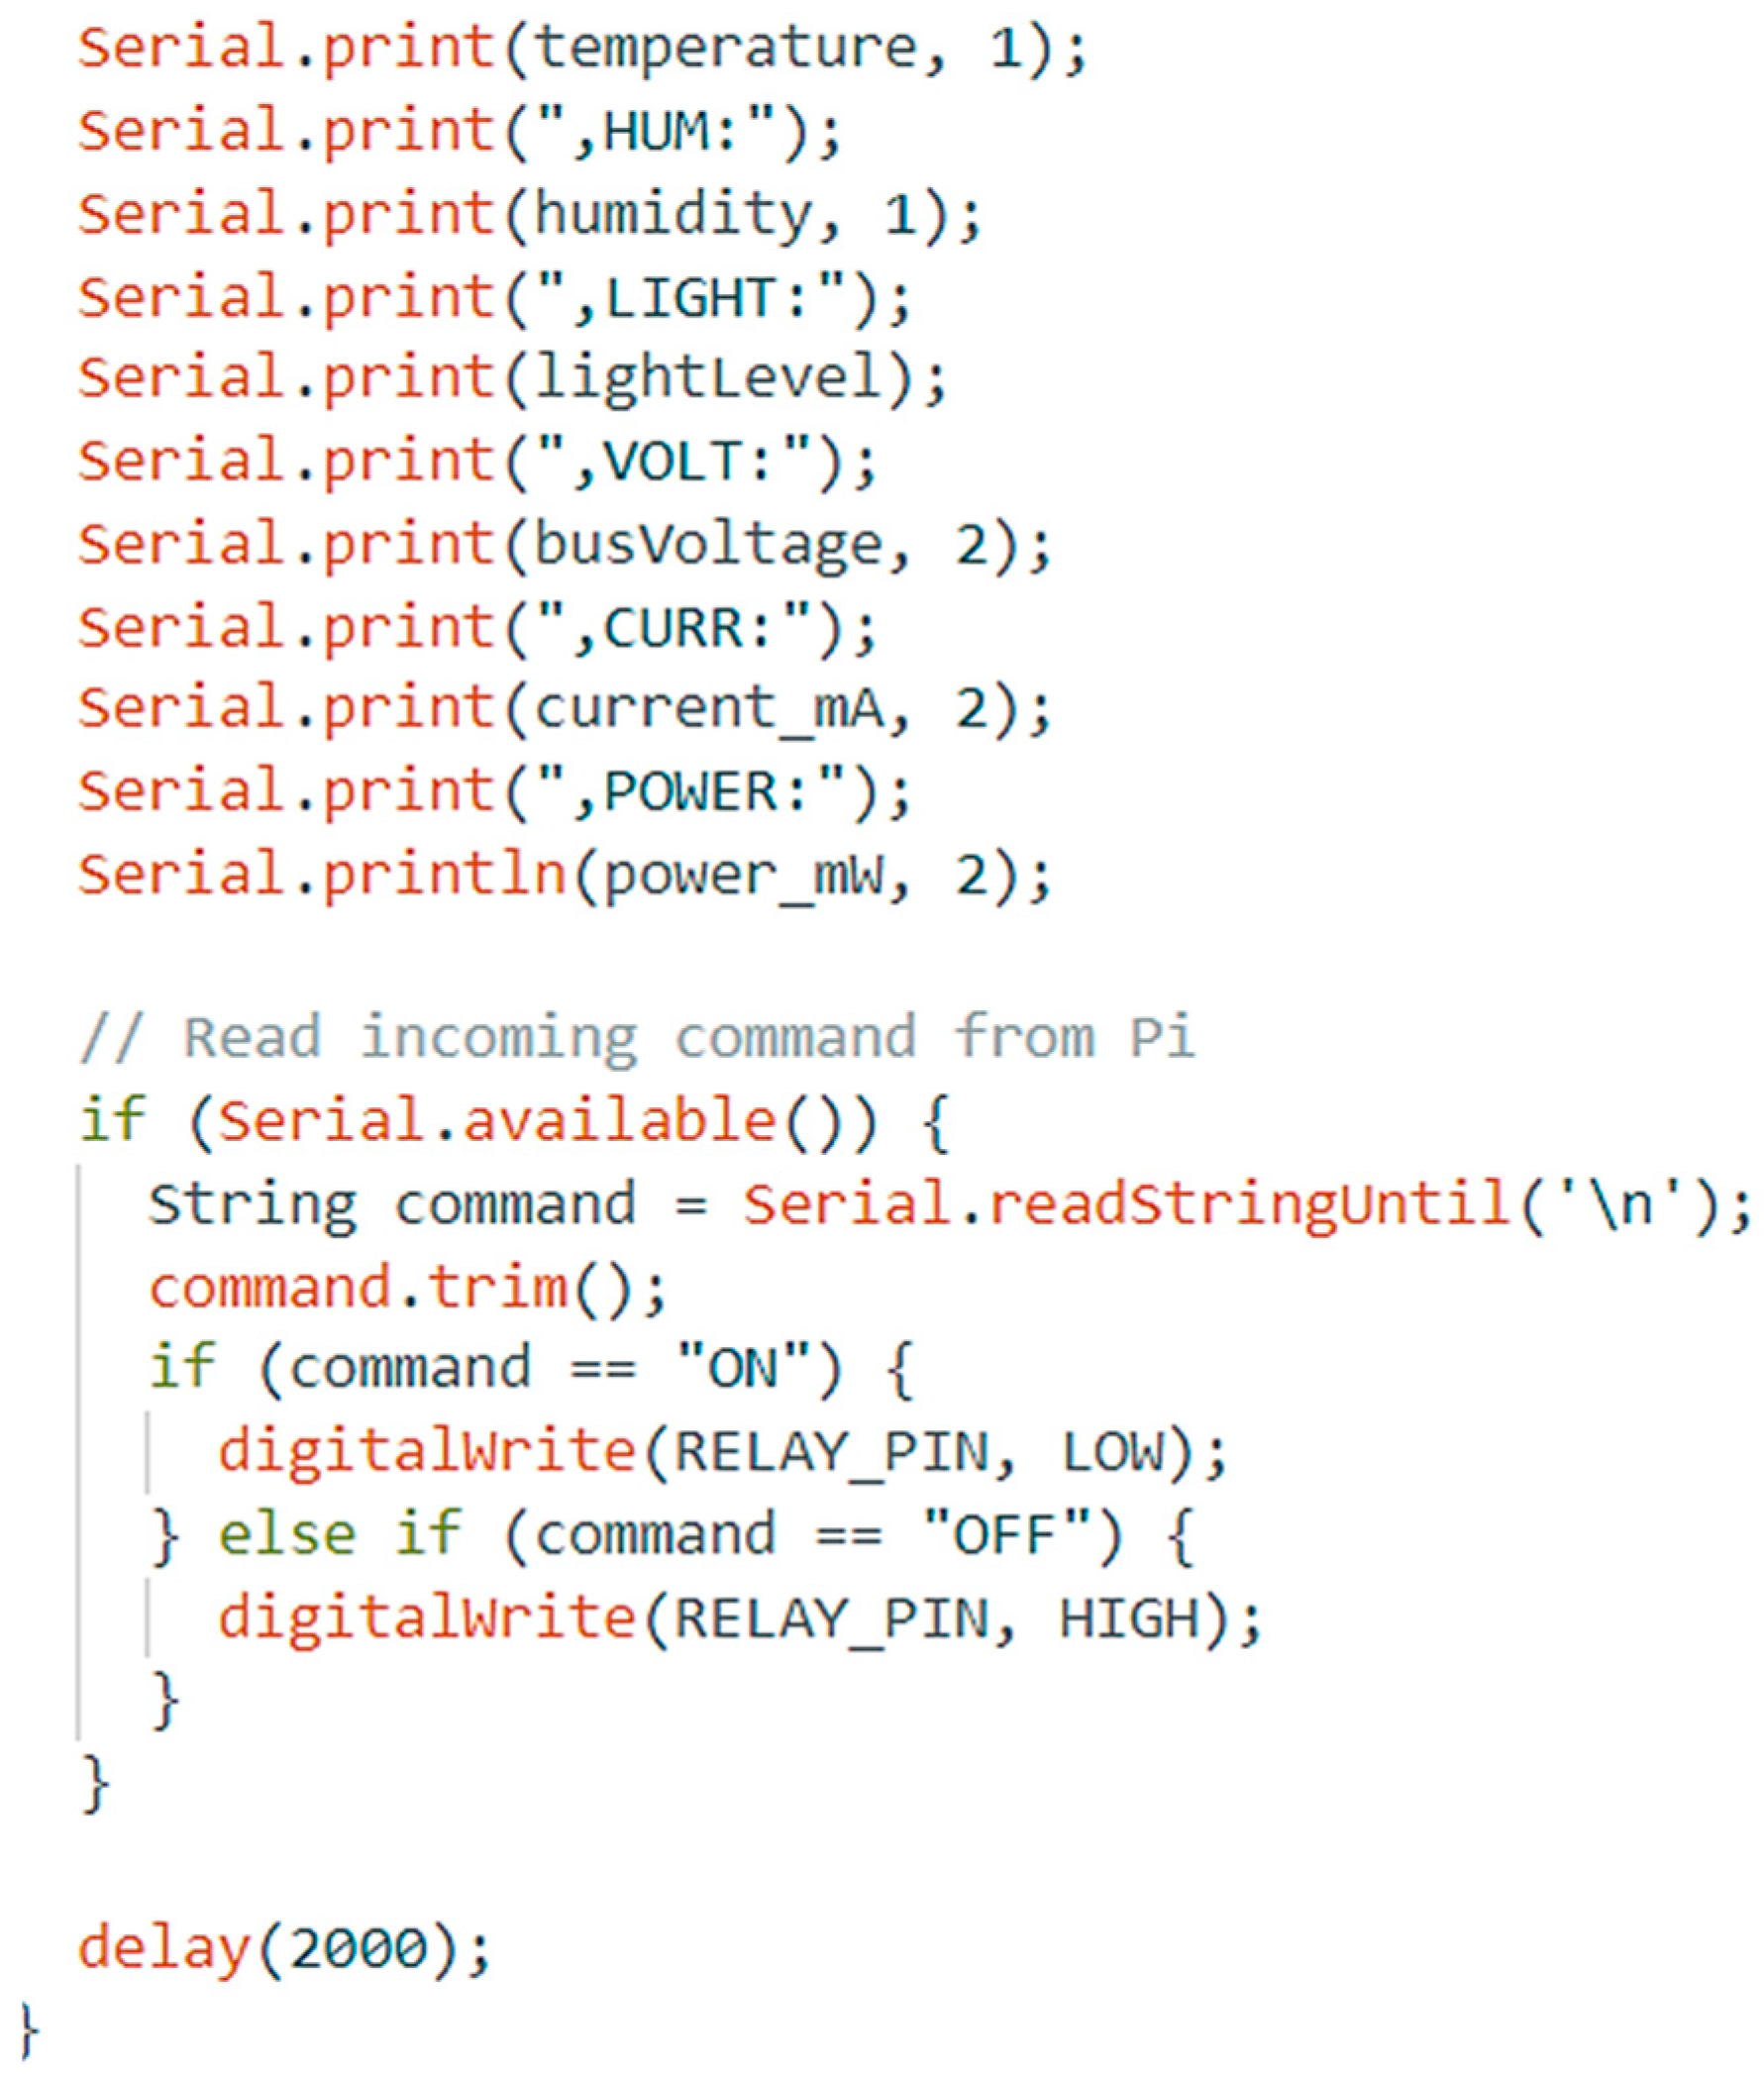
The software setup of the proposed system includes multiple tools and platforms for programming, data acquisition, edge processing, and cloud communication. The Arduino Uno is programmed using the Arduino IDE, where C/C++ code is developed for reading sensor data (DHT11, LDR, INA219), applying threshold logic, and controlling the relay. Necessary sensor libraries such as DHT.h and Adafruit_INA219.h are imported to enable I²C and digital sensor interfacing. Serial communication is configured at 9600 baud rate to enable UART-based data exchange with the Raspberry Pi.
The Arduino IDE integration for programming, sensor interfacing, data collecting, and automation control is the main component of the project's software configuration. The Arduino Integrated Development Environment (IDE) is used to program the Arduino Uno microcontroller. A condensed form of C/C++ is used to write the source code. The IDE offers an easy-to-use interface for USB code uploading to the board. The code includes libraries like Wire.h, Adafruit_INA219.h, DHT.h, and LiquidCrystal.h (if an LCD is used) to handle I2C communication and the corresponding sensor modules. Adafruit_INA219.h reads the current, voltage, and power values from the INA219 module, and the DHT.h library gathers temperature and humidity data from the DHT11 sensor. The analogRead () function is used to read the values from the LDR sensor, which is interfaced via analog pins. The code pre-defines threshold values for temperature, humidity, and light intensity. To decide whether to trigger the relay, these thresholds are employed.
| Algorithm 1. Arduino sensor code for relay activation in IDE. |
 |
 |
On the Raspberry Pi, the code is written and executed using Python 3, managed via the Thonny IDE or terminal. Libraries such as OpenCV-python, ultralytics (for YOLOv8), pyserial, NumPy, and requests are installed using pip. The YOLOv8 model (yolov8n.pt) is run on the Pi using the Ultralytics library for real-time inference on captured images. The Pi Camera is accessed via the libcamera-still command to capture solar panel images, which are then processed using OpenCV for brightness estimation. For cloud integration, the Raspberry Pi communicates with ThingSpeak using HTTP GET (REST) API calls. A user-specific API key is used to upload environmental and power data to predefined fields for live visualization. Additionally, the Arduino is initially tested using PLX-DAQ macros in Excel, which log timestamped sensor data during development. Remote access to the Raspberry Pi's GUI and terminal is achieved through RealVNC, allowing real-time debugging, image inspection, and system control without physical access.
Figure 17.
Serial link between raspberry pi and arduino via thonny and Real VNC.
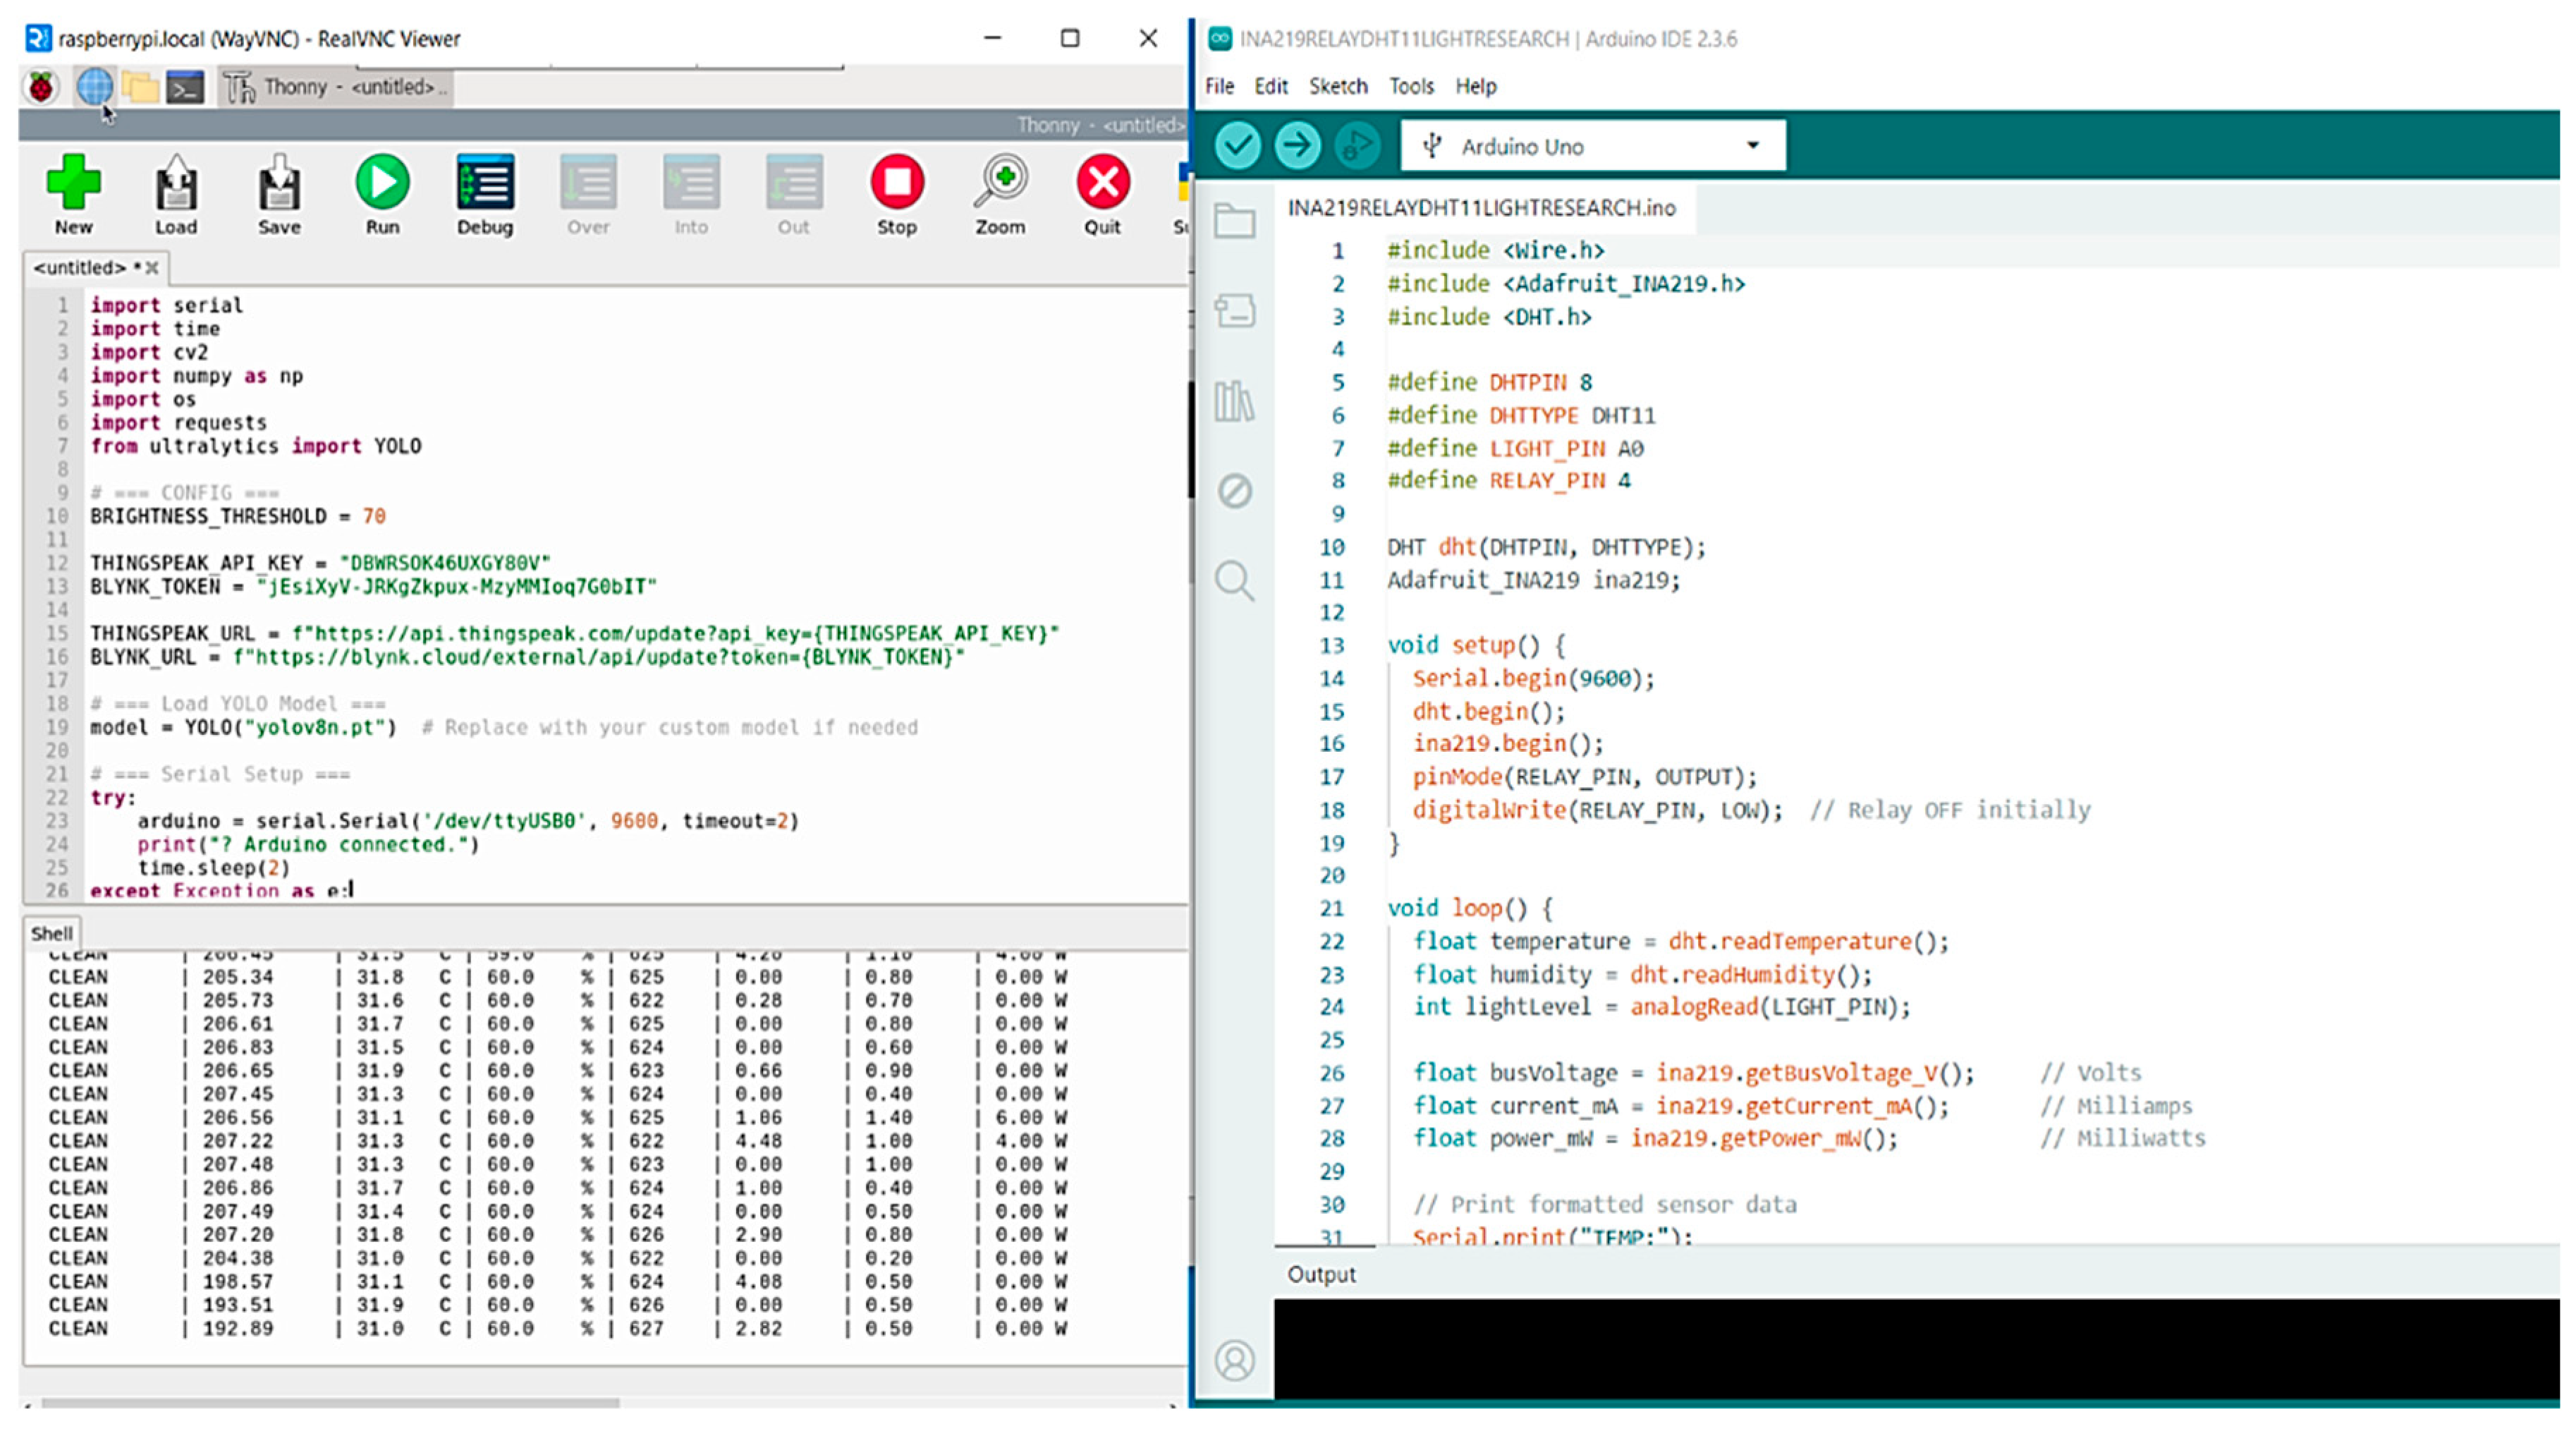
The entire software system is loaded onto a VM Elite 64GB microSD card, which boots the Pi OS and hosts all necessary files, scripts, and libraries. Together, this software setup enables seamless integration of hardware and software layers, supporting intelligent decision-making and fully autonomous operation
Figure 18.
Live sensor and YOLO status output on raspberry pi terminal.
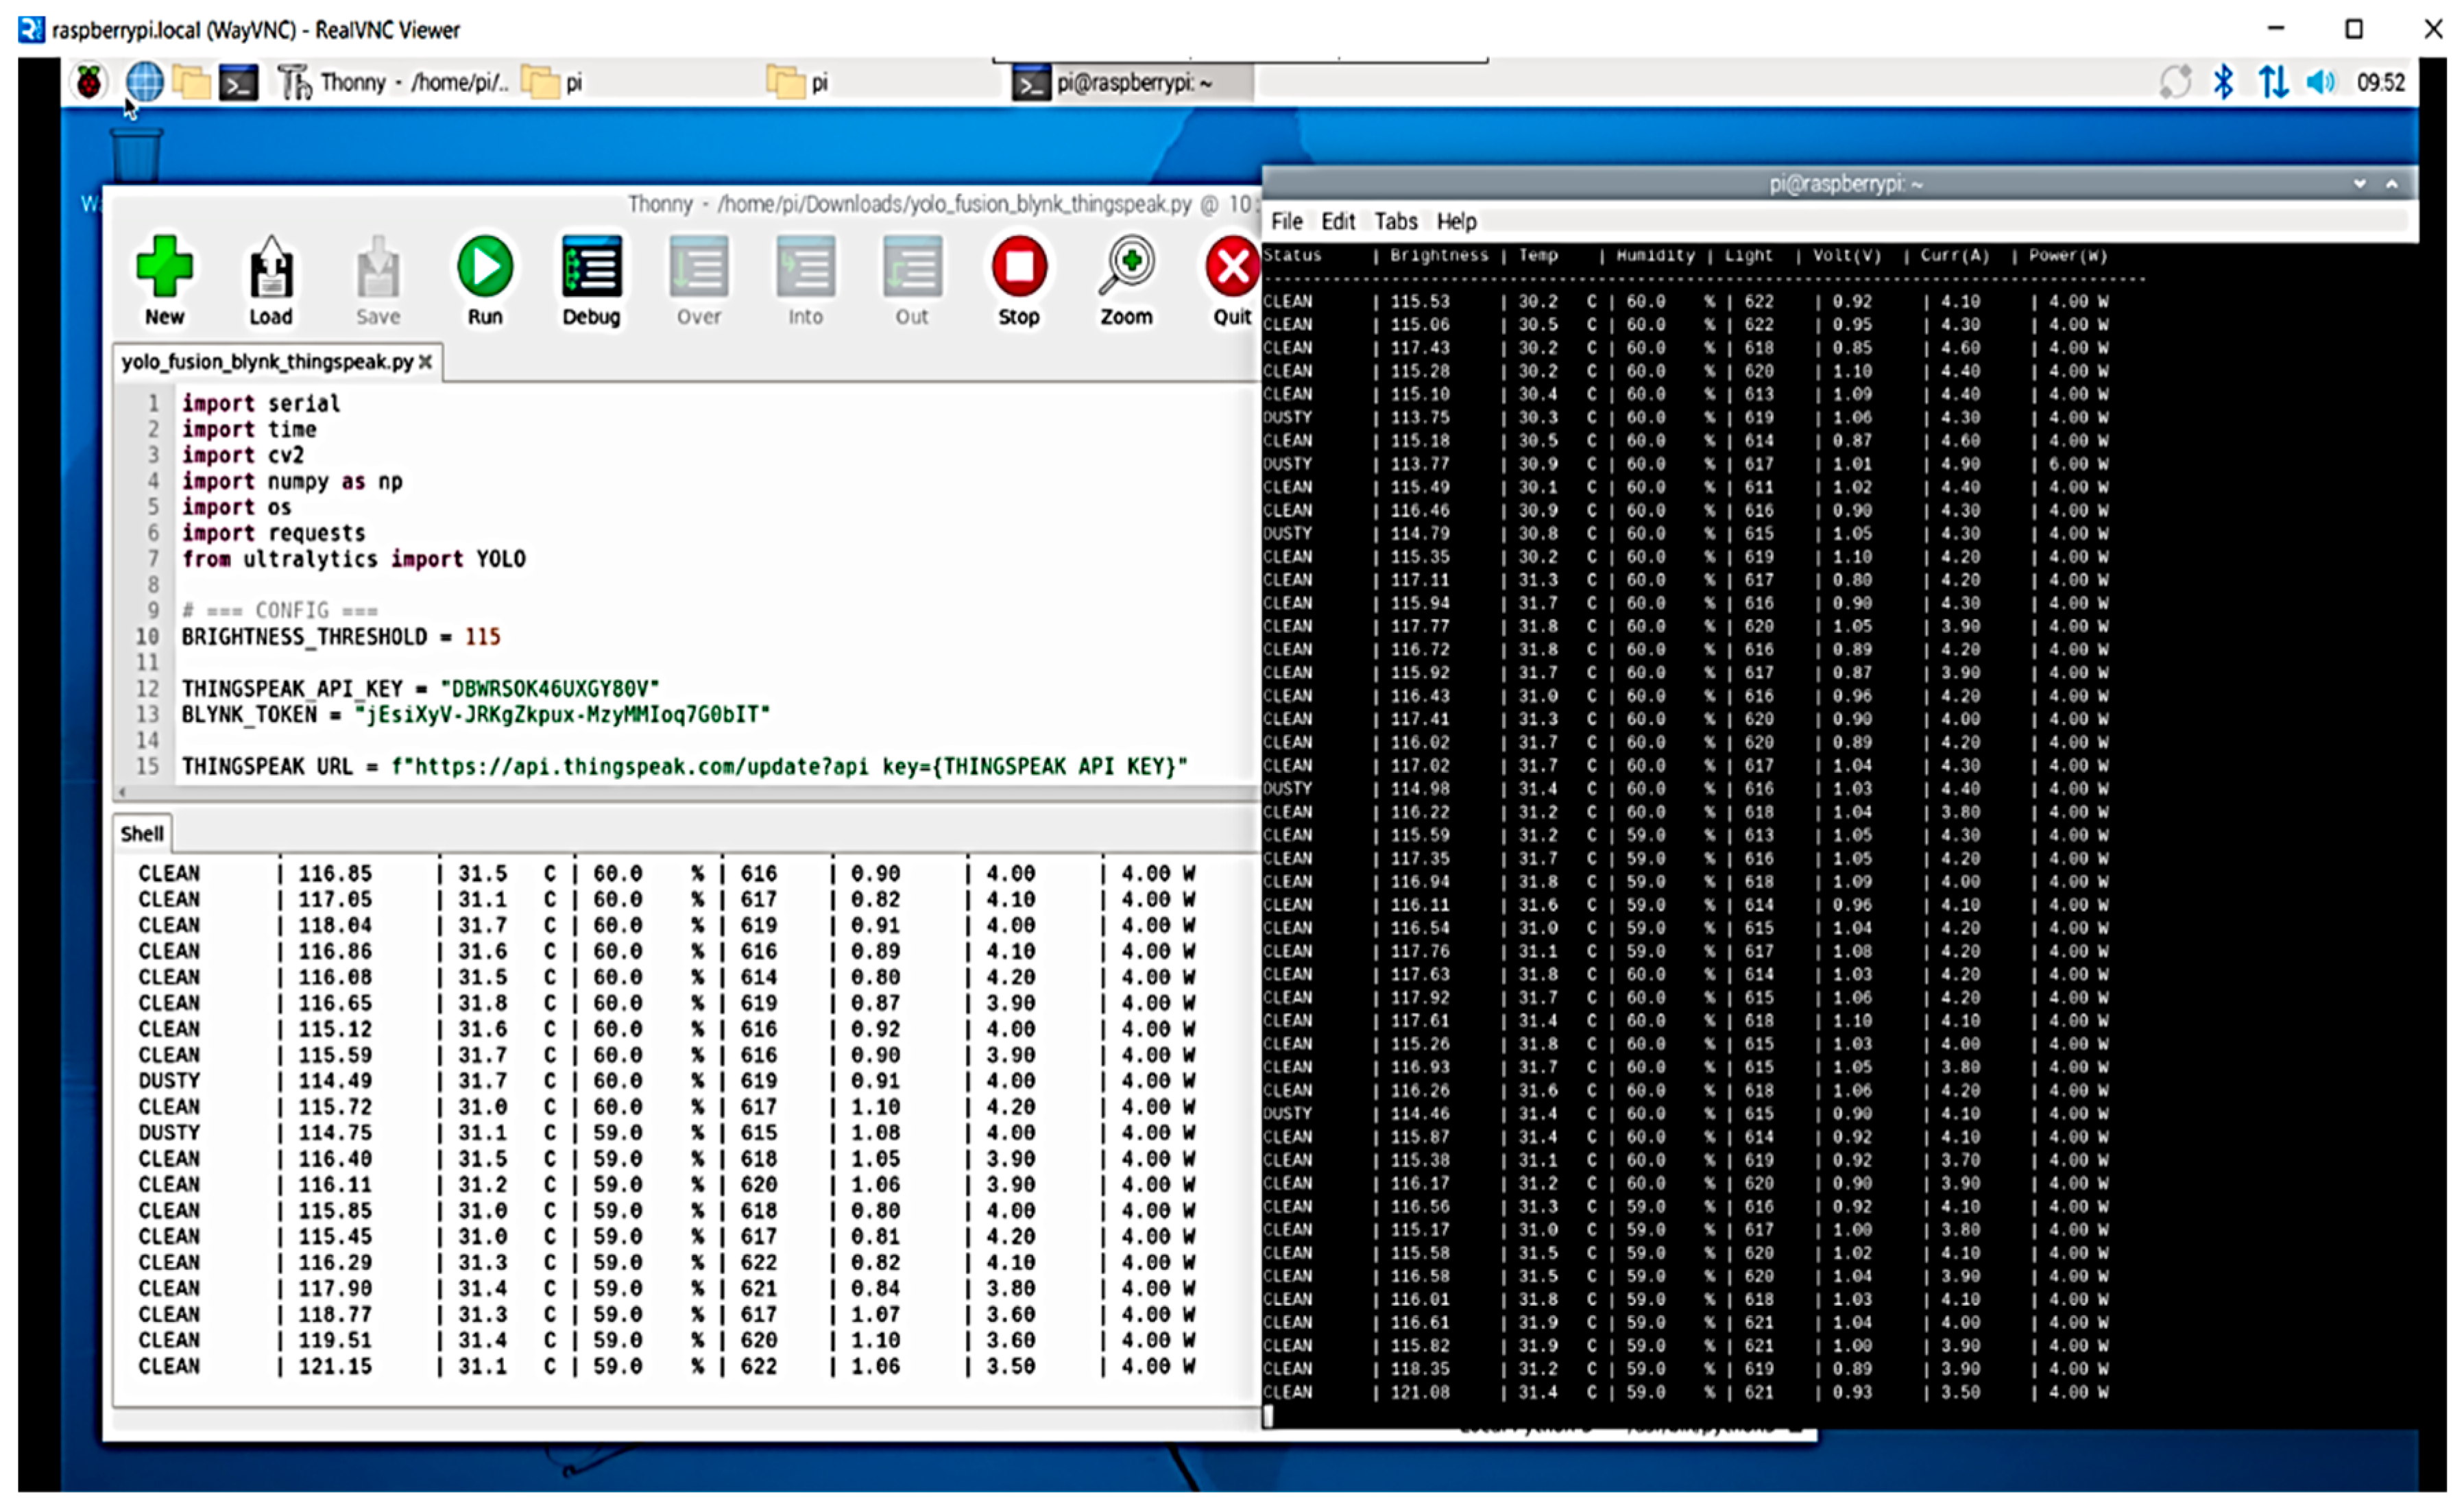
The robust data logging tool PLX-DAQ (Parallax Data Acquisition) was created by Parallax Inc. and allows direct serial communication between a microcontroller board, like an Arduino, and Microsoft Excel. It is a VBA-written Excel macro that opens a computer's serial port and records data in real time into Excel spreadsheets. This enables users to continuously monitor, capture, and evaluate data from linked sensors or devices. In order to enable real-time data collection and sensor value tracking, PLX DAQ serves as a bridge between the Arduino Uno and Microsoft Excel. Using Serial.println() commands, the data gathered from the DHT11 (temperature and humidity), LDR (light intensity), and INA219 (voltage, current, and power) sensors is continuously sent over the Arduino's serial port. This serial stream is captured by PLX-DAQ, which then directly enters it into designated Excel spreadsheet columns.
Figure 19.
Real-time Arduino sensor plotting in IDE.
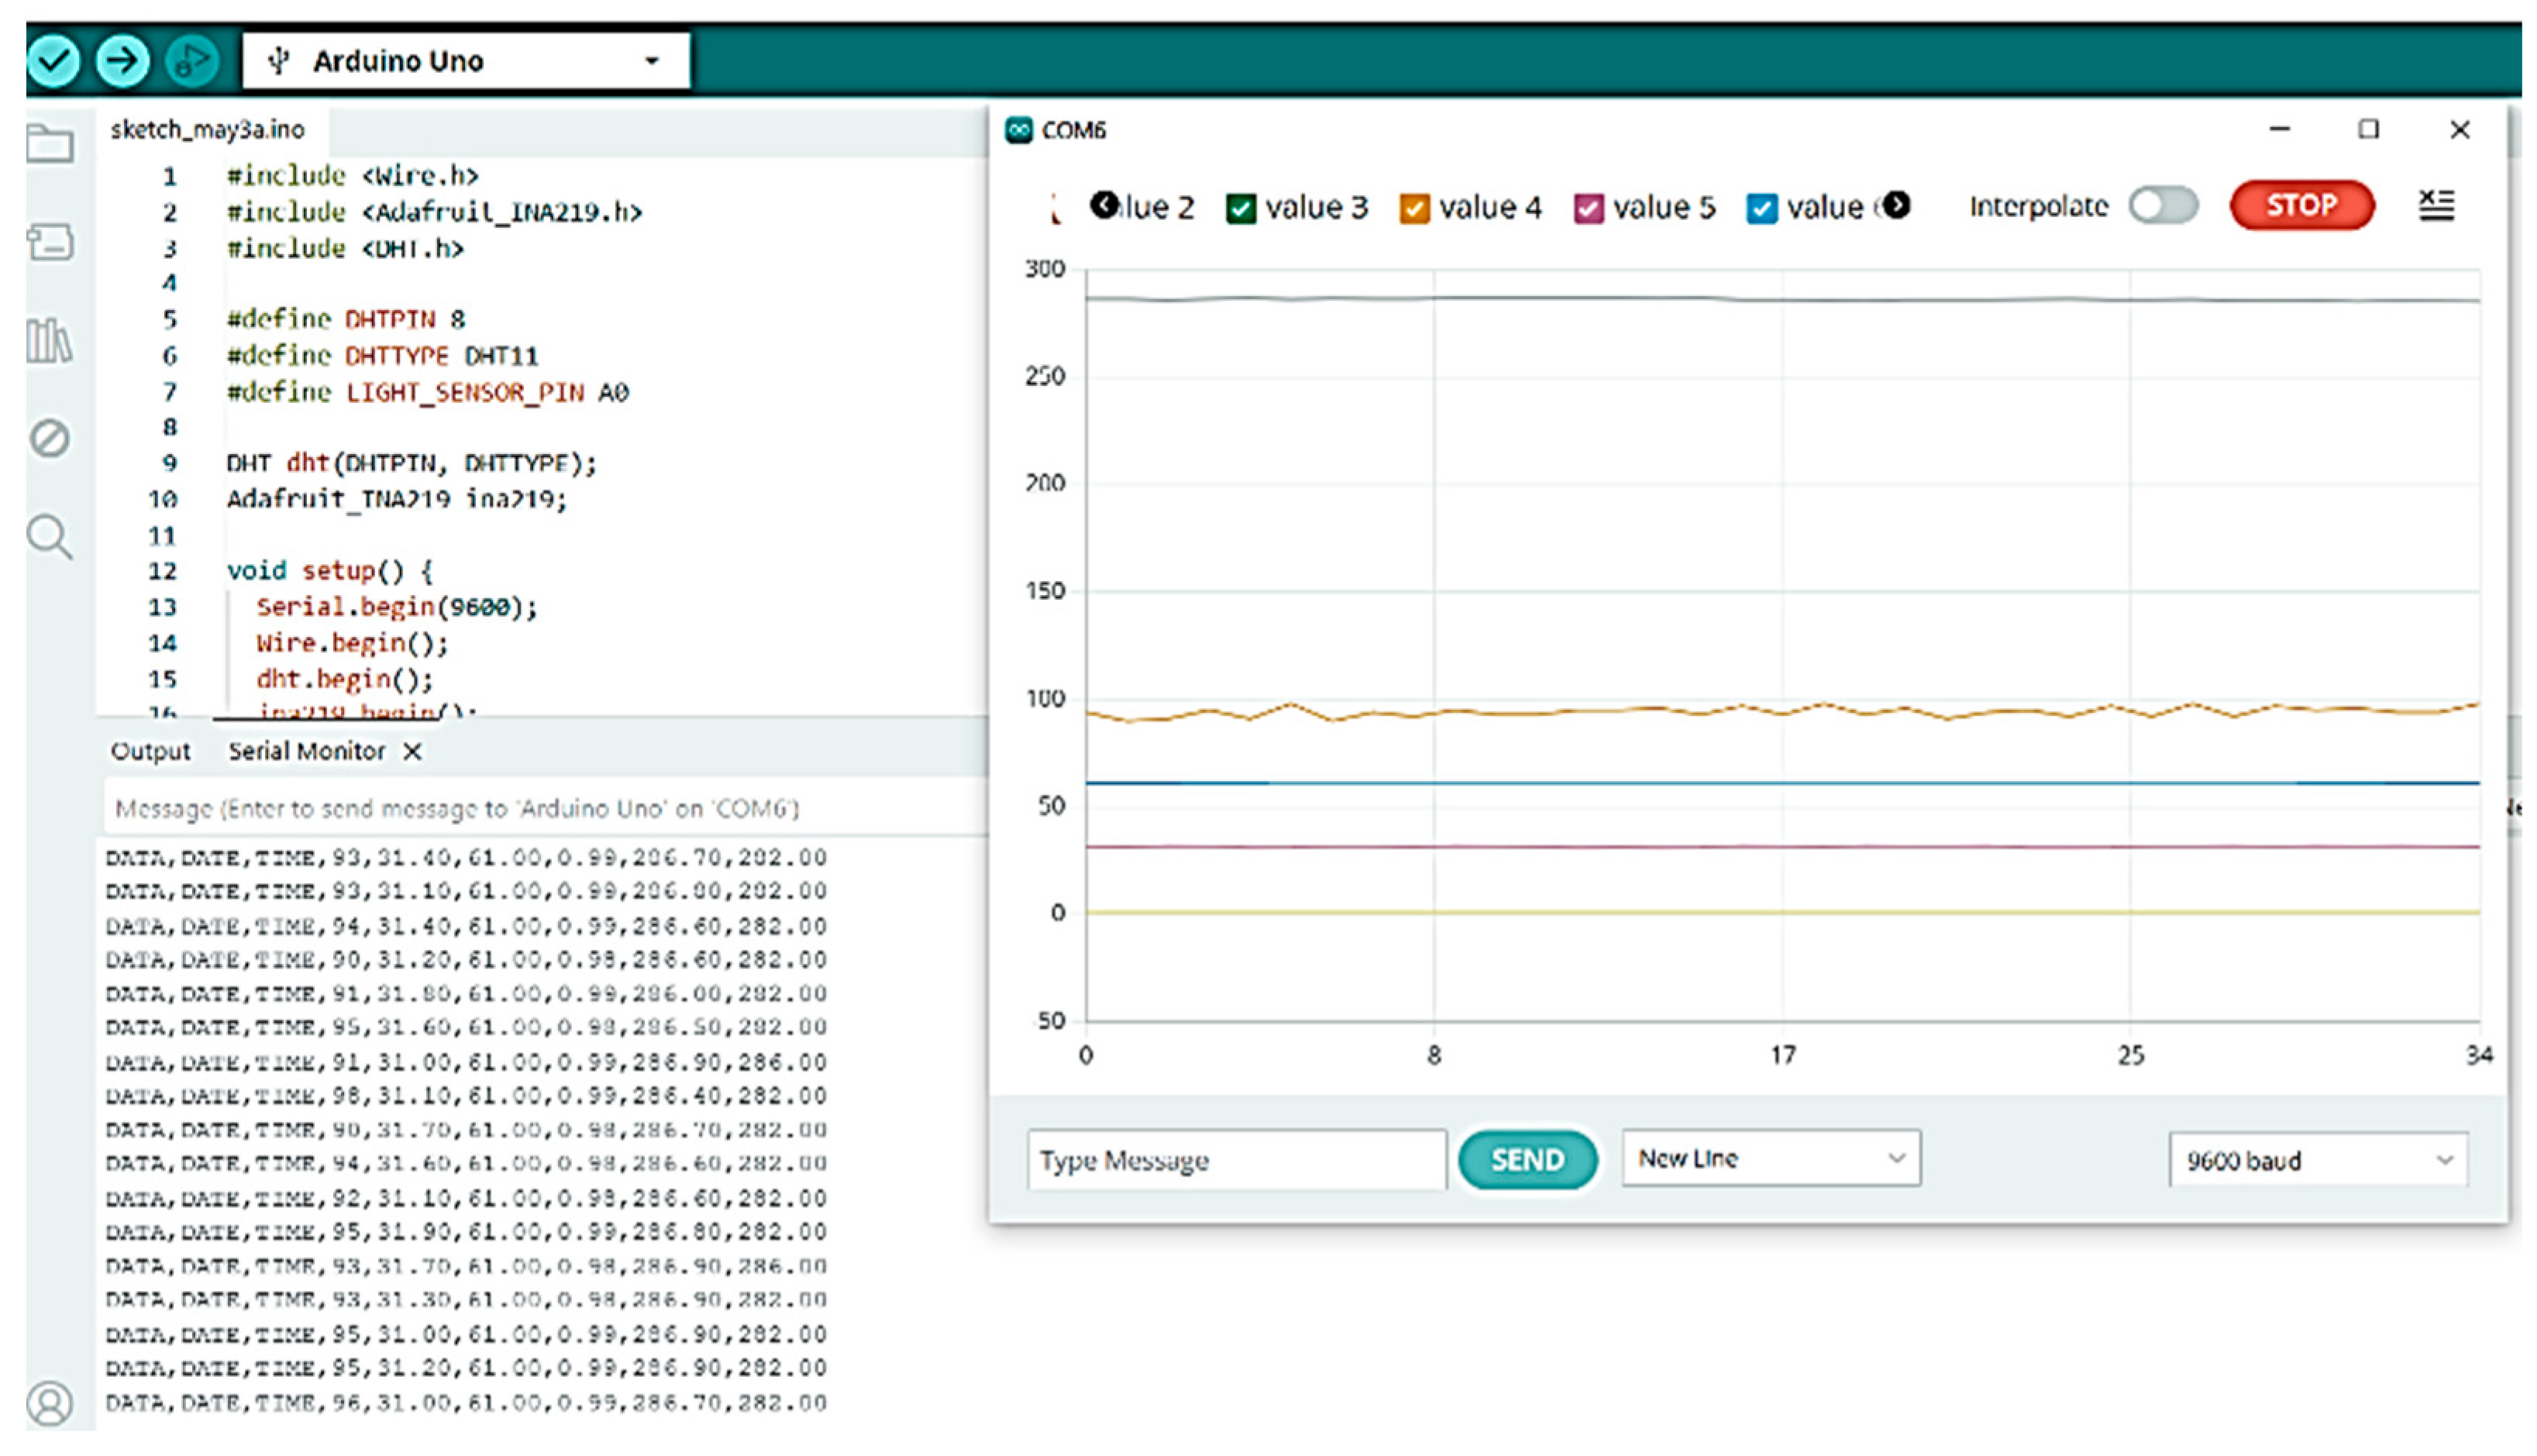
Figure 20.
Arduino data logging to Excel via PLX-DAQ.
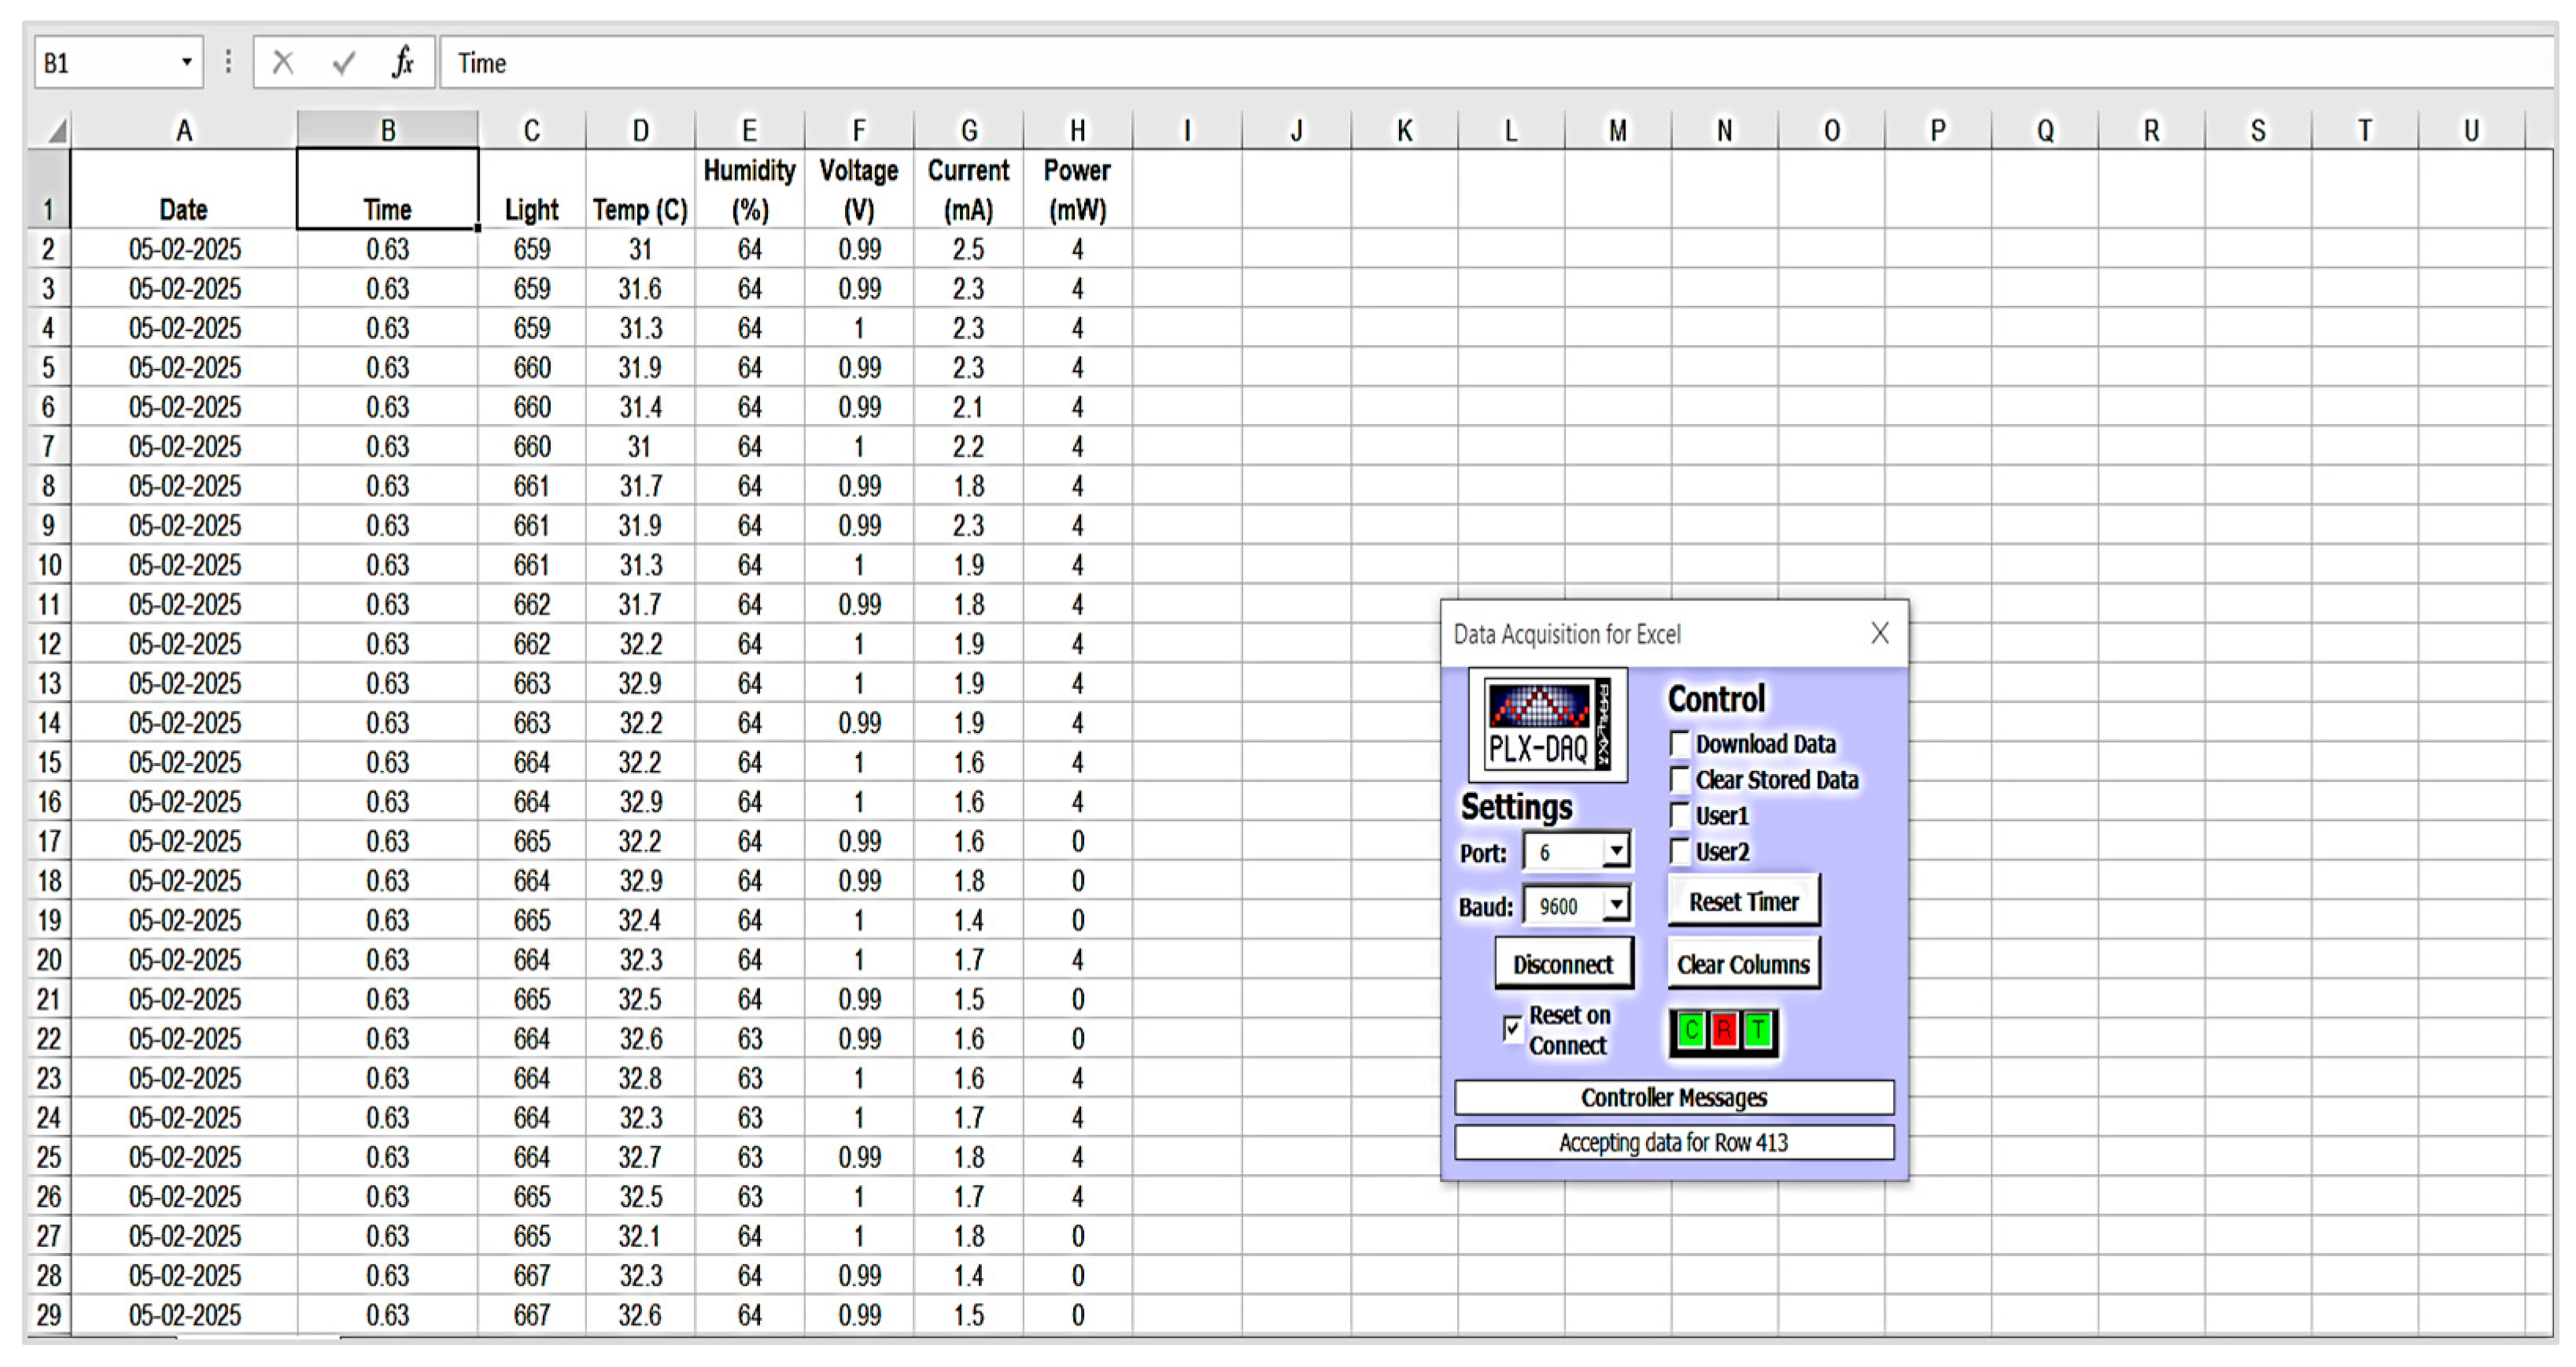
The Parallax Data Acquisition Tool (PLX-DAQ) is used to provide real-time data logging from the Arduino microcontroller to a spreadsheet interface. Direct serial connection between the Arduino and Microsoft Excel is made possible by the Excel-based macro application PLX-DAQ. The program is published as a zipped ZIP file and is available for download from the official Parallax website. The user must use a compatible 32-bit version of Microsoft Excel to open the macro-enabled Excel file (PLX-DAQ Spreadsheet.xls) after extraction. To enable communication through the Visual Basic for Applications (VBA) environment, the tool must be launched with macro rights allowed. The tool provides an interface wherein the appropriate communication port (COM port) and baud rate—typically 9600 bps—are selected to match those configured in the Arduino code. Once the serial connection is established, PLX-DAQ continuously logs incoming sensor data into the Excel spreadsheet with timestamped entries. This method offers a reliable and efficient mechanism for monitoring and recording environmental parameters, thereby facilitating early-stage validation and calibration of the sensor network prior to deployment within the proposed system.
Figure 21.
Closeup of sensor and camera connection.
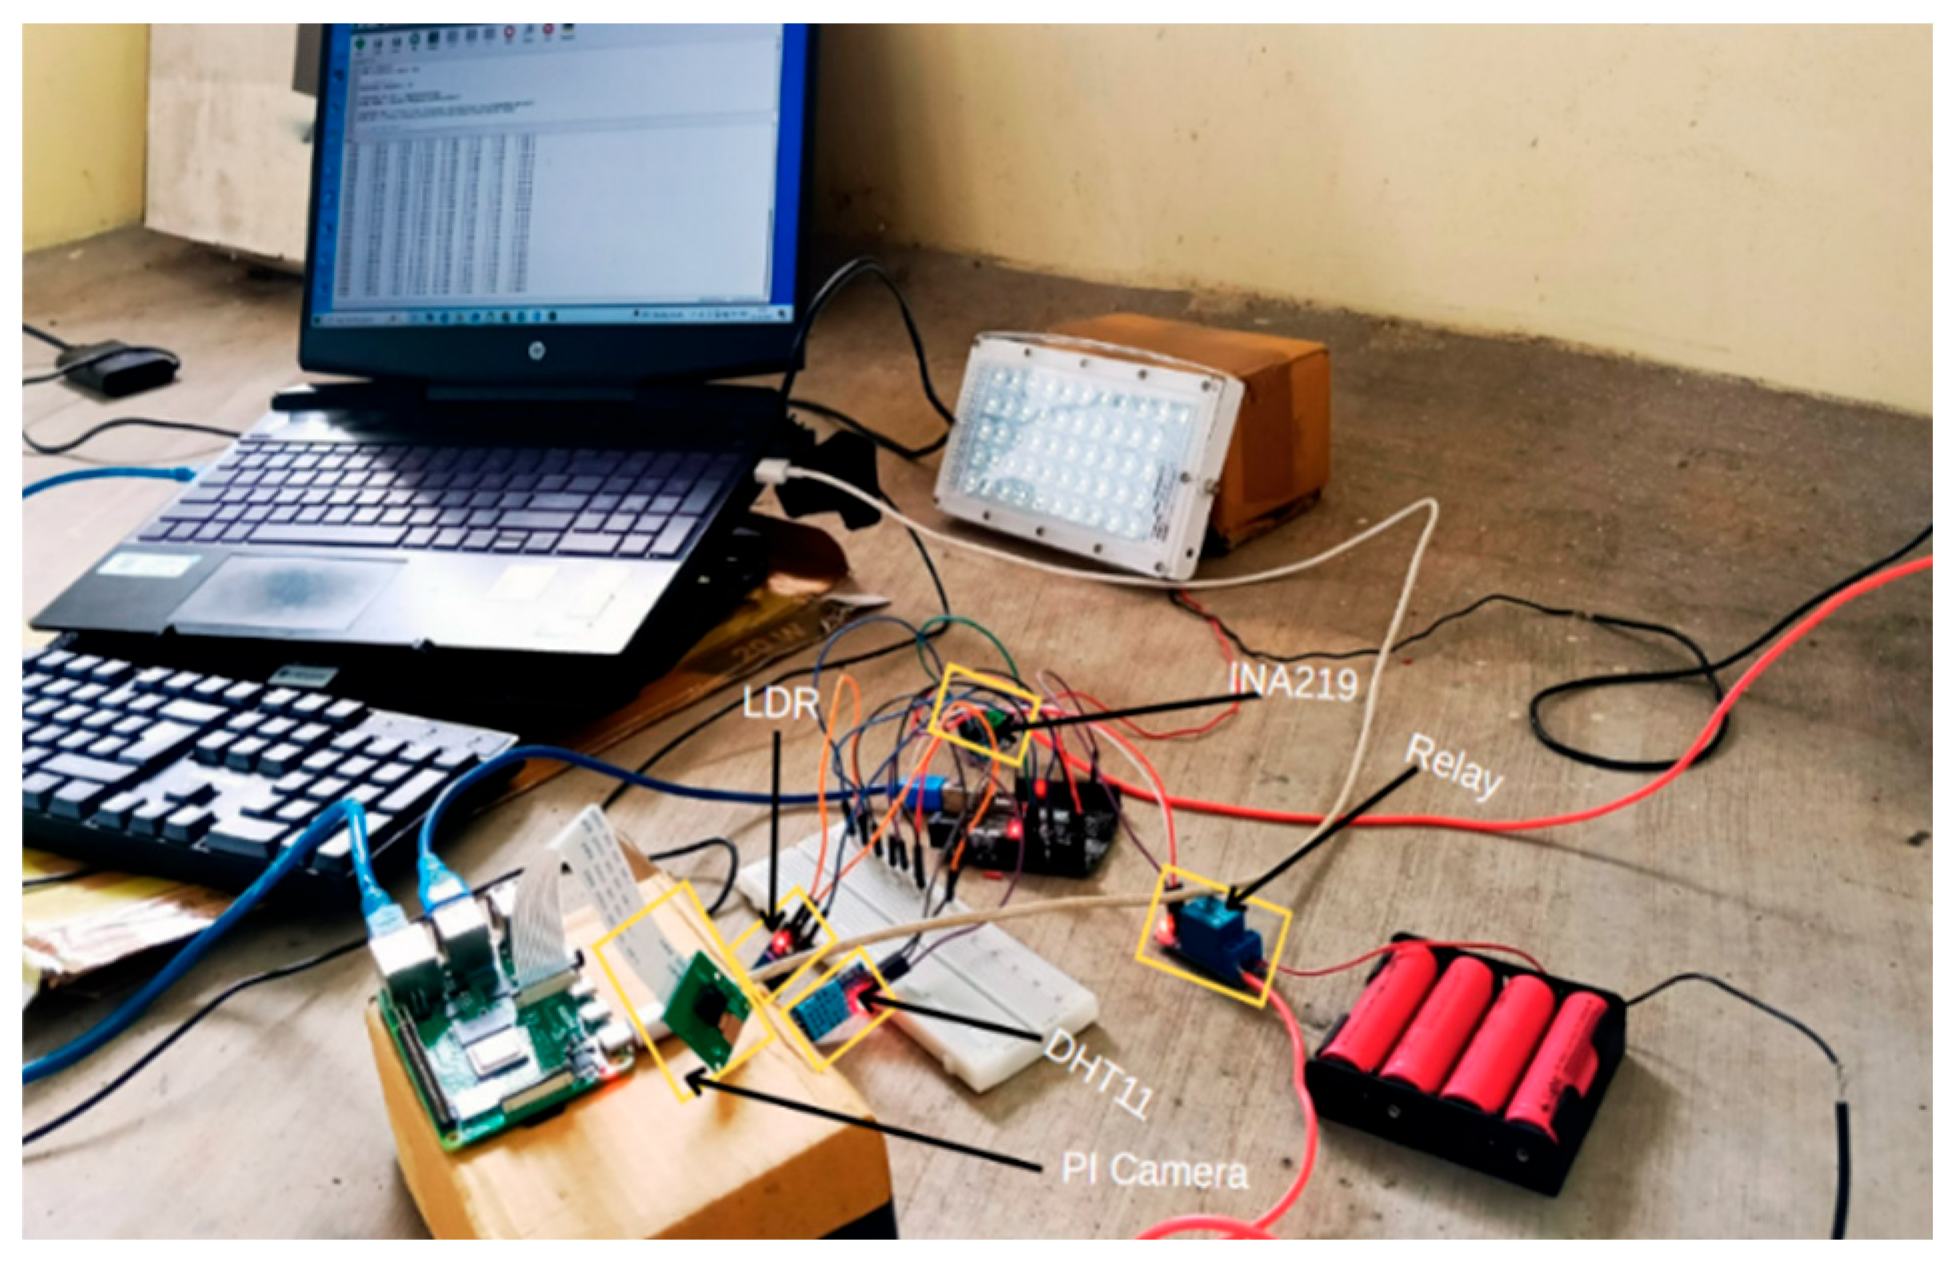
Figure 22.
System displaying live data on thingspeak.
- G.
- Implementation
The following steps describe the workflow of the complete implementation of the proposed YOLO-IoT-based solar panel monitoring and cleaning system:
- Step 1: All hardware components including Arduino Uno, sensors (DHT11, LDR, INA219), relay module, pump, battery, Raspberry Pi, and Pi Camera are physically assembled and wired as per the designed circuit.
- Step 2: The Arduino Uno is programmed using the Arduino IDE with code to read sensor data, apply threshold logic, and control the relay output.
- Step 3: Sensor readings from the Arduino (temperature, humidity, light intensity, voltage, current, and power) are transmitted via UART to the Raspberry Pi at 9600 baud rate.
- Step 4: The Pi Camera captures real-time images of the solar panel using the libcamera-still command on Raspberry Pi.
- Step 5: Python scripts on the Raspberry Pi perform image brightness analysis using OpenCV and detect dust presence using the YOLOv8 model.
- Step 6: Sensor data and image results are processed through fusion logic combining image output, brightness level, and light intensity.
- Step 7: If the panel is determined as dusty, the Raspberry Pi sends an "ON" command to the Arduino to activate the relay.
- Step 8: The relay triggers the submersible pump powered by a separate battery pack, which sprays water on the panel for cleaning.
- Step 9: After a short delay (e.g., 2 seconds), the system returns to the monitoring state and continues to repeat the detection-cleaning cycle.
- Step 10: All sensor and image data are uploaded to ThingSpeak via HTTP GET requests for IoT-based monitoring and visualization.
- Step 11: The Raspberry Pi is accessed remotely using RealVNC for code execution, monitoring, and debugging during live operations.
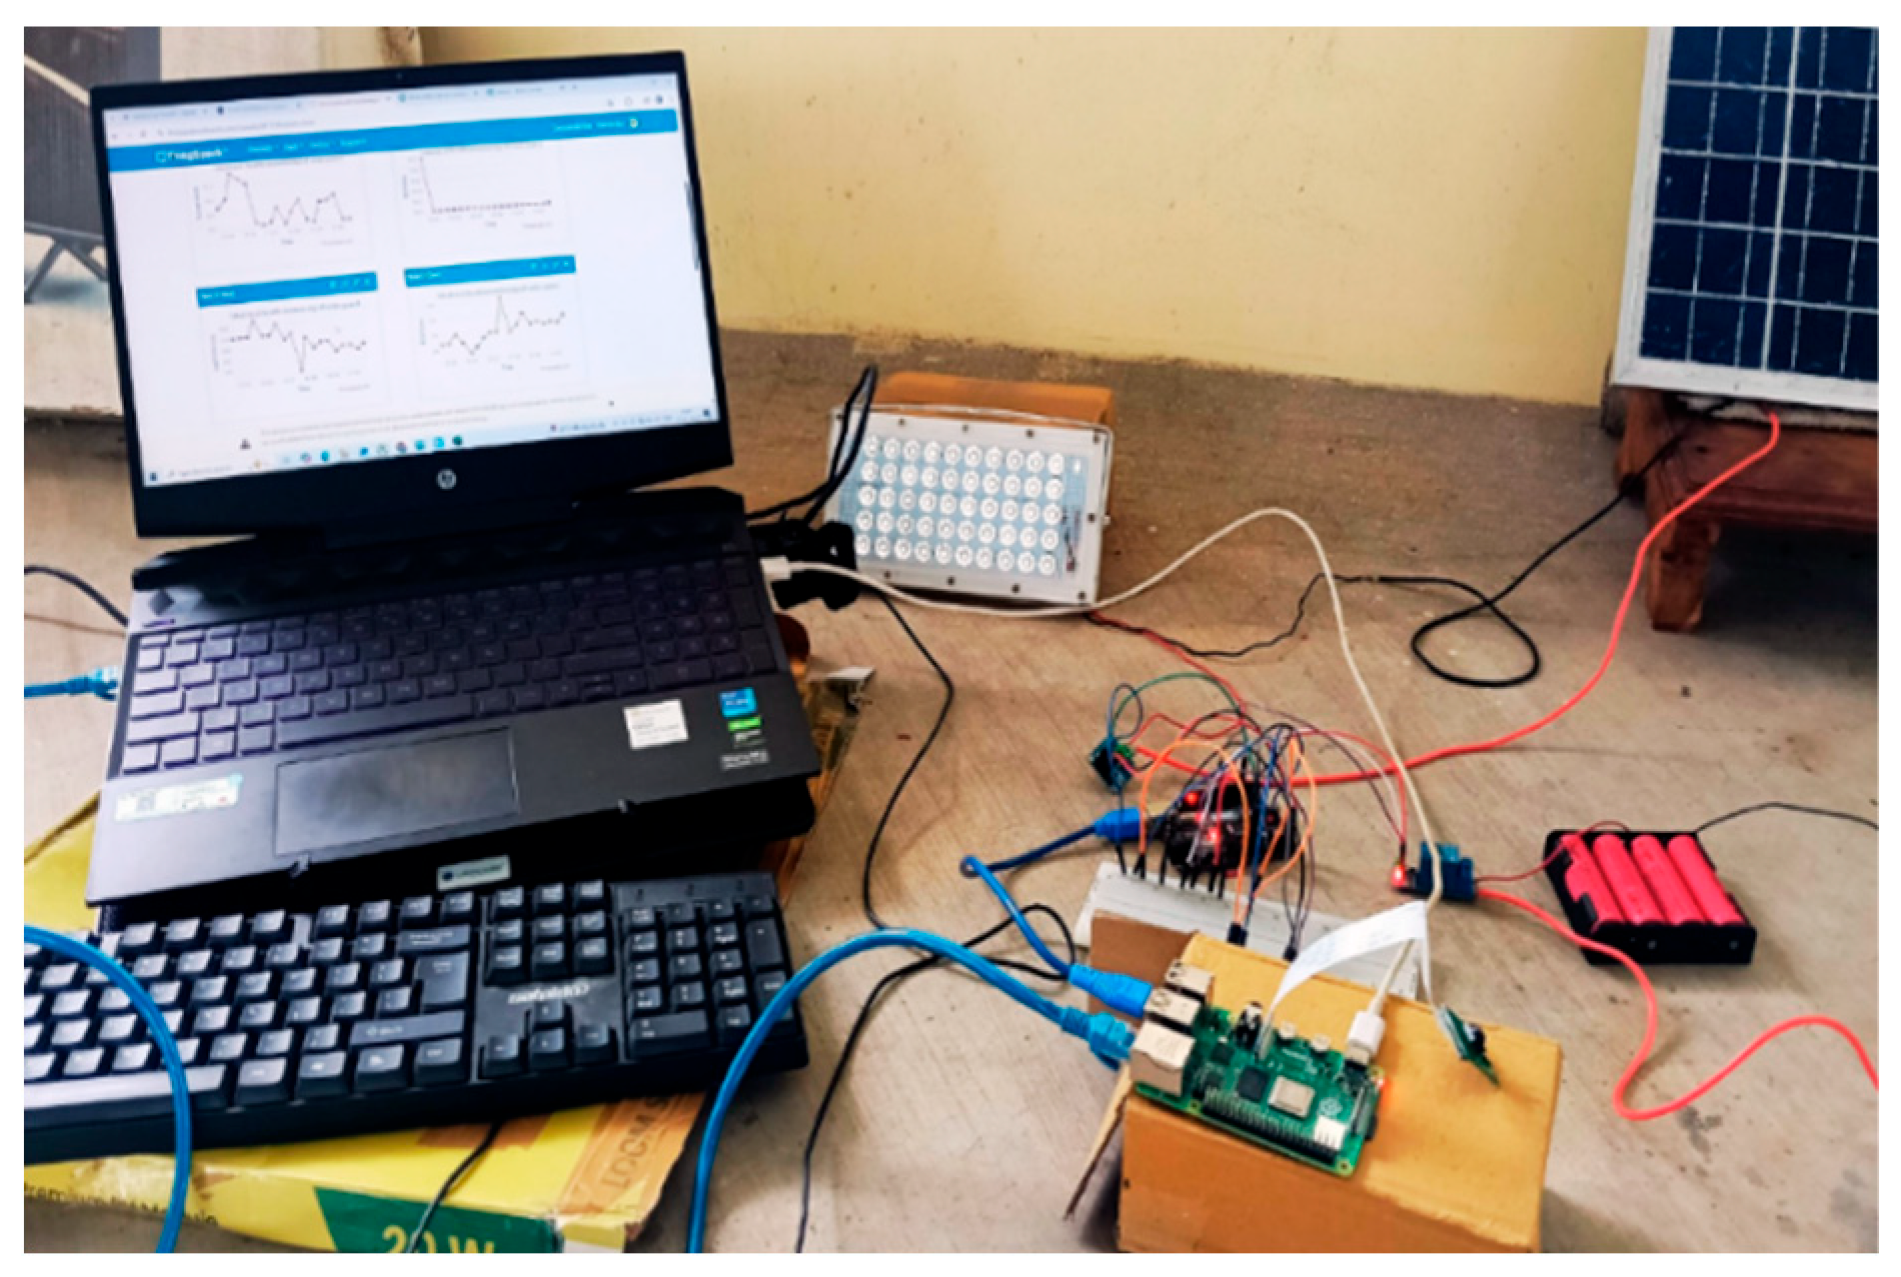
Figure 23.
Complete experimental setup with solar panel and cleaning system.
IV. Results and Discussion
To evaluate the real-time performance and responsiveness of the proposed solar panel monitoring and cleaning system, extensive experimental data was collected and analyzed using the ThingSpeak cloud platform. The system was deployed over multiple time slots—morning (11:45 AM – 12:00 PM), afternoon (2:10 PM – 2:30 PM), and evening (3:40 PM – 4:00 PM)—to capture varying environmental and electrical conditions. The Arduino Uno collected sensor readings for temperature, humidity, light intensity, and panel electrical output (voltage, current, power). The Raspberry Pi concurrently utilized OpenCV to analyze the brightness of the panel photos that were taken and used HTTP GET (REST) API calls to upload all of the fused data to ThingSpeak. Timestamped analysis, remote monitoring, and continuous data display were made possible by this. The plotted results demonstrate how the solar panel system behaves in various lighting and weather scenarios, confirming how well the suggested fusion-based automation method detects panel health and makes wise cleaning choices.
- A.
- At Morning
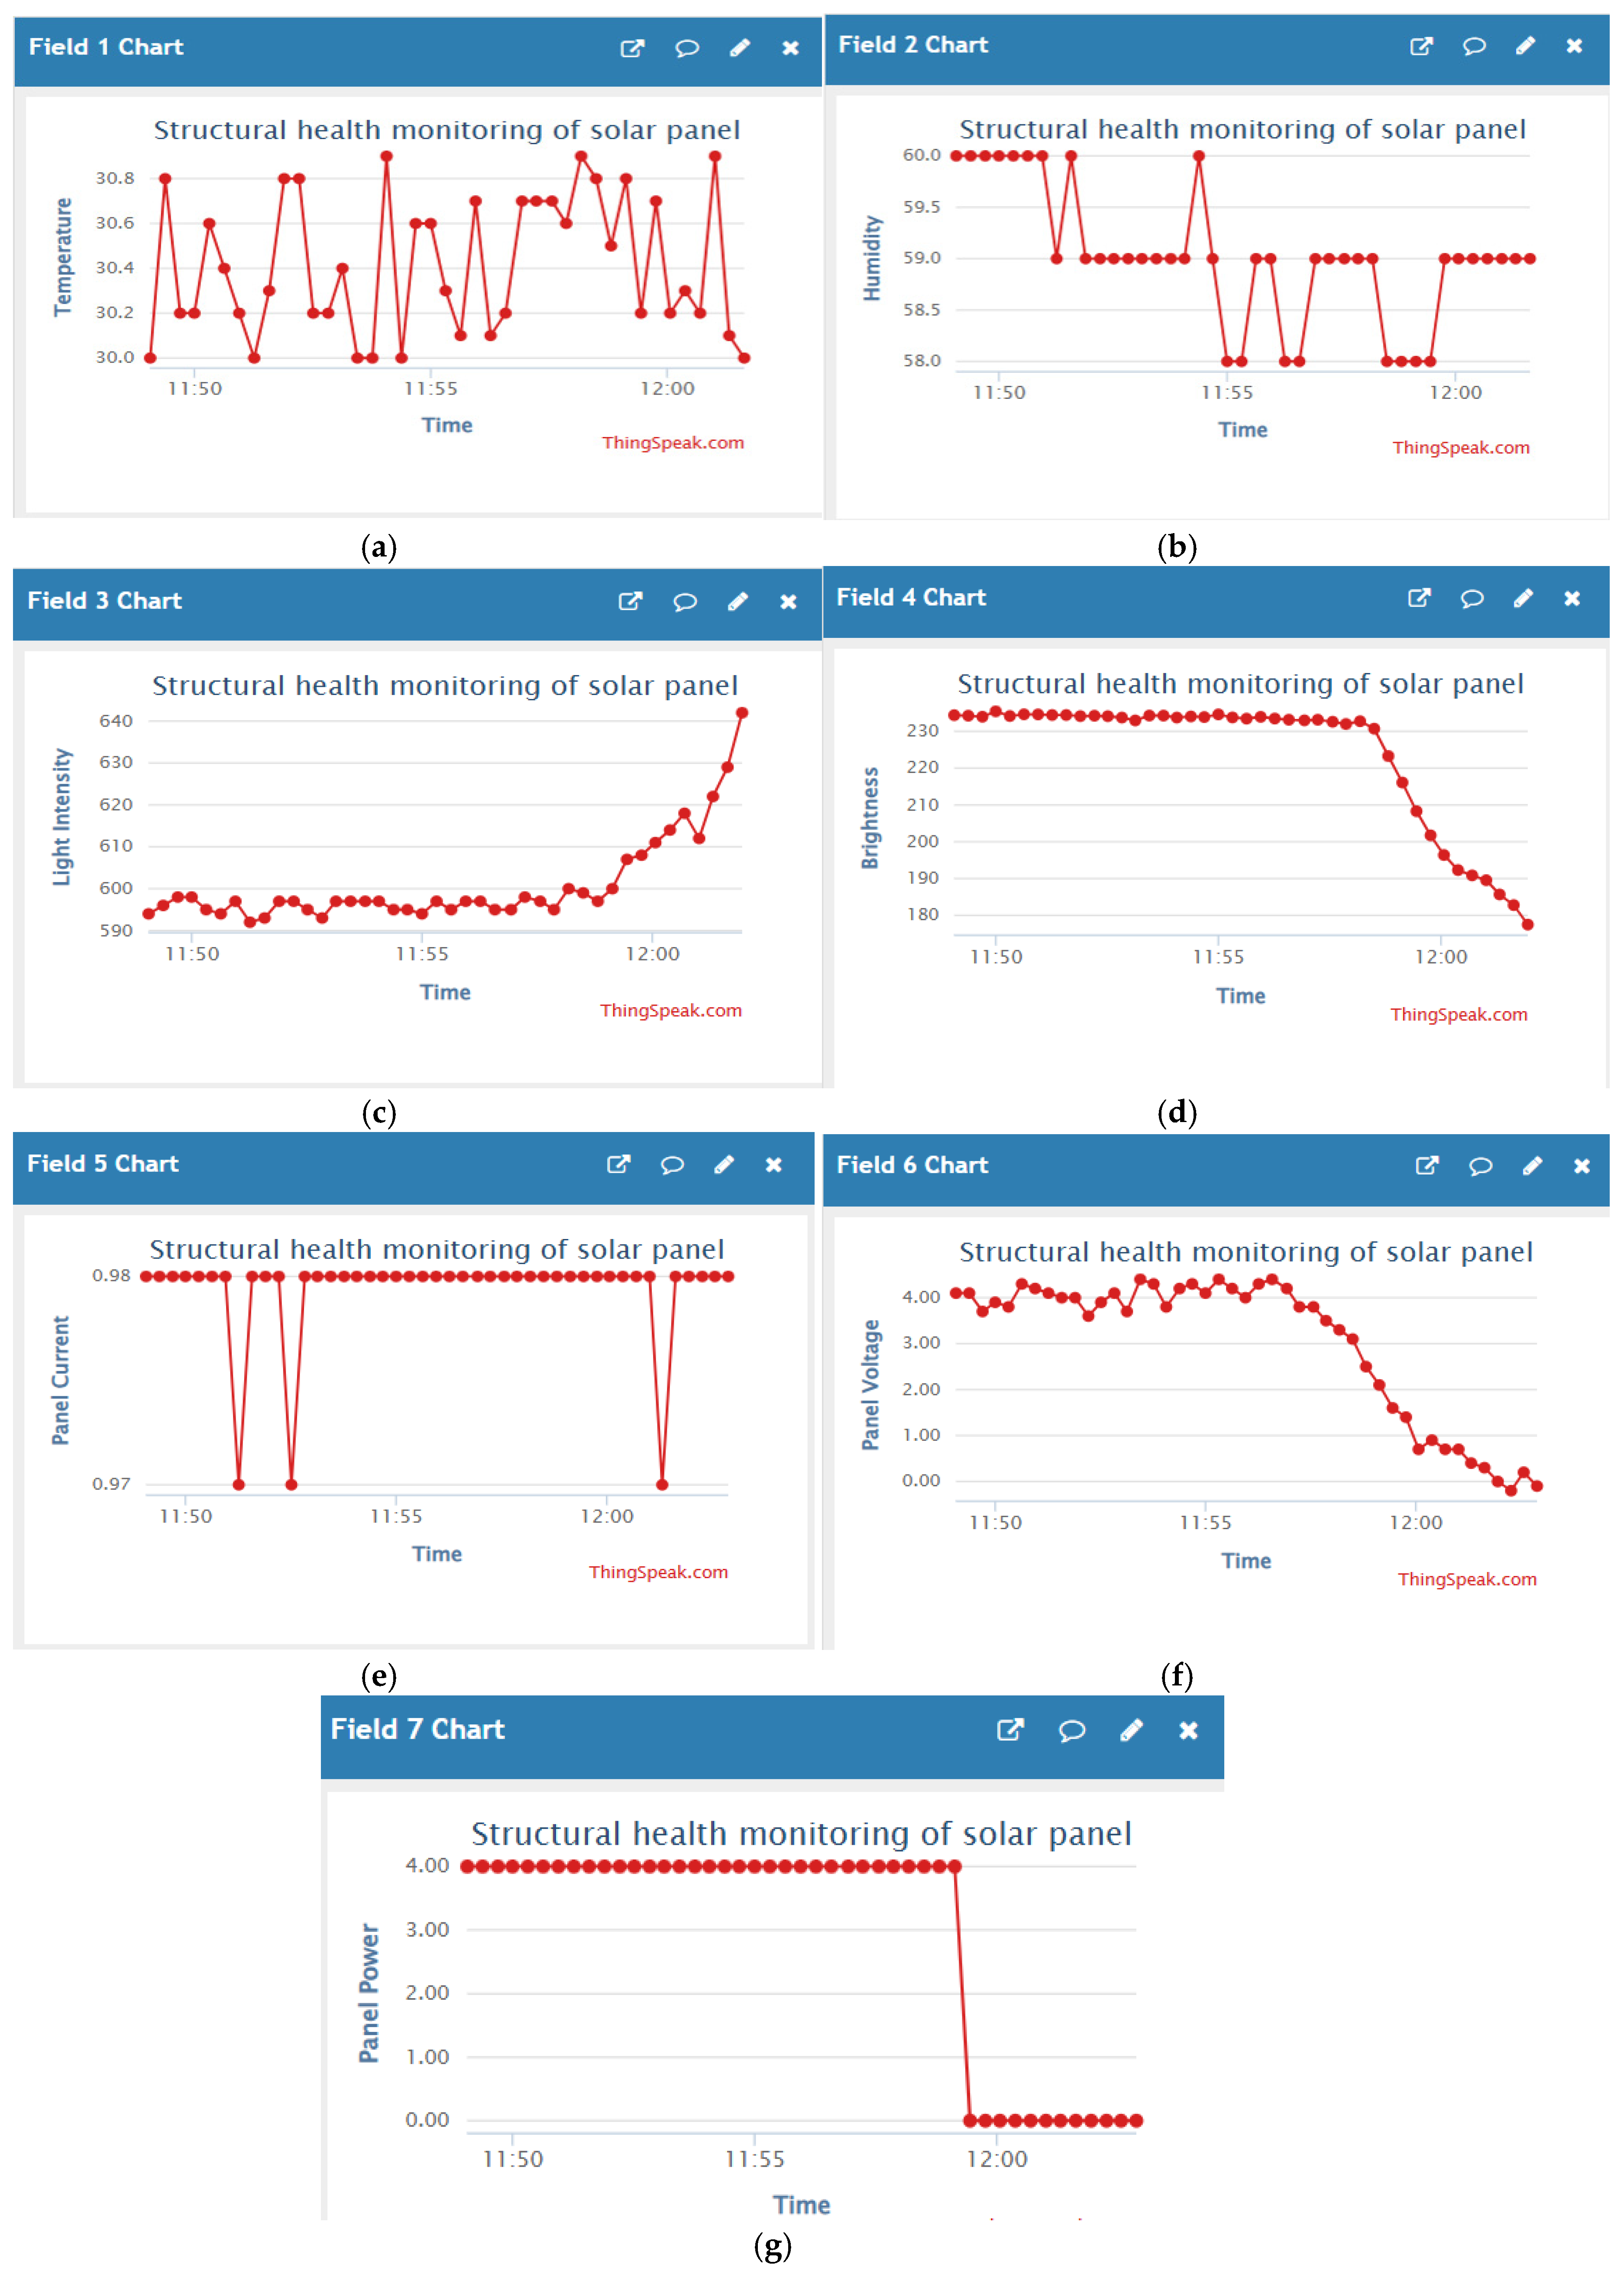
During the morning session, the environmental parameters—light intensity, temperature, and humidity—exhibited distinct dynamic behaviour as recorded by the LDR and DHT11 sensors. As seen in Field 3, the light intensity starts from a relatively low value of around 580 lux and gradually increases to nearly 850 lux as sunlight becomes stronger, indicating the natural progression of daylight after sunrise. In Field 1, temperature fluctuates between 30.2°C and 31.6°C, reflecting moderate and increasing solar heating during the early part of the day. The Field 2 plot shows humidity readings that initially vary, ranging from 58.5% to 60.2%, before stabilizing closer to 58.8% by the end of the interval. These environmental conditions provide context for the sensor fusion decision-making logic and reflect the system’s sensitivity to ambient solar and climatic changes.
The Field 4 chart, which corresponds to the image brightness analysis computed through OpenCV from Pi Camera input, reveals a notable transition over time. Initially, the brightness level remains fairly consistent around 218–220 units, indicating uniform lighting on the panel. However, toward the end of the session, there is a sharp drop in brightness values to approximately 207 units. This could be attributed to a sudden change in environmental conditions—such as partial shading, cloud movement, or increased dust obstruction on the panel surface. This dip plays a critical role in triggering the cleaning logic when combined with the sensor thresholds. The brightness trend thus validates the importance of visual monitoring as an augmentation to traditional sensor-based systems.
The power output of the panel, as measured by the INA219 sensor, is illustrated in Fields 5, 6, and 7 for current, voltage, and power, respectively. In Field 5, the current remains mostly steady around 0.97 mA, with a few minor dips, suggesting consistent load operation from the floodlight. The Field 6 graph shows the panel voltage beginning at around 2.05 V and steadily decreasing to approximately 1.80 V, possibly due to light angle changes or increased resistance from dust. Correspondingly, the Field 7 power plot shows a sharp decline: panel power drops from around 3.90 mW to nearly 0 mW just before 12:00 PM. This sharp power loss may indicate panel degradation or obstruction, and validates the system's decision to initiate cleaning if paired with low brightness and environmental thresholds. These measurements affirm the reliability of INA219 in tracking real-time PV health performance in low-power embedded systems.
Figure 24.
Recorded data in morning (a) Temperature Vs Time graph (b)Humidity Vs Time graph (c)Light Intensity Vs Time graph (d)Brightness Vs Time graph (e)Current Vs Time graph (f)Bus voltage Vs Time graph (g)Panel power Vs Time graph.
Figure 24.
Recorded data in morning (a) Temperature Vs Time graph (b)Humidity Vs Time graph (c)Light Intensity Vs Time graph (d)Brightness Vs Time graph (e)Current Vs Time graph (f)Bus voltage Vs Time graph (g)Panel power Vs Time graph.
- B.
- At Afternoon
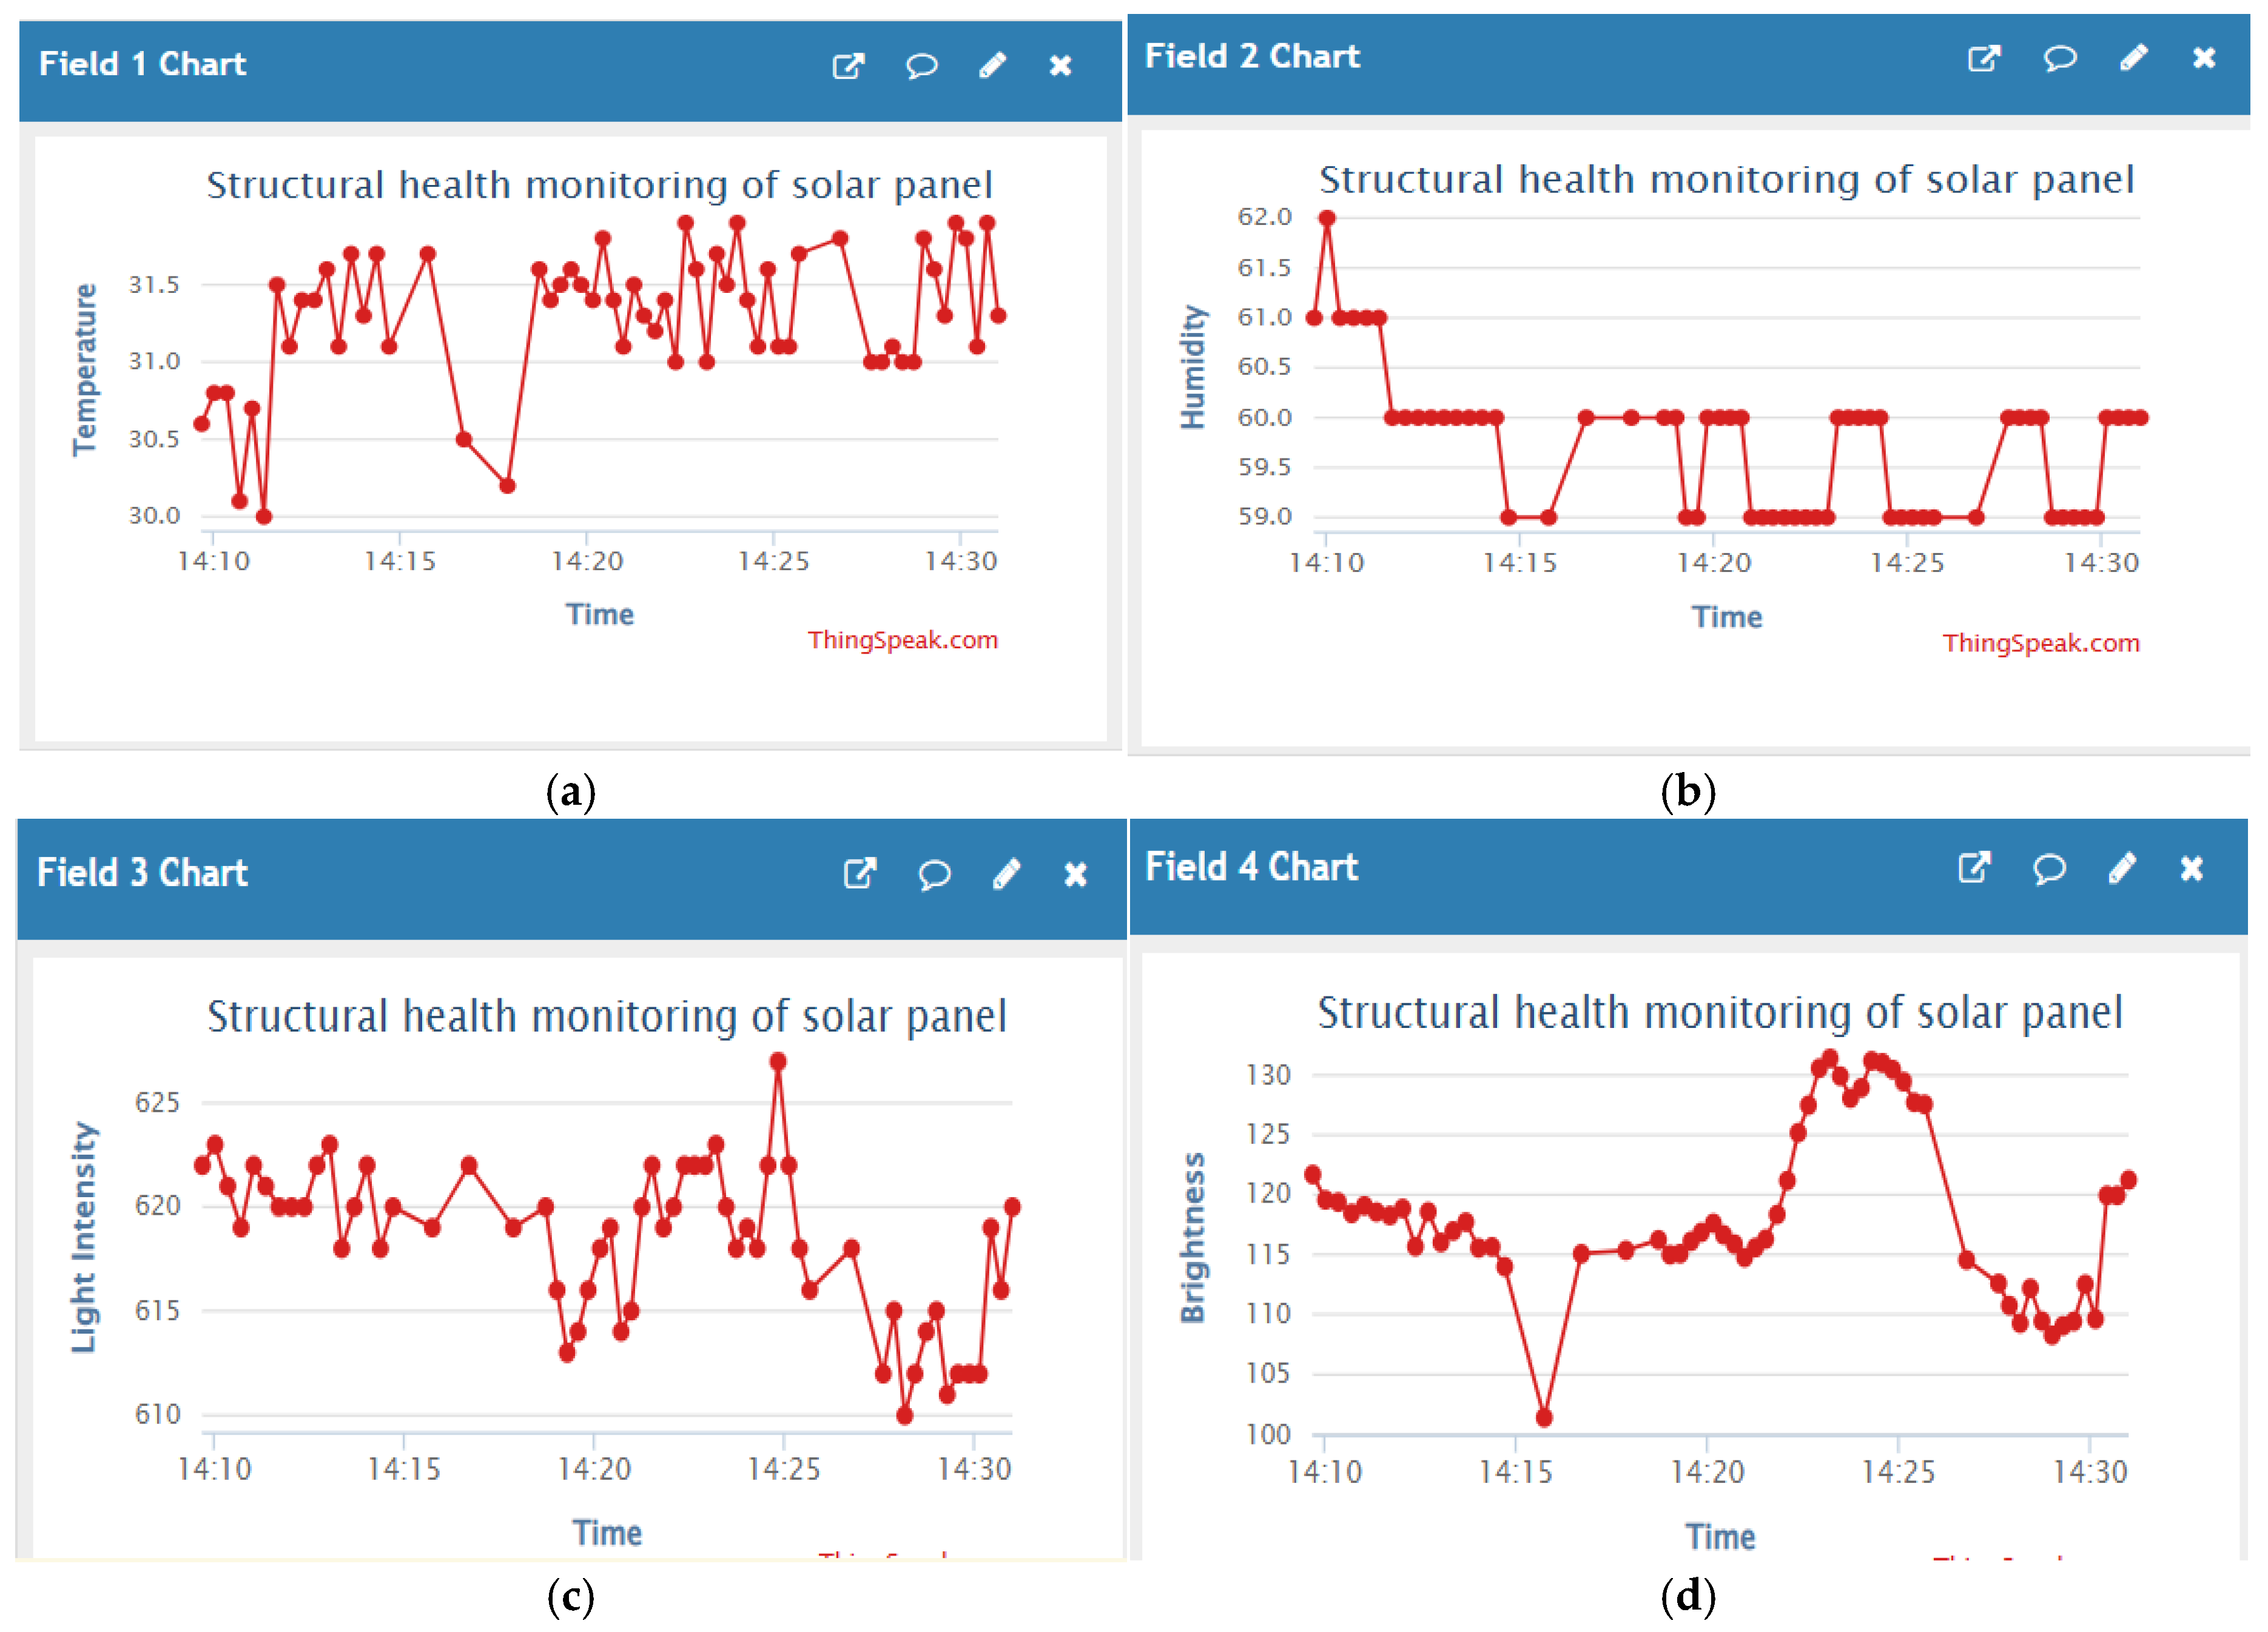
In the afternoon session, the system exhibited more frequent and irregular environmental changes as shown in Fields 1, 2, and 3. The temperature (Field 1) remained mostly stable, fluctuating narrowly between 31.0°C and 31.7°C, indicating peak solar heating during midday. The humidity graph (Field 2) showed more abrupt transitions, starting from 62.0%, then sharply dropping and oscillating around 58.0–60.0%, suggesting changing airflow or transient shade events near the panel area. The light intensity values (Field 3) recorded by the LDR remained relatively high in the range of 612 to 628 lux, with visible micro-fluctuations around 14:25, possibly due to passing clouds or momentary reflection variation. These environmental readings further demonstrate how external conditions actively impact the solar panel surface and justify the need for real-time monitoring and cleaning response during active daylight hours.
The brightness values computed from the panel images using OpenCV are visualized in Field 4. The readings began around 118–120 units and showed gradual elevation toward a peak of 130 units just after 14:20, corresponding to direct solar exposure. Interestingly, there is a sudden dip to ~105 units at around 14:17, which may indicate a brief shading or obstruction over the panel surface, possibly from environmental objects or dust interference. The graph also shows a post-dip recovery, with brightness stabilizing again at 125–128 units. These changes directly correlate with light intensity variations and are valuable in distinguishing true dust conditions from transient shadows. The brightness analysis confirms the system's ability to visually detect panel degradation and integrate it into the fusion logic for cleaning decisions.
Figure 25.
Recorded data in afternoon (a) Temperature Vs Time graph (b)Humidity Vs Time graph (c)Light Intensity Vs Time graph (d)Brightness Vs Time graph (e)Current Vs Time graph (f)Bus voltage Vs Time graph (g)Panel power Vs Time graph.
Figure 25.
Recorded data in afternoon (a) Temperature Vs Time graph (b)Humidity Vs Time graph (c)Light Intensity Vs Time graph (d)Brightness Vs Time graph (e)Current Vs Time graph (f)Bus voltage Vs Time graph (g)Panel power Vs Time graph.
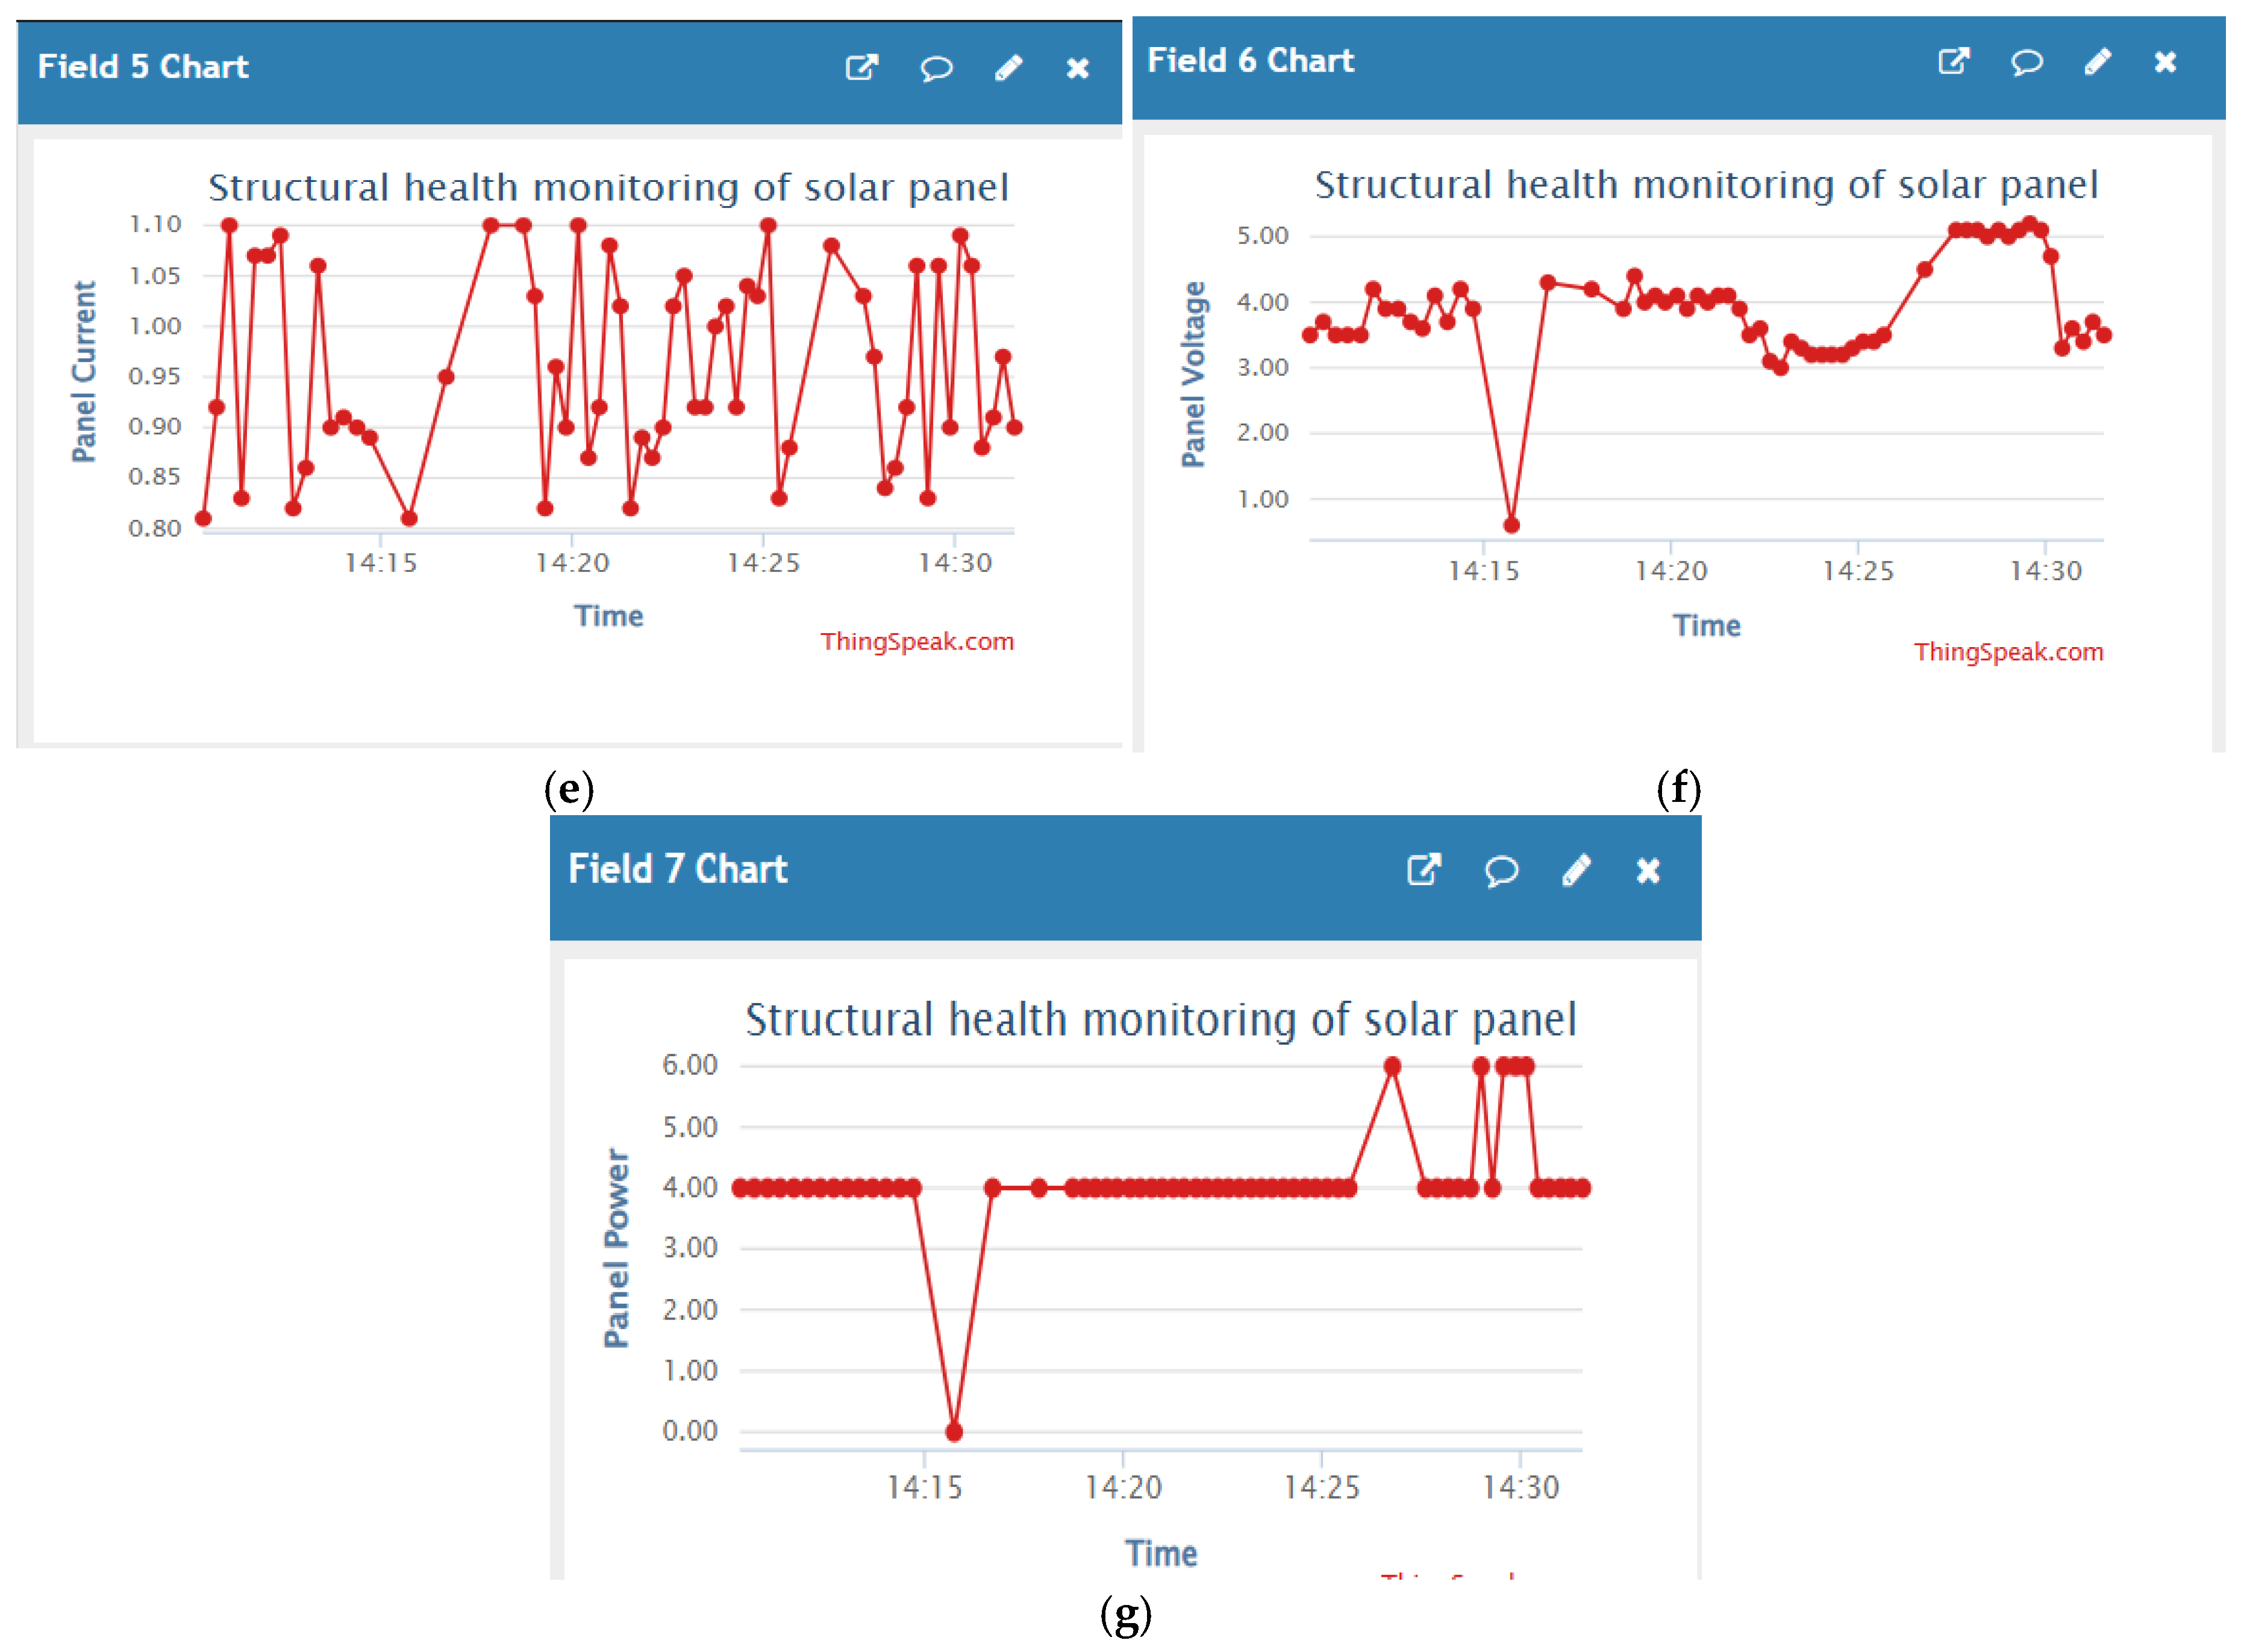
During the afternoon session, the solar panel’s electrical performance showed a notable improvement, especially in terms of voltage and power output, as captured by the INA219 sensor (Fields 5, 6, and 7). The panel voltage (Field 6) increased significantly compared to the morning, stabilizing in the range of 4.6 V to 5.0 V, with a brief dip to ~1.0 V around 14:15, likely caused by a system event such as cleaning activation or transient obstruction. Importantly, this high voltage range reflects the peak sunlight exposure typical of early afternoon hours. Simultaneously, the panel power (Field 7) rose to 5.8–6.0 mW, the highest recorded in the day, again dropping momentarily during the voltage dip before recovering fully. The panel current (Field 5) remained between 0.85 mA and 0.97 mA, showing typical ripple due to load behaviour or minor environmental fluctuations. This power gain confirms that the panel was receiving maximum irradiance during this period and highlights the effectiveness of real-time monitoring for identifying optimal energy windows and adjusting maintenance or cleaning triggers accordingly.
- C.
- At Evening
In the evening session, a notable decline in solar activity and ambient fluctuations is observed, as shown in Fields 1, 2, and 3. The temperature (Field 1) remains mostly between 30.1°C and 31.6°C, with sharp dips below 30°C recorded after 15:50, reflecting natural atmospheric cooling as sunlight weakens. The humidity trend (Field 2) is erratic, ranging from 59.0% to 61.2%, with multiple short-lived drops likely caused by abrupt shifts in air moisture or sensor recalibration. In Field 3, the light intensity starts near 620 lux, remains relatively flat until 15:50, and then rises quickly toward 640 lux, possibly due to reflection from surroundings or a clearing sky. These conditions show how late-day irradiance can vary rapidly and stress the importance of continued monitoring for cleaning and performance assurance as the panel transitions toward low-power operation.
Figure 26.
Recorded data in evening (a) Temperature Vs Time graph (b)Humidity Vs Time graph (c)Light Intensity Vs Time graph (d)Brightness Vs Time graph (e)Current Vs Time graph (f)Bus voltage Vs Time graph (g)Panel power Vs Time graph.
Figure 26.
Recorded data in evening (a) Temperature Vs Time graph (b)Humidity Vs Time graph (c)Light Intensity Vs Time graph (d)Brightness Vs Time graph (e)Current Vs Time graph (f)Bus voltage Vs Time graph (g)Panel power Vs Time graph.
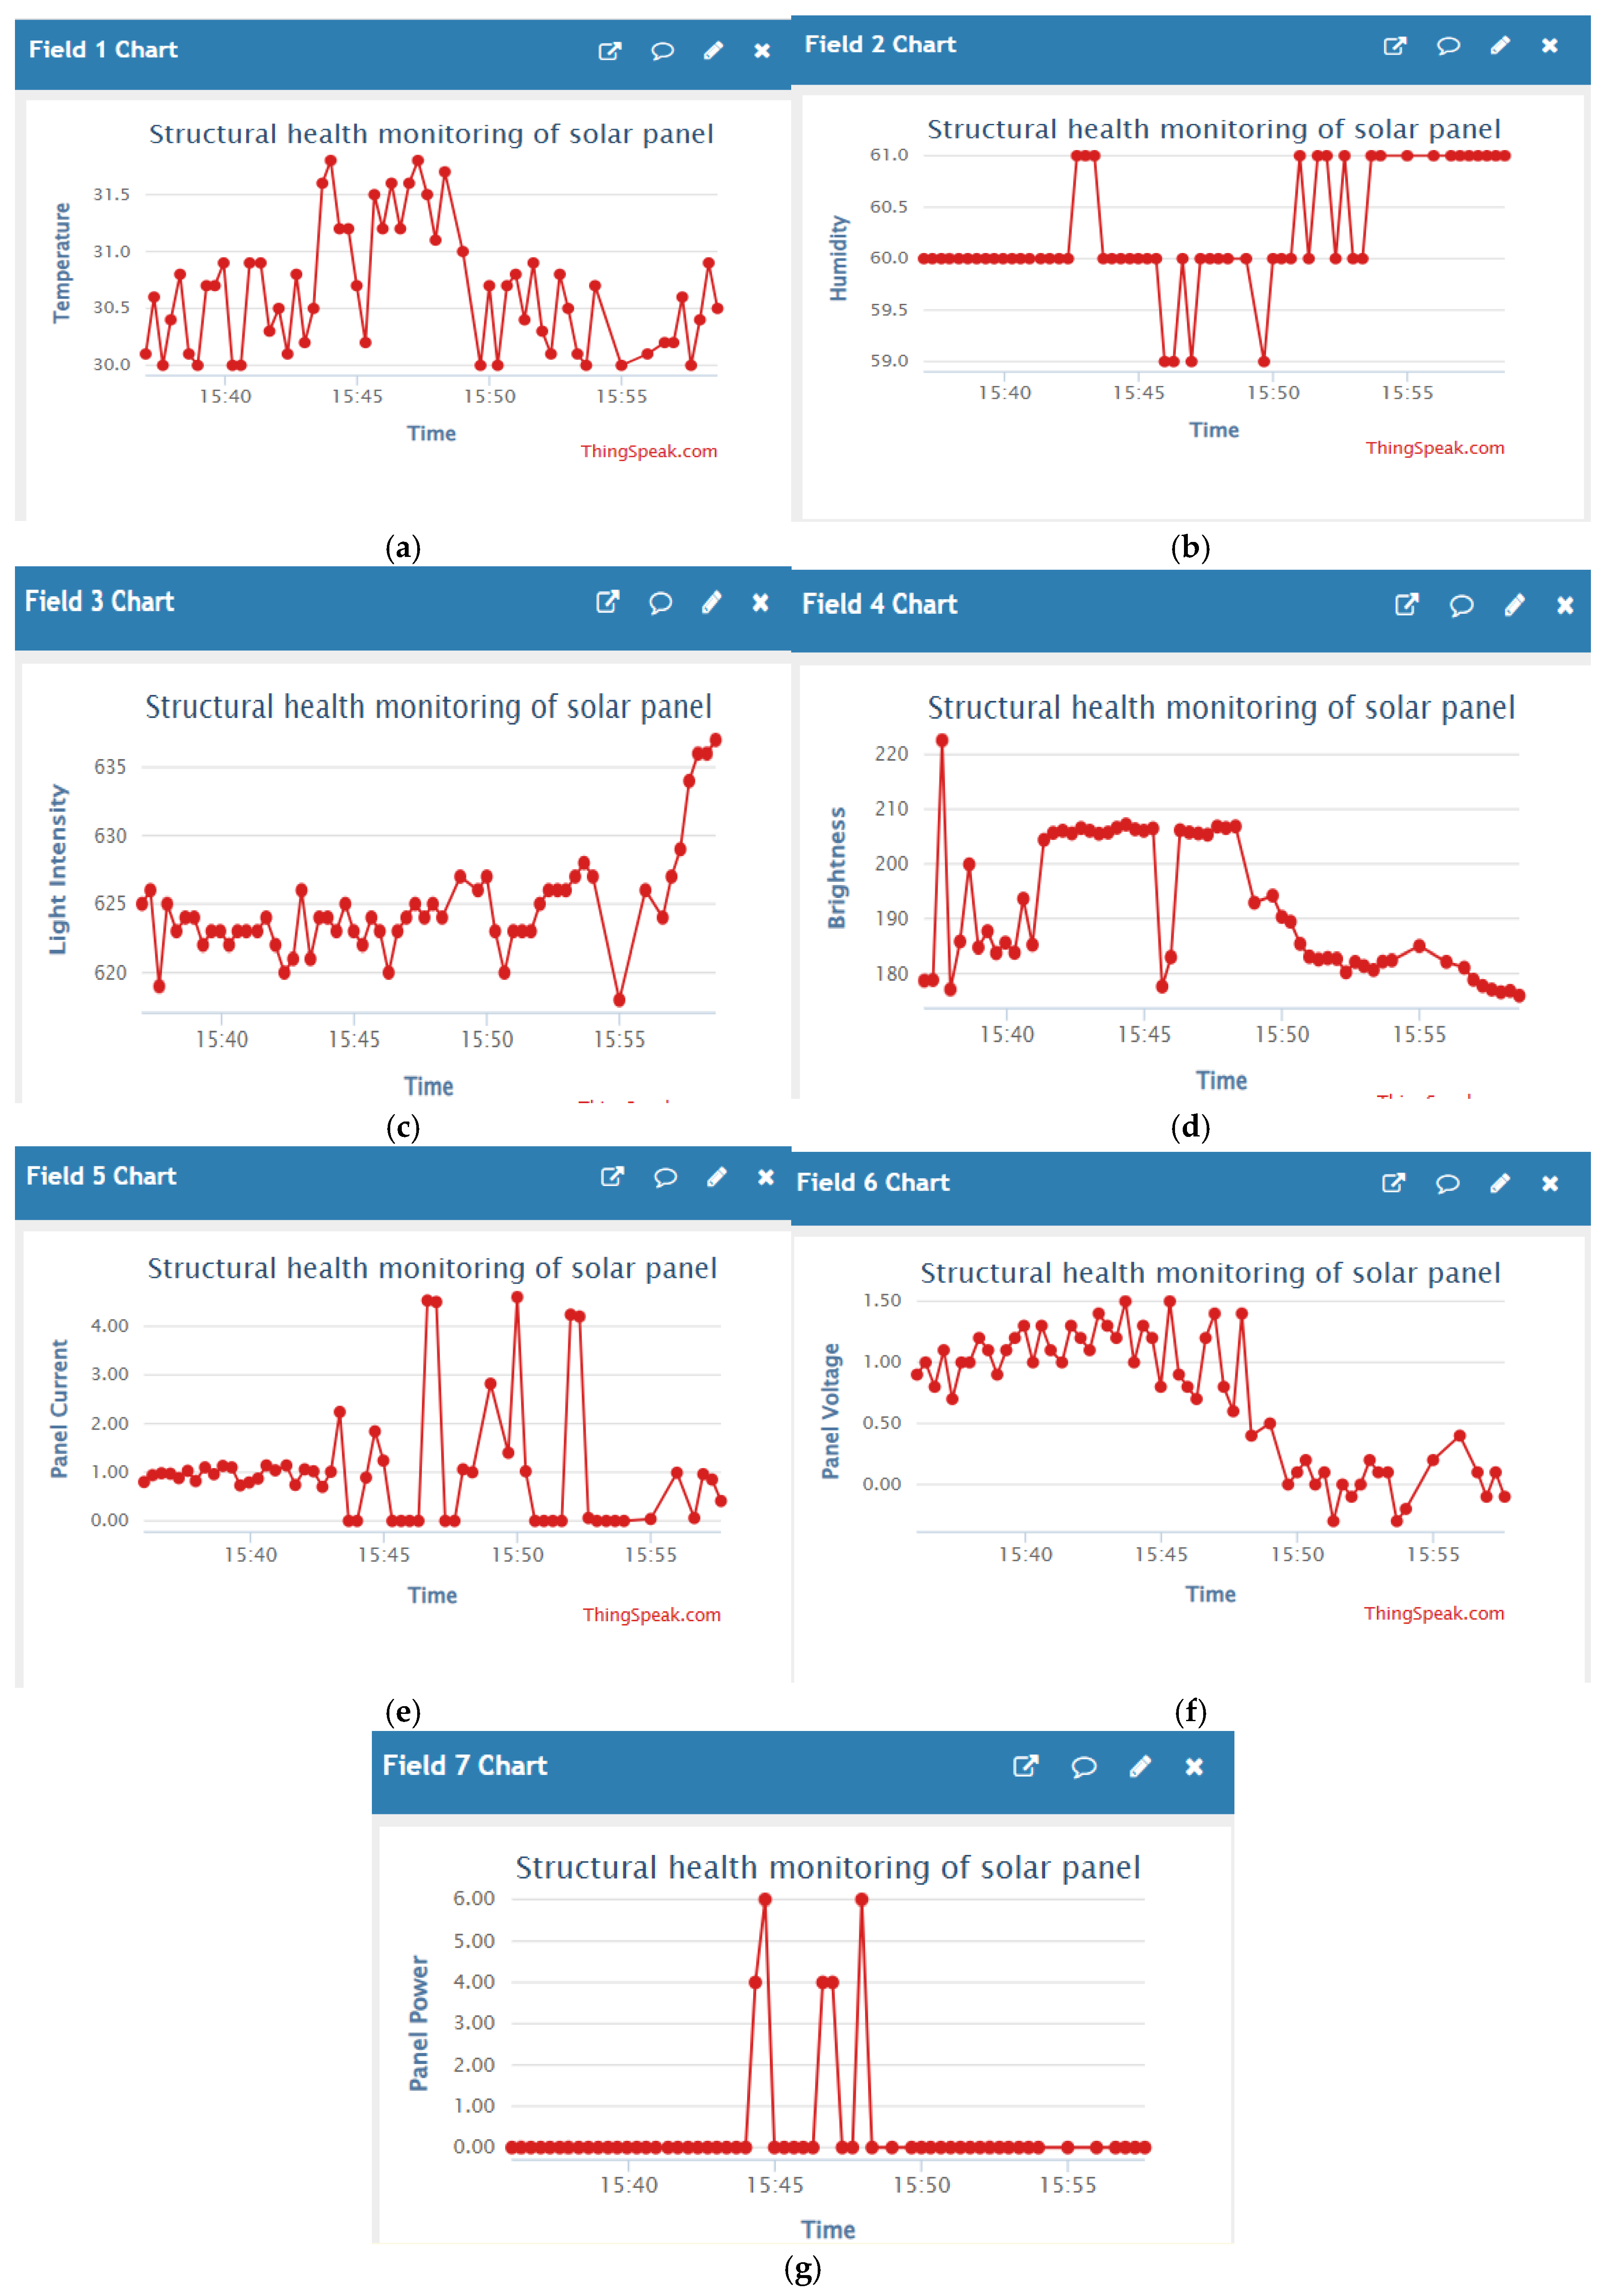
The brightness values, as derived from Pi Camera images and processed using OpenCV, are shown in Field 4. Initially, brightness stays high and stable around 705–710 units between 15:40 and 15:48, indicating unobstructed lighting. However, after 15:48, there's a sudden and sustained drop to ~690 units, followed by a progressive decrease toward 680 units by 15:55, which correlates with reduced sunlight or increased shadowing near sunset. A sharp spike near 720 units at 15:40 may be due to reflected glare or initial bright exposure. These visual trends reveal the system's ability to distinguish evening light transitions from genuine dust accumulation, reinforcing the reliability of the YOLO + brightness fusion logic used to decide cleaning actions during low-light periods.
The electrical performance captured by the INA219 sensor in the evening shows significant degradation and fluctuation, as seen in Fields 5, 6, and 7. Panel current (Field 5) remains close to 0 A for most of the session, with two brief spikes reaching up to 4.0 mA at 15:45, possibly due to transient load or relay switching activity. The voltage output (Field 6) shows a gradual decline from around 2.50 V to 1.20 V, reflecting the panel’s weakening ability to sustain charge under low irradiance. The panel power (Field 7) stays near 0 W throughout, except for a sharp rise to ~5.0 mW at 15:45, which aligns with the current spike and may indicate a triggered cleaning event or brief system reset. These variations confirm that evening solar energy production drops sharply, and automated cleaning decisions based on real-time voltage and power metrics become crucial in preventing false activation during low-light conditions.
- D.
- Current-Voltage-Power Trend
Table 3.
Pivot summary of sensor electrical readings.
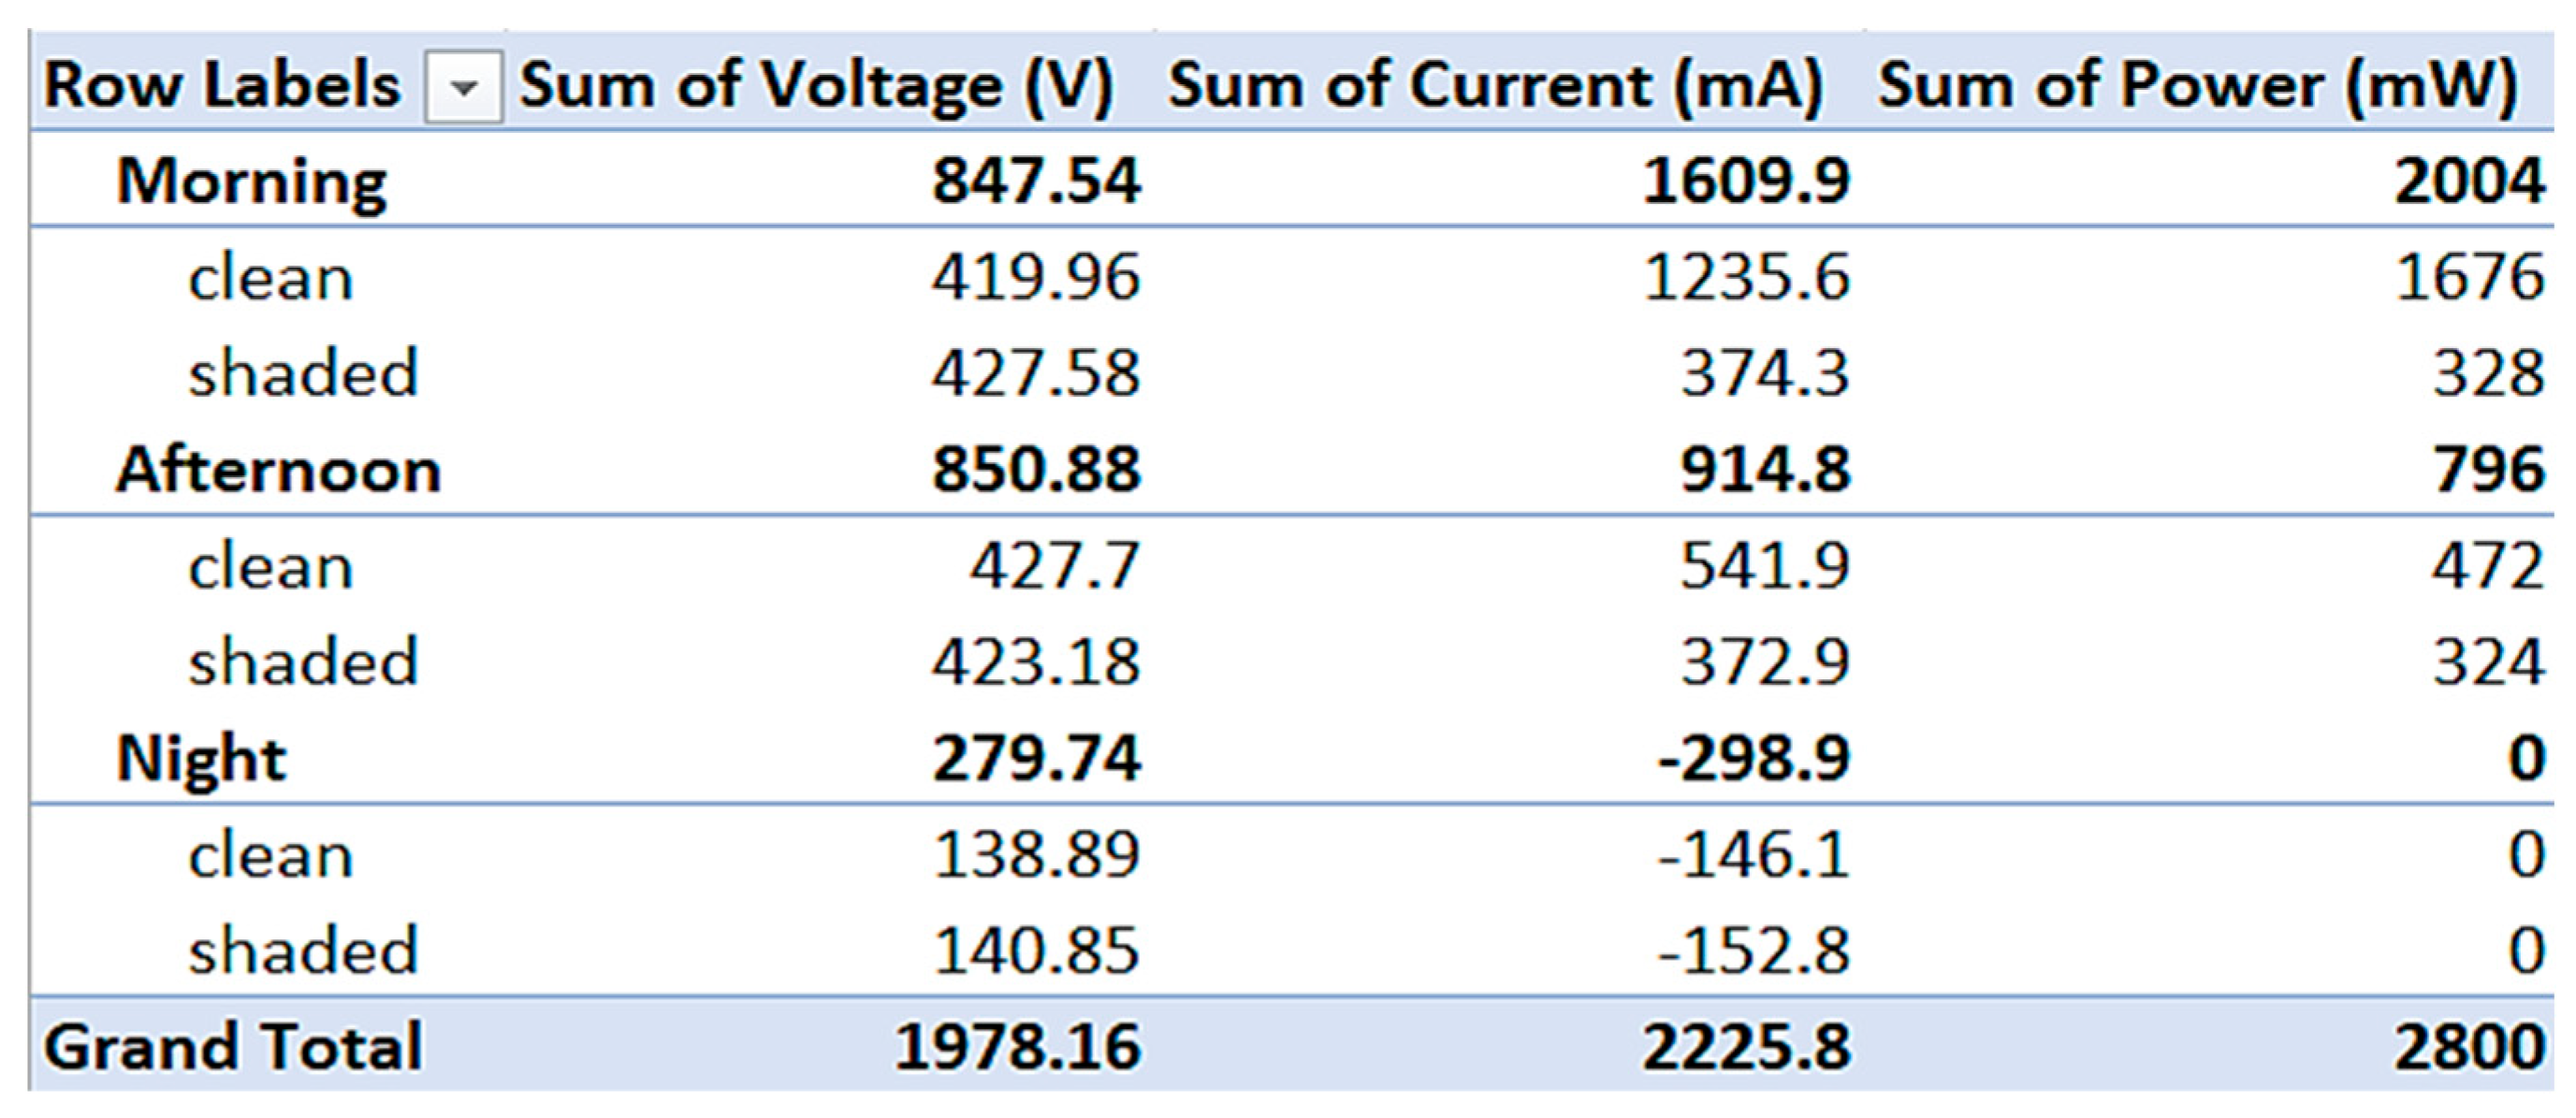 |
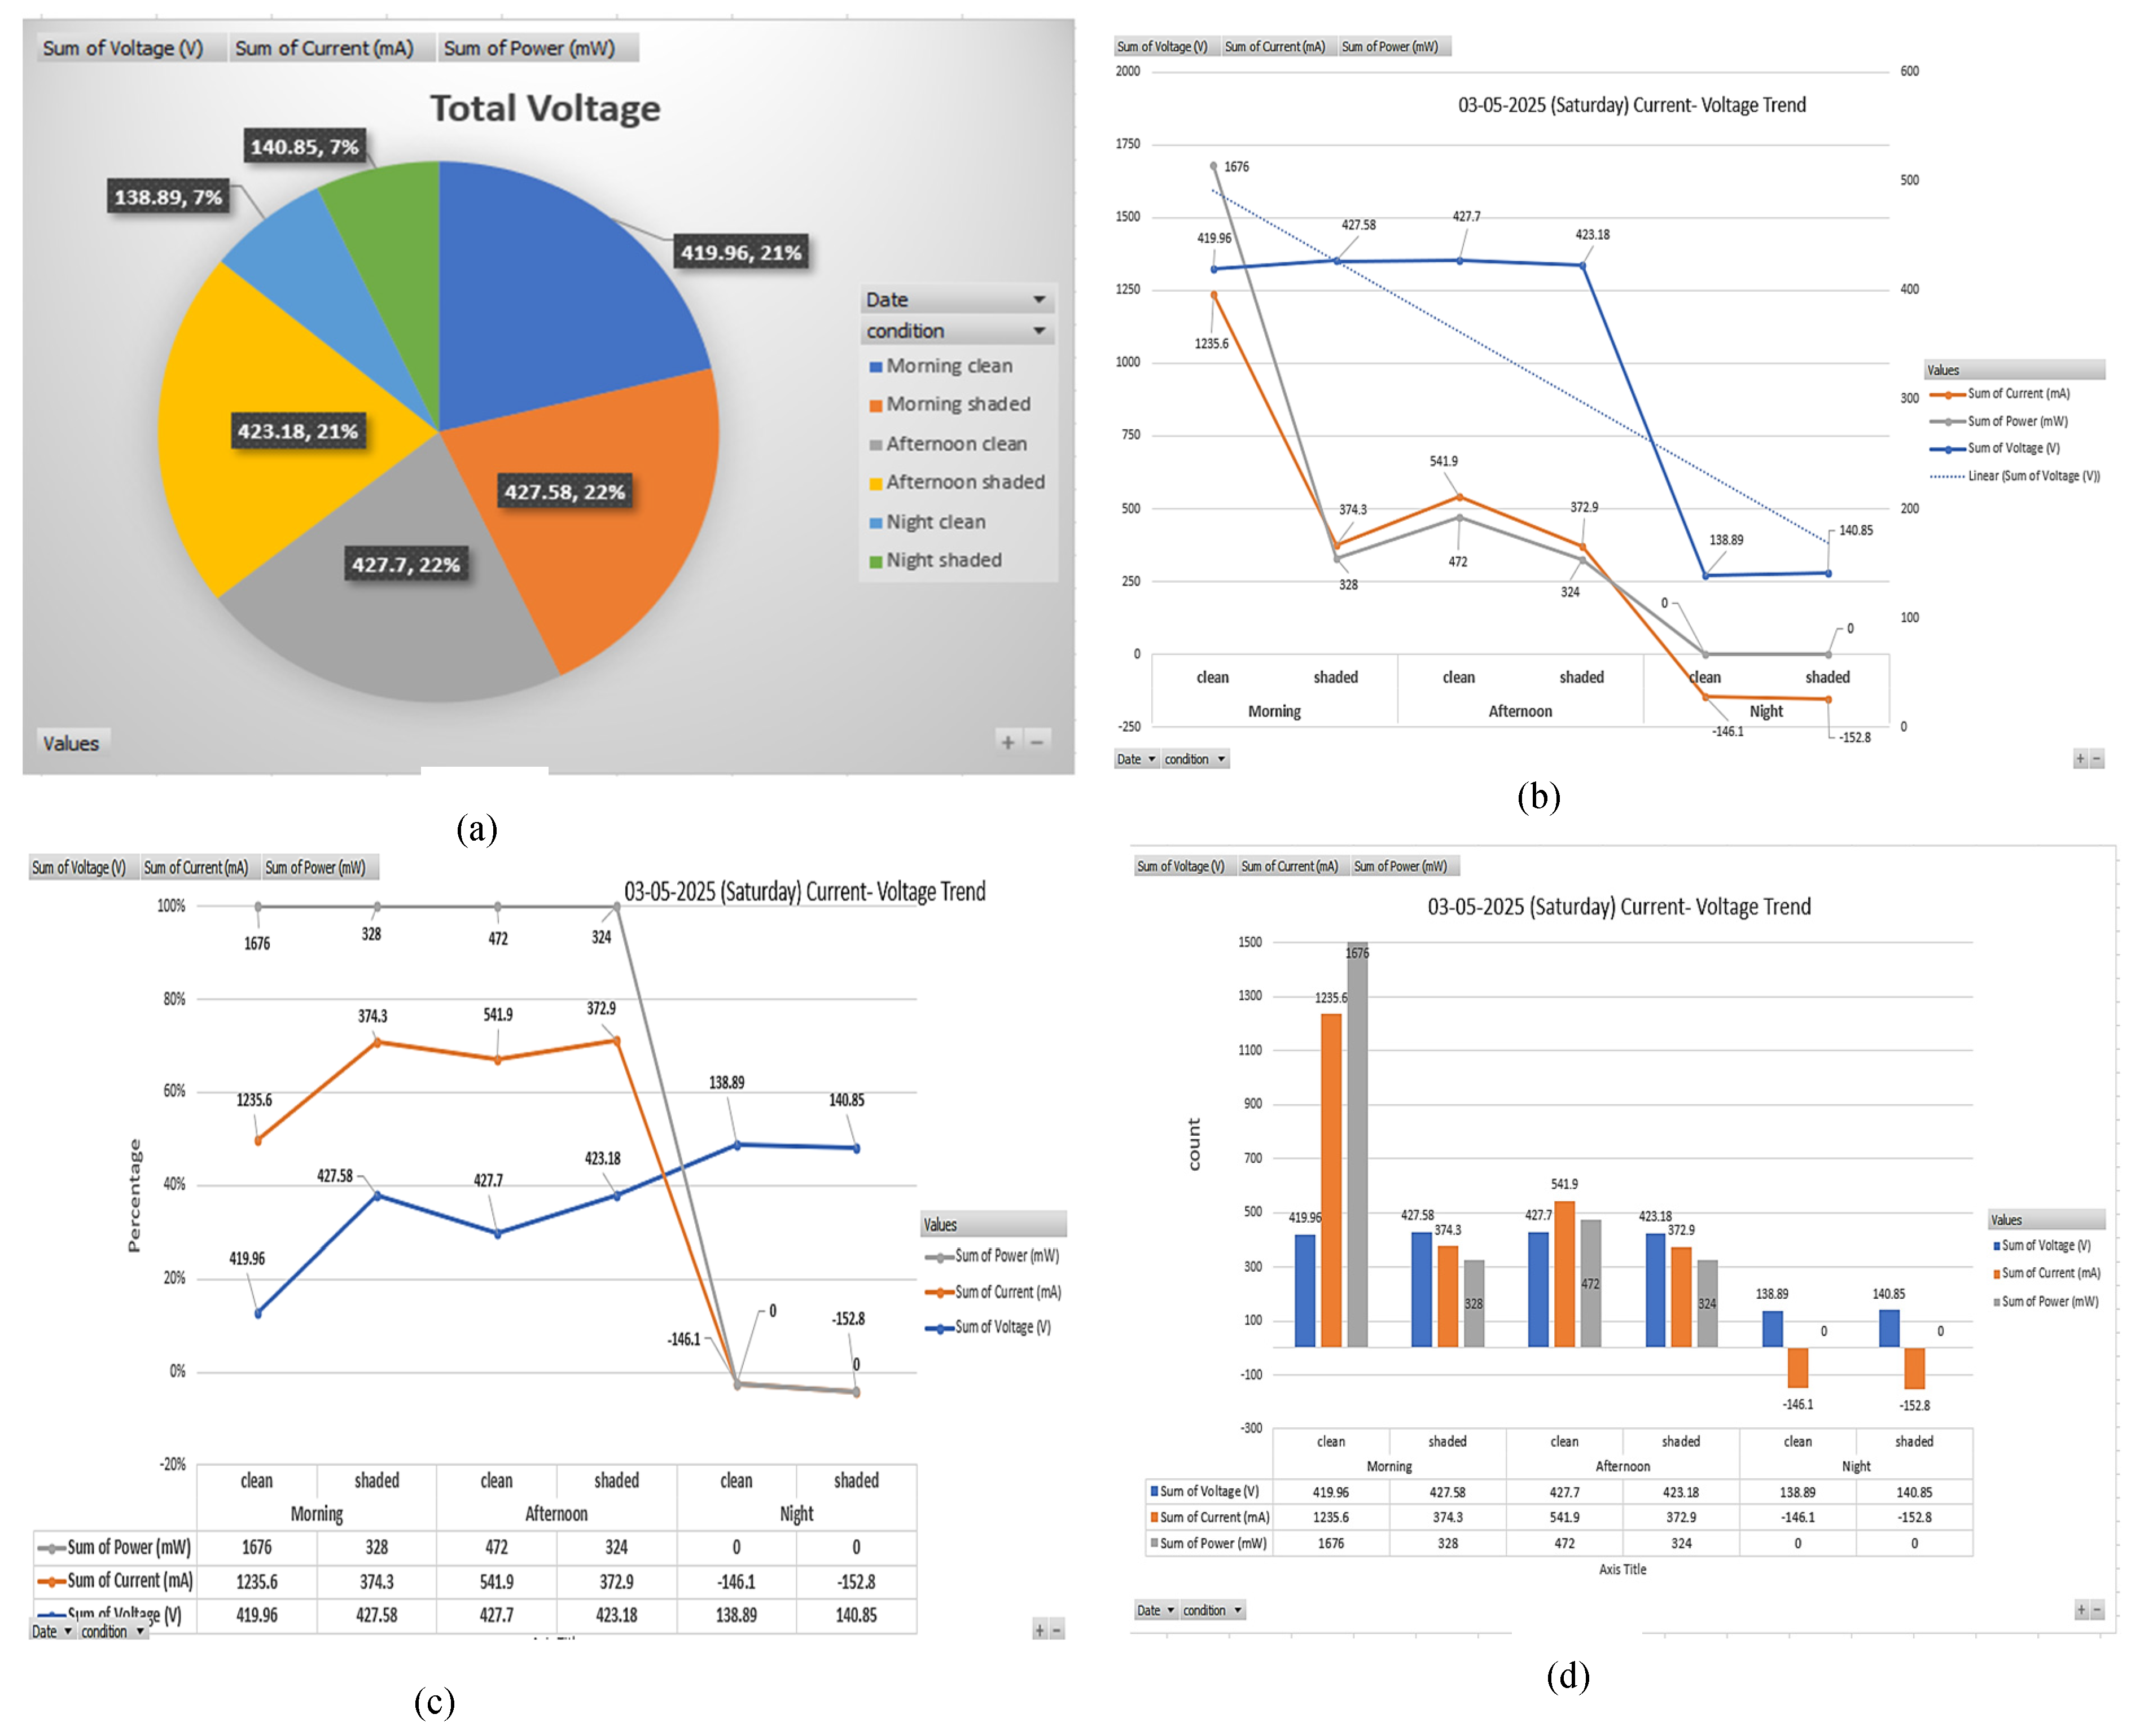
Figure 27.
Recorded data (a)Voltage comparison-pie chart(b)sensor electrical reading trend Line graph (c) Line graph (d) Clustered bar chart.
Figure 27.
Recorded data (a)Voltage comparison-pie chart(b)sensor electrical reading trend Line graph (c) Line graph (d) Clustered bar chart.
- 1)
- Voltage comparison – Pie chart Overview
The overall voltage contribution from each situation and time period is shown in the pie chart. This graph makes it clear that the afternoon hours have the highest voltage readings, with both clean (427.7 V) and shaded (427.58 V) circumstances accounting for 22% of the total. At about 21% each, morning cleanliness and shadowed circumstances also make a considerable contribution, with voltages of about 419.96 V and 423.18 V, respectively. Even under clean settings (138.89 V) and shaded situations (140.85 V), voltage values substantially decrease at night, making up only 7–8% of the total. Thus, it can be inferred that Voltage output is highest during daylight hours irrespective of dust, but it marginally drops in the presence of shading. Nighttime contribution is negligible, highlighting the dependence on sunlight.
- 2)
- Current-Voltage-Power trend -Line Graph
The line graph clearly shows the trend of voltage, current, and power across the day:
- Morning Clean: Exhibits the highest current (1235.6 mA) and power (1676 mW), indicating optimal solar output.
- Morning Shaded: A sharp drop in current (374.3 mA) and power (328 mW), suggesting dust/shade significantly hampers current flow
- Afternoon Clean: While voltage is similar to morning, current rises to 541.9 mA, but power drops to 472 mW.
- Afternoon Shaded: Results in a small decrease in both current (372.9 mA) and power (324 mW).
- Night Clean/Shaded: Both show zero or negative current and power, indicating no useful energy production.
- Thus, its inferred that Shading impacts current and power more severely than voltage. Clean conditions are crucial in the morning when irradiance is more efficiently captured.
- 3)
- Clustered Bar Chart – Quantitative Representation
A direct comparison of the situations is provided by the bar chart. The following are some important observations. Across all time zones, clean conditions result in noticeably higher current and power. No matter how clean the panel is, the voltage stays largely constant during the day. Negligible performance is further confirmed at night when values fall to almost zero or even negative power. Thus, its inferred that Cleaning significantly increases current output. The structure of the clustered bars emphasizes how maintenance affects solar panel performance, particularly during the hours of most sunlight.
- 4)
- Regression/Trend line Graph – Percentage Drop Visualization
The percentage trend of each of the three factors is shown in this graph, emphasizing: Overall, clean panels continuously display greater percentages. In darkened settings, even fairly stable voltage might show sharp decreases in power and current. Regression lines show that performance steadily declines as light levels drop or dust/shade levels rise. Thus The current and power exhibit exponential decline with panel dustiness and low-light conditions, although the voltage can stay largely unchanged. This facilitates the incorporation of real time monitoring and cleaning processes.
- E.
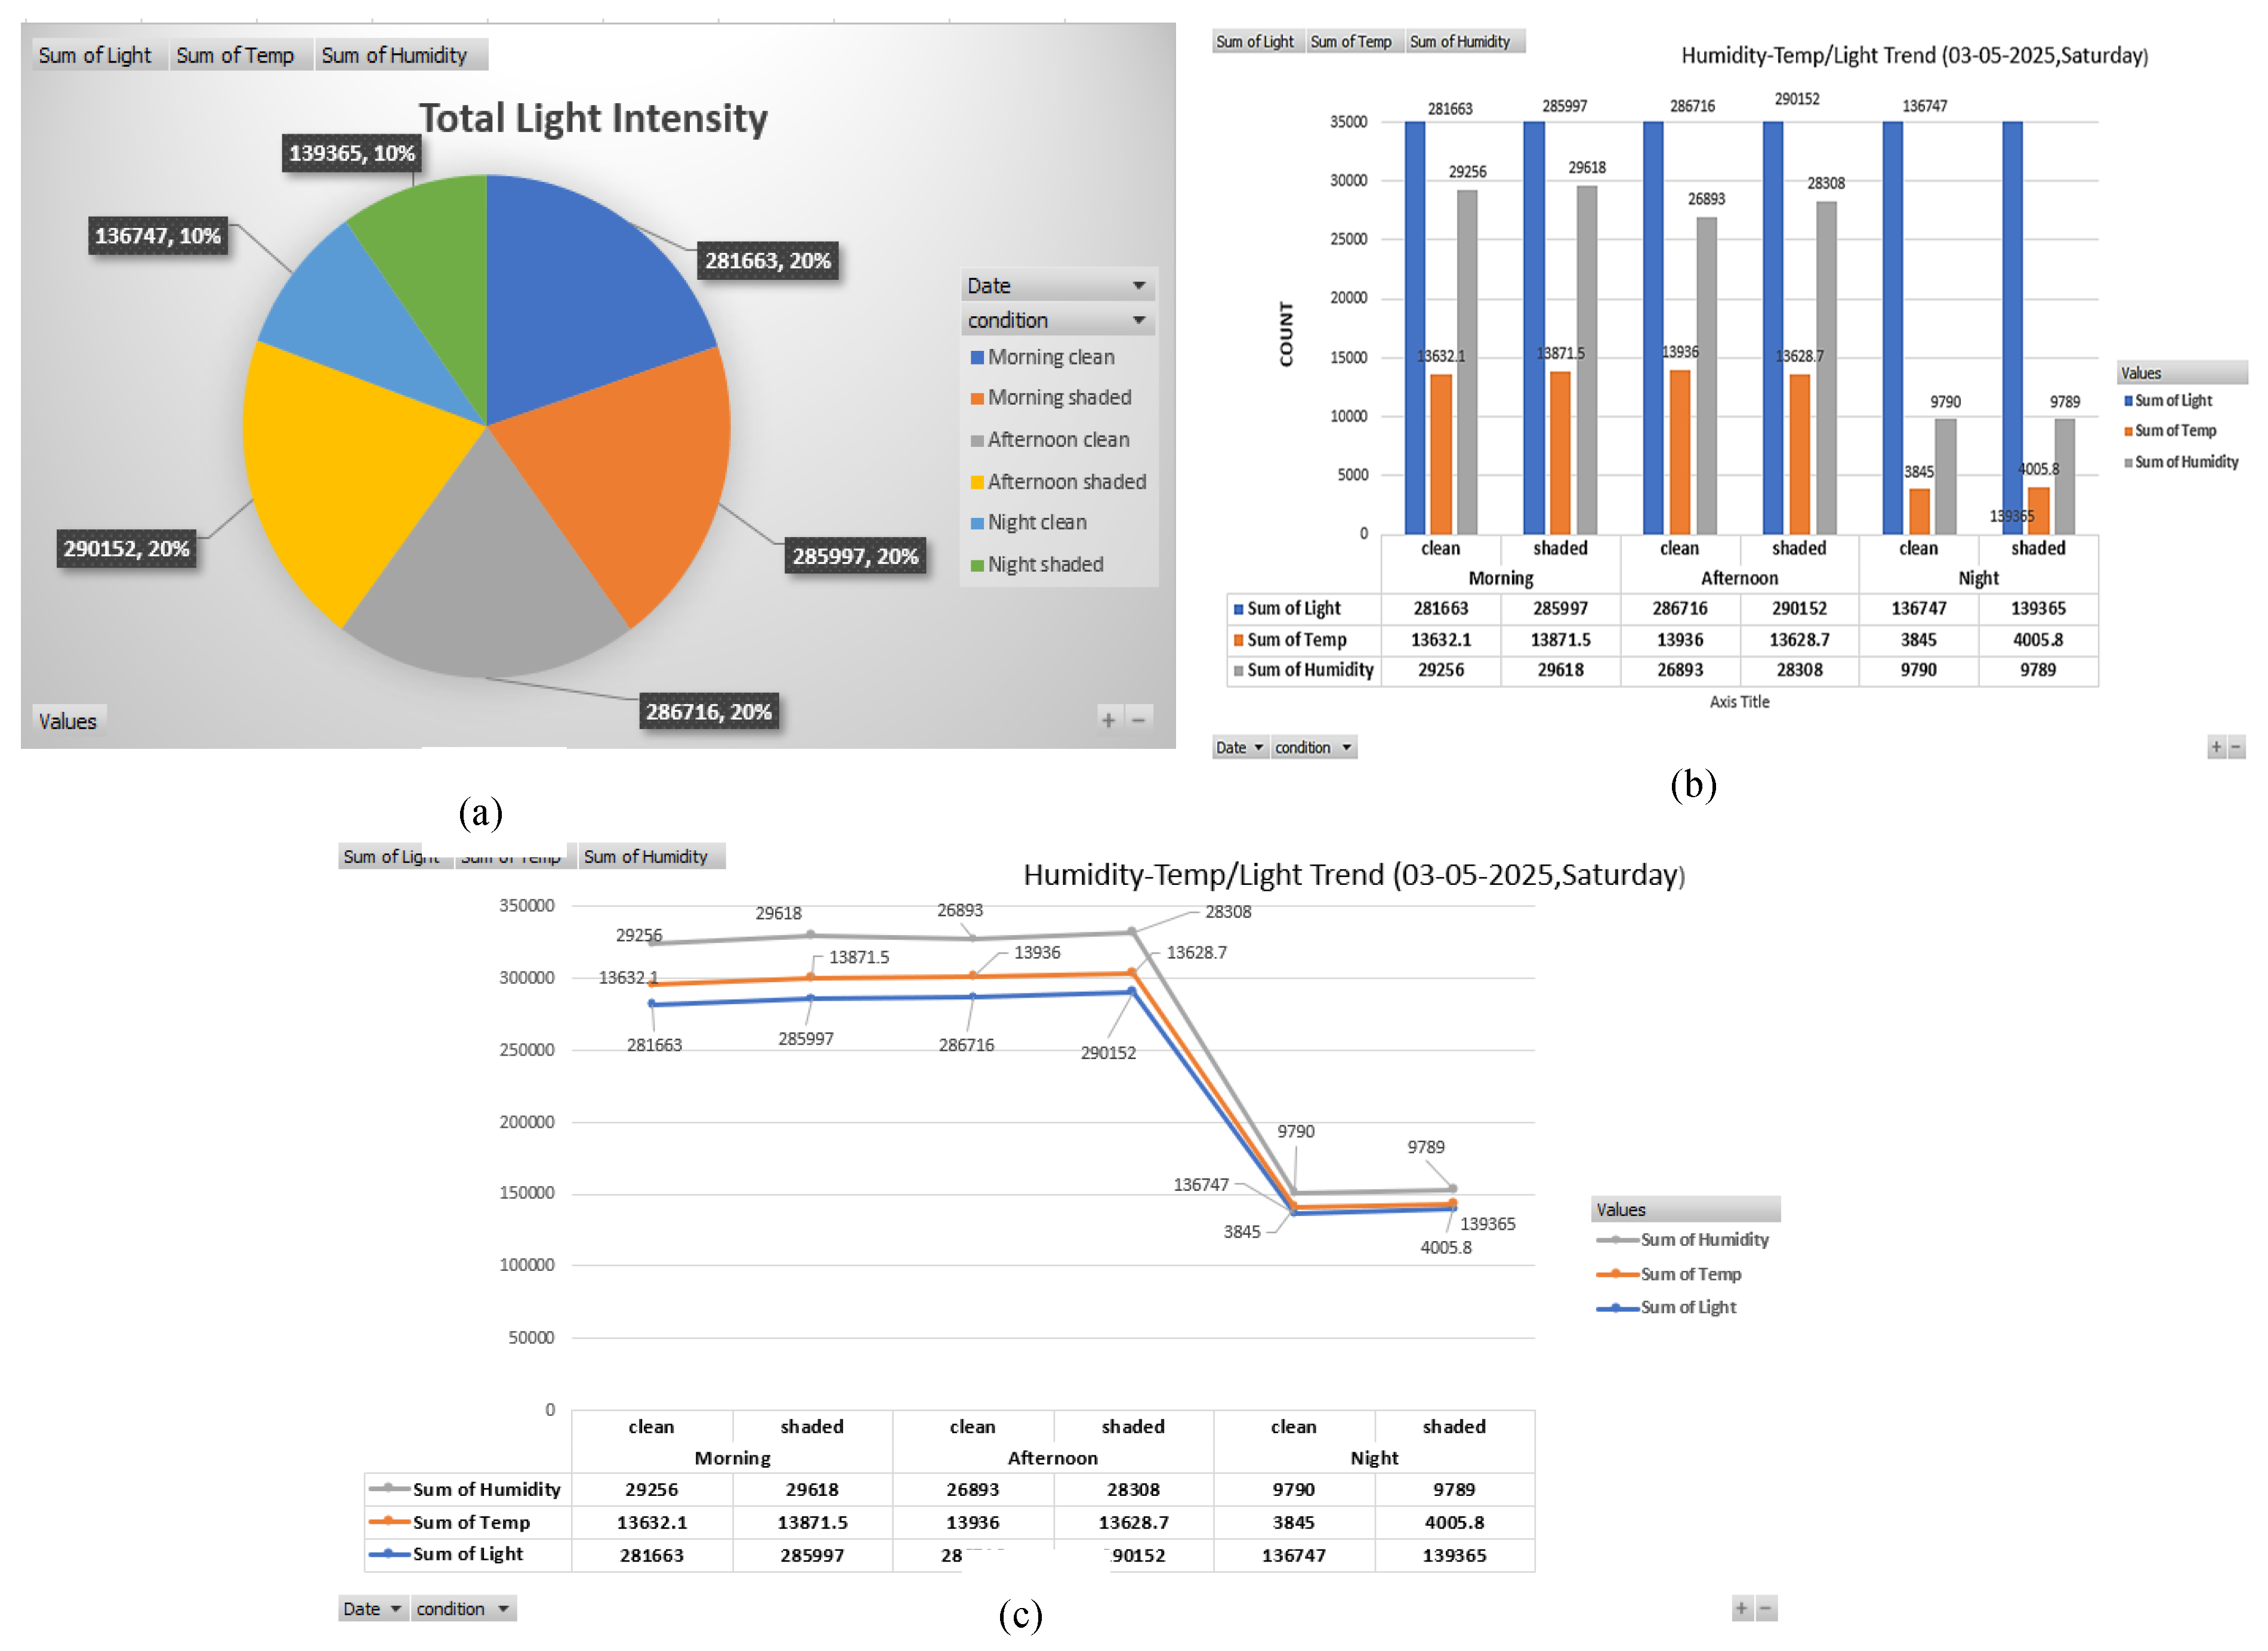
- Humidity-temp-Light Intensity Trend
Table 4.
Pivot summary of sensor electrical readings.
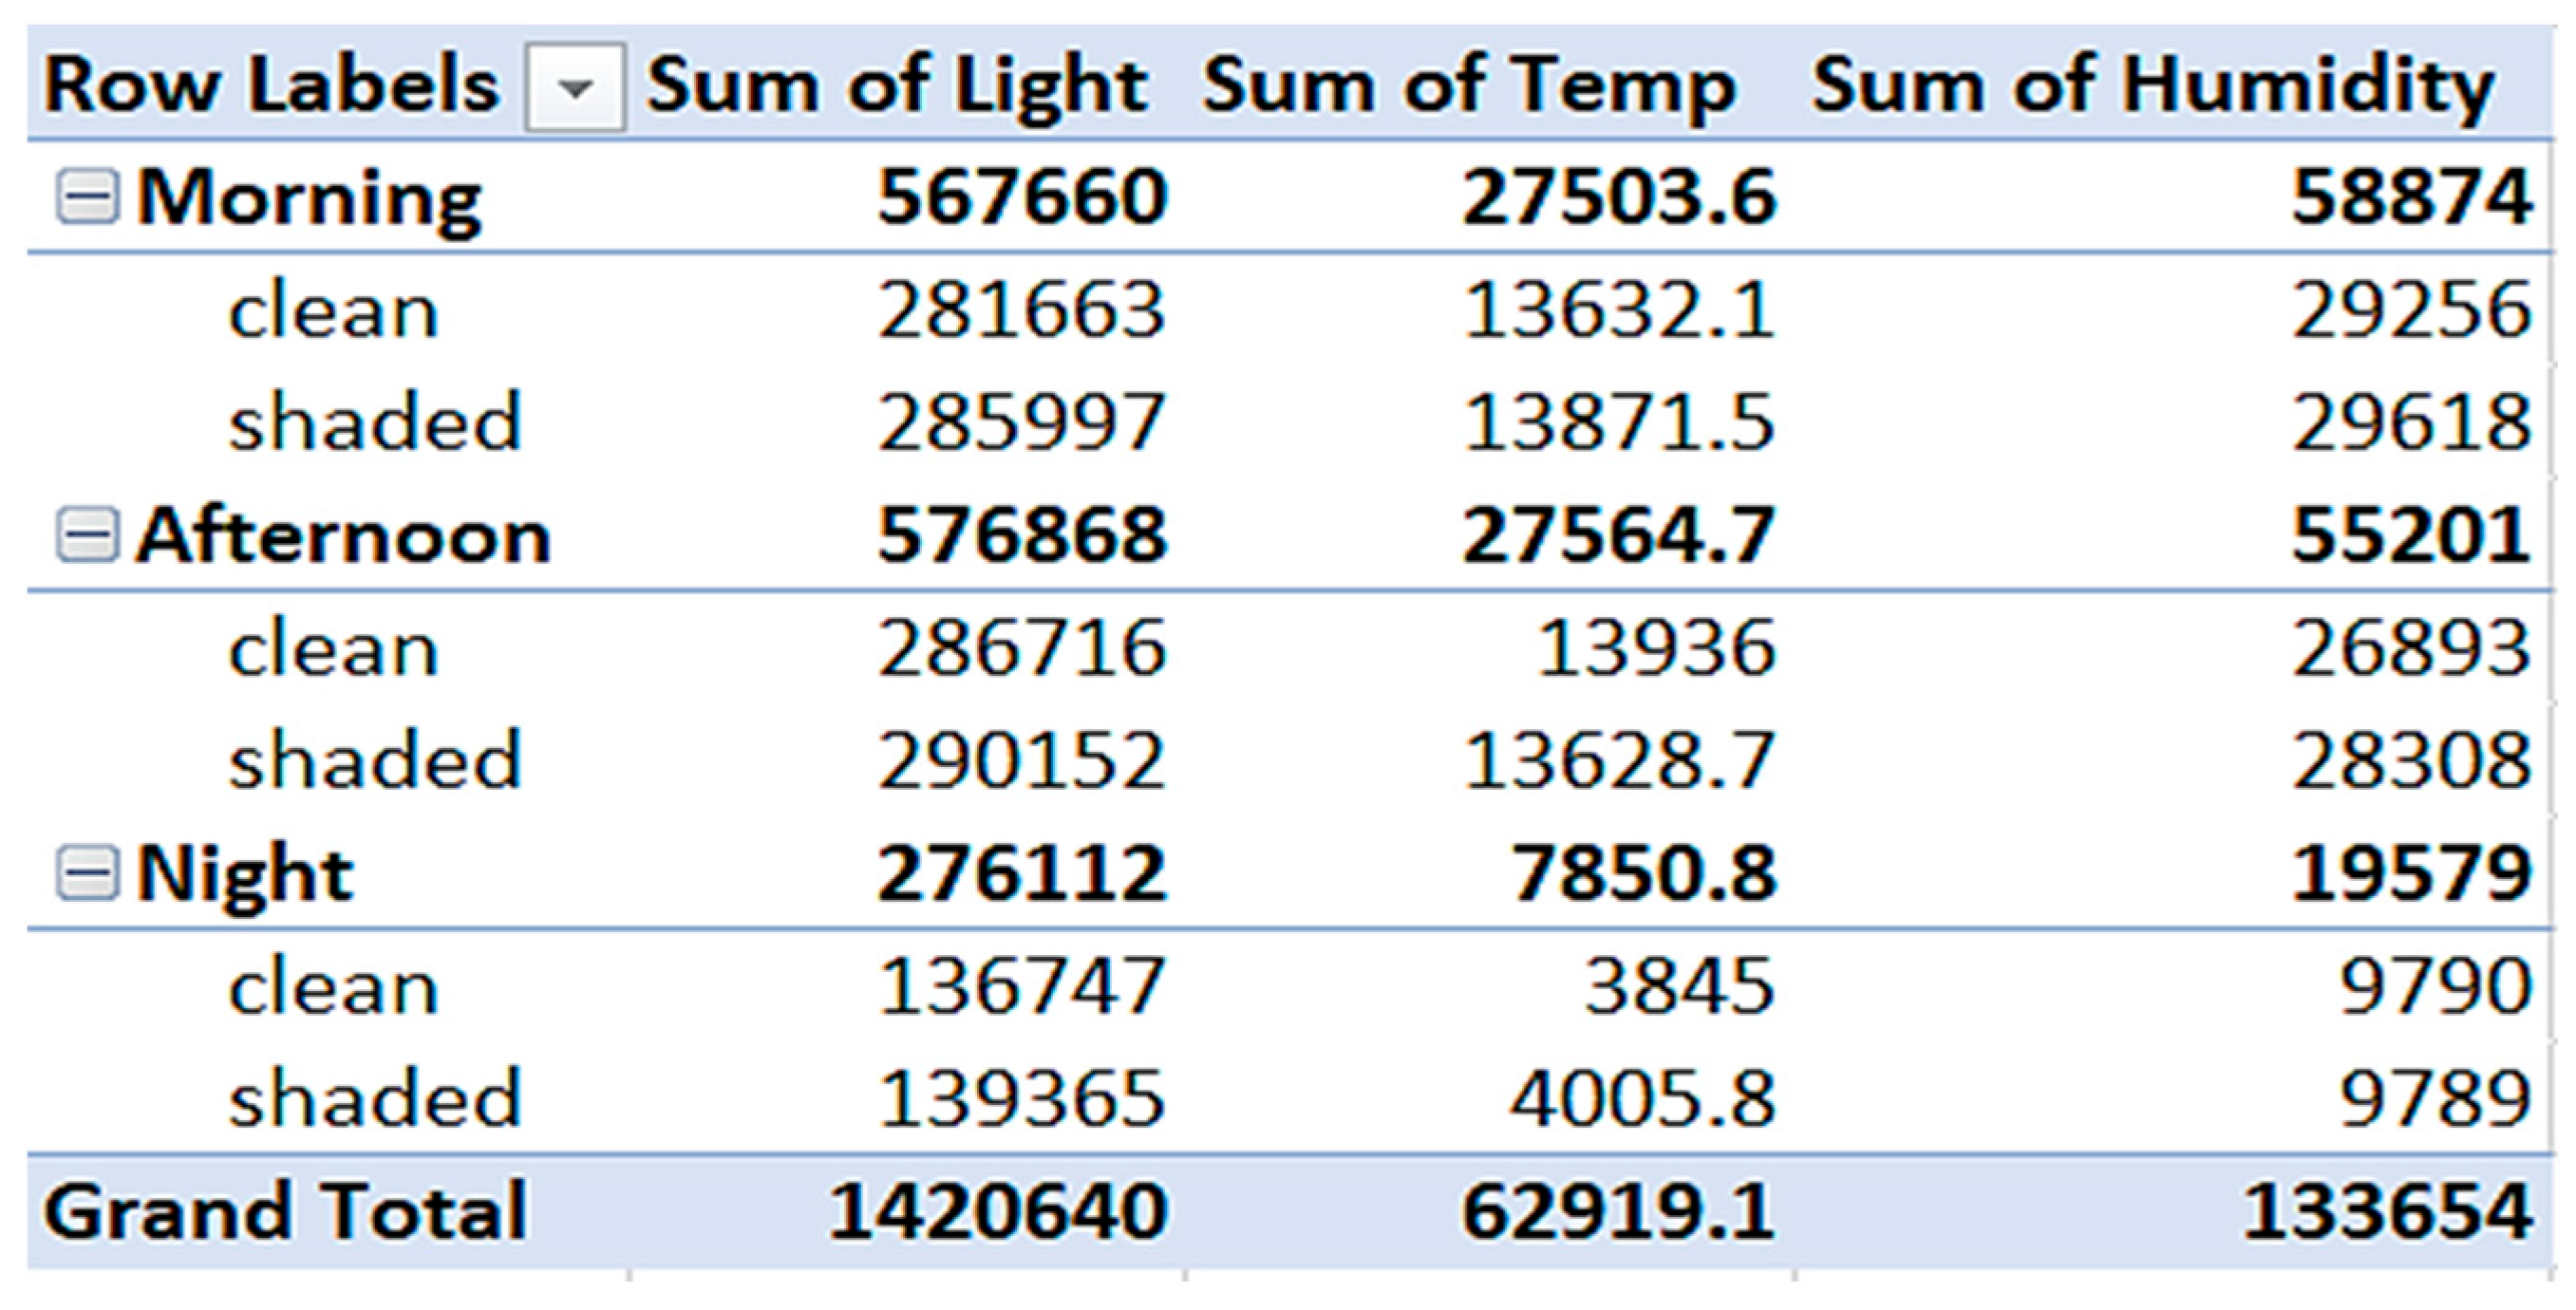 |
Figure 28.
Recorded data (a)Voltage comparison-pie chart(b) Clustered bar chart (d) sensor environmental reading trend Line graph.
Figure 28.
Recorded data (a)Voltage comparison-pie chart(b) Clustered bar chart (d) sensor environmental reading trend Line graph.
- 5)
- Voltage comparison – Pie chart Overview
The overall amount of light is somewhat lower (~10%) at night and almost equal (~20%) in the morning and afternoon (clean/shaded). Significantly lower night values (both clean and shadowed) suggest less solar activity.
- 6)
- Clustered Bar Chart Analysis
- Morning: Shaded panels recorded slightly higher light intensity, temperature, and humidity than clean ones. This could be due to reflected ambient light or residual heat on dirty surfaces.
- Afternoon: Again, shaded panels show slightly higher temp and humidity, but light intensity is highest in clean panels. This suggests that dust reduces direct light absorption but may trap more heat and moisture.
- Night: Both clean and shaded conditions show very low values. Slightly higher humidity and temp on shaded panels, possibly due to the heat retention of dust.
- 7)
- Line Graph Analysis
All three measures show a sharp decline at night, which supports the anticipated diurnal fluctuation. Higher light absorption is continuously possible with clean panels, which is particularly apparent in the afternoon. Higher temperatures and humidity levels in shaded panels might hasten panel deterioration or eventually impair performance. Thus it is inferred from the observation that afternoon is when the light is at its strongest, especially when the air is clear. Because of the retained heat and moisture, shaded (dusty) panels continuously display higher temperatures and humidity levels. Light capture, which is essential for solar performance, is improved by clean panels.
- F.
- Overall Sensor Value Trend
Based on the above graphs that display sensor trends (humidity, temperature, light intensity, voltage, current, and power) under various settings (clean vs. shaded panel) during the morning, afternoon, and night, the following is a succinct and organized analysis and discussion: With regard to the value in the below table, the data-logged charts, which include pie charts, bar charts, clustered bars, and trend lines, are now displayed below.
Table 5.
Pivot summary of overall measured sensor parameters.
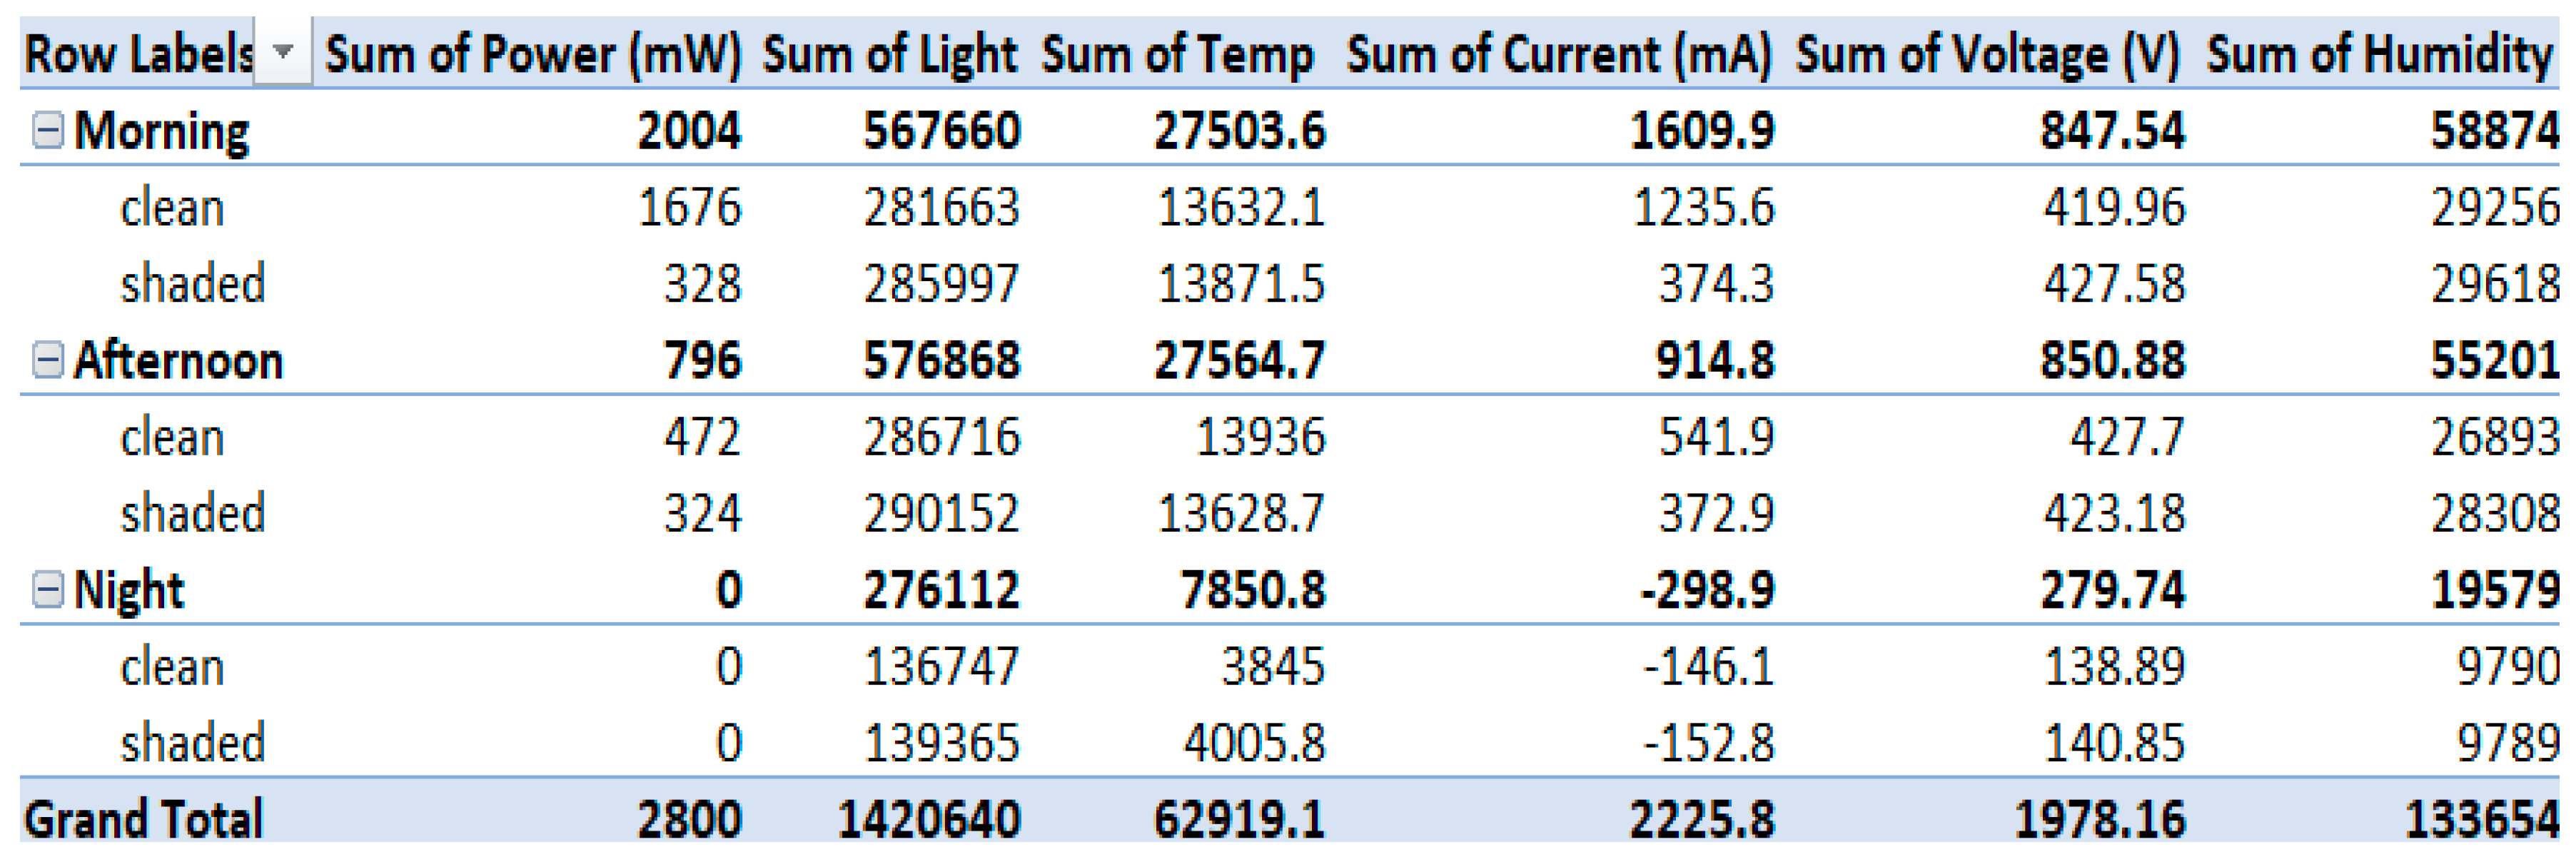 |
Figure 29.
Recorded data (a)Power comparison-pie chart(b) Clustered bar chart (d) Overall sensor reading trend Line graph.
Figure 29.
Recorded data (a)Power comparison-pie chart(b) Clustered bar chart (d) Overall sensor reading trend Line graph.
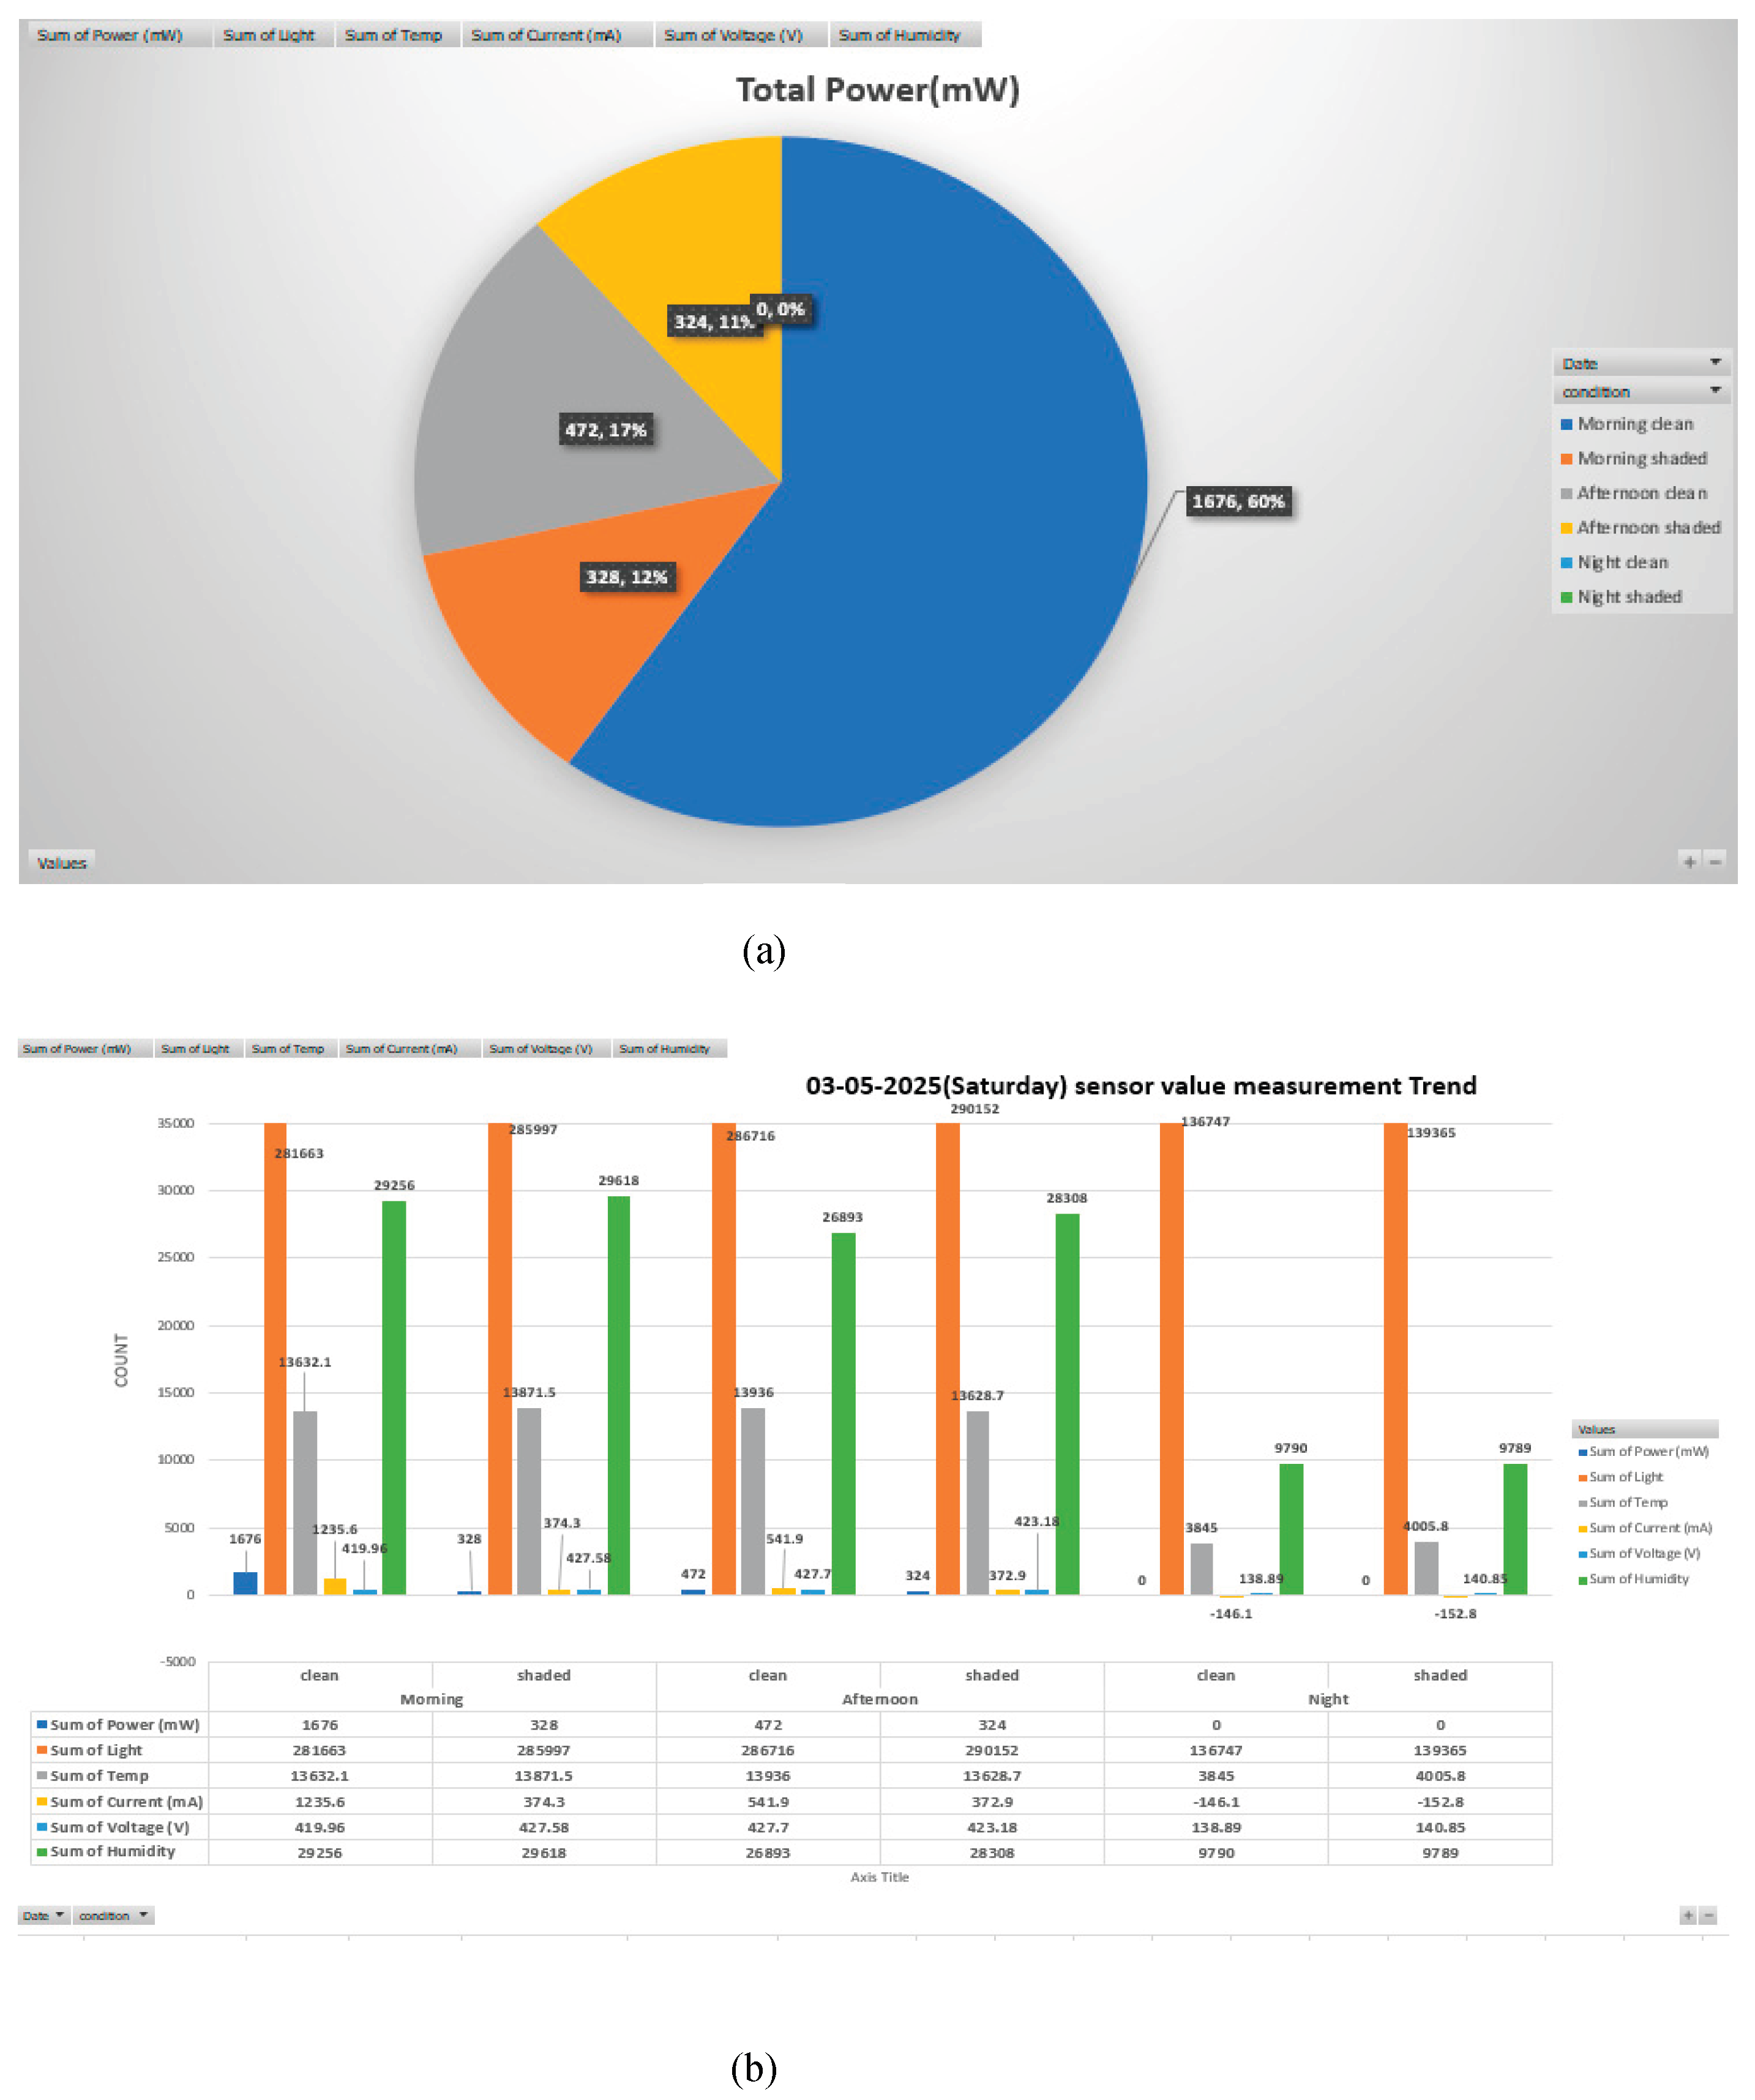
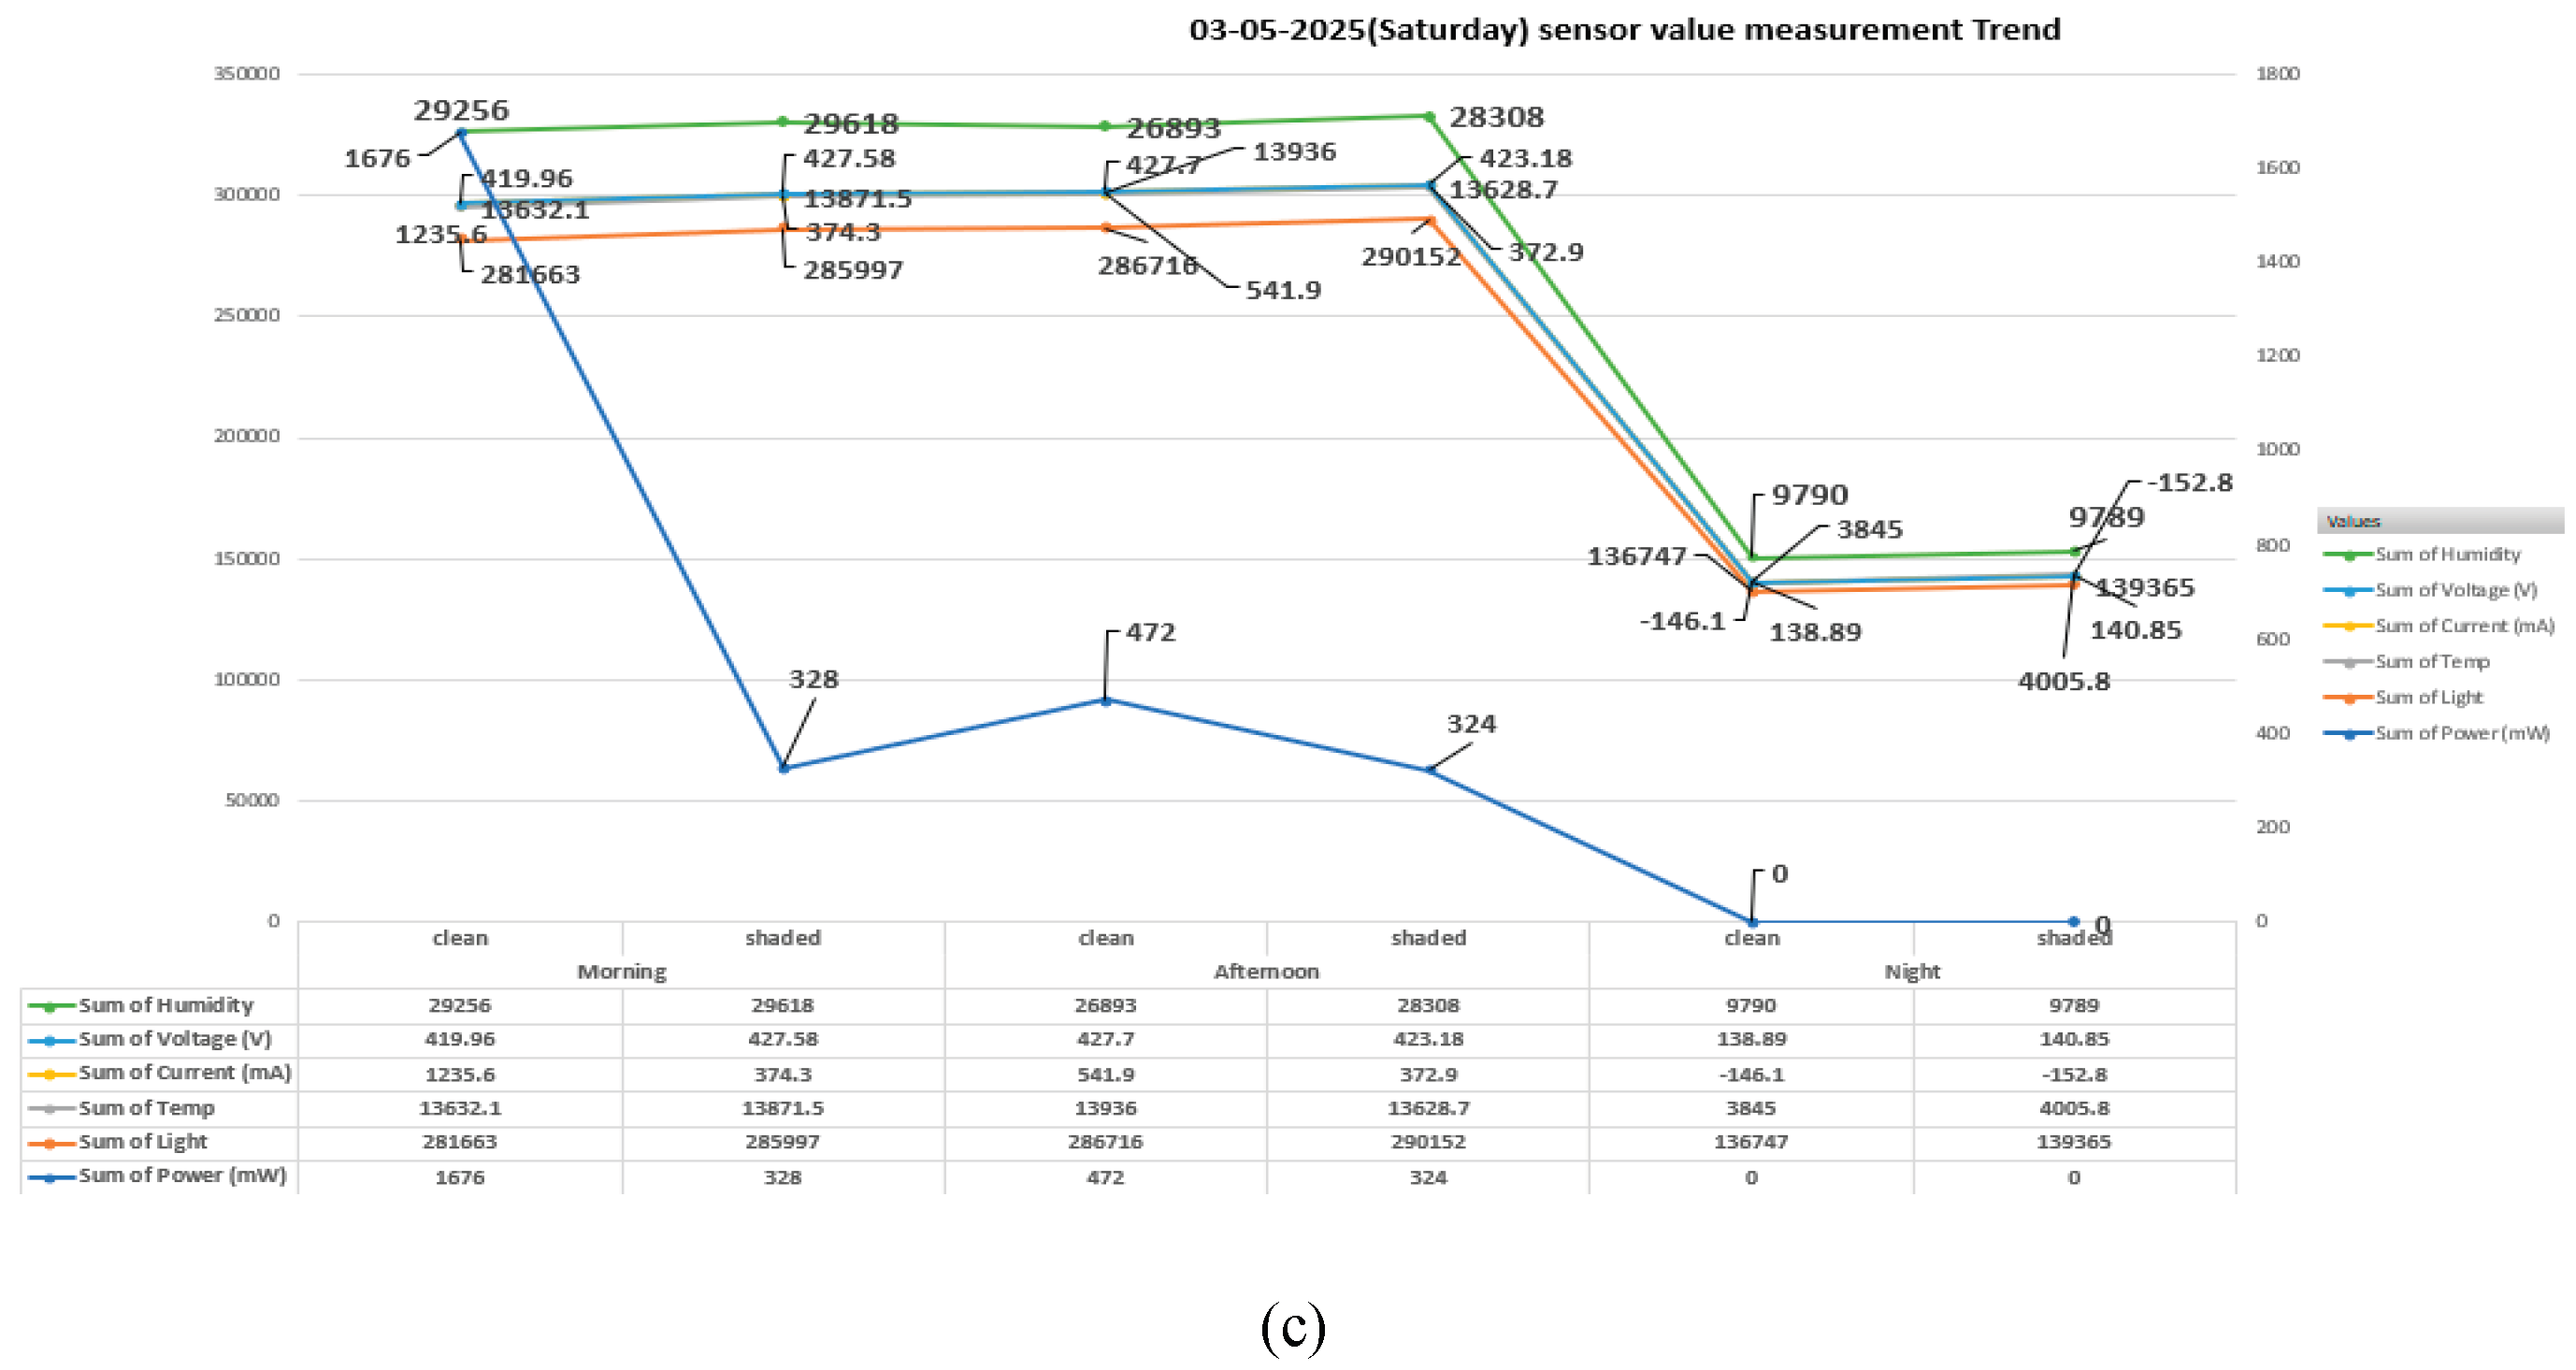
- 8)
- Total Power (Pie Chart)
- Morning clean panel condition contributes the highest power output at 60% (1676 mW).
- Afternoon clean and shaded panel condition contribute 17% (472 mW) and 11% (324 mW) respectively.
- Morning shaded yields 12% (328 mW).
- Both night clean and shaded panel condition produce 0 mW.
- Thus, it can be inferred that Morning clean conditions are optimal for power generation. Shading significantly reduces power generation at all times. Also, no power is generated at night, regardless of cleanliness.
- 9)
- Clustered Bar Chart (Sensor Trend by Time and Condition)
- Light Intensity (Sum of Light): -Highest in morning and afternoon (clean and shaded). Drops drastically at night, confirming no solar input. Clean panels consistently receive more light, though marginally in morning/afternoon.
- Temperature (Sum of Temp): -Similar values across all daylight conditions. Falls at night drastically (e.g., 3845 and 4005.8). Shading doesn't greatly impact temperature.
- Humidity (Sum of Humidity): -High during daytime, slightly higher in shaded conditions. Drops at night (~9790), indicating cooler, more humid conditions at night.
- Voltage (Sum of Voltage): -Consistent across clean and shaded during day (~419–427 V). Drops at night (~138–140 V), reflecting poor solar activity.
- Current (Sum of Current): -Highest during morning clean (1235.6 mA). Decreases with shading and in the afternoon. Turns negative at night, suggesting either sensor anomaly or measurement offset (no generation, only draw or zero current).
- Power (Sum of Power): -Peaks in morning clean, aligns with high current and light. Drops progressively through afternoon and with shading. Zero at night, consistent with no light.
- 10)
- Regression Line Graph
Power drops sharply from morning clean to shaded, dips further in the afternoon, and flatlines at night. Voltage and humidity show minor variation across daylight conditions but drop at night. Current trends mimic power, showing its dependence on irradiance and panel condition. Light intensity correlates directly with power generation. Temperature shows minimal impact on power, but extreme dips at night.
- G.
- Overall Panel Efficiency
Now the panel efficiency can be calculated in per cent by the given formula of
Panel Efficiency (%) = Output power(W) x 100
Input Solar power(W)
Input Solar Power (W) = Solar energy incident on the panel= Solar Irradiance (W/m²) × Area of the panel (m²). Therefore, input solar power = 1000 w/m^2 x panel area
Where:
Efficiency (%) = Pout
(G X A)
- Pout = Output power in watts
- G = Solar irradiance (W/m²)
- A = Area of the panel (m²)
Table 6.
Pivot summary on panel efficiency across conditions.
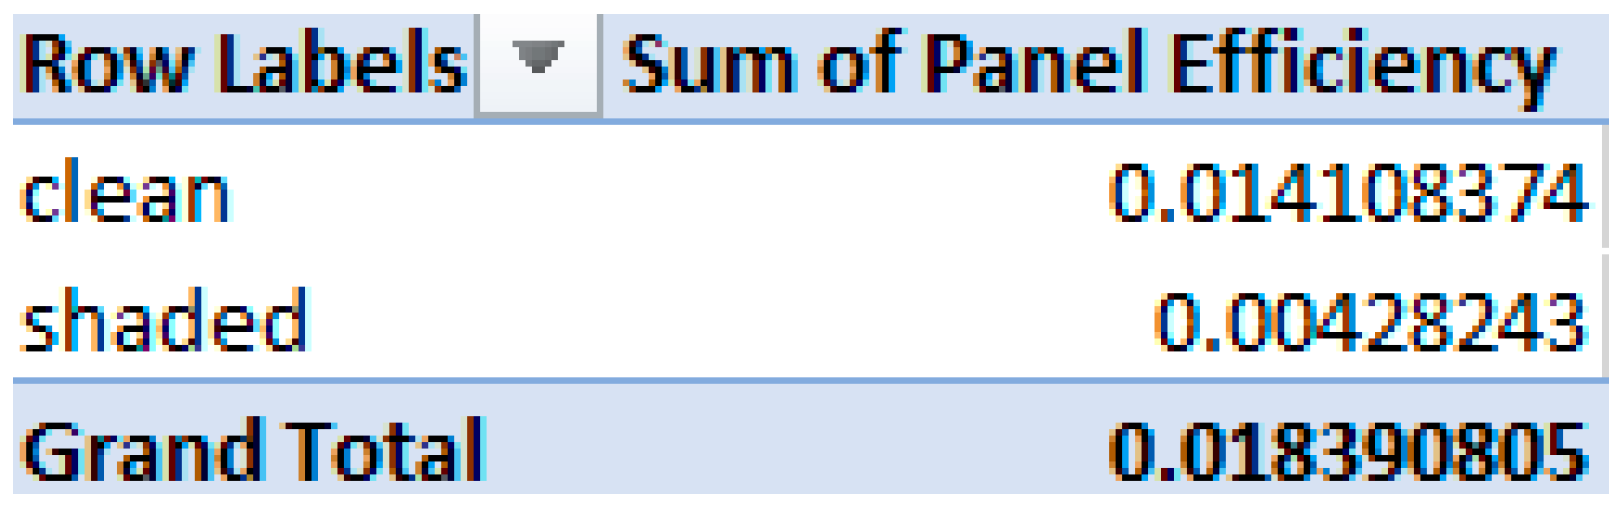 |
Figure 30.
Recorded data (a)Panel efficiency proportional comparison-pie chart(b) bar chart panel condition visualization.
Figure 30.
Recorded data (a)Panel efficiency proportional comparison-pie chart(b) bar chart panel condition visualization.
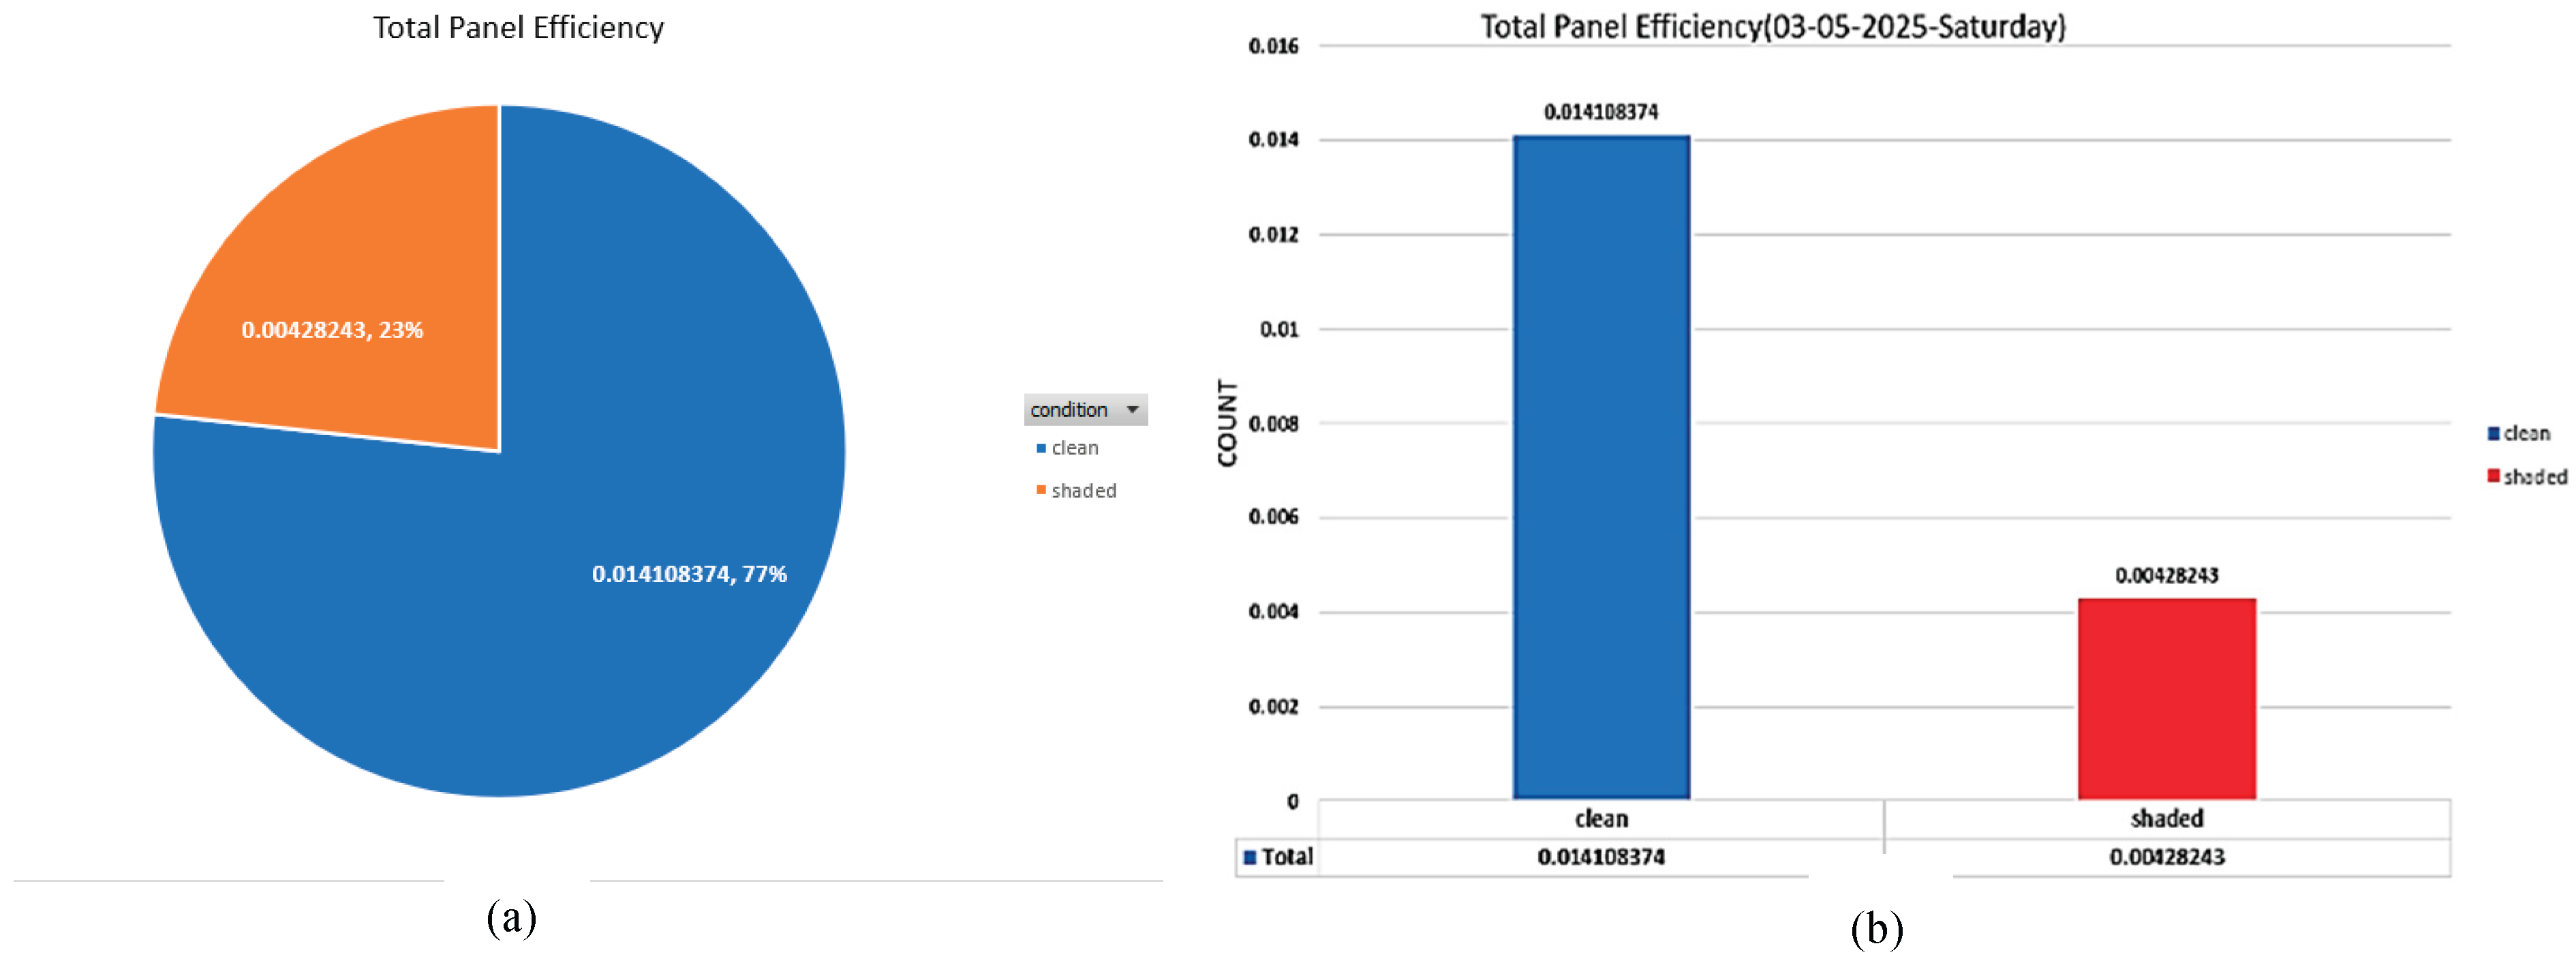
Table 7.
Pivot summary on panel efficiency across timeline.
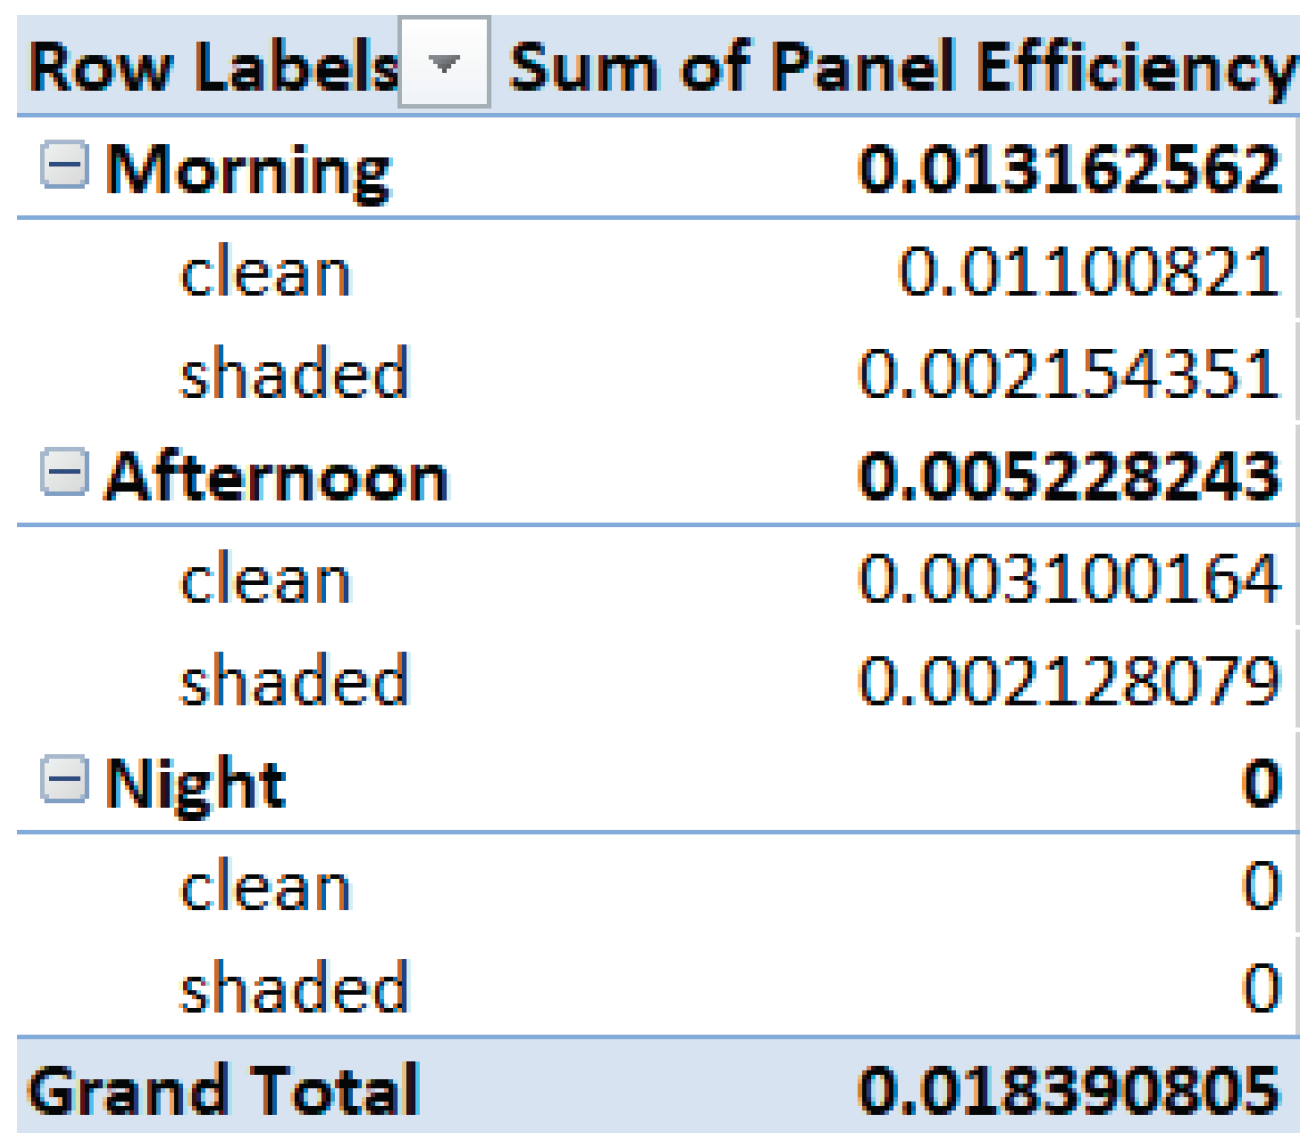 |
Figure 31.
Recorded data (a)Panel efficiency bar timeline comparison-pie chart(b) Line graph panel efficiency visualization.
Figure 31.
Recorded data (a)Panel efficiency bar timeline comparison-pie chart(b) Line graph panel efficiency visualization.
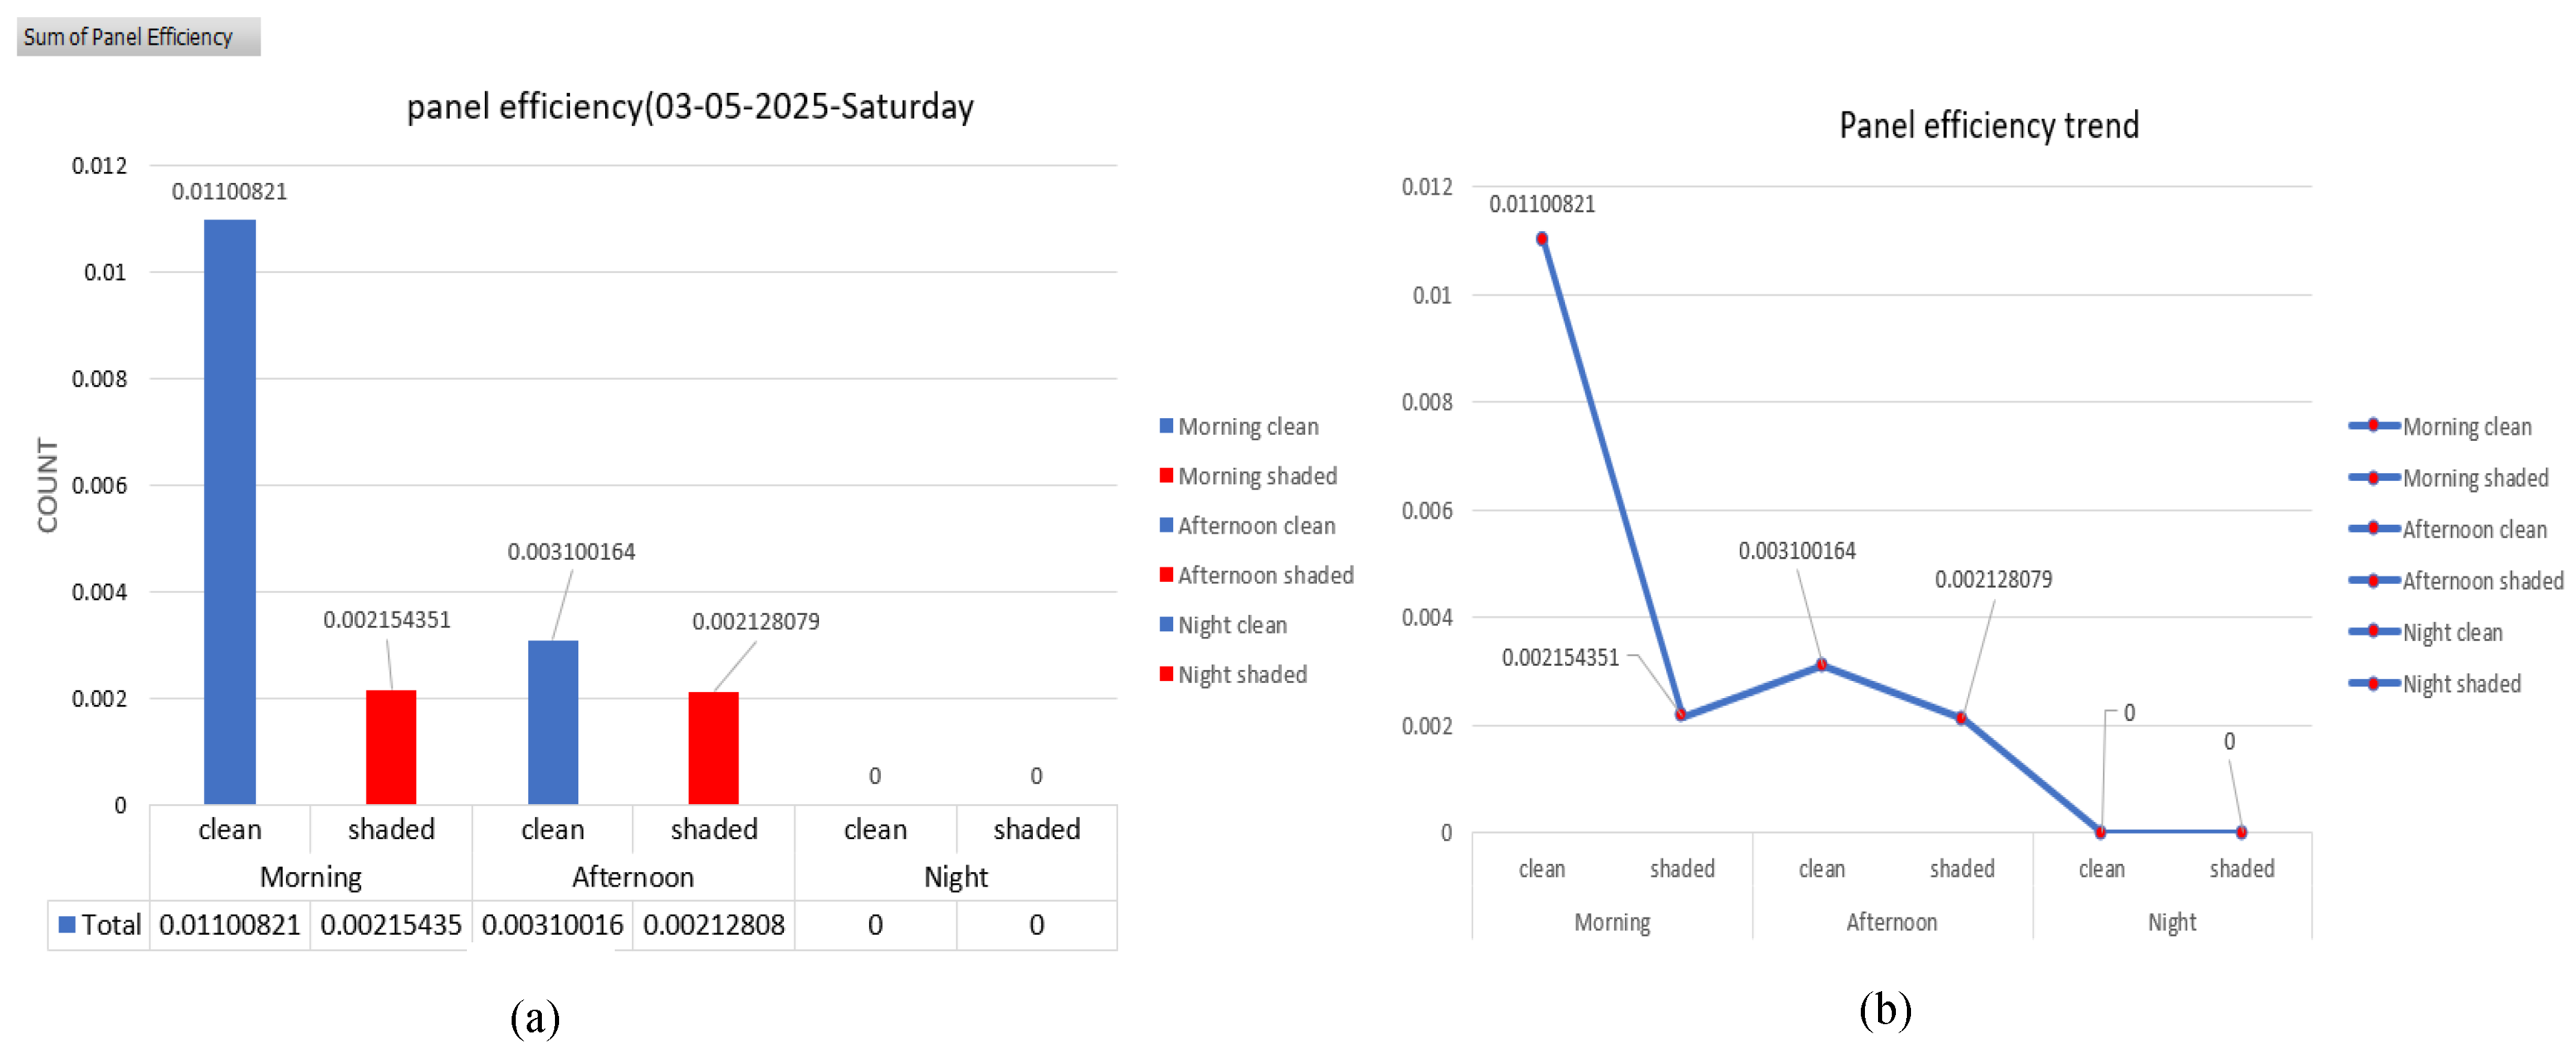
- 11)
- Pie chart: Total Panel Efficiency Distribution
Clean Panels: Account for 77% of total panel efficiency (0.014108374).
Shaded Panels: Contribute only 23% (0.00428243).
Thus, it can be inferred from above observation that clean panels outperform shaded ones by a large margin—over three times more efficient. This highlights the significant impact of shading on solar panel performance. Regular cleaning or strategic placement to avoid shading is crucial for optimizing energy yield.
- 12)
- Bar chart: Total Panel Efficiency
The chart Reinforces pie chart data numerically. It shows panel Efficiency as Clean: 0.014108374, Shaded: 0. 00428243.Thus it Clearly illustrates the magnitude of difference. Clean panels nearly triple the efficiency output of shaded panels. Operational recommendation: Maintain panels free of obstructions (dirt, foliage, buildings) to preserve efficiency.
V. Conclusion
Through the seamless integration of edge AI using YOLOv8, automated cleaning control, and IoT-based sensor fusion, the proposed technology offers a complete, intelligent, and affordable solution for autonomous solar panel maintenance. The system efficiently tracks electrical and environmental data in real time, such as temperature, humidity, light intensity, voltage, current, and power, using sensors like DHT11, LDR, and INA219 in addition to a Raspberry Pi and Pi Camera. To evaluate the health of the panel surface, the recorded data is combined with computer vision-based brightness analysis and picture classification using a blank YOLOv8 model. Exact decision-making is made possible by the fusion logic, which only initiates cleaning in confirmed dusty or performance-degrading circumstances. Accurate detection, prompt cleaning activation, and dependable power restoration after cleaning are all demonstrated by experimental data recorded and displayed using ThingSpeak, confirming the efficacy of this intelligent monitoring framework over a range of time periods, including morning, afternoon, and evening. This system's installation not only lessens the need for manual inspections and energy losses brought on by dust buildup, but it also shows how microcontroller-based automation and edge computing driven by AI may be combined to create sustainable energy systems. The system is ideal for off-grid applications and scalable smart solar infrastructure in real-world deployments due to its modularity, low power consumption, and remote visualization capabilities.
References
- K. Ranabhat, L. Patrikeev, A. A. Revina and K. Andrianov, “An introduction to solar cell technology,” vol. 14, pp. 481 - 491, 15 December 2016.
- A. O. Maka and J. M. Alabid, “Solar energy technology and its roles in sustainable development,” Clean Energy, vol. 6, no. 3, p. 476–483, 11 June 2022. [CrossRef]
- K. Vyas, “Solar Farming with Agricultural land,” ACTA SCIENTIFIC AGRICULTURE, vol. 3, pp. 23-25, 10 October 2019. [CrossRef]
- D. A. Widodo, P. Purwanto and H. , “Potential of Solar Energy in Residential Rooftop Surface Area in Semarang City, Indonesia,” Advances in Science, Technology and Engineering Systems, vol. 5, pp. 397-404, 2020. [CrossRef]
- W. Javed, B. Guo, Y. Wubulikasimu and B. W. , “Photovoltaic performance degradation due to soiling and characterization of the accumulated dust,” in 2016 IEEE International Conference on Power and Renewable Energy, ICPRE 2016, Shanghai, 2017. [CrossRef]
- L. A. Lamont and L. E. Chaar, “Automatic Versus Manual Solar Panel Cleaning for Remote Locations,” Journal of Technology Innovations in Renewable Energy, vol. 2, pp. 98-105, 2013.
- K. Srinivasan , D. Vimaladevi and D. Chakravarthi , “Solar Energy Monitoring System by IOT,” International Journal of Advanced Networking and Application (IJANA), pp. 46-51, January 2019.
- M. Gopal, T. C. Prakash, N. V. Ramakrishna and B. Prabhanjan, “IoT Based Solar Power Monitoring System,” IOP Conf. Series: Materials Science and Engineering, vol. 981, pp. 1-7, 19 December 2020. [CrossRef]
- B. S. Thrinath, B. L. Prasanna, J. Powl.S, N. S. Reddy and N. K. , “Real Time Monitoring and Analysis of String Faults in Solar Plant Using IoT,” in 3rd International Conference on Sustainable Green Energy Technologies (ICSGET 2025), 2024. [CrossRef]
- J. Huang, K. Zeng, Z. Zhang and W. Zhong, “Solar panel defect detection design based on YOLO v5 algorithm,” Heliyon, vol. 11, pp. 1-12, 2023.
- R. H. P. Putra, D. Wahyudin and T. Sucita, “Designing Energy and Power Monitoring System on Solar Power Plant Using Raspberry Pi,” IOP Conf. Series: Materials Science and Engineering, no. IOP Publishing Ltd, pp. 1-7, 2018. [CrossRef]
- C. M. Nkinyam, C. O. Ujah, K. C. Nnakwo, O. Ezeudu, D. V. V. Kallon and I. I.-E. C. , “Design and implementation of a waterless solar panel cleaning system,” Unconventional Resources, pp. 1-11, 2025. [CrossRef]
- D. Jadhav , V. Muddebhalkar and A. Korke, “Dust Cleaner System for PV Panel using IoT,” International Journal of Computer Applications (0975 – 8887), vol. 178, pp. 31-34, 10 May 2019.
- V. S. Priya and . S. Brindha, “Optimizing Solar Power Generation and Integration in Automotive Systems Through IoT,” Indian Journal of Science and Technology, vol. 17, no. 40, pp. 4158-4167, 2024.
- S. Ajaykumar, P. Sandeep, D. Kiran, B. T. Venakatasai and M. K. Venkateswaro, “DESIGN AND DEVELOPMENT OF AUTOMATIC SOLAR PANEL CLEANING SYSTEM BASED ON ARDUINO,” International Research Journal of Modernization in Engineering Technology and Science, vol. 6, no. 4, pp. 7241-7249, April 2024.
- Y. Bikrat , K. Salmi, A. Benlghazi, A. Benali and D. Moussaid, “A Photovoltaic Wireless Monitoring System,” in International Symposium on Advanced Electrical and Communication Technologies (ISAECT), 2018. [CrossRef]
- S. H. Cheragee, N. Hassan, S. Ahammed and A. Z. M. , “A STUDY OF IOT BASED REAL-TIME SOLAR POWER REMOTE MONITORING SYSTEM,” International Journal of Ambient Systems and Applications (IJASA), vol. 9, pp. 27-36, June 2021.
- V. Kavitha and V. Malathi, “A SMART SOLAR PV MONITORING SYSTEM USING IOT,” in First International Conference on Secure Reconfigurable Architectures & Intelligent Computing, 2019.
- J. E. Shaji, B. Varghese and R. V. , “A Health Care Monitoring System with Wireless Body Area Network using IoT,” International Journal of Recent Trends in Engineering & Research (IJRTER), vol. 3, no. 11, pp. 112-117, November 2017.
- N. A. Othman, M. R. Zainodin, N. Anuar and N. S. Damanhuri, “Remote Monitoring System Development via Raspberry- Pi for Small Scale Standalone PV Plant,” in 2017 7th IEEE International Conference on Control System, Computing and Engineering (ICCSCE), Penang, Malaysia, 2017. [CrossRef]
- H. Eteruddin, D. Setiawan and A. Atmam, “Web Based Raspberry Monitoring System Solar Energy Power Plant,” in IOP Conference Series Earth and Environmental Science, 2020. [CrossRef]
- H. Ozbay, A. Karafil, Y. Onal, M. Kesler and H. Parmaksiz, “The Monitoring of Monthly, Seasonal and Yearly Optimum Tilt Angles by Raspberry Pi Card for Bilecik City, Turkey,” Energy Procedia, vol. 113, pp. 313-318, 1 May 2017. [CrossRef]
- R. S. Sarban Singh and M. F. Abbod, “Research and Integration of IoT based Solar Photovoltaic Panel Health Monitoring System,” Indian Journal of Public Health Research & Development, vol. 9, pp. 1751-1757, 1 December 2018.
- I. M. Shirbhate and S. S. Barve, “Solar panel monitoring and energy prediction for smart solar system,” International Journal of Advances in Applied Sciences (IJAAS), vol. 8, pp. 136-142, June 2019. [CrossRef]
- U. Naeem, K. Chadda, S. Vahaji, J. Ahmad, X. Li and E. Asadi, “Aerial Imaging-Based Soiling Detection System for Solar Photovoltaic Panel Cleanliness Inspection,” Sensors, vol. 25, 25 January 2025. [CrossRef]
- R. Khanam, T. Asghar and M. Hussain, “Comparative Performance Evaluation of YOLOv5, YOLOv8,and YOLOv11for Solar Panel Defect Detection,” Solar, vol. 5, 2025. [CrossRef]
- M. Z. A. Hamid, K. Daud, Z. H. C. Soh, M. K. Osman, I. S. Isa and M. S. Jadin, “Deep Learning-Driven Thermal Imaging Hotspot Detection in Solar Photovoltaic Arrays Using YOLOv10,” ESTEEM Academic Journal, vol. 20, pp. 77-90, 30 September 2024.
- S. Singarapu, K. Swaraja and M. Kirola, “Smart Iot Based Solar Panel Cleaning System,” E3S Web of Conferences, vol. 430, 6 October 2023. [CrossRef]
- M. M S, D. Rajinikanth, A. B, C. K G, G. C M and S. N R, “IoT Based Solar Tracking System with Automatic Dust Monitoring System,” International Research Journal on Advanced Engineering Hub (IRJAEH), vol. 2, pp. 1838-1844, 25 June 2024.
- M. Hamid, M. F. Simamora, M. D. E. Vania and P. Cholillah, “Design of Automatic Cleaning System on Solar Panel Using IoT-based Wiper,” Journal of Physics Conference Series, vol. 2733, 1 March 2024. [CrossRef]
- N. Maindad, A. Gadhave, S. Satpute and B. Nanda, “Automatic Solar Panel Cleaning System,” in International Conference on Communication and Information Processing Automatic Solar Panel Cleaning System, 2021.
- G. Anilkumar, K. Naveen, M. T. V. S. H. K. Pavan Kumar, G. V. B. Kumar, K. Palanisamy, A. Patil and D. Sachan, “Design and development of wireless networking for solar PV panel cleaning robots,” in IOP Conference Series Materials Science and Engineering, 2020. [CrossRef]
- N. Khadka, A. Bista, B. Adhikari, A. Shrestha and D. Bista, “Smart solar photovoltaic panel cleaning system,” IOP Conference Series: Earth and Environmental Science, vol. 463, 7 April 2020. [CrossRef]
- F. H. M. Noh, M. F. Yaakub, I. N. A. M. Nordin, N. Sahari, N. A. Zambri, S. Sy Yi and M. S. M. Saibon, “Development of solar panel cleaning robot using Arduino,” Indonesian Journal of Electrical Engineering and Computer Science, vol. 19, pp. 1245-1250, 1 September 2020. [CrossRef]
- R. M. Ramli and W. A. Jabbar, “Design and implementation of solar-powered with IoT-Enabled portable irrigation system,” Internet of Things and Cyber-Physical Systems, pp. 212-225, 1 December 2022. [CrossRef]
- R. H. P. Putra, D. Wahyudin and T. Sucita, “Designing Energy and Power Monitoring System on Solar,” IOP Conf. Series: Materials Science and Engineering(ISMEE), vol. 384, pp. 1-7, 2018. [CrossRef]
Disclaimer/Publisher’s Note: The statements, opinions and data contained in all publications are solely those of the individual author(s) and contributor(s) and not of MDPI and/or the editor(s). MDPI and/or the editor(s) disclaim responsibility for any injury to people or property resulting from any ideas, methods, instructions or products referred to in the content. |
© 2025 by the authors. Licensee MDPI, Basel, Switzerland. This article is an open access article distributed under the terms and conditions of the Creative Commons Attribution (CC BY) license (http://creativecommons.org/licenses/by/4.0/).
Copyright: This open access article is published under a Creative Commons CC BY 4.0 license, which permit the free download, distribution, and reuse, provided that the author and preprint are cited in any reuse.


