
Submitted:
26 June 2025
Posted:
30 June 2025
You are already at the latest version
Abstract
Diffuse astrocytoma is a primary brain tumor characterized by an insidious infiltration of tumor cells into surrounding brain tissue. Considering this trait, investigation of the peritumoral region is of major biological and clinical importance. In this study, ion mobility mass spectrometry (IMS MS) was optimized and introduced for the first time in the analysis of gangliosides expressed in the peritumoral tissue of diffuse astrocytoma. Profiling and structural analysis of ganglioside species were performed by high-resolution nanoelectrospray ionization (nanoESI) IMS MS and tandem MS (MS/MS) by collision induced dissociation at low energies tuned in the negative ion mode. Through IMS MS separation and screening, we discovered that the diversity of gangliosides in peritumoral tissue is significantly larger than previously reported. We observed the high expression of GT1(d18:1/18:0), GT1(d18:1/20:0), GM2(d18:1/16:2), GD1(d18:1/16:0), GD2(d18:1/20:0), Fuc-GT3(d18:1/24:4), and Fuc-GD1(d18:1/18:2), which suggest that these species: a) are potential biomarkers; b) create a microenvironment favorable to the infiltration of the tumor cells; c) promote the invasion of diffuse astrocytoma cells; d) uphold cellular interactions and possibly influence immune responses.In the second phase, IMS MS, tandem MS, and fragmentation data confirmed the structure of GT1(d18:1/20:0), identifying GT1b as the only isomer present in peritumoral regions.
Keywords:
astrocytoma
; peritumoral tissue
; gangliosides
; ion mobility mass spectrometry
; biomarker
1. Introduction
Diffuse astrocytoma is an invasive primary brain tumor (grade II, WHO) characterized by the infiltration of tumor cells with glial differentiation into the adjacent brain areas. Although diffuse astrocytoma has a lower pace of growth than anaplastic astrocytoma (grade III) and glioblastoma (grade IV), in some cases the tumor cell spreading in the nearby areas is so insidious that there is no clear separation from the normal surrounding brain tissue. This tumor type, predominantly localized in the cerebral hemispheres, affects patients of all ages, being, however, more common in older adults [1]. Depending on the location and size of the tumor, diffuse astrocytoma may cause psychiatric symptoms such as personality changes, cognitive and behavioral disturbances, confusion and hallucinations. For example, dementia associated with diffuse astrocytoma is often preceded by psychiatric symptoms such as confusion and visual hallucinations [2]. Moreover, some studies have observed an inverse relationship between Alzheimer’s disease (AD) and this type of cancer, suggesting that individuals with a history of cancer may have a reduced risk of developing AD, and vice versa [3]. This inverse association has been noted in various studies, indicating a complex interplay between the pathophysiological mechanisms of cancer and neurodegenerative diseases [4,5].
Additionally, astrocytomamay lead to cranial nerve paralysis, headaches, cerebral disorders, psychological changes, and motor weakness as the most frequently observed warning signs. Similar to Parkinson’s disease [6], heart diseases [7,8], and other forms of cancer [9] the depressive disorder, which represents a risk factor for an unfavorable outcome, may also occur in association with astrocytoma [10]. It is important to note that most of the symptoms vary depending on the affected brain region. For instance, in certain brain areas like the right frontal lobe, large tumors can develop before patients or those around them notice evident symptoms. In other regions, such as the left temporal lobe or left frontal lobe, even a small lesion can lead to a noticeable symptomatology [1].
These manifestations emphasize the importance of comprehensive neurological and psychiatric evaluations in patients with diffuse astrocytoma to ensure appropriate diagnosis and management of the associated symptoms. The diagnostic journey often begins with a thorough neurological examination. Clinicians assess the patient’s cognitive functions, motor skills, sensory perceptions, and reflexes to identify any abnormalities that might suggest the presence of a brain tumor. Symptoms such as headaches, seizures, or changes in personality can prompt further investigation.
Magnetic Resonance Imaging (MRI) stands as the cornerstone of neuroimaging for diffuse astrocytomas. MRI provides high-resolution images of the brain’s anatomy, allowing for the detailed visualization of tumor size, location, and its relationship with adjacent structures. Advanced MRI techniques, enhance the detection of these infiltrative tumors [11,12].In certain scenarios, Computed Tomography (CT) scans may be employed, especially when MRI is contraindicated. CT imaging is able to reveal mass effects or calcifications associated with the tumor, although it offers less detailed soft tissue contrast in comparison to MRI.
Definitive diagnosis requires histopathological confirmation through a biopsy. Stereotactic needle biopsy or surgical resection allows for the extraction of tumor tissue, which is then examined microscopically to determine the tumor grade and specific histological features. This analysis is crucial for distinguishing diffuse astrocytoma from other gliomas or potential brain lesions [13,14,15].
In the last years, molecular profiling has become increasingly important in the diagnostic process. Identifying genetic mutations, such as IDH1 or IDH2 mutations, provides valuable prognostic information and may influence therapeutic decisions. For instance, the presence of an IDH mutation is often associated with a better prognosis and may guide the selection of targeted therapies [16]. Consequently, diagnosing diffuse astrocytoma involves a multidisciplinary approach that combines clinical assessments, advanced imaging modalities, histopathological examination, and molecular analyses. Such a comprehensive strategy ensures an accurate diagnosis, which is essential for formulating an effective treatment plan, able to render not only an improvement of life quality, but also an increase of the survival time. Certainly, an early diagnosis of diffuse astrocytoma is crucial, as it enables timely intervention that can slow disease progression and improve patient outcomes. Delays in diagnosis may hinder access to treatment, potentially impacting life quality and survival [17].
Considering the characteristics of diffuse astrocytoma, of major importance is the analysis of the peritumoral brain zone, represented by the area surrounding the tumor. This region often harbors infiltrative tumor cells that contribute to recurrence. Exploring the peritumoral zone is vital for determining the extent of resection to prevent recurrence and understand the mechanisms of tumor growth [18]. Hence, a comprehensive examination of both the tumor and its surrounding tissue is of utmost importance for accurate diagnosis and effective treatment planning.
Gangliosides, complex glycosphingolipids abundant in the central nervous system, have emerged as significant biomarkers in the molecular diagnostic landscape of brain tumors. Their unique composition and expression patterns are able to provide valuable information related not only to the tumor presence, but also its type and progression. High-resolution mass spectrometry (HR MS) has proven to be an indispensable tool in this context, offering exceptional sensitivity and specificity for the detailed analysis of ganglioside profiles [19].
In a preliminary study, our group employed HR MS to comparatively map the gangliosides expressed in low-grade astrocytoma vs. its surrounding tissue, and normal brain tissue. The analysis identified a specific pattern of gangliosides associated to each of the three types of tissues, with certain components common to both the tumor and the surrounding tissue. Notably, the ganglioside components discovered in the surrounding tissue exhibited elevated levels of sialylation, fucosylation, and acetylation, which may correlate with tumor expansion into adjacent brain areas. These findings highlighted HR MS potential in identifying tumor-associated markers and enhancing structural characterization of cancer biomarker species [20]. Hence, the integration of HR MS in ganglioside analysis was shown to represent a promising avenue for advancing molecular diagnostics in brain tumors, facilitating early detection and personalized treatment strategies.
The potentials of MS for the discovery of biologically-relevant molecules increased in the last decade due to the introduction of ion mobility separation (IMS) coupled to MS (IMS MS). Based on the properties of the transport driven by the electric field, IMS MS is able to separate isomers, isobars and conformers as well as to discriminate minor components in highly complex biological mixtures. Our earlier studies, targeting the first implementation of IMS MS in brain ganglioside research [21,22,23], indicated that, in conjunction with an effective fragmentation technique such as collision-induced dissociation (CID), IMS MS results in a method of unsurpassed efficiency in detection and structural elucidation of single components in native mixtures and of minor species with diagnostic value. The remarkable number of distinct species which, due to the IMS separation were deciphered for the first time, offered a completely different perspective on human brain gangliosidome.
In this context, we have extended our previous investigations to include the analysis of gangliosides expressed in the peritumoral tissue using the high performance HR MS platform combined with IMS and CID MS/MS. This advanced approach allowed for a) discovery of novel structures due to the efficient separation of ions according to their mobility; b) a more detailed characterization of the chemical composition of the tissue surrounding the tumor, providing novel insights into the interaction between the tumor and its environment.
The results of the present study contribute to a deeper understanding of the mechanisms of tumor invasion and progression, which facilitates the development of more effective and personalized therapeutic strategies based on gangliosides.
2. Results and Discussions
The dried native APT mixture dissolved in methanol to the concentration of 5 pmol∙μL-1 was loaded in the nanoESI capillary and infused into the IMS MS instrument. The sample was profiled in the negative ion mode nanoESI IMS MS with the signal acquired for 3 minutes. For each MS and MS/MS experiment, the number of replicates was 3. The in-run reproducibility was 100% while the day-to-day reproducibility was 99%.
The IMS MS screening disclosed a diverse range of gangliosides, shedding light on the molecular landscape surrounding this type of tumor. Gangliosides, as an important class of sialic acid-containing glycosphingolipids, are known to play crucial roles in cellular processes such as adhesion, signaling, and immune modulation, all of which being significant in the context of tumor development and invasion in the nearby brain tissue.
The IMS mass spectra shown in Figure 1, Figure 2 and Figure 3 display the mass-to-charge ratio (m/z) profiles of gangliosides detected in the peritumoral tissue of the investigated diffuse astrocytoma.
Figure 1 presents the IMS mass spectra of gangliosides detected in the peritumoral tissue of diffuse astrocytoma in the m/z range of (600–1000), showcasing the distribution of lower molecular weight species. The spectra are to be directly correlated with Table 1, which lists the identified gangliosides, their experimental and theoretical m/z values, and the proposed molecular structures and with the heat map depicted in Figure 4. As visible in Table 1, IMS MS revealed in the first place that APT gangliosides present various ionization patterns, being detected as multicharged anionic forms such as [M-2H]2- and [M-3H]3-, which facilitated their identification and characterization. Secondly, IMS MS data indicated that the gangliosidome associated to astrocytoma cell infiltration in the surrounding tissue exhibits a much higher structural complexity than previously known; no less than 64 molecular ions corresponding to55 distinct ganglioside species were detected in the APT sample.
A comparative IMS MS analysis performed on histologically normal adult human hippocampal tissue [24] revealed a notably different gangliosidic profile, both in terms of composition and molecular diversity. In total, 140 ganglioside species were detected in the healthy tissue, nearly triple the number identified in the peritumoral sample. Structural features specific to the normal hippocampal gangliosides included a higher proportion of species with shorter fatty acid chains and increased presence of trihydroxylated sphingoid bases, suggesting a distinct ceramide backbone architecture. Furthermore, the healthy tissue exhibited improved separation across charge states, m/z values, glycan chain lengths, and degrees of sialylation, with reduced spectral overlap. These observations underscore the substantial gangliosidic remodeling occurring in the peritumoral microenvironment and confirm the capability of IMS MS to resolve and distinguish pathophysiological alterations in ganglioside expression patterns at a high level of structural resolution.
Compared to previous study performed using Orbitrap technology, which identified only 40 different ganglioside species in the tissue surrounding astrocytoma, the current IMS MS approach demonstrated a significant improvement in detection capabilities. This substantial increase in the number of identified species highlights the enhanced sensitivity and broader detection range of IMS MS due to the separation, which enables a more detailed and comprehensive analysis of the gangliosidome associated to the peritumoral tissue. The ability to detect a wider array of gangliosides is particularly valuable in the context of astrocytoma cell infiltration, as it provides deeper insights into the molecular complexity of the tumor microenvironment. These findings suggest that IMS MS not only refines the characterization of gangliosides but also enhances our understanding of their role in tumor progression, potentially leading to new paths for biomarker discovery and therapeutic intervention.
The monosialylated (GM), disialylated (GD), trisialylated (GT), and tetrasialylated (GQ) glycoforms and particularly GM1(d18:1/18:1) and GM2(d18:1/16:2) were found prominently expressed in the tissue surrounding the tumor. The latter species are often associated with cellular adhesion and immune evasion mechanisms, which are crucial for the survival and spreading of tumor cells. Disialylatedgangliosides such as GD1(d18:1/16:0) and GD2(d18:1/20:0), known to have been implicated in processes enhancing tumor invasion and resistance to apoptosis [25,26], were also detected through MS signals of relatively high abundance.
Figure 2, covering the range of m/z(1000-1400), captures higher mass gangliosides such as the tri- and tetrasialotetraoses GT1 and GQ1. The signals at m/z 1033.965, 1077.031, and 1223.583 correspond to the species GT1(d18:1/14:1), GT1(d18:1/20:0), and GQ1(d18:0/20:0). This identification is supported by the high mass accuracy, i.e., only 9.29 ppm mass deviation for GT1(d18:1/20:0), which indicates the precision and robustness of the detection method.
Figure 3 highlights the high molecular weight gangliosides within the m/z range of (1600–2000). Key signals include those at m/z 1835.978, 1863.974, and 1879.913, which correspond to GD1(d18:1/18:0), GD1(d18:1/20:0), and GD1(d18:0/19:0), respectively. The highly accurate mass measurements, with deviations as low as 7.63 ppm for GD1(d18:1/18:0), demonstrate again the consistency of the IMS MS measurements and ganglioside assignment.
The class of trisialylatedgangliosides, including GT1(d18:1/18:0) and GT1(d18:1/20:0), was observed in notable abundance. These ganglioside species are essential to neuronal interactions being likely to influence the microenvironment surrounding the tumor. The detection of tetrasialylatedgangliosides, such as GQ1(d18:1/16:3), emphasizes the complexity of the glycosylation patterns in the peritumoral region. Additionally, fucosylatedganglioside variants such as Fuc-GT3(d18:1/24:4) and Fuc-GD1(d18:1/18:2) were discovered; these species are often linked to an enhanced tumorigenic potential and immune suppression [27,28].
The high-resolution nature of IMS MS provided accurate mass measurements with minimal deviations, supporting the reliability of these findings. Hence, the average mass accuracy of 11.38 ppm, offers a high confidence in molecular identification.
Biologically, these gangliosides are likely to play significant roles in the area surrounding the tumor. The monosialylated forms may interact with the extracellular matrix components, influencing tumor cell adhesion and migration. The disialylated and trisialylatedgangliosides might be involved in signaling pathways that regulate proliferation and invasion. On the other hand, the fucosylated and highly sialylated species are particularly interesting, as they are known to modulate immune responses by inhibiting the activity of immune effector cells, thereby promoting tumor immune evasion.
In the context of diffuse astrocytoma, the peritumoral tissue is of particular interest because it serves as the interface between the tumor and the surrounding normal brain tissue. The presence of such ganglioside species in this region suggests their involvement in facilitating tumor expansion and interaction with the host tissue. Specifically, gangliosides contribute to altering the physical properties of the extracellular matrix, creating a microenvironment that supports tumor cell migration and invasion.
Because of the challanges in collecting the peritumoral tissue and making this type of human material available for research, the measurements and the biological interpretation of the data in this study were performed considering a single biopsy. Certainly, these preliminary results require validation in IMS MS studies conducted on other similar samples.
To determine the detailed structure of the dominant species and the position isomers related to Neu5Ac, we have chosen the doubly charged precursor ion [M-2H]²⁻detected at m/z 1077.031 as an example to illustrate the fragmentation analyses carried out by CID MS/MS. According to the exact mass calculation (m/ztheor 1077.041), this ion was assigned with a mass accuracy of 9.29 ppm to the trisialotetraose GT1 (d18:1/20:0) species.
For the CID MS/MS structural investigation, the precursor ion was isolated within a 1 m/z window and subjected to fragmentation using a broad range of collision energies between 20 and 45 eV to facilitate the production of diagnostic fragment ions through glycosidic bond cleavages and cross-ring cleavages. All tandem mass spectra were generated by summing up the scans acquired over 2 minutes across the entire range of applied collision energies.
Figure 5 presents the fragmentation mass spectrum of the doubly charged precursor ion [M-2H]²⁻detected at m/z 1077.031, while Figure 6 illustrates the dissociation scheme experienced by this ion under the employed sequencing conditions.
Based on the detailed fragmentation analysis presented in Figure 5, the generated sequence ions document the saccharide chain structure, sialylation status, the positions along the chain of the three Neu5Ac monosaccharides, and the overall ceramide composition.
The sialylation status of the molecule is defined by the high-intensity signal at m/z 290.118 attributed to the cleaved Neu5Ac residue generating B1α⁻and/or B1β⁻ions, along with their less abundant C1α⁻ and/or C1β⁻counterparts at m/z 308.293 and the ion corresponding to the detachment of the disialo group (Neu5Ac)2- detected at m/z 581.173 as the monocharged B2β⁻ion. Further, the B3α⁻ionat m/z 655.220 is consistent with the Neu5Ac–Gal–GalNActrisaccharide sequence of the non-reducing end. Subsequently, a series of ions fully characterize the reducing end as well. Hence, the Gal-Glc disaccharide sequence in the proximity of the aglycone, the Gal–Glc–Cer motif at the reducing end, and the (d18:1/20:0) composition of the ceramide are supported by the following ions: Y1⁻ at m/z 754.615, Y0⁻ at m/z 592.564, Z0⁻ at m/z 574.552, and the double cleavage [Y2α/B2β]- at m/z 916.674 respectively. In addition, [Y4α/B2β]⁻ detected at m/z 1281.796 documents the Gal–GalNAc–Gal–Glc–Cer oligosaccharide backbone (Figure 5).
Based on the detailed fragmentation analysis, which includes the identification of key diagnostic ions and the confirmation of the Neu5Ac–Gal–GalNAc sequence, we have successfully determined the structure of the GT1b isomer. Due to the inherent molecular symmetry of these gangliosides, it is not possible to completely rule out the presence of the GT1c isomer, as the structural resemblance between the two makes their differentiation particularly challenging. Although the characteristic Neu5Ac–Neu5Ac–Neu5Ac–Glc–Cer fragment of GT1c was not detected, its absence alone does not provide definitive evidence against this isomer. A decisive factor in our structural assignment was the ion mobility mass spectrometry profile, which revealed the presence of a single isomer. The observation of a single drift time, along with the corresponding collision cross-section values, strongly supports the conclusion that the analyzed compound corresponds to GT1b, as no additional isomeric species were detected.
3. Materials and Methods
3.1. Peritumoral Tissue
A 30-year-old male patient was hospitalized for evaluation after experiencing epileptic seizures characterized by loss of consciousness and involuntary contractions of the right arm. These episodes occurred several times a day, each lasting a few minutes. Apart from these symptoms, the patient was in generally good health. Neuroradiological investigations, including computed tomography and magnetic resonance imaging, revealed an expansive lesion measuring 38×49 mm in the left precentral parasagittal frontal region of the brain. The lesion had poorly defined borders and exerted a significant compressive effect on the surrounding tissue. Surgical intervention was performed to remove the tumor along with a portion of adjacent tissue. Histopathological analysis of the excised tumor revealed high cellular density, minimal nuclear pleomorphism, the presence of microcysts (small fluid-filled spaces), and abundant intercellular edema. Based on these findings, the tumor was classified as a diffuse astrocytoma, grade II, according to the WHO 2007 criteria.
Permission for the use of human tissues for scientific research was obtained from the Ethical Commission of the Zagreb Medical Faculty under Project no. 108120, funded by the Croatian Ministry of Science and Technology. The patient provided informed consent for participation in the study.
3.2. Extraction and Purification of Gangliosides
Crude ganglioside mixtures from actrocytomaperitumoral tissue (APT) were extracted and purified using a standardized protocol under identical working conditions. The extraction method was based on the procedure developed by Svennerholm and Fredman [29], later modified by Vukelić et al. [30], and consistently applied in our previous studies on brain tumor gangliosides [31,32,33]. In brief, the tissue samples were weighed and homogenized in ice-cold distilled water to prepare a 10% homogenate. Lipids were extracted twice using a solvent mixture of chloroform and methanol (1:2, v:v). The extraction process involved partitioning and repartitioning by adding chloroform, methanol, and water until a final volume ratio of 1:1:0.8 was reached. The combined upper phases, which contained the gangliosides, were collected for further processing. The crude ganglioside extract was subjected to several purification steps: a) precipitation of co-extracted protein–salt complexes followed by centrifugation; b) removal of low molecular weight contaminants through gel-filtration using a Sephadex G-25 column; c) overnight dialysis against water at 4 °C to eliminate the remaining impurities. The purified extract was subsequently evaporated to complete desiccation in a SpeedVac SPD 111V system (Savant, Düsseldorf, Germany) to yield the final APT ganglioside mixture.
A stock solution of the APT extract (~1 mg/mL) was prepared by dissolving the dried material in pure methanol and stored at -20°C. For IMS MS and CID MS/MS analyses, the stock solution was diluted in pure methanol to render the working aliquots at a concentration of approximately 5 pmol∙μL-1 (calculated based on an average molecular weight of 2000 g/mol). Prior to ion mobility mass spectrometry analysis, the APT sample solution was centrifuged for 5 minutes at 6,000 rpm using a mini-centrifuge (Thermo Fisher Scientific, USA). The resulting supernatant was collected and subjected to (-) nanoESI IMS MS and MS/MS analysis using CID at low collision energies. All reagents used in this procedure were of analytical grade and sourced from Merck (Darmstadt, Germany).
3.3. Ion Mobility Mass Spectrometry
For the ion mobility mass spectrometry experiments conducted on the APT sample in negative ionization mode, a Synapt G2-S mass spectrometer (Waters, Manchester, UK) equipped with a nanoESI source was employed. Data acquisition and IMS data processing were performed using Waters MassLynx (version V4.1, SCN 855) and Waters Driftscope (version V2.7) software, both running on a connected PC. A 30 µL APT solution at a concentration of 5 pmol/µL in methanol was infused in the mass spectrometer at a 10 µL∙min-1 flow rate, through 10 cm long capillaries with 10 µm tip sizes and 4 mm taper lengths. A steady spray, an efficient ionization and a minimum in-source fragmentation were achieved at 1.4 kV applied to the capillary through a platinum wire and 40 V applied to the cone. The source block temperature was kept at 100 oC, whereas the desolvation temperature at 150 oC and the desolvation gas flow rate at 800 L·h-1.
In the IMS MS separation region, the ions were introduced as pulses. The continuous ion beam generated by nanoESI was first accumulated in an ion funnel, then converted into a pulsed beam, and periodically injected into the traveling wave ion guide. The ions then passed through the quadrupole region into the drift region, which was filled with the drift gas, allowing separation based on ion mobility. Finally, the ions entered the time-of-flight (TOF) analyzer, where they were separated according to their mass-to-charge (m/z) ratios.
The traveling-wave technology, employed in this setup, involved a stacked-ring ion guide with an applied traveling voltage wave. In the drift tube, the ions moved through a nitrogen buffer gas and were propelled forward by the wave. Smaller ions with lower collision cross sections experienced less friction and advanced more steadily compared to larger ions, which fell behind and were caught by subsequent waves. The parameters influencing the separation, such as the ion mobility cell gas pressure, wave amplitude, and wave velocity, were optimized as follows: 90 mL/min IM gas flow, 650 m/s IM wave velocity, and 40 V IM wave height.
CID experiments were performed after mobility separation, with collision energies ramped from 20 to 45 eV to ensure a comprehensive sequence ion coverage. This setup provided a robust separation and a reliable structural elucidation of APT sample components.
3.4. Ganglioside Abbreviation, Nomenclature and Assignment of the Mass Spectra
Gangliosides were abbreviated according to the system of Svennerholm (1980) [34] and the recommendations of IUPAC-IUB Commission on Biochemical Nomenclature (IUPAC-IUB 1998) [35] as follows
GM1 - II3-α-Neu5Ac-Gg4Cer; GM2 - II3-α-Neu5Ac-Gg3Cer; GM3 - II3-α-Neu5Ac-LacCer; GD1 - II3-α-(Neu5Ac)2-Gg4Cer; GD2 - II3-α-(Neu5Ac)2-Gg3Cer; GD3 - II3-α-(Neu5Ac)2-LacCer; GT1 - II3-α-(Neu5Ac)3-Gg4Cer; GT2 - II3-α-(Neu5Ac)3-Gg3Cer; GT3 - II3-α-(Neu5Ac)3-LacCer, GT4 - II3-α- (Neu5Ac)3-GgCer; GQ1 - II3-α-(Neu5Ac)4-Gg4Cer.
The assignment of spectral signals to specific ions was performed by comparing the experimental m/z to the calculated theoretical values, using the monoisotopic masses. MS/MS validation experiments were carried out for 59% of the ions. The fragment ions corresponding to the sequencing of the glycan core by CID were assigned according to the nomenclature inroduced by Domon and Costello [36] and revised later by Costello et al. [37]. The fragment ions associated to the cleavages of the ceramide were denoted according to the dedicated the nomenclature proposed by Ann and Adams [38]. The basic statistical data analyses, including the heat map, were performed using Python software.
4. Conclusions
The high-resolution mass spectrometry (HR MS) and ion mobility spectrometry (IMS MS) analysis of the gangliosidome associated to the peritumoral tissue provided a comprehensive characterization of its chemical composition, shedding light on the molecular interactions between the tumor and its surrounding environment. A major finding of this study was the notable abundance of the trisialylatedgangliosides, particularly GT1(d18:1/18:0) and GT1(d18:1/20:0). These molecules play a crucial role in neuronal interactions and are likely to influence key tumor-related processes such as adhesion, migration, and proliferation. Their high expression suggests that they contribute to remodeling the extracellular matrix, creating a microenvironment that supports tumor expansion and invasion.
In addition to trisialylated gangliosides, other significant ganglioside classes were identified, including monosialylated (GM), disialylated (GD), and tetrasialylated (GQ) forms. GM1(d18:1/18:1) and GM2(d18:1/16:2) were found to be strongly linked to immune evasion and cellular adhesion, while disialylated species such as GD1(d18:1/16:0) and GD2(d18:1/20:0) are known to enhance tumor invasion and apoptosis resistance. The identification of fucosylated variants, such as Fuc-GT3(d18:1/24:4) and Fuc-GD1(d18:1/18:2), highlights the complexity of ganglioside-driven tumor progression, as these molecules are often associated with increased tumorigenic potential and immune suppression.
Further structural analysis through fragmentation techniques confirmed the identity and composition of key gangliosides. The fragmentation of the doubly charged precursor ion at m/z 1077.031 enabled the precise identification of the trisialylatedGT1(d18:1/20:0) species with a high mass accuracy of 9.29 ppm, reinforcing the reliability of the analytical approach. CID MS/MS fragmentation provided detailed insights into the saccharide chain structure, sialylation pattern, and, most of all the positioning of the three Neu5Ac monosaccharides leading to isomer identification. The detection of key diagnostic ions allowed for the confirmation of the Neu5Ac–Gal–GalNAc sequence and led to the successful identification of the GT1b isomer, further emphasizing the structural diversity of gangliosides in the peritumoral region.
These findings highlight the pivotal role of gangliosides in shaping the peritumoral microenvironment by modifying extracellular matrix properties, promoting cellular interactions, and influencing immune responses. Their involvement in diffuse astrocytoma progression suggests that they may serve as potential biomarkers or molecular targets for therapeutic intervention. Future research should target the quantification of ganglioside levels across different astrocytoma grades and explore their specific contributions to tumor biology. A deeper understanding of these molecular mechanisms could lead to development of ganglioside-targeted therapies, potentially improving treatment strategies and patient outcomes in diffuse astrocytoma.
Acknowledgments
This work was supported by the Romanian National Authority for Scientific Research, UEFISCDI, projects PN-IV-P2-2.1-TE-2023-0175 and PN-III-P4-ID-PCE-2020-0209.
References
- Lang, M.; Colby, S.; Ashby-Padial, C.; Bapna, M.; Jaimes, C.; Rincon, S.P.; Buch, K. An imaging review of the hippocampus and its common pathologies. J. Neuroimaging 2023, 34, 5–25. [CrossRef]
- Madhusoodanan, S.; Ting, M.B.; Farah, T.; Ugur, U. Psychiatric aspects of brain tumors: A review. World J. Psychiatry 2015, 5, 273–285. [CrossRef]
- Realmuto, S.; Cinturino, A.; Arnao, V.; Mazzola, M.A.; Cupidi, C.; Aridon, P.; Ragonese, P.; Savettieri, G.; D'Amelio, M. Tumor diagnosis preceding Alzheimer's disease onset: is there a link between cancer and Alzheimer's disease?J. Alzheimers Dis.2012, 31, 177–182.
- Lanni, C.; Masi, M.; Racchi, M.; Govoni, S. Cancer and Alzheimer’s disease inverse relationship: an age-associated diverging derailment of shared pathways. Mol. Psychiatry 2020, 26, 280–295. [CrossRef]
- Xia, S.; Chen, H.; Tang, T. Risk of death from Alzheimer's disease associated with brain tumor, glioma, and glioblastoma. J. Alzheimers Dis.2023, 96, 623–631.
- Ahmad, M.H.; Rizvi, M.A.; Ali, M.; Mondal, A.C. Neurobiology of depression in Parkinson’s disease: Insights into epidemiology, molecular mechanisms and treatment strategies. Ageing Res. Rev.2023, 85, 101840.
- Bondar, L.I.; Osser, B.; Miuța, C.C.; Petran, D.; Baltean, A.I.; Butari, D.B.; Mariș, M.A.; Piroș, L.E.; Almășan, R.; Gavrila-Ardelean, M.; et al. Gender-Specific Insights into Depression in Patients with Ischemic Heart Disease: Findings from a Pilot Study Using a Self-Developed Questionnaire. Diseases 2024, 12, 320. [CrossRef]
- Bondar, L.I.; Iovanovici, D.C.; Măduța, V.; Butari, D.B.; Șandor, F.M.; Mariș, M.A.; Piroș, L.E.; Miuța, C.C.; Toderescu, C.D.; Popescu, M.I. Screening Depression in Ischemic Heart Disease: Gender Differences and Psychosocial Implications Using a Self-Developed Questionnaire. J. Clin. Med. 2025, 14, 837. [CrossRef]
- Battat, M.; Omair, N.; WildAli, M.A.; Alkaissi, A.; Amer, R.; Koni, A.A.; Salameh, H.T.; Zyoud, S.H. Assessment of depression symptoms among cancer patients: a cross-sectional study from a developing country. Sci. Rep. 2024, 14, 11934. [CrossRef]
- Starkweather, A.R.; Sherwood, P.; Lyon, D.E.; McCain, N.L.; Bovbjerg, D.H.; Broaddus, W.C. A Biobehavioral Perspective on Depressive Symptoms in Patients With Cerebral Astrocytoma. J. Neurosci. Nurs. 2011, 43, 17–28. [CrossRef]
- Alshoabi, S.A.; Alareqi, A.A.; Omer, A.M.; Suliman, A.G.; Daqqaq, T.S. Diffuse astrocytoma and the diagnostic dilemma of an unusual phenotype: A case report. Radiol. Case Rep. 2020, 16, 319–326. [CrossRef]
- Kim, M.M.; Parolia, A.; Dunphy, M.P.; Venneti, S. Non-invasive metabolic imaging of brain tumours in the era of precision medicine. Nat. Rev. Clin. Oncol. 2016, 13, 725–739. [CrossRef]
- Tonn, J.C.; Teske, N.; Karschnia, P. Astrocytomas of the spinal cord. Neurooncol. Adv.2024, 6, 48–56.
- Khandwala, K.; Mubarak, F.; Minhas, K. The many faces of glioblastoma: Pictorial review of atypical imaging features. Neuroradiol. J. 2020, 34, 33–41. [CrossRef]
- Weller, M.; van den Bent, M.; Hopkins, K.; Tonn, J.C.; Stupp, R.; Falini, A.; Cohen-Jonathan-Moyal, E.; Frappaz, D.; Henriksson, R.; Balana, C.; et al. EANO guideline for the diagnosis and treatment of anaplastic gliomas and glioblastoma. Lancet Oncol. 2014, 15, e395–e403. [CrossRef]
- Camelo-Piragua, S.; Jansen, M.; Ganguly, A.; Kim, J.C.; Louis, D.N.; Nutt, C.L. Mutant IDH1-specific immunohistochemistry distinguishes diffuse astrocytoma from astrocytosis. Acta Neuropathol. 2010, 119, 509–511. [CrossRef]
- Brennan, P.M.; Butler, H.J.; Christie, L.; Hegarty, M.G.; Jenkinson, M.D.; Keerie, C.; Norrie, J.; O’bRien, R.; Palmer, D.S.; Smith, B.R.; et al. Early diagnosis of brain tumours using a novel spectroscopic liquid biopsy. Brain Commun. 2021, 3, fcab056. [CrossRef]
- Grishin, A.; Achkasova, K.; Kukhnina, L.; Sharova, V.; Ostapyuk, M.; Yashin, K. Peritumoral Brain Zone in Astrocytoma: Morphology, Molecular Aspects, and Clinical Manifestations (Review). Sovrem. Teh. v Med. 2024, 16, 79–88. [CrossRef]
- Sarbu, M.; Petrica, L.; Clemmer, D.E.; Vukelić, Ž.; Zamfir, A.D. Gangliosides of Human Glioblastoma Multiforme: A Comprehensive Mapping and Structural Analysis by Ion Mobility Tandem Mass Spectrometry. J. Am. Soc. Mass Spectrom. 2021, 32, 1249–1257. [CrossRef]
- Zamfir, A.D.; Fabris, D.; Capitan, F.; Munteanu, C.; Vukelić, Ž.; Flangea, C. Profiling and sequence analysis of gangliosides in human astrocytoma by high-resolution mass spectrometry. Anal. Bioanal. Chem. 2013, 405, 7321–7335. [CrossRef]
- Sarbu, M.; Fabris, D.; Vukelić, Ž.; Clemmer, D.E.; Zamfir, A.D. Ion Mobility Mass Spectrometry Reveals Rare Sialylated Glycosphingolipid Structures in Human Cerebrospinal Fluid. Molecules 2022, 27, 743. [CrossRef]
- Sarbu, M.; Ica, R.; Sharon, E.; Clemmer, D.E.; Zamfir, A.D. Glycomics by ion mobility tandem mass spectrometry of chondroitin sulfate disaccharide domain in biglycan. J. Mass Spectrom. 2023, 58, e4908. [CrossRef]
- Biricioiu, M.R.; Sarbu, M.; Ica, R.; Vukelić, Ž.; Kalanj-Bognar, S.; Zamfir, A.D. Advances in Mass Spectrometry of Gangliosides Expressed in Brain Cancers. Int. J. Mol. Sci. 2024, 25, 1335. [CrossRef]
- Sarbu, M.; Vukelić, Ž.; Clemmer, D.E.; Zamfir, A.D. Ion mobility mass spectrometry provides novel insights into the expression and structure of gangliosides in the normal adult human hippocampus. Anal. 2018, 143, 5234–5246. [CrossRef]
- Nazha, B.; Inal, C.; Owonikoko, T.K. Disialoganglioside GD2 Expression in Solid Tumors and Role as a Target for Cancer Therapy. Front. Oncol. 2020, 10, 1000. [CrossRef]
- Cavdarli, S.; Groux-Degroote, S.; Delannoy, P. Gangliosides: The Double-Edge Sword of Neuro-Ectodermal Derived Tumors. Biomolecules 2019, 9, 311. [CrossRef]
- Groux-Degroote, S.; Delannoy, P. Cancer-Associated Glycosphingolipids as Tumor Markers and Targets for Cancer Immunotherapy. Int. J. Mol. Sci. 2021, 22, 6145. [CrossRef]
- Shi, M.; Nan, X.-R.; Liu, B.-Q. The Multifaceted Role of FUT8 in Tumorigenesis: From Pathways to Potential Clinical Applications. Int. J. Mol. Sci. 2024, 25, 1068. [CrossRef]
- Svennerholm, L.; Fredman, P. A procedure for the quantitative isolation of brain gangliosides. Biochim. et Biophys. Acta (BBA) - Lipids Lipid Metab. 1980, 617, 97–109. [CrossRef]
- Vukelic, Z.; Metelmann, W.; Müthing, J.; Kos, M.; Peter-Katalinic, J. Anencephaly: Structural Characterization of Gangliosides in Defined Brain Regions. Biol. Chem. 2001, 382, 259–74. [CrossRef]
- Vukelić, Ž.; Kalanj-Bognar, S.; Froesch, M.; Bîndilă, L.; Radić, B.; Allen, M.; Peter-Katalinić, J.; Zamfir, A.D. Human gliosarcoma-associated ganglioside composition is complex and distinctive as evidenced by high-performance mass spectrometric determination and structural characterization. Glycobiology 2007, 17, 504–515. [CrossRef]
- Schiopu, C.; Flangea, C.; Capitan, F.; Serb, A.; Vukelić, Ž.; Kalanj-Bognar, S.; Sisu, E.; Przybylski, M.; Zamfir, A.D. Determination of ganglioside composition and structure in human brain hemangioma by chip-based nanoelectrospray ionization tandem mass spectrometry. Anal. Bioanal. Chem. 2009, 395, 2465–2477. [CrossRef]
- Schiopu, C.; Vukelić, Ž.; Capitan, F.; Kalanj-Bognar, S.; Sisu, E.; Zamfir, A.D. Chip-nanoelectrospray quadrupole time-of-flight tandem mass spectrometry of meningioma gangliosides: A preliminary study. Electrophoresis 2012, 33, 1778–1786. [CrossRef]
- Svennerholm, L. Ganglioside Designation. In Structure and Function of Gangliosides; Springer: Boston, MA, USA, 1980; Volume 125, p. 11. [CrossRef]
- Chester, M. IUPAC-IUB joint commission on biochemical nomenclature (JCBN) nomenclature of glycolipids. J. Mol. Biol. 1999, 286, 963–970. [CrossRef]
- Domon, B.; Costello, C.E. A systematic nomenclature for carbohydrate fragmentations in FAB-MS/MS spectra of glycoconjugates. Glycoconj. J. 1988, 5, 397–409. [CrossRef]
- Costello, C.E.; Juhasz, P.; Perreault, H. New mass spectral approaches to ganglioside structure determinations. Prog. Brain Res.1994, 101, 45–61.
- Ann, Q.; Adams, J. Structure determination of ceramides and neutral glycosphingolipids by collisional activation of [M + Li]+ ions. J. Am. Soc. Mass Spectrom. 1992, 3, 260–263. [CrossRef]
Figure 1.
(-) nanoESI IMS MS of gangliosides detected in the APT, m/z range 600–1000. Solvent: Methanol; sample concentration: 5 pmol•μL−1; flow rate: 10 μL•min−1; spray voltage:1.4 kV; cone voltage: 40 V; source block temperature: 100 °C; desolvation temperature:150 °C.
Figure 1.
(-) nanoESI IMS MS of gangliosides detected in the APT, m/z range 600–1000. Solvent: Methanol; sample concentration: 5 pmol•μL−1; flow rate: 10 μL•min−1; spray voltage:1.4 kV; cone voltage: 40 V; source block temperature: 100 °C; desolvation temperature:150 °C.
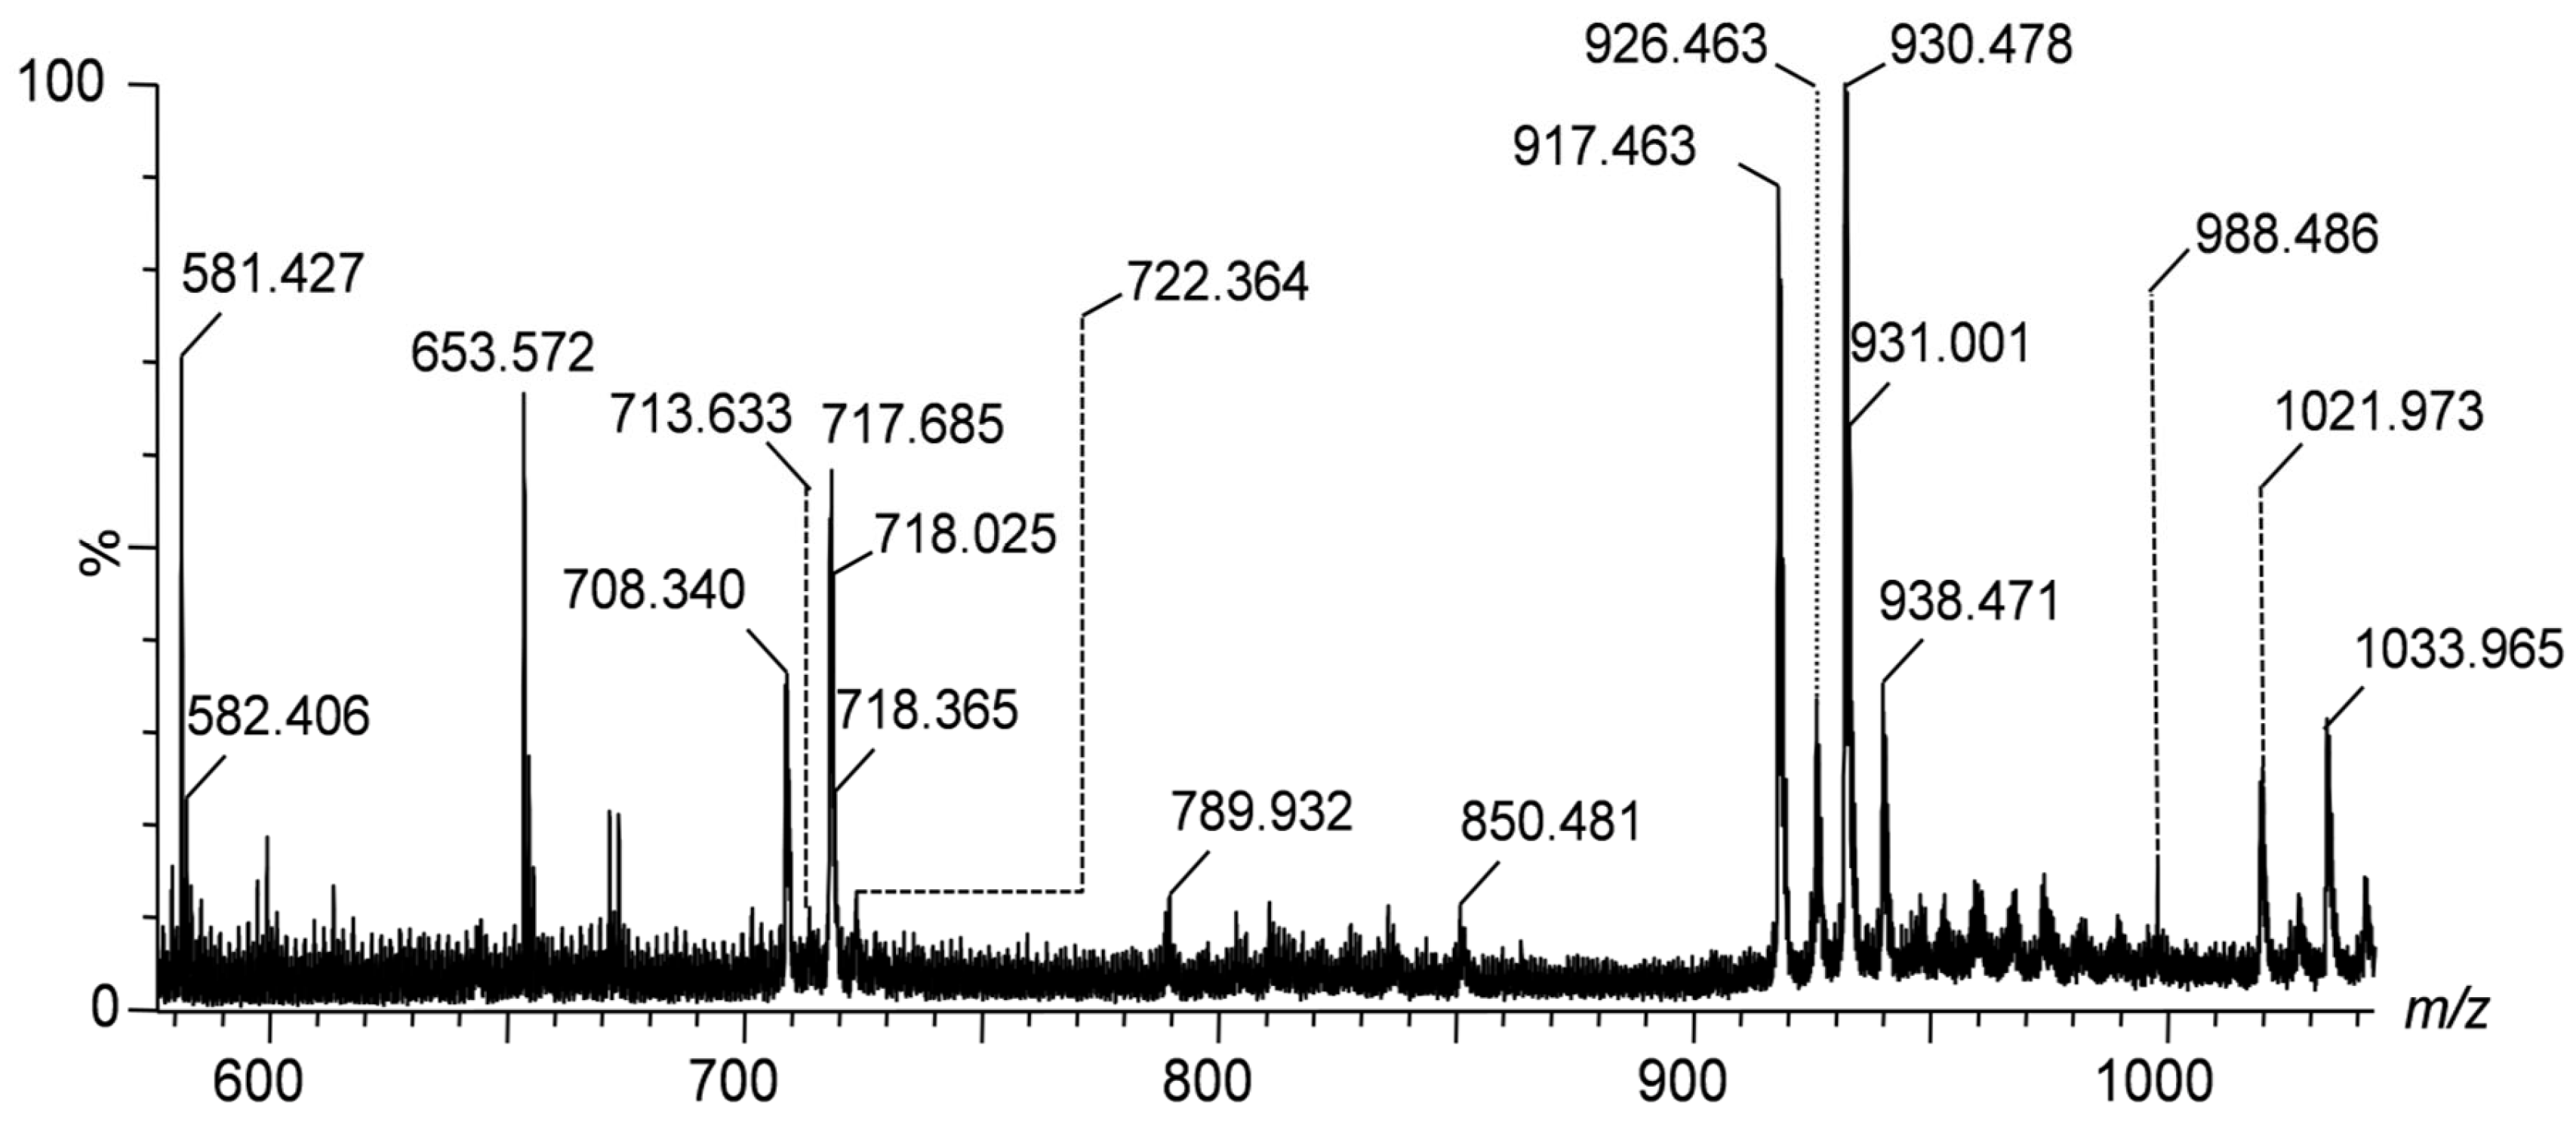
Figure 2.
(-) nanoESI IMS MS of gangliosides detected in the APT, m/z range 1000–1400. Conditions as described in Figure 1.
Figure 2.
(-) nanoESI IMS MS of gangliosides detected in the APT, m/z range 1000–1400. Conditions as described in Figure 1.
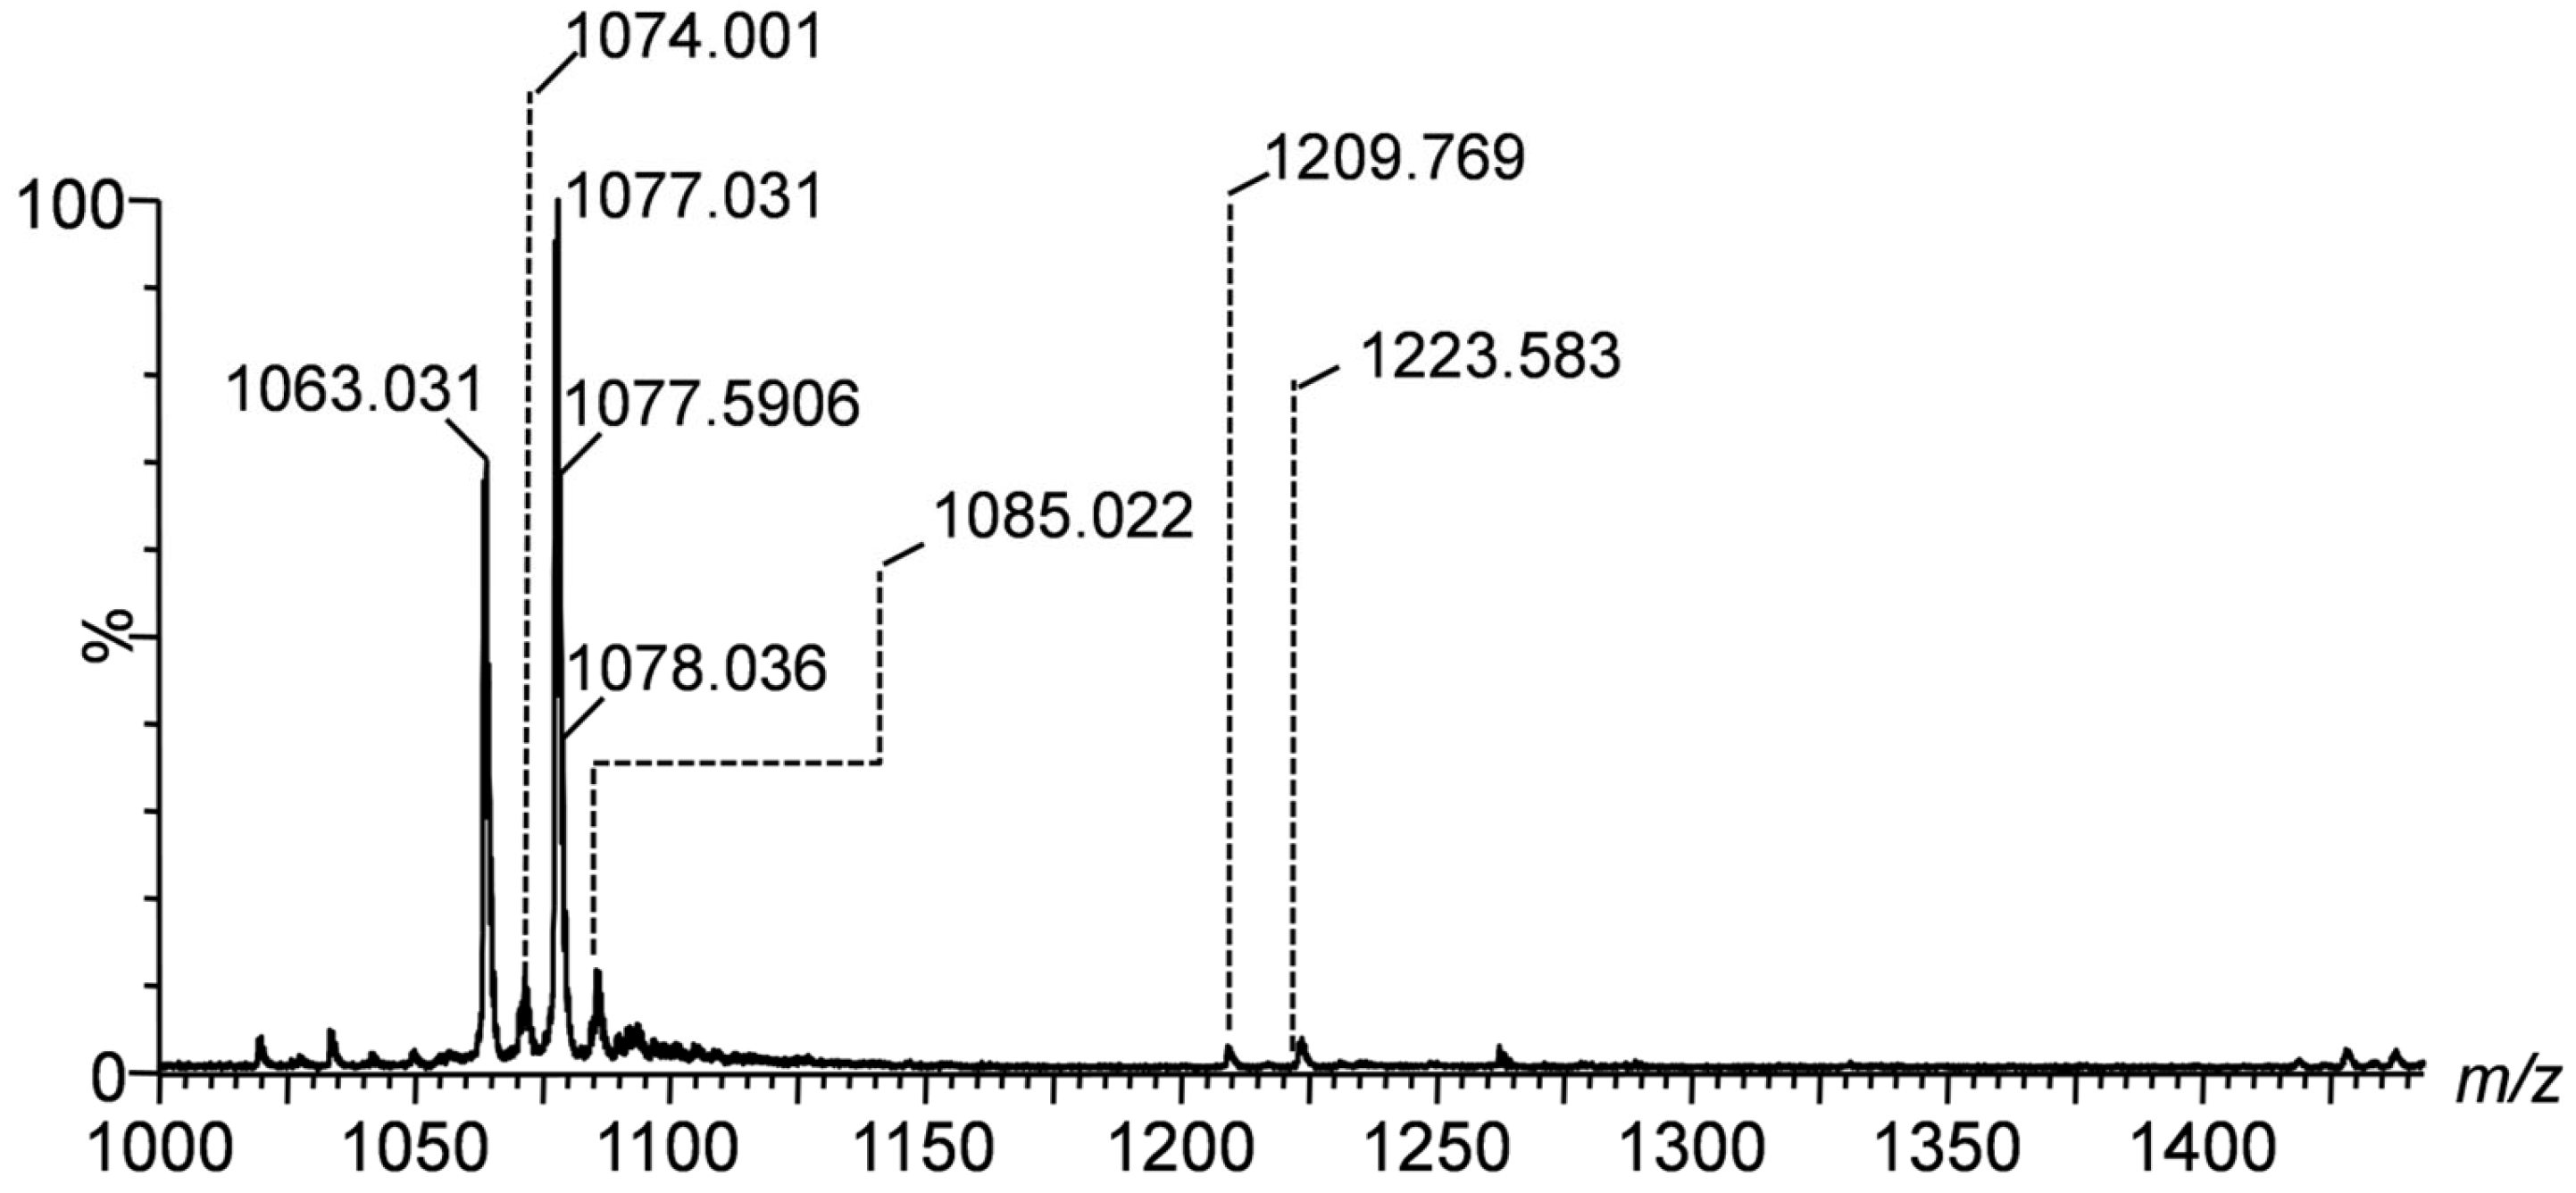
Figure 3.
nanoESI IMS MS of gangliosides detected in the APT, m/z range 1600–2000. Conditions as described in Figure 1.
Figure 3.
nanoESI IMS MS of gangliosides detected in the APT, m/z range 1600–2000. Conditions as described in Figure 1.
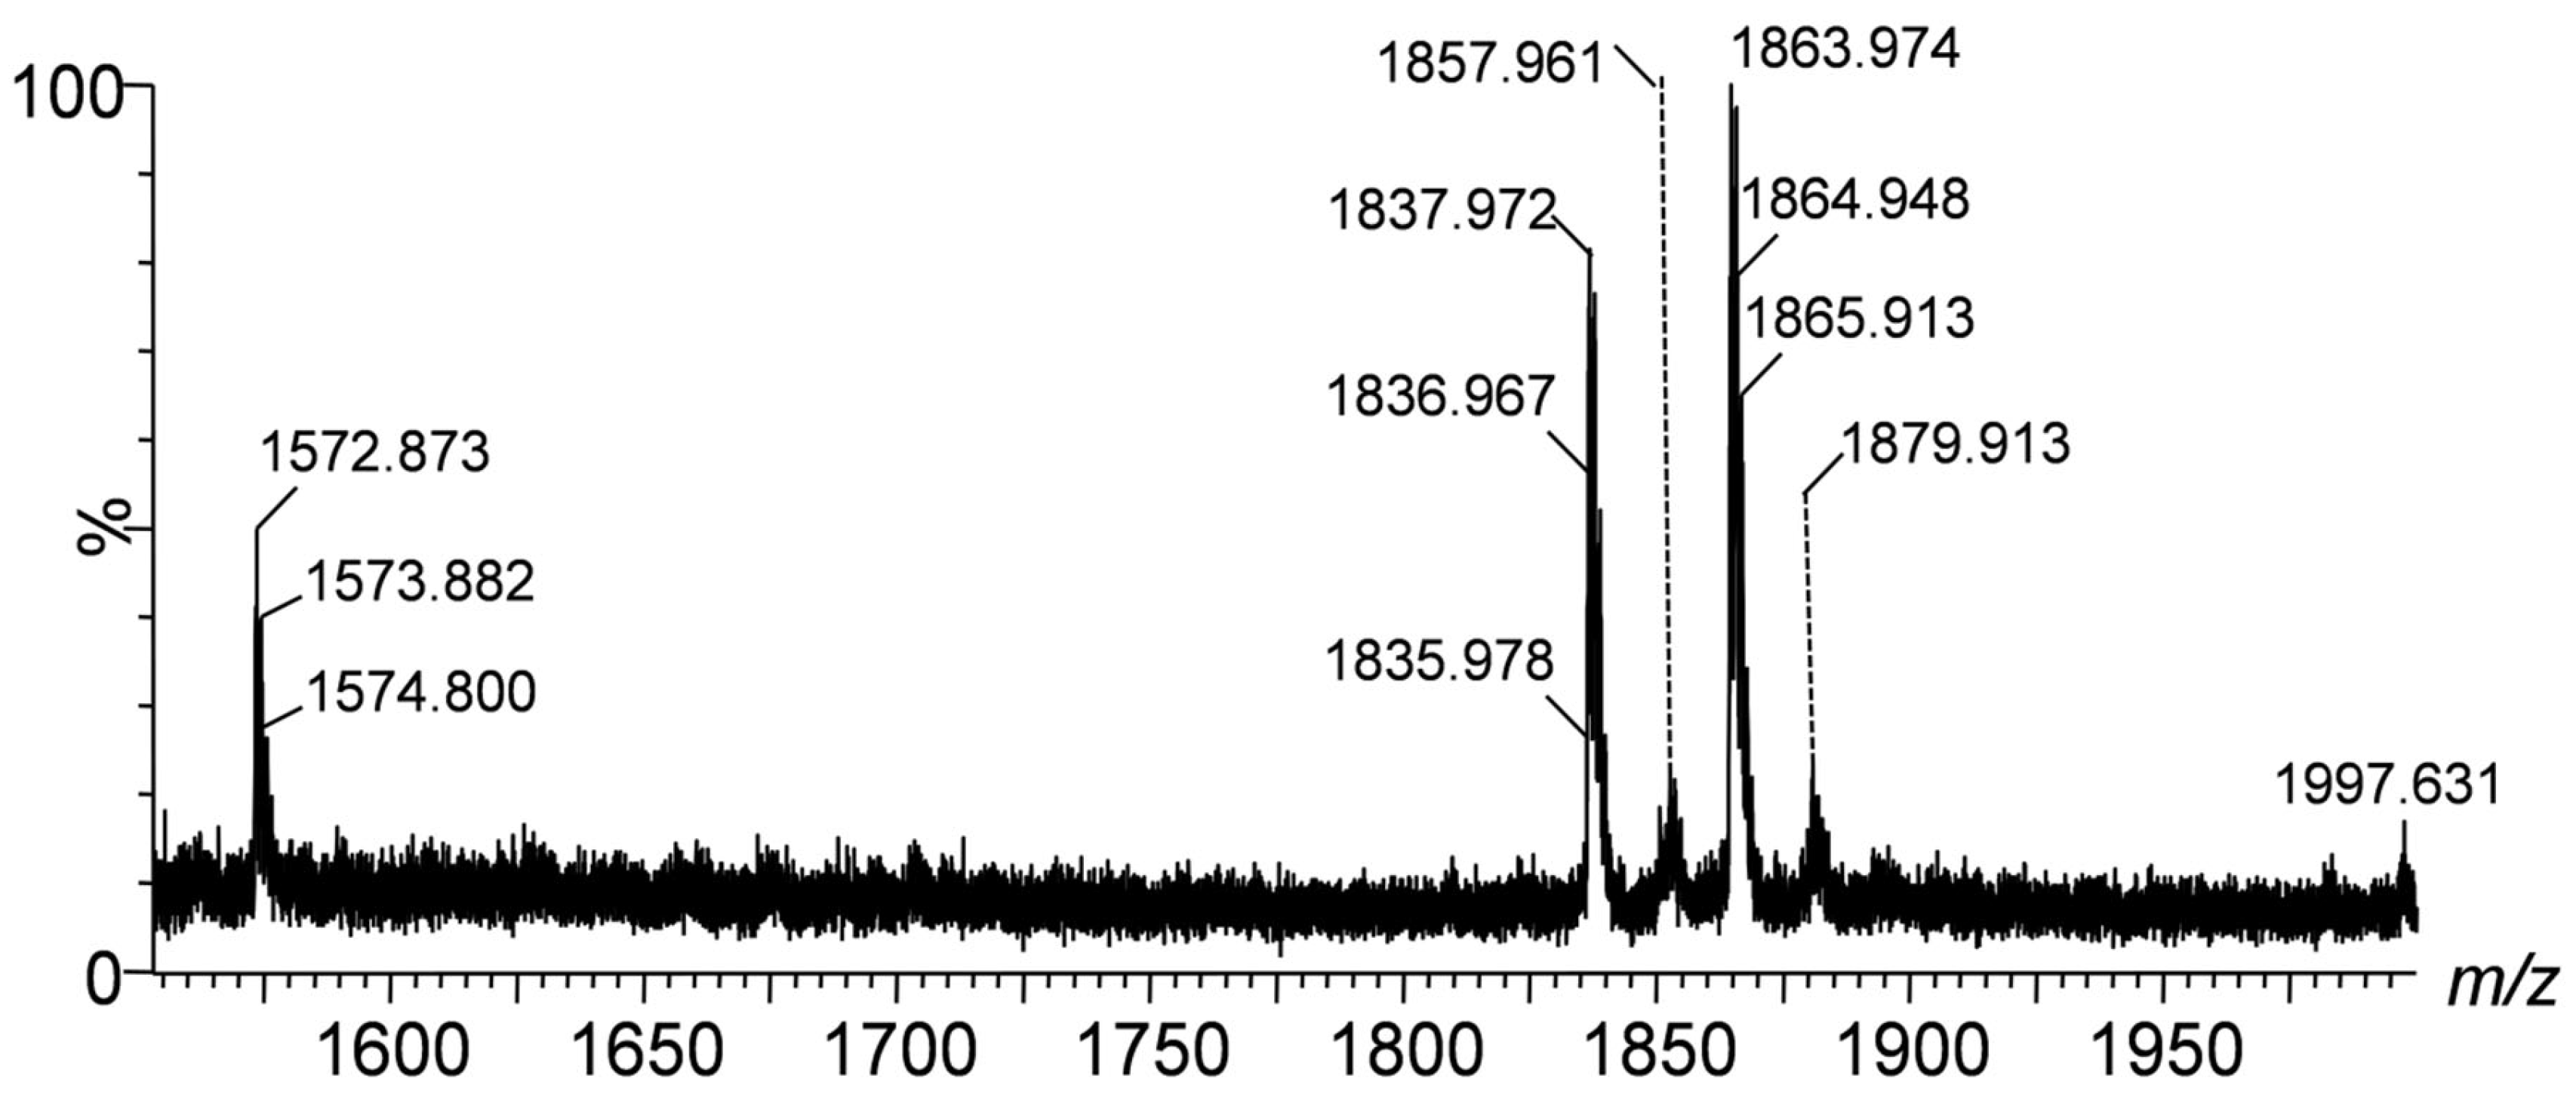
Figure 4.
Heatmap representing the distribution of gangliosides in the peritumoral tissue of diffuse astrocytoma. The heatmap was generated using a diverging color palette, from yellow (low values) to red (high values).
Figure 4.
Heatmap representing the distribution of gangliosides in the peritumoral tissue of diffuse astrocytoma. The heatmap was generated using a diverging color palette, from yellow (low values) to red (high values).
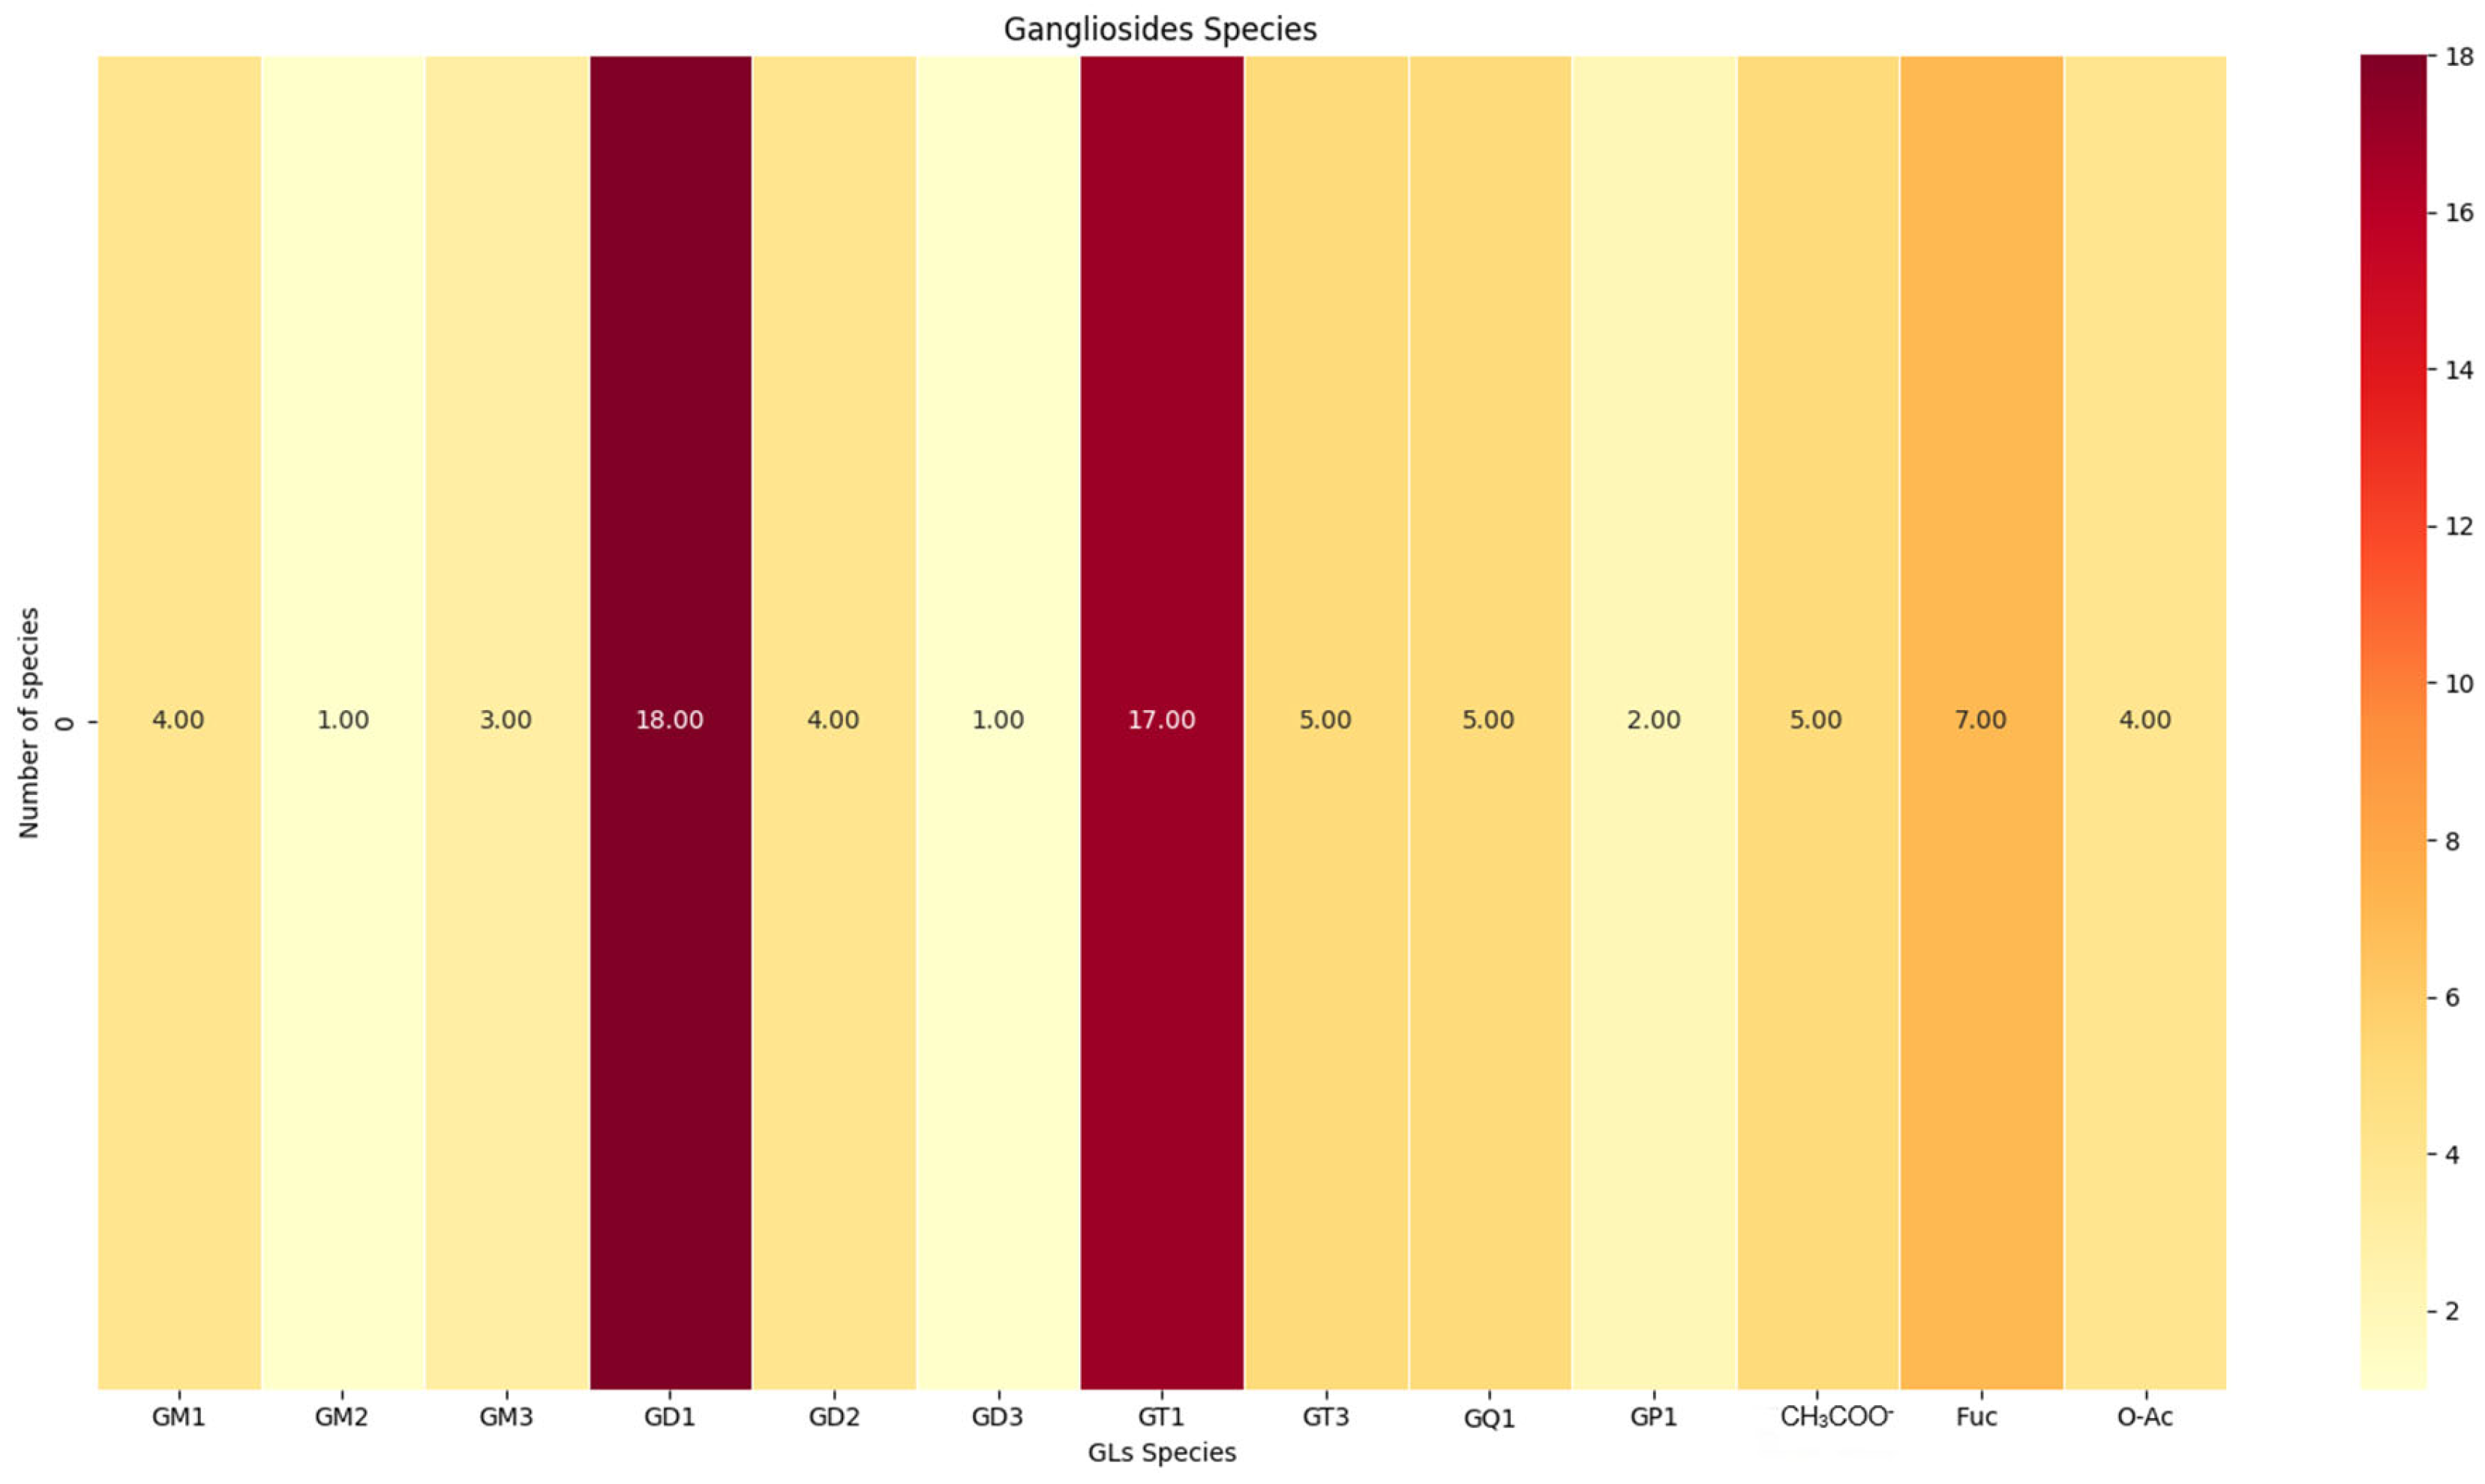
Figure 5.
(-) nanoESI IMS CID MS/MS of the doubly charged [M-2H]²⁻ ion detected at m/z 1077.031, corresponding to the GT1 (d18:1/20:0) ganglioside species isolated and fragmented from the APT sample. CID at variable collision energy within the range of 20–45 eV.
Figure 5.
(-) nanoESI IMS CID MS/MS of the doubly charged [M-2H]²⁻ ion detected at m/z 1077.031, corresponding to the GT1 (d18:1/20:0) ganglioside species isolated and fragmented from the APT sample. CID at variable collision energy within the range of 20–45 eV.
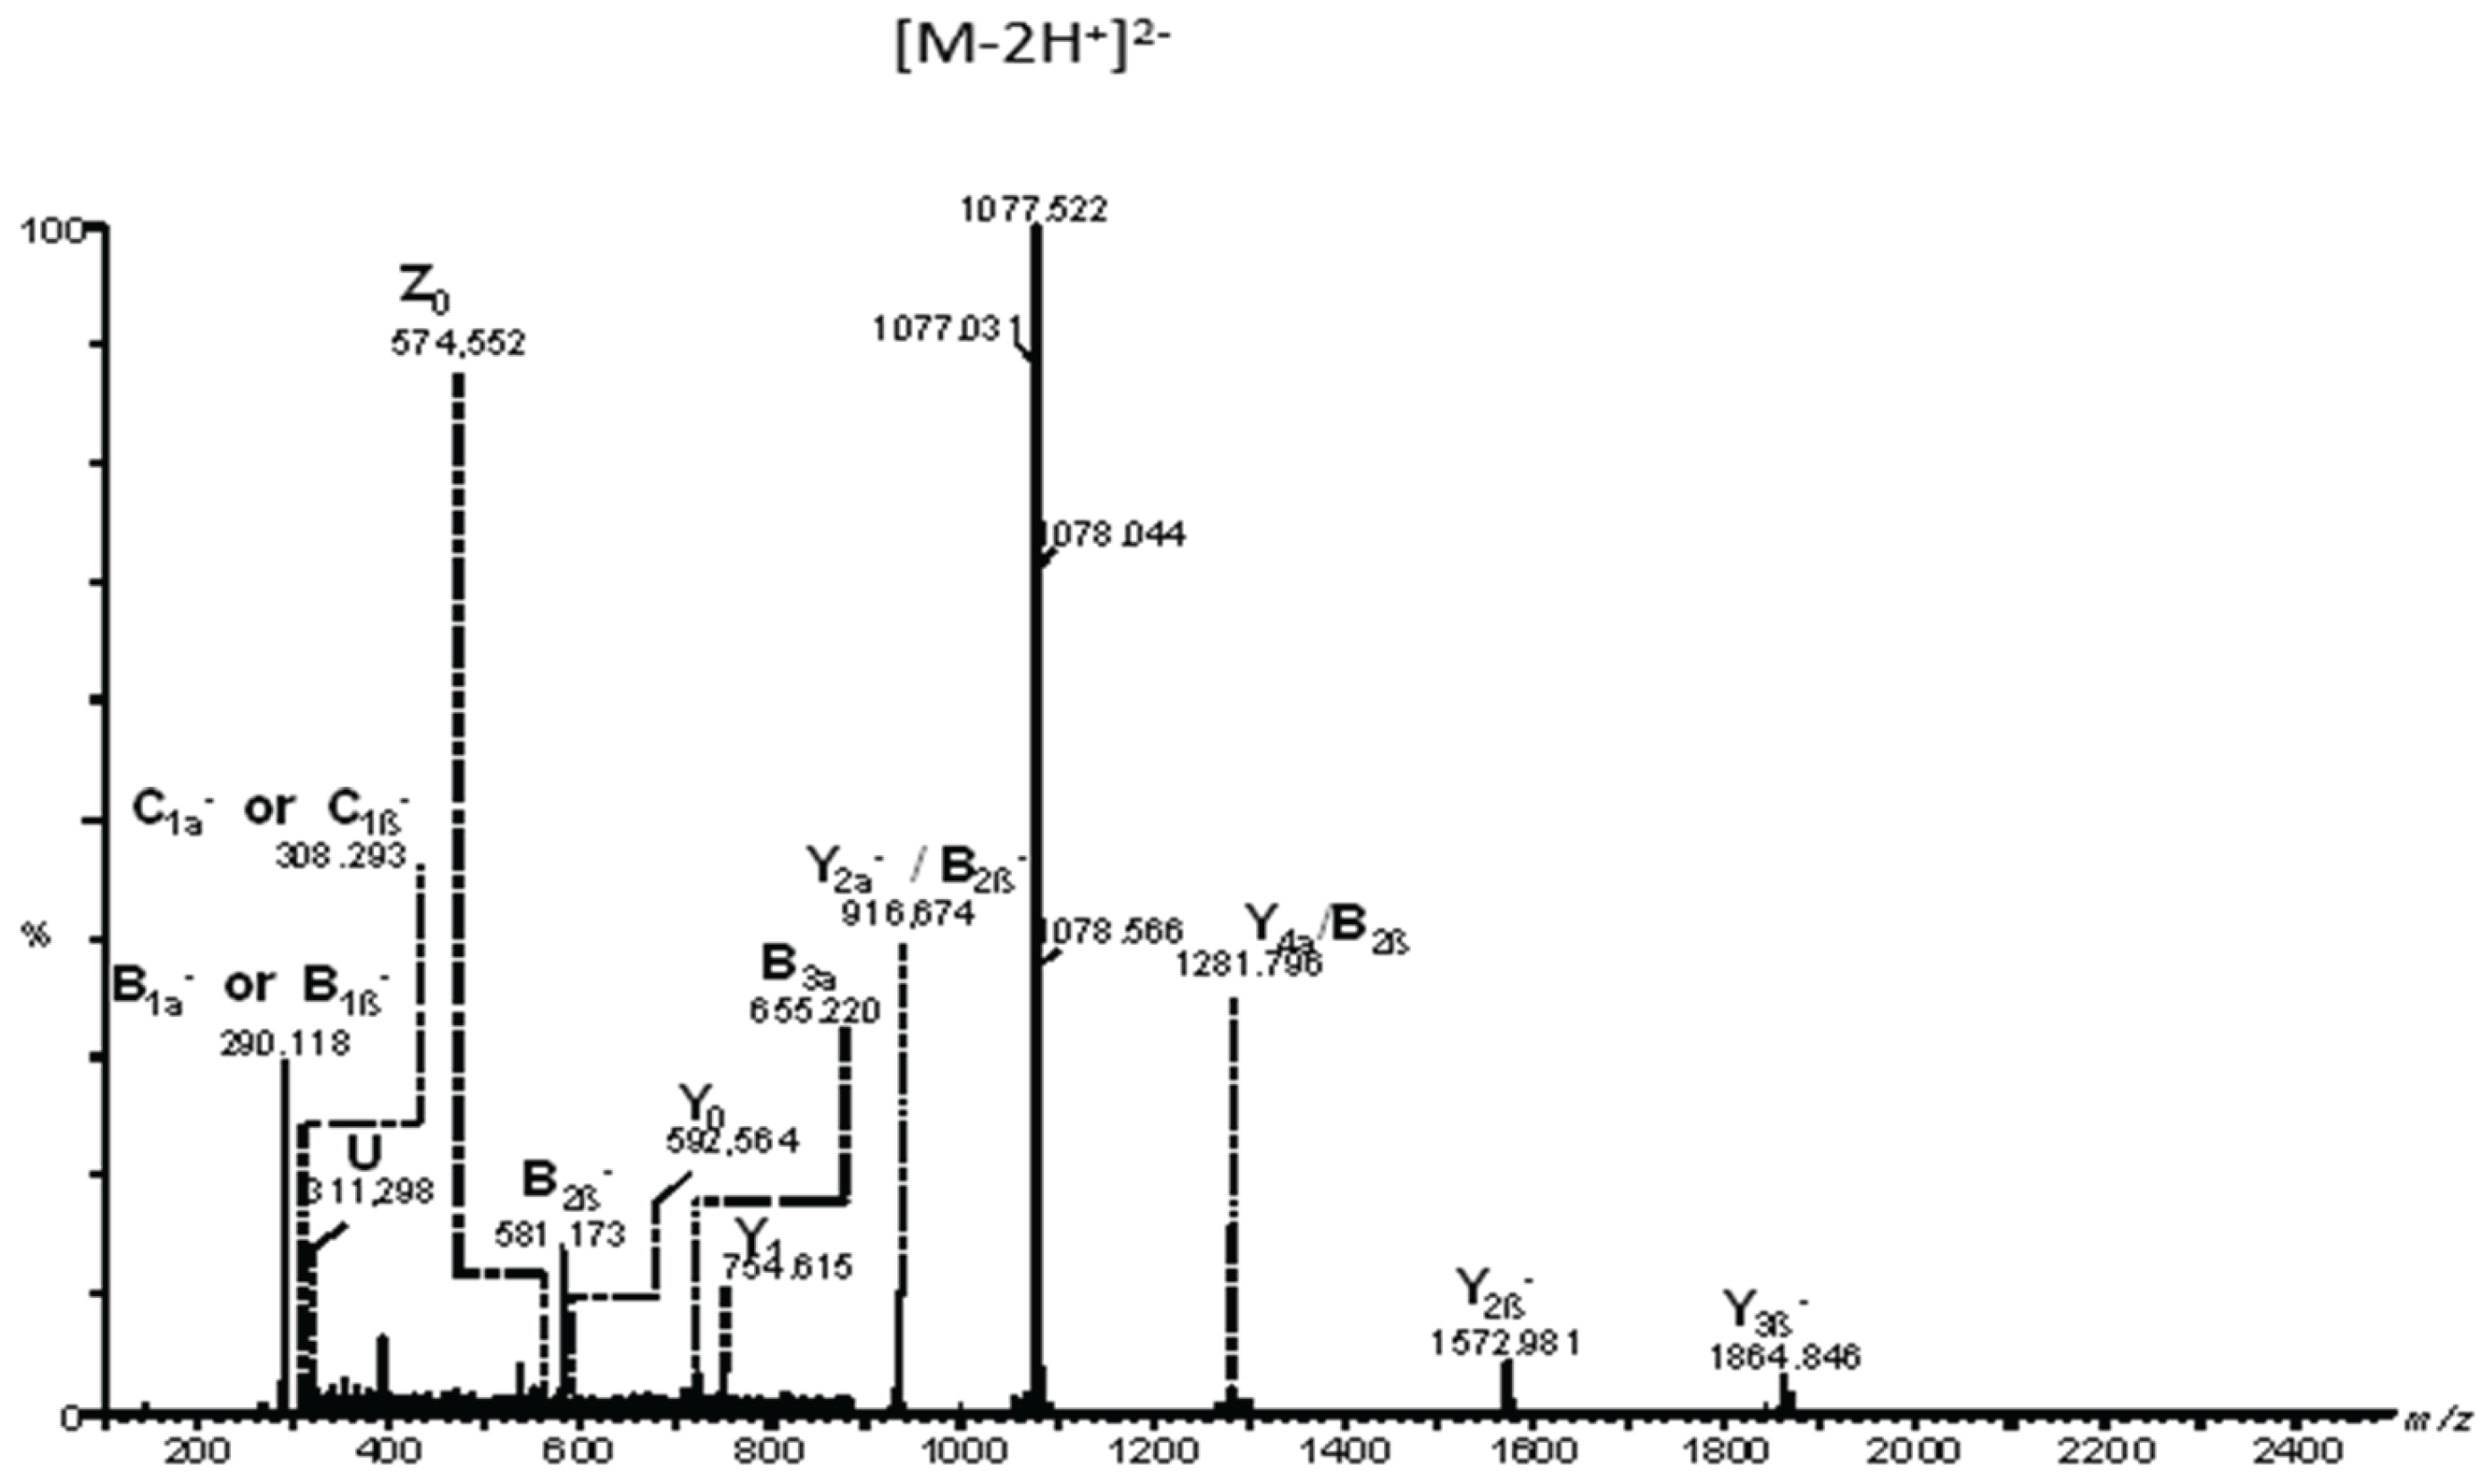
Figure 6.
Fragmentation scheme of the ganglioside species GT1 (d18:1/20:0) isolated from the APT sample under CID conditions. The analysis reveals the fragmentation pattern and the structural details of the species, highlighting the position of Neu5Ac.
Figure 6.
Fragmentation scheme of the ganglioside species GT1 (d18:1/20:0) isolated from the APT sample under CID conditions. The analysis reveals the fragmentation pattern and the structural details of the species, highlighting the position of Neu5Ac.
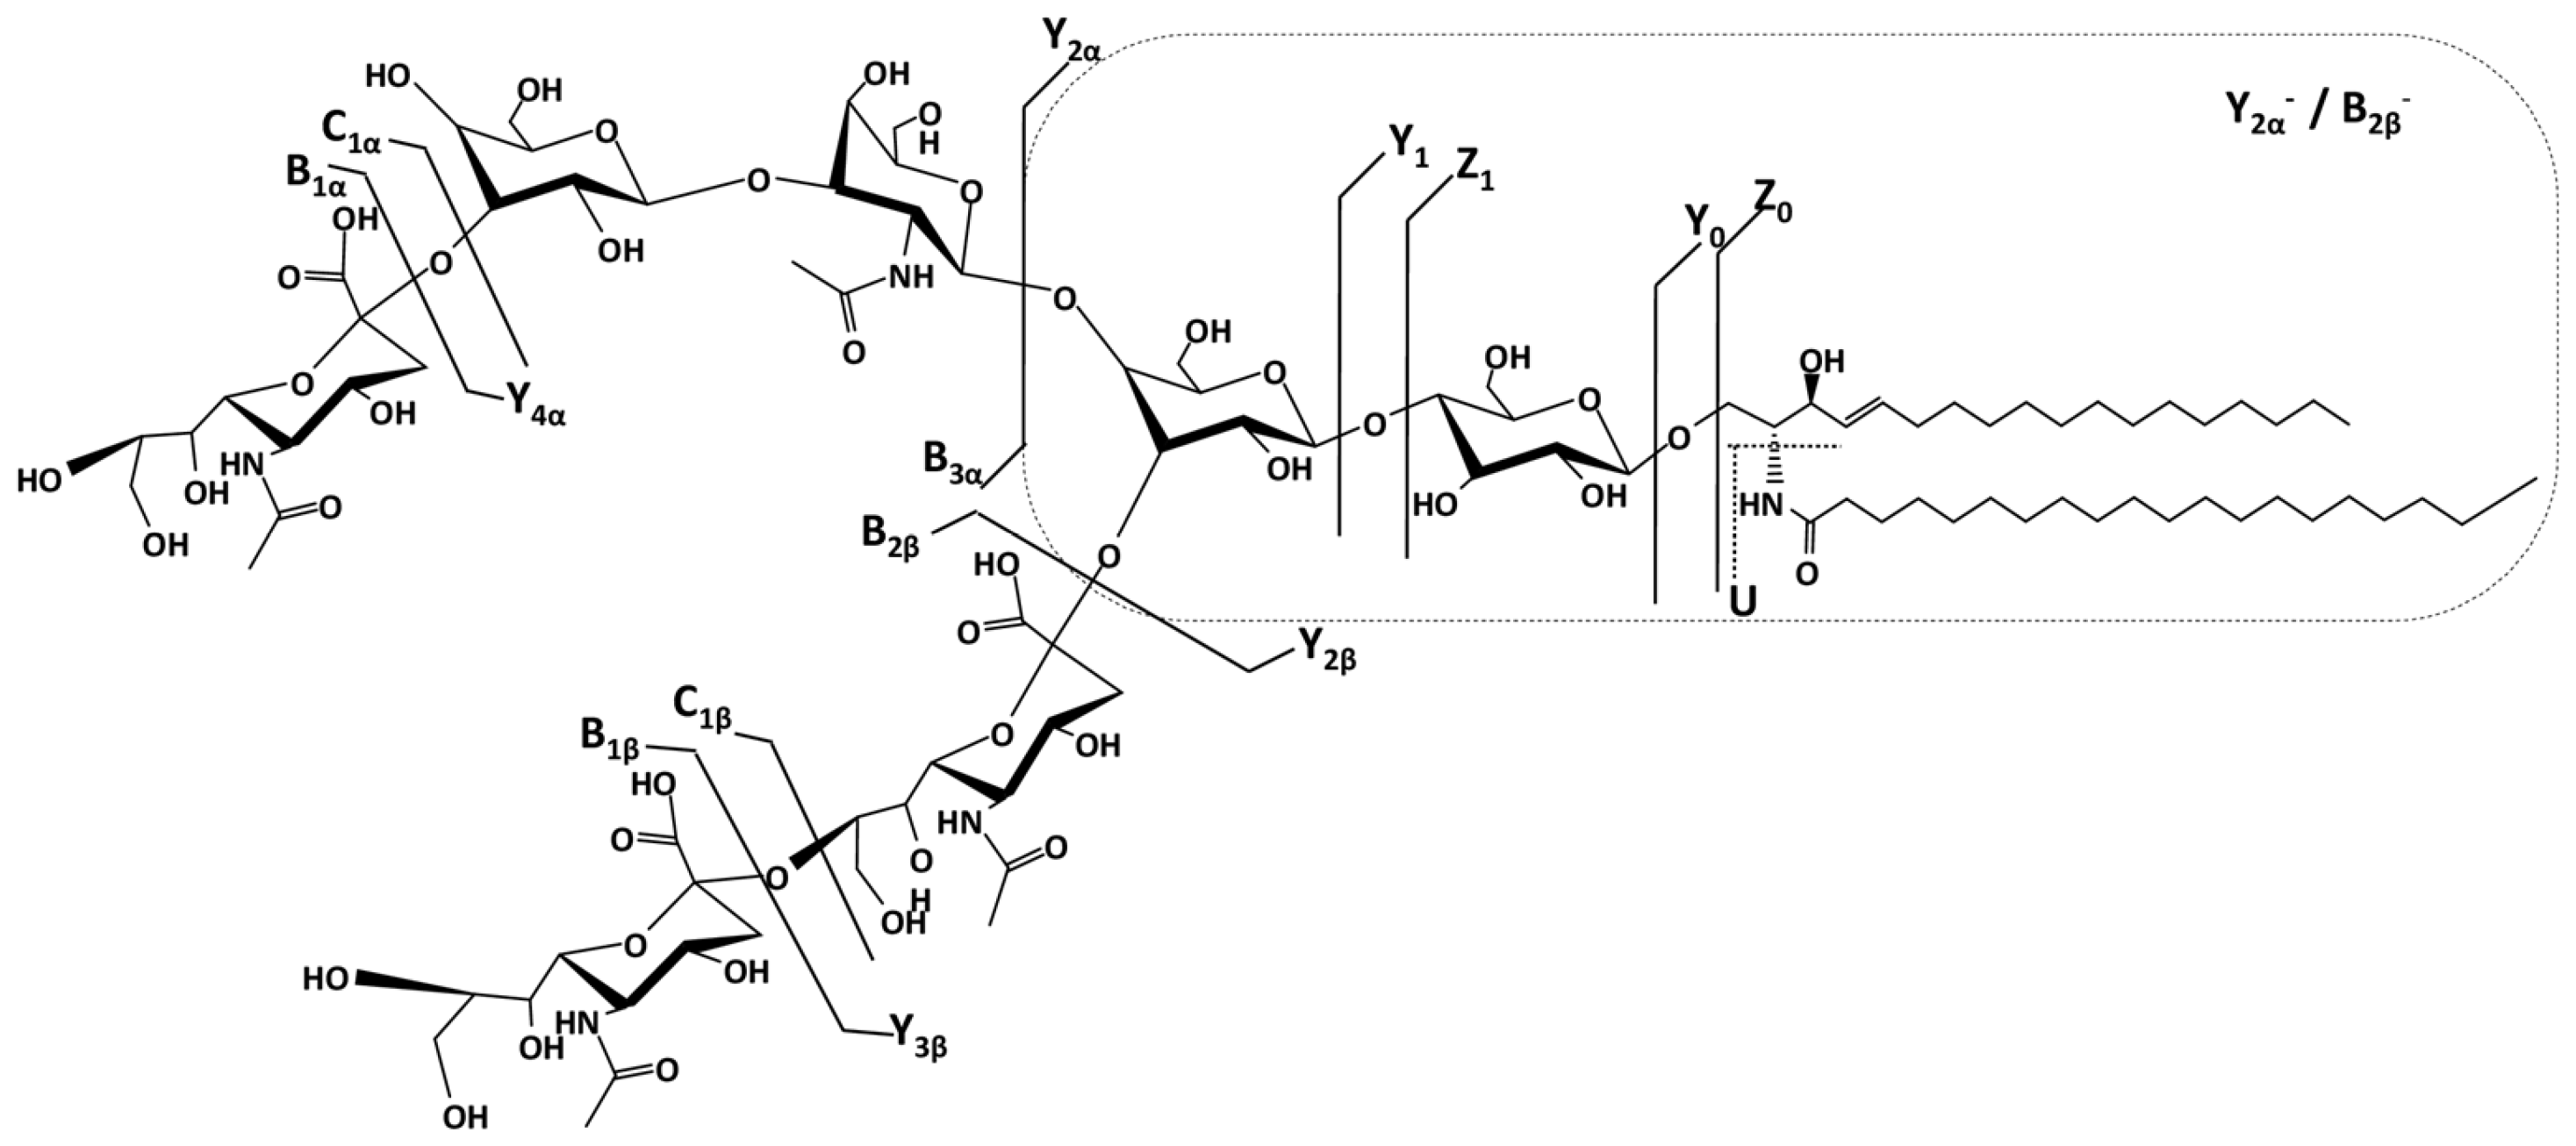

Table 1.
Assignment of the ionic species detected in APT-associated gangliosidome by (-) nanoESI IMS MS.
Table 1.
Assignment of the ionic species detected in APT-associated gangliosidome by (-) nanoESI IMS MS.
| No | m/z exp | m/z theor | Mass accuracy (ppm) | Proposed structure | Molecular ion |
| 1. | 674,863 | 674,870 | 10,39 | GM2(d18:1/16:2) | [M-2H+]2- |
| 2. | 708,340 | 708,346 | 8,47 | GT1(d18:1/18:0) | [M-3H+]3- |
| 3. | 713,663 | 713,679 | 22,44 | GT1(t18:1/18:0) | [M-3H+]3- |
| 713,6591 | 5,47 | GT1(d18:1/16:0) | [M-5H++2Na]3- | ||
| 4. | 717,685 | 717,692 | 9,76 | GT1(d18:1/20:0) | [M-3H+]3- |
| 5. | 722,364 | 722,351 | 18,01 | GT1(t18:1/20:1) | [M-3H+]3- |
| 6. | 727,041 | 727,033 | 11,01 | GT1(d18:1/22:0) | [M-3H+]3- |
| 7. | 735,694 | 735,682 | 15,51 | (CH3COO- ) GT1(d18:1/18:0) | [M- -3H+Na]3- |
| 8. | 770,928 | 770,920 | 10,39 | GM1(d18:1/18:1) | [M-2H+]2- |
| 9. | 782,906 | 782,919 | 16,62 | GM1(d18:1/18:0) | [M-3H++Na+]2- |
| 10. | 785,932 | 785,944 | 15,29 | GM1(d18:1/20:0) | [M-2H+]2- |
| 11. | 789,952 | 789,965 | 16,48 | GD3(d18:1/26:1) | [M-2H+]2- |
| 12. | 794,012 | 794,018 | 7,56 | GQ1(d18:1/16:3) | [M-3H+]3- |
| 13. | 822,422 | 822,434 | 14,60 | GD2(d18:1/16:0) | [M-2H+]2- |
| 14. | 828,444 | 828,452 | 9,66 | GD2(d18:0/18:0) | [M-2H+]2- (-H2O) |
| 15. | 831,397 | 831,392 | 6,02 | GQ1(d18:1/22:0) | [M-3H+]3- |
| 16. | 850,481 | 850,465 | 18,82 | GD2(d18:1/20:0) | [M-2H+]2- |
| 17. | 863,462 | 863,474 | 13,90 | GD2(d18:1/22:1) | [M-2H+]2- |
| 18. | 902,122 | 902,110 | 13,30 | GP1(d18:1/18:0) | [M-3H+]3- |
| 19. | 903,468 | 903,460 | 8,86 | GD1(d18:1/16:0) | [M-2H+]2- |
| 903,479 | 12,18 | GT3(t18:0/20:0) | [M-2H+]2- | ||
| 20. | 916,460 | 916,470 | 10,92 | GD1(d18:1/18:1) | [M-2H+]2- |
| 21. | 917,463 | 917,475 | 13,09 | GD1(d18:1/18:0) | [M-2H+]2- |
| 22. | 926,463 | 926,483 | 21,60 | GD1(t18:0/18:0) | [M-2H+]2- |
| 926,453 | 10,80 | GD1(d18:1/18:2) | [M-3H++Na+]2- | ||
| 23. | 930,478 | 930,486 | 8,60 | GD1(d18:1/20:1) | [M-2H+]2- |
| 24. | 938,471 | 938,483 | 13,75 | GD1(t18:1/20:1) | [M-2H+]2- |
| 938,452 | 19,62 | GD1(d18:1/18:1) | [M-4H++2Na+]2- | ||
| 25. | 950,477 | 950,4839 | 7,26 | O-Ac-GD1(d18:1/20:2) | [M-2H+]2- |
| 950,4708 | 6,53 | O-Ac-GT3(d18:1/22:1) | [M-4H++2Na]2- | ||
| 26. | 951,493 | 951,488 | 5,26 | O-Ac-GD1(d18:1/20:1) | [M-2H+]2- |
| 27. | 958,468 | 958,476 | 8,35 | (CH3COO-) GD1(d18:1/18:0) | [M--2H++Na+]2- |
| 28. | 965,478 | 965,484 | 6,22 | (CH3COO-) GD1(d18:1/19:0) | [M--2H++Na+]2- |
| 29. | 988,486 | 988,4919 | 5,97 | FucGD1(d18:1/18:2) | [M-2H+]2- |
| 30. | 991,508 | 991,512 | 4,04 | Fuc-GT3(d18:1/24:4) | [M-2H+]2- |
| 991,502 | 6,05 | Fuc-GT3(d18:1/24:3) | [M-2H+]2- | ||
| 31. | 1003,509 | 1003,513 | 3,99 | Fuc-GD1(d18:1/20:1) | [M-2H+]2- |
| 32. | 1009,503 | 1009,512 | 8,92 | (CH3COO-) Fuc-GT3(d18:1/22:2) | [M--H+]2- |
| 1009,498 | 4,96 | (CH3COO-) GD1(d18:1/24:2) | [M--3H++2Na+]2- | ||
| 33. | 1013,486 | 1013,496 | 9,87 | Fuc-GD1(d18:1/20:2) | [M-3H++Na+]2- |
| 34. | 1018,951 | 1018,963 | 11,79 | GT1(d18:1/12:2) | [M-2H+]2- |
| 35. | 1021,973 | 1021,987 | 13,71 | GT1(d18:0/12:0) | [M-2H+]2- |
| 36. | 1024,523 | 1024,536 | 12,70 | Fuc-GD1(d18:1/23:1 | [M-2H+]2- |
| 37. | 1027,953 | 1027,969 | 15,58 | GT1(t18:1/12:1) | [M-2H+]2- |
| 38. | 1029,972 | 1029,954 | 17,49 | GT1(d18:1/12:2) | [M-3H++Na+]2- |
| 39. | 1032,963 | 1032,979 | 15,50 | GT1(d18:1/14:2) | [M-2H+]2- |
| 40. | 1033,965 | 1033,987 | 21,30 | GT1(d18:1/14:1) | [M-2H+]2- |
| 41. | 1042,984 | 1042,962 | 21,11 | GT1(d18:1/14:3) | [M-3H++Na+]2- |
| 42. | 1048,996 | 1049,010 | 13,35 | GT1(d18:1/16:0) | [M-2H+]2- |
| 43. | 1062,004 | 1062,018 | 13,18 | GT1(d18:1/18:1) | [M-2H+]2- |
| 44. | 1063,031 | 1063,026 | 4,42 | GT1(d18:1/18:0) | [M-2H+]2- |
| 45. | 1074,009 | 1074,017 | 7,45 | GT1(d18:1/20:3) | [M-2H+]2- |
| 1074,018 | 8,38 | GT1(d18:1/20:0) | [M-2H+]2- | ||
| 46. | 1077,031 | 1077,041 | 9,29 | GT1(d18:1/20:0) | [M-2H+]2- |
| 47. | 1081,997 | 1082,012 | 13,86 | O-Ac-GT1(d18:1/18:2) | [M-2H+]2- |
| 48. | 1085,022 | 1085,008 | 12,90 | GT1(d18:1/18:0) | [M-4H++2Na+]2- |
| 1085,039 | 15,67 | GT1(t18:1/20:0) | [M-2H+]2- | ||
| 49. | 1088,018 | 1088,030 | 11,03 | GT1(d18:1/20:0) | [M-3H++Na+]2- |
| 50. | 1095,982 | 1095,997 | 13,70 | GT1(d18:1/20:3) | [M-4H++2Na+]2- |
| 51. | 1099,065 | 1099,054 | 10,01 | GT1(t18:1/22:0) | [M-2H+]2- |
| 52. | 1139,658 | 1139,666 | 7,02 | GM3(t18:1/14:0) | [M-H+]- |
| 53. | 1151,724 | 1151,705 | 16,51 | GM3(d18:1/16:0) | [M-2H+]2- |
| 54. | 1209,769 | 1209,783 | 11,58 | GM3(d18:0/20:0) | [M-2H+]2- |
| 55. | 1223,583 | 1223,597 | 11,45 | GQ1(d18:0/20:0) | [M-2H+]2- |
| 56. | 1227,563 | 1227,577 | 11,41 | GQ1 (t18:1/18:0) | [M-3H++Na+]2- |
| 57. | 1310,635 | 1310,642 | 5,42 | Fuc-GQ1(d18:0/22:0) | [M-2H+]2- |
| 58. | 1382,140 | 1382,152 | 8,68 | GP1(d18:0/22:0) | [M-2H+]2- |
| 59. | 1572,873 | 1572,900 | 17,18 | GM1(d18:1/20:0) | [M-H+]- |
| 60. | 1835,978 | 1835,964 | 7,63 | GD1(d18:1/18:0) | [M-H+]- |
| 61. | 1857,961 | 1857,946 | 8,08 | GD1(d18:1/18:0) | [M-2H++Na+]- |
| 62. | 1863,974 | 1863,995 | 11,27 | GD1(d18:1/20:0) | [M-H+]- |
| 63. | 1873,961 | 1873,973 | 6,41 | GD1(d18:0/19:0) | [M-2H++Na+]- |
| 64. | 1879,913 | 1879,923 | 5,32 | GD1(d18:1/18:0) | [M-3H++2Na+] |
d-dihydroxylated sphingoid base; t-trihydroxylated sphingoid base.
Disclaimer/Publisher’s Note: The statements, opinions and data contained in all publications are solely those of the individual author(s) and contributor(s) and not of MDPI and/or the editor(s). MDPI and/or the editor(s) disclaim responsibility for any injury to people or property resulting from any ideas, methods, instructions or products referred to in the content. |
© 2025 by the authors. Licensee MDPI, Basel, Switzerland. This article is an open access article distributed under the terms and conditions of the Creative Commons Attribution (CC BY) license (http://creativecommons.org/licenses/by/4.0/).
Copyright: This open access article is published under a Creative Commons CC BY 4.0 license, which permit the free download, distribution, and reuse, provided that the author and preprint are cited in any reuse.


