
Submitted:
25 June 2025
Posted:
25 June 2025
You are already at the latest version
Abstract
Given the climate change being observed in the past few decades, sustainable development and the use of renewable energy sources are urgent. In this scenario, hydrogen production through electrolyzers is a promising renewable source and energy vector because of its ultralow greenhouse emissions and high energy content. Hydrogen can be used in a variety of applications, from transportation to electricity generation, contributing to the diversification of the energy matrix. In this context, this paper presents an autonomous isolated microgrid system for generating and storing electrical energy, to be exclusively used for feeding an electrolyzer hydrogen production plant, which has been retrofitted toward green hydrogen production. The experimental verification was performed at Itaipu Parquetec, which consists of an alkaline electrolysis unit directly integrated with a battery energy storage system and renewable sources (e.g., photovoltaic and wind) by using an isolated DC microgrid concept based on DC-DC and AC-DC converters. Experimental results revealed that the new electrolyzer DC-DC converter increases the system’s overall efficiency in comparison to the legacy thyristor-based power supply system, and autonomously control the energy supply to the electrolyzer under optimized conditions with extremely low output current ripple. Another advantage of the proposed DC microgrid is its ability to proper manage the startup and shutdown process of the electrolyzer plant under generation outages. This paper is the result of activities carried out under the R&D project of the ANEEL program No. PD-10381-0221/2021, entitled Multiport DC-DC Converter and IoT System for Intelligent Energy Management, which was conducted in partnership with CTG-Brasil.
Keywords:
Green Hydrogen
; DC microgrid
; Renewable Energy Sources
; Power Plant Retrofit
1. Introduction
Sustainable development combined with the adoption of renewable energy sources (RES) has been the goal to achieve net-zero emissions in the modern world. Given the severe climate changes faced and their current effects, several countries have been proposing increasingly bold measures and objectives for mass decarbonization in the coming years, with a focus on mitigating carbon emissions. The global energy transition is an urgent challenge and a critical priority to address climate change and achieve decarbonization. In this context, green hydrogen (GH2), produced through the electrolysis of water utilizing electricity from RES, such as solar and wind, has emerged as a promising energy vector and a fundamental solution for decarbonizing multiple sectors. Green hydrogen is particularly considered essential for hard-to-abate sectors and long-term energy storage [1,2,3,4,5,6].
Hydrogen has been safely used for over a century, primarily in industrial applications such as oil refining, ammonia production, fertilizers, metallurgical applications, and the food industry [7]. Currently, over 99.9% of hydrogen demand is met by those traditional sectors, where hydrogen plays a fundamental role [4]. Green hydrogen is now being promoted for a broader range of new applications, aiming to decarbonize these and other sectors. These applications include heavy industry (e.g., steel, cement, chemicals), mobility and transportation (e.g., fuel in electric vehicles, heavy-duty transportation like trucks, trains, ships, and long-haul transport), and civil applications such as heating and power generation in buildings [4]. Furthermore, green hydrogen is crucial for energy storage and grid balancing, acting as a versatile energy carrier and storage medium for surplus renewable energy [3,4].
However, the widespread implementation of green hydrogen faces significant drawbacks and challenges. The intermittent and stochastic nature of renewable energy sources can reduce the efficiency of hydrogen production and complicate its integration into energy systems. The water electrolysis process, a key method for green hydrogen generation, is inherently energy-intensive [8]. The entire hydrogen supply chain, from production to final use, is complex and can incur significant energy losses, potentially reducing overall efficiency to below 30-40% [4]. High production costs, which can be five to ten times more expensive than gray hydrogen and currently range from $10 to $15 per kilogram for GH2 [5] (though projected to decrease to around $1.5/kg by 2050 [5]), conversion inefficiency, and dependence on specialized infrastructure are additional barriers to widespread adoption [8]. Existing infrastructure often requires substantial and costly modifications to accommodate hydrogen, presenting challenges related to storage (such as low density, significant compression energy requirements of 10-15% of total energy input, and material degradation including embrittlement) and transportation (limited dedicated pipelines, only about 5000 km globally compared to over 3 million km for natural gas) [3,4,5,9,10]. Furthermore, many promising technological solutions are still far from industrial readiness, operating at low Technology Readiness Levels (TRLs) [3,4,5]. Safety considerations are paramount in hydrogen system design and deployment, given its highly flammable and explosive nature, which necessitates rigorous measures for leakage detection, explosion risk mitigation, and public perception management [7,10,11]. The current marginal presence of green hydrogen, making up just 0.1% of global hydrogen production by the end of 2023, highlights these ongoing challenges [4,5].
Despite these challenges, green hydrogen presents significant opportunities for a sustainable energy future. It offers a powerful tool for decarbonization, particularly in sectors where direct electrification is difficult. One key advantage is its ability to mitigate the intermittency and stochasticity of renewable energy sources by converting surplus electricity from wind and solar into hydrogen for storage and later use, thereby optimizing energy utilization and preventing curtailment. The mixing advantages between solar and wind, combined with storage, are particularly notable; these diverse renewable resources can complement each other by providing consistent energy during periods of low availability from one source, enhancing overall system reliability and supporting grid stability and resilience. This long-term energy storage capability goes beyond the capacities of batteries and extends the application of renewables into thermal energy systems and mobility [4,6,12,13,14]. Furthermore, green hydrogen offers potential economic benefits, including a projected 20–28% reduction in climate mitigation costs [5]. These costs are expected to decline further due to technological advancements and economies of scale. Targeted policies and bankable investment models are crucial for fostering the development of hydrogen ecosystems and accelerating their adoption [4]. Moreover, the development of approaches that allow for the retrofitting of already installed facilities presents a significant opportunity for widespread implementation.
Hydrogen plants using alkaline electrolyzers are commercially mature for large-scale production, but there is continuous efforts to keep their production efficiency increasing and reducing costs [2,4,5,8,9,12,13,14,15]. Alkaline electrolyzers are electrochemical systems composed of non-noble metallic electrodes (cathode and anode) embedded in an alkaline electrolyte (potassium hydroxide, KOH). In sum, the electrochemical reaction requires the supply of electrical energy in direct current (DC) between the electrodes, leading to the electrochemical conversion of water molecules into hydrogen (H2) and oxygen (O2) [16,17]. The power supply is usually based on the Alternating Current (AC) systems, employing rectifiers (AC-DC converters) to integrate the DC electrolyzers into the electrical utility AC grid, most of them mainly based on transformers associated with thyristor rectifiers or transistor and diode rectifiers [18,19,20]. The alkaline electrolyzers are recognized for their dynamic operation, efficiency, and rapid response times, making them ideal for integration with intermittent energy sources. Thyristor-based converters are the most widely used because of their cost, simplicity, and reliability. However, these AC-DC converters present technical limitations related to the energy quality of power supplied and efficiency. The ripple factor of direct current, frequency, and fluctuation of the current supplied by the rectifier to the electrolyzer can also impact the life cycle of the electrodes, resulting in degradation and/or efficiency decrease [18,19,20]. To obtain GH2, the Hydrogen plants must be powered by renewable energy sources, and their direct connection to DC power systems can enhance overall system efficiency.
Considering the challenges of existing infrastructure and the need for coherent, scalable strategies that connect technological development with practical implementation in specific sectors, this paper presents a novel isolated DC microgrid concept for GH2 production to efficiently integrate RES into industrial electrolyzers, which is an opportunity to retrofit already installed Hydrogen plants, as shown in this work. Experimental results obtained from the isolated DC microgrid experimental Hydrogen plant are presented to validate the operation of the different DC ports on energy processing and storage, as well as to feed the legacy electrolyzer. The results show that the proposed DC microgrid efficiently performs the energy processing and management of the power generated by RES (PV and Wind emulated), and it is also capable of storing the excess energy in a sodium battery or feeding the electrolyzer from the battery. It properly provides DC power to the electrolyzer for GH2 production, showcasing the efficiency improvements with the DC power supply. The experimental validations are crucial to confirm the practical feasibility and efficiency of new approaches in the field of green hydrogen. This study contributes to advancing the integration of GH2 into energy systems, promoting a more sustainable and decarbonized future.
2. Legacy Hydrogen Production Plant
The Itaipu Parquetec located in Brazil is focused on applied research and was established in 2012, with the support of Itaipu Binational, the largest hydroelectric plant in the world in terms of annual energy production and the second in generation capacity (14 GW) [21,22]. The center operates across the entire hydrogen technology value chain, and innovation in hydrogen production is one of its core expertise areas. Since its establishment in 2012, it has been developing new technologies and operating an production plant, based on Alkaline Water Electrolysis (AEL) Figure 1.
2.1. Standard Electrical Power System of the Electrolyzer
The industrial electrolyzer operating in Itaipu Parquetec was designed and manufactured by the former Italian company H2 Nitidor. The electrolyzer technical parameters and electrical loads data are shown in Table 1. The legacy electrolyzer electrical power system overview, showing the thyristor-based power supply and auxiliary electrical loads, can be seen in Figure 2.
One safety-related factor regarding hydrogen production systems is the plant’s earthing of the metal parts to avoid the risk of electrical discharges and the danger of explosions. Since metal live parts must be protective earthed, the electrical system must include a galvanic isolation stage to protect the parts from the electric grid hazards [18]. As can be seen in Figure 2, the legacy electrolyzer electrical power system features an isolation transformer to provide galvanic isolation between the electrical grid and the electrolyzer’s thyristor-based six-pulse rectifier, which is connected to the cell stack. This was one of the assessed requirements to define the new converter topology for feeding the G electrolyzer, as will be shown in the next section (galvanic isolation was provided in high-frequency through an isolated DC-DC converter).
2.2. Hydrogen Production Process Based on AEL
The Hydrogen production is based on alkaline electrolysis technology. The process consists of the electrochemical conversion of water () into Hydrogen () and Oxygen () molecules through the electric field applied at the electrode interface by a DC power supply. The electrolysis cell has a multi-layer structure of anode, diaphragm, cathode, and electrolyte flow channels. Once the electrolysis cell is stacked up in a desired/designed number of cells, it forms a cell stack of the electrolyzer, which can be seen in Figure 3. More details on the AEL cell stack arrangement, as well as its physics phenomena, can be seen in [16,17].
The control process of Hydrogen production is based on several stages involving not only the electrolysis itself, but also the separation, purification, compression, and storage processes. Each stage is automatically controlled via a Programmable Logic Controller (PLC) integrated into a Supervisory Control and Data Acquisition (SCADA) system, and then the plant’s operator supervises all production steps using the SCADA software on computers. Among the main embedded functionality of the test platform, precise control of pivotal process variables, such as electrolyte flow, pressure, temperature, and direct current electrical power supply, is essential to guarantee the overall production process quality. The experimental station has also integrated safety features, graphical supervision via human-machine interface (HMI), automated execution of operational sequences through pre-configured scripts, and functional expansion capacity via programmable interfaces. All operating data are automatically collected and stored, enabling traceability, comparative performance analysis, and support for calibration of physical-computational models. The whole process is represented in Figure 4 and a summary of each step in the Hydrogen production is discussed in the following subsections.
2.2.1. Startup/Shutdown Purge and Inertization Phases with Nitrogen
Nitrogen is often used to purge the electrolyzer system, playing a subtle but important role in alkaline water electrolyzers keeping the system safe specially during startup, shutdown, and maintenance phases (idle time), as well as to prevent system oxidation, since components inside the electrolyzer can corrode if exposed to oxygen or moisture when idle (electrodes or internal piping). Therefore, Nitrogen helps create an oxygen-free environment to protect these parts during inertization phases.
After a whole cycle of the electrolysis process, the system contains a mixture of Hydrogen and Oxygen gases. If those gases are not removed from the piping and equipment, the mixture can become explosive. Thus, also for safety reasons, an inert gas is used to carry the potentially explosive gas mixture out of the electrolyzer. Before restarting the system, Nitrogen is employed to dry the internal components, ensuring no reactive gases are present, keeping Hydrogen production within the highest purity levels.
2.2.2. Alkaline Water Electrolysis (AEL)
After the purge phase Section 2.2.1, all pipes are almost free of impurities, and Nitrogen is collected. The automated process control starts the Hydrogen production.
The water molecule is broken down into Hydrogen and Oxygen applying DC voltage in the cell stack electrodes, while the electrolyte flowing through the anode and cathode, contacting the catalyst on both electrodes, facilitates ionic conduction of the (cathode) and (anode) molecules out of the electrolyzer utilizing an aqueous solution of Potassium Hydroxide (). Each and molecules are properly routed to its horizontal separator vessels ( vessel - HV and vessel - OV) through the electrolyte as shown in Figure 4.
The energy to start the electrolysis under constant temperature and pressure conditions is determined by the enthalpy change () of the process [17,23,24,25]. Ideally, one fraction of the enthalpy energy is electricity employing the Gibbs energy () and the other fraction is heat (Q), an endothermic reaction, which leads to (1). Thus, the general electrolysis chemical reaction equation is shown in (2) including water in its liquid phase (l), the necessary electrical ( = 237.153 kJ/mol) and thermal ( = 48.687 kJ/mol) energies to break down the water molecule at standard pressure and temperature conditions (1 atm and 298.15K [26]), and the resulting gaseous phase (g) of the Hydrogen and Oxygen separated molecules [17,25].
Based on (1), the equation can be written in terms of voltages, translating the chemical electrolysis process to electricity physics. According to [17,25], dividing both sides of (1) by nF, where n is the number of moles of electrons transferred in the reaction to produce a mole of Hydrogen ( mol) and F is the Farad SI constant (96485 C/mol [25]), it leads to (3), translating the energy equation into the necessary voltages to perform the electrolysis process.
When substituting the appropriate values for and in (3), it is possible to derive the ideal Gibbs voltage = 1.23V, that is the reversible cell potential, the necessary energy related voltage to start the electrolysis reaction. It also leads to the ideal thermoneutral voltage = 1.48V, which is the total reaction enthalpy that must be supplied in the form of electrical energy. The thermoneutral voltage in each electrolyzer cell shouldn’t be greater then 1.48V to avoid heat generation, because above this voltage level the electrolysis process turns to an exothermic reaction [17,25], something unachievable in the real world since the electrolysis process has some inherent lossy mechanisms tough, such as: ohmic phenomena, activation phenomena, and double-layer effect, all of them increasing the cell voltage above the ideal thermoneutral voltage of 1.48V
The electrical equivalent model used in this work to model the AEL behaviour, considering the mentioned lossy mechanisms, was based on the model presented in [17]. The ideal thermoneutral voltage for the cell stack in this work is 118.4V (80 cells times 1.48V), the stack voltage reaches 130V in average due to the loss mechanisms though.
2.2.3. Gas/Liquid Separation (HV and OV Vessels)
The gases produced during the electrolysis inside the cell stack, as previously described in Section 2.2.2, are conducted through the electrolyte to the separator tanks, where they are collected in two separate buffers and taken to the horizontal separator tanks: the Hydrogen vessel (HV), and Oxygen vessel (OV). The and gases are then separated from the liquid electrolyte, which is returned to the electrolyzer via the recirculation pump. The electrolyte level in the horizontal separator tanks must be at the midpoint to ensure good unit performance. The solution levels in the horizontal Hydrogen and Oxygen separator tanks are monitored in the SCADA system to guarantee the process performance. These separation stages are shown in Figure 4.
2.2.4. Heat Exchanger
A chiller is responsible for controlling the water temperature that circulates in the heat exchangers inside the production unit and the compressor stage, which is also monitored.
2.2.5. Purification Process
During this stage, the impurities are removed from the gases produced during the electrolysis process. The Hydrogen goes through an advanced purification and drying stage to remove most impurities, while the Oxygen is released into the atmosphere. The purification unit includes:
- Heater Deoxidant Reactor (HDO): the present in the line reacts with the Hydrogen forming water, which is condensed and subsequently removed.
- Dryers: remove the moisture contained in the .
- Gas analyzers: measure the amount of gas in the line and vice-versa. Gas concentrations must be below safety limits. The ISO 22734-1 standard indicates stopping the process when the concentrations reach values such as 2% in and 1.6% in .
This entire process, represented in Figure 4, allows achieving a high degree of purity in the produced . After purification, the Hydrogen passes to the low-pressure storage step, described below.
2.2.6. Intermediate Buffer
The free of impurities is routed to an intermediate Hydrogen Buffer (HB) to stabilize the system pressure. The HB has a capacity of 700L and operates up to 20 bar of pressure. It is located after the Hydrogen Filter (HF) vertical tank, as shown in Figure 4, where the electrolyte fraction and other impurities are removed from the final gas to be compressed and stored.
2.2.7. Compressor & Storage
When the pressure in the HB reaches 17 bar, the compressor is activated, compressing the in two stages: from 17 bar to 110 bar and, subsequently, from 110 bar to 350 bar. The compressor is deactivated when the pressure in the HB decreases to 14 bar.
The whole produced Hydrogen is then compressed and stored in high-pressure cylinders (350 bar) outside the Hydrogen production building for safety reasons. The energy balance of the plant is also measured in terms of the amount of Hydrogen produced and stored.
2.3. Operating and Maintenance Aspects
One important aspect when operating the Hydrogen production plant is the purge time to complete the startup and shutdown processes to avoid system contamination and safety issues, as already shown in the previous production process sections (especially in Section 2.2.1).
The startup and shutdown purge time usually takes 15 minutes to complete a cleaning cycle over all systems of the production plant and ramp-up (startup) or ramp-down (shutdown) the production power sets, usually between 70% to 100%. If the purge is interrupted in the middle or the electrolyzer suffers a sudden loss of electrical power while generating Hydrogen, safety and/or maintenance issues may arise, affecting the plant’s production time availability and/or damaging important components, which could lead to additional costs and affect the overall system performance/efficiency.
The Hydrogen plant is equipped with a 24V Uninterruptible Power System (UPS) based on lead-acid battery technology with 12Ah of capacity to keep running some of the auxiliaries presented in Figure 2 in case of electrical power loss, such as the emergency circuits (sensors and control valves), auxiliary power supplies, and PLC devices.
Suppose the electrical power from the utility grid is suddenly lost when Hydrogen is being generated. In that case, the system is not able to properly run the shutdown purge process (all auxiliary AC loads are shut down, including the electrolyte circulating pumps, heaters, and fans). As a consequence, the system is contaminated, which leads to maintenance actions. In this case, since the system has a UPS to keep the emergency circuit running, the system is safely shut down, without concerns on overpressure or any other safety-related issue, driving maintenance and longer production stop time though.
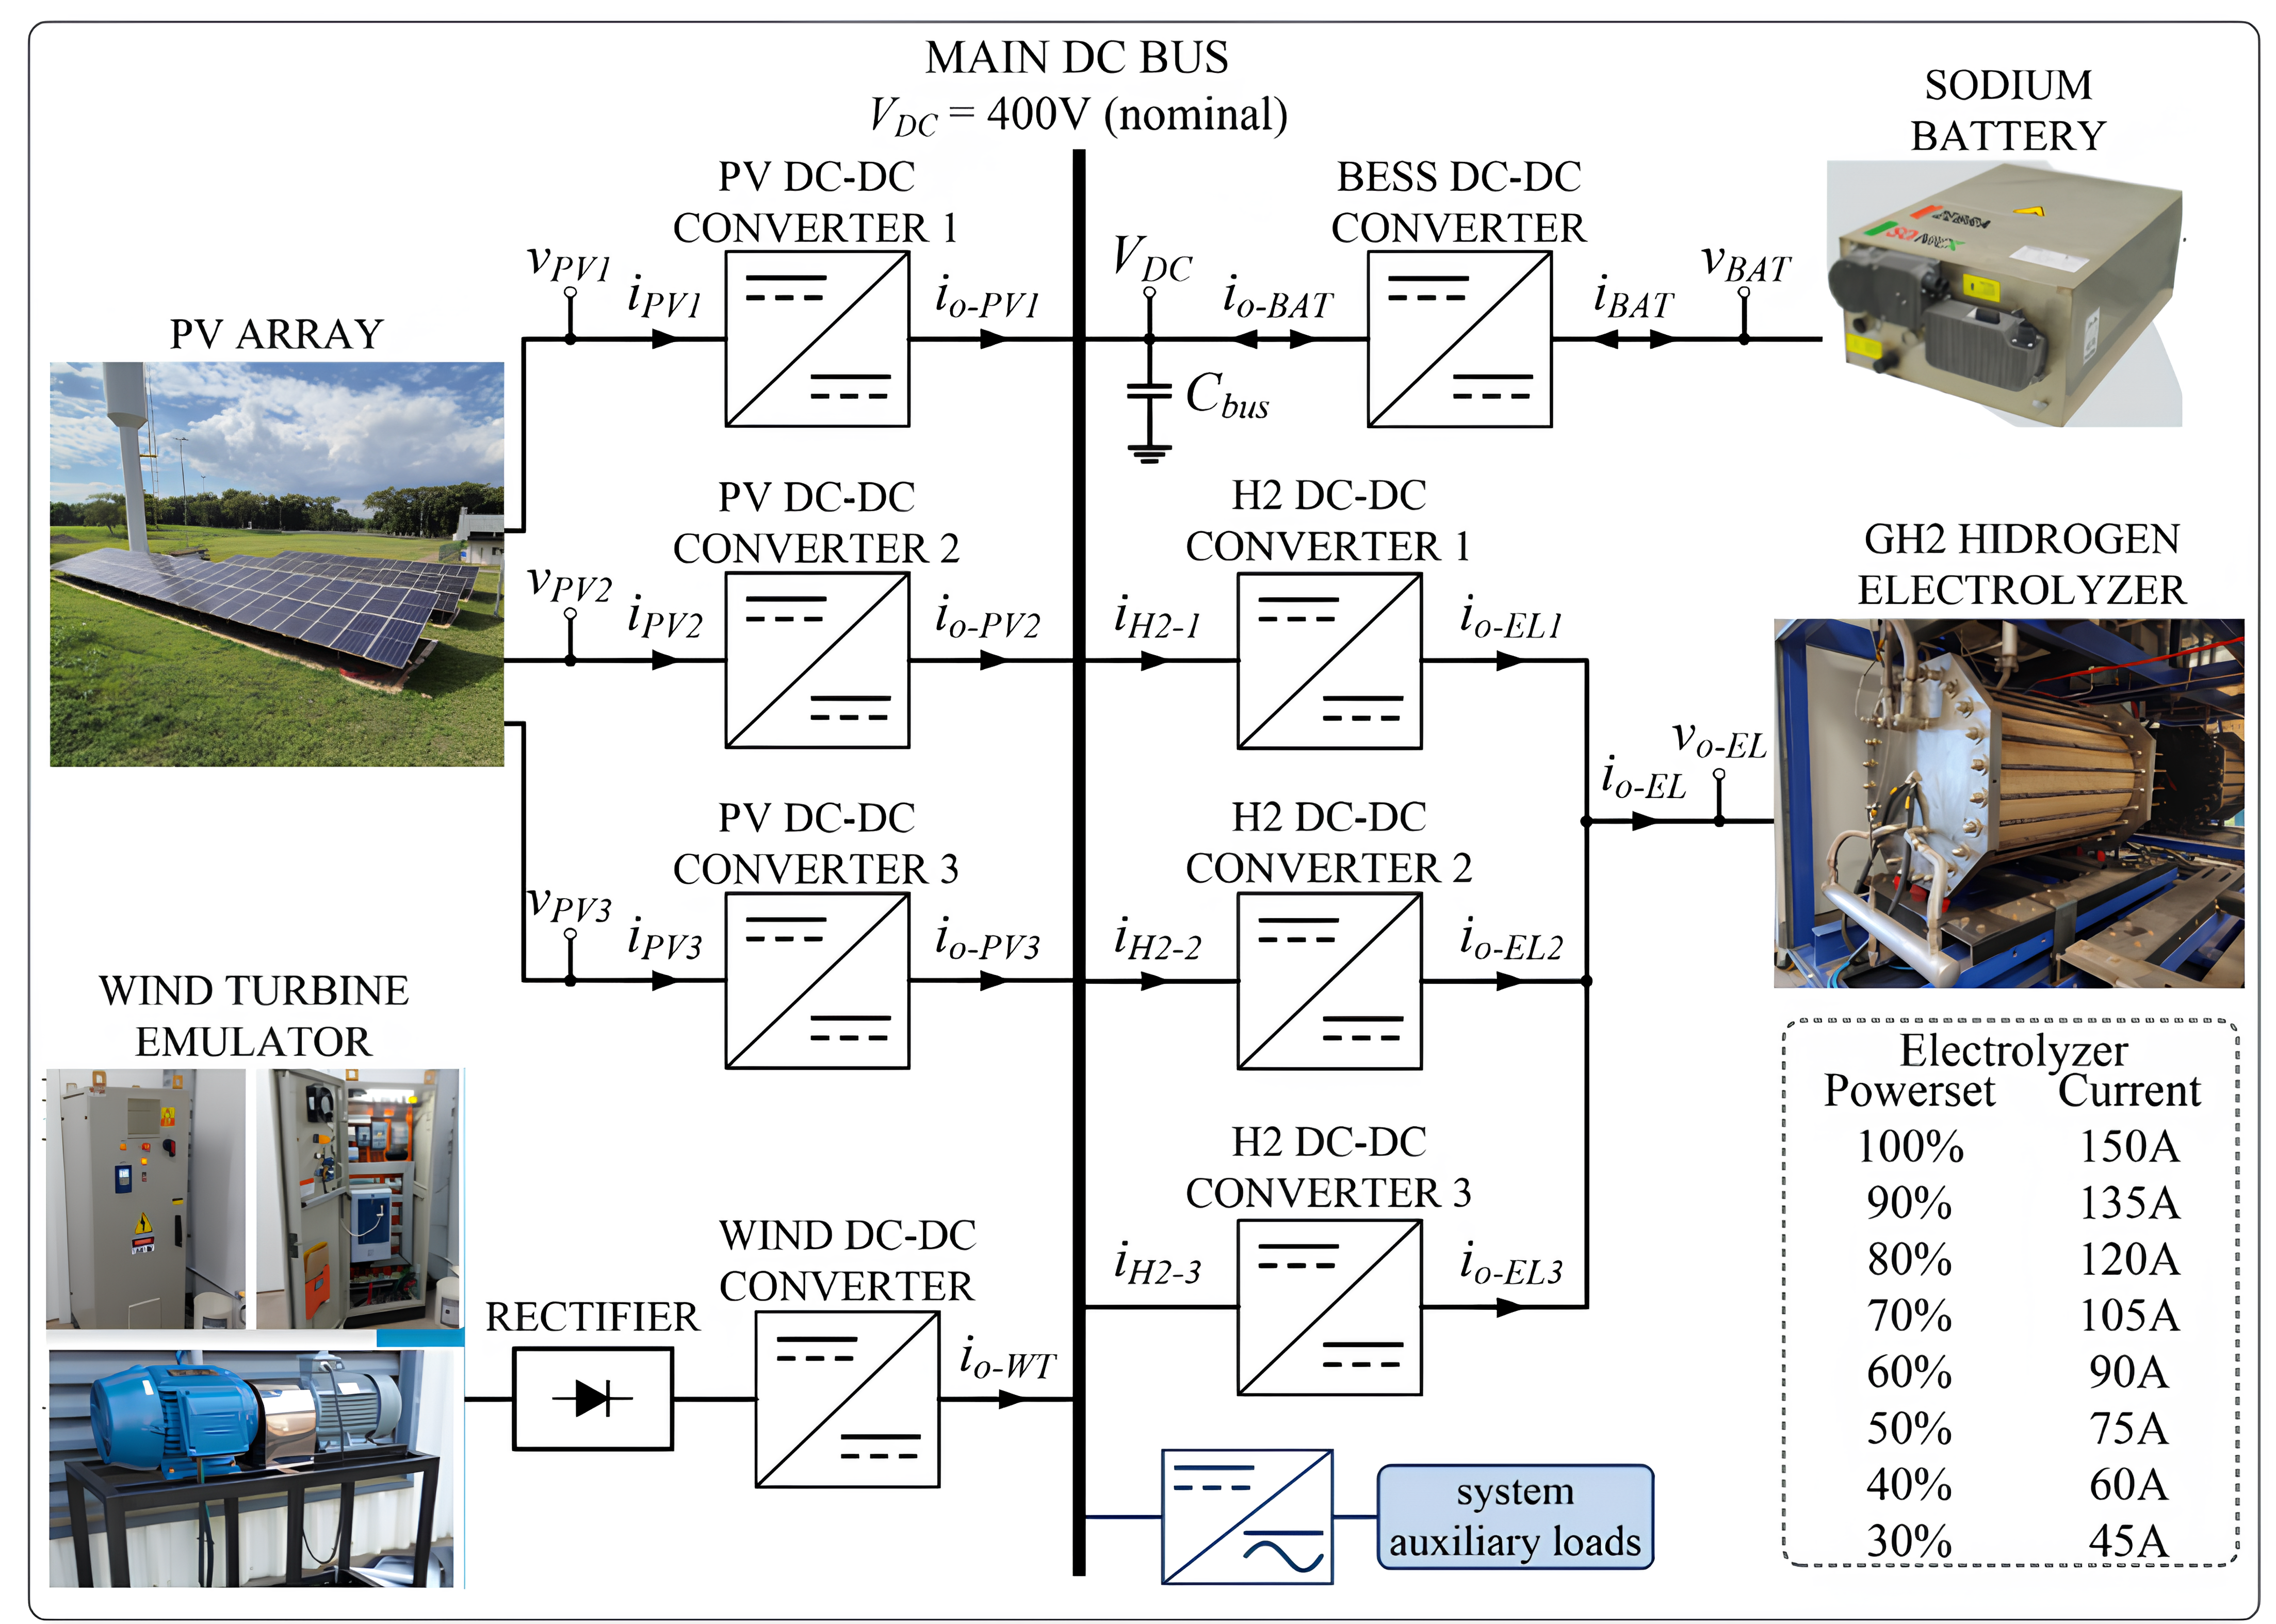
3. Isolated Microgrid Architecture for Production
Considering the legacy electrolyzer operating aspects presented in the previous section, and especially the subSection 2.3, the Figure 5 shows the block diagram of the proposed isolated DC microgrid dedicated to feeding the GH2 plant, with RES and BESS, in substitution to the former/standard thyristor-based rectifier tied to the utility grid (non GH2 production) as shown in Figure 2. This power structure is composed of seven input/output ports, as follows: four current-controlled DC-DC converters fed by RES, three with PV and one with a wind generator; a voltage-controlled DC-DC converter connected to the BESS (main DC bus voltage former); three dedicated current-controlled converters, in interleaving mode, supplying the electrolyzer of the GH2 plant (DC power supply in Figure 4); and one DC-AC converter to supply all the AC and DC auxiliary loads (the DC ones have an input AC/DC conversion stage) presented in Figure 2 and in Figure 4.
One of the key advantages of the proposed microgrid architecture is its ability to maintain power supply to critical loads in the event of an abrupt interruption in energy generation. In such scenarios, the BESS can temporarily supply the electrolyzer and its auxiliary systems, ensuring that they remain powered for the necessary duration to execute a controlled and safe shutdown procedure, as discussed in Section 2.3. This represents a significant improvement over the legacy system, which relied solely on an Uninterruptible Power Supply (UPS) dedicated to the Programmable Logic Controller (PLC). In the previous setup, a utility grid outage would result in the immediate loss of power to all auxiliary loads, often leading to improper shutdown sequences and potential equipment damage or process instability. By contrast, the microgrid’s integrated storage and control enable a more reliable operation, particularly under fault or emergency conditions.
3.1. Microgrid Control Strategy
The objectives behind implementing control in microgrids typically include:
- Power sharing: Ensuring that multiple distributed generation units proportionally share the load.
- Regulation: Maintaining a stable voltage level on the DC bus or managing current from different sources.
- Energy management: Optimizing the use of energy resources and storage.
Control strategies for microgrids are typically divided into local and coordinated levels [27]. Local control, which relies on local measurements, manages individual converters and includes functions such as current, voltage, and droop control; source-dependent functions like Maximum Power Point Tracking (MPPT) for photovoltaic (PV) modules; and decentralized coordination functions like virtual resistance (VR), Distributed Bus Signaling (DBS), or Power Line Signaling (PLS). Coordinated control, which manages the overall operation of the microgrid, requires communication between units and includes decentralized, centralized, and distributed strategies. Decentralized control is an extension of local control using only local measurements, and it includes methods such as droop control and DBS. Centralized control uses a central controller (CC) that gathers data from distributed units, processes it, and sends commands, with master-slave control being a typical example. This approach is useful for optimizing power exchange with the main grid and between microgrids, managing local Distributed Generation (DG), optimizing energy storage, and minimizing operational costs. Distributed control involves communication between neighboring units through digital communication links (DCLs). Consensus and agent-based algorithms are frequently used in distributed control.
In this project, a hierarchical control strategy was implemented, combining local and coordinated control levels. At the local level, each power converter operates with a dedicated control loop based on its function. The electrolyzer port is controlled through an output current control loop to regulate hydrogen production. The BESS port employs dual-loop control: output current control and output voltage control to regulate the common 400 V DC bus, to which all converters are connected. For the PV and wind ports, two operating modes are implemented: output current control mode for direct power regulation, and Maximum Power Point Tracking mode using the Perturb and Observe (P&O) method to maximize energy extraction under varying conditions. In addition to the local control loops, a centralized coordinated control strategy oversees the overall energy balance of the microgrid. This centralized controller monitors the power demand of the electrolyzer and dynamically manages the energy generation from the PV and wind sources, as well as the charge and discharge cycles of the BESS.
3.2. Power Interface for the Electrolyzer Port
The selection of the power converter for feeding the electrolyzer was based on the analysis of various technical criteria. First, the converter must operate with a gain in the range of 0.25 to step down the 400 V input voltage to approximately 100 V. Since the metal parts of the hydrogen production plant are earthed, isolation is required [18]. Modularity and current sharing are desirable characteristics that increase reliability and enable scalability to higher power ratings. Finally, low output current ripple and high conversion efficiency are required to improve the overall hydrogen production efficiency [18,28,29,30]. The basic specifications for the power converter to interface the DC microgrid to the hydrogen electrolyzer are summarized in Table 2.
Among high-frequency isolated DC-DC topologies, the literature highlights Half-Bridge and Full-Bridge topologies [31,32,33]. The Half-Bridge, although simple, presents excessive current stress and lacks redundancy, which may compromise its efficiency and reliability. Between the Full-Bridge topologies, the Phase-Shifted Full-Bridge Zero Voltage Switching (PSFB-ZVS) and the LLC converters arise as the most prominent converters, and were chosen for a more detailed comparison.
The LLC resonant converter, while efficient at its optimal point, operates with variable switching frequency. Although possible [34], this characteristic makes it more difficult to achieve synchronization and current sharing between parallel modules. The converter exhibits ZVS on the primary side and Zero Current Switching (ZCS) on secondary side. However, its efficiency is highly dependent on operating with a specific gain, while the conversion ratio is reported to change considerably during the electrolyzer’s lifetime [33]. Its rectified sinusoidal output current is also a drawback for this application, since it requires a strong filtering effort to achieve a low ripple output current, resulting in large output capacitance [35]. Due to the ZCS on the secondary, this topology doesn’t require any additional circuit to protect the rectifier’s diodes against overvoltages.
On the other hand, the Phase-Shifted Full-Bridge ZVS (PSFB-ZVS) converter with center-tapped transformer was found to be more suitable for the project requirements. This topology operates with fixed switching frequency, facilitating synchronization between parallel modules and the implementation of interleaving. Interleaved operation benefits from reduced output current ripple and higher frequency ripple, both advantageous to increase the hydrogen production efficiency [18,28,29,30] and to reduce the filtering effort of the output stage, making it possible to even eliminate the output capacitor. The center-tapped topology reduce the number of semiconductor devices in the current path on the secondary side, thus reducing the power dissipation. The PSFB is designed to operate with soft switching (ZVS) for a certain load range, reducing switching losses and increasing converter efficiency [35,36]. As a drawback, this topology can suffer from high voltage stresses in the secondary diodes due to the hard switching.
Another important advantage of the PSFB topology is the possibility of employing synchronous rectification on the secondary side of the center-tapped transformer, replacing diodes with MOSFETs or GaNFET, for reduced conduction losses and enhanced efficiency. This technique is considered for future work.
The adopted configuration, presented in Figure 6, includes three PSFB modules operating in interleaving, with an output inductance () that provides the current-source characteristic. The capacitance () is included to prevent the circulation of an average current component through the transformer’s primary winding, avoiding core saturation. This solution is often called in the literature as the Phase-Shifted Full-Bridge Series Resonant Converter [37,38]. In a well-executed project, the resonance frequency of the and circuit must be much lower than the switching frequency; thus, the influence of on the converter operation is minimal, and its operating characteristics follow those of a classic PSFB-ZVS converter [37,38,39].
It was chosen to build three identical 6.5 kW PSFB modules, achieving interleaved operation through a trigger signal between the modules.
3.3. Power Interface for the BESS Port
The selection of the power topology for the BESS port is initiated from the specifications it must meet. The battery employed in this project is a second-life Z37-620-38 battery from FZSoNick [40]. The battery voltage ranges from 414 V to 696 V, and its maximum allowed discharge current is 112 A. Since it’s a second-life battery, it was chosen to limit the current considerably below the original limit, and operate with a minimum voltage of 450 V. Despite that, the battery can comfortably handle the maximum limit of 15 kW defined for this port. The output of the converter is the grid’s common DC bus to which all converters are connected. This DC bus should be regulated by the BESS converter at 400 V with a small deviation during load/source transients. Table 3 summarizes the main specifications for the BESS converter.
Due to its balanced characteristics, the interleaved bidirectional Buck converter arises as one of the main topologies for bidirectional battery chargers in the range of cents of volts and a few tens of kilowatts. It counts with a reduced number of passive and active components, presents lower current efforts than three-level topologies [41,42,43], presents low voltage efforts [44], it is efficient, modular, and does not require the design of complex magnetic components [45,46,47,48,49,50,51]. Figure 7 presents the schematic of the interleaved bidirectional Buck converter. In addition to the main topology, an input filter was added to reduce the battery’s current ripple, and a common-mode filter was added to the output, between the converter and the microgrid common 400V DC bus connection point.
3.4. Power Interface for the PV Port
The specifications for the PV converter are based on the photovoltaic power plant installed at the laboratory facilities where the system will be tested. The PV installation is composed of three individual strings, each connected to a power converter module. Table 4 presents the electrical specifications for the PV power converter, which form the basis for the design of the device.
The review of power topologies for the BESS port shown the advantages of the Buck converter for the power ratings of this project. Unlike the BESS port, the PV input port required a converter with the capacity to step up and step down the input voltage. The two-switch non-inverter Buck-Boost with two-carrier modulation is presented as a high-efficiency converter capable of meeting the project requirements [52]. This converter, presented in Figure 8, employs 2 active switches and 2 diodes. This modulation has significant advantages over a conventional Buck-Boost converter, since it reduces the current and voltage efforts in all components.
3.5. Power Interface for the Wind Port
The wind port of the microgrid is designed to interface with small wind turbines, which are commonly used in distributed renewable energy systems. The specifications of a commercial small wind turbine were the basis for defining the input specifications of the wind power converter. To enable laboratory testing under controlled and repeatable conditions, a wind turbine emulator was constructed. This emulator consists of an electric motor mechanically coupled to a generator, allowing the emulation of the dynamic behavior of a real wind turbine during various operating scenarios. Table 5 summarizes the specifications of the PV power converter.
The wind port requires processing the variable-frequency AC power generated by the wind turbine, based on a permanent magnet generator, and delivering a regulated DC output current to the microgrid. Although the literature presents a variety of power conversion topologies for wind energy systems [53,54], these are predominantly boost-type converters, which do not apply to this project, since the input voltage can be higher than the output voltage. A two-stage topology was adopted. The first stage consists of a three-phase Graetz rectifier followed by a capacitive filter, responsible for converting the generator’s AC output into an unregulated DC voltage. The second stage is a two-phase interleaved two-switch non-inverter Buck-Boost converter [52]- same topology used in the PV port—selected for its capacity to both step up and step down the input voltage, depending on wind conditions. Figure 9 presents the schematic of the power topologies employed for the wind port.
4. Experimental Results
This section presents the main experimental results obtained from the tests with both hydrogen plants, one powered by the thyristor-based six-pulse rectifier (Figure 2) and the other by the proposed DC microgrid (Figure 5).
Figure 10 shows the output voltage and current waveforms of the legacy electrolyzer thyristor-based rectifier, to feed the electrolyzer cell stack. The electrical grid frequency is 60 Hz, while the output voltage/current ripple frequency is 360 Hz due to the six-pulse thyristor-based rectifier. When the grid voltage is higher than the load voltage, there is a transfer of energy from the grid to the electrolyzer, so there is a current flow and the voltage follows the current behavior. However, when the grid voltage is lower than the load, there is no current and the voltage is floating. This test was conducted in 70% of powerset, with total active power of 15.89 kW and apparent power of 19.62 kVA, resulting in a power factor of approximately 0.8. The active power is the energy actually used for hydrogen generation. As can be seen, there is a significant ripple factor in the current and AC oscillations. These characteristics affect the system operation and degrade the electrolytic cells, resulting in a low efficiency of the electrolyzer and consequently a decrease in hydrogen production.
On the other hand, in the Figure 11 are shown the voltage and current waveforms of the electrolyzer ( and ), when powered by the DC microgrid. This test was performed at 80% of the powerset, resulting in total active power () close to 15.77 kW. As expected, the electrolyzer is powered by a DC current with low ripple, and free from AC oscillations. This figure also shows the currents and , injected by the wind and BESS DC-DC converters, respectively, into the main DC bus. Complementarily, the Figure 12 and Figure 13 show other electrical quantities of the DC microgrid for 70% and 60% of full powerset, respectively.
Table 6 summarizes the values of voltage, current and active power consumed by the electrolyzer, for the results shown in the Figure 10, Figure 11, Figure 12 and Figure 13. As expected, there is a significant reduction in the active power consumed by the electrolyzer when powered by the DC microgrid, for example, reduction of approximately 18% for operation in 70% of full powerset.
The experimental results for the DC microgrid initialization are shown in the Figure 14 to Figure 17. Initially, the battery converter start with a soft ramp until reaching the nominal voltage of the central DC bus ( = 400V), as shown in the Figure 14. After initializing the BESS converter, the wind converter was started in constant current mode ( = 5A) and, in the sequence, the three PV converters was started also in constant current mode ( = 1.2A) as shown in the Figure 15. Once the electrolyzer is turned off, all the energy produced by the RES sources is absorbed by the BESS (negative indicates battery energy consumption). With the microgrid supply converters connected (wind and photovoltaic sources), the three GH2 converters were simultaneously activated, as shown in Figure 16, with control in constant current mode, and with an increase of 5 A in the value of the DC output current of each converter. It can be seen that when exceeds 30 A, the direction of the current is reversed. In this case, the SAE supplies energy to the microgrid, together with wind and photovoltaic sources, to power the electrolyzer. With all converters turned-on, the current was increased up to 90% of the power set (135 A). Simultaneously, as shown in Figure 17. Simultaneously with these tests, increases were made to the powers extracted from the wind and photovoltaic sources, according to the values of and indicated in the figures. The results presented prove that the converters of the proposed DC microgrid adequately extract energy from wind and photovoltaic sources, regulate the voltage of the central DC bus, process the energy globally and store/supply the energy in/by the SAE. In addition, the system simultaneously supplies appropriate DC current to the electrolyzer of the GH2 plant.
Figure 18 shows the case in which there is power generation from both RES (PV and Wind), the battery bank is partially charged, and the GH2 plant turned off. Thus, all the energy produced is stored in the battery bank. For this test, PV generation were configured with = = = 1.2 A, close to 3.6A of current injected by the PV converters ( = 1.4 kW), and wind generation with = 5.3 A ( = 2.1 kW). It can be observed that the BESS converter imposes the DC voltage on the main bus ( = 400 V) even with the energy injection by the RES. Moreover, since the GH2 plant is turned off, all the produced energy is absorbed by the BESS converter ( = 9 A) and sent to the battery bank. This test shows the system capability to manage all energy produced by RES. It is worth noting that the maximum power levels to be extracted from PV and Wind sources are directly linked to the consumption of the GH2 plant, as well as to the momentary storage capacity of the battery bank. Therefore, if there is a momentary surplus of energy, a deviation from the maximum power point of these sources must be made.
Author Contributions
Conceptualization, R.J., F.T., L.C., G.P., L.M., and F.O.; methodology, R.J., F.T., L.C., G.P., L.M., and F.O.; software, R.J., F.T., L.C., G.P., L.M., and F.O.; validation, R.J., F.T., L.C., G.P., A.Q., C.J., L.M., and F.O.; formal analysis, R.J., F.T., L.C., G.P., L.M., and F.O.; investigation, R.J., F.T., L.C., G.P., L.M., and F.O.; resources, R.J., F.T., L.C., G.P., A.Q., C.J., L.M., and F.O.; data curation, F.T., G.P., A.Q., C.J., L.M., and F.O.; writing—original draft preparation, R.J., F.T., L.C., G.P., and F.O.; writing—review and editing, R.J., F.T., L.C., G.P., and F.O.; visualization, R.J., F.T., L.C., G.P., and F.O.; supervision, T.J. and J.V.; project administration, T.J., L.M., F.O., and J.V.; funding acquisition, T.J. and J.V. All authors have read and agreed to the published version of the manuscript.
Funding
This paper is the result of activities carried out under the R&D project of the ANEEL program No. PD-10381-0221/2021, entitled "Multiport DC-DC Converter and IoT System for Intelligent Energy Management", which was conducted in partnership with CTG-Brazil.
Abbreviations
The following abbreviations are used in this manuscript:
| RES | Renewable Energy Sources |
| GH2 | Green Hydrogen |
| TRLs | Technology Readiness Levels |
| AC | Alternating Current |
| DC | Direct Current |
| PLC | Programmable Logic Controller |
| SCADA | Supervisory Control and Data Acquisition |
| AEL | Alkaline Water Electrolysis |
| UPS | Uninterruptible Power System |
| BESS | Battery Energy Storage System |
| PV | Photovoltaic |
| WT | Wind Turbine |
| EL | Electrolyzer |
| BAT | Battery |
References
- Cader, J.; Koneczna, R.; Olczak, P. The Impact of Economic, Energy, and Environmental Factors on the Development of the Hydrogen Economy. Energies 2021, 14. [Google Scholar] [CrossRef]
- Emonts, B.; Müller, M.; Hehemann, M.; Janßen, H.; Keller, R.; Stähler, M.; Stähler, A.; Hagenmeyer, V.; Dittmeyer, R.; Pfeifer, P.; et al. A Holistic Consideration of Megawatt Electrolysis as a Key Component of Sector Coupling. Energies 2022, 15. [Google Scholar] [CrossRef]
- Nayebossadri, S.; Walsh, M.; Smailes, M. An Overview of the Green Hydrogen Value Chain Technologies and Their Challenges for a Net-Zero Future. Hydrogen 2025, 6. [Google Scholar] [CrossRef]
- Franco, A. Green Hydrogen and the Energy Transition: Hopes, Challenges, and Realistic Opportunities. Hydrogen 2025, 6. [Google Scholar] [CrossRef]
- Elegbeleye, I.; Oguntona, O.; Elegbeleye, F. Green Hydrogen: Pathway to Net Zero Green House Gas Emission and Global Climate Change Mitigation. Hydrogen 2025, 6. [Google Scholar] [CrossRef]
- Roucham, B.; Zaghdoud, O. Mapping Green Hydrogen and Renewable Energy Research in Extended BRICS (Brazil, Russia, India, China, South Africa and Others): A Bibliometric Approach with a Future Agenda. Hydrogen 2025, 6. [Google Scholar] [CrossRef]
- Patil, R.R.; Calay, R.K.; Mustafa, M.Y.; Thakur, S. Artificial Intelligence-Driven Innovations in Hydrogen Safety. Hydrogen 2024, 5, 312–326. [Google Scholar] [CrossRef]
- Barbosa, L.T.; Vasconcelos, S.D.; Rosas, P.A.C.; Castro, J.F.C.; Barbosa, D.C.P. Assessment of Green Hydrogen as Energy Supply Alternative for Isolated Power Systems and Microgrids. Energies 2024, 17. [Google Scholar] [CrossRef]
- Quintos Fuentes, J.E.; Santos, D.M.F. Technical and Economic Viability of Underground Hydrogen Storage. Hydrogen 2023, 4, 975–1000. [Google Scholar] [CrossRef]
- Sun, Y.Q. Explosions of Hydrogen Storages and the Safety Considerations in Hydrogen-Powered Railway Applications—A Review. Hydrogen 2024, 5, 901–918. [Google Scholar] [CrossRef]
- Kazemi, M.; Brennan, S.; Molkov, V. Hydrogen Safety by Design: Exclusion of Flame Blow-Out from a TPRD. Hydrogen 2024, 5, 280–292. [Google Scholar] [CrossRef]
- Franco, A.; Carcasci, C.; Ademollo, A.; Calabrese, M.; Giovannini, C. Integrated Plant Design for Green Hydrogen Production and Power Generation in Photovoltaic Systems: Balancing Electrolyzer Sizing and Storage. Hydrogen 2025, 6. [Google Scholar] [CrossRef]
- Wang, W.; Qi, Y.; Zhang, X.; Xie, P.; Guo, Y.; Sun, H. Carbon Emission Optimization of the Integrated Energy System in Industrial Parks with Hydrogen Production from Complementary Wind and Solar Systems. Hydrogen 2025, 6. [Google Scholar] [CrossRef]
- Ali, D.; Stewart, C.; Qadir, K.; Jalisi, I. Design and Optimal Sizing of a Hydrogen Uninterruptable Power Supply (UPS) System for Addressing Residential Power Cutoffs. Hydrogen 2025, 6. [Google Scholar] [CrossRef]
- Li, K.; Zhang, H.; Zheng, X.; Liu, C.; Chen, Q. Hydrogen Production by Water Electrolysis with Low Power and High Efficiency Based on Pre-Magnetic Polarization. Energies 2022, 15. [Google Scholar] [CrossRef]
- Zhong, Z.; Fang, J.; Hu, K.; Huang, D.; Ai, X.; Yang, X.; Wen, J.; Pan, Y.; Cheng, S. Power-to-Hydrogen by Electrolysis in Carbon Neutrality: Technology Overview and Future Development. CSEE Journal of Power and Energy Systems 2023, 9, 1266–1283. [Google Scholar] [CrossRef]
- Ursúa, A.; Sanchis, P. Static–dynamic modelling of the electrical behaviour of a commercial advanced alkaline water electrolyser. International Journal of Hydrogen Energy 2012, 37, 18598–18614, International Workshop on Molten Carbonates & Related Topics. [Google Scholar] [CrossRef]
- Ursúa, A.; Sanchis, P.; Marroyo, L. Chapter 14 - Electric Conditioning and Efficiency of Hydrogen Production Systems and Their Integration with Renewable Energies. In Renewable Hydrogen Technologies; Gandía, L.M., Arzamendi, G., Diéguez, P.M., Eds.; Elsevier: Amsterdam, 2013; pp. 333–360. [Google Scholar] [CrossRef]
- Koponen, J.; Ruuskanen, V.; Kosonen, A.; Niemelä, M.; Ahola, J. Effect of Converter Topology on the Specific Energy Consumption of Alkaline Water Electrolyzers. IEEE Transactions on Power Electronics 2019, 34, 6171–6182. [Google Scholar] [CrossRef]
- Chen, M.; Chou, S.F.; Blaabjerg, F.; Davari, P. Overview of Power Electronic Converter Topologies Enabling Large-Scale Hydrogen Production via Water Electrolysis. Applied Sciences 2022, 12. [Google Scholar] [CrossRef]
- Slater-Thompson, N.; Johnson, S. The world’s nine largest operating power plants are hydroelectric facilities. Technical report, U.S. Energy Information Administration, 2016.
- Lu, M. These are the world’s largest hydroelectric dams. Technical report, World Economic Forum, 2022.
- LeRoy, R.L.; Bowen, C.T.; LeRoy, D.J. The Thermodynamics of Aqueous Water Electrolysis. Journal of The Electrochemical Society 1980, 127, 1954. [Google Scholar] [CrossRef]
- Balej, J. Water vapour partial pressures and water activities in potassium and sodium hydroxide solutions over wide concentration and temperature ranges. International Journal of Hydrogen Energy 1985, 10, 233–243. [Google Scholar] [CrossRef]
- Carmo, M.; Stolten, D. Chapter 4 - Energy Storage Using Hydrogen Produced From Excess Renewable Electricity: Power to Hydrogen. In Science and Engineering of Hydrogen-Based Energy Technologies; de Miranda, P.E.V., Ed.; Academic Press, 2019; pp. 165–199. [CrossRef]
- Keenan, J. Steam Tables, SI Version: Thermodynamic Properties of Water Including Vapor, Liquid, and Solid Phases; A Wiley-Interscience publication, Wiley, 1978.
- Dragičević, T.; Lu, X.; Vasquez, J.C.; Guerrero, J.M. DC Microgrids—Part I: A Review of Control Strategies and Stabilization Techniques. IEEE Transactions on Power Electronics 2016, 31, 4876–4891. [Google Scholar] [CrossRef]
- Ursúa, A.; Marroyo, L.; Gubía, E.; Gandía, L.M.; Diéguez, P.M.; Sanchis, P. Influence of the Power Supply on the Energy Efficiency of an Alkaline Water Electrolyser. International Journal of Hydrogen Energy 2009, 34, 3221–3233. [Google Scholar] [CrossRef]
- Ursúa, A.; San Martín, I.; Sanchis, P. Design of a Programmable Power Supply to Study the Performance of an Alkaline Electrolyser under Different Operating Conditions. In Proceedings of the 2012 IEEE International Energy Conference and Exhibition (ENERGYCON); 2012; pp. 259–264. [Google Scholar] [CrossRef]
- Koponen, J.; Ruuskanen, V.; Kosonen, A.; Niemela, M.; Ahola, J. Effect of Converter Topology on the Specific Energy Consumption of Alkaline Water Electrolyzers. IEEE Transactions on Power Electronics 2019, 34, 6171–6182. [Google Scholar] [CrossRef]
- Guilbert, D.; Collura, S.; Scipioni, A. DC/DC converter topologies for electrolyzers: State-of-the-art and remaining key issues. International Journal of Hydrogen Energy 2017, 42. [Google Scholar] [CrossRef]
- Williamson, S.S.; Rathore, A.K.; Musavi, F. Industrial Electronics for Electric Transportation: Current State-of-the-Art and Future Challenges. IEEE Transactions on Industrial Electronics 2015, 62, 3021–3032. [Google Scholar] [CrossRef]
- Chen, M.; Chou, S.F.; Blaabjerg, F.; Davari, P. Overview of Power Electronic Converter Topologies Enabling Large-Scale Hydrogen Production via Water Electrolysis. Applied Sciences 2022, 12, 1906. [Google Scholar] [CrossRef]
- Shah, S.S.; Rastogi, S.K.; Bhattacharya, S. Paralleling of LLC Resonant Converters. IEEE Transactions on Power Electronics 2021, 36, 6276–6287. [Google Scholar] [CrossRef]
- Gilmor, C. Phase shifted full bridge (PSFB) vs. full bridge LLC (FB-LLC) for high power DC/DC conversion, 2018.
- Barbi, I.; Pöttker, F. Soft commutation isolated DC-DC converters; Vol. 1, Springer, 2019.
- Yazdani, M.R.; Farzanehfard, M. Evaluation and Comparison of Conducted EMI in Three Full-Bridge DC-DC Switching Converters. In Proceedings of the 2019 10th International Power Electronics, Drive Systems and Technologies Conference (PEDSTC); 2019; pp. 439–444. [Google Scholar] [CrossRef]
- Lenke, R.U.; Hu, J.; De Doncker, R.W. Unified Steady-State Description of Phase-Shift-Controlled ZVS-operated Series-Resonant and Non-Resonant Single-Active-Bridge Converters. In Proceedings of the 2009 IEEE Energy Conversion Congress and Exposition, 2009, pp. 796–803. [CrossRef]
- Rospirski, A.; Zancanaro, L.G.; Mai, L.S.; De Oliveira, F.M.; Da Silva, R.L.; Carneiro, F.T.; Hernández, S.G.; Rigo, C.A.; Jahn, T.G.; De Araujo, P.G. Enhanced Three-Phase Interleaving Phase-Shifted Full Bridge Converter with Active Clamp Using GaNFET for Green Hydrogen Production. In Proceedings of the 2023 IEEE 8th Southern Power Electronics Conference (SPEC), Florianopolis, Brazil, 2023; pp. 1–6. [CrossRef]
- Fzsonick. Z Range Z37, 2017.
- Hao, Z.; Jing-hua, Z.; Bing, H.; Chao-nan, T. A New Interleaved Three-Level Boost Converter and Neutral-Point Potential Balancing. In Proceedings of the 2013 2nd International Symposium on Instrumentation and Measurement, Sensor Network and Automation (IMSNA); 2013; pp. 1093–1096. [Google Scholar] [CrossRef]
- Dusmez, S.; Hasanzadeh, A.; Khaligh, A. Comparative Analysis of Bidirectional Three-Level DC–DC Converter for Automotive Applications. IEEE Transactions on Industrial Electronics 2015, 62, 3305–3315. [Google Scholar] [CrossRef]
- Dusmez, S.; Hasanzadeh, A.; Khaligh, A. Loss Analysis of Non-Isolated Bidirectional DC/DC Converters for Hybrid Energy Storage System in EVs. In Proceedings of the 2014 IEEE 23rd International Symposium on Industrial Electronics (ISIE); 2014; pp. 543–549. [Google Scholar] [CrossRef]
- de Sá, M.V.D.; Andersen, R.L. Dynamic Modeling and Design of a Cúk Converter Applied to Energy Storage Systems. In Proceedings of the 2015 IEEE 13th Brazilian Power Electronics Conference and 1st Southern Power Electronics Conference (COBEP/SPEC); 2015; pp. 1–6. [Google Scholar] [CrossRef]
- Fahem, K.; Chariag, D.E.; Sbita, L. On-Board Bidirectional Battery Chargers Topologies for Plug-in Hybrid Electric Vehicles. In Proceedings of the 2017 International Conference on Green Energy Conversion Systems (GECS); 2017; pp. 1–6. [Google Scholar] [CrossRef]
- Yilmaz, M.; Krein, P.T. Review of Battery Charger Topologies, Charging Power Levels, and Infrastructure for Plug-In Electric and Hybrid Vehicles. IEEE Transactions on Power Electronics 2013, 28, 2151–2169. [Google Scholar] [CrossRef]
- Gorji, S.A.; Sahebi, H.G.; Ektesabi, M.; Rad, A.B. Topologies and Control Schemes of Bidirectional DC–DC Power Converters: An Overview. IEEE Access 2019, 7, 117997–118019. [Google Scholar] [CrossRef]
- Bascope, G.; Barbi, I. Generation of a Family of Non-Isolated DC-DC PWM Converters Using New Three-State Switching Cells. In Proceedings of the 2000 IEEE 31st Annual Power Electronics Specialists Conference. Conference Proceedings (Cat. No.00CH37018), 2000, Vol. 2, pp. 858–863 vol.2. [CrossRef]
- Kwon, M.; Oh, S.; Choi, S. High Gain Soft-Switching Bidirectional DC–DC Converter for Eco-Friendly Vehicles. IEEE Transactions on Power Electronics 2014, 29, 1659–1666. [Google Scholar] [CrossRef]
- Peraça, M.T. Conversores Utilizando Células de Comutação de Quatro Estados. PhD thesis, Universidade Federal de Santa Catarina, Florianópolis, 2008.
- Tofoli, F.L.; Tavares, D.d.A.; Saldanha, J.I.d.A. Survey on Topologies Based on the Three-State and Multi-State Switching Cells. IET Power Electronics 2019, 12, 967–982. [Google Scholar] [CrossRef]
- Martins Junior, J. Power Equalization of Parallel Converters Via Droop Control for Battery Charging. Dissertação (Mestrado Acadêmico em Engenharia Elétrica), Universidade Federal de Santa Catarina, Florianópolis, 2020.
- Chen, Z.; Guerrero, J.M.; Blaabjerg, F. A Review of the State of the Art of Power Electronics for Wind Turbines. IEEE Transactions on Power Electronics 2009, 24, 1859–1875. [Google Scholar] [CrossRef]
- Blaabjerg, F.; Liserre, M.; Ma, K. Power Electronics Converters for Wind Turbine Systems. IEEE Transactions on Industry Applications 2012, 48, 708–719. [Google Scholar] [CrossRef]
Figure 1.
Hydrogen facility dedicated to industrial-scale experimental stations for the entire hydrogen technology value chain.
Figure 1.
Hydrogen facility dedicated to industrial-scale experimental stations for the entire hydrogen technology value chain.
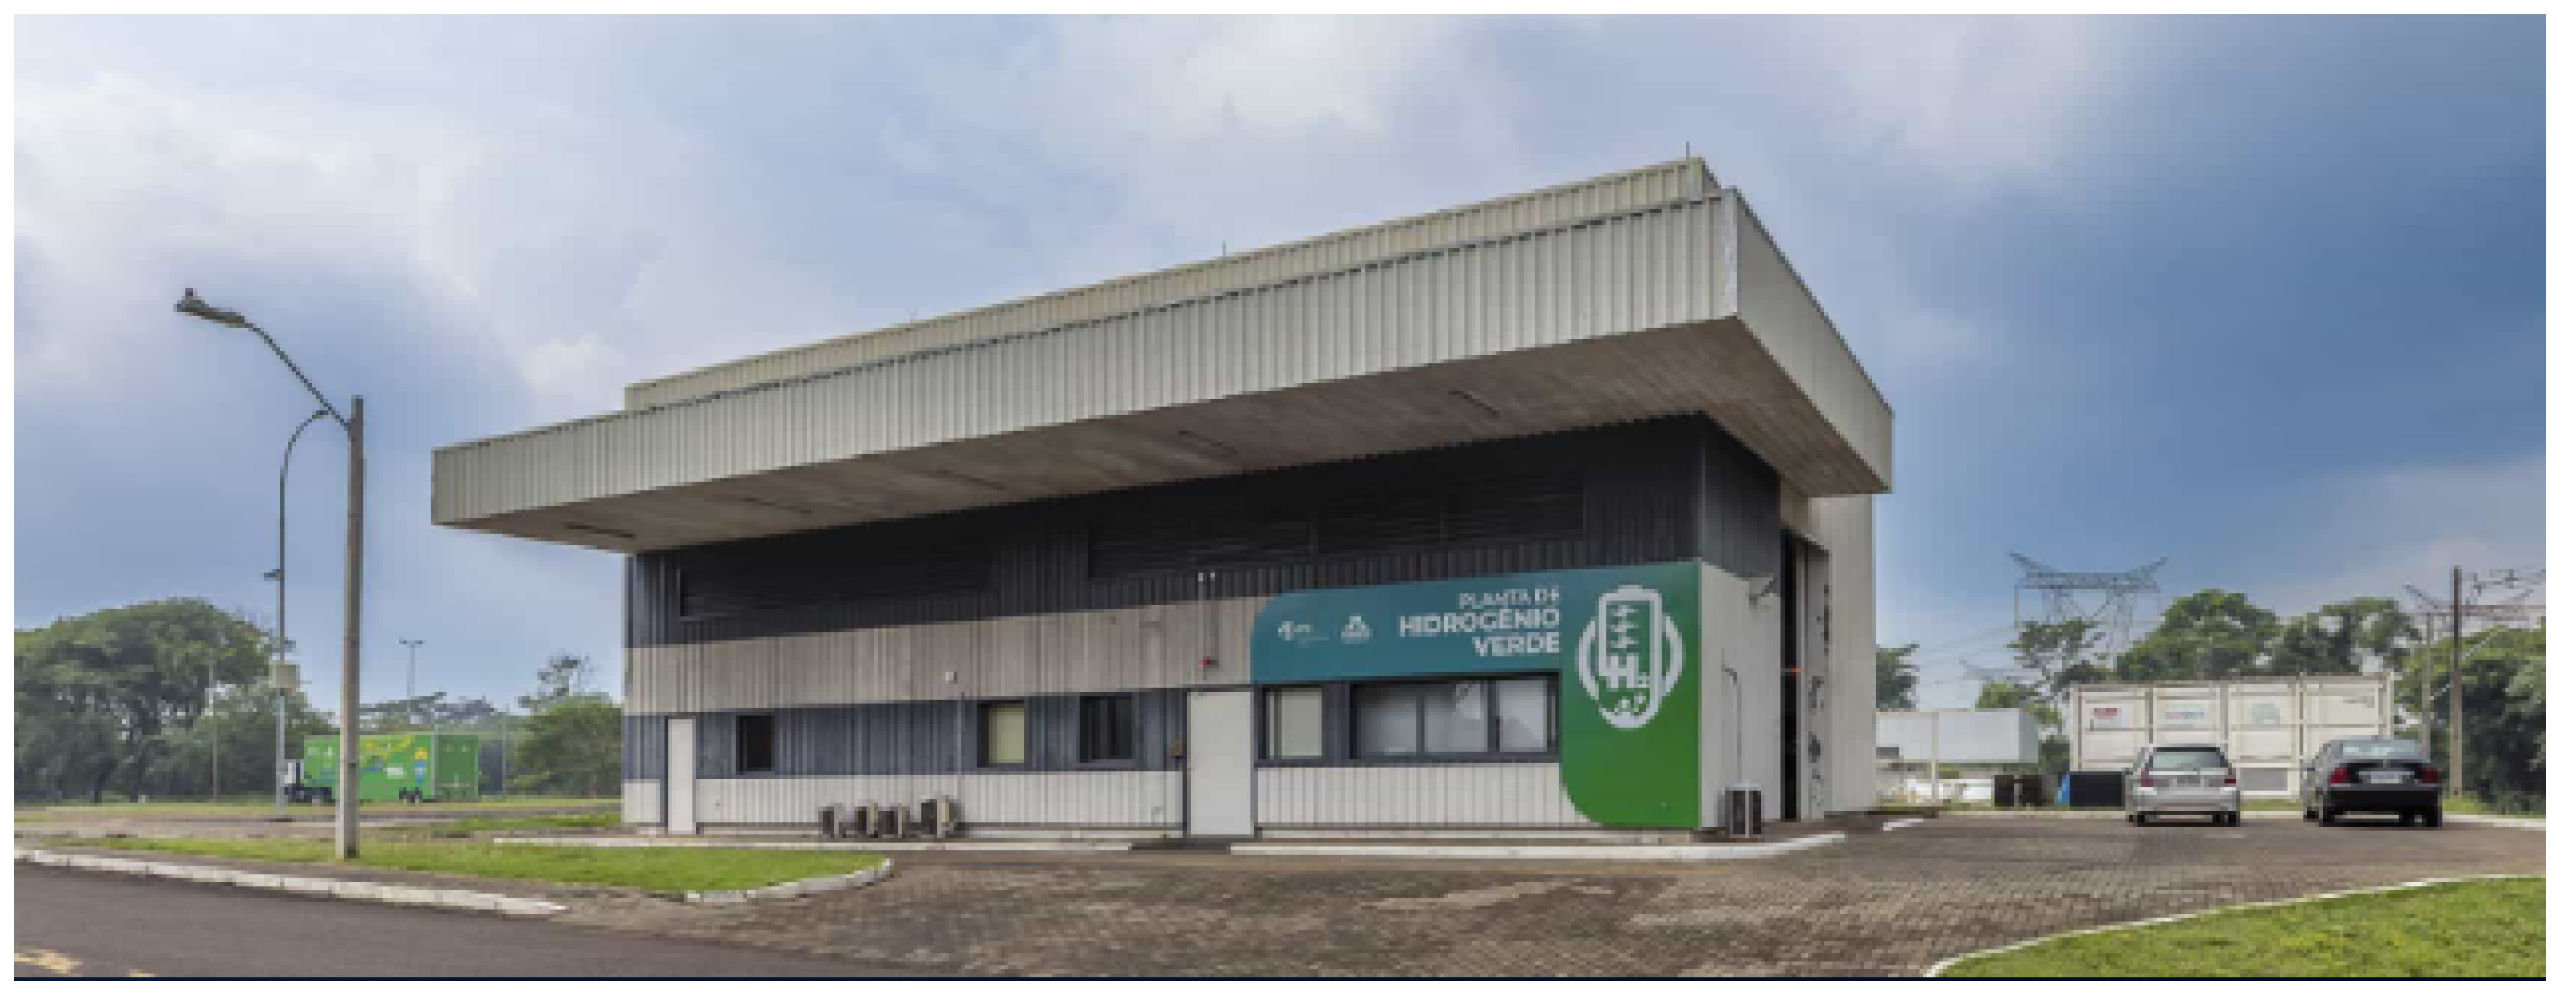
Figure 2.
Legacy electrical power system of the H2 Nitidor AEL electrolyzer plant. Two thyristor-based six-pulse rectifiers provide the DC voltage for each cell stack. The auxiliary loads, such as Pumps, Fans, Heaters, Electrovalves, Light AC fans, DC loads (with dedicated AC/DC rectifier), are fed with line-to-neutral voltages employing their dedicated load controller (contactor or relay). The DC loads are comprised of sensors ( leakage, Pressure, Flow, Temperature, Voltage, Current, Hall effect, etc), Modem for communications, Displays (Human Machine Interface), Protective devices, Emergency circuits, Programmable Logic Controller (PLC) for process control, and Power Supplies (24V/+15V/-15V).
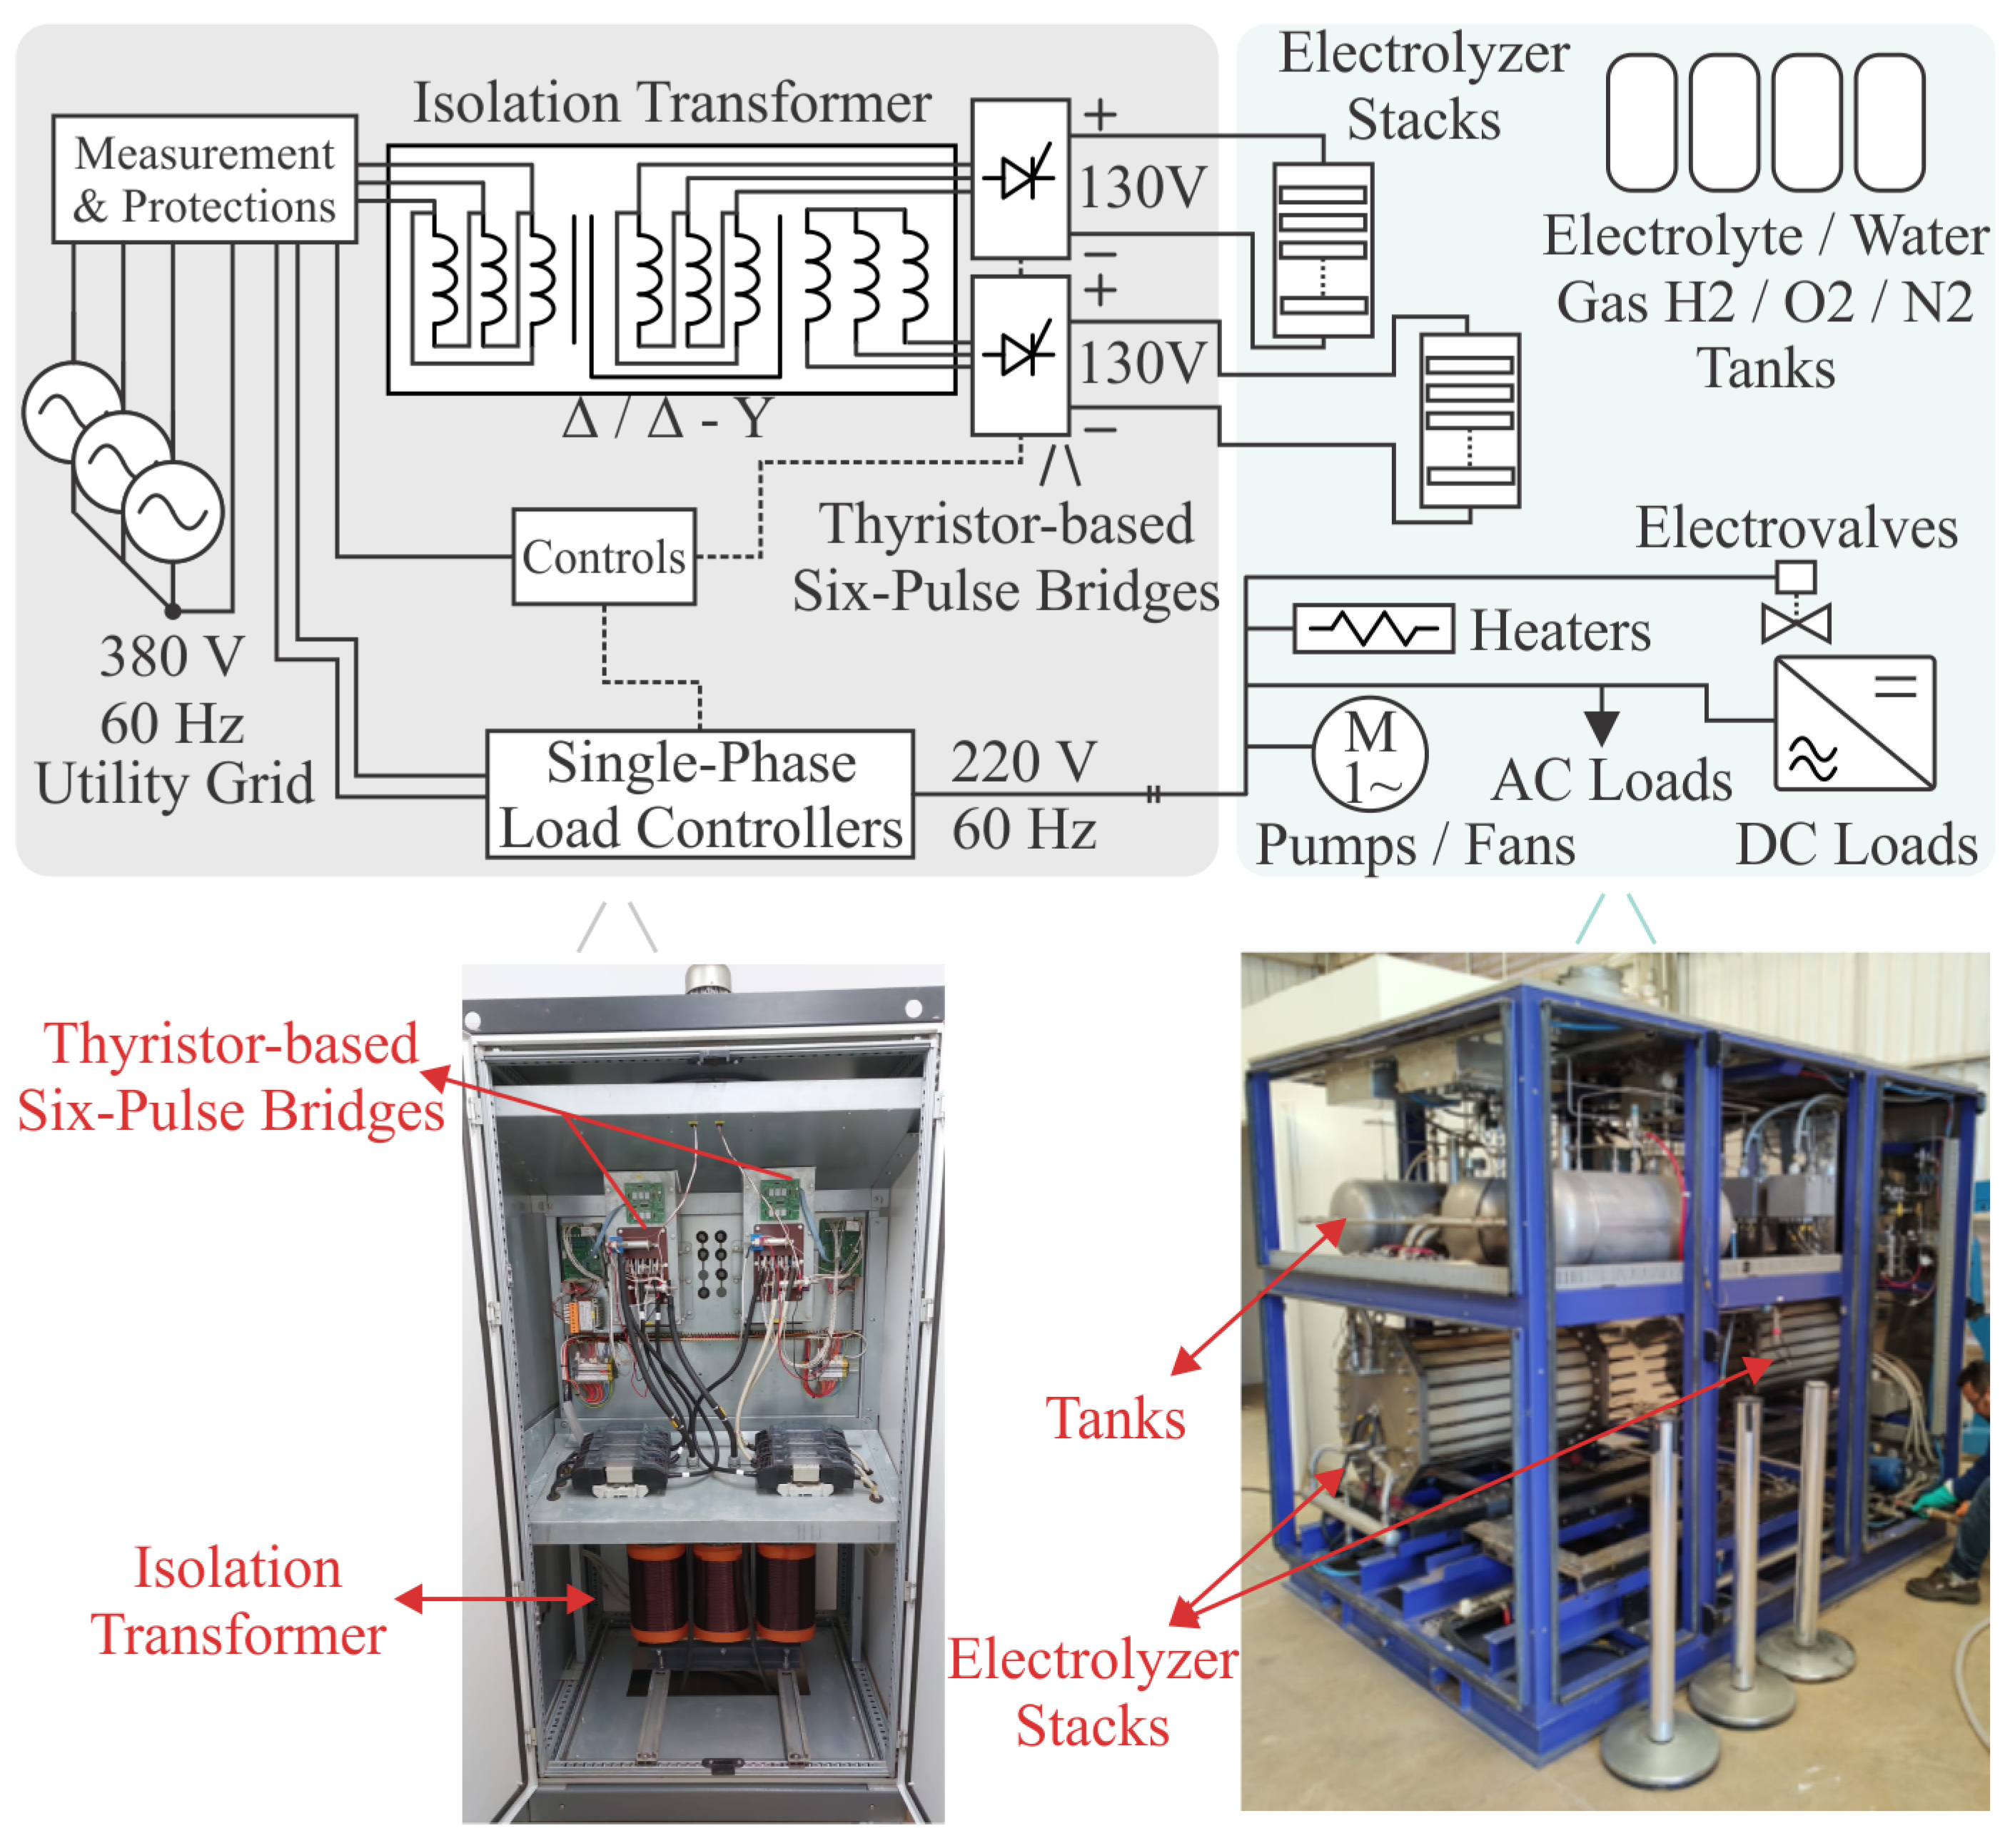
Figure 3.
Electrolyzer cell stack comprised of 80 AEL cells. The mechanical support/electric isolators can be seen in red at the bottom of the cell stack, separating it from the metal frame.
Figure 3.
Electrolyzer cell stack comprised of 80 AEL cells. The mechanical support/electric isolators can be seen in red at the bottom of the cell stack, separating it from the metal frame.
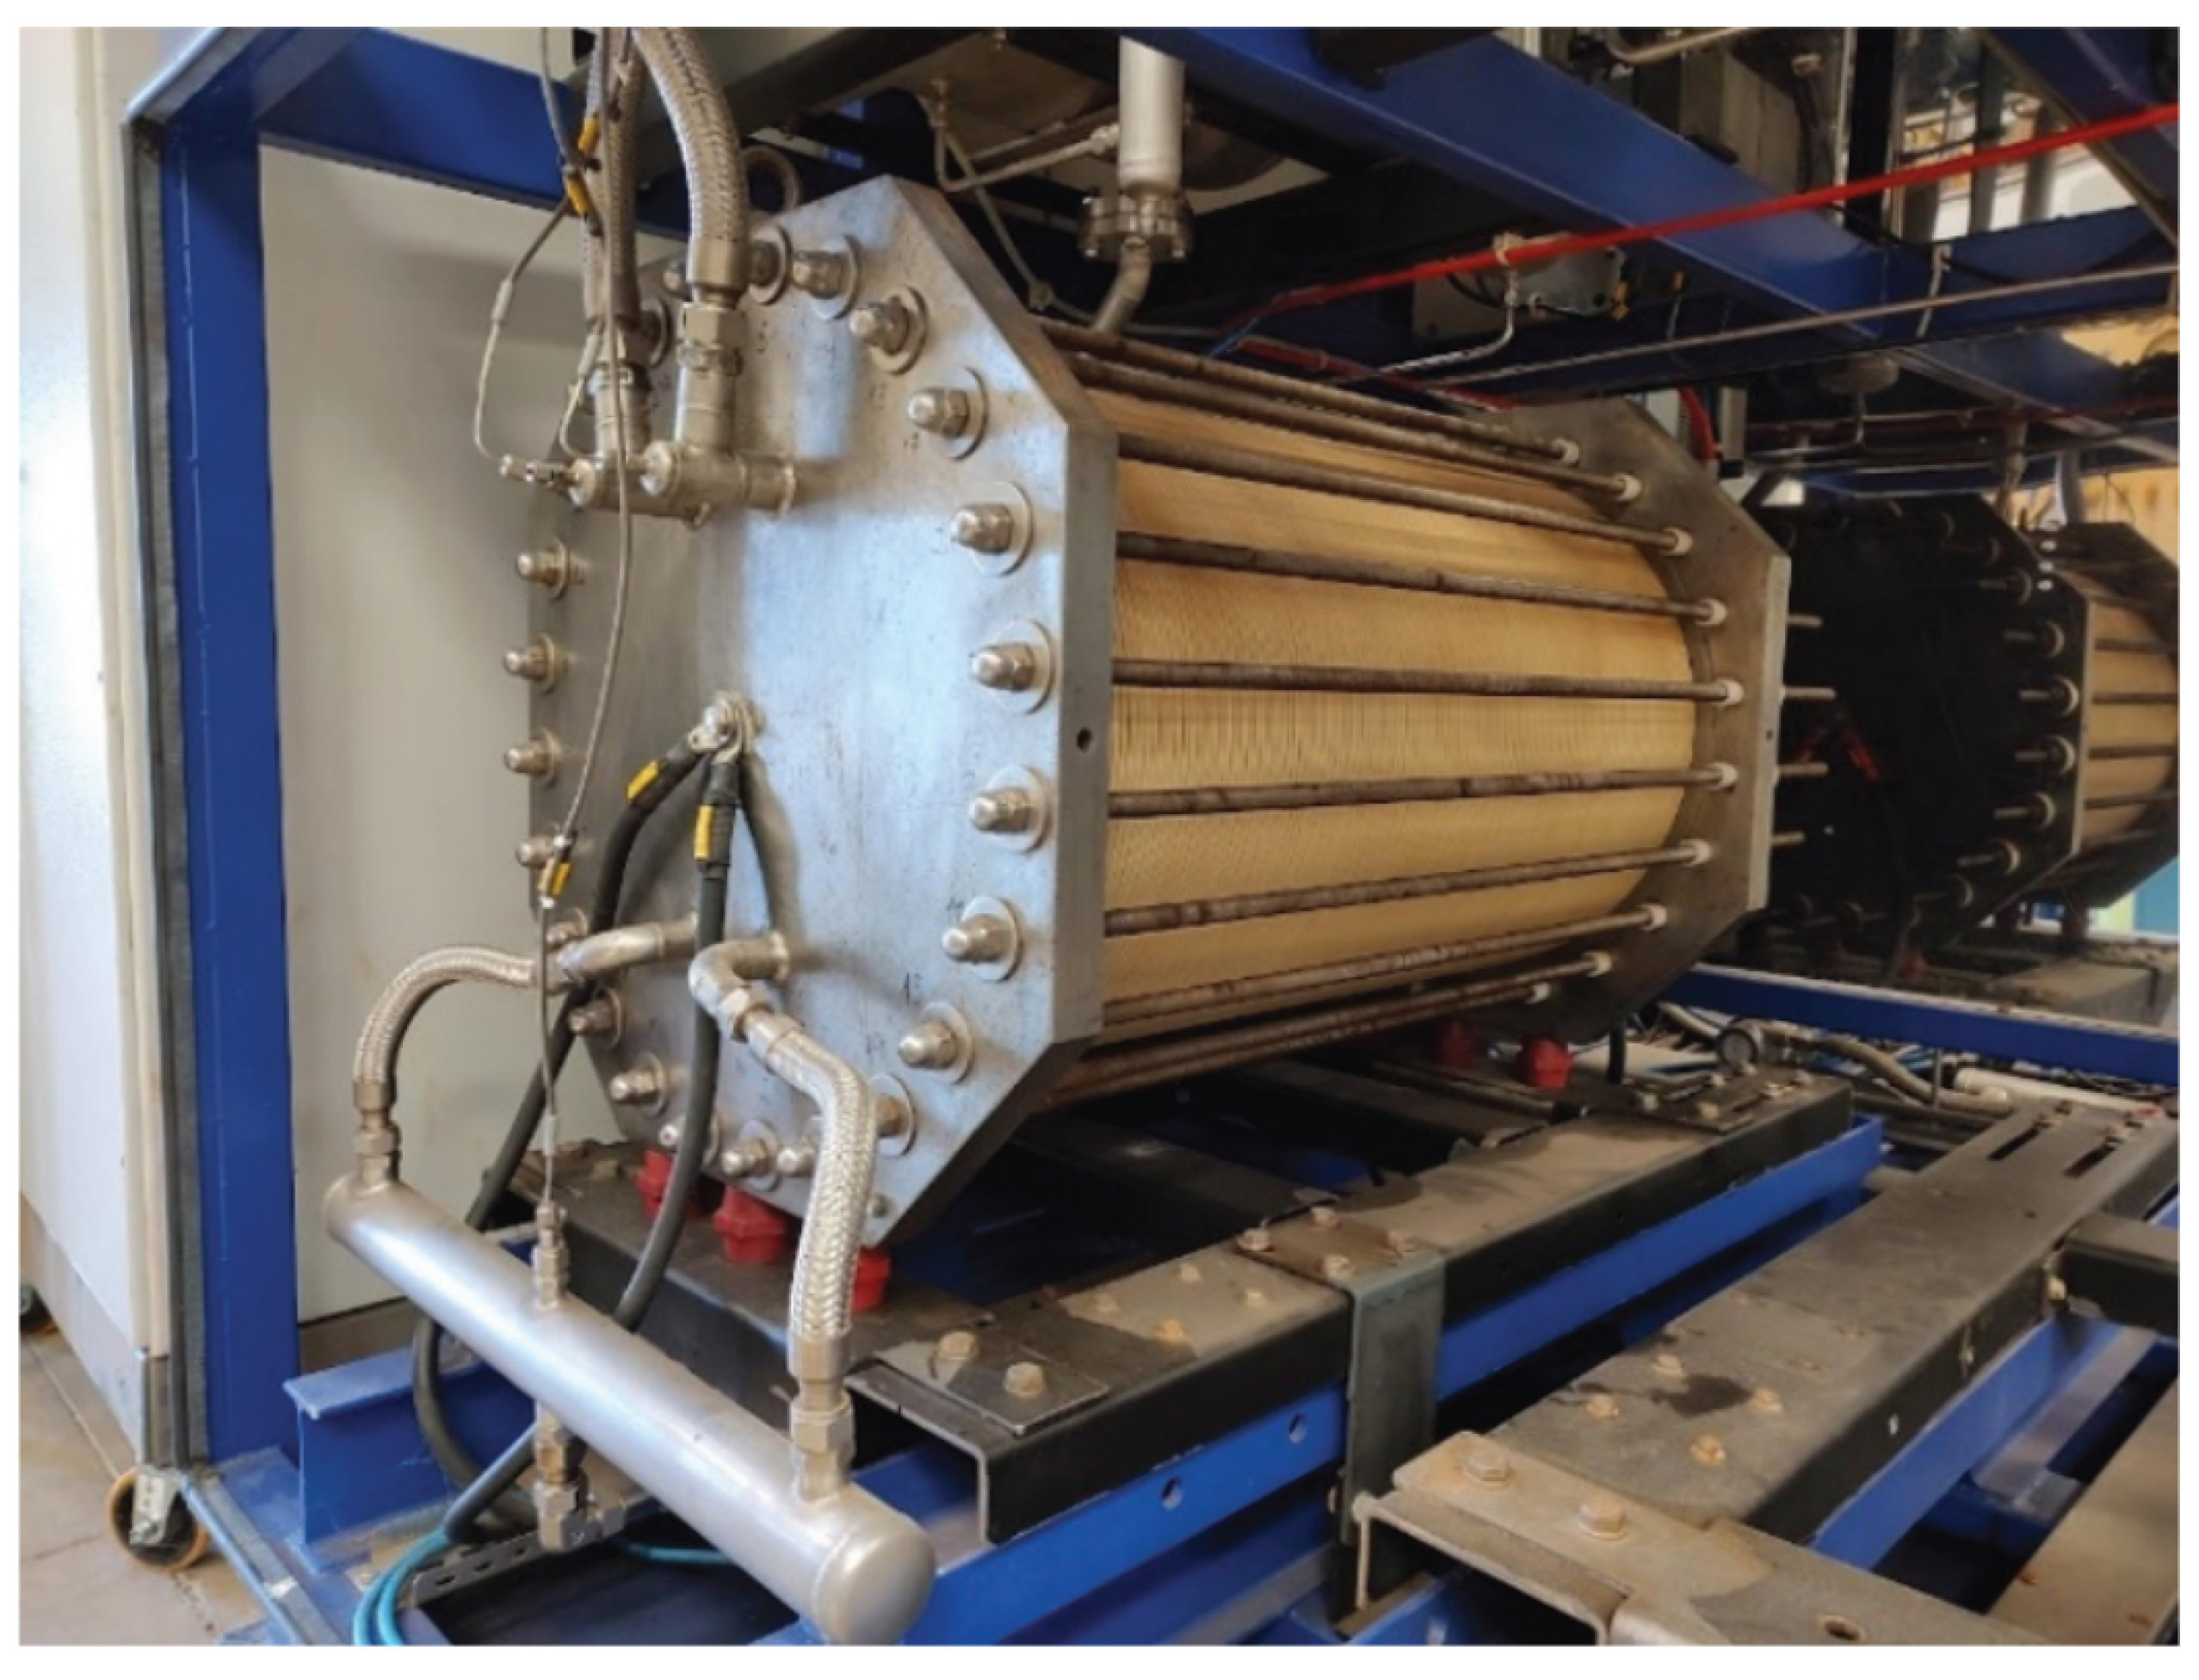
Figure 4.
Electrolyzer plant diagram showing sensors, vessels, tanks, equipment, employed in each stage of the Hydrogen production.
Figure 4.
Electrolyzer plant diagram showing sensors, vessels, tanks, equipment, employed in each stage of the Hydrogen production.
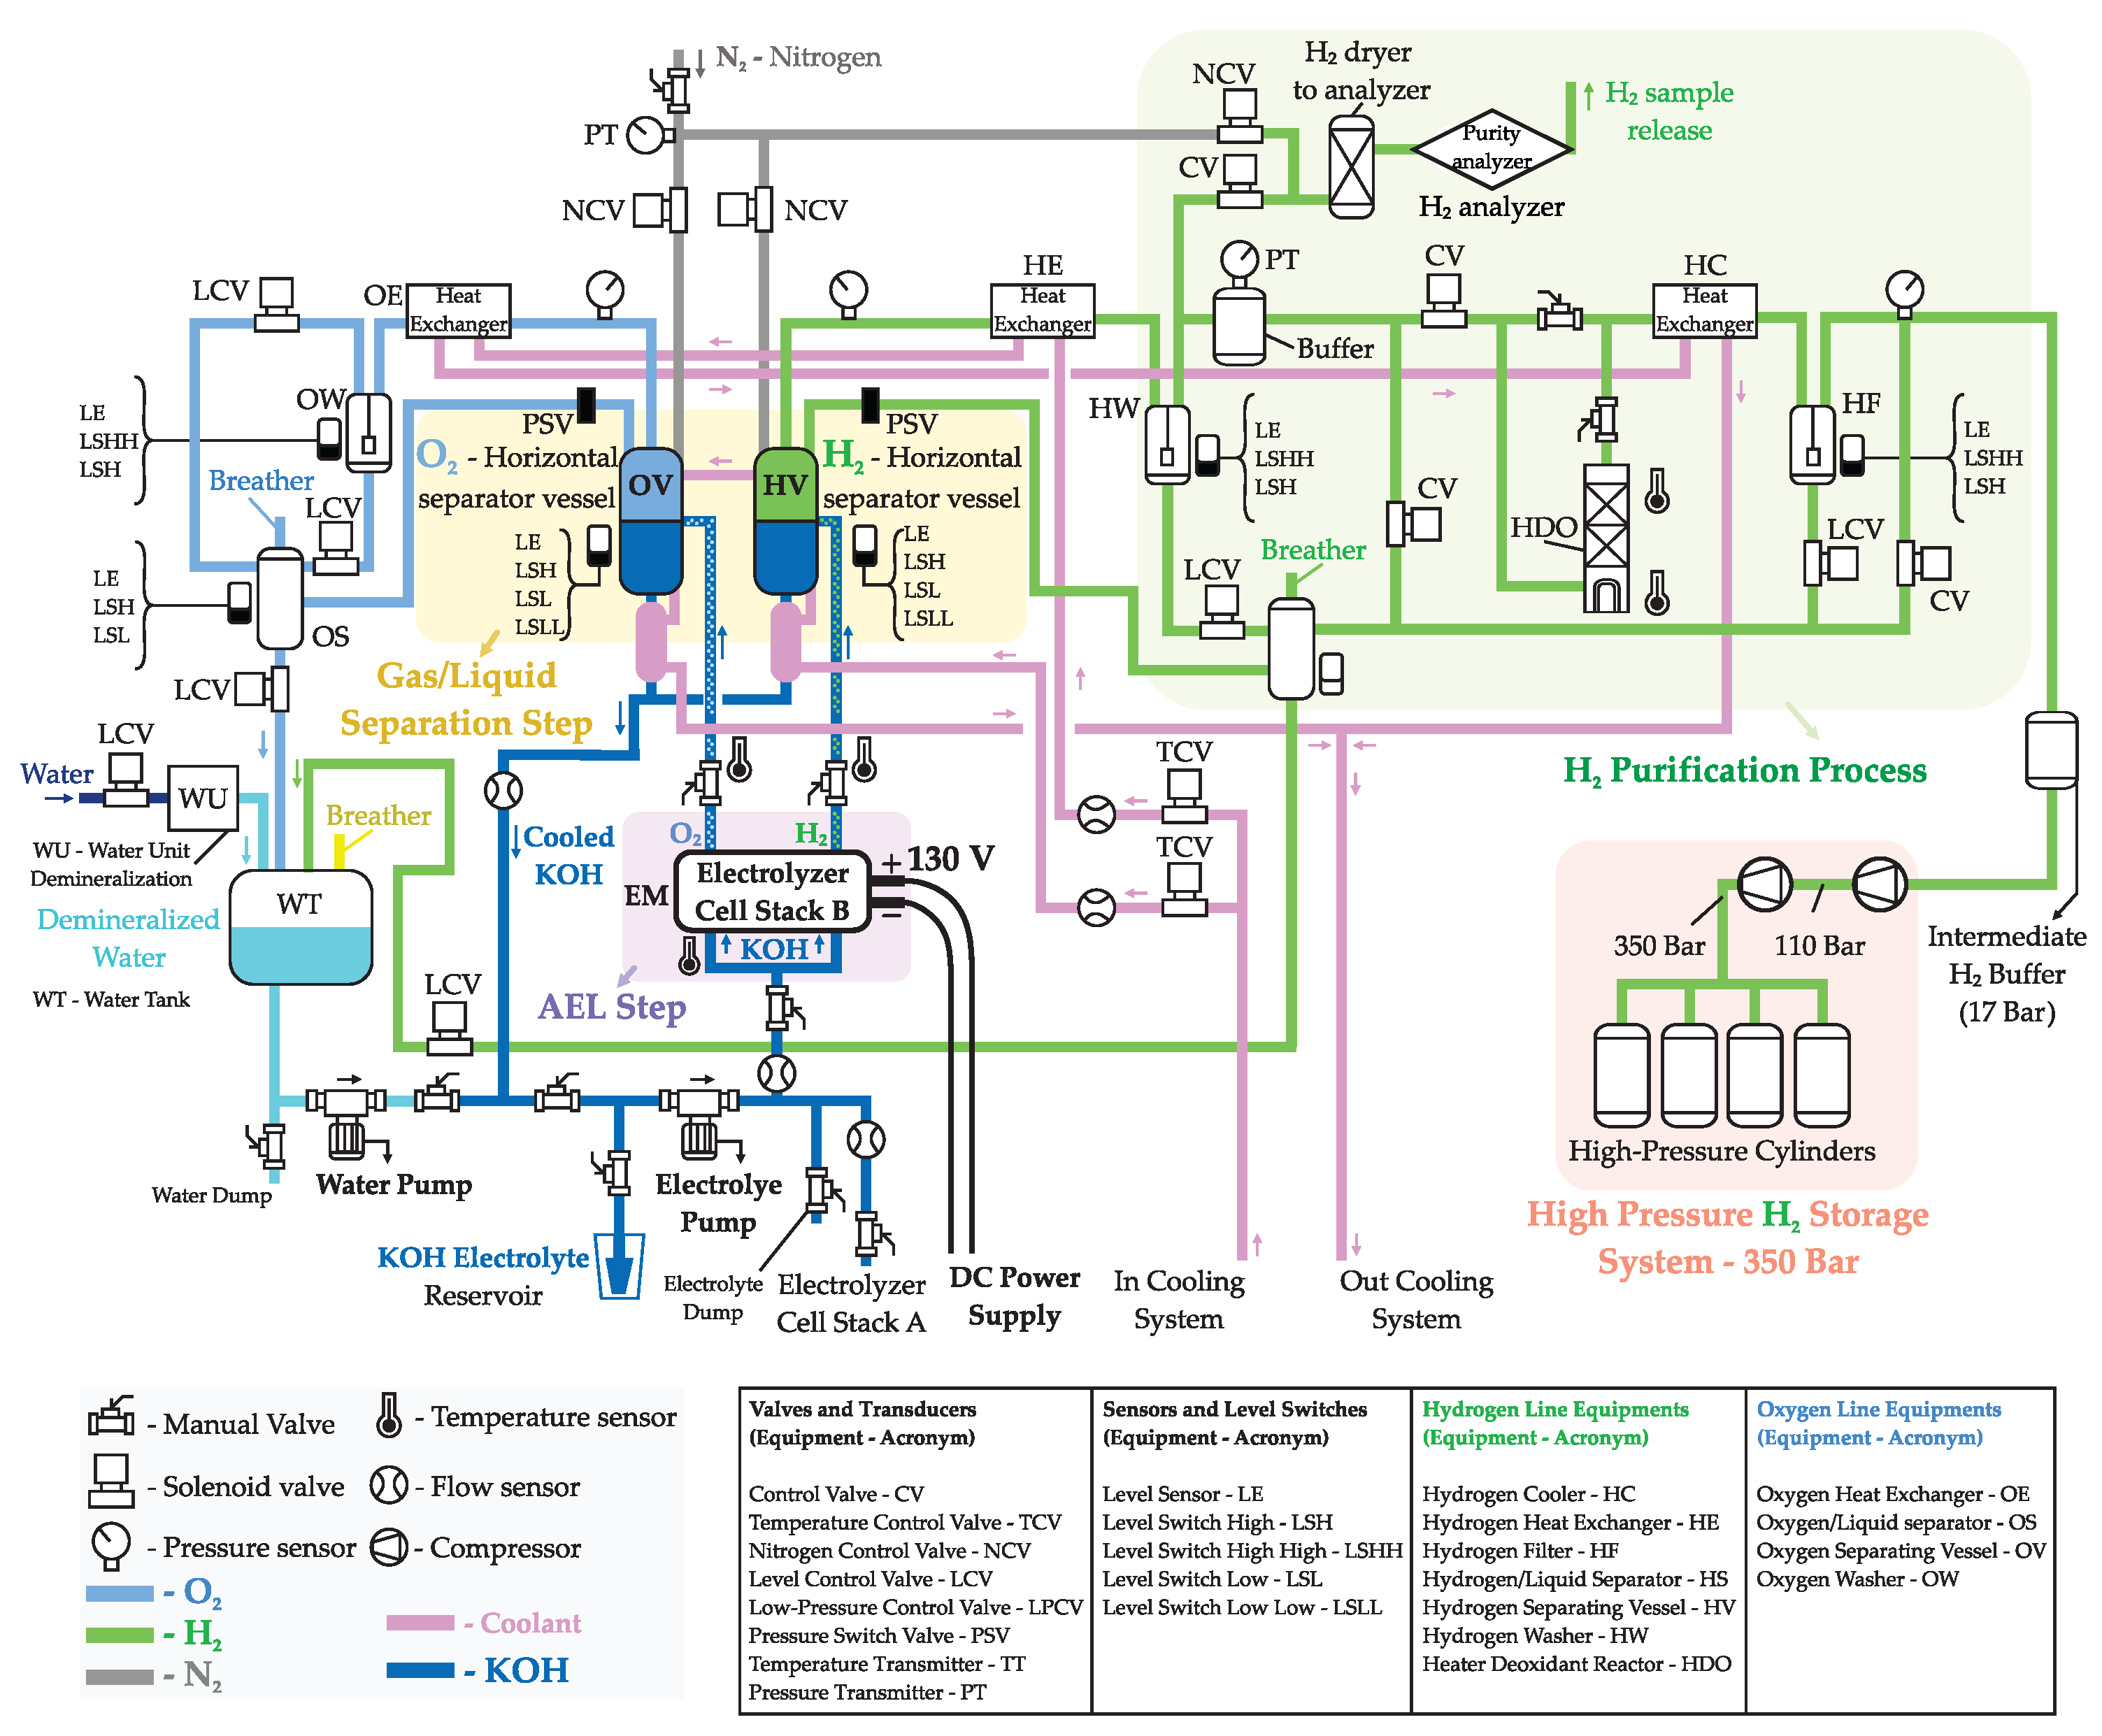
Figure 5.
Block diagram of the proposed DC microgrid.
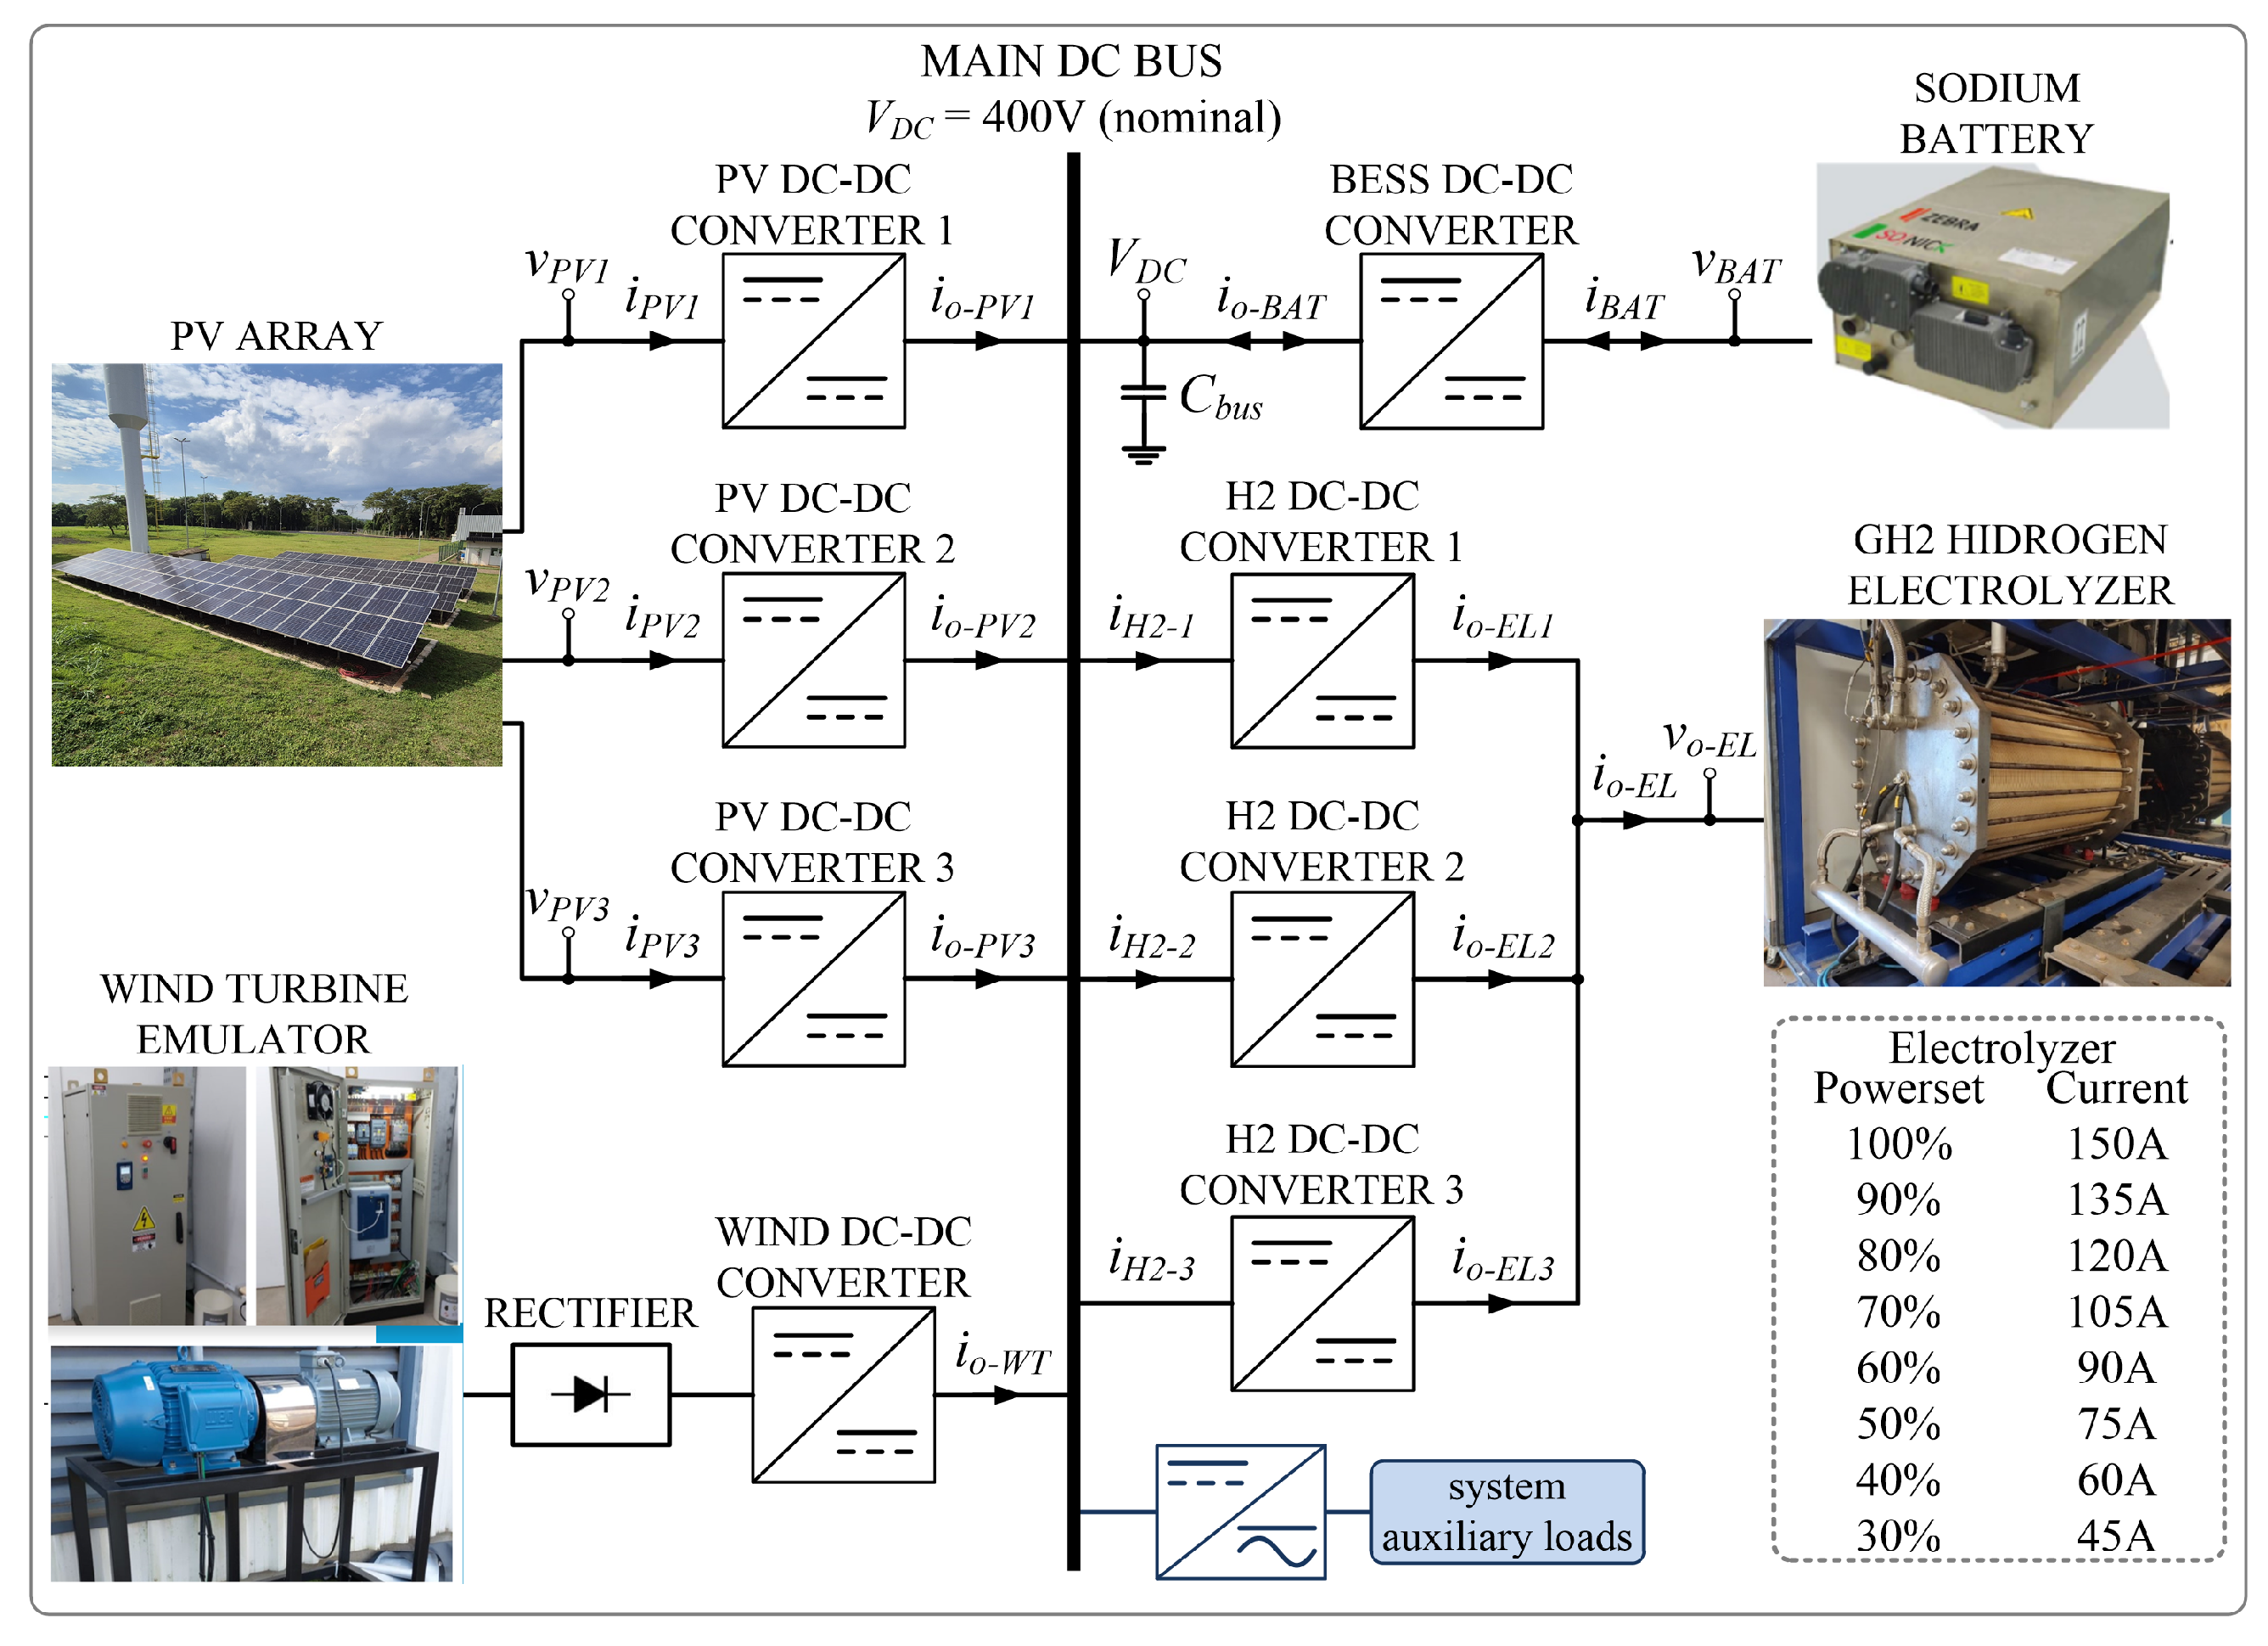
Figure 6.
Three interleaved PSFB converter modules employing active clamp circuits at the secondary stage.
Figure 6.
Three interleaved PSFB converter modules employing active clamp circuits at the secondary stage.
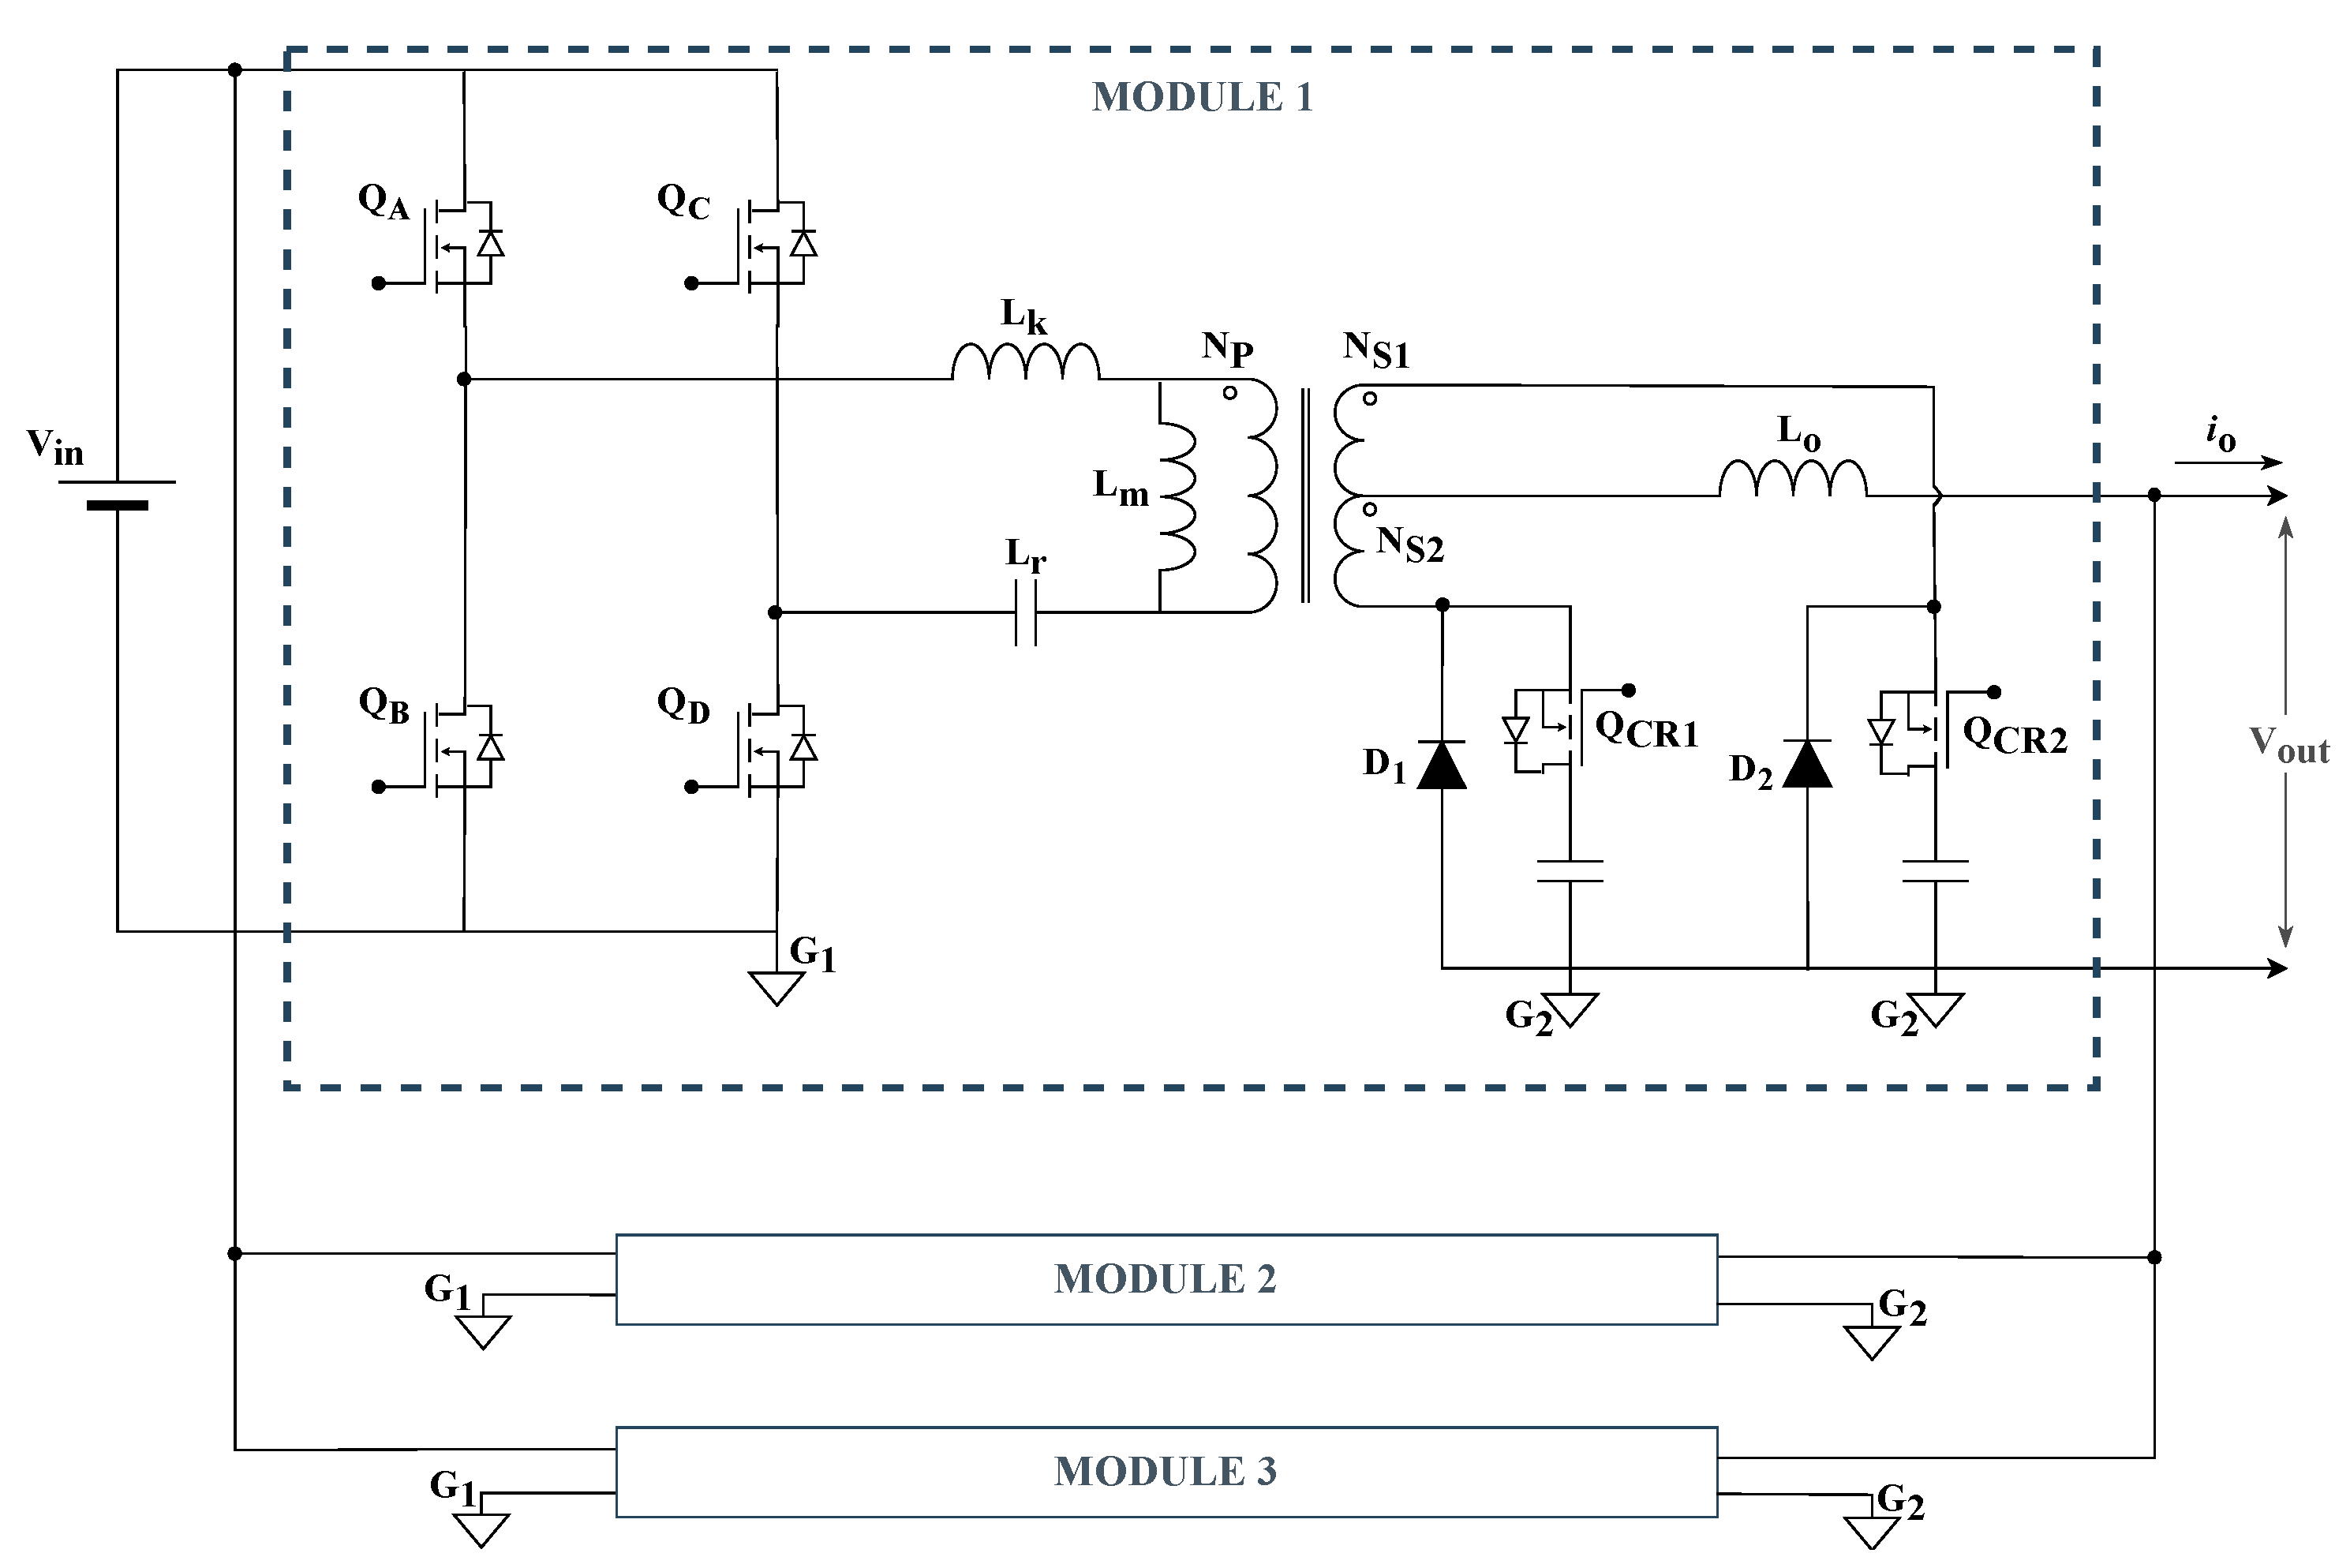
Figure 7.
Two-phase interleaved bidirectional Buck converter with input and output filters.
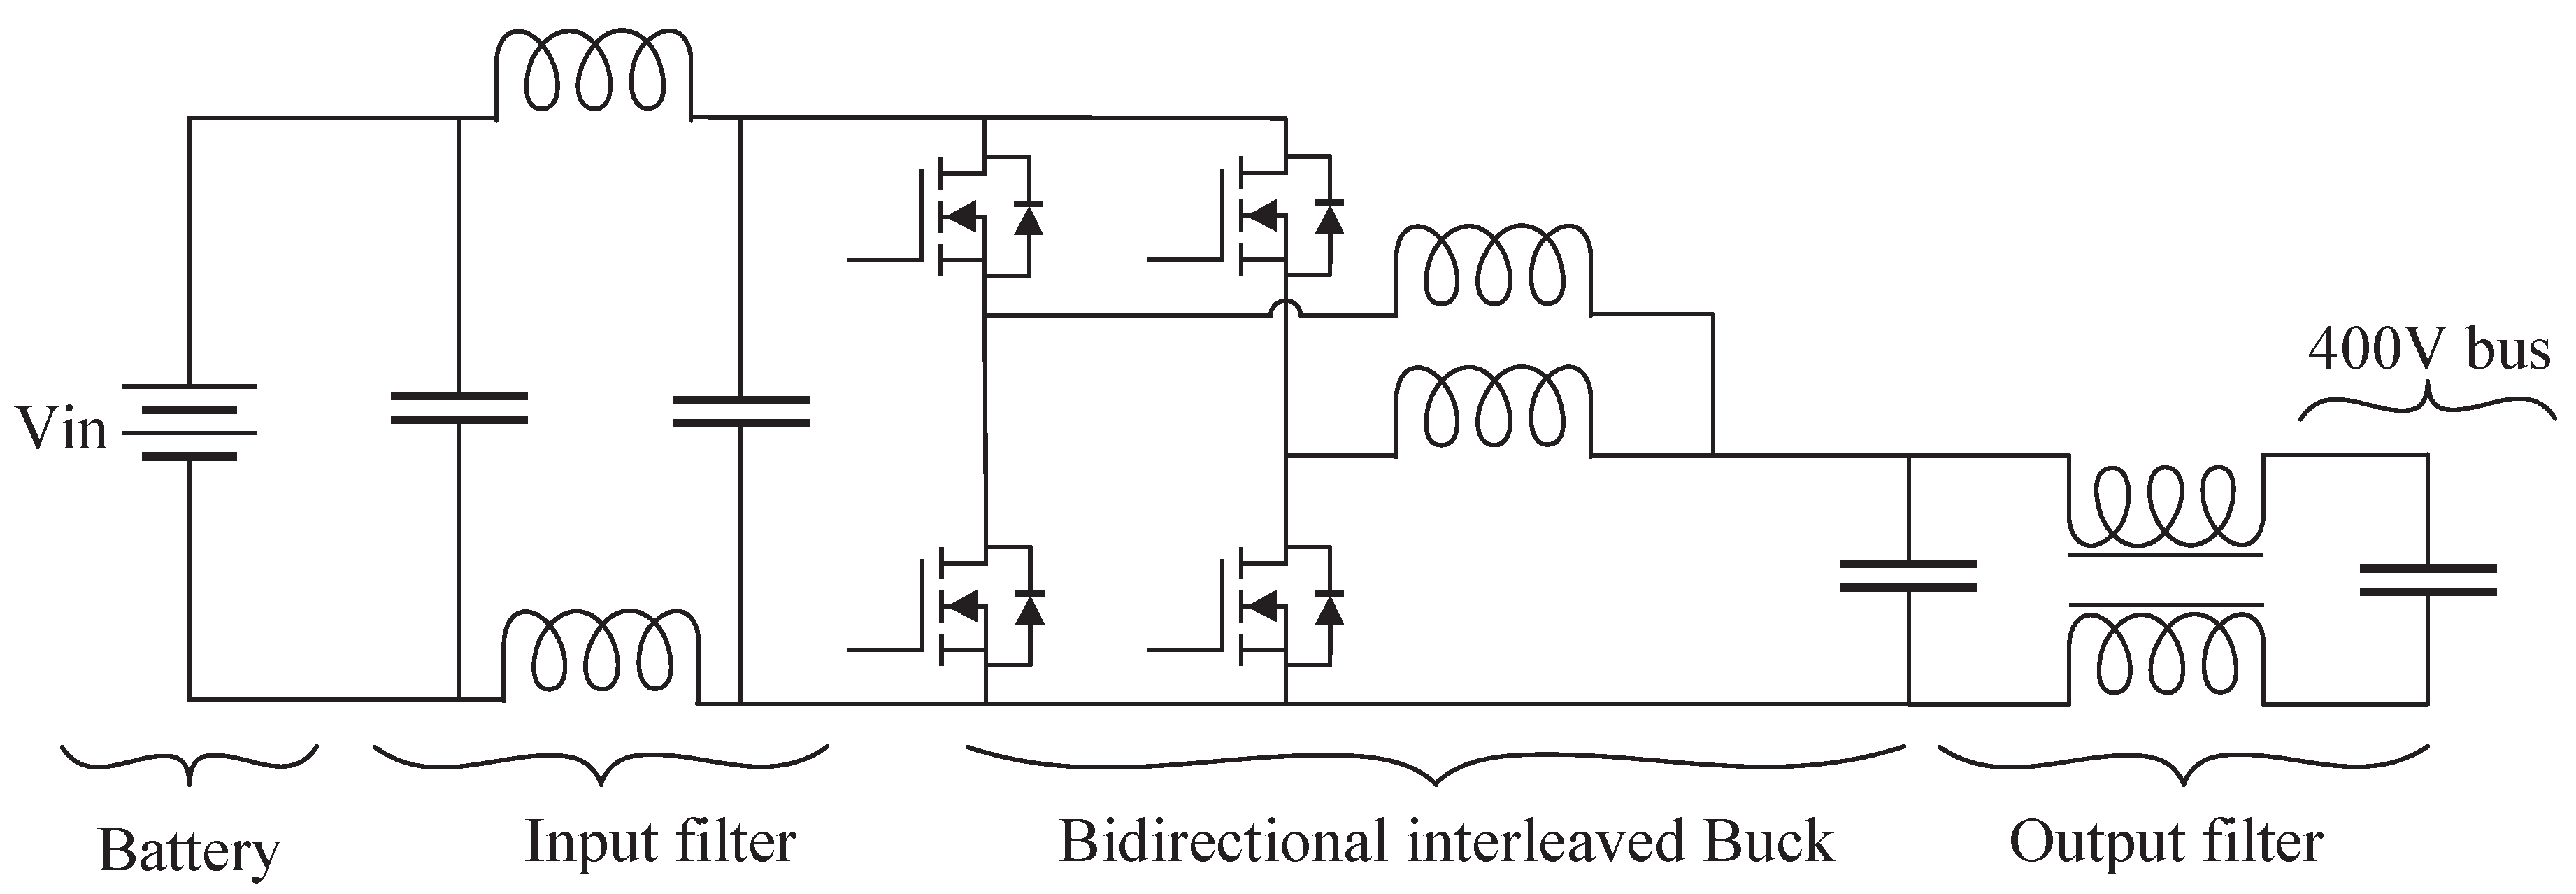
Figure 8.
Schematic of the non-inverter Buck-Boost for the PV input port.
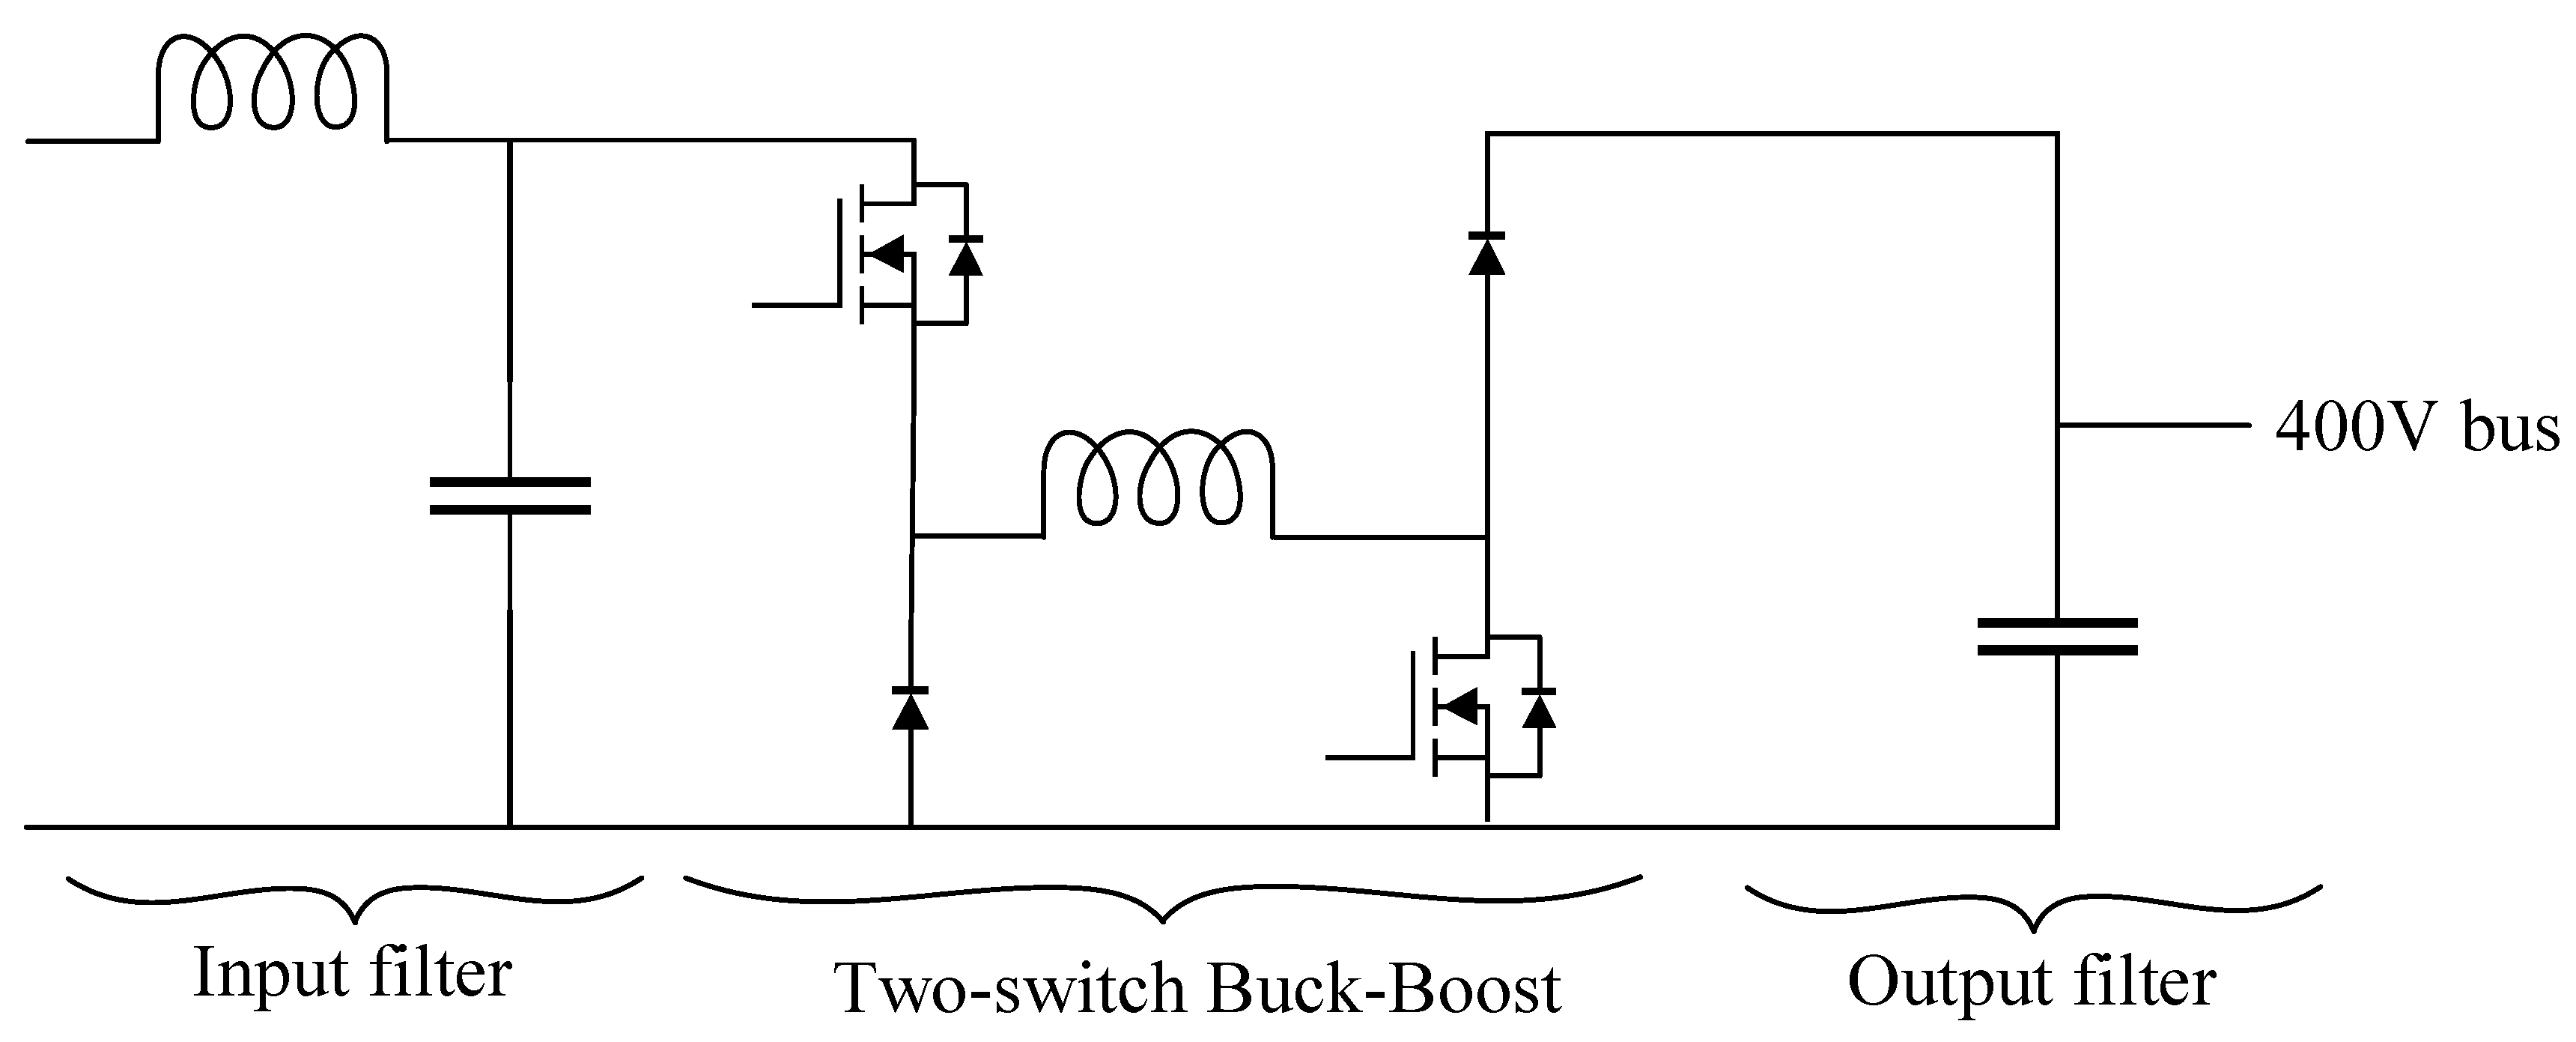
Figure 9.
Schematic of the rectifier and non-inverter Buck-Boost for the wind input port.
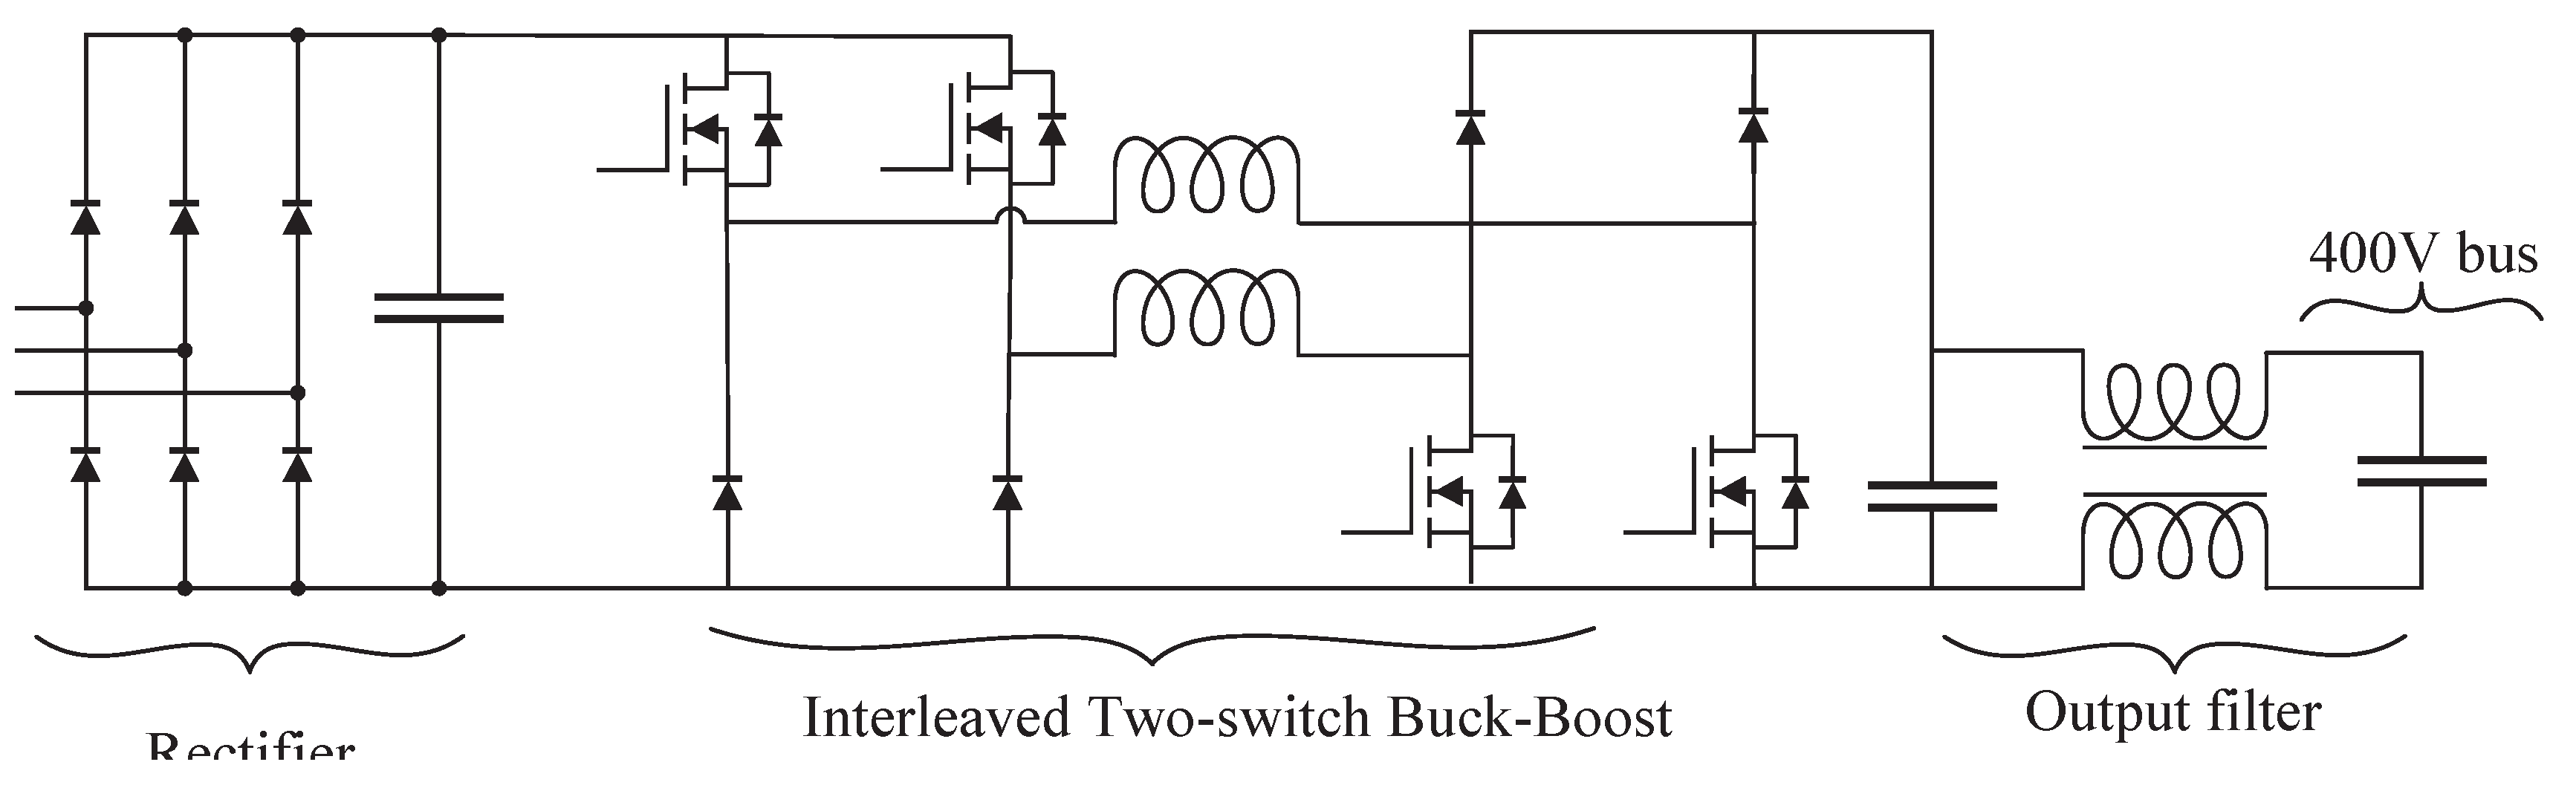
Figure 10.
Legacy electrolyzer thyristor-based rectifier voltage and current waveforms for an operating point with 70% of the full powerset. Yellow waveform: rectifier output voltage (maximum peak value is 139.9 V, mean value is 116.7 V, RMS value is 117.6 V); Blue waveform: rectifier output current (maximum peak value is 260.4 A, mean value is 93.36 A, RMS value is 135.2 A).
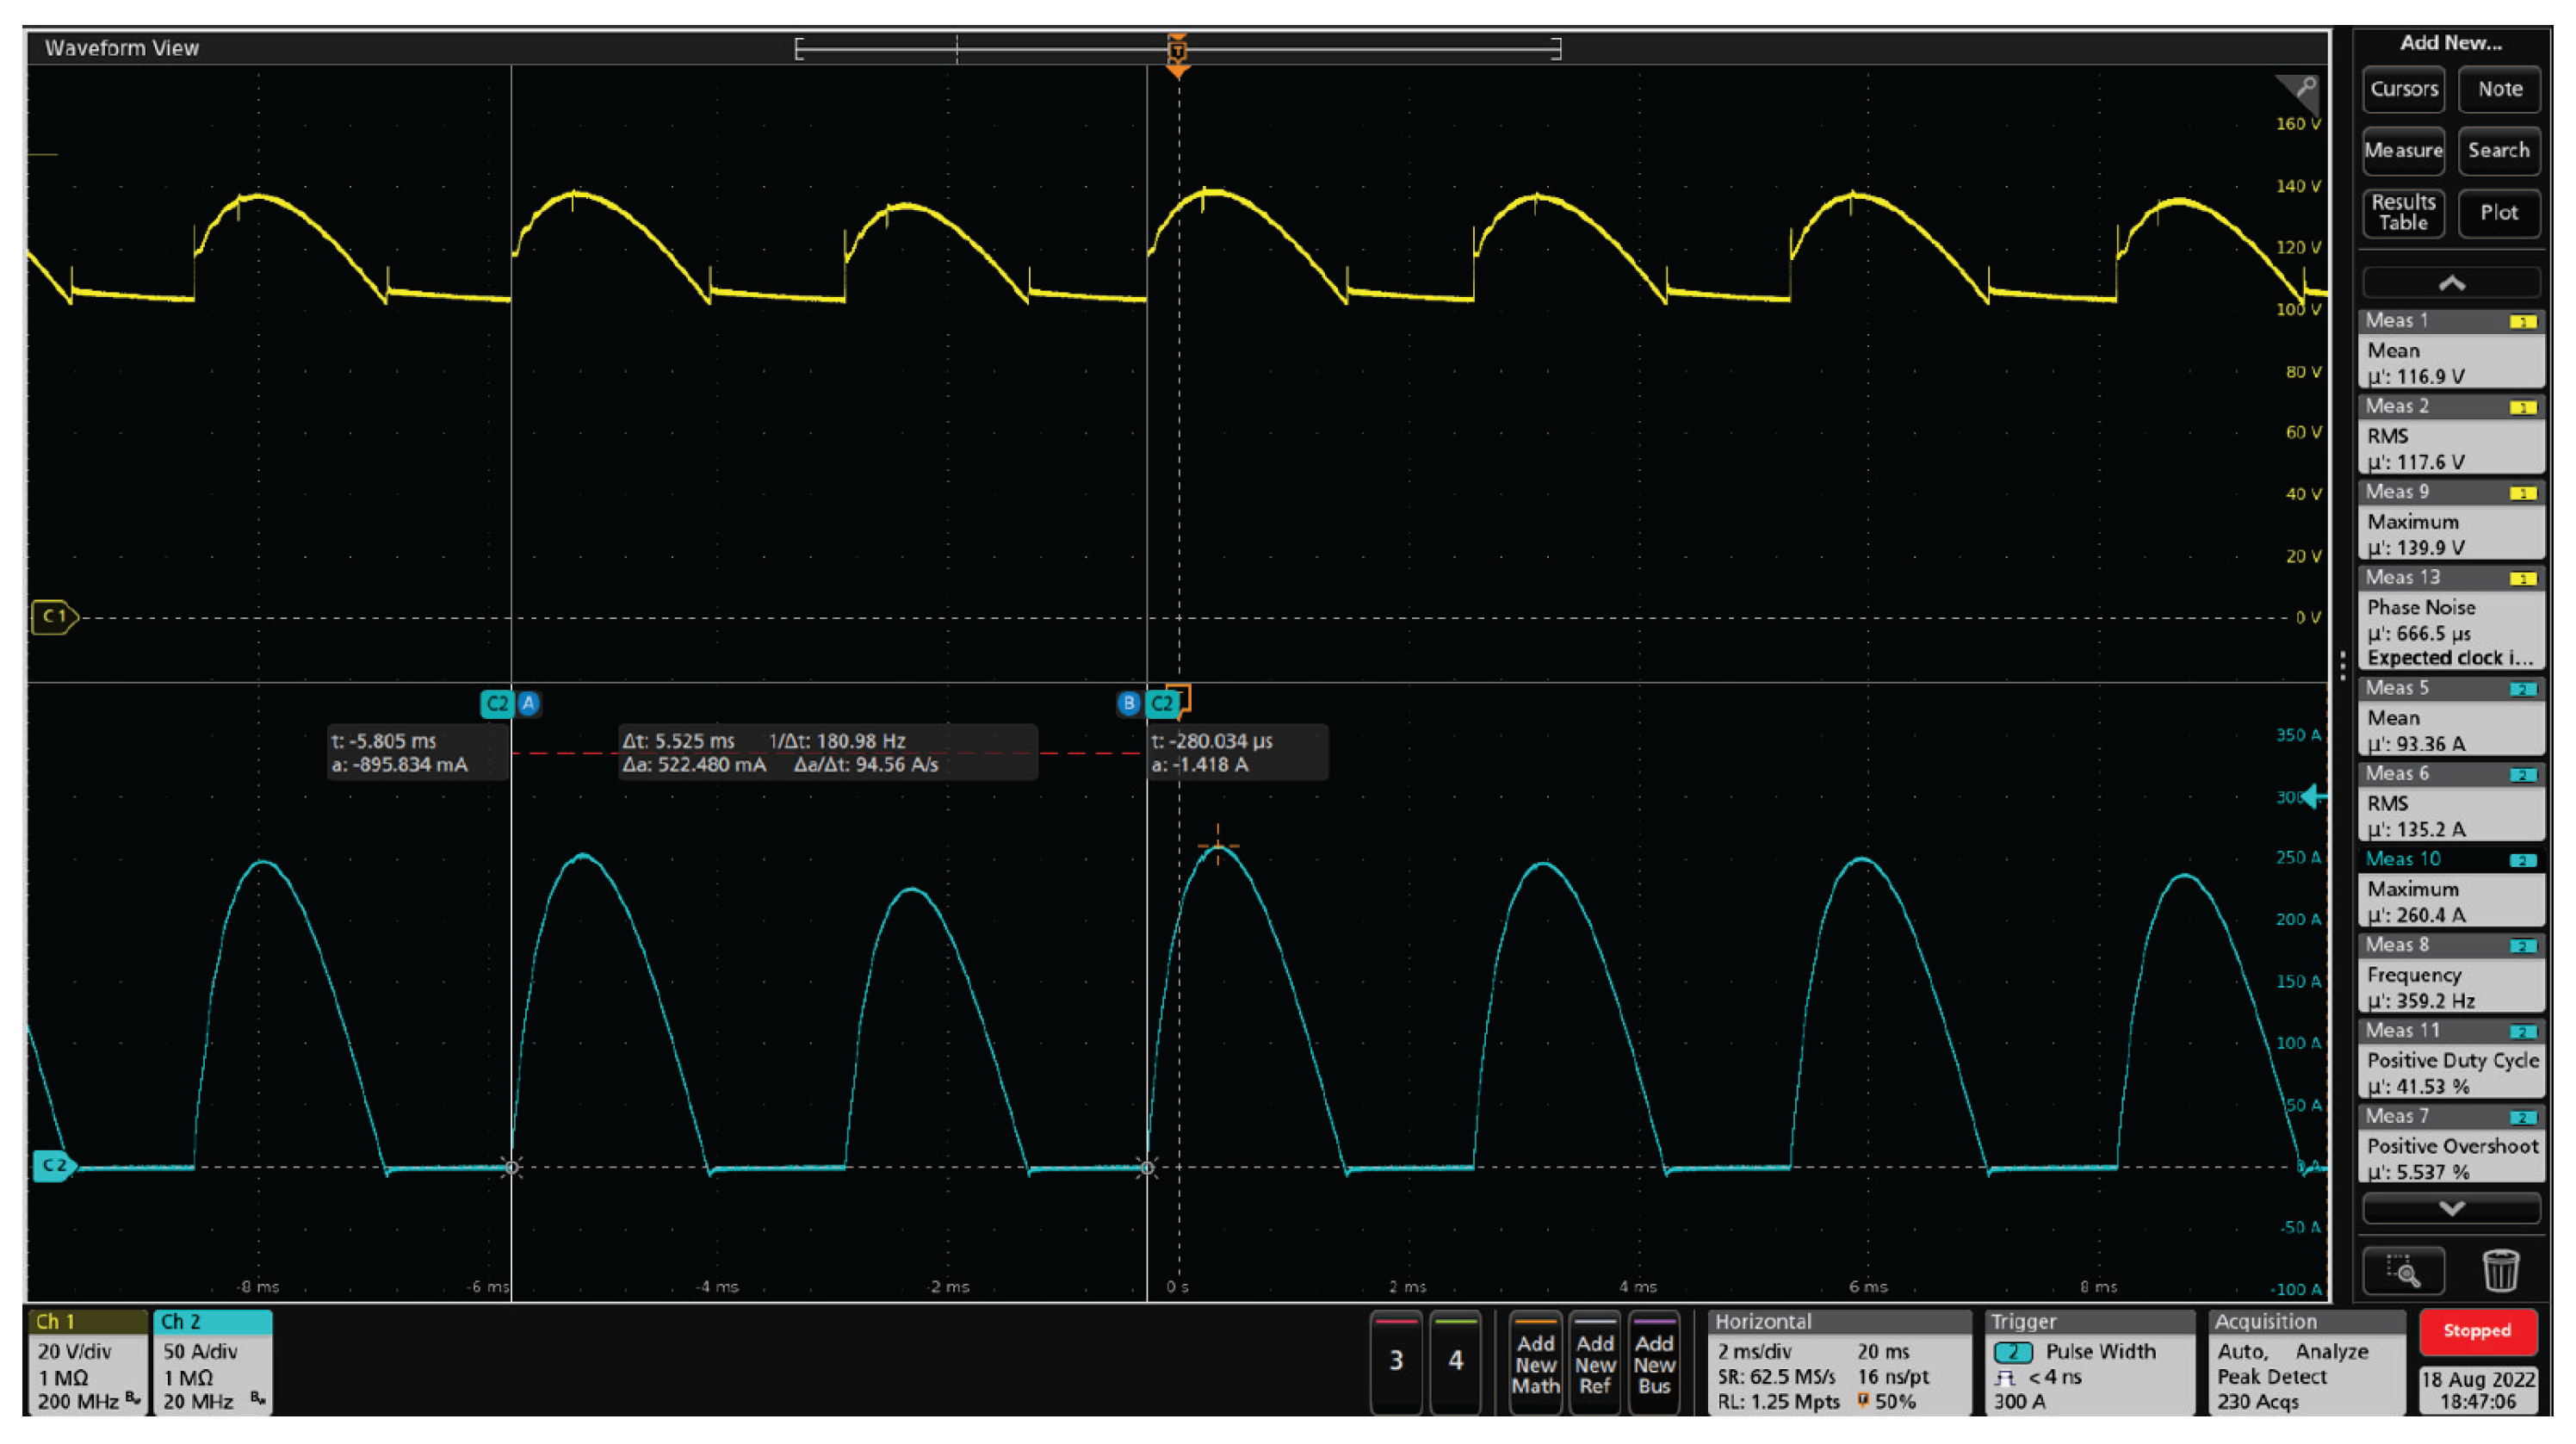
Figure 11.
Voltage and currents waveforms of DC microgrid for 80% of the full power set ( = 134 V and = 117 A, approximately).
Figure 11.
Voltage and currents waveforms of DC microgrid for 80% of the full power set ( = 134 V and = 117 A, approximately).
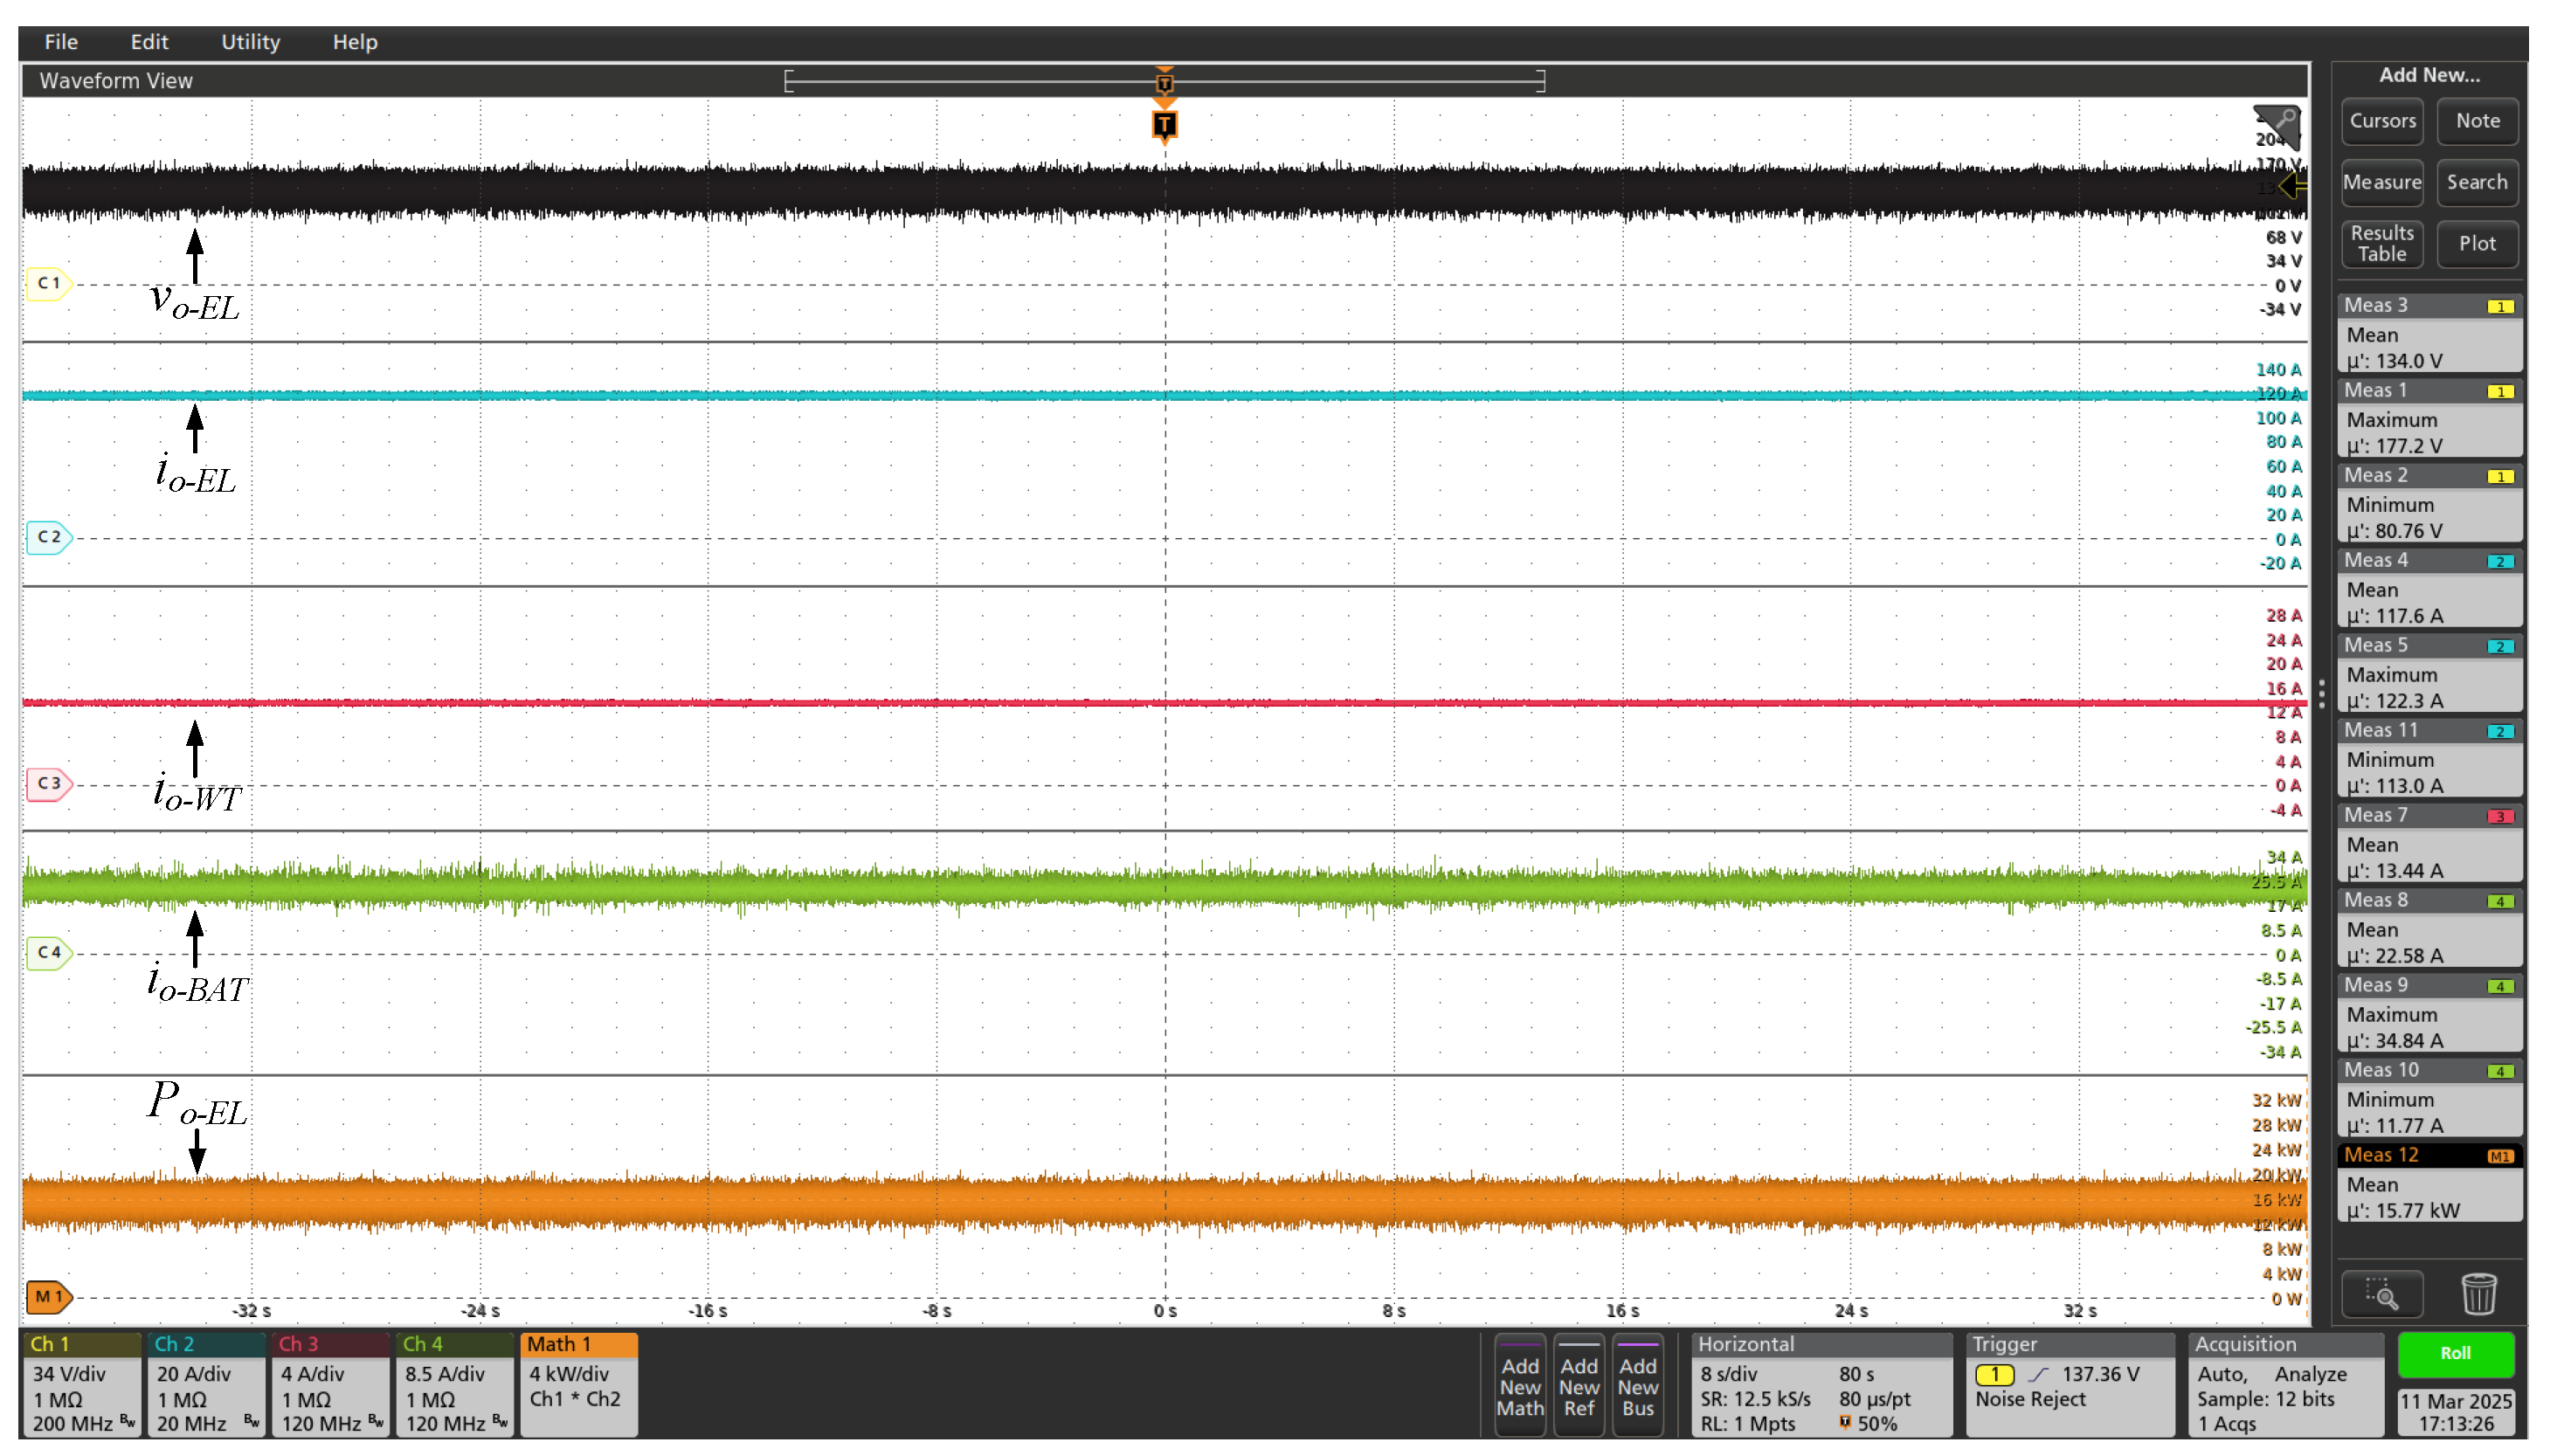
Figure 12.
Voltage and currents waveforms of DC microgrid for 70% of the full power set ( = 126 V and = 104 A, approximately).
Figure 12.
Voltage and currents waveforms of DC microgrid for 70% of the full power set ( = 126 V and = 104 A, approximately).
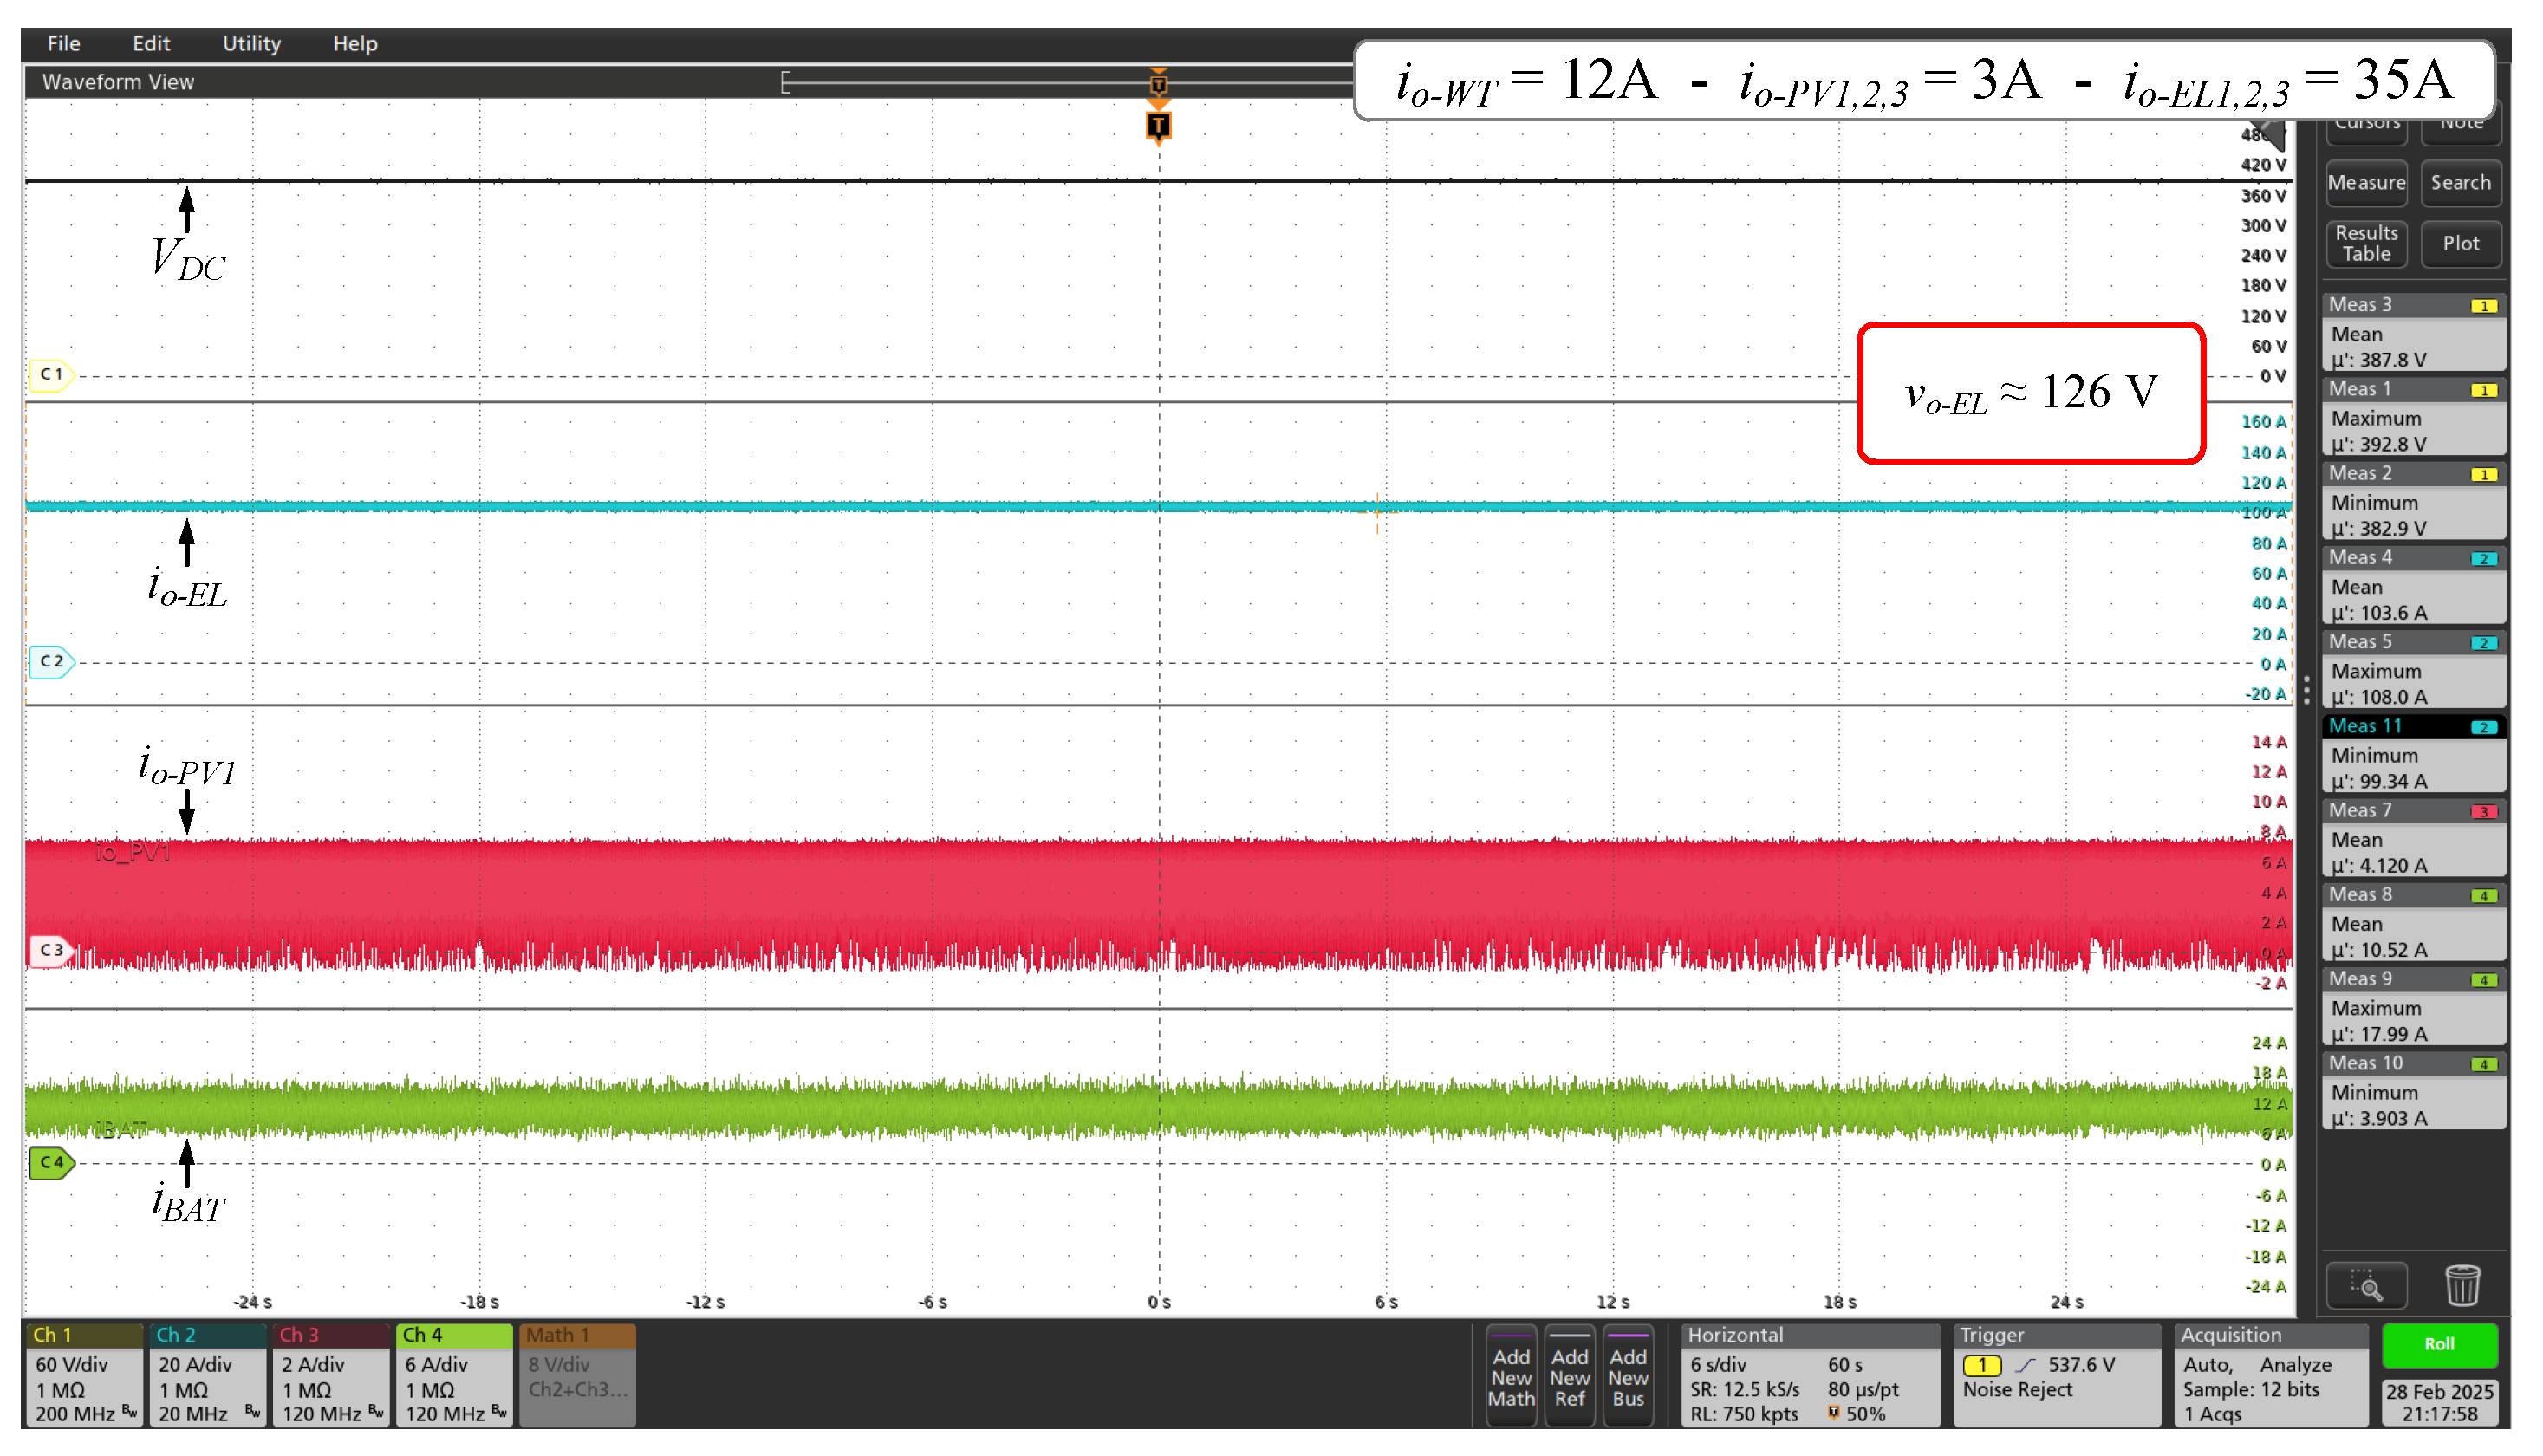
Figure 13.
Voltage and currents waveforms of DC microgrid for 60% of the full power set ( = 122 V and = 89 A, approximately).
Figure 13.
Voltage and currents waveforms of DC microgrid for 60% of the full power set ( = 122 V and = 89 A, approximately).
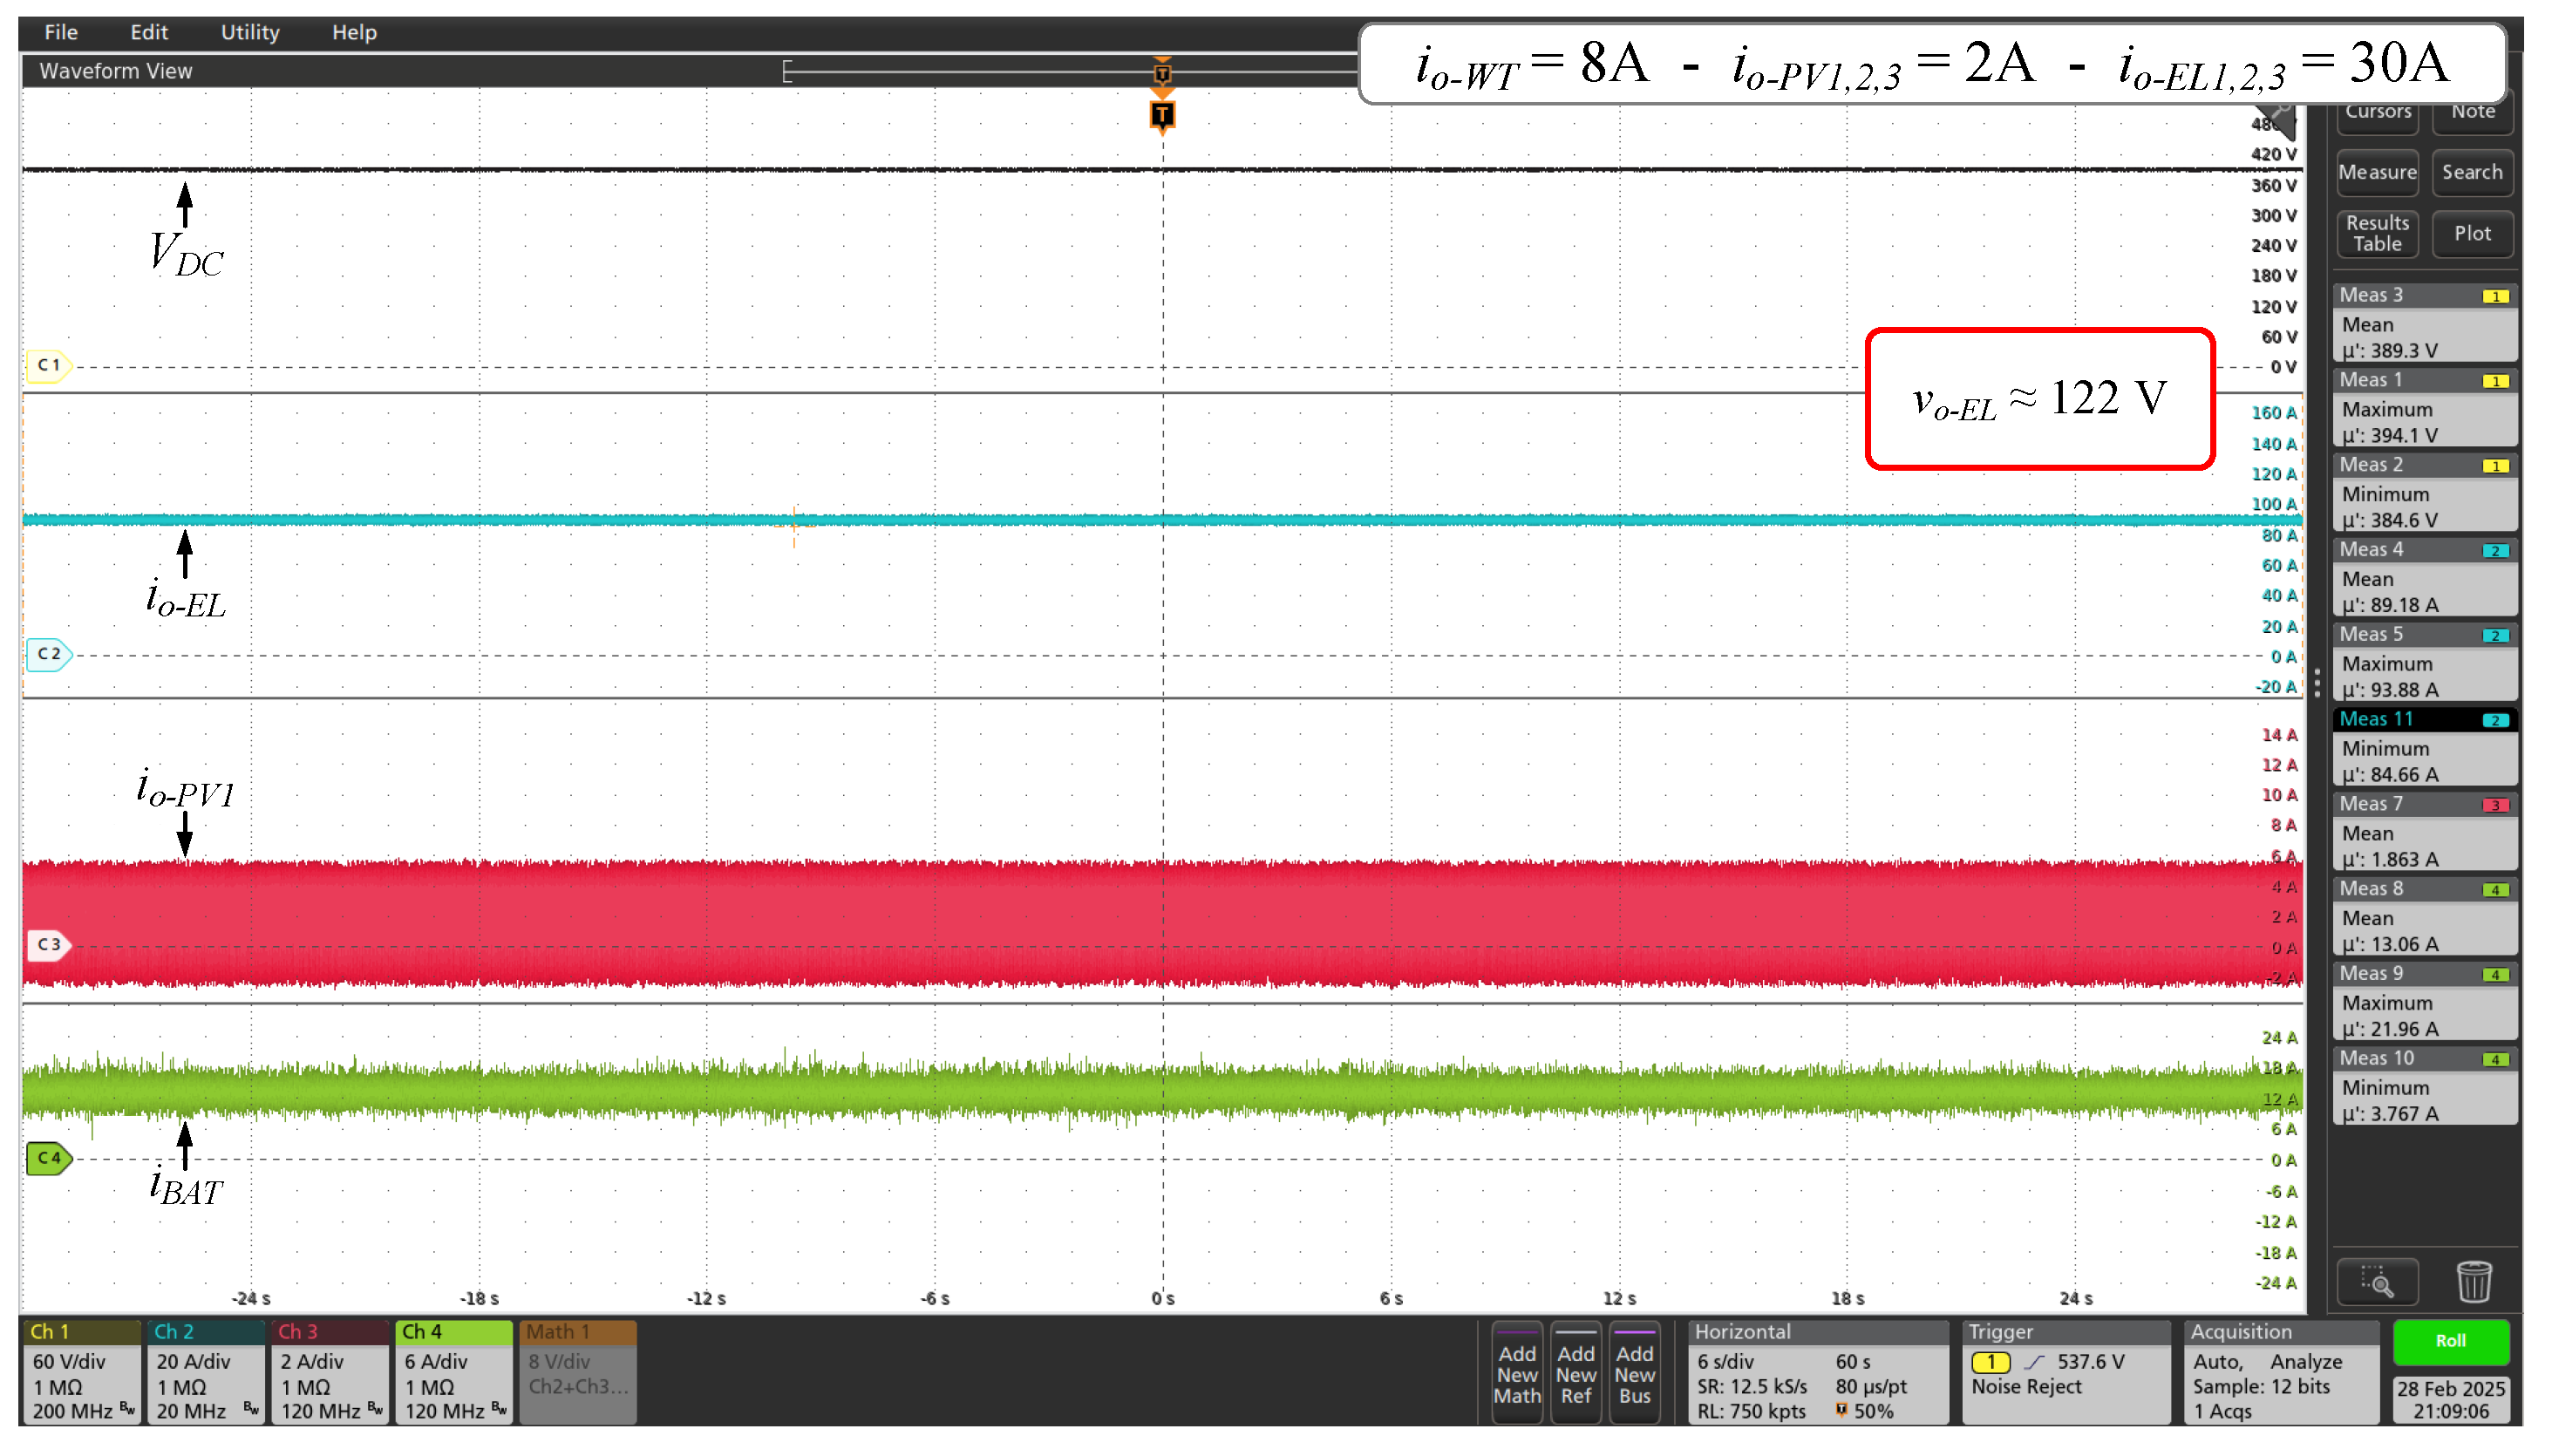
Figure 14.
Start-up of the battery converter.
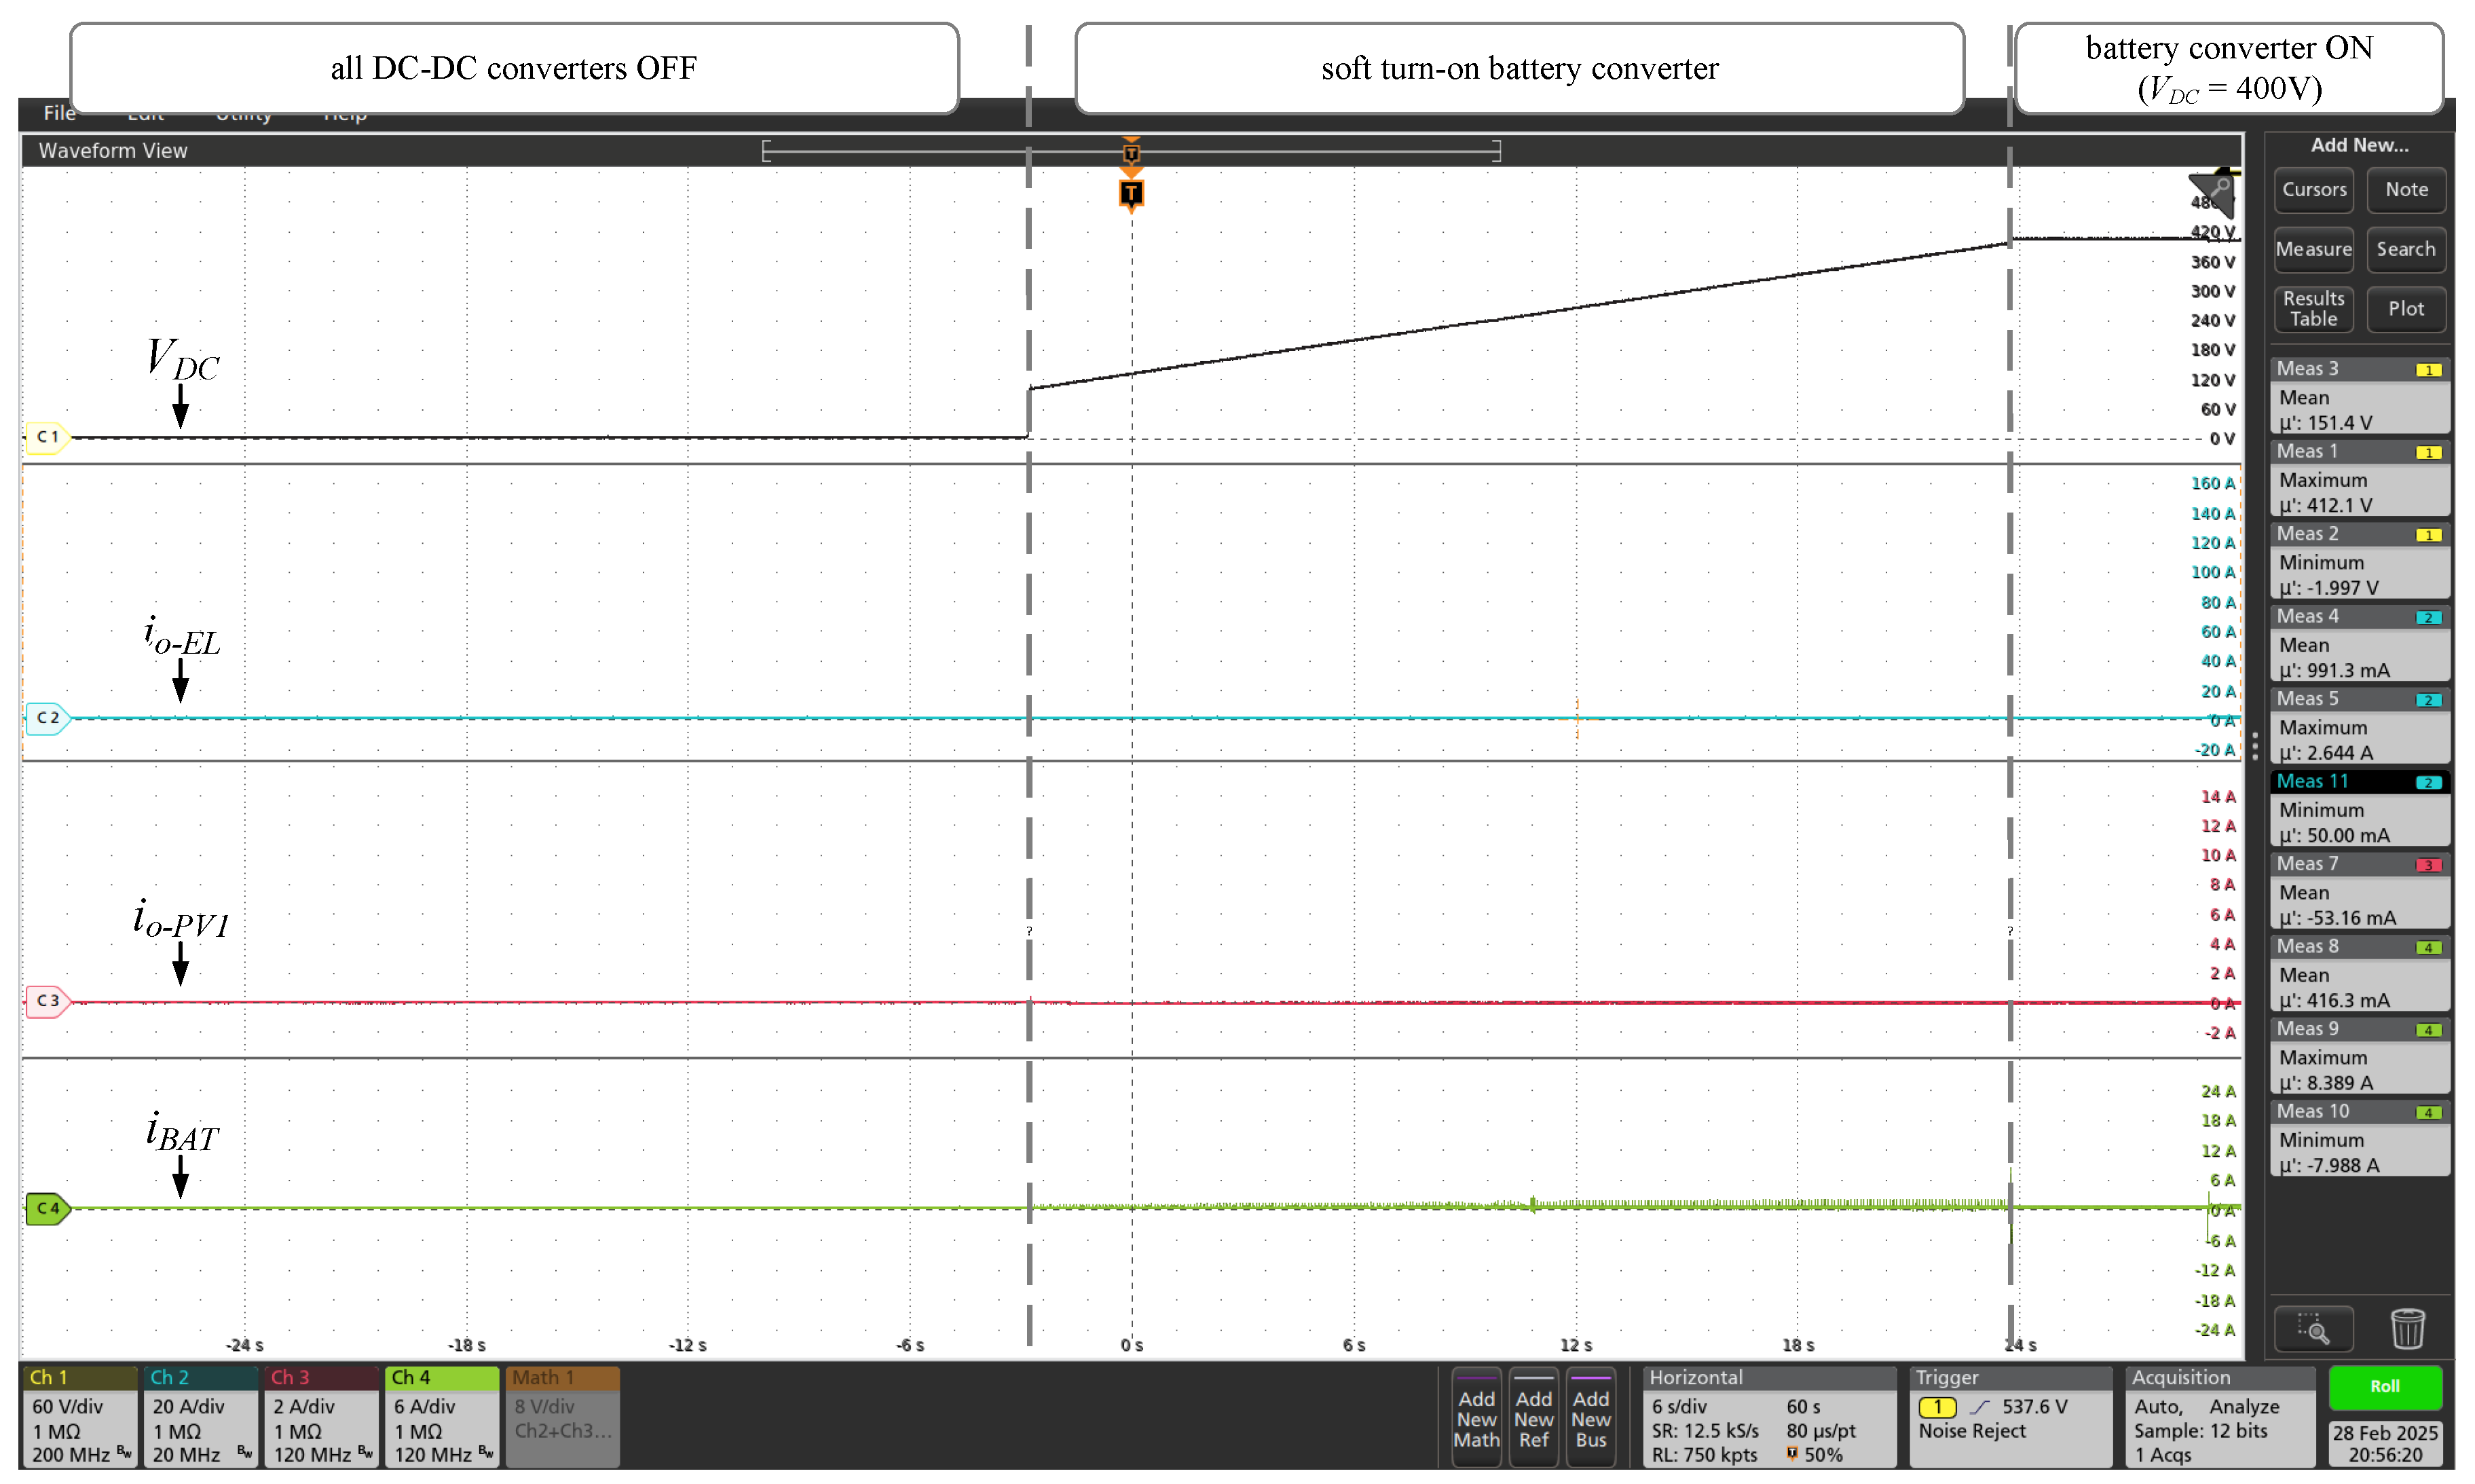
Figure 15.
Start-up of the wind and three PV converters.
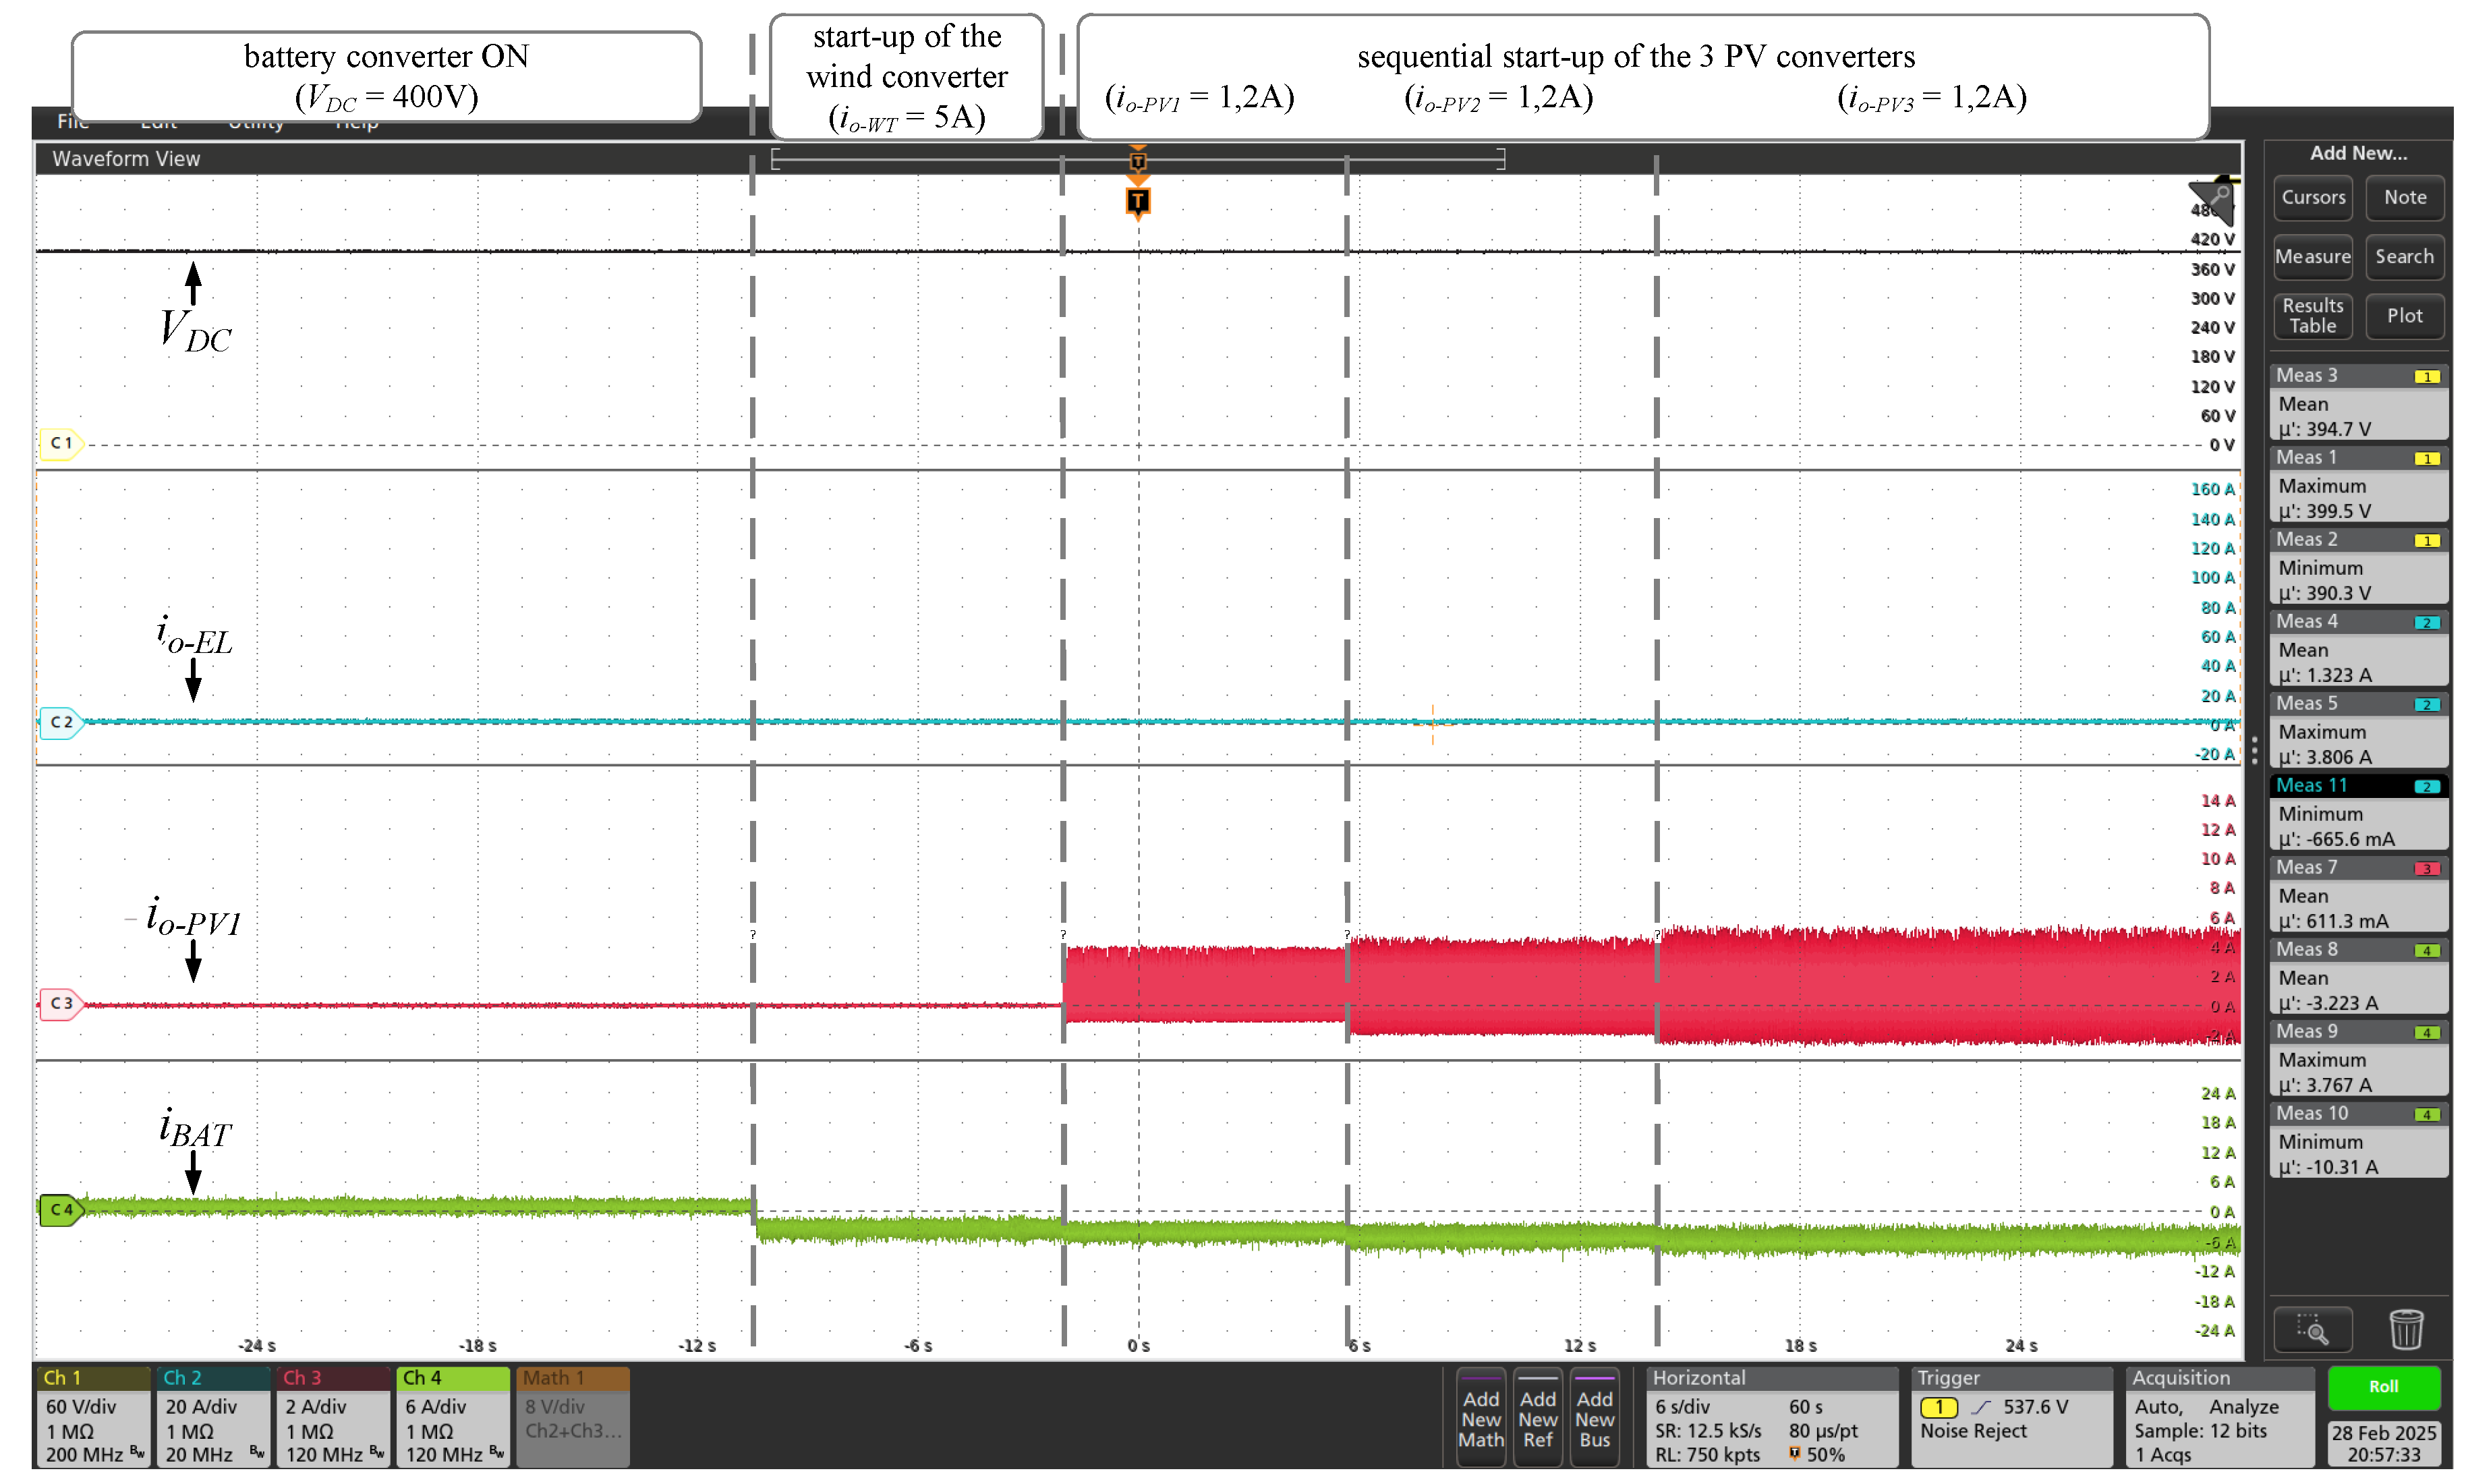
Figure 16.
Start-up of the 3 H2 converters.
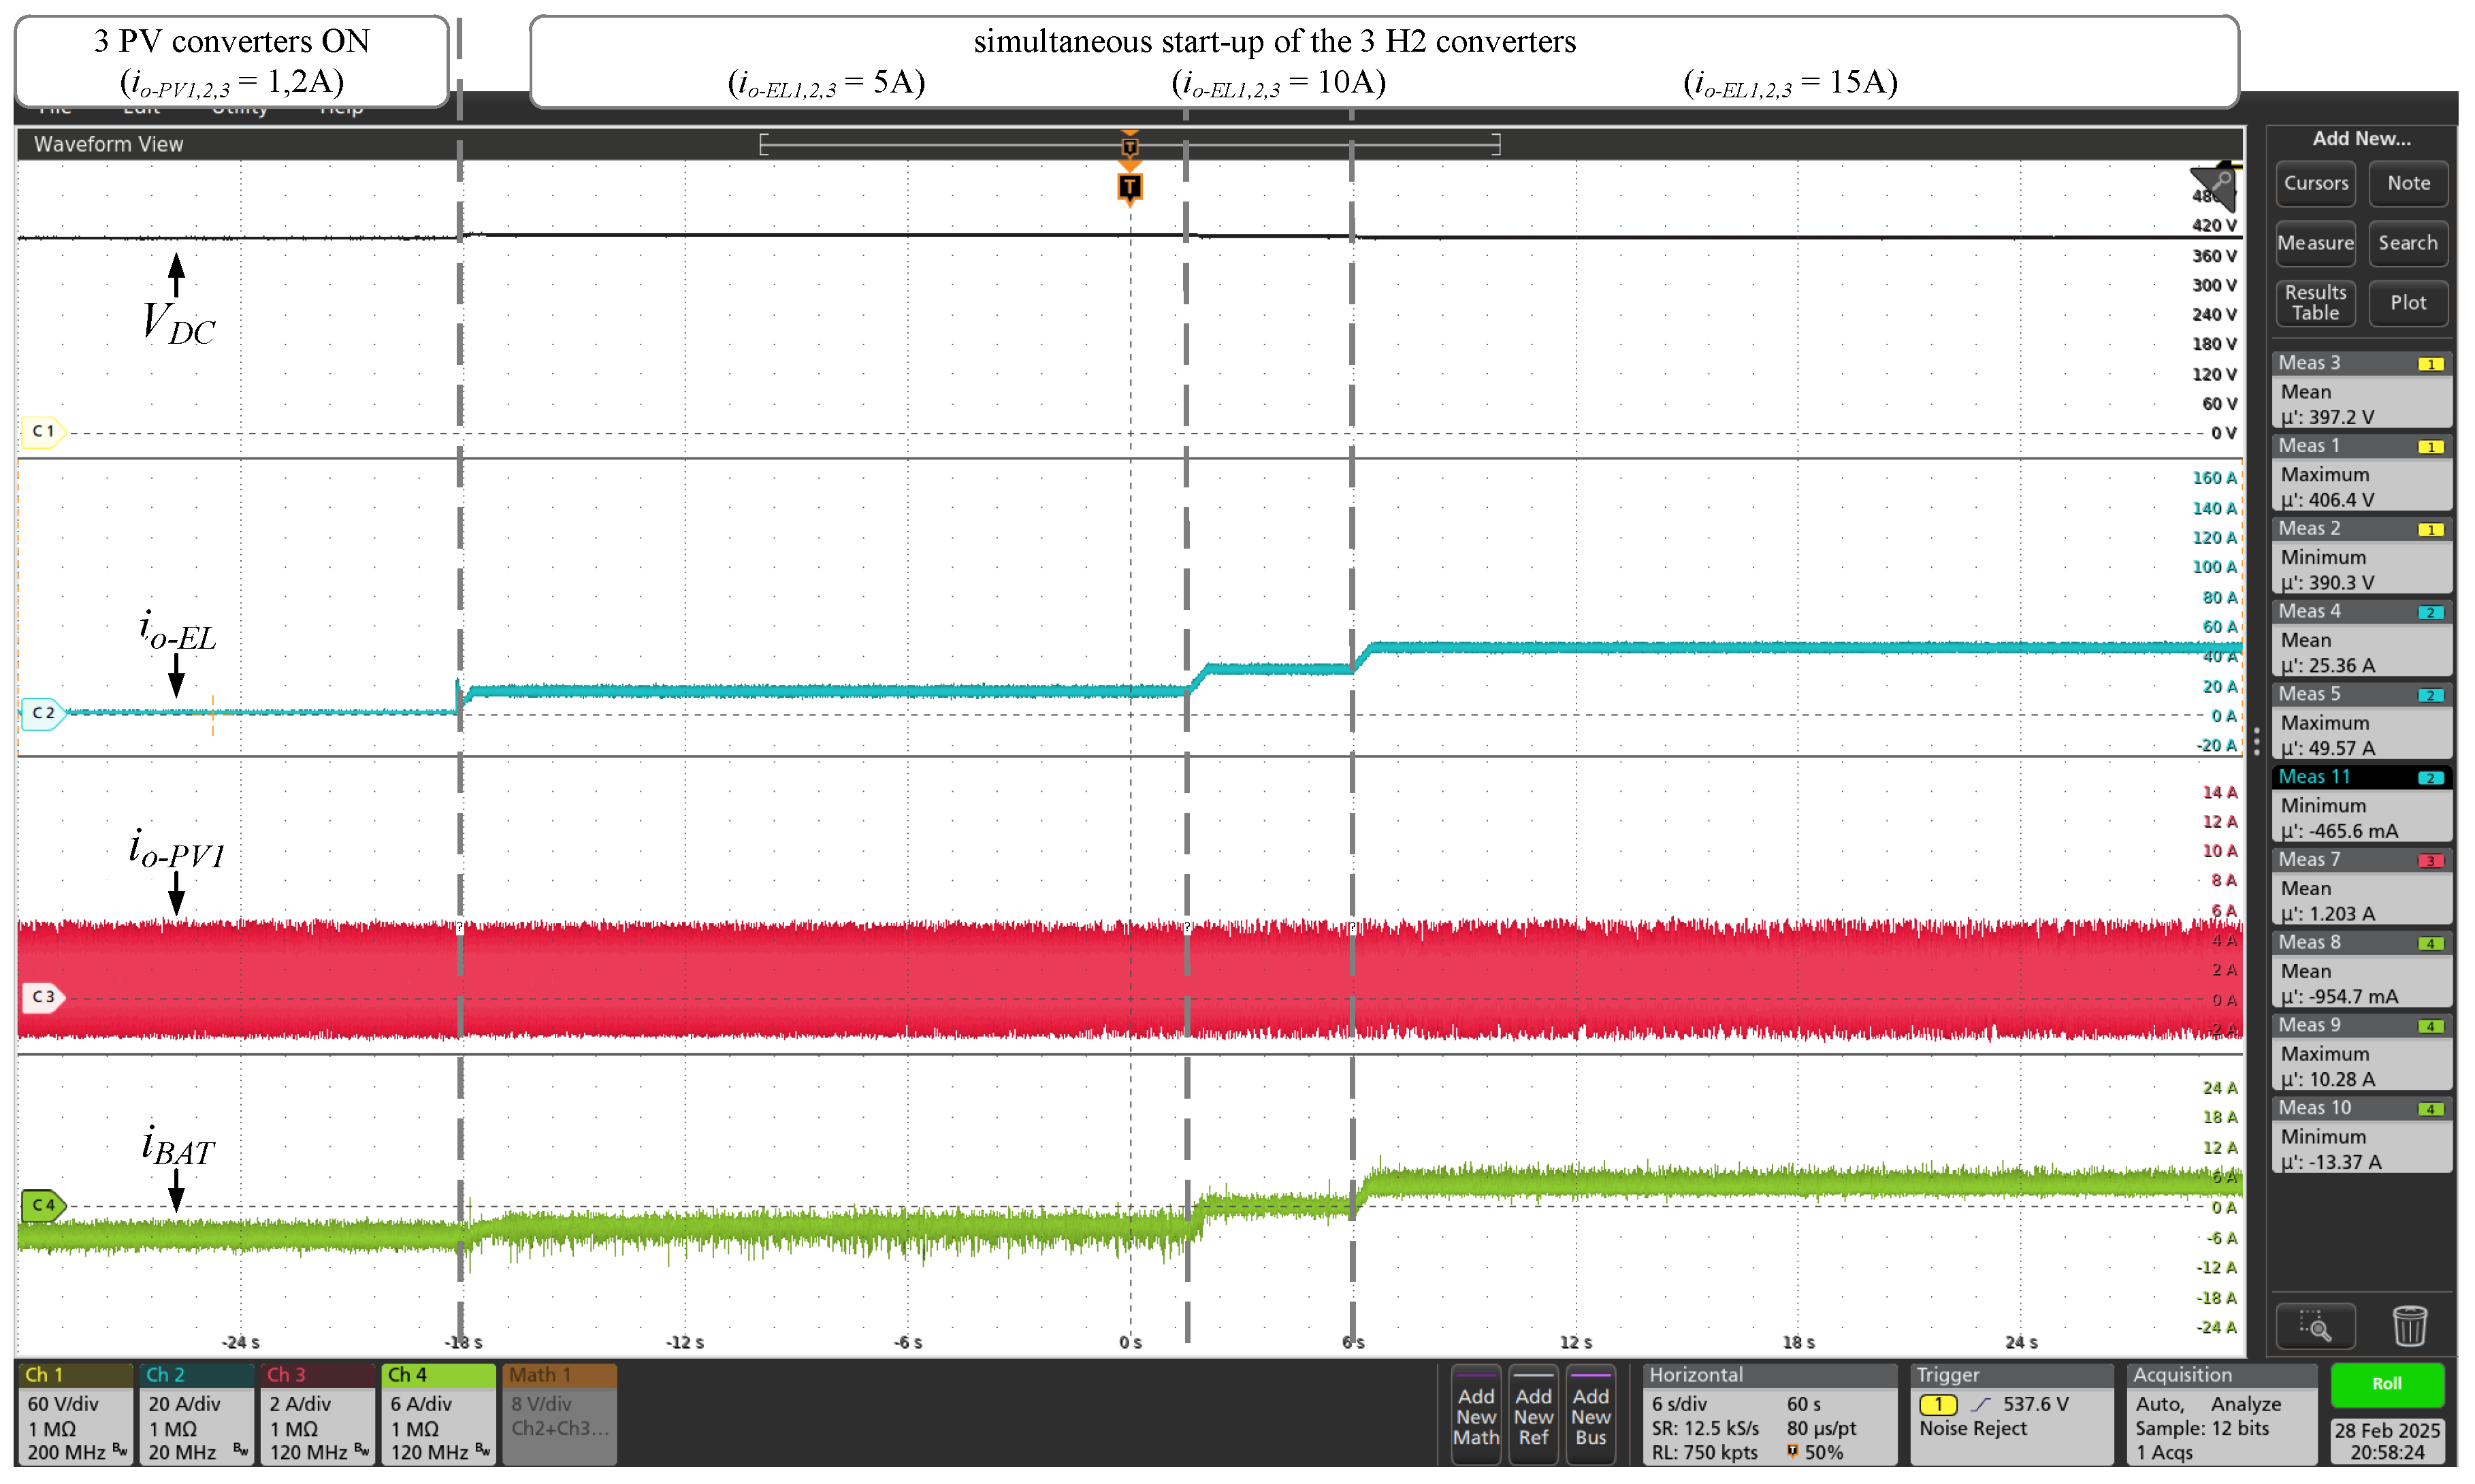
Figure 17.
Nominal operation of the electrolyzer.
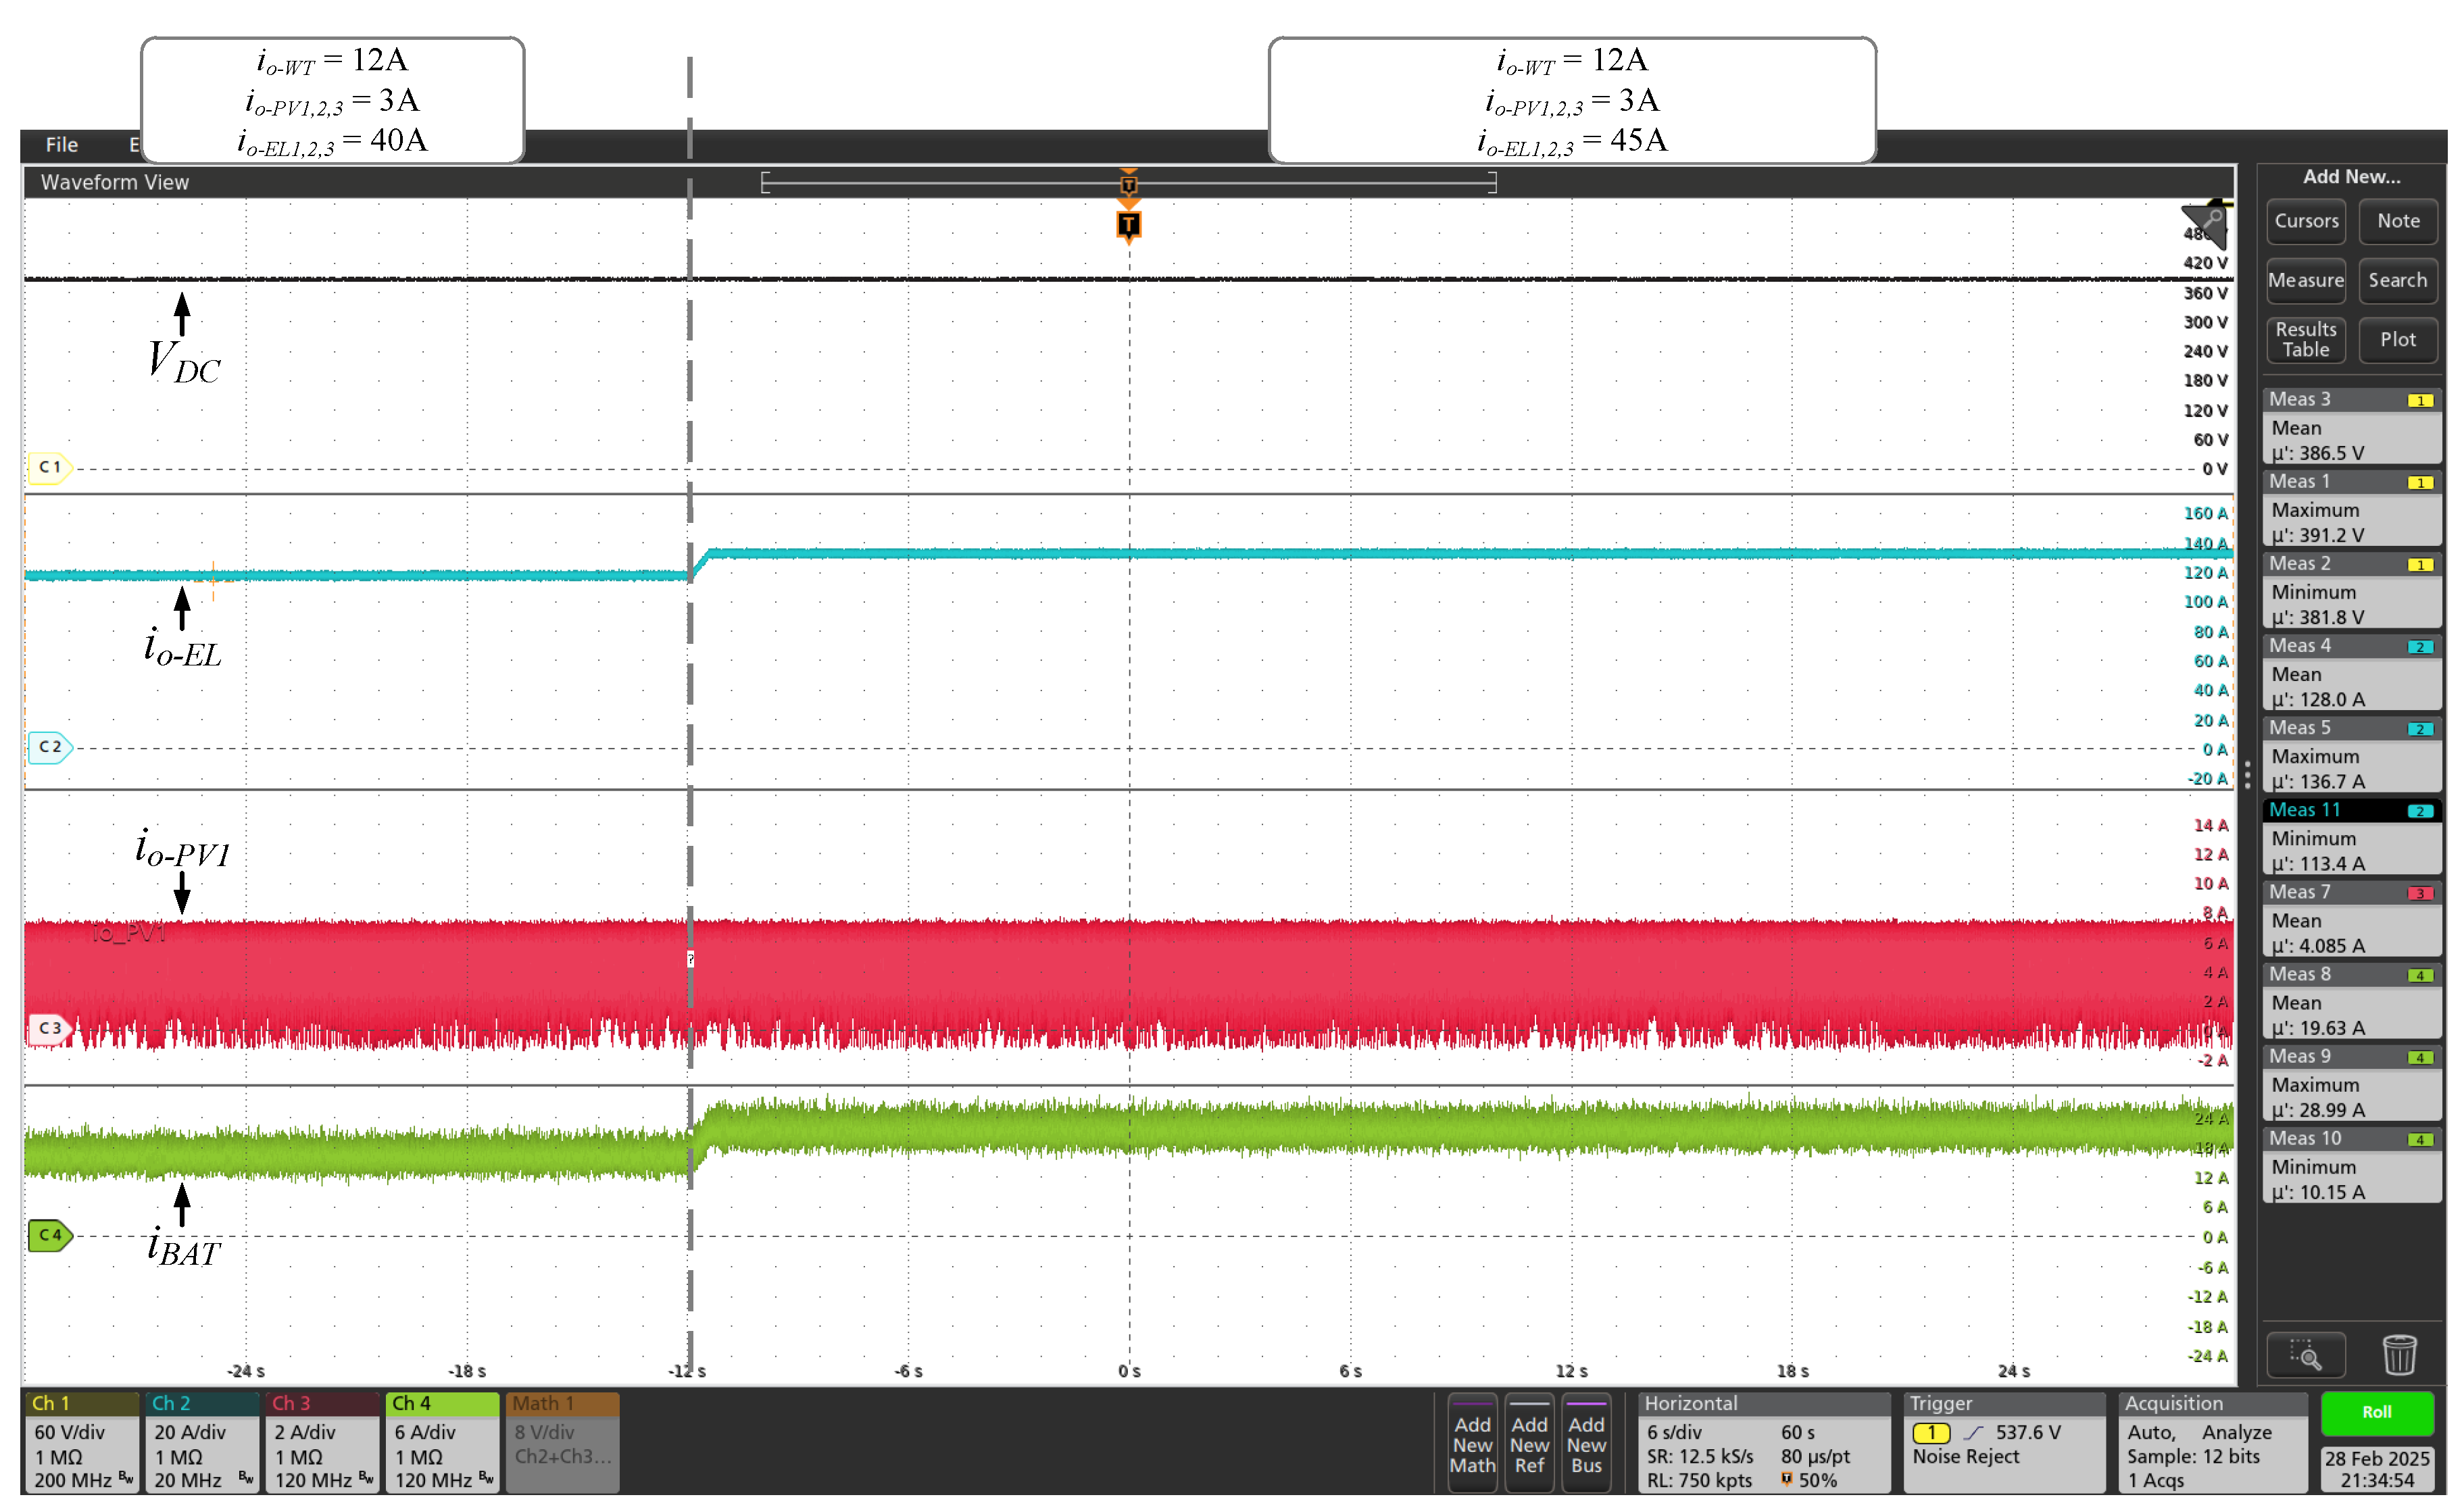
Figure 18.
Experimental tests of the DC microgrid with GH2 plant off.
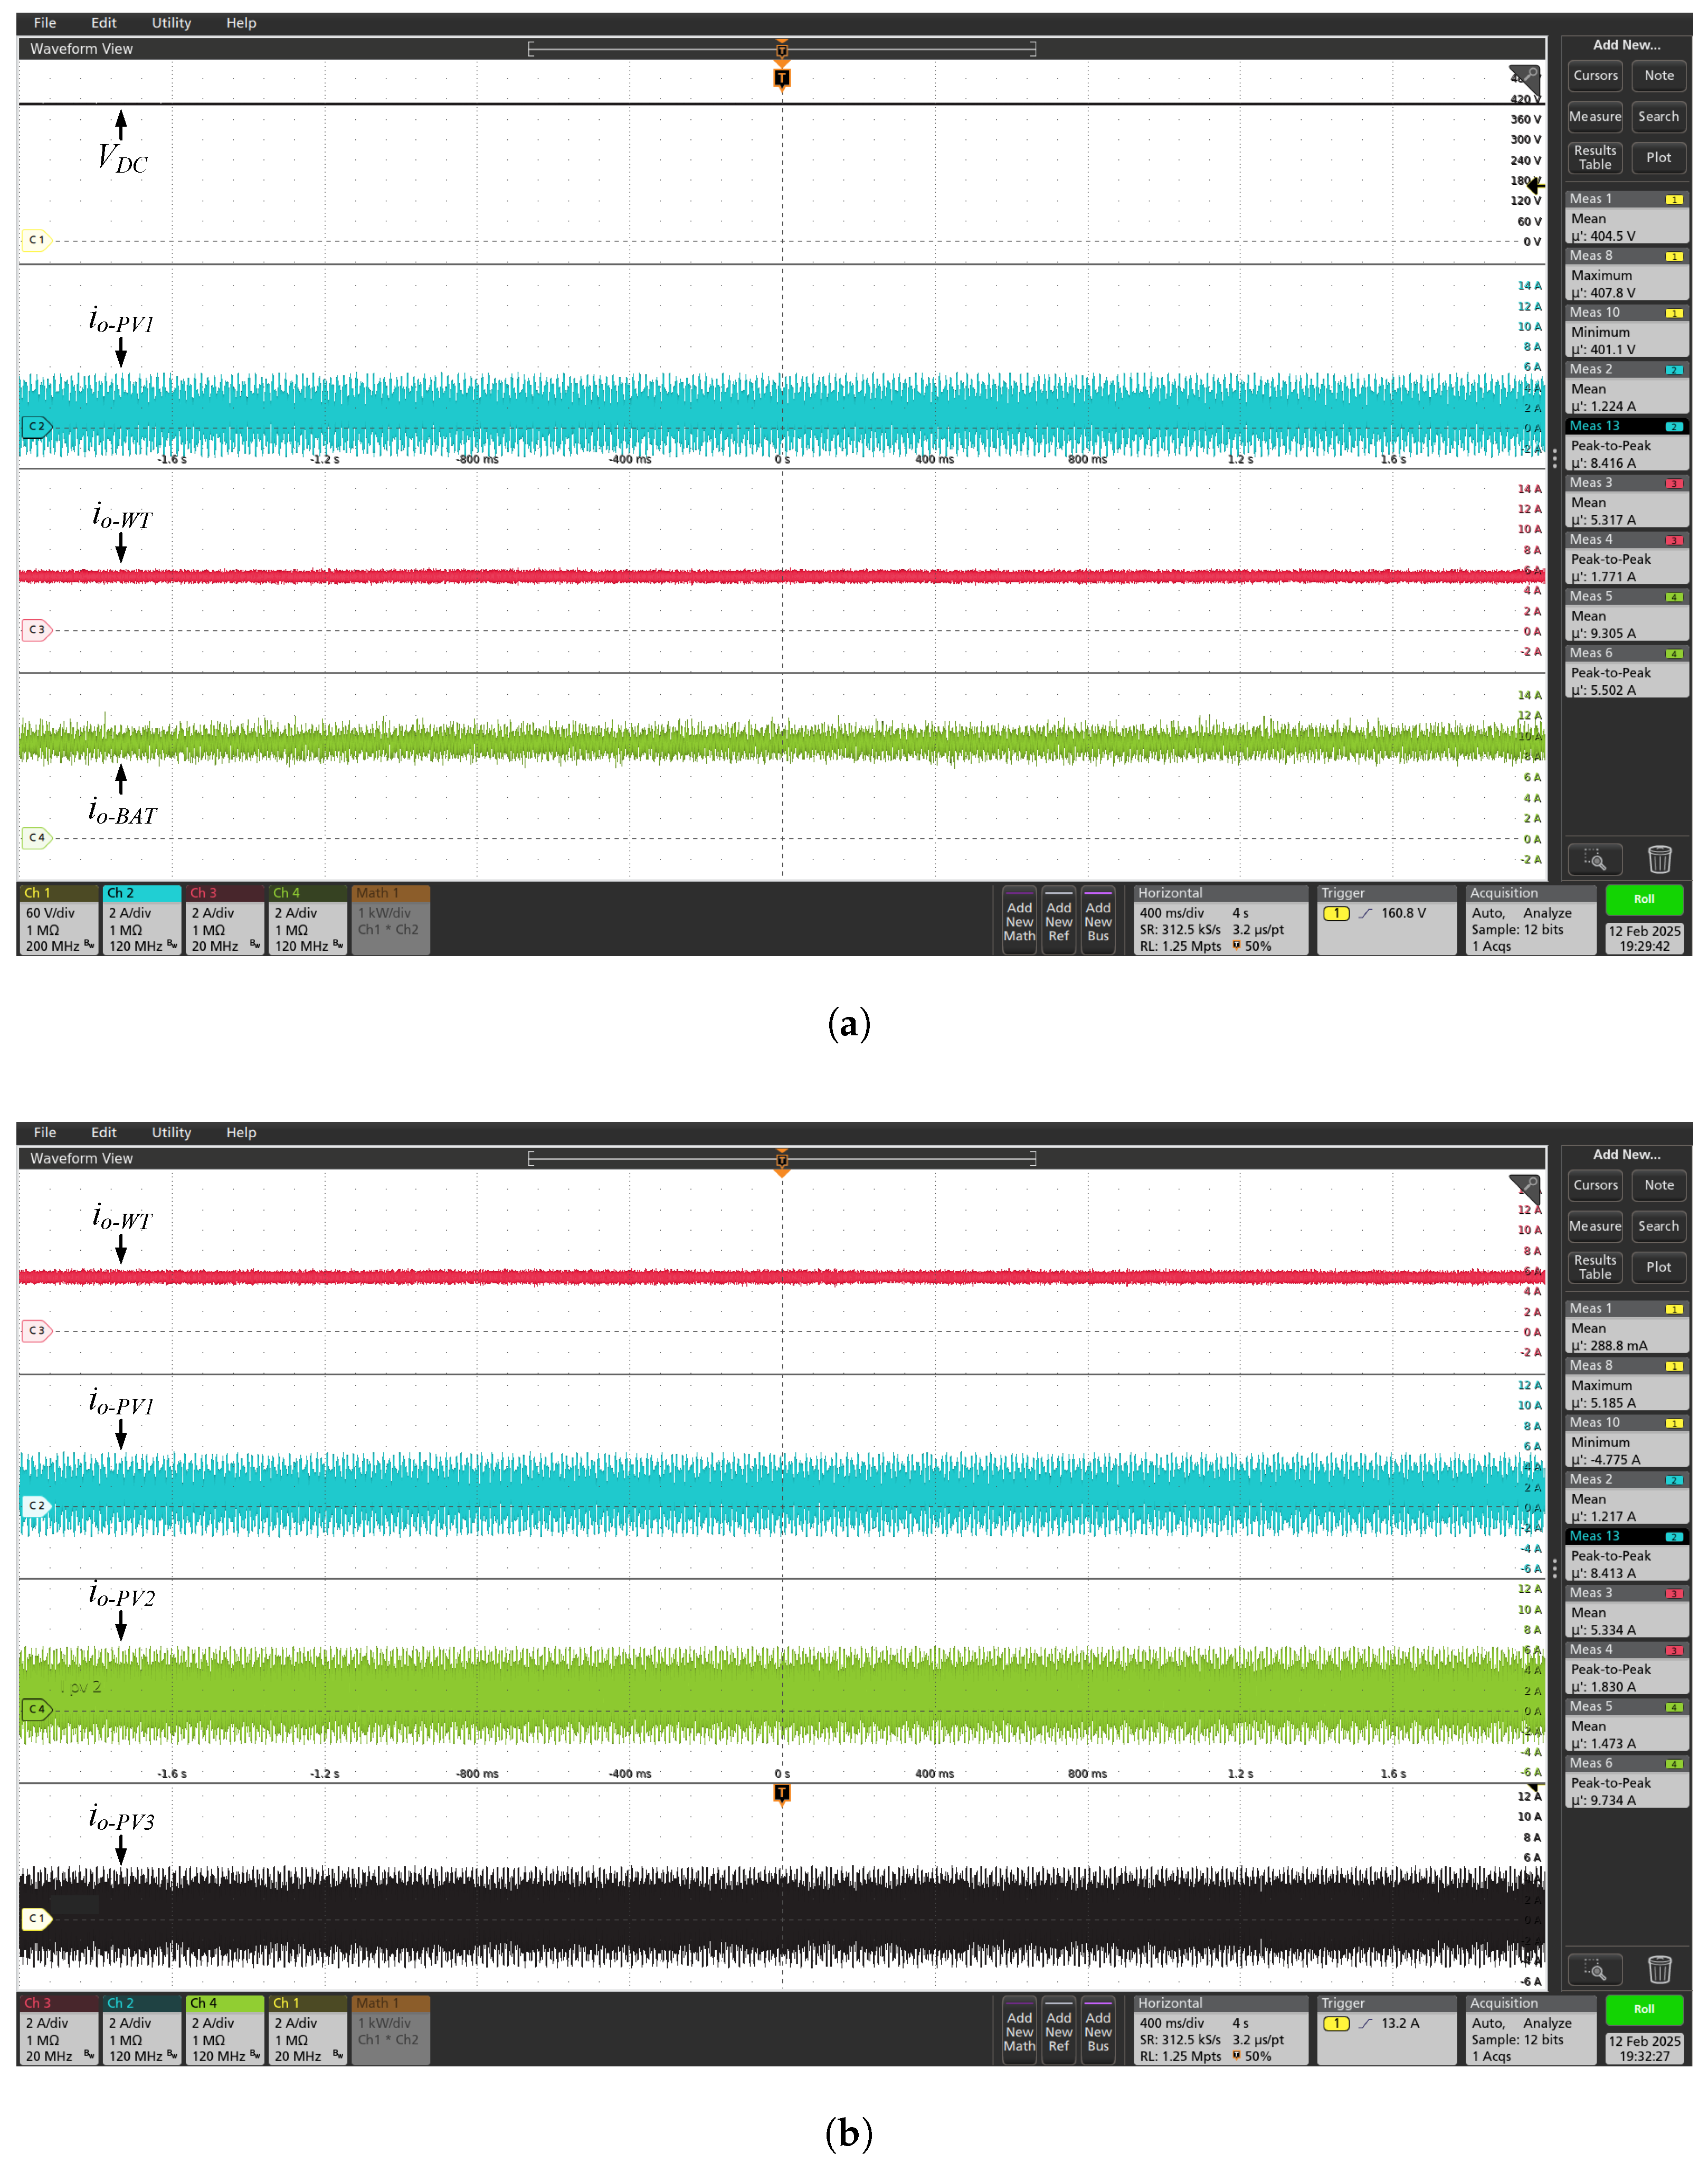

Table 1.
Legacy electrolyzer technical parameters and data
| Technical Parameter | Value |
|---|---|
| Hydrogen production rate (Nm3/h) | 10 |
| Nitrogen consumption (Nm3/op cycle) | 2 |
| Max operating pressure (bar) | 20 |
| Max operating temperature (°C) | 80 |
| Min/Max room temperature (°C) | 5/40 |
| Electrolyte and concentration (%) | KOH, 25-30 |
| Electrolyte volume (L) | 150 |
| Demineralized Water (L/h) | 10 |
| Thyristor Six-Pulse Bridge Output Current (A) | 170 |
| Thyristor Six-Pulse Bridge Output Voltage (V) | 130 |
| Optimum production power per stack - 70% power set (kW) | 17.5 |
| Maximum electrical power per stack (kW) | 25 |
| Total power of cell stacks A & B (kW) | 50 |
| DC loads (kW) | 1.1 |
| Light AC fan loads and Electrovalves (kW) | 0.1 |
| Heater loads (kW) | 1.5 |
| AC Pumps and Fans total load (kW) | 2.1 |
| Isolation Transformer Rated Power (kVA) | 75.0 |
Table 2.
Specifications of the power converter for the GH2 port.
| Parameter | Value |
|---|---|
| Input voltage | 400 |
| Maximum electrolyzer voltage | 130 |
| Minimum electrolyzer voltage | 90 |
| Maximum output power | 19.5 kW |
| Maximum output current | 150 A |
Table 3.
Specifications of the interleaved Buck for BESS.
| Parameter | Value |
|---|---|
| Battery storage capacity | 38 Ah |
| Output power | 15 kW |
| Maximum input voltage | 696 V |
| Minimum input voltage | 450 V |
| Maximum input current | 33.3 A |
| Output voltage | 400 V |
| Maximum output current | 37.5 A |
Table 4.
Specifications of the PV converter.
| Parameter | Value |
|---|---|
| PV panels per string | 16 |
| Maximum input voltage | 731 V |
| Input voltage in the MPP | 614.4 V |
| Input current in the MPP | 8.86 A |
| Output voltage | 400 V |
| Output power | 5.44 kW |
Table 5.
Specifications of the wind converter.
| Parameter | Value |
|---|---|
| Maximum input voltage | 380 Vac |
| Maximum input frequency | 50 Hz |
| Output voltage | 400 V |
| Rated output current | 26.5 A |
| Rated output power | 10.6 kW |
| Peak output power | 12.4 kW |
Table 6.
Electrolyzer power consumption comparison.
| Power Source | Powerset | |||
|---|---|---|---|---|
| Thyristor-based rectifier | 70% | 117.6 V(RMS) | 135.2 A(RMS) | 15.89 kW |
| 60% | 122 V | 89.2 A | 10.88 kW | |
| DC microgrid | 70% | 126 V | 104 A | 13.05 kW |
| 80% | 134 V | 117 A | 15.77 kW |
Disclaimer/Publisher’s Note: The statements, opinions and data contained in all publications are solely those of the individual author(s) and contributor(s) and not of MDPI and/or the editor(s). MDPI and/or the editor(s) disclaim responsibility for any injury to people or property resulting from any ideas, methods, instructions or products referred to in the content. |
© 2025 by the authors. Licensee MDPI, Basel, Switzerland. This article is an open access article distributed under the terms and conditions of the Creative Commons Attribution (CC BY) license (http://creativecommons.org/licenses/by/4.0/).
Copyright: This open access article is published under a Creative Commons CC BY 4.0 license, which permit the free download, distribution, and reuse, provided that the author and preprint are cited in any reuse.


