
Submitted:
25 June 2025
Posted:
26 June 2025
You are already at the latest version
Abstract
Aberrant protein glycosylation is a key driver of colorectal cancer (CRC) progression, contributing to tumour growth, metastasis, and immune evasion. In this study, computational approaches were employed to explore the potential of Brefeldin A (BFA) as an inhibitor of two glycosylation-associated regulatory proteins: Protein Kinase C (PrKC1) and Mitogen-Activated Protein Kinase (MAPK). Molecular docking and structural analysis revealed that BFA binds stably and specifically to the active sites of both proteins, suggesting its ability to modulate their function. Detailed interaction profiling identified key active site residues involved in hydrogen bonding, hydrophobic interactions, and van der Waals forces—further supporting the structural compatibility and specificity of BFA for these targets. The optimal binding poses observed indicate potential allosteric or competitive inhibition mechanisms, which could disrupt critical signaling pathways linked to glycosylation and tumour progression. In addition, Binding free energy estimations indicated strong interactions, with BFA-MAPK and BFA-PrKC1 complexes yielding favorable binding affinities of -22.18 ± 4.50 kcal/mol and -23.90 ± 5.36 kcal/mol, respectively. These values highlight the thermodynamic stability of the complexes and suggest a high likelihood of inhibitory activity under physiological conditions. Collectively, these findings underscore BFA’s potential as a novel inhibitor targeting glycosylation-related kinases in CRC. This work not only proposes BFA as a promising therapeutic lead but also supports glycosylation inhibition as a strategic avenue for CRC control, with broader implications for drug discovery in glycan-related oncogenic pathways.
Keywords:
Mitogen activated protein kinase
; Protein kinase C
; Brefeldin A
; Molecular
1. Introduction
Protein glycosylation is an intricate and significant post-translational modification (PTM) that controls glycoproteins' biological activities and functions [1]. This primary PTM occurs within the endoplasmic reticulum/Golgi compartment of all cells [2,3]. This process is coordinated by the actions of a series of glycosyltransferase and glycosidase enzymes that eventually produce different carbohydrate structures (glycan) [2,3,4]. In the investigation of cancer progression, pathological changes in the process of glycosylation are considered a hallmark of cancer [2,4]. Glycosylation is essential for recognition, signalling, and interaction events that occur in both inter and intra-cellular proteins; and these events have crucial structural roles being involved in the folding, conformation, trafficking, and degradation of these glycoproteins [3,5]. Additional roles played by glycosylation include but are not limited to adhesion, cell-matrix interaction, protection against proteases and immune recognition, and membrane organisation [2]. Glycans mediate fundamental molecular, cellular, tissue, organ, and systemic biological processes responsible for normal physiological functions, implicating them in numerous human diseases, including cancer [6]. Hence, slight changes in carbohydrate structure can profoundly affect cell biological processes, resulting in oncogenic transformation [2]. Changes in the glycosylation profiles of membrane proteins are typically characteristic of many cancer cell types, serving not only as potential biomarkers for cancer, but are also responsible for influencing tumorigenesis and metastasis [7]. Considering the general roles of glycosylation, it can be deduced that novel targets in the field of glycobiology like glycoforms and glycosyltransferases connected to glycans synthesis could possess potential for drug discovery.
Previous studies have suggested Protein kinase C (PrKC1) and mitogen-activated protein kinase (MAPK) to be involved in glycosylation [8,9,10,11]. PrKC1 and MAPK have been extensively reported to regulate the glycosylation process and are viable therapeutic targets. PrKC1 is a serine/threonine kinase family member essential in signal transduction [12], and plays a role in cell proliferation, differentiation, survival, invasion, migration, apoptosis, angiogenesis, and drug resistance [13]. Their significant contribution to cell signaling makes them as promising therapeutic targets for several diseases, including different types of cancer [13]. Studies have revealed that PrKC1 is essential for neoplastic transformation, carcinogenesis and tumour cell invasion; therefore, these findings have presented PrKC1 as a potential target for anticancer therapy [12]. Different cellular responses are produced by PrKC1 activation, which is responsible for the a diverse set of responses, including the expression of growth factors, activation of signaling pathways and response to oxidative stress [14]. Several obtainable catalytic and regulatory mechanisms have suggested PrKC1 possesses a plethora of potential for targeted drug design [15,16,17,18].
MAPK cascades play a crucial role in environmental signal transduction and stress induction as a means of defence responses; the signals are unfavourably regulated by specific Ser/Thr protein phosphatases of the type 2C (PP2C) and dual-specificity phosphatase (DSP) families which are responsible for stress-induced MAPKs inactivation [19]. The MAPK signaling pathways cascade comprises three kinases: extracellular signal-regulated kinase (ERK), c-Jun NH2-terminal kinase (JNK), and p38. Here, the upstream kinase (MAPKKK) responds to diverse extra and intracellular signals and further activates the middle kinase (MAPKK) via a direct phosphorylation reaction [20]. The entire process results in MAPK phosphorylation by MAPKKs, leading to physiological conditions such as cell proliferation, differentiation, survival, and death [21]. Counter actions and reactions of protein kinases and protein phosphatases, as applied in reversible protein phosphorylation, serve as one of the mechanisms exploited by MAPK to transmit stress and developmental signals at molecular levels [22,23]. Findings have suggested the dual role of MAPK in cancer growth prevailing in specific cases and circumstances [24]. An increase in the phosphorylation of MAPK has been reported to be highly associated with malignancy in particular types of cancers [25,26,27]. MAPKs can be dephosphorylated and hence inactivated by specific protein phosphatases; thus, attenuation of MAPKs can serve as an excellent therapeutic approach and can be exploited for drug discovery.
Small molecules that can inhibit glycosylation enzymes or the cellular glycosylation process have been deemed a potential drug candidate in the therapeutic advancement toward treating cancer disease [2,28]. BFA, a fungal metabolite derived from Penicillium Brefeldianum, is an inhibitor that swiftly blocks protein transport from the endoplasmic reticulum (ER) to the Golgi network. It carries out this process by affecting protein glycosylation through the prevention of COP-I assembly and access to emerging ER glycoproteins to the Golgi-located glycosylation process [2,29,30,31]. The incidence of colorectal cancer (CRC) is on the rise as the second most common malignancy worldwide, and several studies have reported on the significant contribution of MAPK and PrKC1 in the progression of CRC in patients. Therefore, this study aims to use computational techniques to investigate the silent molecular implication associated with the possibility of inhibiting MAPK and PrKC1 with BFA.
2. Materials and Methods
2.1. Identification of Target Proteins
The Chemical Entities of Biological Interest/ChEBI database (https://www.ebi.ac.uk/chebi/), associated with the European Bioinformatics Institute that provides molecular information on biologically active natural and synthetic products , was used in the preliminary stages of this study, to obtain the spatial data file (.sdf) for BFA. This file was then uploaded to the High-Throughput Docking website (https://www.cbligand.org/HTDocking/searchstruct.php) to identify proteins that may interact with BFA. The simplified molecular-input line-entry system (SMILES) file of BFA, also accessed from the ChEBI was submitted to the SwissTargetPrediction database, to detect additional protein interactors. Here, the strength of the interaction between BFA and each protein was indicated by a docking score, wherein a high score represented strong ligand/protein interaction. A stringency factor of 8 was initially employed to select prospective proteins of interest for further analysis (Table S1).
The list of putative protein targets interacting with BFA was screened for hits that may play a role in glycosylation in colorectal cancer. KEGG pathway analysis database (https://www.genome.jp/kegg/pathway.html) was initially used to identify pathways involving the identified proteins; while the KEGG Pathway Database was utilised for Gene Ontology and KEGG analyses. P<0.01 was deemed statistically significant. However, as not all the proteins discovered could be linked to a specific pathway, the WIKI pathway (https://www.wikipathways.org/index.php/WikiPathways) was employed as a secondary database to determine the pathway(s) of the remaining proteins (Table S2, S3). A literature review was then employed to determine which proteins are related to cancer, specifically colorectal cancer. The list was carefully screened, and support from literature was used to detect these targets. To validate the choice, putative protein targets were verified for their available high-quality 3D structure at the Protein Data Bank (PDB). These ligand-based techniques identified protein kinase C (PrKC1) and mitogen-activated Protein kinase (MAPK) as potential target proteins for BFA.
2.2. Computational Modelling Studies
2.2.1. Computer Hardware Used for Computational Modelling Studies
All molecular modelling studies were performed on two high-performance gaming computing units with the following configurations: the Maestro algorithm was installed in a Windows OS PC, containing an AMD RYZEN Threadripper 1950X Processor, Asus Rog Strix X399-E Gaming Ryzen AMD with 40MB of Cache Memory, 4TB drive 6GB/s 3D NAND internal SSD with 560 MB/s read, 520 MB/s write, a 4.0 GHz Precision Boost (up to 4.2 GHz) X399 chipset, Quad-Channel DDR4, motherboard, 64GB (16GB x 4) 3200 MHz DDR4 desktop gaming RAM and MSI GeForce RTX 2080 Ti 11 GB GDDR6 4352 CUDA core graphics card. The Desmond molecular dynamics simulation algorithm was installed in an Ubuntu OS PC containing an AMD Threadripper 3990X 4.3 GHz GT 1030 2 GB PRO high-performance workstation (288 MB Cache, 64x Cores, 4.3GHz Turbo) with an MSI TRX40 PRO 10G AMD Ryzen Threadripper motherboard, a GeForce RTX 2070 8GB GDDR6 graphics card a 3200MHz 64GB gaming RAM, 1TB M.2 SSD with up to 3.5 GB/s speed, and a 4TB HDD.
2.2.2. Preparation of MAPK, PrKC1 and BFA for Docking and MD Simulation
The three-dimensional structure coordinates of MAPK were extracted from the open-access digital resource, the RCSB Protein Data Bank (PCSB PDB) using a PDB ID: 3EQC. Similarly, the PrKC1 three-dimensional coordinates were extracted from this resource using a PDB ID: 6AR4. Both protein target coordinates thus obtained were subsequently submitted to the Protein Preparation Wizard module implemented in the Maestro v13.0 molecular modelling algorithm. Then, hydrogen atoms were added, zero bond orders to metals, and disulphide bonds were created. The hydrogen-bonding network was optimised by sampling the water orientation with the PROPKA algorithm at pH 7.0. The model modification was carried out by correcting bond order and removing the γ-glutamyl[s-(2-iodobenzyl) cysteinyl glycine ligand from both proteins, in addition to water molecules whose hydrogen atoms were within the range of 5 Ả. The model was refined using the OPL_2005 force field until an average RMSD value of 0.3 Å was reached. This was followed by checking the side chain's stereochemistry to ensure that an absence of significant perturbation was induced during structure preparation. Using PubChem, a database of chemical molecules' activities against their biological assays, the structure data files (SDF) belonging to BFA (CID: 5287620) were extracted. These data were then submitted to the LigPrep and Epik molecules for ligand preparation (implemented in Maestro v13.0). These tools ensured energy minimisation with the use of OPLS_2005 force field, bringing about ligand desalting, potentially generating each ligand tautomeric state at pH 7.0 ± 2. This procedure was also used to accurately predict the pKa of these states at the established pH, with the use of using the Epik module of the algorithm. Furthermore, some specific chiral centres were either varied or retained during ligand preparation, to return low-energy states of chemically sensible structures. The generated molecule of each ligand was saved separately as Maestro (.mae) files to be subsequently used for induced fit ligand docking.
2.2.3. Induced Fit Ligand Docking of BFA into PrKC1 and MAPK
A Schrödinger Maestro v13.0 algorithm implementable induced fit docking was used to predict the binding of BFA to MAPK and PrKC1 models, respectively. Since the MAPK structure is known to be a homodimer with equal subunits and dimer interphase binding site [32], the entire structure was then specified as a binding site for BFA. However, because of the tetrameric structure-forming ability of PrKC1 with two α catalytic subunits and two β regulatory subunits [30], similarly the entire structure was selected as a binding site for PrKC1. The induced fit ligand process with a ring conformational sampling was carried out using the OPLS_2005 force field with an implicit solvent model and a 2.5 kcal/mol energy barrier alongside a non-polar conformational penalty on amide bonds. The receptor and ligand scale were set at 0.5 with 20 maximum allowable poses per ligand. A post-refinement was carried out on residues within 5.0 Ả of the docked ligand using the prime refinement module algorithm (implemented in Maestro v13.0) to rank the refined protein-ligand complexes further. Subsequently, the default Glide XP setting was used for a final round of Glide docking and scoring. This was done by resubmitting the receptor structures within 30.0 kcal/mol of the minimum energy structure and re-docking each ligand into every refined low-energy receptor structure in the accompanying second docking step.
2.2.4. Molecular Dynamics (MD) Simulation Studies
The 3D- crystallographic structures of the two proteins PrKC1 (PDB ID: 6ar4) [33] and MAPK (PDB ID: 3eqc) [34] were obtained from RCSB Protein Data Bank; and PubChem was used for ligand download. Co-crystallised molecules (ions, crystallographic water), which are not required for the bioactivities of the proteins, were removed. The MODELLER algorithm integrated into the UCSF Chimera Graphic User Interface was used to fill missing residues. Maestro was used to dock BFA into the active sites of PrKC1 and MAPK, respectively. The docked conformations were visualised in Maestro and Chimera, and the top docking scores were recorded.
Molecular dynamic (MD) simulations were carried out using a GPU-enabled Desmond molecular dynamics simulation engine implemented in Maestro v13.0. The complex corresponding to the top-scoring pose for BFA in complex with MAPK and PrKC1 and the respective apo form of MAPK and PrKC1 were saved as PDB files and submitted to the Linux (Ubuntu) desktop server for the Desmond MD simulations studies. Before the MD simulation, each of the four systems for simulation (BFA: MAPK, BFA: PrKC1, apo BFA and apo-PrKC1) was built using the System Builder module implemented in the Desmond algorithm. This solvated the system using the TIP3P explicit solvent model using the OPLS_2005 force field. The BFA - ligand complex or apo - BFA was placed in an orthorhombic box (distance from the box face to the outermost protein/ligand atom was set at 10 Å, the box angle was α = β = γ = 90°).
The volume box containing the BFA-ligand or apo-BFA was minimised, and counter ions (placed at least 20 Å from each ligand) were added to neutralise the system. The system was physiologically conditioned by adding 0.15 M NaCl into the solvent box. After the solvation and ionisation phase in the explicit solvent model, the system was submitted for the molecular dynamics production phase. The MD simulation phase is divided into eight distinct stages in which the simulation parameters were specified for each stage. Stages 1-7 are the equilibration, which comprises short simulation steps, while stage 8 is the final long-range 50 ns simulation stage. The type and parameters of the solvated system were detected in stage 1. In stage 2, a 100 ps simulation was carried out using Brownian Dynamics under NVT conditions at 10 K with restraints placed on the solute-heavy atoms. Stage 3 involved a 12 ps simulation under NVT conditions at 10 K with restraints on heavy atoms. Stages 4, 6, and 7 (the pocket solvation in stage 5 was skipped) used short simulation steps (12, 12 and 24 ps, respectively) under NPT conditions (at 10 K and restraints on heavy atoms for stages 4 and 6). Stages 4, 6, and 7 (the pocket solvation in stage 5 was passed over) used short simulation steps (12, 12 and 24 ps, respectively) under NPT conditions (at 10 K and restraints on heavy atoms for stages 4 and 6). No restraints were placed on heavy atoms at stage 7. The final MD production stage at a constant temperature of 300 K was carried out at stage 8.
2.2.5. Post-Dynamic Analysis
The molecular dynamics simulation studies derived trajectories were viewed relative to post-dynamic analysis using Schrodinger Maestro v13.0 or the Bio-3D R-Statistical package for comparative analysis of protein structures. Succinctly put, both the simulation quality and the alpha carbon atoms' root-mean-square-deviation (RMSD) alongside the ligand with the receptor's RMSD were assessed. In addition, the residue's root-mean-square-fluctuations (RMSF), secondary structures element analysis, and protein-ligand interaction analysis were carried out using the Simulation Interaction Diagram algorithm (implemented in Maestro v13.0). The radius of gyration (Rg) and atomic distance calculations were determined using the Simulation Events Analysis algorithm (also implemented in Maestro v13.0).
2.2.6. MM/GBSA Free Binding Energy Calculation
Topology and parameter file generation for the complexes were performed using the LEAP module, and counter ions were added at a constant pH with the LEAP module to neutralise the system. The systems were finally solvated in a 10 Å TIP3P water box. The systems were first partially minimised for 2500 steps using a 500 kcal/mol Å restraint potential, followed by complete minimisation for 5000 steps, without energy restraints. Langevin thermostat [35]and a harmonic restraint of 5 kcal/mol Å2 gradually heated the systems from 0 to 300 K in an NPT canonical ensemble for 50 ps. System equilibration was performed at 300 K for 1000 ps without energy restraint, while the Berendsen barostat was used to maintain atmospheric pressure at 1 bar. A production MD run was performed for 25 ns, whereas the SHAKE algorithm was used to restrain all atomic hydrogen bonds. The resulting trajectories were analysed using integrated CPPTRAJ and PTRAJ modules, and coordinates were obtained at every 1 ps, while data were plotted and analysed using the Origin data analytical tool [36]. In addition, 3D structural visualisation and analyses were carried out on the GUI of UCSF Chimera.
2.2.7. Thermodynamic Binding Free Energy (BFE) Calculation
Thermodynamic Binding Free Energy (BFE) Calculation is a method to probe the thermodynamic binding affinities of the various complexes, considering both the enthalpic and entropic contributions. The Molecular Mechanics/Poisson-Boltzmann Surface Area (MM/PBSA) method was employed to estimate small therapeutic molecules' binding interaction free energy with biological macromolecules. This study computed the binding interaction free energy from the last 250 ns trajectory. Mathematically, binding free energy is represented by the following equation;
ΔGbind = Gcomplex− Greceptor− Gligand
Egas = Eint + Evdw + Eele
Gsol + GPB + GSA
GSA + γSASA
From the above equation, Egas correlates with the gas-phase energy, whereas Eint denotes the internal energy. Coulomb and Van der Waals energies are denoted with Eele and Evdw, respectively. In addition, Gsol is the free energy of solvation, whereas the polar solvation contribution is represented as GPB. On the other hand, GSA is the non-polar contribution, which is estimated by the solvent accessible surface area (SASA) determined by using a water probe of radius 1.4 Å with a surface tension constant, γ of 0.0072 kcal/(mol·Å2). Per residue decomposition, analysis was also carried out to obtain the different energies each binding site residue added to ligand affinity and stabilisation.
2.3. Molecular Dynamics Data Analyis of PrKC1 and MAPK
Principal Component Analysis (PCA) was applied to evaluate the structural dynamics of PrKC1 and MAPK proteins, both in their apo state and under Brefeldin A treatment. The analysis involved parameters such as Cα RMSD, Cα RMSF, and RoG. This study utilised R Studio (Posit Software, PBC Version 2023.09.1+494) and the ggfortify package [37,38], where the apo form is depicted in black and the Brefeldin A-treated form in pink. The PCA enabled a detailed examination of structural alterations prompted by Brefeldin A, offering valuable insights into the dynamic responses of the protein.
3. Results
3.1. Screening Glycosylation Targets
The SMILES (Simplified Molecular Input Line Entry System) chemical structure of BFA was utilised in Swiss Target protein prediction to identify potential biological targets. The Canonical SMILES structure of BFA was obtained from the PubChem database, and this standardised format could hen serve as input the for various computational tools for target prediction. This process allowed for systematically evaluating the binding affinity of BFA to various proteins. Table 1 details proteins that we identified as being potential targets for further study and drug development using SwissTargetPredict.

Table 1.
Potential Target Proteins for BFA.
| BFA targets | Known actives (3D/2D) |
| CYP19A1 (Cytochrome P450 Family 19 Subfamily A Member 1) | 55/ 69 |
| ATP12A (ATPase H+/K+ Transporting Non-Gastric Alpha2 Subunit) | 03/ 10 |
| RPS6KA5 (Ribosomal Protein S6 Kinase A5) | 04/ 03 |
| AR (Androgen Receptor) | 163 / 56 |
| *PRKCA (Protein Kinase C Alpha) | 49/ 203 |
| PDCD4 (Programmed Cell Death Protein 4) | 0/8 |
| PGR (Progesterone Receptor) | 31/ 40 |
| TAS2R31 (Taste Receptor Type 2 Member 31) | 0/1 |
| PSEN2 (Presenilin 2) | 66/ 0 |
| PPARG- (Perioxisome Proliferator-Activated Receptor Gamma) | 12/10 |
| JAK1 (Janus Kinase 1) | 112/ 0 |
| CDC25A (Cyclin-Dependent Kinase 2) | 8/ 15 |
| PDE10A (Phosphodiesterase 10A) | 201/ 0 |
| MAPK14 (Mitogen-Activated Protein Kinase Kinase 14) | 118/ 0 |
| *MAP2K1 (Mitogen-Activated Protein Kinase Kinase 1) | 133/ 0 |
* Two target proteins of interest, PRKCA and MAP2K1, were identified as potential protein targets through manual curation, and are indicated in the table above.
Swiss Protein Predict is an in-silico protein target prediction software that helps identify potential protein targets for a given compound by analysing the compound's structure and evaluating its interactions with proteins. Table 1 illustrates the protein targets for BFA and their respective known actives in 3D and 2D, as the Swiss Protein Predict tool predicted. Known actives in 3D and 2D provide insight into the potential interactions and binding affinities between BFA and the protein targets. A higher number of known actives suggests that the compound may have a stronger affinity for the specific protein target and, thus, a higher likelihood of modulating its function [39].
Two proteins of interest were identified as potential targets through manual curation, and PRKCA and MAP2K1 were selected, with KEGG pathway analysis showing their involvement in various cellular signalling pathways that regulate essential processes, such as pathways in cancer, proteoglycans in cancer, MAPK signalling, and AGE-RAGE signalling pathways, to name a few. Some of the critical pathways to note are shown in Table 2. The genes highlighted in yellow are the specific genes of interest which were further investigated.
3.2. Structural Evaluation of Ligand-Induced Protein Conformational Alteration
RMSD and RMSF were employed here to gain insight into the structural variations occurring in the 3D structures of the proteins during the 250 ns MD simulation. The RMSD plot examines the structural deviations of the secondary structure of the proteins from the native state, wherein a decrease in RMSD value suggests structural stability, while the reverse is the case when the RMSD is high [40,41,42]. From the plot in Figure 1A, it can be noticed that the trajectories of both the apo and BFA bound MAPK exhibited similar trajectory patterns at the start of the MD simulation down to the 50ns of the MD simulation. After this point, the two trajectories diverged laterally, with the BFA bound MAPK moving upwards while the apo form tilted slightly downwards. Notably, the two trajectories maintained a horizontal plot from 75 ns down towards the end of the MD simulation, where the BFA bound MAPK appeared to move downwards to meet the apo trajectory. The estimated average RMSD of the BFA bound MAPK is 3.55±0.58 Å, and that of the apo is 2.88±0.31 Å.
Considering the conformational pattern exhibited by PrKC1, the trajectory shows that the binding of BFA increased the RMSD of BFA bound PrKC1 since the trajectory of BFA bound PrKC1 deviated upwards above that the apo with a short-lived fluctuation (Figure 1C). The estimated mean RMSD for the BFA bound PrKC1 is 2.70±0.40Å, while that of the apo is 2.12±0.13Å (Figure 1C).
- The RMSF plots of the bound MAPK and PrKC1 show trajectory patterns quite similar to the apo (Figure 1B and 1D). As their fluctuation pattern is quite close to that of their corresponding apo, differences relative to the apo thus can’t be made. The estimated mean RMSF of MAPK is 1.44±1.02Å, while that of the apo is 1.33±0.99Å. In the case of PrKC1, the mean RMSF is 1.47±0.80Å for the BFA-bound PrKC1, while the apo form is 1.24±0.55Å.
3.3. Molecular Docking and Binding Site Visualization of BFA with MAPK and PrKC1
The docking analysis revealed stable and specific binding of Brefeldin A (BFA) to both MAPK and PrKC1, as illustrated in Figure 2. In the case of MAPK (Figure 2A and Figure 2B), BFA occupied distinct binding pockets within the kinase domain. The cartoon representation (2A) highlights the alignment of BFA within a cleft formed by α-helices and β-sheets, while the surface representation (2B) shows that BFA is well-embedded within the protein’s topology, suggesting favourable interaction and structural compatibility.
For PrKC1 (Figure 2C and Figure 2D), BFA demonstrated multiple binding poses, with key residues surrounding the ligand in structurally supportive orientations. The cartoon model (2C) shows BFA binding within deep grooves and interaction hotspots, while the surface representation (2D) confirms that these conformations are physically accessible and well-fitted within the PrKC1 surface landscape. These observations support the hypothesis that BFA can form stable, non-covalent interactions with both kinases, potentially interfering with their activity by occupying critical regulatory or catalytic domains.
3.4. Time-Based BFA-Induced Structural Mobility
The Rg reflects the overall compactness and stability of a protein structure over time during MD simulations. A lower Rg value typically indicates a more compact and stable protein conformation, while a higher Rg suggests increased flexibility or structural instability [40,41,42]. As shown in Figure 3, the Rg trajectories of the BFA-bound MAPK and its apo form followed a similar pattern, with no substantial differences observed. The mean Rg for the BFA–MAPK complex was 20.09 ± 0.48 Å, closely comparable to the apo MAPK value of 20.02 ± 0.42 Å, indicating minimal conformational disruption upon ligand binding.
In contrast, a marked difference was observed in the PrKC1 simulations. The BFA-bound PrKC1 displayed a significantly higher Rg value (18.06 ± 1.15 Å) compared to the apo form (12.42 ± 0.09 Å), suggesting that ligand binding led to a less compact and potentially more flexible protein structure. This result implies that BFA may induce conformational changes in PrKC1 that alter its structural rigidity, possibly impacting its functional dynamics.
3.5. Structural Investigation of BFA Dynamics Across the MD Simulation Timeline
The conformational behaviour of BFA at the binding pockets of MAPK and PrKC1 is represented in Figure 4. The ligand RMSD plot shows that BFA bound quite stably at the respective pockets of MAPK and PrKC1, as the trajectory pattern exhibited a consistent horizontal dynamic from approximately the beginning of the MD simulation to the end (Figure 4A). However, notably, there was a wide flip of the trajectory of PrKC1 from 210ns to 230ns of the MD simulation, before returning to its initial trajectory pattern. The estimated mean ligand RMSD for MAPK was 3.69±0.43Å, while that of PrKC1 was 6.52±2.04Å.
Molecular surface area (MSA) shows BFA consistently maintained a similar interaction pattern with MAPK and PrKC1 throughout the MD simulation (Figure 4B). MSA is a quantitative method of calculating the level of interaction established between the ligand and the protein molecular environment. Previous studies have deduced that the higher the MSA, the more stable the system, while the reverse holds when the MSA is low [40]. The estimated mean MSA of BFA-bound MAPK was 272.56±1.79Å2 while that of the BFA-bound PrKC1 was 272.59±1.93Å2.
The SASA plot shared similarities in trajectory patterns with the ligand RMSD plot (Figure 4C). It quantitatively describes the binding dynamics of BFA within the hydrophobic core of MAPK and PrKC1. The measurement represented here is the SASA of the ligand, as previous studies have suggested that a hydrophobic environment promotes molecular recognition and targeting (Aloke, Iwuchukwu and Achilonu, 2023). An observation that can be made from the plot is that the trajectory maintained a seemingly horizontal trajectory from the beginning to the endpoint of the MD simulation. However, a sudden flip occurred between 210ns and 230ns of the MD simulation before the trajectory (Figure 4C) assumed the initial pattern, similar to what was observed in the ligand RMSD plot. The estimated mean SASA for MAPK was 46.17±16.67 Å2 while that of PrKC1 was 187.07±43.35 Å2.
3.5. Medium-Based Visualisation of BFA Interaction with Binding Site Residues
Figure 6 presents a comparative 2D interaction diagram of the binding of BFA with MAPK /PrKC1 both in solvent (MD simulation) and no solvent medium (docking). BFA in complex with MAPK/PrKC1 in the solvent medium is represented in Figure 6B & D, while BFA in complex with MAPK/PrKC1 in non-solvent medium is represented in Figure 6A& C.
A look at the average PDB, which expresses at a glance the precise/summary of the conformational interaction state assumed by the BFA complexes to produce the needed interaction leading to the needed functional activities (Figure 7). Here, hydrogen bond interaction is employed as a parameter to predict crucial active site residues necessary for BFA's binding stabilisation and molecular recognition. From the presented images, it can be seen that Leu74 and Met146 played prominent roles in the binding stabilisation of BFA on MAPK, with average PDBs of 40% for Leu74 and 30% for Met146 (Figs. 7A). It is equally important to note the presence of bulk water (H2O) making a 40% linkage between Leu74 and OH of BFA. In the case of BFA bound to PrKC1, Gln30, Asn31, Gly34, Ile35 and Ile37 produced average PDBs of 40%, 68%, 61% 62% and 77%, respectively to the binding stabilization of BFA with PrKC1. It is important to equally note the presence of bulk water contributing 61% and 62% to interactions with Gly34 and Ile34, respectively.
3.6. Evaluation of Structural Properties Contributing to Binding Interactions
The stacked bar charts in Figure 8 indicate that water bridges, van der Waals and H-bonds established the binding contacts and complex stabilisation. Quantitative analysis of the binding interactions and dynamics equally revealed the electrostatic energy contribution to the total energy for the binding stabilisation to have been established by Ala76, Gly77, Asn78, Lys97, Asp162, Asp208 in the case of BFA binding to MAPK (see Fig 9). On the other hand, when considering the binding of BFA to PrKC1, the plot shows that Asn31, Leu32, Ile33, Gly34, Ser36, Ile37 and Lys83 contribute to the total energy of the binding stabilisation. Hence, it can be inferred that the roles played by the identified parameters contributed immensely to the binding stabilisation of BFA to both MAPK and PrKC1.
3.7. Quantification Thermodynamic Evaluation of Binding Affinity
MMGBSA was used to investigate the free energy of binding of BFA to MAPK/PrKC1, which has been tabulated in Table 1. This analysis indicates the favourability of the binding interactions of BFA to MAPK/PrKC1. The table shows that the estimated ∆Gbind for the binding of BFA to MAPK was -22.18±4.50Kcal/mol, while that of PrKC1 was -23.9±5.36 Kcal/mol.
Table 1.
Estimated binding energy predictions of BFA complexes.
| Compounds | Energy components (kcal/mol) | ||||
| ∆Evdw | ∆Eele | ∆Ggas | ∆Gsol | ∆Gbind | |
| MAPK _ BFA | -28.23±3.24 | -11.91±7.52 | -40.14±9.14 | 17.97±5.65 | -22.18±4.50 |
| PrKC1_BFA | -27.44±3.89 | -6.31±8.66 | -33.75±10.19 | 9.81±5.82 | -23.9±5.36 |
3.8. Molecular Dynamics Data Analyis of PrKC1 and MAPK
Principal Component Analysis (PCA) of the PrKC1 protein, focusing on Cα RMSD, Cα RMSF, and RoG parameters, reveals significant structural and dynamic modifications upon Brefeldin A treatment. The PCA plot for Cα RMSD (Figure 10A) differentiates the native apo conformation (black) from the Brefeldin A-treated conformation (pink), highlighting substantial conformational rearrangements. Principal Component 1 (PC1) explains 62.10 % of the variance, while Principal Component 2 (PC2) accounts for 37.90 %, emphasising the structural perturbations induced by Brefeldin A. In the PCA plot for Cα RMSF (Figure 10B), we observe partial overlap but also distinct shifts between the apo form (black) and the Brefeldin A-treated form (pink). PC1 captures 87.4 % of the variance, with PC2 explaining 12.6 %. These changes suggest enhanced flexibility in certain regions of the protein as a consequence of Brefeldin A treatment. Finally, the PCA plot for Radius of Gyration (RoG) (Figure 10C) demonstrates clear clustering differences between the apo form (black) and the Brefeldin A-treated form (pink). PC1 accounts for 50.9 % of the variance, while PC2 explains 49.1 %, indicating notable alterations in protein compactness and overall tertiary structure following Brefeldin A treatment.
The Principal Component Analysis (PCA) of the MAPK protein reveals significant structural and dynamic changes upon Brefeldin A treatment. The PCA plot of Cα RMSD data (Figure 11A) demonstrates a clear separation between the apo form (black) and the Brefeldin A-treated form (pink), indicating substantial conformational alterations, with PC1 capturing 87.0 % of the variance and PC2 accounting for 13.0 %. In the PCA plot of Cα RMSF data (Figure 11B), distinct clustering with some overlap is observed between the apo and treated forms, suggesting that Brefeldin A treatment induces changes in the flexibility of specific protein regions; PC1 explains 88.4 % of the variance, while PC2 accounts for 11.6 %. Lastly, the PCA plot of RoG data (Figure 11C) shows clear clustering differences, indicating significant variations in protein compactness and overall tertiary structure due to Brefeldin A treatment, with PC1 and PC2 accounting for 52.40 % and 47.60 % of the variance, respectively.
4. Discussion
A study by Liu et al. (2017) found a connection between glycosylation and the Ras/Raf/MAPK signalling pathway in carcinoma (HCC) cells treated with sorafenib, a multikinase inhibitor. The treatment of HCC cells with sorafenib resulted in modifications to protein glycosylation. Additionally, changes were observed in how glycoproteins bind to lectins following sorafenib treatment. These alterations in glycosylation profiles indicated that sorafenib impacted the Ras/Raf/MAPK signalling pathways [43]. By inhibiting these pathways in HCC cells, sorafenib decreased the expression of Ets 1 (erythroblastosis 26) associated with protein glycosylation. The suppression of Ets 1 expression after sorafenib treatment suggests a relationship between this signalling pathway and glycosylation processes within HCC cells [43]. Furthermore, the study proposes that influencing the sorafenib's Ras/Raf/MAPK signalling pathway indirectly affects protein glycosylation patterns in HCC cells, potentially impacting cancer progression. Their research highlighted the interaction between signal transduction pathways and post-translational modifications like glycosylation in cancer cells [43].
The identification of probable protein targets for Brefeldin A using Swiss Protein Predict led to the identification of numerous probable targets. By combining the Swiss Protein Predict results with further computational and experimental analyses, we can gain valuable insights into the molecular mechanisms underlying BFA's effects on cancer cells. This knowledge will ultimately contribute to developing more effective therapeutic strategies targeting colorectal cancer and potentially other types of cancer. This led to the identification of two proteins of interest.
Protein kinase A (PKA) plays a role in the hexosamine pathway (HP), a metabolic pathway that produces uridine 5' diphospho-N-acetyl-D glucosamine (UDP GlcNAc) an important building block for glycosylation processes. The activity of glutamine fructose-6-phosphate amidotransferase-1 (GFAT-1) is controlled by feedback inhibition and phosphorylation mediated by UDP GlcNAc and PKA. PKA is considered an enzyme in the hexosamine pathway. In human GFAT-1, phosphorylation takes place precisely at the Ser205 site. Has been found to impact the interactions between domains of GFAT 1 that regulate its catalytic activity. Notably, Ser205 phosphorylation has two effects; it lowers GFAT 1s baseline activity while also eliminating UDP GlcNAc feedback inhibition, thus affecting the hexosamine pathway by disrupting GFAT 1s metabolic feedback loop [44]. The effect of PKA phosphorylation at Ser205 and Ser235 on GFAT-1 activity has been debated, with reports on whether these modifications enhance or diminish GFAT-1 activity.
Nonetheless, PKA-mediated phosphorylation at Ser205 plays a role, in regulating GFAT-1. The research uncovered a mutation called GFAT-1 R203H with a gain-of-function effect. This mutation interferes with UDP-GlcNAc inhibition and PKA-dependent phosphorylation at Ser205. As a result, it reduces the activity of GFAT-1 and inhibits UDP GlcNAc. This finding indicates that the phosphorylation at Ser205 by PKA plays a role in regulating GFAT-1 activity and feedback inhibition. Consequently, this phosphorylation serves as a mechanism for controlling the hexosamine pathway. In turn, mammalian glycosylation processes [44].
In another study focused on neuroblastoma (NB) cells, researchers examined the involvement of phosphoinositide 3 kinase (PI3K) in glycosylation and the distribution of molecules affecting NB cell properties. The study highlights explicitly how changes in NB cell properties are influenced by the status of glycosylation and molecule localisation through the PI3K/ PKC pathways. It demonstrates that both PI3K and PKC play a role in regulating glycosylation processes that impact cell behaviour, in neuroblastoma [45].
The role of MAPKs in glycosylation has been studied in the yeast Saccharomyces cerevisiae. The focus was on the high osmolarity glycerol (HOG) and filamentous growth (FG) pathways. These pathways employ MAPKs, such as Hog1 in the HOG pathway and Kss1 in the FG pathway. Each MAPK responds to stimuli and plays distinct roles in the yeasts' response to environmental conditions. During the study, researchers discovered two mutants called mnn10 and mnn11, which showed activation of Kss1, an important MAPK involved in the FG pathway. These mutants lacked MNN10 and MNN11 genes that encode for mannosyl transferase enzymes, critical Golgi apparatus, and N-glycosylation machinery components. Deleting these genes resulted in the production of N glycosylated proteins with shorter mannan chains. The findings highlight the significance of N glycosylation for maintaining accurate MAPK signalling, mainly to prevent cross-activation between different MAPK pathways. Additionally, researchers identified an N glycosylation site on Msb2 (Asn 30), which, when mutated, led to the activation of Kss1 similar to what was observed in the mnn11 mutant phenotype. This finding also highlights the significance of N-glycosylation in regulating MAPK signalling for Msb2, a crucial regulator, in the FG pathway [10].
The trajectory pattern obtained for the binding of BFA to these two proteins shows that the binding of BFA produced a trajectory pattern that showed inhibitory activity. An investigation into the binding pattern of BFA when docked into MAPK and PrKC1 showed that BFA binds in different pockets (Figure 2). This could be due to BFA presumably being a weaker binder; hence, instability at one pocket results in binding at different pockets. Additional studies could disclose the events that might produce inconsistent pocket binding. The trajectory pattern and what the average RMSF suggests showed that the binding of BFA could not create many structural variations in residue motions relative to the apo form. Since minimal fluctuations were observed, this residue pattern suggests rigidity relative to the apo form. In this regard, previous studies have associated rigidity with inactivity [46] . Hence, from the observations made from the RMSD and RMSF plots, it can be inferred that the binding of BFA induced a structural alteration, which could presumably produce inhibition of MAPK and PrKC1. However, additional studies could substantiate this view. The mobility pattern obtained for BFA-bound MAPK did not show a distinct mobility difference, though BFA-bound MAPK exhibited an Rg pattern higher than that of the apo. In the case of BFA-bound PrKC1, there was a mobility difference between BFA-bound PrKC1 and the apo form, which indicates the inactivity of PrKC1.
The trajectory of the ligand RMSD plot indicated that BFA is bound with a stable and consistent configurational dynamic. Throughout the MD simulation, the 3D presentation of the orientation of BFA's configuration during the 250ns MD simulation showed that the structural packing of BFA and its conformational configuration remained similar in both MAPK and PrKC1(Figure 5). As reported here, the two trajectories for the binding of BFA to MAPK and PrKC1 were quite similar but with high Å2. Therefore, this suggested that BFA established quite an adequate level of interaction, which will produce binding that could result in functional activity/inactivity. This sudden trajectory jump observed in the SASA plot could be due to the conformational reorientation of BFA at that binding pocket of PrKC1. The consistent horizontal trajectory movement of the plot pictures/suggests that BFA steadily remained in the binding pockets of MAPK and PrKC1 and was not moved out. The result of the comparative 2D interaction diagram revealed that the presence of bulk water in the MD simulation medium could presumably not have contributed much to the dynamics and binding stabilisation of BFA- MAPK/PrKC1 complexes, as there is a lack of water to contribute to hydrogen bonds to stabilise BFA. The binding and interactions might be produced by other factors which promote molecular recognition and subsequent binding.
The nature and types of interactions established between BFA with MAPK and PrKC1 could provide further insight into the silent structural events which might have produced the obtained binding stabilization of BFA on the pockets of the two proteins. From Figure 8 we can observe that the scarcity of bulk water resulted in low levels of hydrogen bonding in the association between BFA and MAPK, but with a higher level of water bridges. Hydrogen bonding is more prevalent in the binding of BFA to PrKC1.
As indicated in Figure 9, the active site residues that primarily played crucial roles in the binding stabilization of BFA with their corresponding percentage occupancy are presented.
For MAPK, they are as follows Gly75, Ala76, Gly77, Asn78, Val82, Lys97, Asp152Ser194 and Asp208. For PrKC1 they are Asn31, Leu32, Ile33, Ser36, Ile37, Lys83, Ala87, Ile9- and Gln91A. It is imperative to observe the presence of bulk water in both average PDBs equally making contributions to the binding stabilization; this tends to buttress the assertion made in Figure 7 about the critical role made by water in the binding stabilization of ligands. The stacked bar charts (Figure 8) revealed that the water bridge, van der Waals and H-bond interactions predominantly established the contacts between the ligands and the active site residues. It is important to notice that there were more residues in PrKC contributing to the binding stabilization of BFA but the energy output in both proteins is similar. From the MMDBSA result obtained, BFA interacted with the active site residues of the two proteins to produce a moderately high ∆Gbind for MAPK (-22.18±4.50 kcal/mol) and PrKC1 (-23.9±5.36kcal/mol)) to produce favorable binding. Overall, the PCA results for both PrKC1 and MAPK proteins indicate that Brefeldin A treatment leads to notable structural and dynamic alterations. These changes include conformational adjustments, increased regional flexibility, and variations in overall compactness, which may impact the biological functions of PrKC1 and MAPK.
These findings are consistent with current research on the effects of Brefeldin A on protein structure. Studies have demonstrated that Brefeldin A, an inhibitor of N-linked glycosylation and protein trafficking between the endoplasmic reticulum (ER) and Golgi apparatus, can induce ER stress and disrupt Golgi structure, ultimately affecting protein folding and stability [47]. The observed conformational changes and increased flexibility in both PrKC1 and MAPK proteins suggest that Brefeldin A interferes with their structural integrity, potentially leading to altered protein function. Variations in compactness further indicate that Brefeldin A affects the overall folding and shape of these proteins, which could have significant implications for their biological activities [48].
5. Conclusions
This study provides compelling computational evidence that BFA binds with high affinity to two glycosylation-associated kinases, MAPK and PrKC1, both implicated in CRC progression. Molecular docking and dynamic simulations revealed stable interactions, supported by favourable binding energies and structural compatibility at key active sites. These findings suggest that BFA may function as a dual inhibitor, potentially disrupting glycosylation-related signalling pathways critical for tumour development and survival. Importantly, this work highlights glycosylation inhibition as a promising therapeutic strategy for CRC, a field with limited targeted options. While these in-silico results offer valuable mechanistic insight, further validation in-vitro and in patient derived models is essential to confirm BFA’s biological efficacy and translational potential.
Collectively, this study lays a strong foundation for the repurposing of BFA and supports future efforts in glycosylation-targeted drug development for colorectal and potentially other cancers as well.
Supplementary Materials
The following supporting information can be downloaded at the website of this paper posted on Preprints.org, Table S1: Docking results of Brefeldin A with protein targets; Table S2: KEGG pathway analysis for Targeted proteins for Brefeldin A. Table S3: Wiki Pathway analysis.
Author Contributions
Conceptualisation, J.K., S.M. and C.P.; methodology, I.A and C.P.; software, I.A. and M.S.; formal analysis, I.A. and M.S.; investigation, V.N, R.H and J.K.; data curation, V.N, R.H, J.K. and S.M; writing—original draft preparation, V.N, I.A., R.H and M.S.; writing—review and editing, R.H., S.M. and C.P.; supervision, C.P., I.A, S.M., and R.H.; project administration, C.P.; funding acquisition, C.P. and V.N. All authors have read and agreed to the published version of the manuscript.
Funding
V. Naidoo acknowledges funding received from the National Research Foundation, the Faculty Research Committee of the University of the Witwatersrand Medical School, and the Wits/MRC Common Epithelial Cancer Research Centre.
Data Availability Statement
The original contributions presented in this study are included in the article/Supplementary Material. Please direct further inquiries to the corresponding authors.
Acknowledgments
For access to the high-performance computing systems used in this study, the authors would like to acknowledge the NRF/DSI-CPRR grant (CPRR23042899244) awarded to Ikechukwu Achilonu, School of Molecular and Cell Biology, the University of the Witwatersrand, Braamfontein, Johannesburg. For access to the Schrödinger Maestro Molecular Modelling Suite license, the authors acknowledge the Centre for High-Performance Computing (CHPC), Cape Town, South Africa.
Conflicts of Interest
The authors declare no conflicts of interest.
References
- Reily, C.; Stewart, T.J.; Renfrow, M.B.; Novak, J. Glycosylation in health and disease. Nature reviews. Nephrology 2019, 15, 346-366. [CrossRef]
- Costa, A.F.; Campos, D.; Reis, C.A.; Gomes, C.J.T.i.C. Targeting glycosylation: a new road for cancer drug discovery. 2020, 6, 757-766.
- Varki, A. Biological roles of glycans. Glycobiology 2017, 27, 3-49.
- Pinho, S.S.; Reis, C.A. Glycosylation in cancer: mechanisms and clinical implications. Nature reviews. Cancer 2015, 15, 540-555. [CrossRef]
- Stowell, S.R.; Ju, T.; Cummings, R.D. Protein glycosylation in cancer. Annual Review of Pathology: Mechanisms of Disease 2015, 10, 473-510.
- Mereiter, S.; Balmaña, M.; Campos, D.; Gomes, J.; Reis, C.A. Glycosylation in the Era of Cancer-Targeted Therapy: Where Are We Heading? Cancer cell 2019, 36, 6-16. [CrossRef]
- Zheng, Y.; Liang, M.; Wang, B.; Kang, L.; Yuan, Y.; Mao, Y.; Wang, S. GALNT12 is associated with the malignancy of glioma and promotes glioblastoma multiforme in vitro by activating Akt signaling. Biochemical and biophysical research communications 2022, 610, 99-106. [CrossRef]
- Arey, B. The role of glycosylation in receptor signaling. Glycosylation 2012, 26, 50262.
- Li, X.; Yang, B.; Chen, M.; Klein, J.D.; Sands, J.M.; Chen, G. Activation of protein kinase C-α and Src kinase increases urea transporter A1 α-2, 6 sialylation. Journal of the American Society of Nephrology : JASN 2015, 26, 926-934. [CrossRef]
- Lien, E.C.; Nagiec, M.J.; Dohlman, H.G. Proper protein glycosylation promotes mitogen-activated protein kinase signal fidelity. Biochemistry 2013, 52, 115-124. [CrossRef]
- Wu, J.; Chen, S.; Liu, H.; Zhang, Z.; Ni, Z.; Chen, J.; Yang, Z.; Nie, Y.; Fan, D. Tunicamycin specifically aggravates ER stress and overcomes chemoresistance in multidrug-resistant gastric cancer cells by inhibiting N-glycosylation. Journal of experimental & clinical cancer research : CR 2018, 37, 272. [CrossRef]
- Mackay, H.J.; Twelves, C.J. Protein kinase C: a target for anticancer drugs? Endocrine-related cancer 2003, 10, 389-396. [CrossRef]
- Kang, J.-H. Protein kinase C (PKC) isozymes and cancer. New Journal of Science 2014, 2014.
- Lien, C.F.; Chen, S.J.; Tsai, M.C.; Lin, C.S. Potential Role of Protein Kinase C in the Pathophysiology of Diabetes-Associated Atherosclerosis. Frontiers in pharmacology 2021, 12, 716332. [CrossRef]
- Edwards, A.S.; Newton, A.C. Phosphorylation at conserved carboxyl-terminal hydrophobic motif regulates the catalytic and regulatory domains of protein kinase C. The Journal of biological chemistry 1997, 272, 18382-18390. [CrossRef]
- Keranen, L.M.; Newton, A.C. Ca2+ differentially regulates conventional protein kinase Cs' membrane interaction and activation. Journal of Biological Chemistry 1997, 272, 25959-25967.
- Keranen, L.M.; Newton, A.C. Ca2+ differentially regulates conventional protein kinase Cs' membrane interaction and activation. The Journal of biological chemistry 1997, 272, 25959-25967. [CrossRef]
- Mosior, M.; Newton, A.C. Mechanism of the apparent cooperativity in the interaction of protein kinase C with phosphatidylserine. Biochemistry 1998, 37, 17271-17279. [CrossRef]
- Suriya, U.; Mahalapbutr, P.; Rungrotmongkol, T. Integration of In Silico Strategies for Drug Repositioning towards P38α Mitogen-Activated Protein Kinase (MAPK) at the Allosteric Site. Pharmaceutics 2022, 14. [CrossRef]
- Ayatollahi, Z.; Kazanaviciute, V.; Shubchynskyy, V.; Kvederaviciute, K.; Schwanninger, M.; Rozhon, W.; Stumpe, M.; Mauch, F.; Bartels, S.; Ulm, R.; et al. Dual control of MAPK activities by AP2C1 and MKP1 MAPK phosphatases regulates defence responses in Arabidopsis. Journal of experimental botany 2022, 73, 2369-2384. [CrossRef]
- Astolfi, A.; Manfroni, G.; Cecchetti, V.; Barreca, M.L. A Comprehensive Structural Overview of p38α Mitogen-Activated Protein Kinase in Complex with ATP-Site and Non-ATP-Site Binders. ChemMedChem 2018, 13, 7-14. [CrossRef]
- Ardito, F.; Giuliani, M.; Perrone, D.; Troiano, G.; Lo Muzio, L. The crucial role of protein phosphorylation in cell signaling and its use as targeted therapy (Review). International journal of molecular medicine 2017, 40, 271-280. [CrossRef]
- Yu, Z.H.; Zhang, Z.Y. Regulatory Mechanisms and Novel Therapeutic Targeting Strategies for Protein Tyrosine Phosphatases. Chemical reviews 2018, 118, 1069-1091. [CrossRef]
- Wei, S.; Zhao, Q.; Zheng, K.; Liu, P.; Sha, N.; Li, Y.; Ma, C.; Li, J.; Zhuo, L.; Liu, G.; et al. GFAT1-linked TAB1 glutamylation sustains p38 MAPK activation and promotes lung cancer cell survival under glucose starvation. Cell discovery 2022, 8, 77. [CrossRef]
- Esteva, F.J.; Sahin, A.A.; Smith, T.L.; Yang, Y.; Pusztai, L.; Nahta, R.; Buchholz, T.A.; Buzdar, A.U.; Hortobagyi, G.N.; Bacus, S.S. Prognostic significance of phosphorylated P38 mitogen-activated protein kinase and HER-2 expression in lymph node-positive breast carcinoma. Cancer 2004, 100, 499-506. [CrossRef]
- Greenberg, A.K.; Basu, S.; Hu, J.; Yie, T.A.; Tchou-Wong, K.M.; Rom, W.N.; Lee, T.C. Selective p38 activation in human non-small cell lung cancer. American journal of respiratory cell and molecular biology 2002, 26, 558-564. [CrossRef]
- Junttila, M.R.; Ala-Aho, R.; Jokilehto, T.; Peltonen, J.; Kallajoki, M.; Grenman, R.; Jaakkola, P.; Westermarck, J.; Kähäri, V.M. p38alpha and p38delta mitogen-activated protein kinase isoforms regulate invasion and growth of head and neck squamous carcinoma cells. Oncogene 2007, 26, 5267-5279. [CrossRef]
- Sørensen, D.M.; Büll, C.; Madsen, T.D.; Lira-Navarrete, E.; Clausen, T.M.; Clark, A.E.; Garretson, A.F.; Karlsson, R.; Pijnenborg, J.F.A.; Yin, X.; et al. Identification of global inhibitors of cellular glycosylation. Nature communications 2023, 14, 948. [CrossRef]
- Bosshart, H.; Straehl, P.; Berger, B.; Berger, E.G. Brefeldin A induces endoplasmic reticulum-associated O-glycosylation of galactosyltransferase. Journal of cellular physiology 1991, 147, 149-156. [CrossRef]
- Chantalat, L.; Leroy, D.; Filhol, O.; Nueda, A.; Benitez, M.J.; Chambaz, E.M.; Cochet, C.; Dideberg, O. Crystal structure of the human protein kinase CK2 regulatory subunit reveals its zinc finger-mediated dimerization. The EMBO journal 1999, 18, 2930-2940. [CrossRef]
- McCormick, C.; Duncan, G.; Tufaro, F. New perspectives on the molecular basis of hereditary bone tumours. Molecular medicine today 1999, 5, 481-486. [CrossRef]
- Meng, W.; Swenson, L.L.; Fitzgibbon, M.J.; Hayakawa, K.; Ter Haar, E.; Behrens, A.E.; Fulghum, J.R.; Lippke, J.A. Structure of mitogen-activated protein kinase-activated protein (MAPKAP) kinase 2 suggests a bifunctional switch that couples kinase activation with nuclear export. The Journal of biological chemistry 2002, 277, 37401-37405. [CrossRef]
- Birringer, M.S.; Claus, M.T.; Folkers, G.; Kloer, D.P.; Schulz, G.E.; Scapozza, L. Structure of a type II thymidine kinase with bound dTTP. FEBS letters 2005, 579, 1376-1382. [CrossRef]
- Fischmann, T.O.; Smith, C.K.; Mayhood, T.W.; Myers, J.E.; Reichert, P.; Mannarino, A.; Carr, D.; Zhu, H.; Wong, J.; Yang, R.S.; et al. Crystal structures of MEK1 binary and ternary complexes with nucleotides and inhibitors. Biochemistry 2009, 48, 2661-2674. [CrossRef]
- Grest, G.S.; Kremer, K. Molecular dynamics simulation for polymers in the presence of a heat bath. Physical review. A, General physics 1986, 33, 3628-3631. [CrossRef]
- Seifert, E. OriginPro 9.1: scientific data analysis and graphing software-software review. Journal of chemical information and modeling 2014, 54, 1552-1552.
- R: A language and environment for statistical computing. R Foundation for Statistical Computing. 2013.
- Tang, Y.; Horikoshi, M.; Li, W.J.R.J. ggfortify: unified interface to visualize statistical results of popular R packages. 2016, 8, 474.
- Daina, A.; Michielin, O.; Zoete, V. SwissTargetPrediction: updated data and new features for efficient prediction of protein targets of small molecules. Nucleic acids research 2019, 47, W357-w364. [CrossRef]
- Aloke, C.; Iwuchukwu, E.A.; Achilonu, I. Exploiting Copaifera salikounda compounds as treatment against diabetes: An insight into their potential targets from a computational perspective. Computational biology and chemistry 2023, 104, 107851. [CrossRef]
- Emmanuel, I.A.; Olotu, F.A.; Agoni, C.; Soliman, M.E.S. Deciphering the 'Elixir of Life': Dynamic Perspectives into the Allosteric Modulation of Mitochondrial ATP Synthase by J147, a Novel Drug in the Treatment of Alzheimer's Disease. Chemistry & biodiversity 2019, 16, e1900085. [CrossRef]
- Emmanuel, I.A.; Olotu, F.A.; Agoni, C.; Soliman, M.E.S. In Silico Repurposing of J147 for Neonatal Encephalopathy Treatment: Exploring Molecular Mechanisms of Mutant Mitochondrial ATP Synthase. Current pharmaceutical biotechnology 2020, 21, 1551-1566. [CrossRef]
- Liu, T.P.; Hong, Y.H.; Yang, P.M. In silico and in vitro identification of inhibitory activities of sorafenib on histone deacetylases in hepatocellular carcinoma cells. Oncotarget 2017, 8, 86168-86180. [CrossRef]
- Ruegenberg, S.; Mayr, F.; Atanassov, I.; Baumann, U.; Denzel, M.S. Protein kinase A controls the hexosamine pathway by tuning the feedback inhibition of GFAT-1. Nature communications 2021, 12, 2176. [CrossRef]
- Ho, J.C.; Nadeem, A.; Rydström, A.; Puthia, M.; Svanborg, C. Targeting of nucleotide-binding proteins by HAMLET--a conserved tumor cell death mechanism. Oncogene 2016, 35, 897-907. [CrossRef]
- Karshikoff, A.; Nilsson, L.; Ladenstein, R. Rigidity versus flexibility: the dilemma of understanding protein thermal stability. The FEBS journal 2015, 282, 3899-3917. [CrossRef]
- Lippincott-Schwartz, J.; Yuan, L.C.; Bonifacino, J.S.; Klausner, R.D. Rapid redistribution of Golgi proteins into the ER in cells treated with brefeldin A: evidence for membrane cycling from Golgi to ER. Cell 1989, 56, 801-813. [CrossRef]
- Donaldson, J.G.; Finazzi, D.; Klausner, R.D. Brefeldin A inhibits Golgi membrane-catalysed exchange of guanine nucleotide onto ARF protein. Nature 1992, 360, 350-352. [CrossRef]
Figure 1.
An RMSD and RMSF plot of MAPK and PrKC1 with their corresponding apo. Figure 1 (A and B) plots represent the trajectory pattern for MAPK, while the Figure 1 (C and D) plots are for PrKC1.
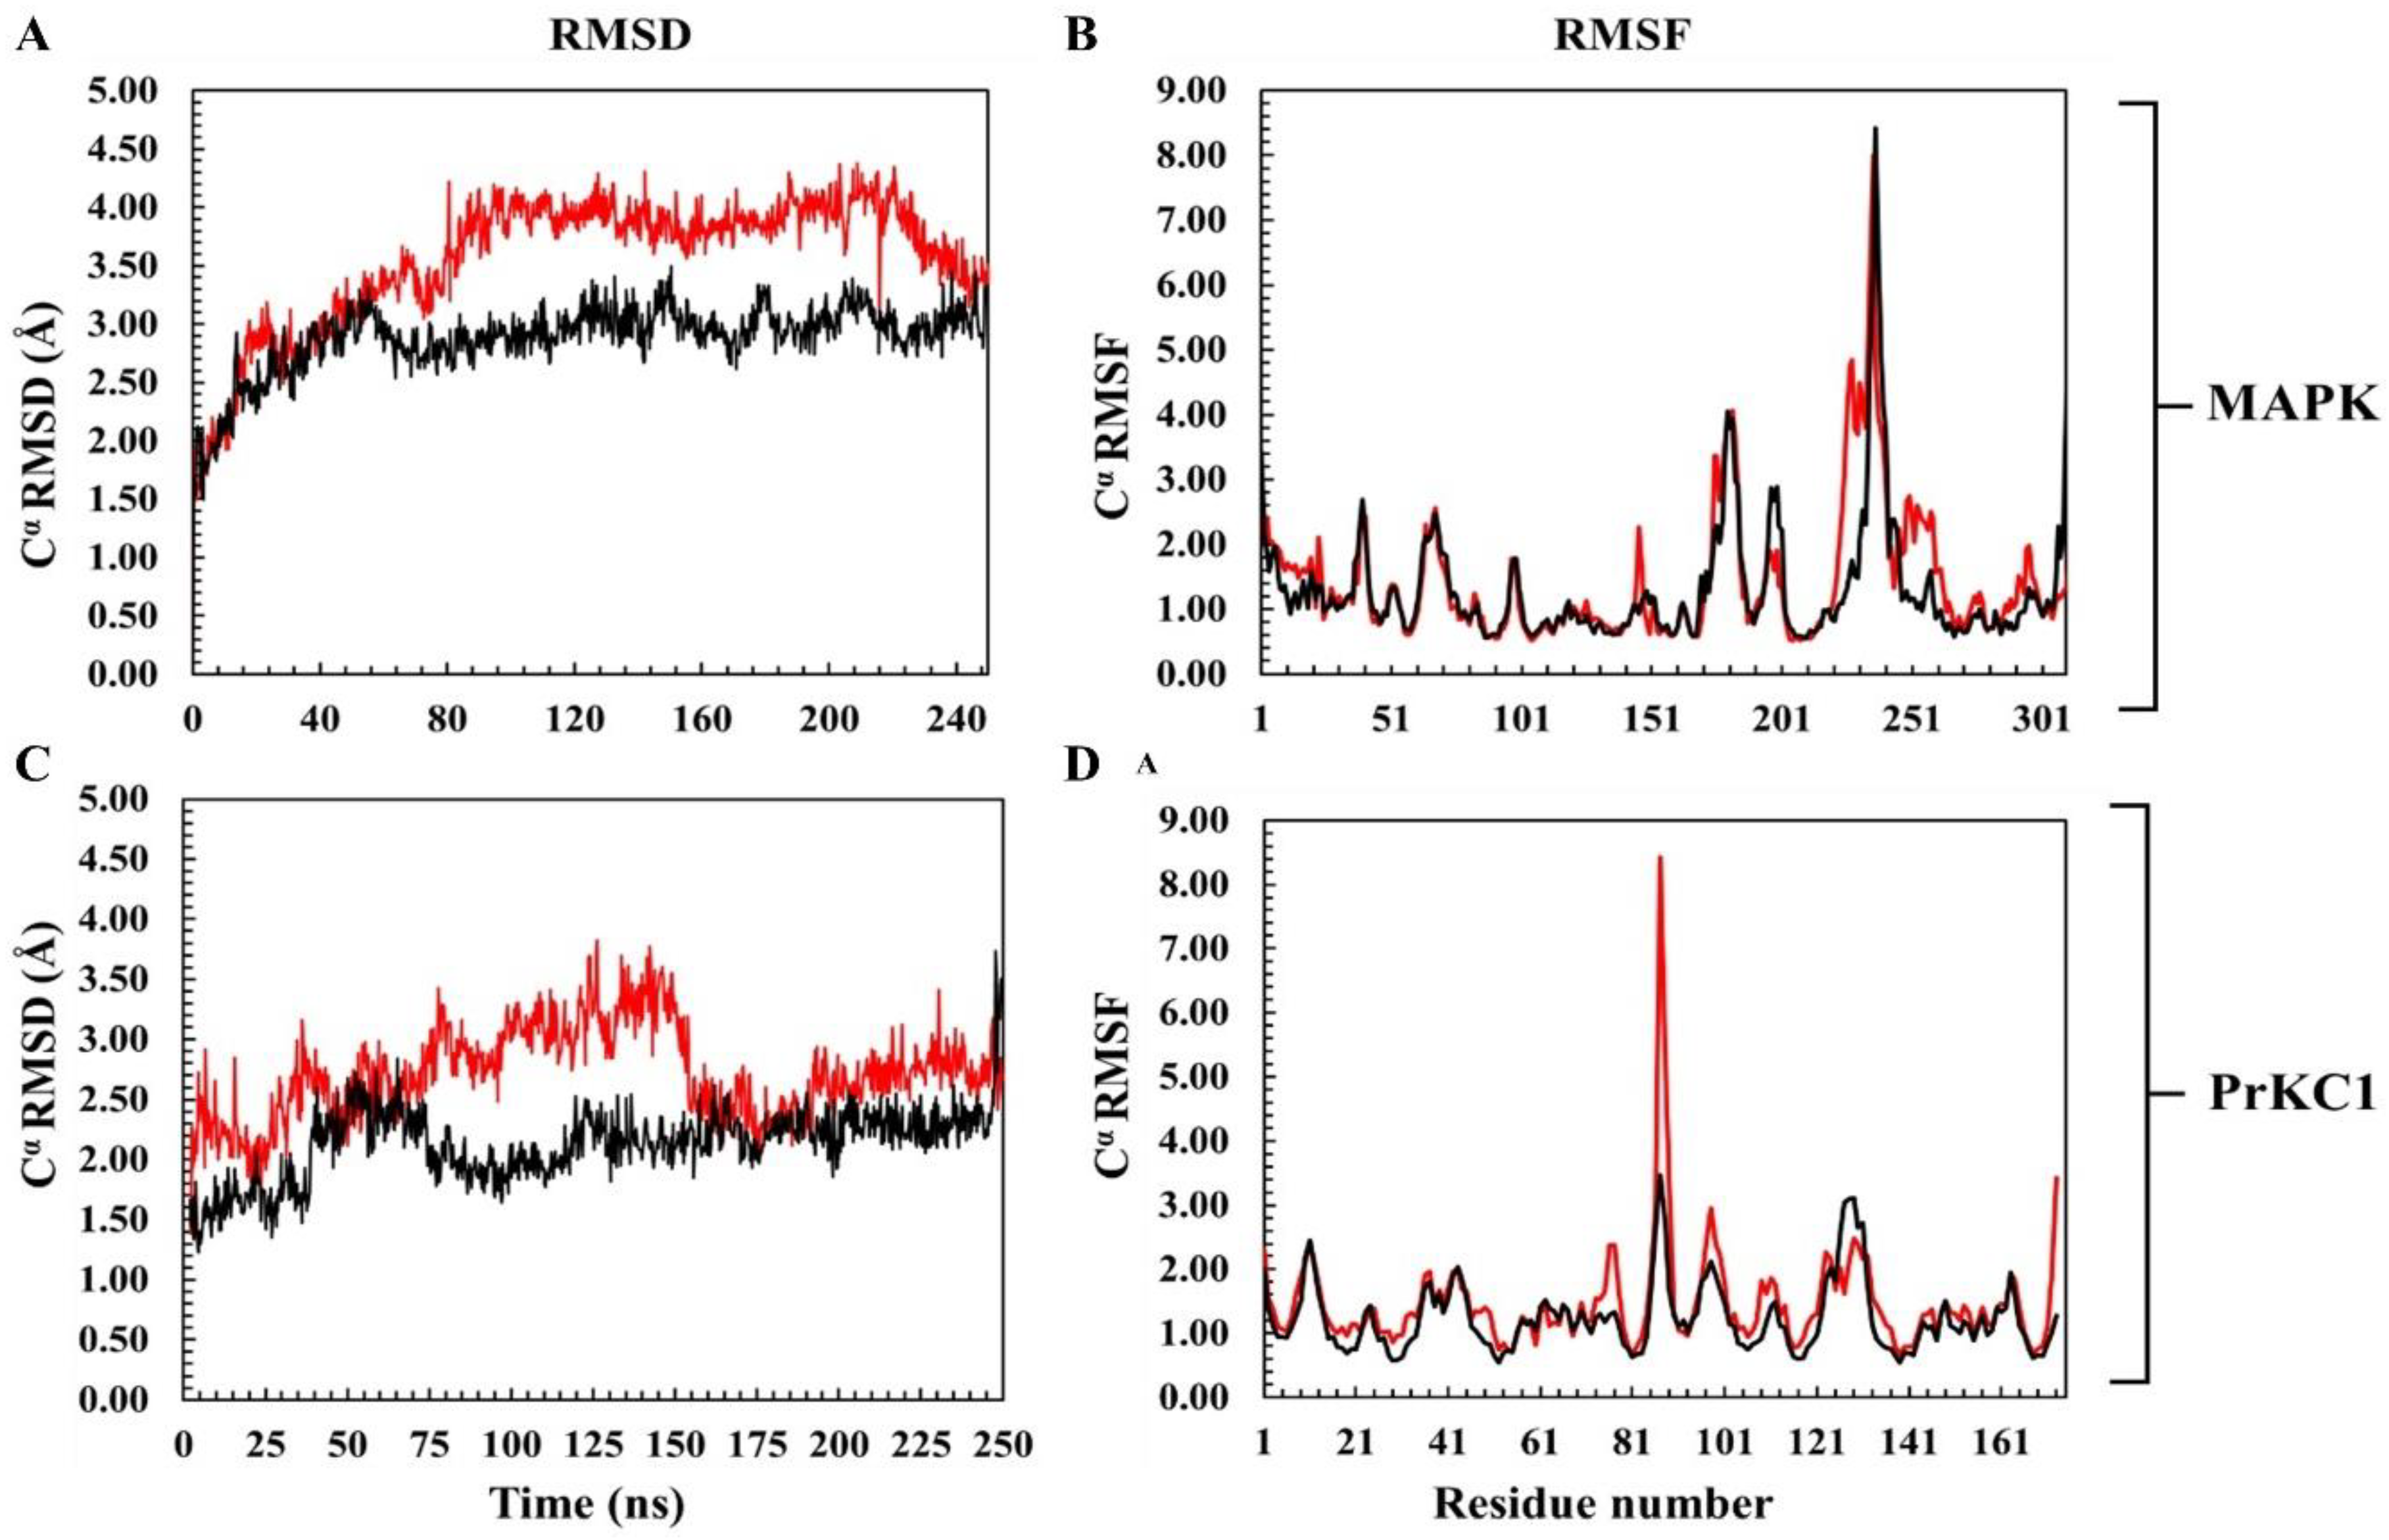
Figure 2.
A cartoon and surface representation of MAPK and PrKC1 docking complexes showing the best binding pose conformation for optimal interactions. A and B are the cartoon and surface representations for MAPK docked with BFA, while C and D represent those of PrKC1, respectively.
Figure 2.
A cartoon and surface representation of MAPK and PrKC1 docking complexes showing the best binding pose conformation for optimal interactions. A and B are the cartoon and surface representations for MAPK docked with BFA, while C and D represent those of PrKC1, respectively.
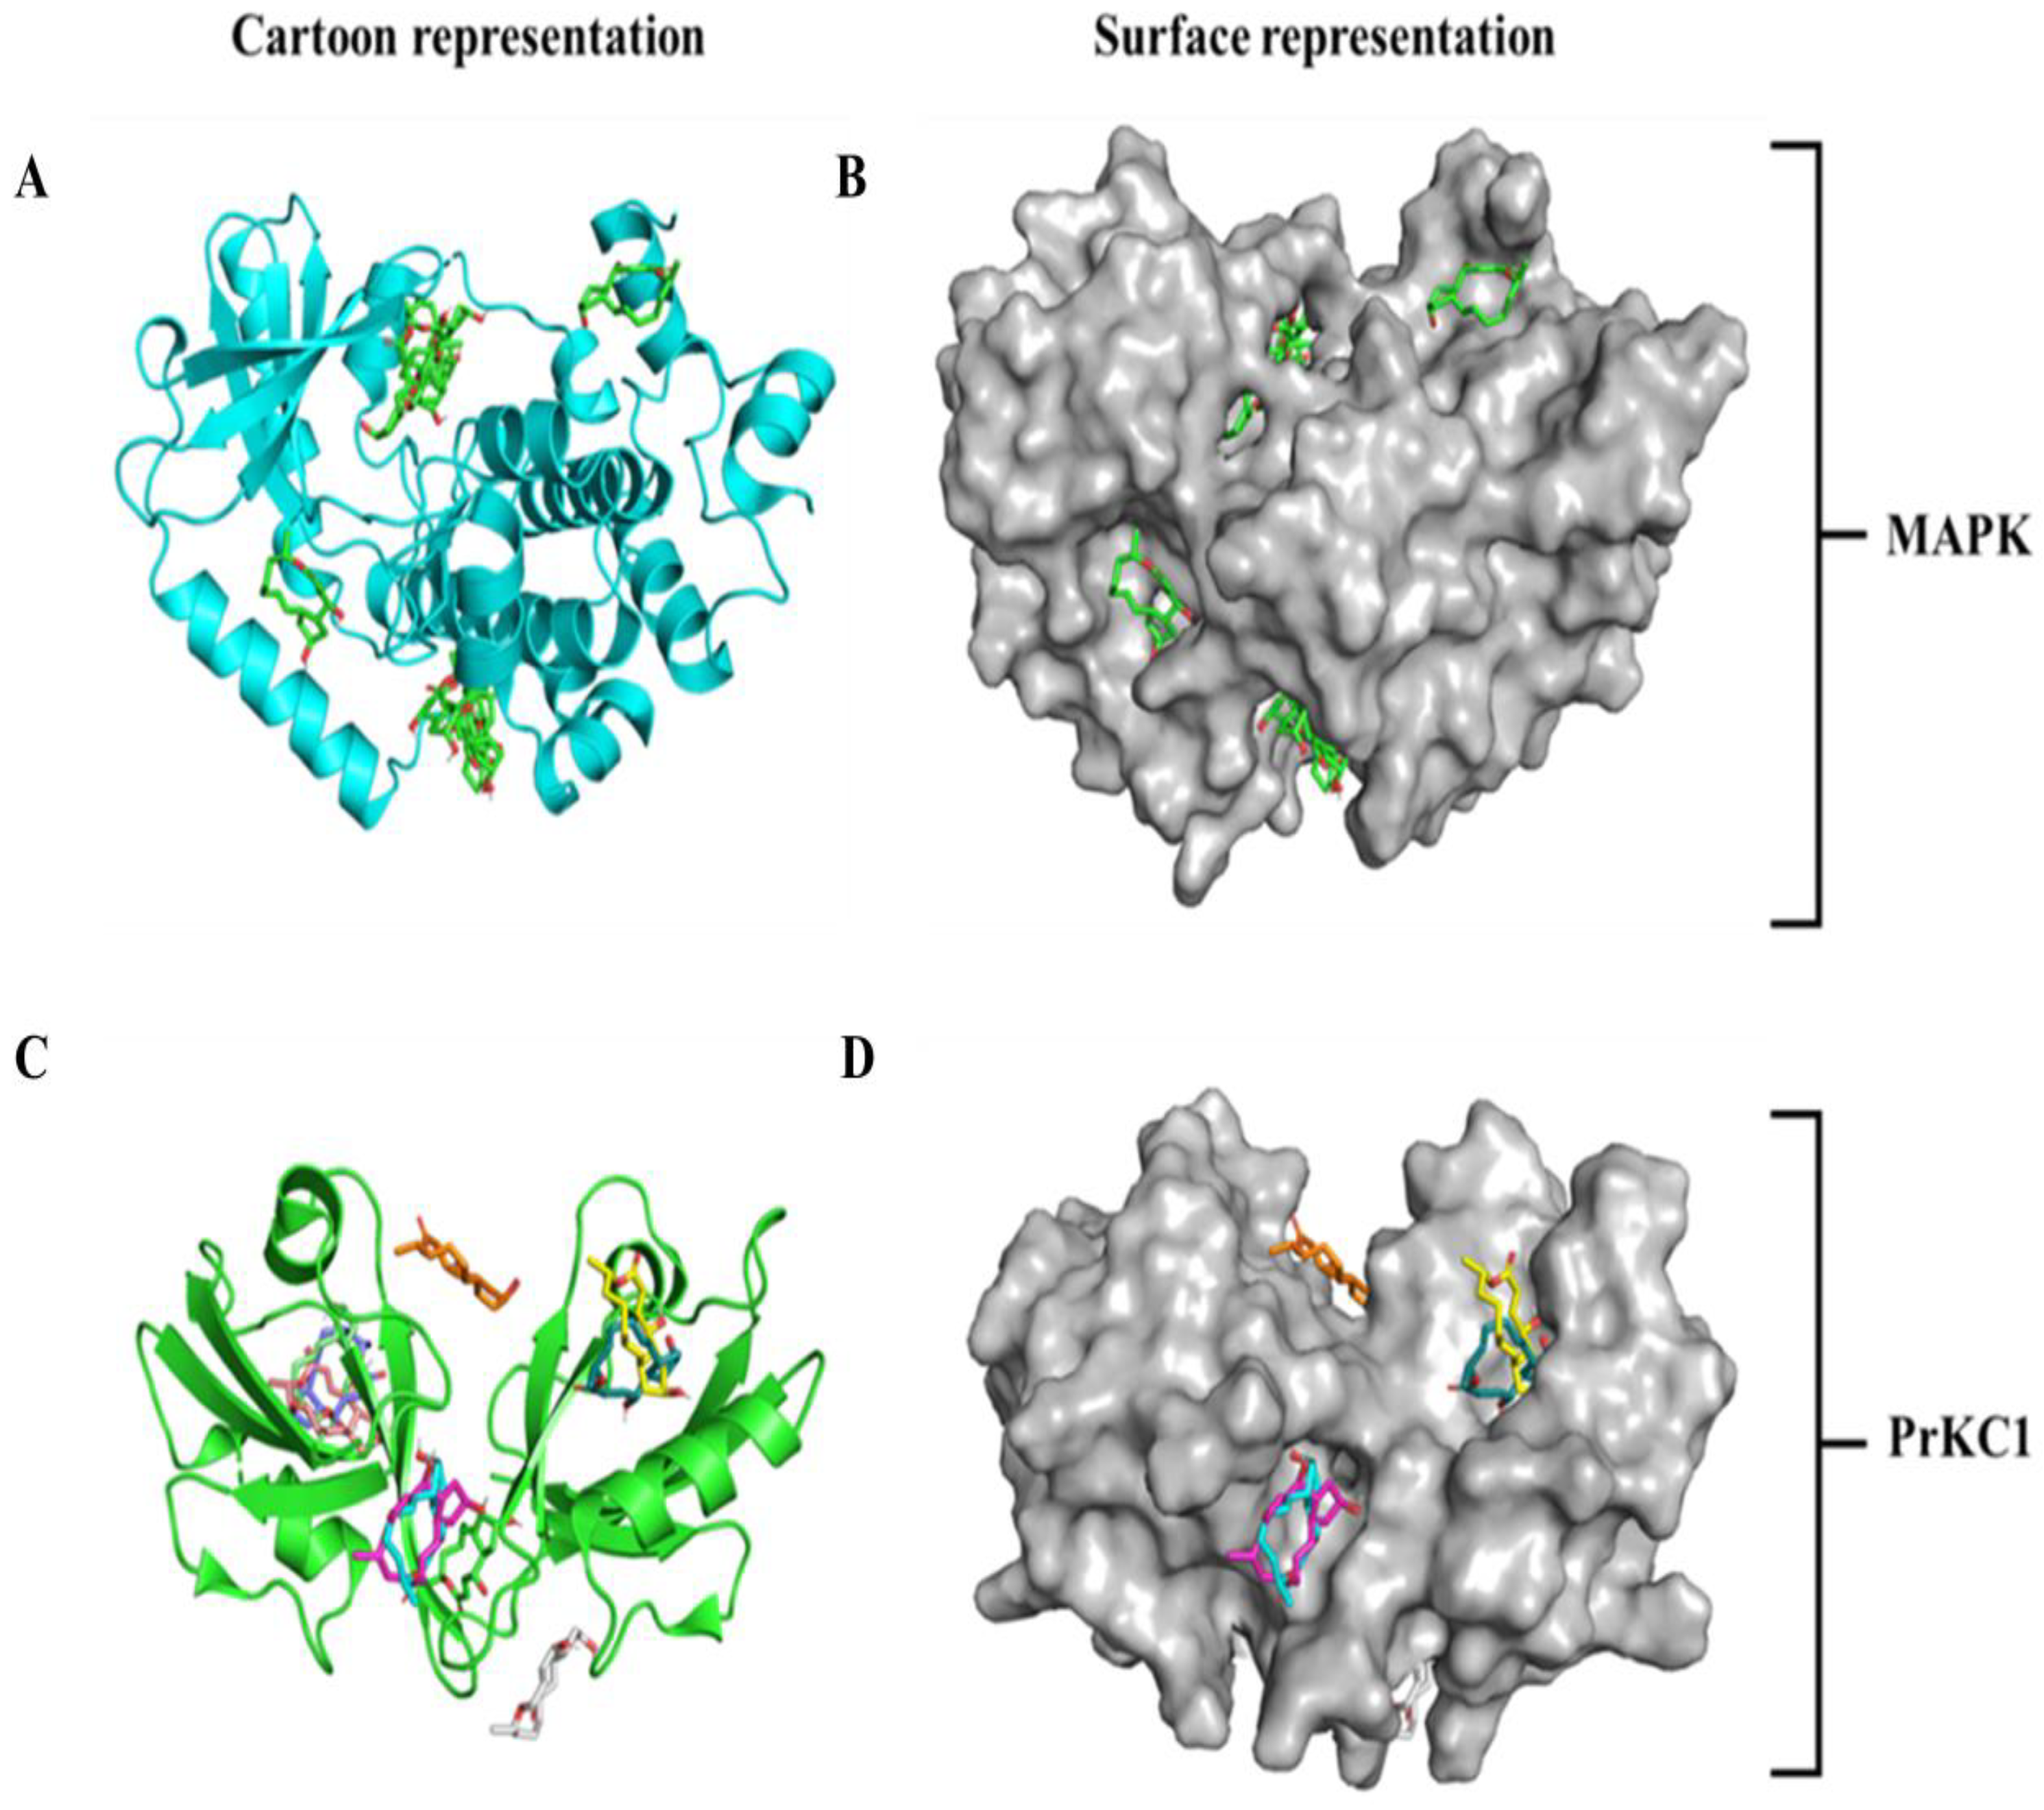
Figure 3.
Rg plots of the global structure of MAPK (A) and PrKC1(B) with their corresponding BFA bound systems.
Figure 3.
Rg plots of the global structure of MAPK (A) and PrKC1(B) with their corresponding BFA bound systems.
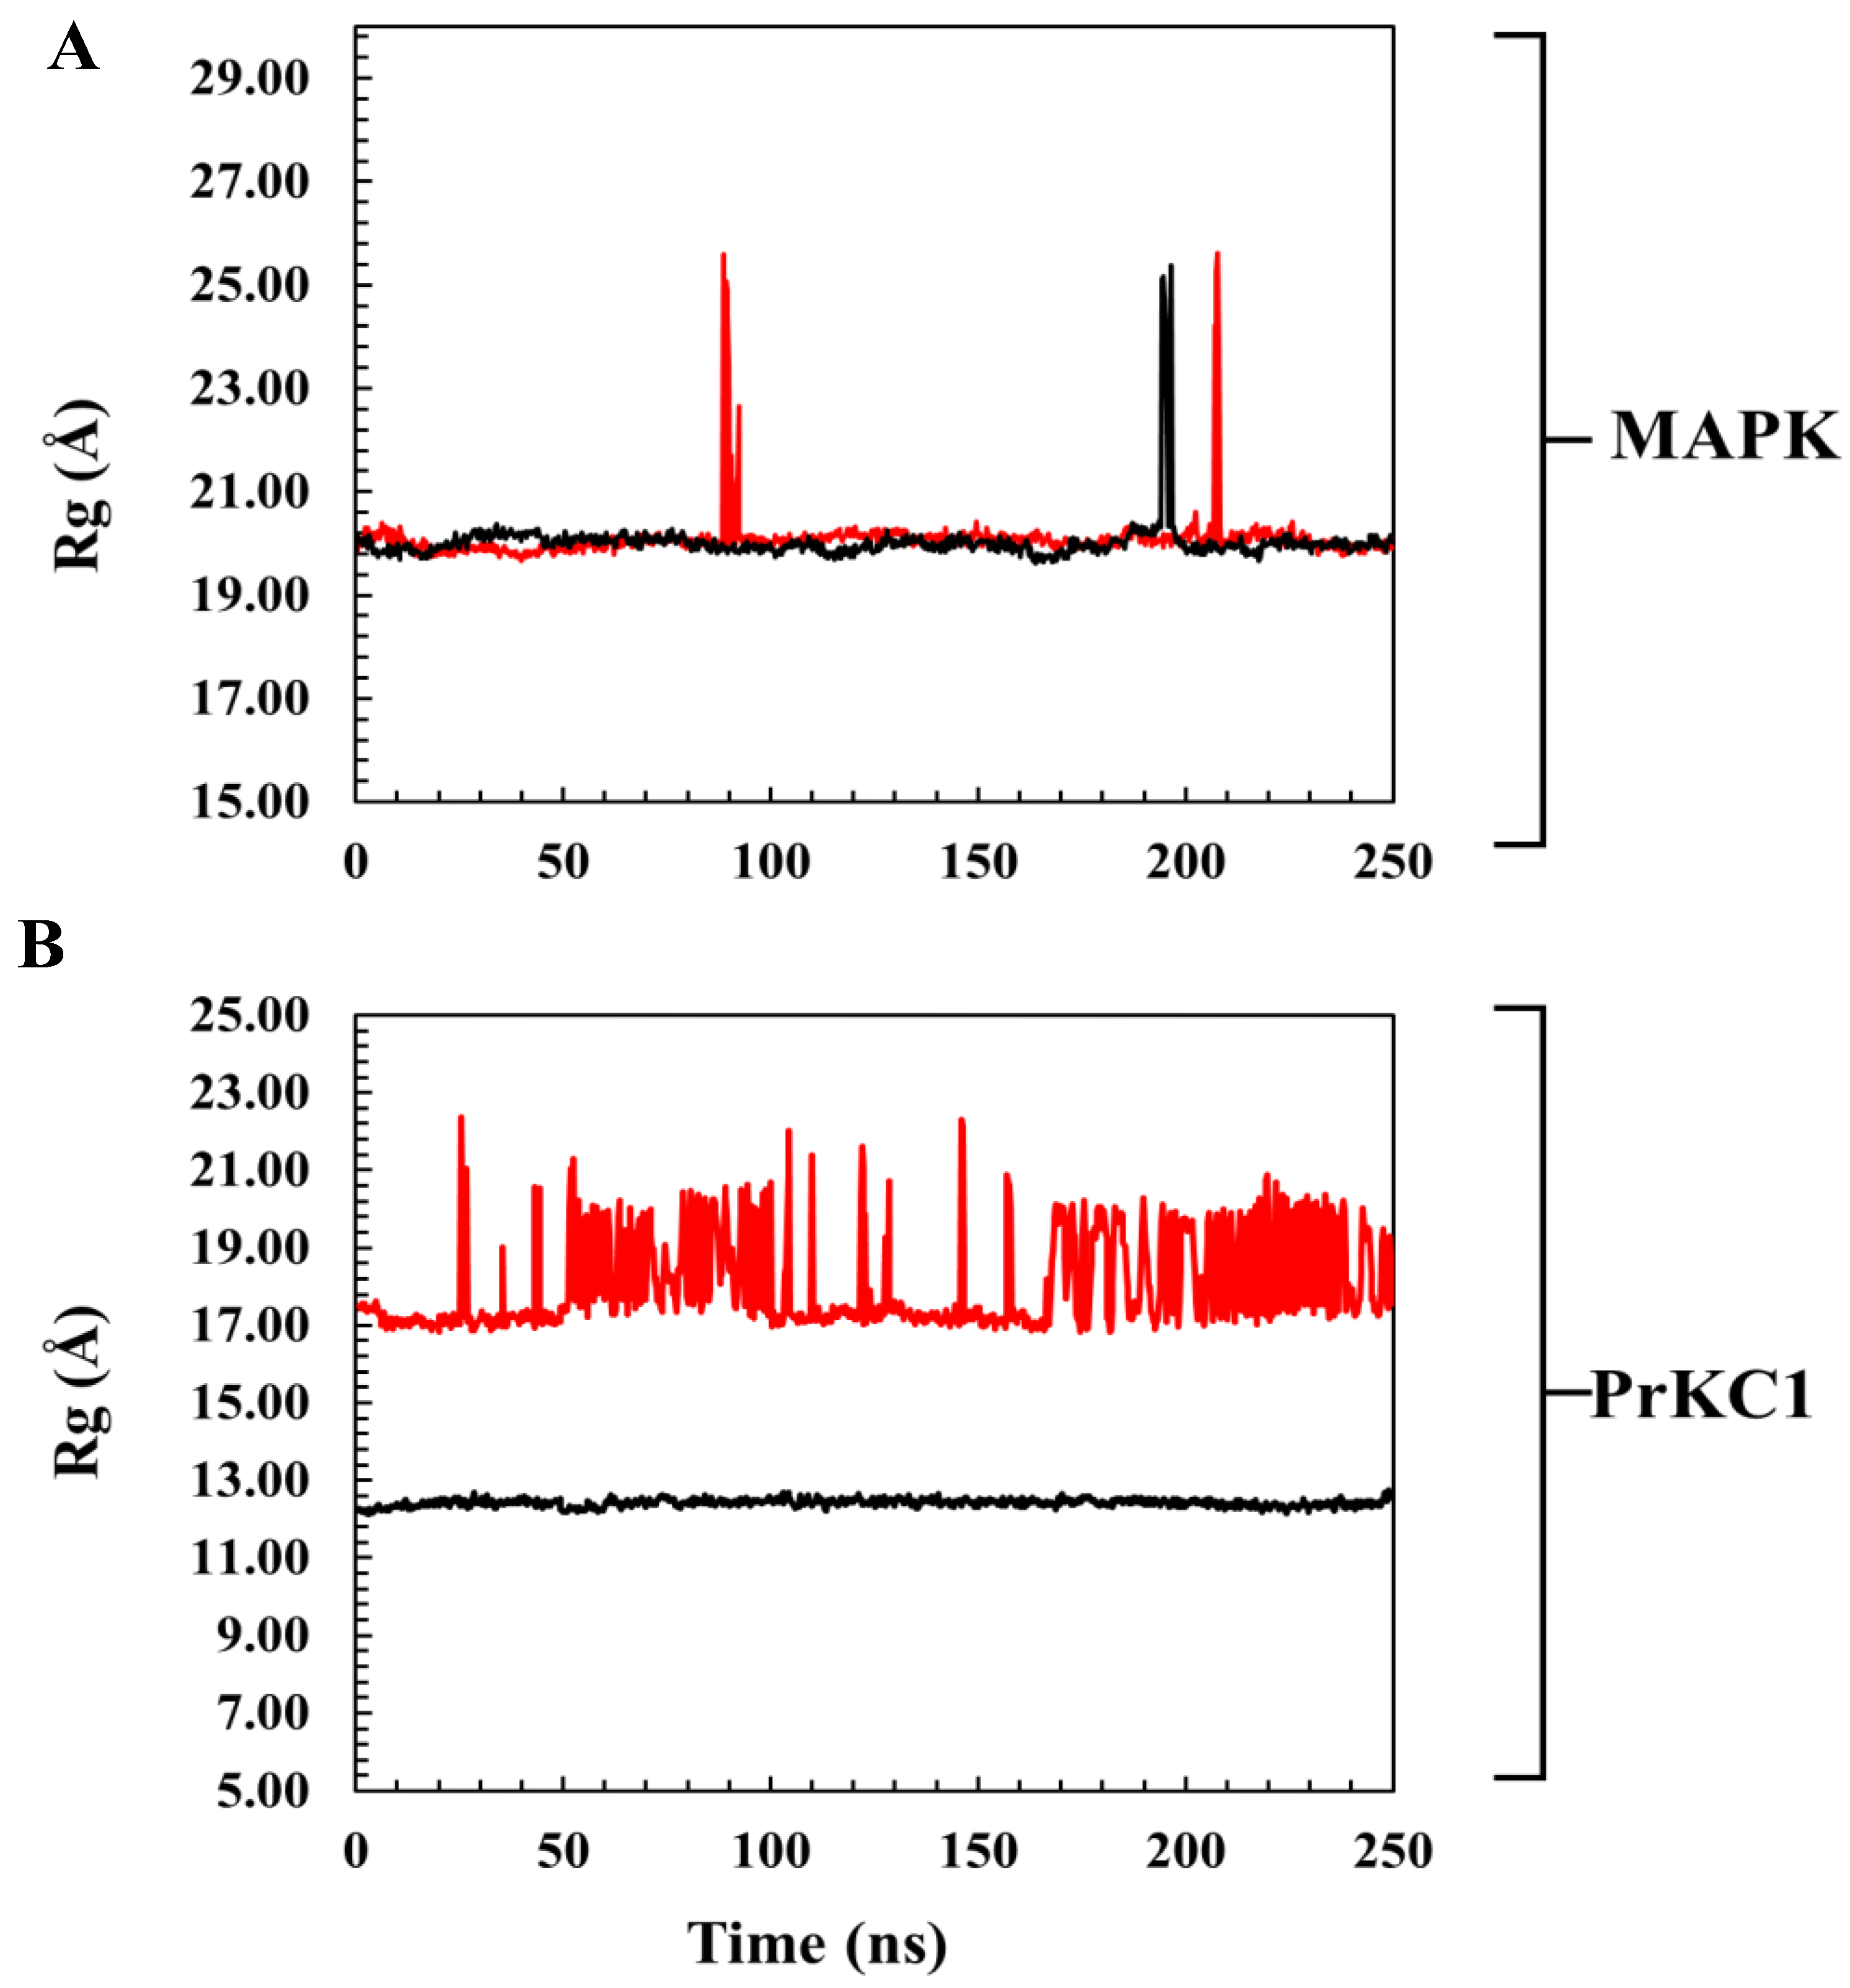
Figure 4.
A descriptive representation of the structural dynamics of MAPK and PrKC1 concerning BFA during the MDS timeline. It gives an idea of the ligand's interaction and stabilisation pattern. A. Ligand RMSD plot of MAPK bound BFA (black) and PrKC1 bound BFA (pink). B. Molecular Surface Area plot indicating the molecular level interactions of MAPK bound BFA (black) and PrKC1 bound BFA (pink). C. The solvent-accessible surface area plot shows the binding dynamics of MAPK: BFA (black) and PrKC1:BFA (pink) at their hydrophobic core.
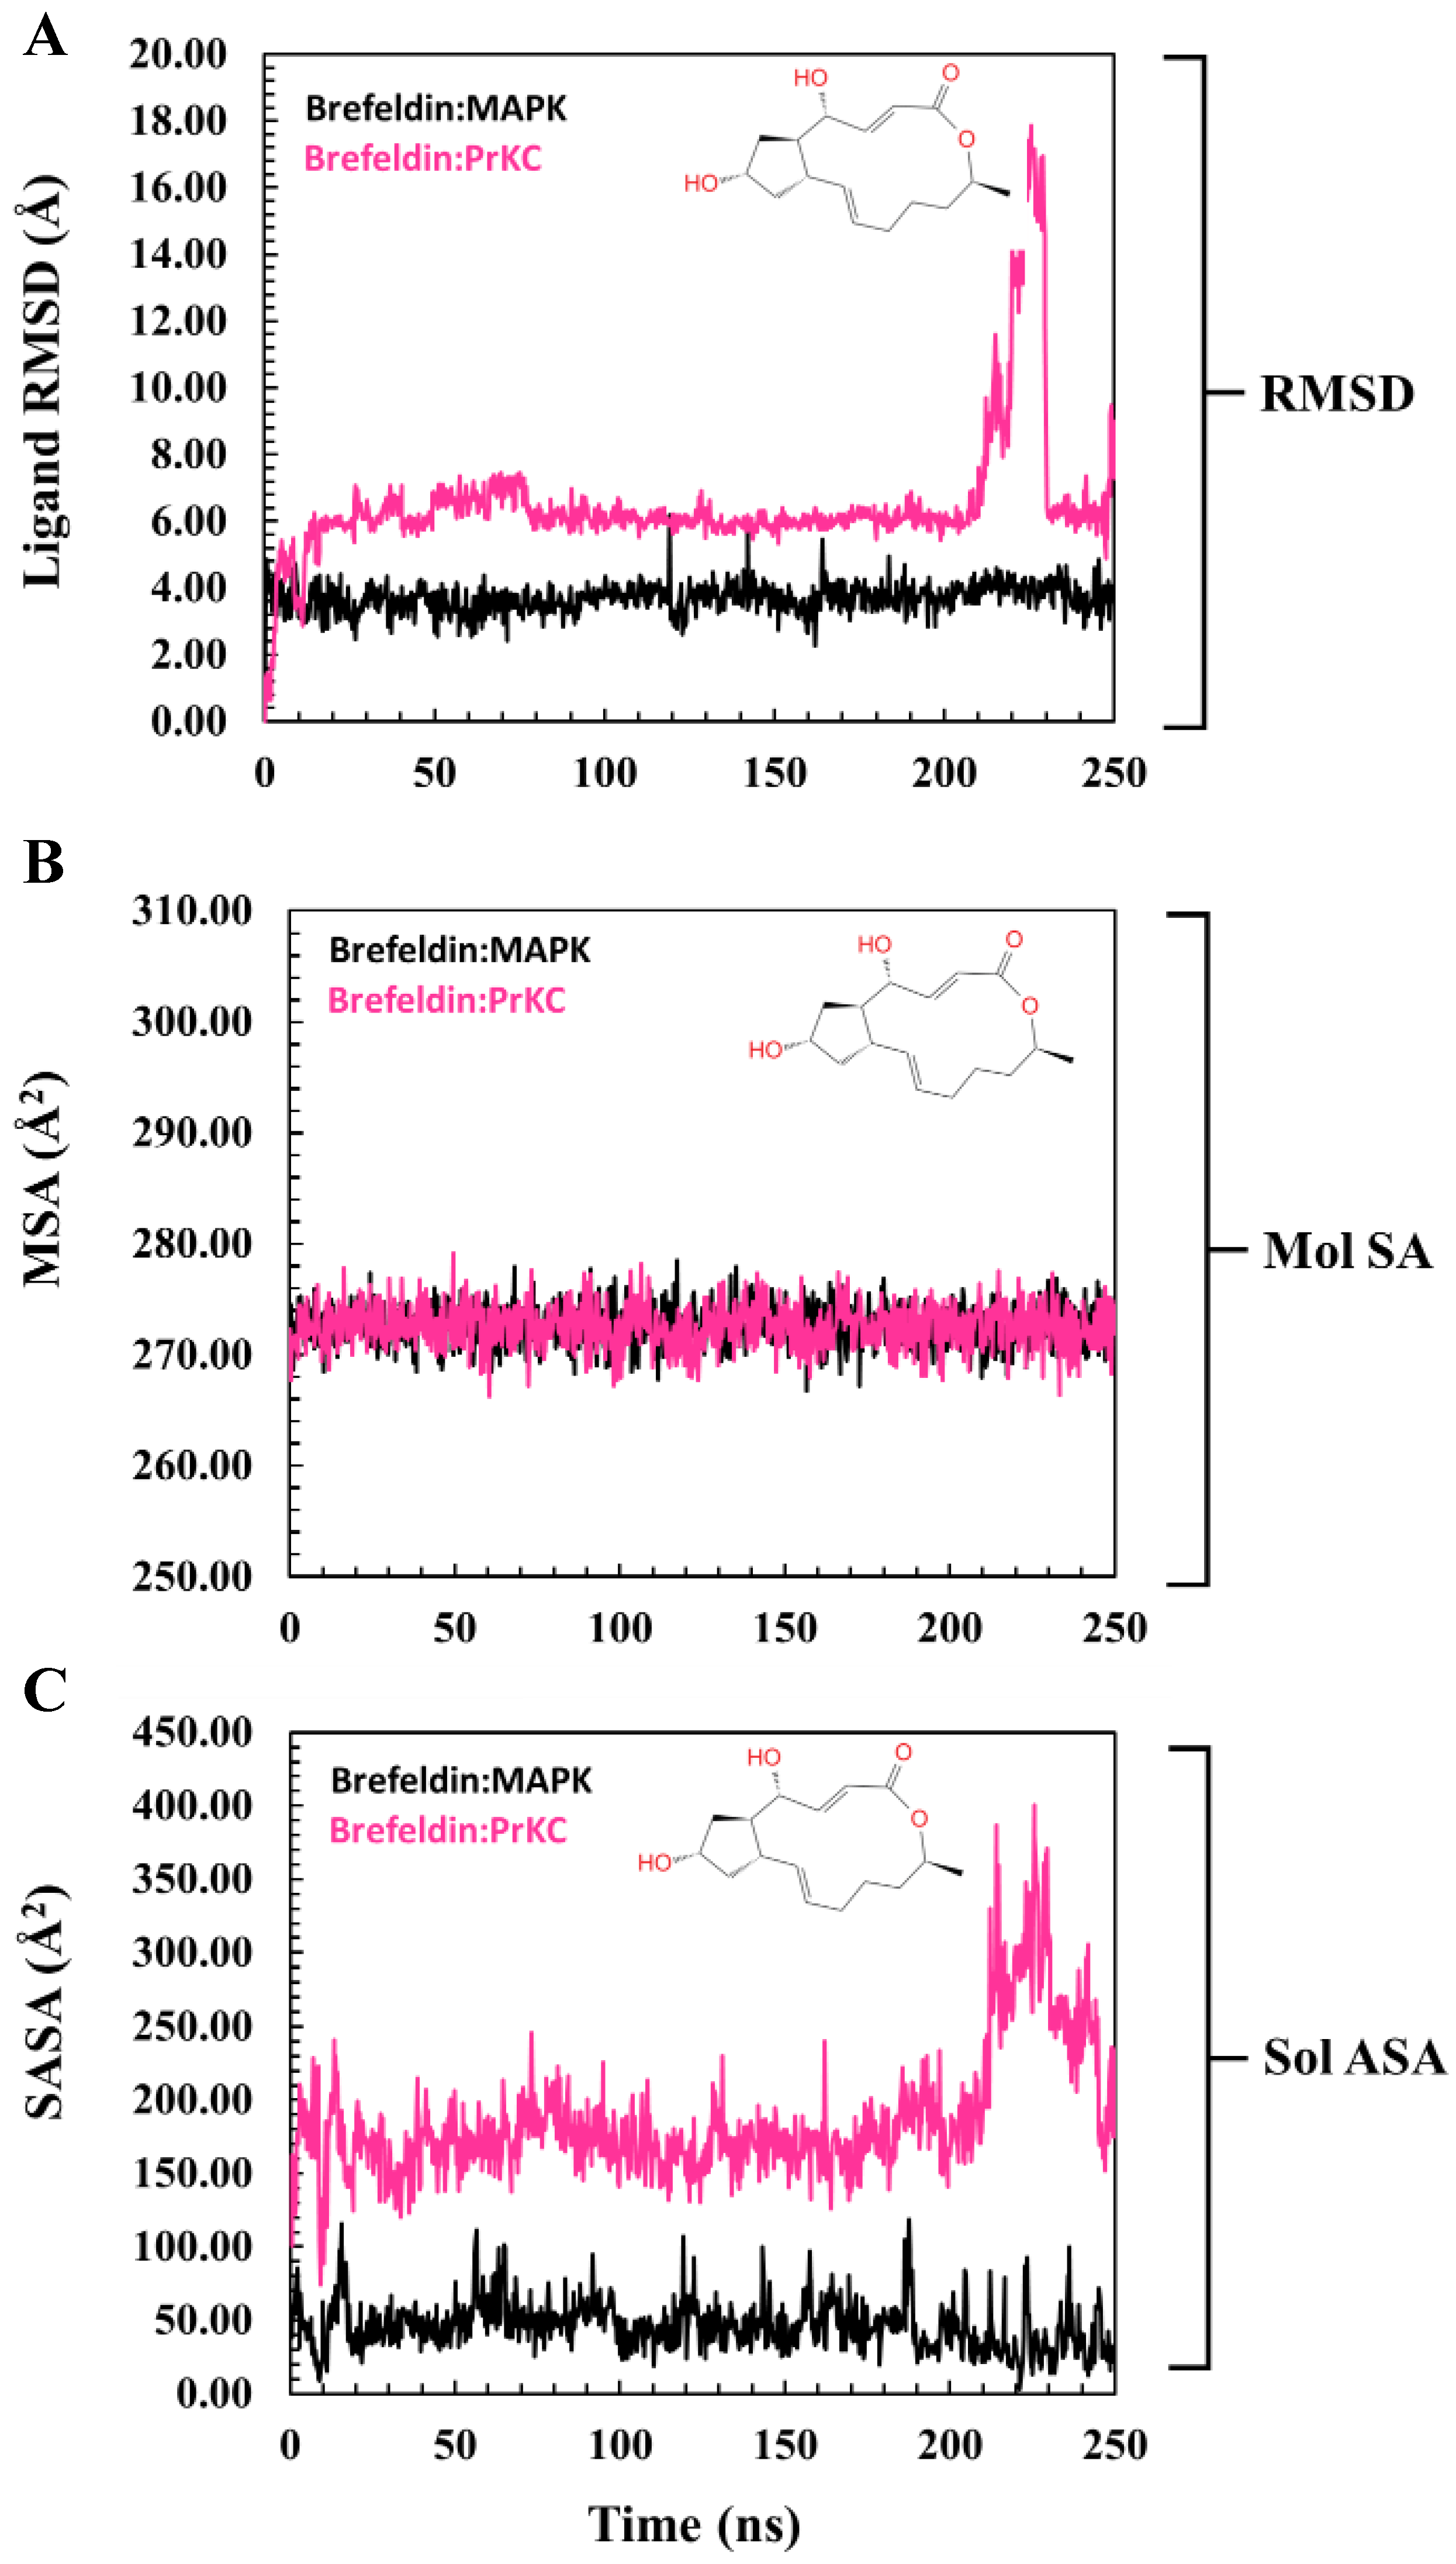
Figure 5.
3D Time-based illustration of the structural packing of A. MAPK B. PrKC1 concerning the structural orientation of BFA during the 250 ns MD simulations. C. BFA's 2D structure.
Figure 5.
3D Time-based illustration of the structural packing of A. MAPK B. PrKC1 concerning the structural orientation of BFA during the 250 ns MD simulations. C. BFA's 2D structure.
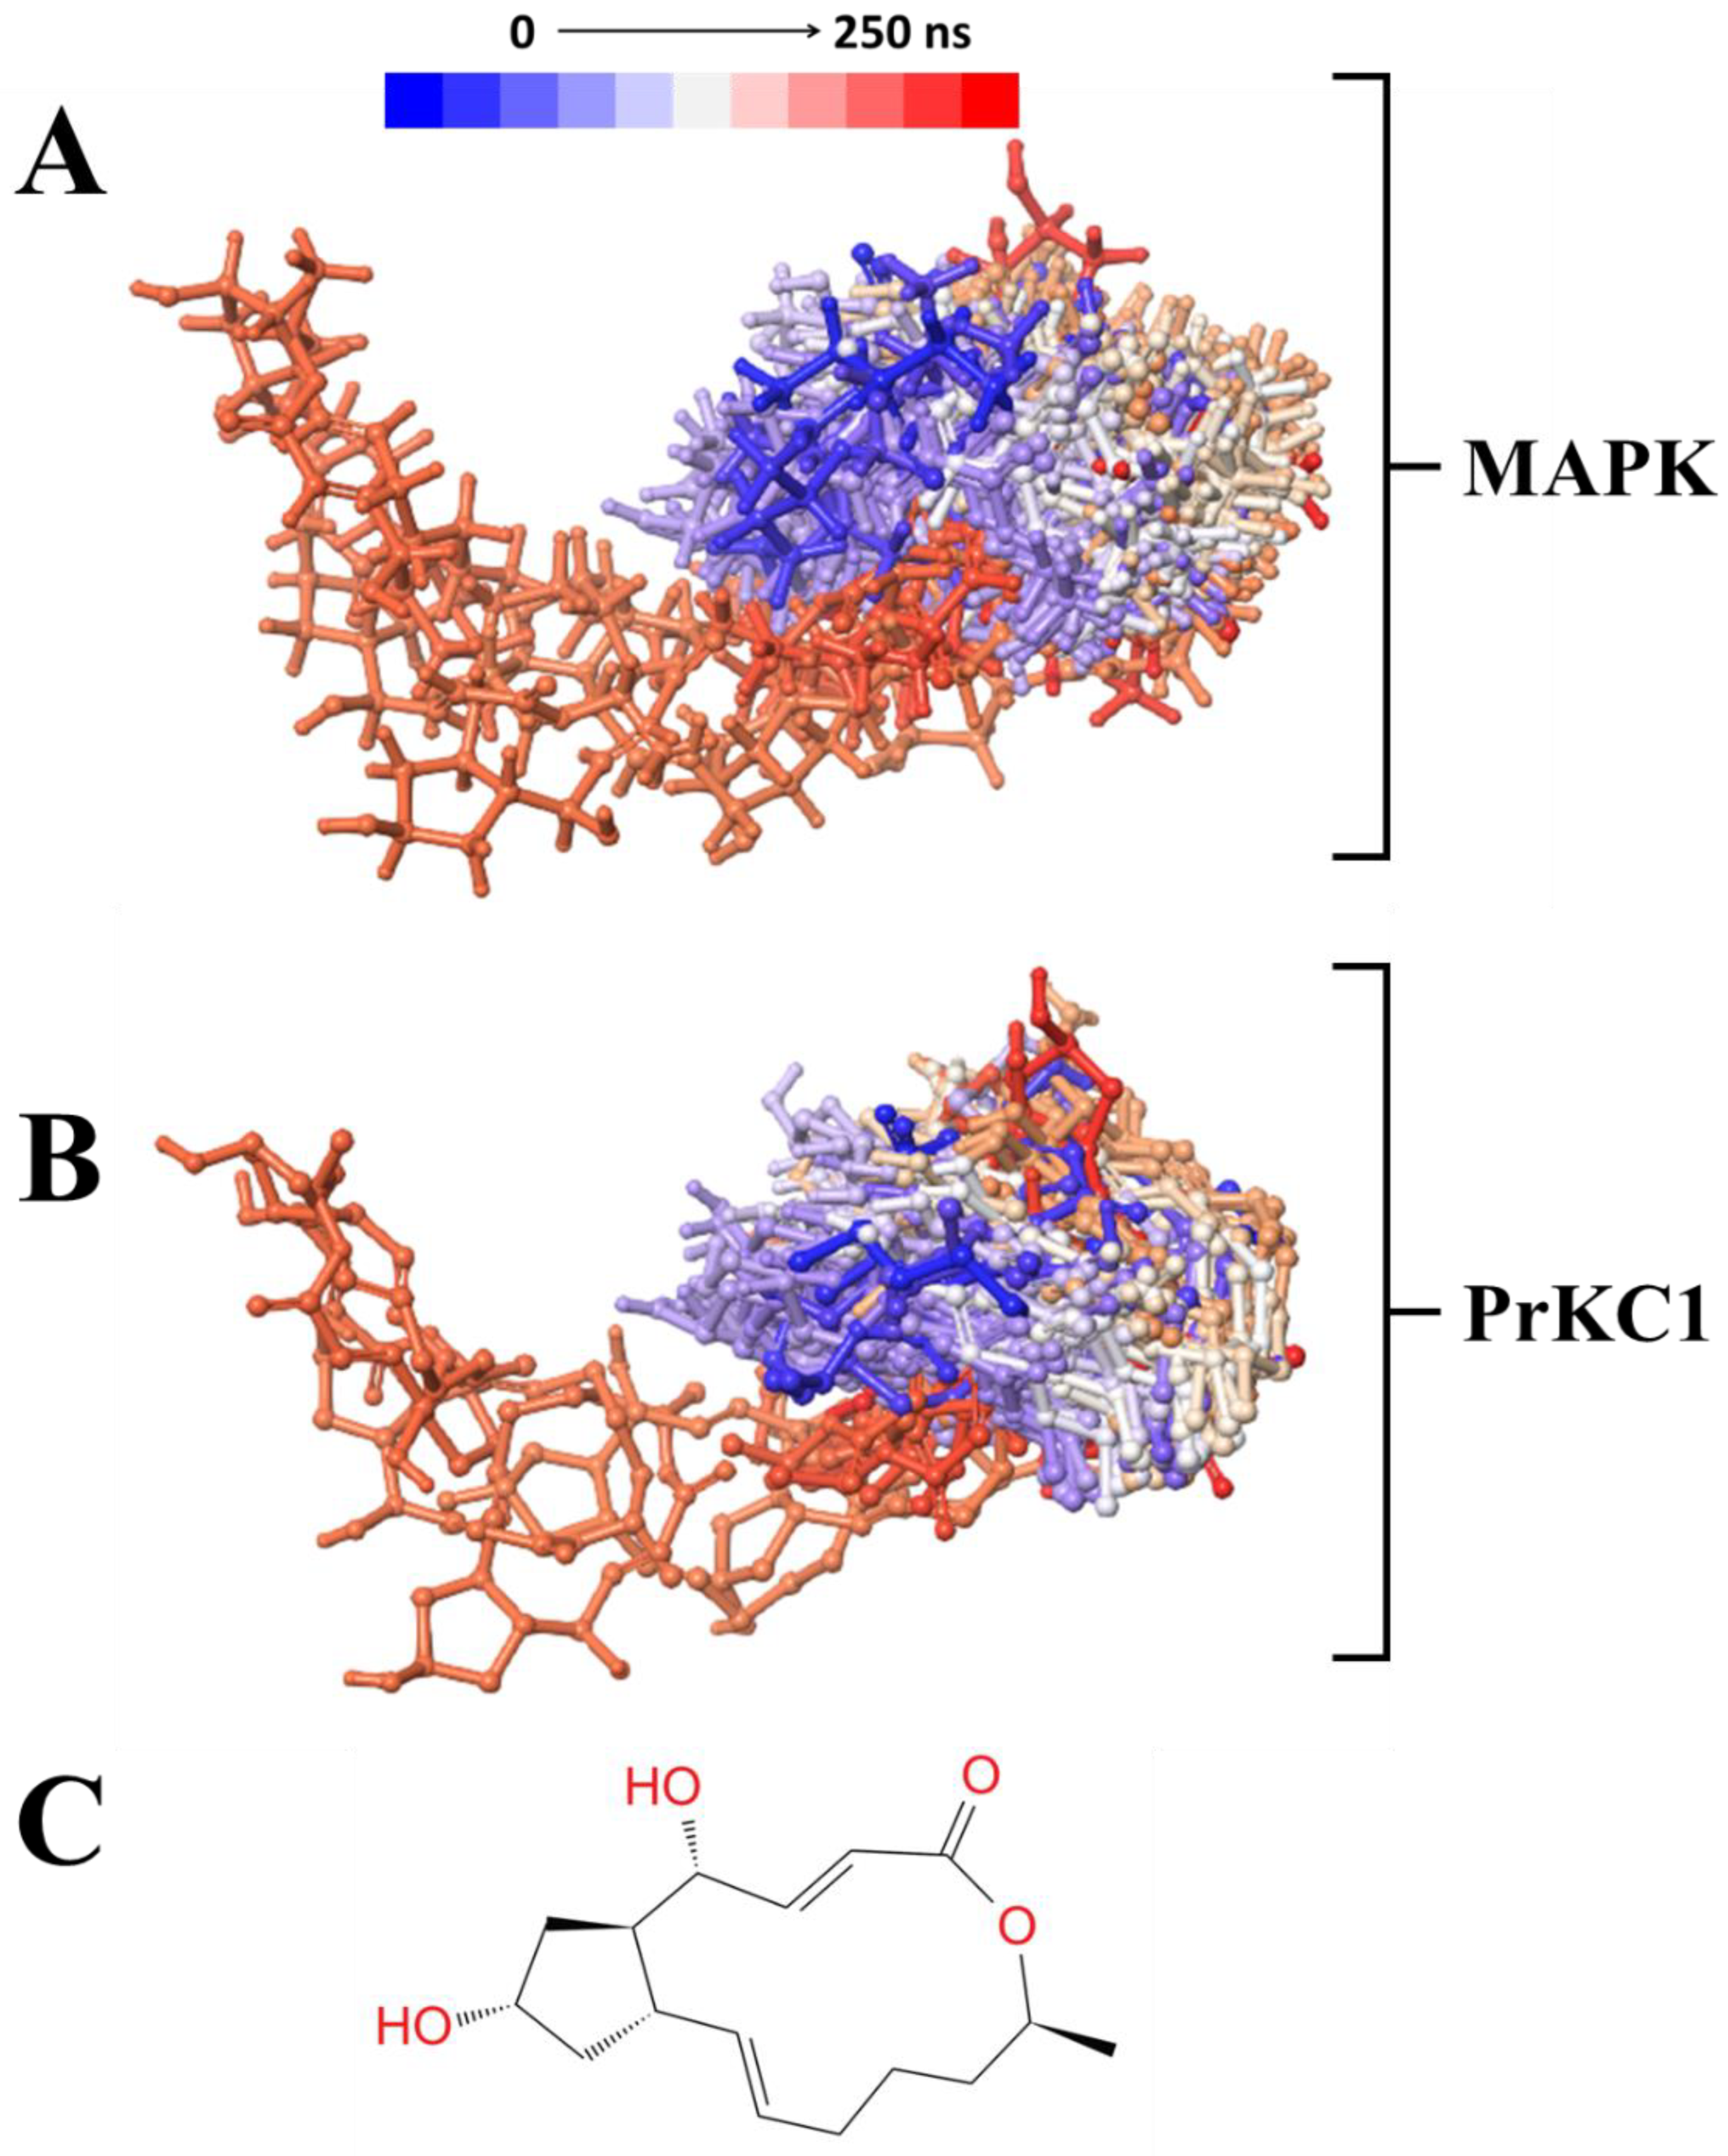
Figure 6.
2D interaction representation of BFA-associated MAPK and PrKC1 complexes, showing the difference between the docking and MD complex environment. A & C depict the docking complex environment, while B& D represent the MD environment, which gives an idea of the role of bulk which describes the typical physiological environment for better binding interaction stabilisation. .
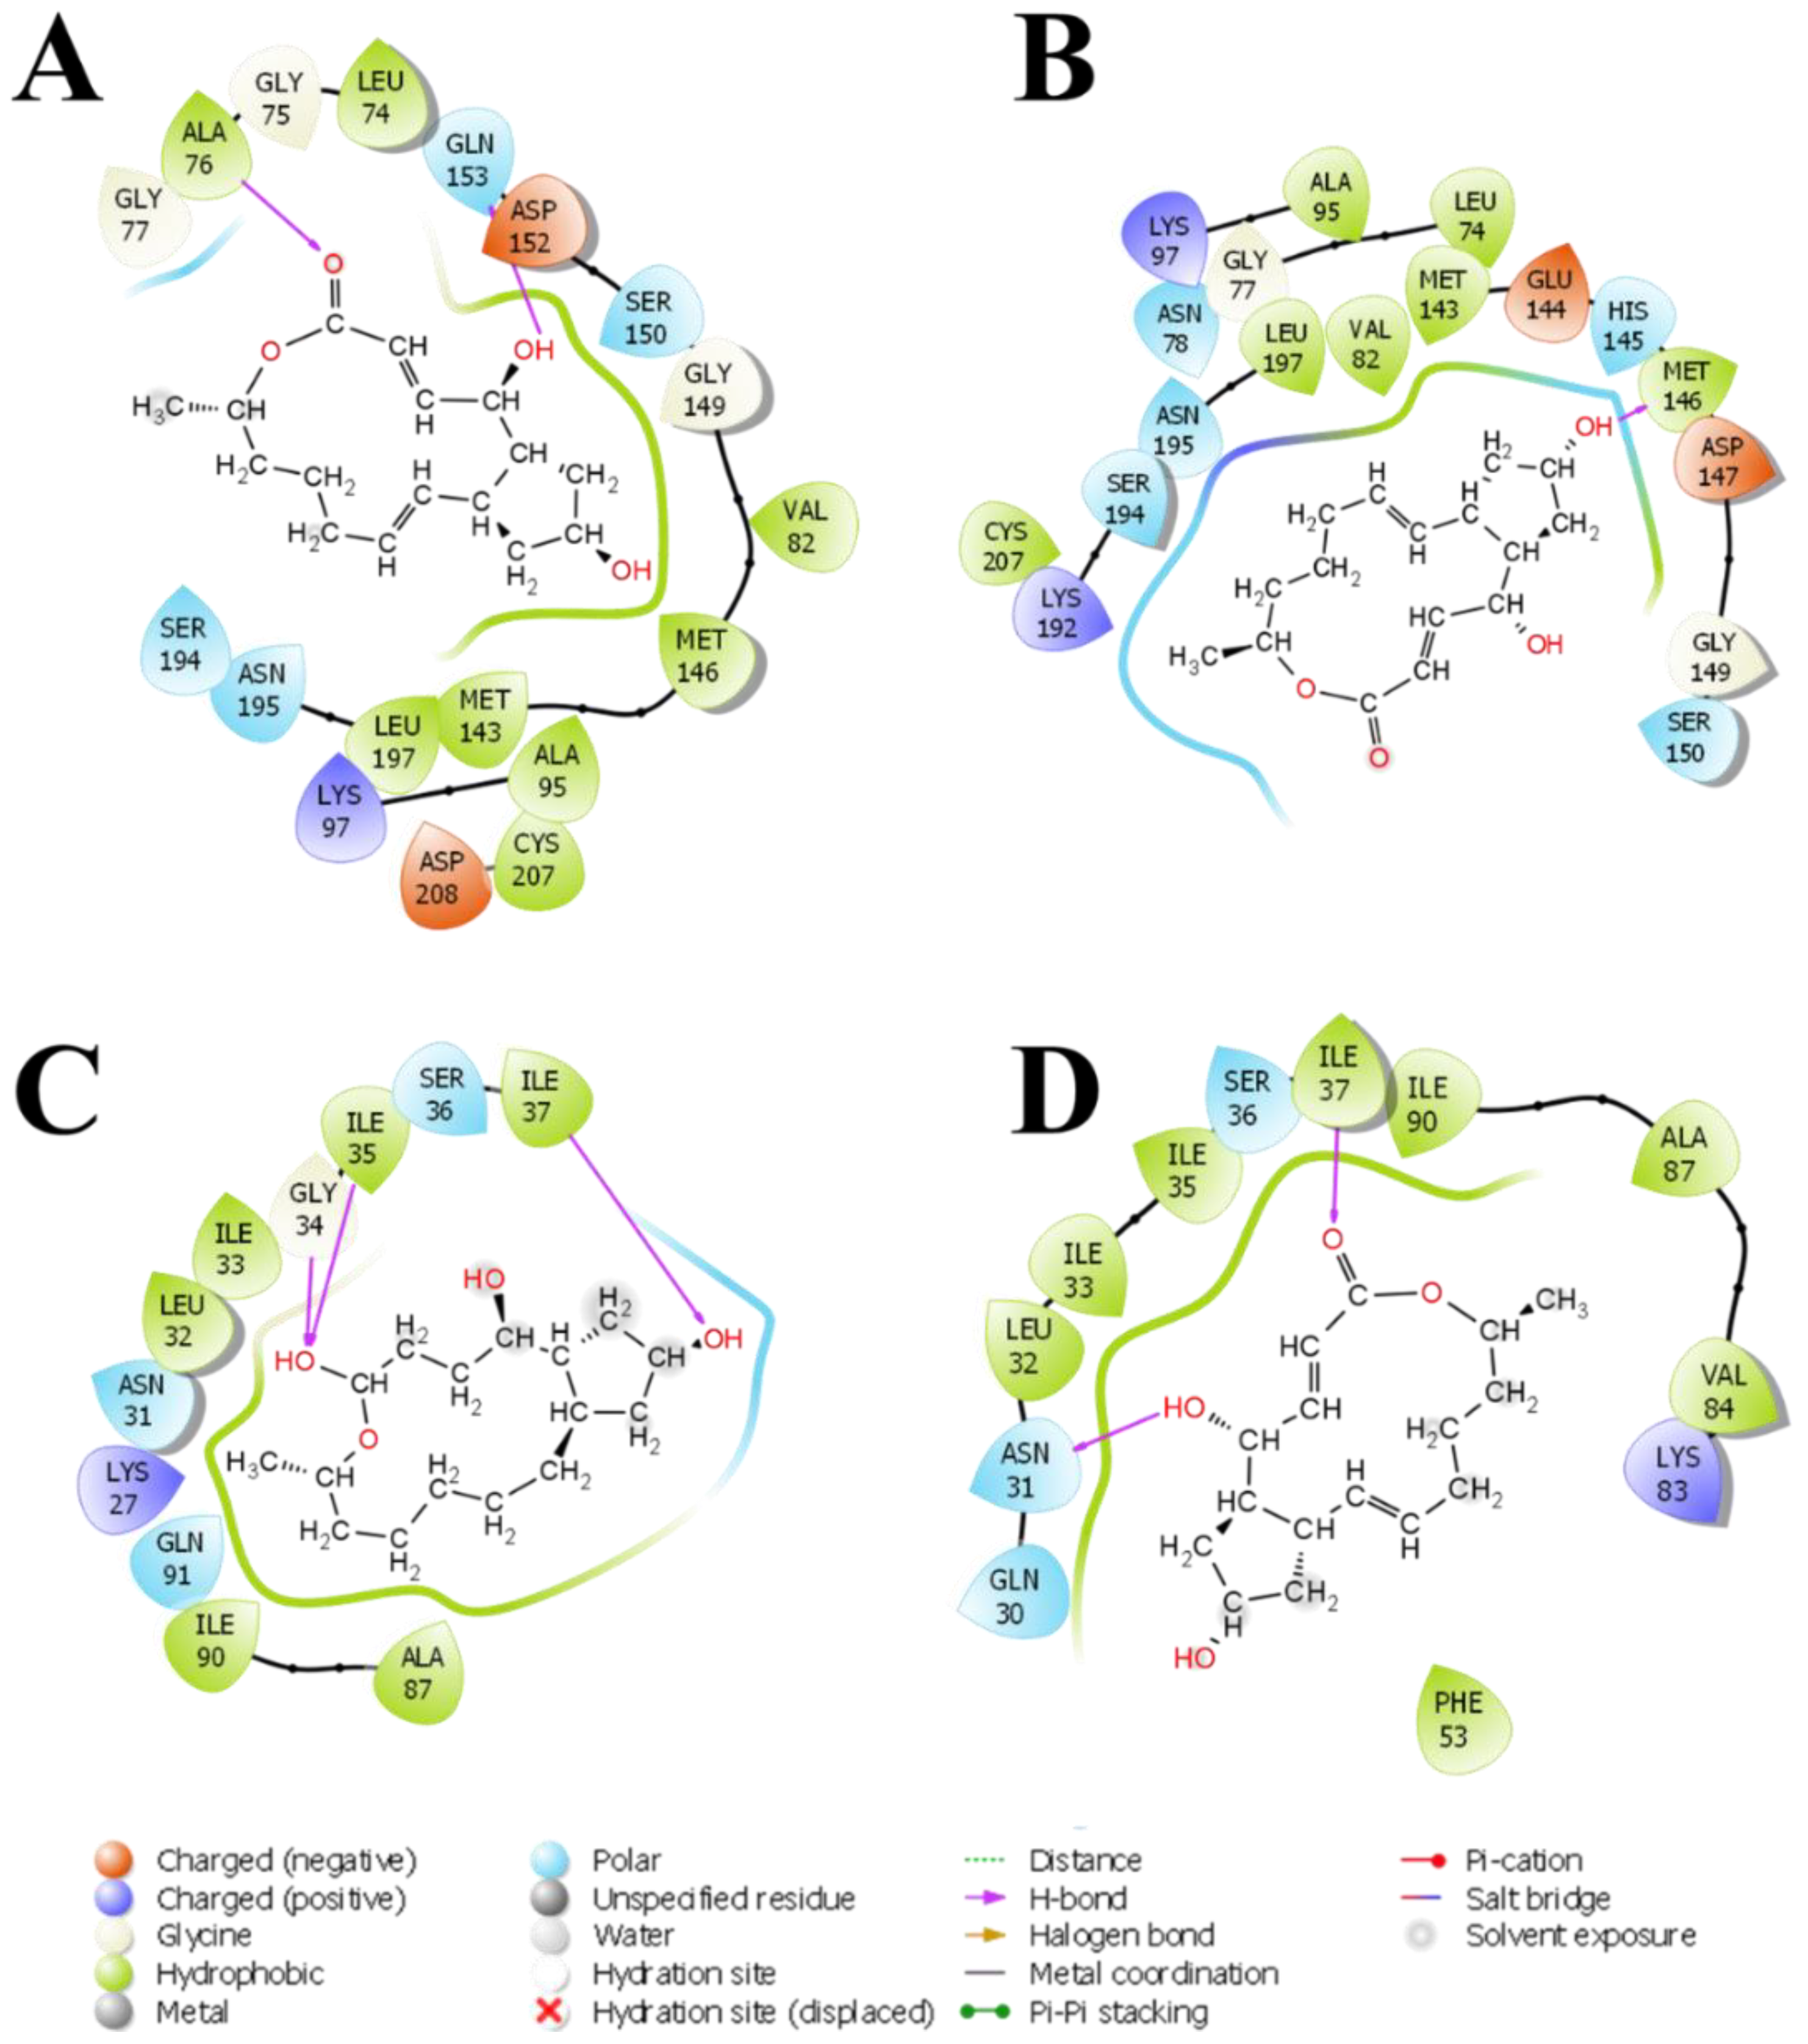
Figure 7.
2D interaction diagram for the average PDB, indicating the most dominant contributing residues to BFA's binding stabilisation with A. MAPK and B. PrKC1.
Figure 7.
2D interaction diagram for the average PDB, indicating the most dominant contributing residues to BFA's binding stabilisation with A. MAPK and B. PrKC1.
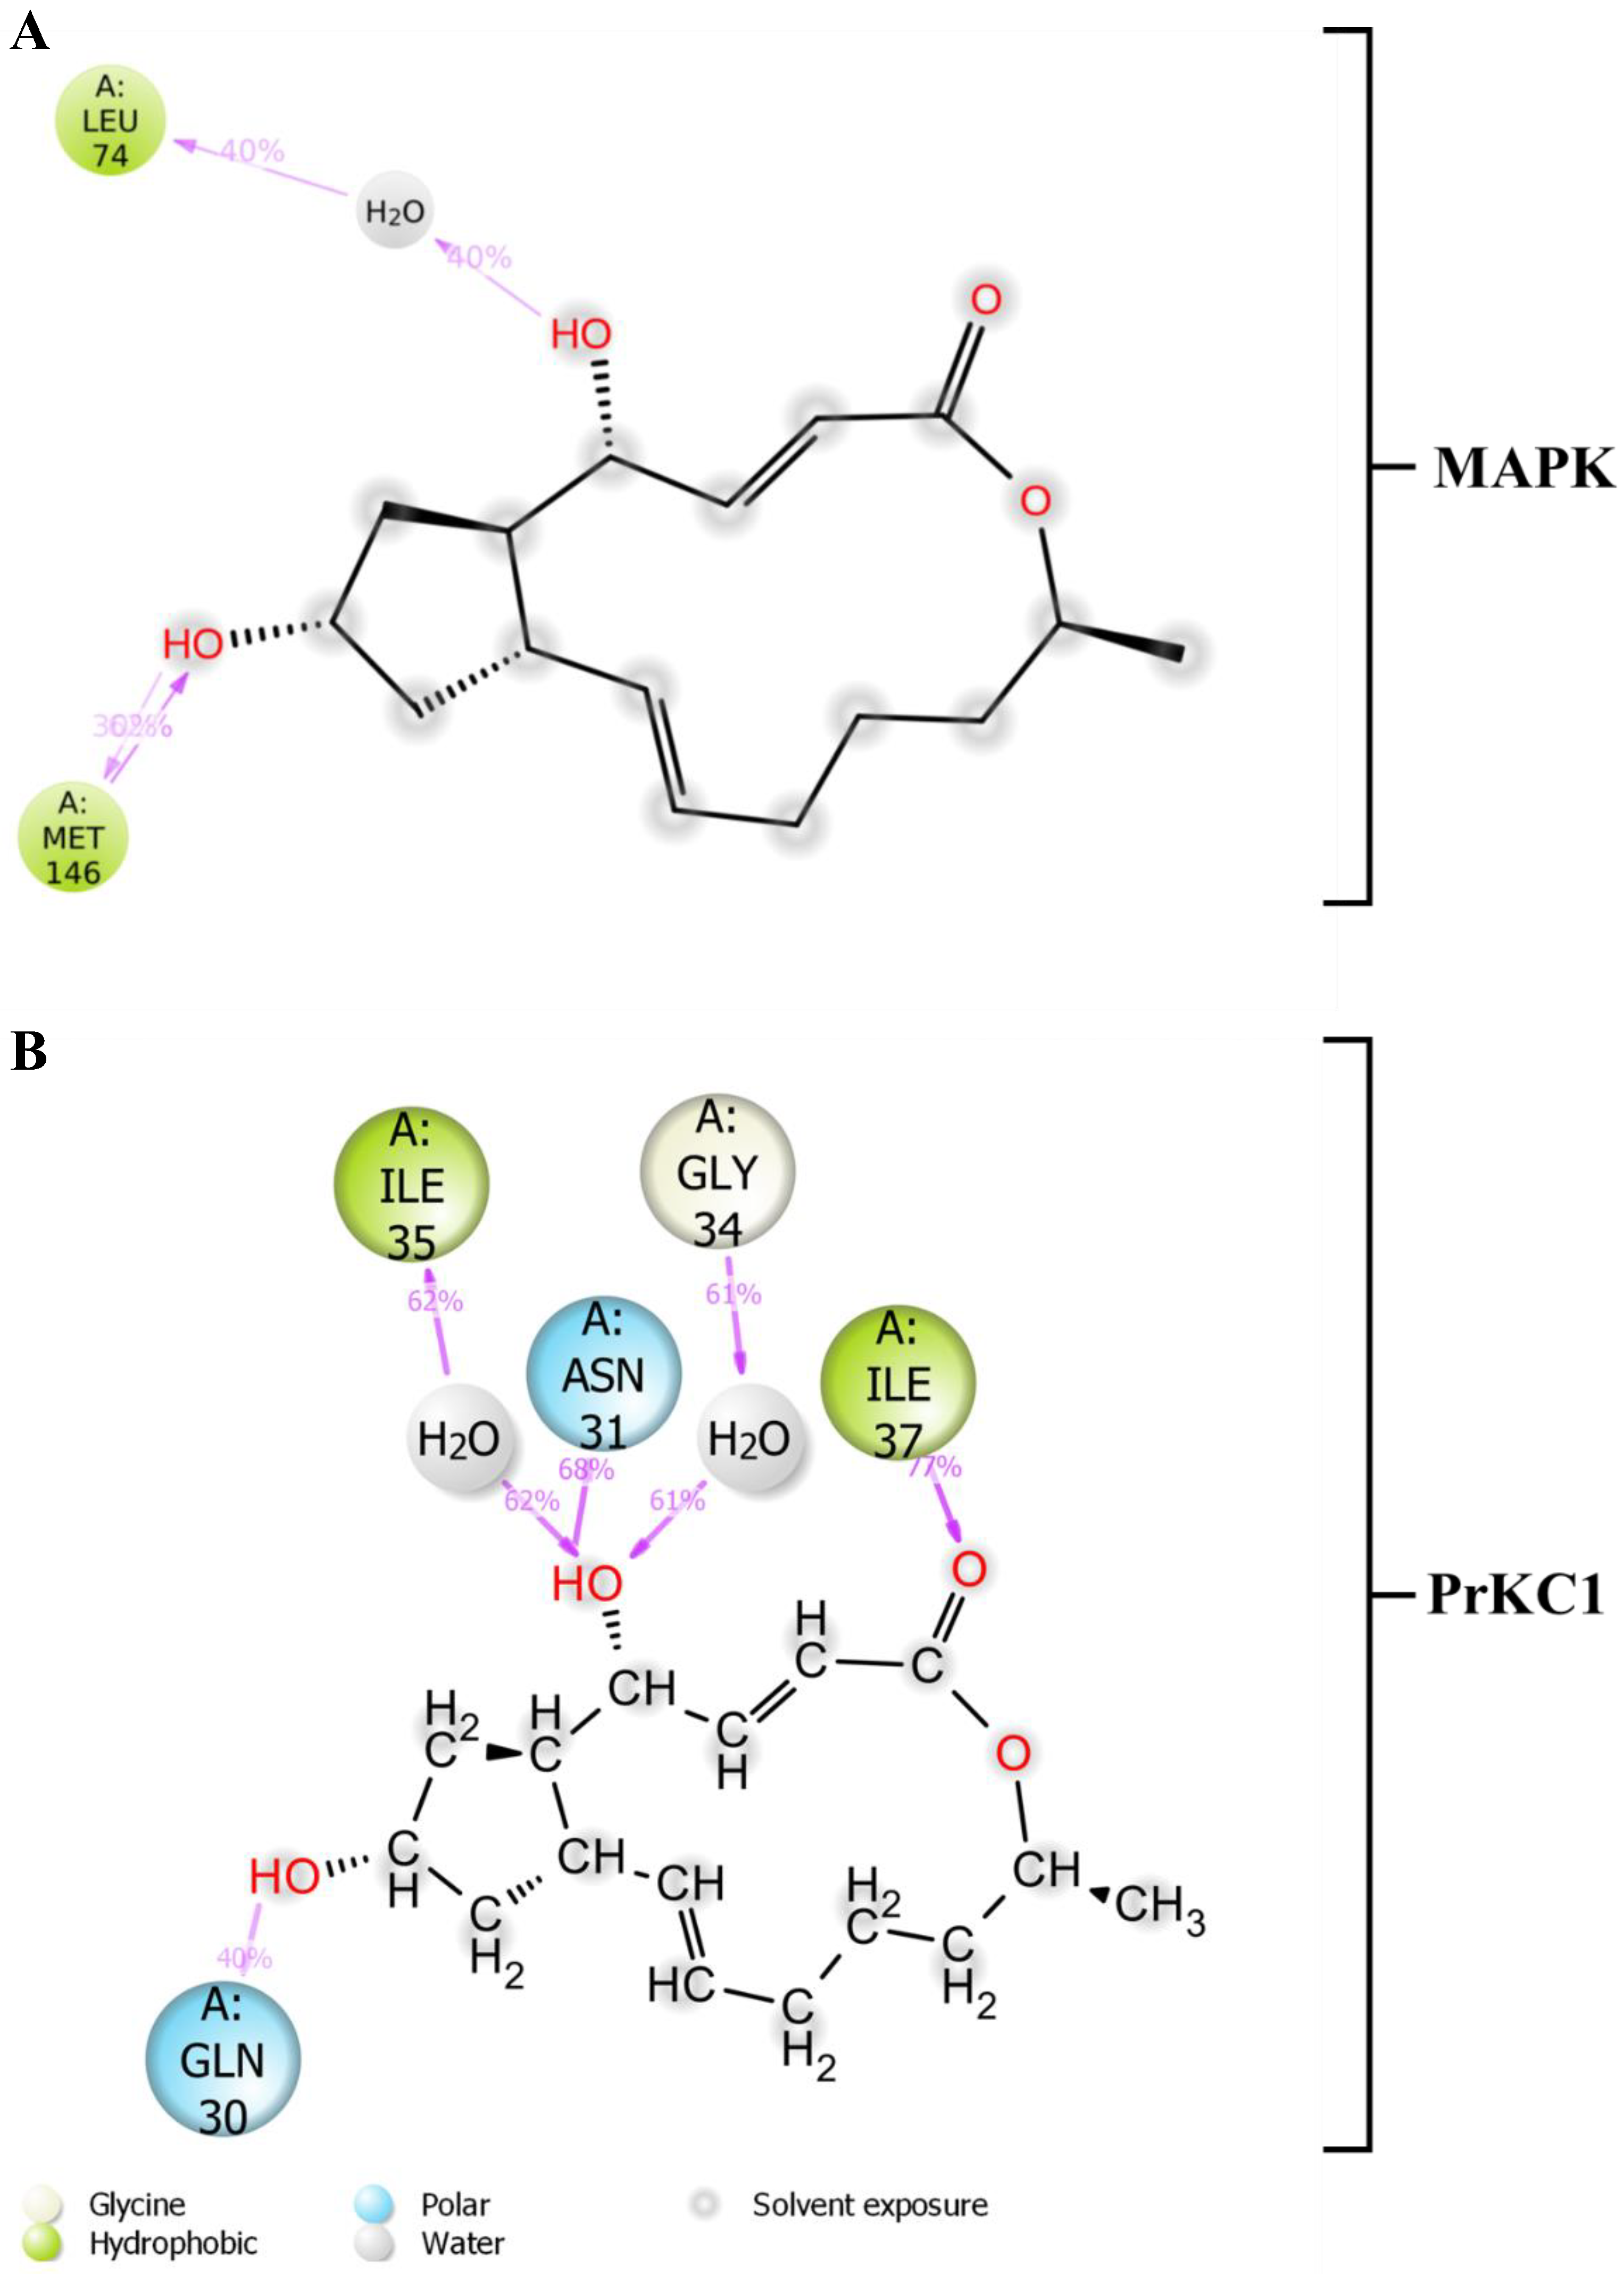
Figure 8.
Stacked bar charts of side chain interactions and interaction types between BFA complexed with (A) MAPK and (B) PrKC1 systems. H-bonds are categorised into backbone acceptor, backbone donor, side-chain acceptor, and side-chain donor. Hydrophobic interactions are classified into p-cation, p-p*, and non-specific interactions.
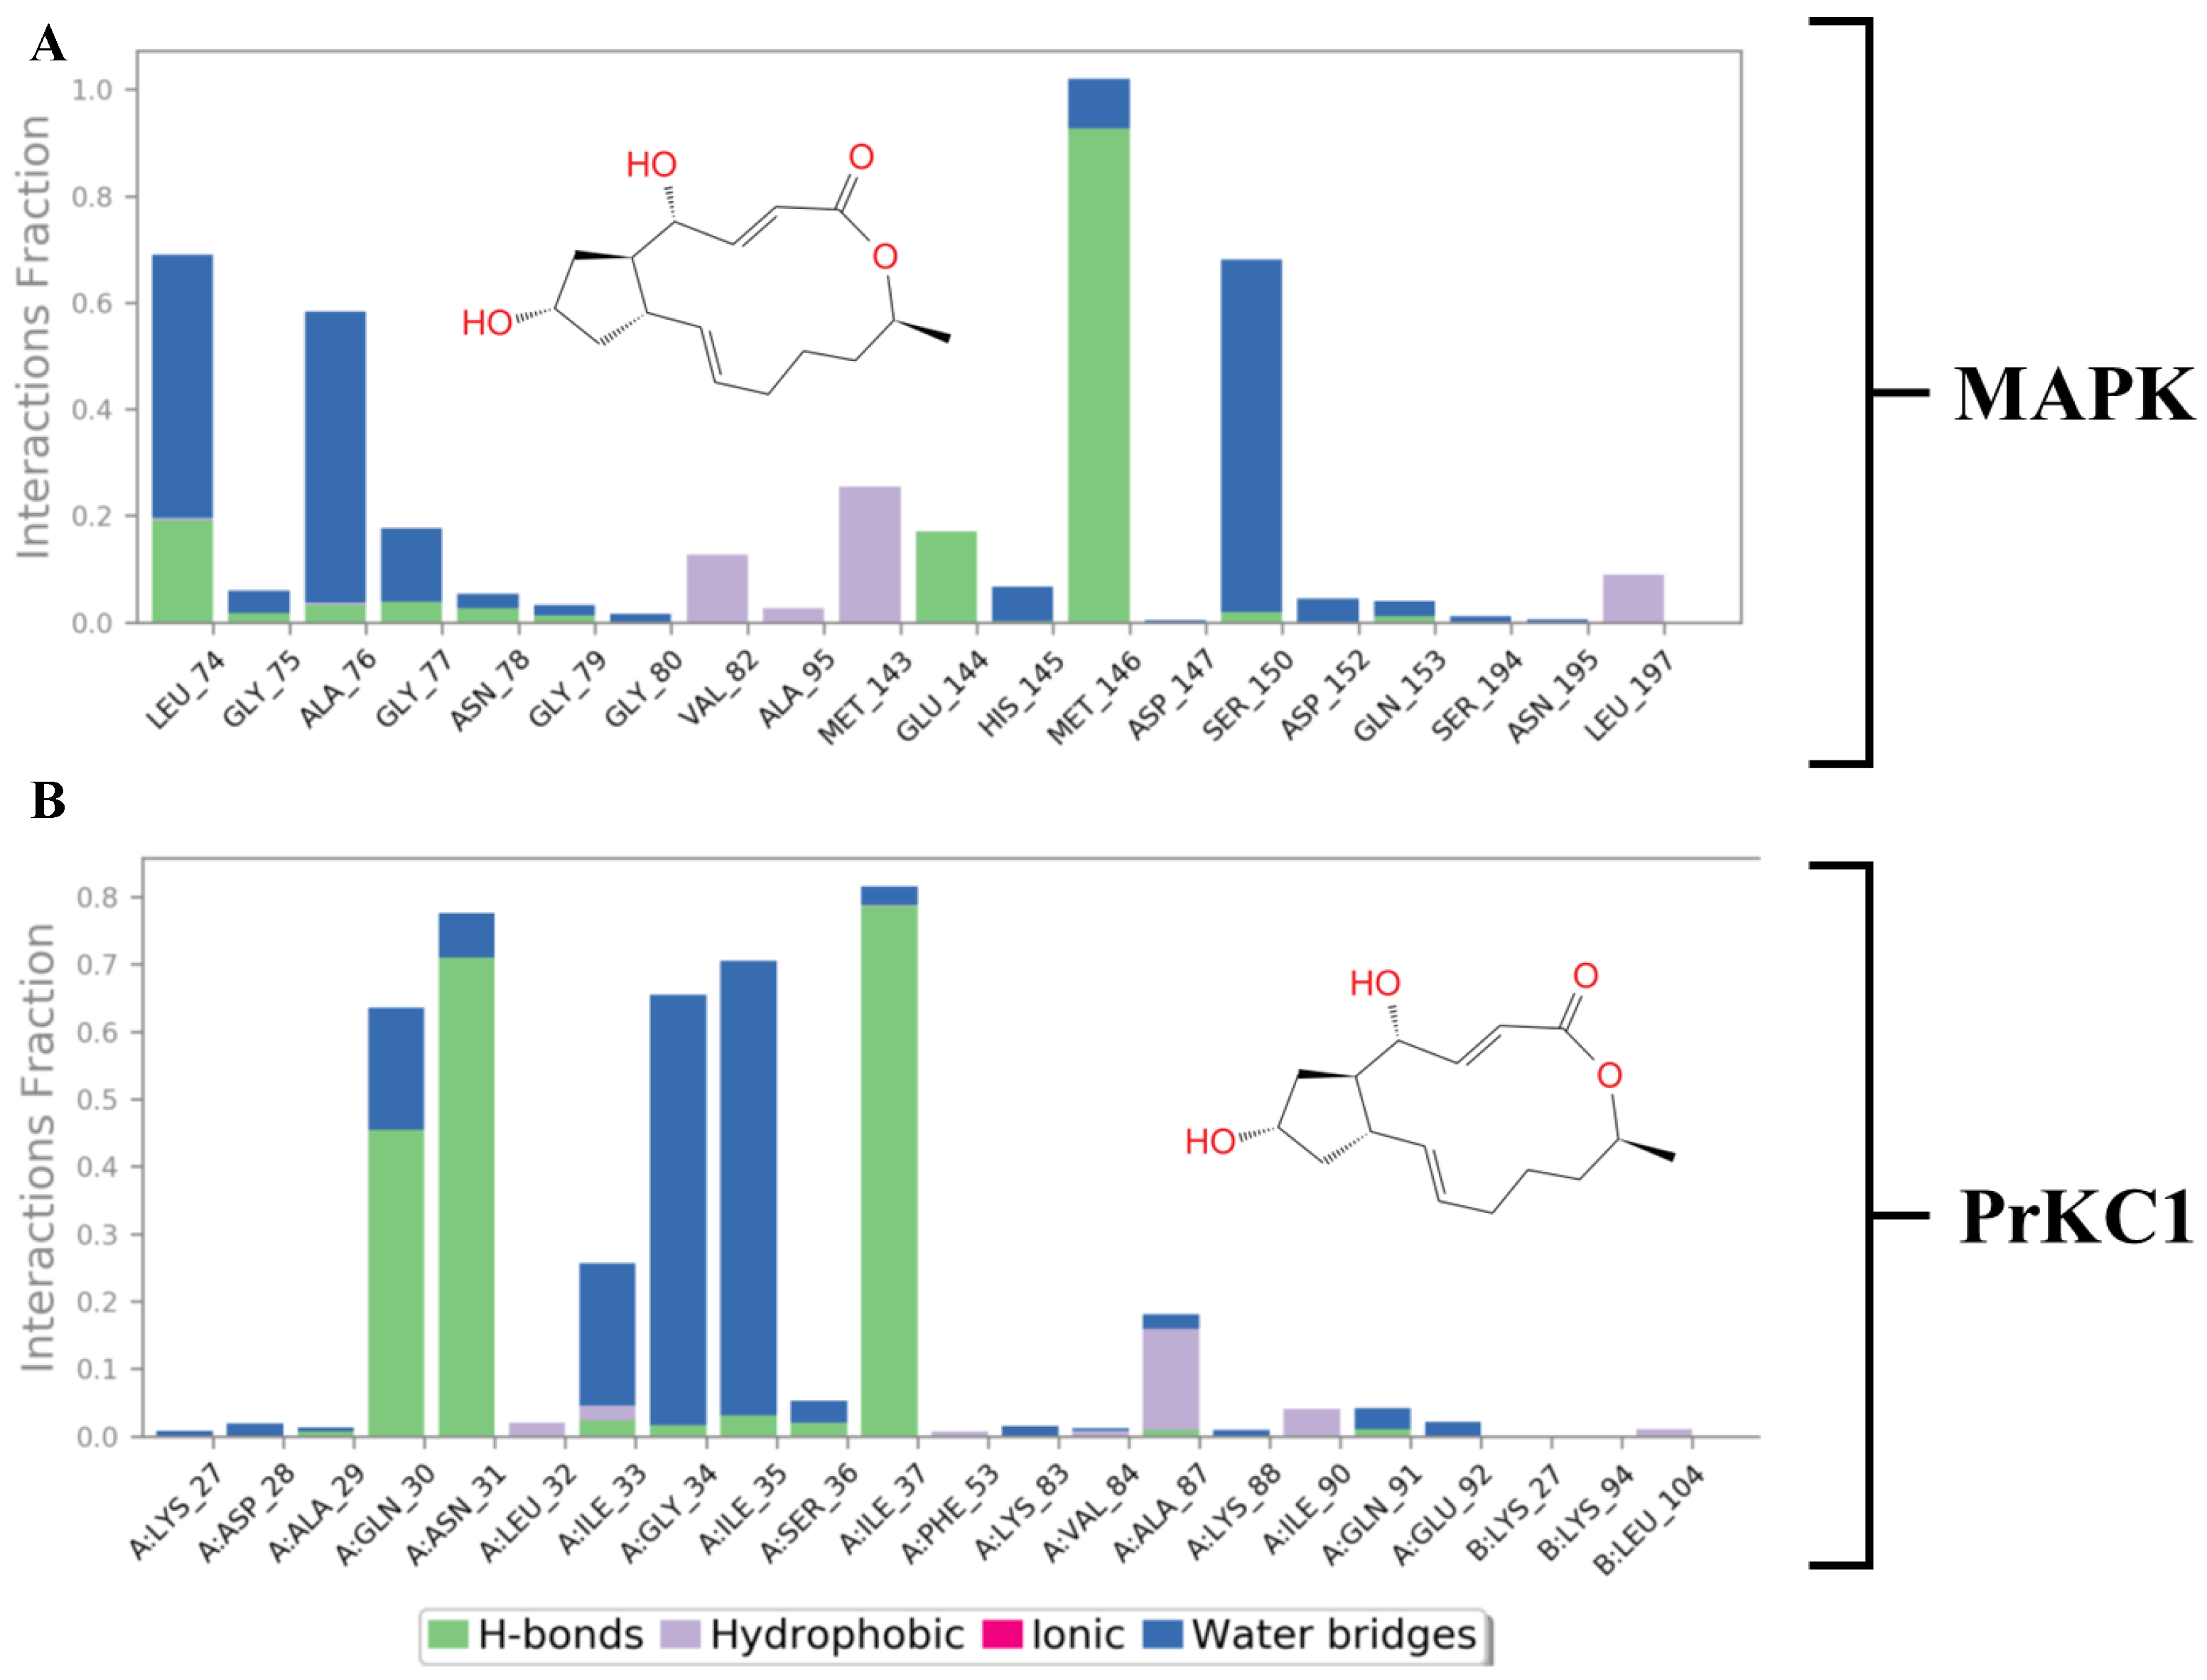
Figure 9.
Per-residue energy contribution concerning the binding interactions and dynamics of (A) MAPK and (B) PrKC1 to the binding of BFA, showing the electrostatic energy contribution to the total energy for binding stabilisation.
Figure 9.
Per-residue energy contribution concerning the binding interactions and dynamics of (A) MAPK and (B) PrKC1 to the binding of BFA, showing the electrostatic energy contribution to the total energy for binding stabilisation.
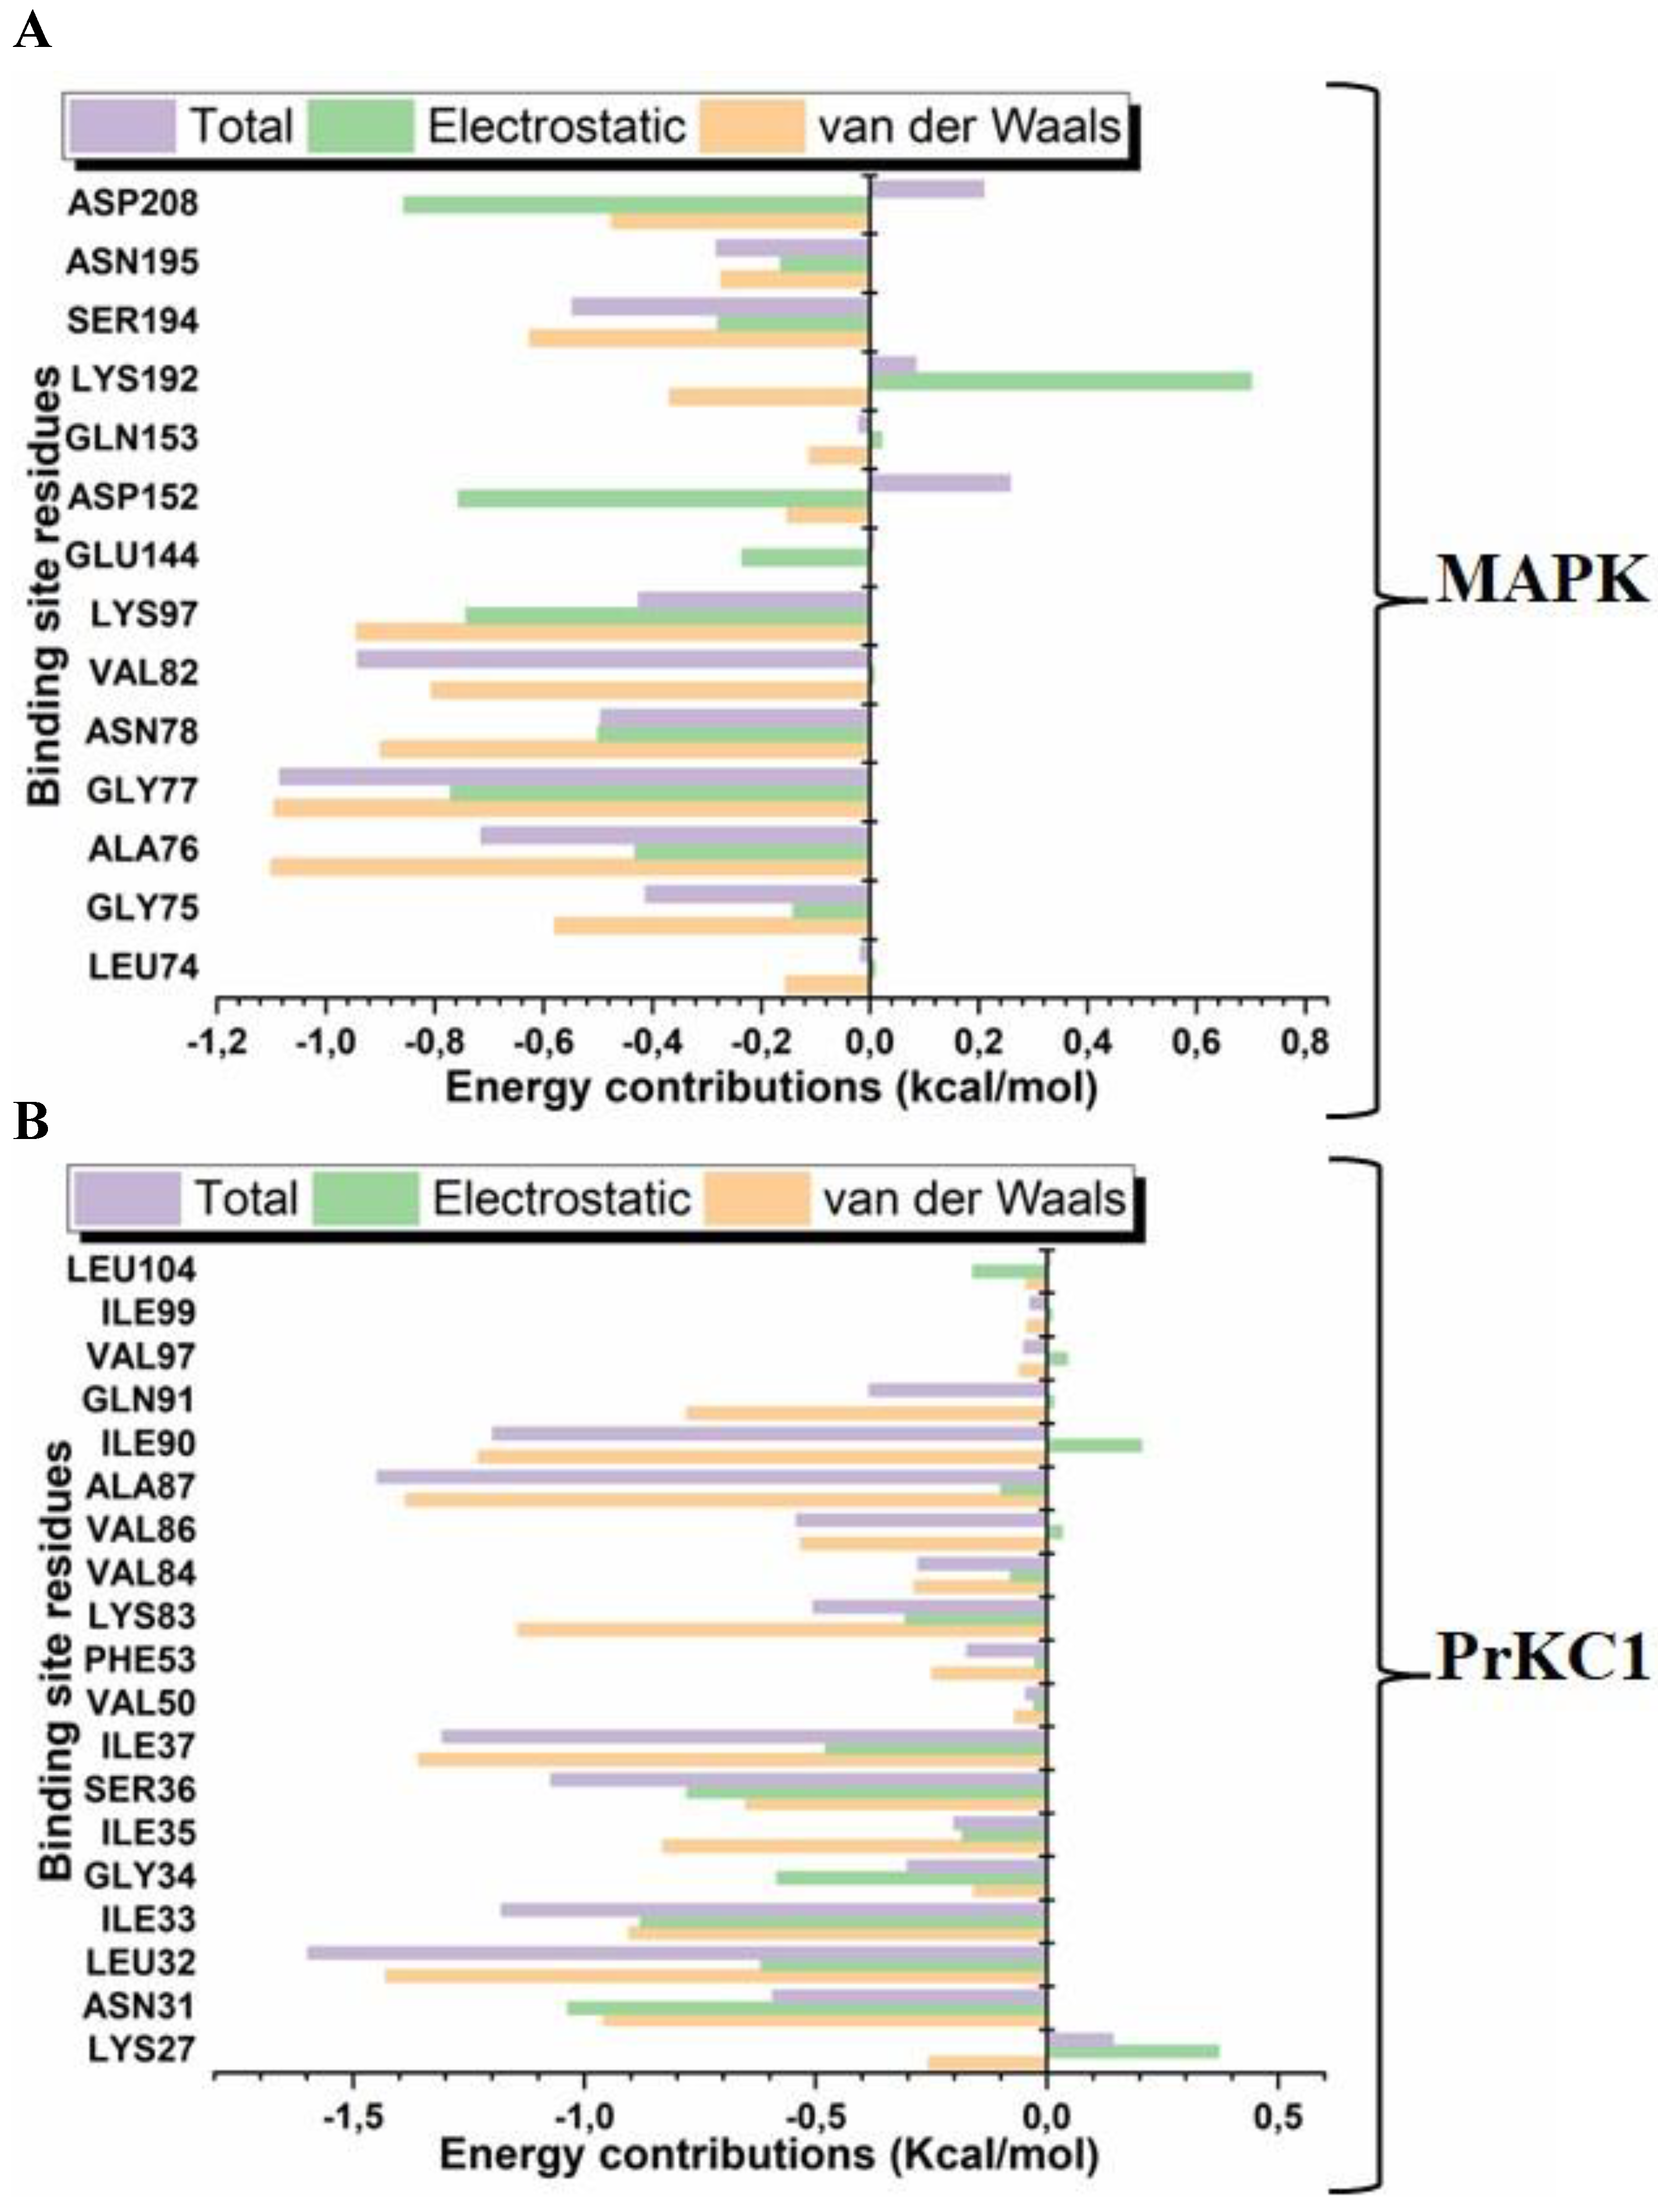
Figure 10.
PCA Analysis of PrKC1 Protein in Apo and Brefeldin A-Treated States. A. PCA plot of Cα RMSD data comparing apo (black) and Brefeldin A-treated (pink) proteins. PC1 captures 62.10 % of the variance, while PC2 captures 37.90 %. B. PCA plot of Cα RMSF data showing some overlap but distinct separation between apo (black) and Brefeldin A-treated (pink) states. PC1 explains 87.4 % of the variance, with PC2 explaining 12.6 %. C. PCA plot of RoG data demonstrating clear clustering for apo (black) and Brefeldin A-treated (pink) forms. PC1 accounts for 50.9 % of the variance, while PC2 accounts for 49.1 %.
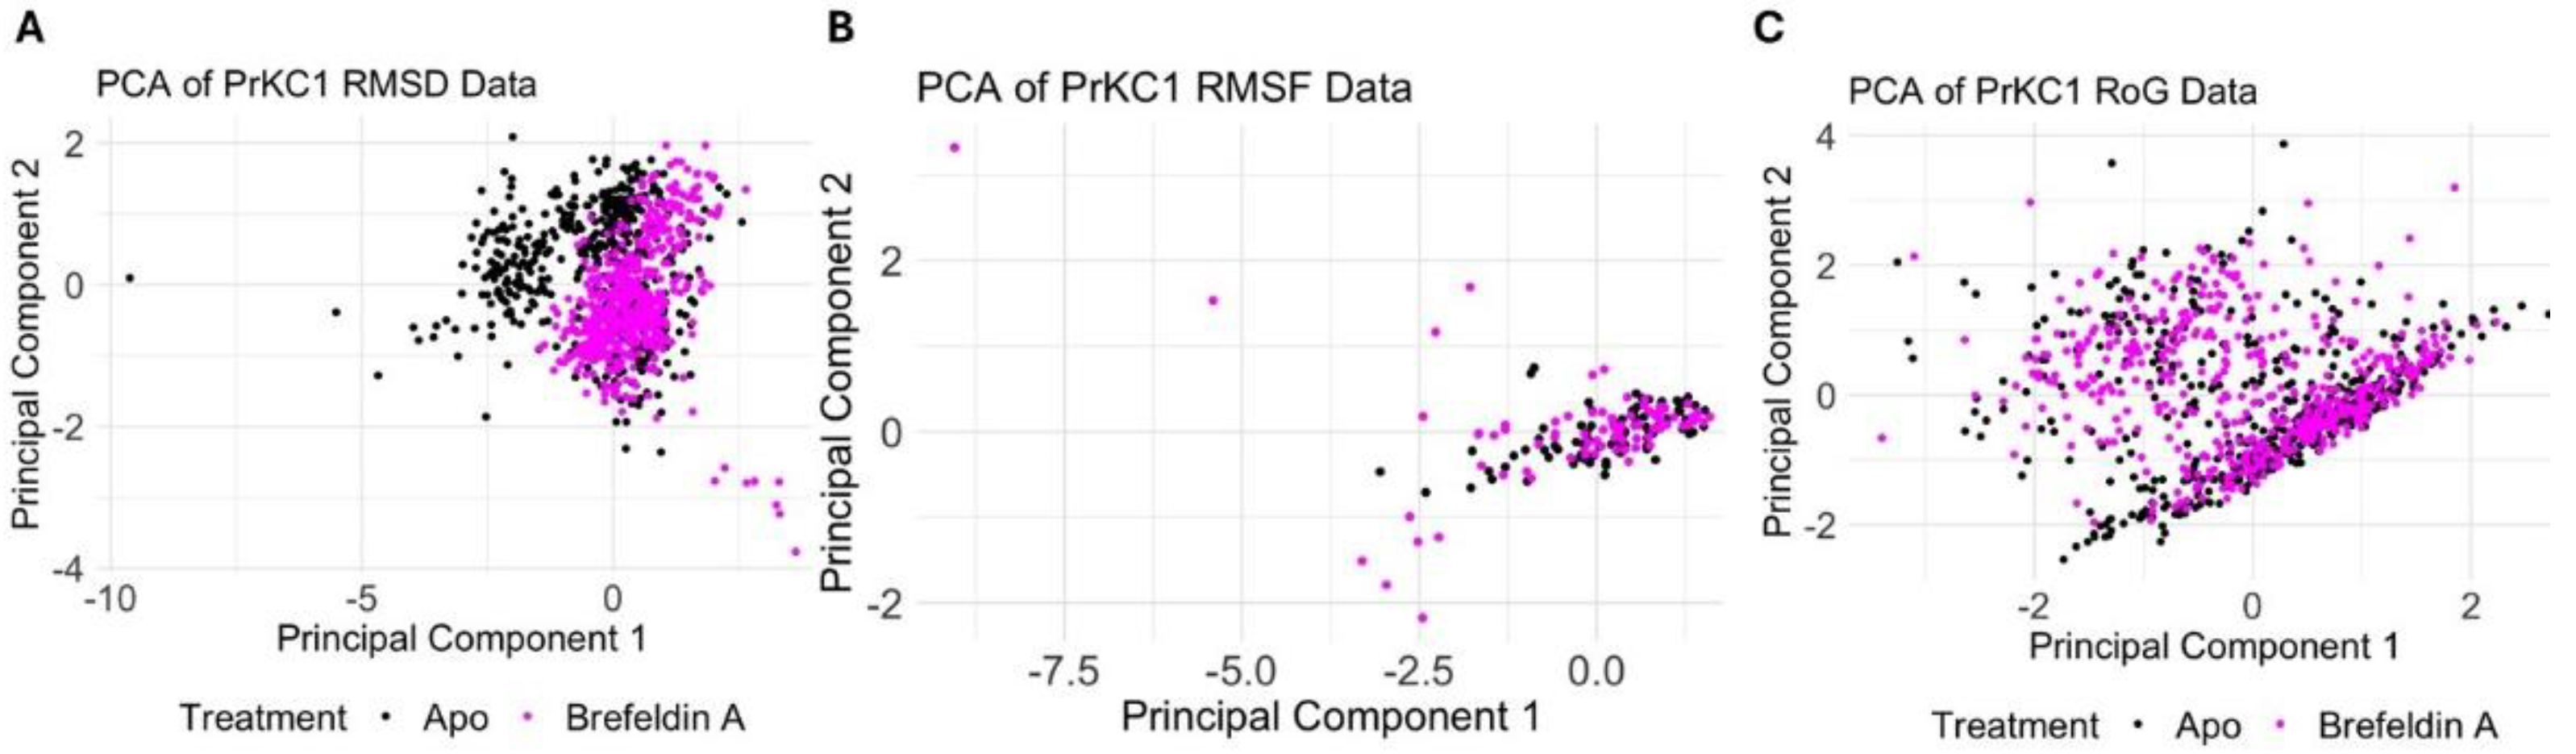
Figure 11.
PCA Analysis of MAPK Protein in Apo and Brefeldin A-Treated States. A. PCA plot of Cα RMSD data showing clear separation between apo (black) and Brefeldin A-treated (pink) proteins. PC1 captures 87.0 % of the variance, while PC2 captures 13.0 %. B. PCA plot of Cα RMSF data comparing apo (black) and Brefeldin A-treated (pink) proteins. PC1 explains 88.4 % of the variance, with PC2 explaining 11.6 %. C. PCA plot of RoG data highlighting distinct clustering for apo (black) and Brefeldin A-treated (pink) forms. PC1 accounts for 52.40 % of the variance, while PC2 accounts for 47.60 %.
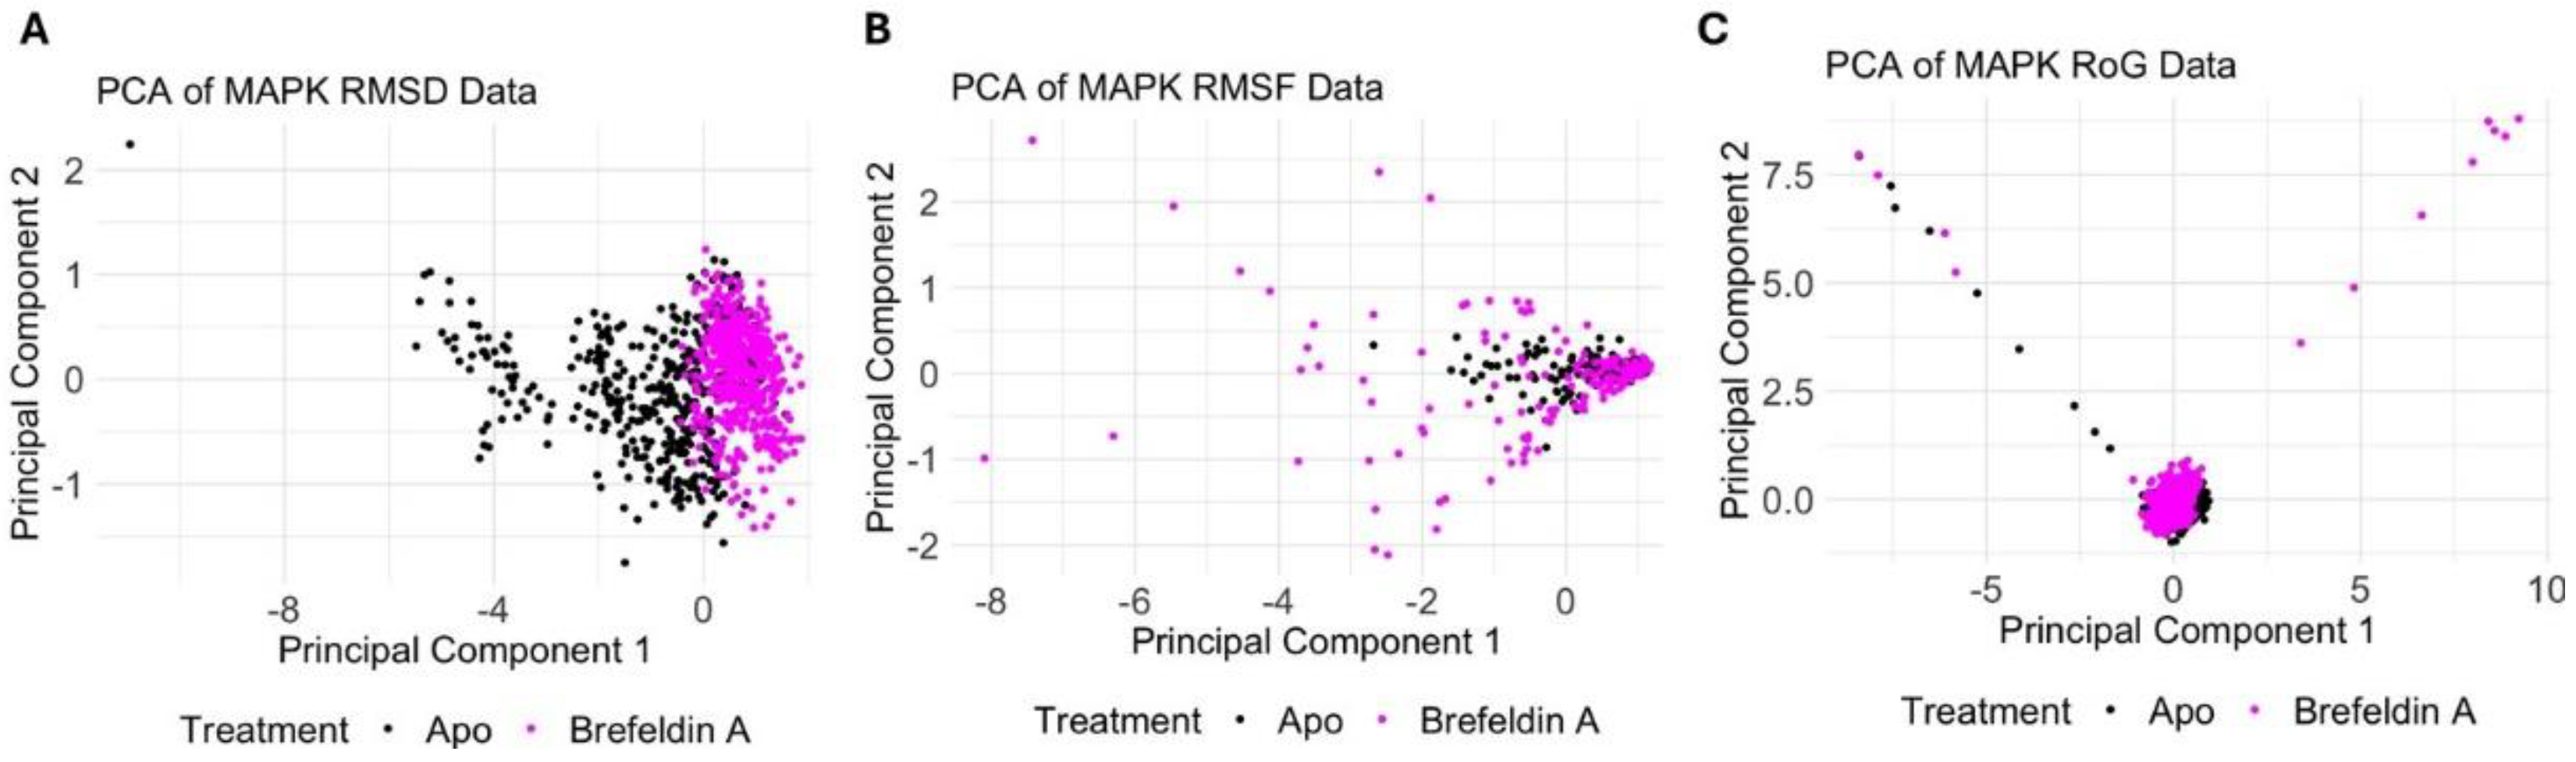
Table 2.
KEGG Pathway Analysis for BFA Target Proteins.
| Term description | Matching potential target proteins in the network |
| Pathways in cancer | PPARG,MAP2K1,AR,PRKCA,RPS6KA5,JAK1 |
| Proteoglycans in cancer | MAPK14,PDCD4,MAP2K1,PRKCA |
| PD-L1 expression and PD-1 checkpoint pathway in cancer | MAPK14,MAP2K1,JAK1 |
| MAPK signalling pathway | MAPK14,MAP2K1,PRKCA,RPS6KA5 |
| PI3K-Akt signalling pathway | MAP2K1,PRKCA,JAK1 |
| AGE-RAGE signalling pathway in diabetic complications | MAPK14,PRKCA |
Disclaimer/Publisher’s Note: The statements, opinions and data contained in all publications are solely those of the individual author(s) and contributor(s) and not of MDPI and/or the editor(s). MDPI and/or the editor(s) disclaim responsibility for any injury to people or property resulting from any ideas, methods, instructions or products referred to in the content. |
© 2025 by the authors. Licensee MDPI, Basel, Switzerland. This article is an open access article distributed under the terms and conditions of the Creative Commons Attribution (CC BY) license (http://creativecommons.org/licenses/by/4.0/).
Copyright: This open access article is published under a Creative Commons CC BY 4.0 license, which permit the free download, distribution, and reuse, provided that the author and preprint are cited in any reuse.


