
Submitted:
24 June 2025
Posted:
25 June 2025
You are already at the latest version
Abstract
This research examines the impact of shared autonomous vehicles on fostering social equity within Tehran's urban transportation framework, particularly concerning vulnerable populations such as individuals with disabilities, children, and the elderly. To achieve this, a mixed-method approach was utilized, executed in two phases. In the initial phase, employing experiment design methodology, 25 scenarios were crafted based on the integration of four social equity indicators: accessibility, cost, distribution of transport modes, and service satisfaction. These scenarios were subsequently assessed by transportation specialists. In the second phase, field data were gathered through a distinct questionnaire distributed to three vulnerable groups throughout Tehran. The data was analyzed utilizing a multinomial logit model. The novelty of this study is found in its provision of a comprehensive framework that merges the analysis of designed scenarios with field evaluations from vulnerable groups, with the objective of evaluating social equity in the context of emerging transportation technologies. The results of the analysis demonstrated that the average values of all four indicators experienced a significant increase following the introduction of shared autonomous vehicles. Specifically, accessibility improved from 2.7 to 3.76 (a 39.26% increase), cost enhanced from 2.53 to 3.47 (a 37.17% increase), the distribution of transport modes rose from 2.9 to 3.81 (a 31.38% increase), and satisfaction increased from 2.67 to 3.45 (a 29.23% increase). The sensitivity analysis of the model indicated that, among the four indicators, accessibility emerged as the most critical and influential factor in promoting social equity. Before the advent of this technology, the overall social equity level was rated at 2 (poor), but following the implementation of shared autonomous vehicles, this rating improved to 3 (moderate).
The results of this research indicate that shared autonomous vehicles may function as a valuable resource for creating intelligent, inclusive, and fair transportation systems, especially for at-risk populations. These findings can provide a basis for policymakers to formulate equity-focused initiatives for the future of transportation.
Keywords:
shared autonomous vehicles
; vulnerable users
; multinomial logit model
; social equity
; experts
1. Introduction
Recent advancements in transportation technologies, particularly the emergence of shared autonomous vehicles, have the potential to instigate significant changes in enhancing accessibility and promoting transportation equity. While this technology may create new avenues for improving urban mobility, its effects on various social groups and spatial disparities necessitate thorough examination. One of the primary challenges within urban transportation systems is the inequality in access to vehicles and transport services, a concern that can intensify social division among different segments of society. In this regard, shared autonomous vehicles, as a novel solution, have the capacity to mitigate these disparities. However, accurately evaluating the degree of their impact on vulnerable populations remains an essential requirement. Numerous studies have investigated accessibility concerning shifts in household demand patterns and mobility [1,9], yet the connection between shared autonomous vehicle technology and transportation equity still demands more extensive research. Access to this technology may yield varying results based on social, economic, and geographical contexts; it has the potential to either alleviate existing inequalities, particularly among income groups and across urban and rural areas, or even worsen them. Some prior studies have also highlighted that the effects of accessibility to shared autonomous vehicles, shaped by implementation policies, may result in either enhancement or decline of the current circumstances [2,3,4]. This study aims to explore the role of shared autonomous vehicles in fostering social equity within the urban transportation framework, with a particular emphasis on vulnerable groups such as the elderly, individuals with disabilities, and children.
This research aims to ascertain whether shared autonomous vehicles can be effectively employed as a means to mitigate transportation disparities and enhance social equity. The primary emphasis of the study revolves around four essential indicators: accessibility, cost, distribution of transportation modes, and satisfaction with transportation services. In developing a social equity model within the transportation framework, insights from experts in transportation planning were leveraged, and utility functions for five tiers of social equity were constructed based on their assessments. To evaluate and analyze the degree of social equity in urban transportation access, an experiment design methodology was utilized. In this regard, four principal indicators (cost, accessibility, satisfaction, and mode distribution) were identified as significant factors influencing social equity. The integration of these variables resulted in the creation of 25 hypothetical scenarios, which were presented in a questionnaire format to a cohort of specialists in transportation, urban planning, and social equity. These experts assessed the scenarios and established the extent of social equity realization across five levels (very poor, poor, moderate, good, and very good). The data acquired from this assessment served as the foundation for modeling and analyzing the utility functions of social equity. To facilitate a more comprehensive examination of social equity, a specialized questionnaire was crafted and administered to three target demographics (individuals with disabilities, the elderly, and children). The information gathered from these groups was integrated into the expert evaluation models, and the state of social equity was comparatively analyzed under two conditions: prior to and following the implementation of shared autonomous vehicles.
This research investigates two essential questions: 1. To what degree can shared autonomous vehicles alleviate current disparities in transportation social equity for at-risk populations, and what contribution do they make towards its enhancement? 2. In what ways do transportation metrics including accessibility, cost, mode distribution, and user satisfaction shift for these demographics before and after the deployment of the shared autonomous vehicle system? The overall framework of the paper is structured into six primary sections to methodically address the research process from theoretical underpinnings to conclusive outcomes. Section two examines existing literature and concepts pertinent to social equity in transportation to furnish the requisite theoretical context for the analyses. Section three delineates the research methodology, outlining the research strategy, data collection instruments, and the target population of the study. Section four showcases the outcomes of the questionnaire data analysis and interprets the results based on significant indicators. Section five focuses on modeling and sensitivity analysis, where the impacts of various factors on the perceived level of social equity are scrutinized and assessed. Lastly, section six encompasses a summary of the findings, underscores the research innovations, and provides recommendations for urban transportation policymakers, emphasizing emerging technologies such as shared autonomous vehicles.
2. Literature Review
Autonomous vehicles have emerged as a significant area of research within the domain of intelligent transportation. These vehicles function without direct human control, undertaking the responsibilities of driving and navigation. By employing sensors and sophisticated algorithms, they autonomously evaluate and interpret road and traffic conditions [5]. Autonomous vehicles are categorized into six distinct levels, ranging from level zero to level five, according to the extent of automation and their capacity to respond to environmental factors. The advent of this technology brings about shifts in users’ perceptions and attitudes regarding vehicle usage and the related travel expenses [6]. Access refers to the degree to which land use and transportation systems, through the integration of various transportation modes, allow individuals to reach their activities or destinations [3]. Equity in transportation access is a fundamental principle in policy-making within this sector. The two primary objectives in this context are to enhance the level of access and to ensure its equitable distribution among diverse social groups and geographical areas, both of which influence the sustainability and fairness of the transportation system [7,8,9]. In the forthcoming decades, autonomous vehicles are poised to significantly transform accessibility levels and affect equity-related issues in transportation [10]. Shared autonomous vehicles are self-sufficient vehicles that can be utilized in two manners: asynchronously, where they are solely used by one person for a single journey before being reassigned to another individual; or synchronously, where multiple users can share the vehicle for a portion of the trip, even if they are not acquainted with one another [11]. The policy promoting synchronous (shared) vehicle usage enhances fleet utilization advantages and boosts the overall efficiency of the transportation system [12]. An analysis of autonomous vehicles in the Southern California region has been conducted concerning vehicle miles traveled, emissions, and transportation equity.
The findings indicate that utilizing these vehicles results in a 10% rise in vehicle miles traveled and emissions, while also diminishing travel equity across various income groups. To address these effects, a series of travel demand management policies have been suggested, aimed at decreasing vehicle miles traveled and emissions, as well as enhancing travel equity [13]. Autonomous vehicles may have both beneficial and detrimental effects on social equity for marginalized groups. Research on policies concerning connected autonomous vehicles categorizes them into three primary domains: accessibility, multimodal transportation, and social welfare. The majority of these policies emphasize shared-use models and economic implications; however, aspects such as the oversight of low-income individuals, people of color, security issues in shared vehicles, and the difficulties encountered by rural communities have received less attention [14]. Transportation policies associated with shared autonomous vehicles are proposed as a sustainable approach for the modernization of road transport; nevertheless, their effective implementation hinges on the capacity to fulfill users’ requirements. In this context, it is crucial to consider public perspectives in the design and acceptance of new services. Equity in accessibility, social cohesion, environmental sustainability, and issues related to social interactions are pivotal elements that affect the acceptance of shared autonomous vehicle services [15]. With the rise in investment in autonomous vehicle technology, institutions are investigating the influence of this technology on travel behavior and corresponding responses. Various potential outcomes of autonomous vehicles may either lessen, sustain, or even worsen transportation inequalities. Kahn et al., in 2019, developed a regional travel demand model that assesses transportation disparities among disadvantaged populations in the Washington D.C. area under different scenarios. The performance indicators in this research include access to job opportunities, travel time, travel distance, mode share, and miles traveled [16].
In 2021, Dianin et al. examined the effects of autonomous vehicles, specifically shared autonomous vehicles, on accessibility and equity within the transportation sector. Enhancing accessibility and ensuring its fair distribution are regarded as essential objectives for achieving sustainability in transportation. The impacts of this technology can differ based on the nature of the autonomous vehicles, whether private or shared, and the context in which they are deployed, be it rural or urban. The four primary effects of autonomous vehicles are: (1) polarization of accessibility, (2) dispersion of accessibility, (3) exacerbation of social inequalities, and (4) reduction of inequalities [17]. Autonomous vehicles hold the promise of fostering a more equitable future for marginalized groups by generally enhancing transportation accessibility; however, they also risk widening existing disparities by creating transportation networks that cater exclusively to certain demographics [18]. Nevertheless, policies governing autonomous vehicles have the potential not only to mitigate adverse effects but also to create opportunities and advantages for underrepresented communities [19]. Transportation planning that prioritizes equity necessitates evaluation methods that thoroughly incorporate the principle of equity into the planning framework. In 2017, Brodie et al. introduced a novel methodology for evaluating equity, which assesses transportation system outcomes on a regional scale and across all demographic groups over time. Findings from the Atlanta region suggest that this approach can overcome the shortcomings of current methods and contribute to improved equity outcomes in performance-based transportation planning [20]. In 2021, Martens et al. offered four distinct interpretations of distributional standards concerning accessibility and assessed equity in regional plans across the ten largest Metropolitan Planning Organizations (MPOs) in the United States.
The findings suggest that these organizations mainly employ robust distribution standards [21]. While vehicle automation does not inherently remove financial obstacles, policies aimed at social equity can help bridge access disparities by reducing the individual costs associated with using autonomous vehicles (through sharing initiatives) or by improving access and the quality of affordable transportation options such as walking and public transit. The implementation of these policies can greatly enhance transportation accessibility for low-income households without cars, without imposing significant cost increases on them. This is especially crucial when policies are crafted to mitigate inequality and foster transportation inclusivity [22]. Research conducted in Singapore reveals that individuals with visual, auditory, mobility, and cognitive disabilities, along with the elderly and vulnerable families, despite having a favorable view of autonomous vehicle technology, harbor significant concerns regarding safety, reliability, and accessibility. These findings underscore the importance of developing autonomous vehicle services with a holistic perspective, incorporating features like multisensory alert systems, ease of entry and exit, and an inclusive ride experience, to improve the acceptance of this technology among vulnerable populations [23]. There are notable mobility disparities between individuals with disabilities and the broader community. Research indicates that the willingness to utilize autonomous public transportation differs among groups with specific needs; visually impaired individuals are generally more open to it, whereas those with mobility challenges are less likely to embrace this technology. The overall perception of autonomous vehicles within these groups tends to be largely negative, with safety and technology reliability being the primary concerns. The results highlight the necessity for comprehensive policy development to improve equitable access to the advantages of emerging transportation technologies for these populations [24].
There exists a profound and significant disparity in access and social engagement for individuals with disabilities, where mobility serves as a crucial element in promoting social inclusion for this demographic. Autonomous vehicles, situated within the framework of Transportation as a Service, hold the promise of enhancing mobility and improving the quality of life for these groups; however, poorly designed and non-inclusive technologies may result in the exclusion and marginalization of individuals with special needs. Implementing inclusive and comprehensive design principles can be an effective strategy to ensure accessibility and equity in transportation. In this context, an integrated model has been established to assist policymakers and public transportation entities in the creation and execution of inclusive autonomous vehicles, with the goal of ensuring social inclusion and facilitating the active participation of individuals with disabilities in intelligent transportation systems [25]. In this research, related literature has been utilized as the basis and theoretical framework for examining the influence of shared autonomous vehicles on social equity. By analyzing prior studies in the domains of autonomous vehicle technology, transportation models, social equity, and transport policies, research gaps were identified, and key variables were extracted. This methodology contributed to the formulation of the questionnaire, the selection of relevant variables, and the development of statistical models, allowing for a more accurate analysis of travel behavior and the impacts of shared autonomous vehicles within the socio-spatial framework. Furthermore, the application of findings from the literature has aligned the outcomes of this study with existing knowledge and bolstered its scientific validity.
3. Methodology
In this research, a discrete choice model was utilized to assess levels of social equity within transportation. Discrete choice models represent sophisticated statistical techniques employed to analyze the selection behavior of individuals when presented with a range of alternative options. By pinpointing the factors that influence individuals’ ultimate decisions, these models facilitate the exploration of how personal, economic, and social variables impact decision-making. Considering the nature of the data, the characteristics of the choice alternatives, and the decision-making framework in this study, a multinomial logit model was applied. This model presumes that each individual selects one option from the available alternatives with the intention of maximizing their utility. In this context, the utility associated with each option is determined by both the attributes of that option and the personal characteristics of the individual. To enhance comprehension of the research methodology, a flowchart illustrating the research process is provided in Figure 1. This flowchart delineates the primary stages of the study sequentially, encompassing data collection, data preparation, model selection, estimation of the multinomial logit model, results analysis, and conclusion. Figure 1. Flowchart of the research method steps for analyzing and evaluating the role of shared autonomous vehicle deployment on social equity.
3.1. Discrete Choice Model
An individual is faced with a selection among J alternatives, which is modeled through a random utility framework. It is assumed that the utility derived from each alternative for the individual comprises a non-random component, linear in parameters and reliant on observed data, a random element that may exhibit correlation across alternatives and is heterogeneous, as well as another random component that is independently and identically distributed across alternatives and individuals. Specifically, the utility for individual n from alternative i is articulated by equation (1).
where represents a vector of observed variables associated with alternative i and individual n. The vector consists of structural parameters that characterize the choices made by the overall population. is a random term with a mean of zero, whose distribution among individuals and alternatives typically relies on underlying parameters and the observed data pertinent to alternative i and individual n. is a random term with a mean of zero that is independently and identically distributed across alternatives, not influenced by underlying parameters or observed data. In each specific modeling context, the variance of may not be distinctly identifiable from; hence, it is normalized to establish the scale of utility [27]. This study utilizes insights from transportation planning experts to develop a utility function model that reflects varying levels of social equity within the transportation system. In the multinomial logit model applied in this research, a vector of attributes is incorporated to depict individual-specific characteristics, and a set of parameter vectors is allocated for each alternative being evaluated. Within this discrete choice framework, these relationships are defined inversely; that is, each transportation alternative is defined by its unique set of specific features, which include elements such as cost, travel time, and the socio-economic status of the individual. Respondents are tasked with making choices among these alternatives. In this model, a single parameter vector is treated as a function of attributes for each alternative. The proposed model for analyzing the observed data is outlined in Equation (2).
In this model, the random components specific to individuals () are distributed independently, with each component adhering to an extreme value distribution. Based on these assumptions, the likelihood that individual i selects alternative j is articulated in Equation (3).
It has been established that for independent extreme value distributions, as previously noted, this likelihood is represented by Equation (4):
Here, denotes the indicator of the choice made by individual i. Regardless of the number of alternatives available, only a single parameter vector comprising K variables is necessary for estimation. This model circumvents the issue of parameter proliferation commonly encountered in standard logit models [26]. In this research, we utilize the multinomial logit (MNL) model to assess the influence of shared autonomous vehicles on social equity in transportation. The model is constructed within the discrete choice framework. By presuming independently and identically distributed extreme value errors in the utility components, the probability of selecting each alternative is calculated using the multinomial logit function.
3.2. Case Study
Tehran has an estimated total population of around 9.4 million individuals, with a population density of 129 people per hectare. The city is segmented into 22 districts, where 26.7% of the population is employed and 22.6% is currently engaged in studies. The daily trip count in Tehran is approximately 19.8 million. The distribution of trip purposes is as follows: 18% for educational activities, 43% for work-related purposes, 13% for shopping, 19% for leisure activities, and 7% with no defined purpose. The modal distribution of intra-city transportation in Tehran is as follows: private vehicles and pickup trucks (49%), ride-hailing services (2%), motorcycles (7%), buses and the metro system (19%), minibuses (2%), traditional taxis (18%), and other transportation modes (3%). The zoning of Tehran is depicted in Figure 2 [28].
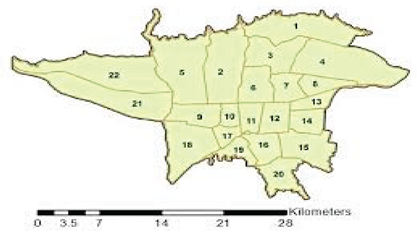
For the purpose of this study, the 22 districts within the city of Tehran were defined as the study area, and data were collected from residents residing in these districts.
3.2.1. Data Collection
The data collection process for this study was carried out in two separate stages: The initial stage focused on assessing social equity within the urban transportation system from the viewpoint of experts. During this phase, an experiment design approach was employed to identify four primary variables: accessibility level, transportation cost, distribution of transport modes, and satisfaction with transportation, which were recognized as the principal indicators of social equity. The integration of these four indicators led to the creation of 625 potential scenarios. Subsequently, a sampling technique was utilized within the experimental design framework to select 25 representative scenarios, which were then presented to a group of transportation experts via a questionnaire. The experts were requested to evaluate each scenario concerning its effectiveness in achieving social equity, utilizing a five-point Likert scale that ranged from “Very Poor” to “Very Good.” The objective of the second stage was to investigate the perceived levels of social equity among vulnerable populations, particularly individuals with disabilities, children, and the elderly. A structured questionnaire was crafted and distributed in person at pertinent locations throughout Tehran, such as rehabilitation centers (for individuals with disabilities), schools (for children), and elderly care or community centers (for older adults). This questionnaire was designed to gauge respondents’ perceptions regarding four essential dimensions of social equity in urban transportation: accessibility, cost, mode distribution, and overall satisfaction, in relation to two distinct conditions: prior to and following the introduction of shared autonomous vehicles.
In the creation of these questionnaires, the socio-economic data of respondents was also gathered to facilitate a more comprehensive analysis of the connections between individual traits and their views on social equity. To assess the attitudes and perceptions of respondents, a five-point Likert scale was utilized, recognized as one of the most prevalent measurement instruments in the social sciences. This scale, which was initially introduced in 1932 by social psychologist Rensis Likert, measures the extent of agreement or disagreement among respondents regarding the statements presented, ranging from “strongly disagree” to “strongly agree” [29].
4. Data Analysis
4.1. Experts
In order to assess the scenarios developed in this study, the insights of 20 experts were employed. These professionals were meticulously chosen for their knowledge and experience in the transportation sector. The aim of this selection was to harness the profound and analytical perspectives of these experts concerning the principles of social equity and the obstacles encountered by the transportation system in Tehran. The demographic details of these experts are illustrated in Table 1.
Table 1 outlines the composition of the experts by gender, age categories, educational qualifications, and professional experience. The distribution of 75% male to 25% female, along with an age range from 30 to 40 years and extending beyond 50 years, ensures a commendable diversity of experience. Furthermore, with 60% possessing PhDs and 40% holding master’s degrees, the group’s elevated level of specialized knowledge is guaranteed.
4.2. Users with Disabilities
In this research, individuals with disabilities—including those with disabilities, children, and the elderly—were the primary participants and played a crucial role in the second phase of data collection. These groups shared their insights on the four essential social equity indicators by filling out the specially designed questionnaires. The descriptive analysis of the data involved examining the socio-economic characteristics of these three target groups. The outcomes of the frequency analyses of the socio-economic variables derived from the collected questionnaires are displayed in Table 2, Table 3 and Table 4.
In this research, to assess the demographic and socio-economic characteristics of the respondents, variables concerning age, gender, and education were presented separately for the three vulnerable groups, which include children, individuals with disabilities, and the elderly, as shown in Table 2, Table 3 and Table 4. The total number of children was 220, individuals with disabilities numbered 285, and elderly individuals totaled 318. To evaluate the status of the four dimensions of social justice before and after the introduction of autonomous vehicles in Tehran from the viewpoint of the vulnerable groups (children, individuals with disabilities, and the elderly), a second questionnaire was developed. This questionnaire was designed to assess four key parameters in the transportation system—specifically, “level of accessibility,” “cost,” “distribution of transport modes,” and “satisfaction with transportation”—from the perspective of these groups to analyze the levels of social justice prior to and following the introduction of shared autonomous vehicles. The data collected from the questionnaire responses utilized a Likert scale for both the pre- and post-deployment phases of shared autonomous vehicles, and the frequency and percentage results for each of these indicators are presented in Table 5.
Table 5 illustrates the percentage distribution of responses concerning the transportation system in Tehran for three vulnerable demographics: children, the elderly, and individuals with disabilities. This analysis emphasizes four primary indicators of social equity, which include accessibility, transportation costs, the distribution of transportation modes, and overall satisfaction with the transportation system. Prior to the implementation of shared autonomous vehicles, the data revealed a considerable degree of dissatisfaction among these vulnerable groups regarding their assessments of these indicators. For example, in the category of “accessibility,” merely about 14% of respondents rated the situation as “good” or “very good.” Likewise, in terms of the “distribution of transportation modes,” only approximately 18% offered positive evaluations, underscoring the limited availability of transportation options for these groups.
- In the accessibility index, the percentage of respondents who rated the situation as “good” or “very good” rose from 14% to over 60%, signifying a substantial enhancement in transportation accessibility for vulnerable groups.
- In the transportation cost index, while some responses still express concerns regarding high costs, the proportion of individuals rating the cost as “low” or “moderate” has increased, indicating a general perception of the relative affordability of this technology.
- Concerning the distribution of transportation modes, satisfaction levels improved, with the percentage of positive responses escalating from about 18% to over 66%. This indicates that the introduction of shared autonomous vehicles can foster greater diversity and inclusiveness in transportation options. Ultimately, the overall satisfaction index with transportation also reflects a significant improvement, as the number of respondents rating the situation as “good” or “very good” has more than tripled.
These findings suggest that the implementation of shared autonomous vehicles can significantly enhance the quality of the transportation experience, mitigate inequalities, and promote social justice for marginalized groups.
5. Modeling, Results Analysis, and Discussion
5.1. Multinomial Logit Modeling for Levels of Social Justice
In this research, an experiment design method was utilized to achieve a thorough and accurate assessment of social justice within the transportation system. The primary aim of this design was to effectively integrate four essential parameters: accessibility level, cost, mode distribution, and satisfaction with the transportation system, allowing for a comprehensive examination of the interactions among these parameters concerning transportation justice. To facilitate this, five-level Likert scales were employed for each parameter, enabling experts to deliver more precise evaluations. Throughout this process, 25 response scenarios were systematically selected from various combinations of these parameters to be presented to the experts. This selection was conducted to ensure a comprehensive representation of the full spectrum of potential variations of these parameters, thus yielding valid and extensive data for the analysis and modeling of the utility function of justice. For a more accurate assessment and modeling to investigate the diverse impacts on justice within the transportation system, five distinct utility functions were developed for five different levels of social justice in transportation. Each of these utility functions is constructed based on the four critical social justice indicators: accessibility level, cost, mode distribution, and satisfaction with the transportation system, and specifically evaluates the influence of each of these parameters on justice in the transportation system.
This method, by leveraging the expert and accurate insights of specialists, acts as a significant instrument for assessing and comprehending the various aspects of justice within the transportation system, and can establish a foundation for critical decision-making aimed at creating more equitable transportation systems. Table 6 displays the utility functions corresponding to the five distinct levels of justice in the transportation system. These functions demonstrate the effect of the four essential parameters on the utility of justice in transportation from the viewpoint of experts. The parameters incorporated in the model are: Β0 (the model constant or the baseline utility value for each level of justice), X1 (accessibility level), X2 (cost), X3 (mode distribution), and X4 (transportation satisfaction). These functions illustrate how variations in each of these parameters can affect the utility of justice at every level, which ranges from very poor to very good.
According to Table 6, the utility functions representing the five levels of social justice within the transportation system are constructed based on four essential parameters, demonstrating that experts’ views on social justice are significantly affected by variations in these factors. At the lowest level of justice (Level 1), the substantial negative coefficient associated with accessibility suggests that a reduction in access to public transportation services or shared vehicles greatly exacerbates feelings of injustice. Conversely, increases in the other parameters particularly satisfaction and mode distribution can somewhat alleviate this negative situation, although their impact is not as pronounced as that of accessibility. At the second level (Poor), cost exerts the most considerable positive influence on utility, indicating that when justice is lacking, lowering transportation costs can diminish dissatisfaction and somewhat reduce the perceived injustice. Nevertheless, satisfaction and accessibility exert negative influences at this level, signifying that simply having infrastructure in place without ensuring a satisfactory user experience is inadequate. At the third level (Moderate), the positive influence of cost persists, while satisfaction continues to have a negative effect. This implies that even in relatively balanced circumstances, if the user experience is not satisfactory, the perception of justice does not improve. Additionally, the unequal distribution of transport modes continues to foster a negative perception. At the fourth level (Good), the proper distribution of transport modes yields a positive and significant effect, indicating that the availability of various transport options for different segments of society is crucial in advancing social justice. However, the pronounced negative impact of accessibility indicates that even if the transportation system provides acceptable diversity, unequal access still obstructs the realization of complete justice.
Ultimately, at the pinnacle of justice (Level 5), both accessibility and satisfaction with transportation exhibit positive and significant impacts, being recognized as the most influential elements in improving the perception of social justice. At this stage, cost reduction and uneven mode distribution yield negative consequences, suggesting that in scenarios characterized by high justice, users favor the quality of their experience and true equality over simple price cuts or superficial diversity. In summary, the examination of the utility functions indicates that accessibility and satisfaction with the transportation system are the primary factors influencing perceptions of social justice. Although cost and mode distribution are important at lower levels of justice, at elevated levels, the quality and thoroughness of services play a more crucial role in fostering a sense of justice than mere pricing or variety. These insights can offer essential direction for policymakers striving to create a more equitable transportation system, particularly in relation to shared autonomous vehicles and new urban services. Table 7 displays the goodness-of-fit indices for the multinomial logit model employed to assess social justice. These indices encompass log-likelihood values, chi-square test statistics, McFadden’s R-squared, and AIC criteria, which collectively reflect the model’s effectiveness and explanatory capability in forecasting the levels of social justice.
The findings shown in Table 7 demonstrate that the multinomial logit model aligns well with the research data. The disparity between the initial log-likelihood (L0 = −201.17974) and the log-likelihood of the estimated model (LB = −142.04429) signifies a notable enhancement of the model compared to the baseline scenario. The chi-square statistic of 118.27, with 24 degrees of freedom and a p-value of 0.0000, validates the overall significance of the model at an exceptionally high confidence level. The McFadden’s pseudo R-squared (ρ²) value of 0.2939434 is within an acceptable range, suggesting that the model possesses relatively strong explanatory power. Furthermore, the Akaike Information Criterion (AIC) value of 316.1 and the AIC per observation (AIC/N) value of 2.529 both reinforce the suitability of the model fit. In summary, the multinomial logit model utilized in this research is statistically sound and exhibits a robust ability to analyze social justice within the transportation system. The aggregation of these goodness-of-fit indices confirms that the chosen model can yield dependable results for evaluating perceived social justice.
5.2. Sensitivity Analysis of the Model
In this section, we analyze the alterations in the average values of essential variables prior to and following the implementation of shared autonomous vehicles. These variables encompass accessibility level, transportation cost, distribution of transport systems, and satisfaction with transportation. To evaluate the effect of shared autonomous vehicles on these elements, the mean values of each variable were computed for users in both pre- and post-introduction contexts. The resulting changes are illustrated in Table 8.
The aforementioned table displays the modifications in four critical variables of the study. Figure 3 depicts the fluctuations in the four primary model indicators access level, cost, distribution of transport modes, and satisfaction with transportation before and after the introduction of shared autonomous vehicles. These indicators are assessed based on the average user responses utilizing a Likert scale (ranging from 1 to 5).
The most significant relative change pertains to the accessibility index, which rose by approximately 39%, signifying the substantial impact of shared autonomous vehicles (SAVs) on improving access to urban transportation services. Subsequently, the cost index increased by 37%, mode share distribution by 31%, and transportation satisfaction enhanced by about 29%. These findings illustrate that the effect of shared autonomous vehicles extends beyond the enhancement of a single facet of the transportation system; instead, it holistically influences key indicators related to equity, satisfaction, and efficiency. The remarkable changes in the mean indices across the Likert scale affirm that users view the introduction of shared autonomous vehicle technology favorably, not only at a functional level but also regarding their overall perception. Furthermore, taking into account the simultaneous rise in the four principal indices—accessibility, cost, mode distribution, and satisfaction it can be inferred that the adoption of this technology has resulted in the concurrent improvement of multiple aspects of transportation quality.
The significant alterations in the average indices across the Likert scale indicate that users have a favorable view of the implementation of shared autonomous vehicle technology, not only regarding its functionality but also concerning their overall impression. Additionally, taking into account the simultaneous rise in the four primary indices—accessibility, cost, mode distribution, and satisfaction—it can be inferred that the integration of this technology has resulted in the simultaneous improvement of various aspects of transportation quality. This collaboration in enhancing the indices implies that shared autonomous vehicles are not simply an alternative choice but act as a fundamental instrument for transforming conventional urban transportation frameworks. Indeed, the sensitivity analysis of the model reveals that following the introduction of SAVs, users’ inclination to engage with a broader range of affordable and dependable transportation systems has grown. This observation underscores a significant strength of the model, showcasing its ability to respond effectively and in harmony with social and economic realities in light of environmental and technological advancements. Consequently, the sensitivity analysis, while examining the model’s behavior in response to the introduction of a pivotal new variable —shared autonomous vehicles— suggests that urban transportation policy strategies can utilize this innovative tool to concurrently achieve goals such as enhancing spatial equity, lowering costs, and boosting user satisfaction. Moreover, this analytical framework can be applied in the future to assess other emerging technologies within the transportation domain.
5.4. Results on Changes in Social Equity
In this research, equity is characterized as the perceived fairness and equality in the availability of transportation services for all social and economic demographics. This notion is particularly significant regarding the accessibility of transportation systems and shared autonomous vehicles, as individuals from various social backgrounds should perceive that they receive equal benefits from these services. In this study, the degree of social equity within the transportation framework is regarded as a fundamental criterion for assessing the influence of shared autonomous vehicles in Tehran. This emphasis is particularly vital for evaluating the contribution of autonomous vehicles in diminishing social inequalities and enhancing access to public transportation. Prior to the implementation of shared autonomous vehicles, the social equity level was assessed at level 2, signifying a relatively low perception of fairness in transportation service access among users. Numerous groups, particularly those in different urban locales, expressed that their access to sufficient and effective transportation was constrained. Nevertheless, following the introduction of shared autonomous vehicles, the social equity level rose to level 3. This favorable shift indicates a notable enhancement in users’ perception of equity, likely due to improved accessibility and a more equitable distribution of transportation services among varied user groups. With these developments, it seems that shared autonomous vehicles have played a role in mitigating issues related to access and equality in transportation utilization for diverse populations. The findings of the study imply that shared autonomous vehicles can serve as a significant factor in advancing social equity in urban transportation. Additionally, the examination of multinomial logit models conducted before and after the introduction of this technology uncovered statistically significant positive changes in essential metrics such as travel costs, accessibility levels, mode share distribution, and user satisfaction with services
These findings are statistically significant and suggest an enhanced perception of social equity, especially among the empowered segments of society. From a theoretical standpoint, these results correspond with the tenets of distributive justice theory, which underscores the importance of equitable distribution of urban resources and services across all social classes. In this context, improved access for marginalized groups, particularly individuals with disabilities, the elderly, and children, to transportation services can be seen as a means of diminishing structural inequalities in urban infrastructure. The advancement of social equity from level 2 to level 3 in this research not only signifies users’ enhanced subjective perception of equality in access but may also act as a measure of the social legitimacy and acceptance of new transportation technologies. This enhancement is particularly noticeable in the metrics of “cost” and “accessibility,” which illustrate the effectiveness of the shared autonomous vehicle system in addressing the deficiencies found in Tehran’s conventional transportation network. Furthermore, the sensitivity analysis of the models indicates that variations in factors such as cost, waiting time, and the number of co-riders have a significant impact on users’ utility. This implies that shared autonomous vehicle technology, when paired with well-structured services and suitable supportive policies, has the potential to serve as a strategic instrument in alleviating social inequalities.
The findings of this research clearly indicate that shared autonomous vehicles (SAVs) can significantly and fundamentally enhance social equity within Tehran’s urban transportation framework. By analyzing multinomial logit models both prior to and subsequent to the implementation of SAVs, notable changes were detected in critical metrics such as transportation costs, levels of accessibility, distribution of mode share, and user satisfaction with transportation services. The analyses reveal that after the introduction of shared autonomous vehicles, there was a marked increase in positive coefficients for the three indices of accessibility, satisfaction, and mode distribution at the ‘good’ and ‘very good’ levels, indicating a real enhancement in the perception of social equity and more equitable access to transportation services. In contrast, variations in the cost variable exhibited moderate to low-level increases, which is a positive outcome concerning the adoption of this technology. These changes are particularly significant for vulnerable demographics, including individuals with disabilities, children, and the elderly, as they contribute to diminishing existing disparities in access to transportation services throughout society. The social equity utility functions, created in partnership with specialists in transportation and social justice, were assessed based on four primary indicators: transportation costs, levels of accessibility, distribution of mode share, and satisfaction with transportation services. These functions illustrated that shared autonomous vehicles (SAVs), in addition to lowering costs, they have improved access to transportation services for all social groups, especially for vulnerable populations. Sensitivity analysis further validated substantial changes in these variables following the introduction of SAVs. Enhancements in accessibility, cost reductions, improved mode distribution, and increased user satisfaction with transportation services all act as indicators of elevated social equity within the urban transportation system.
These modifications not only serve the general populace but also particularly assist vulnerable and empowered groups, aiding in the reduction of social disparities in transportation access.
6. Conclusions
Ultimately, the results of this research highlight that shared autonomous vehicles can function as a viable solution for fostering social equity in urban transportation. The enhancements across various indicators and the rise in user satisfaction demonstrate their beneficial influence on altering transportation usage trends and mitigating inequalities. These results can guide urban transportation policymakers and planners in crafting intelligent and sustainable transportation systems that, by specifically catering to the needs of vulnerable groups, more effectively address the diverse requirements of different social segments and advance social equity in transportation access for all population groups.
The key innovation of this research resides in the utilization of a discrete choice model to assess levels of social equity in urban transportation. In contrast to earlier studies that predominantly depended on descriptive analyses, this research applies a multinomial logit model to quantitatively evaluate the impacts of individual, economic, and social factors on citizens’ travel behavior, thus offering a more accurate representation of the distribution of transportation advantages among various social groups. Furthermore, by examining all 22 districts of Tehran, the study provides a thorough viewpoint on spatial equity throughout the entire urban landscape. In addition to its statistical and theoretical contributions, this research presents several significant practical implications that can act as a basis for decision-making and policymaking in urban transportation:
1. Development of a framework based on multinomial logit for evaluating social equity in transportation.
2. This research creates and implements a multinomial logit model to assess the effects of shared autonomous vehicles, offering a practical framework for evaluating social equity in new transportation systems. This model is adaptable for similar investigations in other cities or nations.
3. Development of a utility function for social equity derived from expert insights within the transportation field and specific user demographics.
4. The results provide significant assistance to policymakers and implementing organizations in fostering the development of infrastructure and incentive strategies aimed at increasing the adoption of shared autonomous vehicles—especially in underserved regions and among vulnerable groups.
5. Highlighting the beneficial impact of technology in mitigating social disparities.
6. This research illustrates that new technologies can significantly contribute to closing social divides. This understanding directs future research efforts towards exploring the social consequences of other transportation advancements.
7. Creation of empirical data for underrepresented groups. Gathering and analyzing information from demographics such as individuals with disabilities, the elderly, and children in the urban environment of Tehran offers a crucial resource for researchers.
8. addressing a prevalent gap due to sampling challenges in numerous previous studies.
References
- Handy S. Is accessibility an idea whose time has finally come?. Transportation Research Part D: Transport and Environment. 2020,83,102319.
- Milakis, Dimitris, and Bert van Wee. “Implications of vehicle automation for accessibility and social inclusion of people on low income, people with physical and sensory disabilities, and older people.” Demand for emerging transportation systems. Elsevier, 2020. 61-73.].
- Gelauff, G.; Ossokina, I.; Teulings, C. Spatial and welfare effects of automated driving: Will cities grow, decline or both? Transp. Res. Part A Policy Pract. 2019, 121, 277–294. [CrossRef]
- Milakis, D.; Kroesen, M.; van Wee, B. Implications of automated vehicles for accessibility and location choices: Evidence from an expert-based experiment. J. Transp. Geogr. 2018, 68, 142–148. [CrossRef]
- Krueger, R., Rashidi, T. H., & Rose, J. M. Preferences for shared autonomous vehicles. Transportation research part C: emerging technologies,2016, 69, 343-355.
- Hörl S, Ciari F, Axhausen KW. Recent perspectives on the impact of autonomous vehicles. Arbeitsberichte Verkehrs-und Raumplanung. 2016;1216.
- Geurs KT, Van Wee B. Accessibility evaluation of land-use and transport strategies: review and research directions. Journal of Transport geography. 2004 ,12(2):127-40.
- Litman T. Evaluating transportation equity. Victoria, BC, Canada: Victoria Transport Policy Institute; 2017.
- Van Wee B. Accessible accessibility research challenges. Journal of transport geography. 2016 ,51:9-16.
- Meyer, J.; Becker, H.; Bösch, P.M.; Axhausen, K.W. Autonomous vehicles: The next jump in accessibilities? Res. Transp. Econ. 2017, 62, 80–91. [CrossRef]
- Parkhurst G, Seedhouse A. Will the ‘smart mobility’revolution matter?. InTransport matters 2019,pp. 349-380. Policy Press.
- Krueger R, Rashidi TH, Rose JM. Preferences for shared autonomous vehicles. Transportation research part C: emerging technologies. 2016,69:343-55.
- He, B.Y.; Jiang, Q.; Ma, J. Connected automated vehicle impacts in Southern California part-I: Travel behavior and demand analysis. Transp. Res. Part D: Transp. Environ. 2022, 109. [CrossRef]
- Wu, X.; Cao, J.; Douma, F. The impacts of vehicle automation on transport-disadvantaged people. Transp. Res. Interdiscip. Perspect. 2021, 11. [CrossRef]
- Paddeu, D.; Shergold, I.; Parkhurst, G. The social perspective on policy towards local shared autonomous vehicle services (LSAVS). Transp. Policy 2020, 98, 116–126. [CrossRef]
- Cohn, J.; Ezike, R.; Martin, J.; Donkor, K.; Ridgway, M.; Balding, M. Examining the Equity Impacts of Autonomous Vehicles: A Travel Demand Model Approach. Transp. Res. Rec. J. Transp. Res. Board 2019, 2673, 23–35. [CrossRef]
- Dianin, A.; Ravazzoli, E.; Hauger, G. Implications of Autonomous Vehicles for Accessibility and Transport Equity: A Framework Based on Literature. Sustainability 2021, 13, 4448. [CrossRef]
- Creger H, Espino J, Sanchez AS. Autonomous vehicle heaven or hell? Creating a transportation revolution that benefits all,2019.
- Cohen S, Shirazi S, Curtis T. Can we advance social equity with shared, autonomous and electric vehicles. Institute of Transportation Studies at the University of California, Davis. 2017.
- Brodie, S.; Amekudzi-Kennedy, A. Performance-Based Methodology for Evaluating Equity for Transportation System Users. Transp. Res. Rec. J. Transp. Res. Board 2017, 2605, 83–91. [CrossRef]
- Martens, K.; Golub, A. A Fair Distribution of Accessibility: Interpreting Civil Rights Regulations for Regional Transportation Plans. J. Plan. Educ. Res. 2018, 41, 425–444. [CrossRef]
- Transpogroup. Autonomous Vehicle Policy Framework Summit,2018.
- Miller, K.; Chng, S.; Cheah, L. Understanding acceptance of shared autonomous vehicles among people with different mobility and communication needs. Travel Behav. Soc. 2022, 29, 200–210. [CrossRef]
- Kassens-Noor, E.; Cai, M.; Kotval-Karamchandani, Z.; Decaminada, T. Autonomous vehicles and mobility for people with special needs. Transp. Res. Part A: Policy Pr. 2021, 150, 385–397. [CrossRef]
- Nanchen, B.; Ramseyer, R.; Grèzes, S.; Wyer, M.; Gervaix, A.; Juon, D.; Fragnière, E. Perceptions of People with Special Needs Regarding Autonomous Vehicles and Implication on the Design of Mobility as a Service to Foster Social Inclusion. Front. Hum. Dyn. 2022, 3. [CrossRef]
- Brownstone D. Discrete choice modeling for transportation,2001.
- Greene WH. Nlogit. Student Reference Guide., zuletzt geprüft am. 2012;11:2014.
- Tehran City Council, Center for Statistics and Research. Selected statistics and information on transportation and traffic in Tehran Tehran: Tehran City Council,2021.
- Likert R. A technique for the measurement of attitudes. Archives of psychology,1932.
Figure 1.
Flowchart of the research method steps for analyzing and evaluating the role of shared autonomous vehicle deployment on social equity.
Figure 1.
Flowchart of the research method steps for analyzing and evaluating the role of shared autonomous vehicle deployment on social equity.
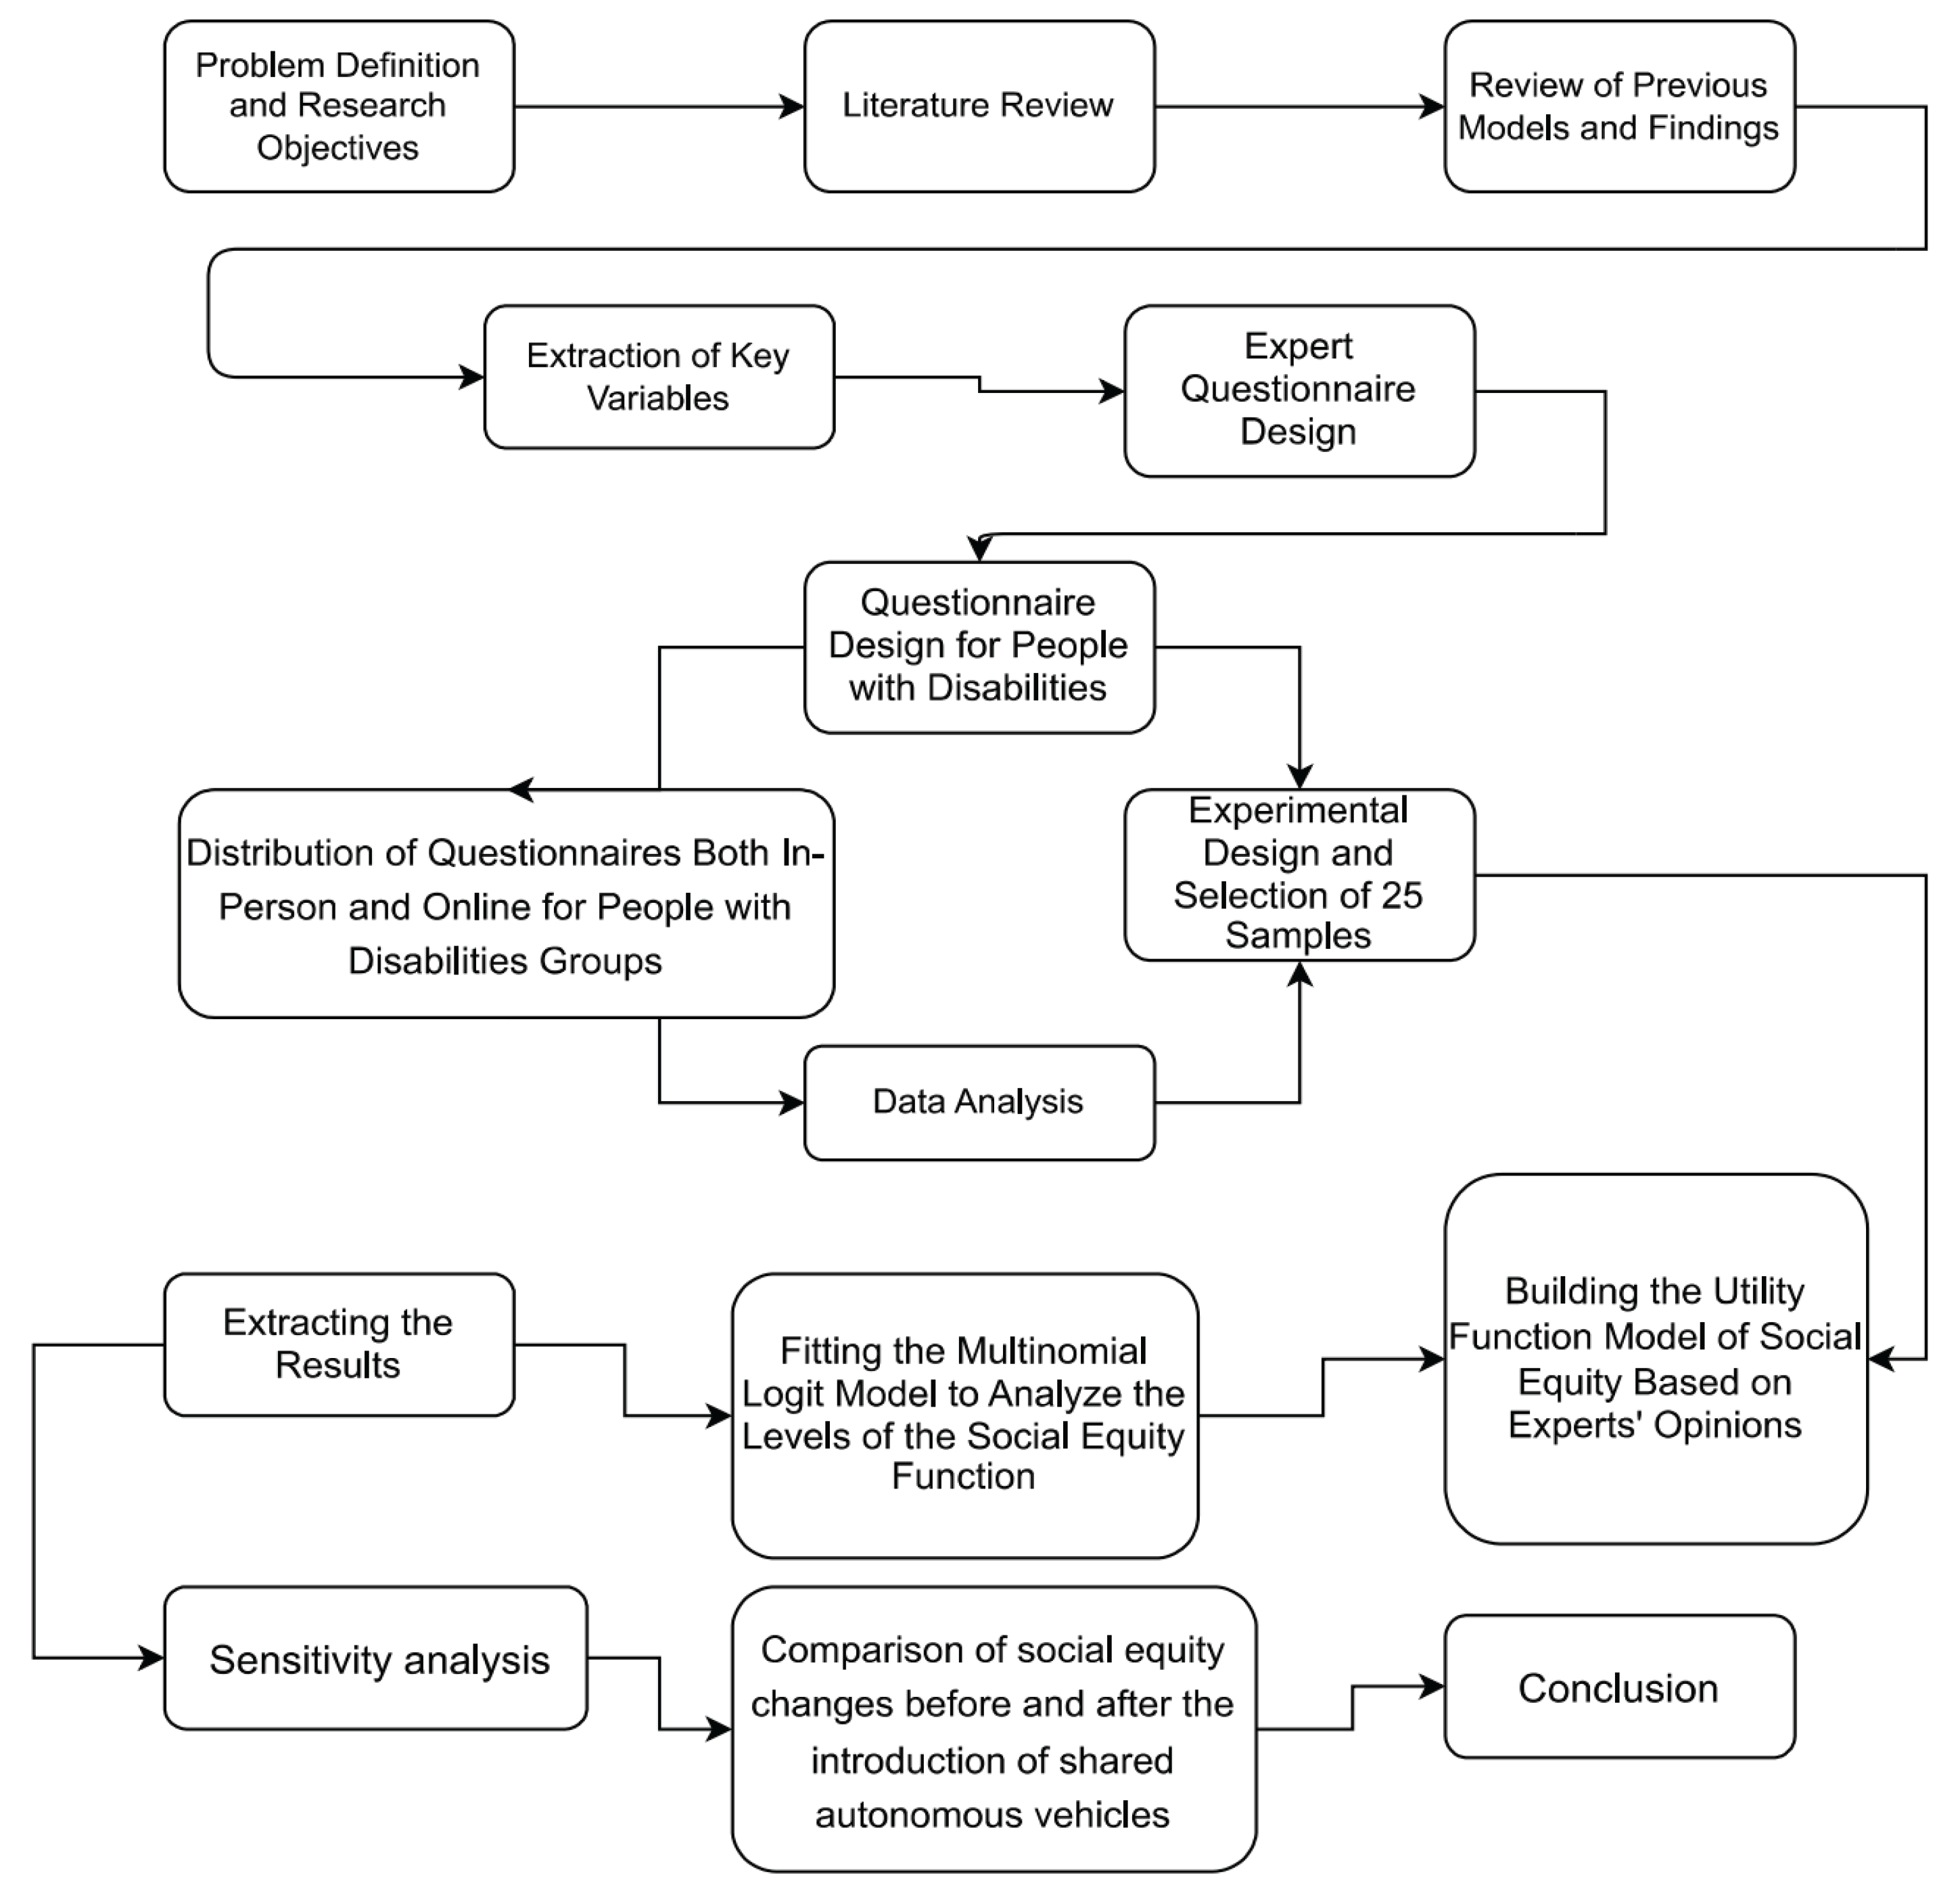
Figure 3.
Changes in the Four Social Justice Indicators Before and After the Introduction of Shared Autonomous Vehicles.
Figure 3.
Changes in the Four Social Justice Indicators Before and After the Introduction of Shared Autonomous Vehicles.
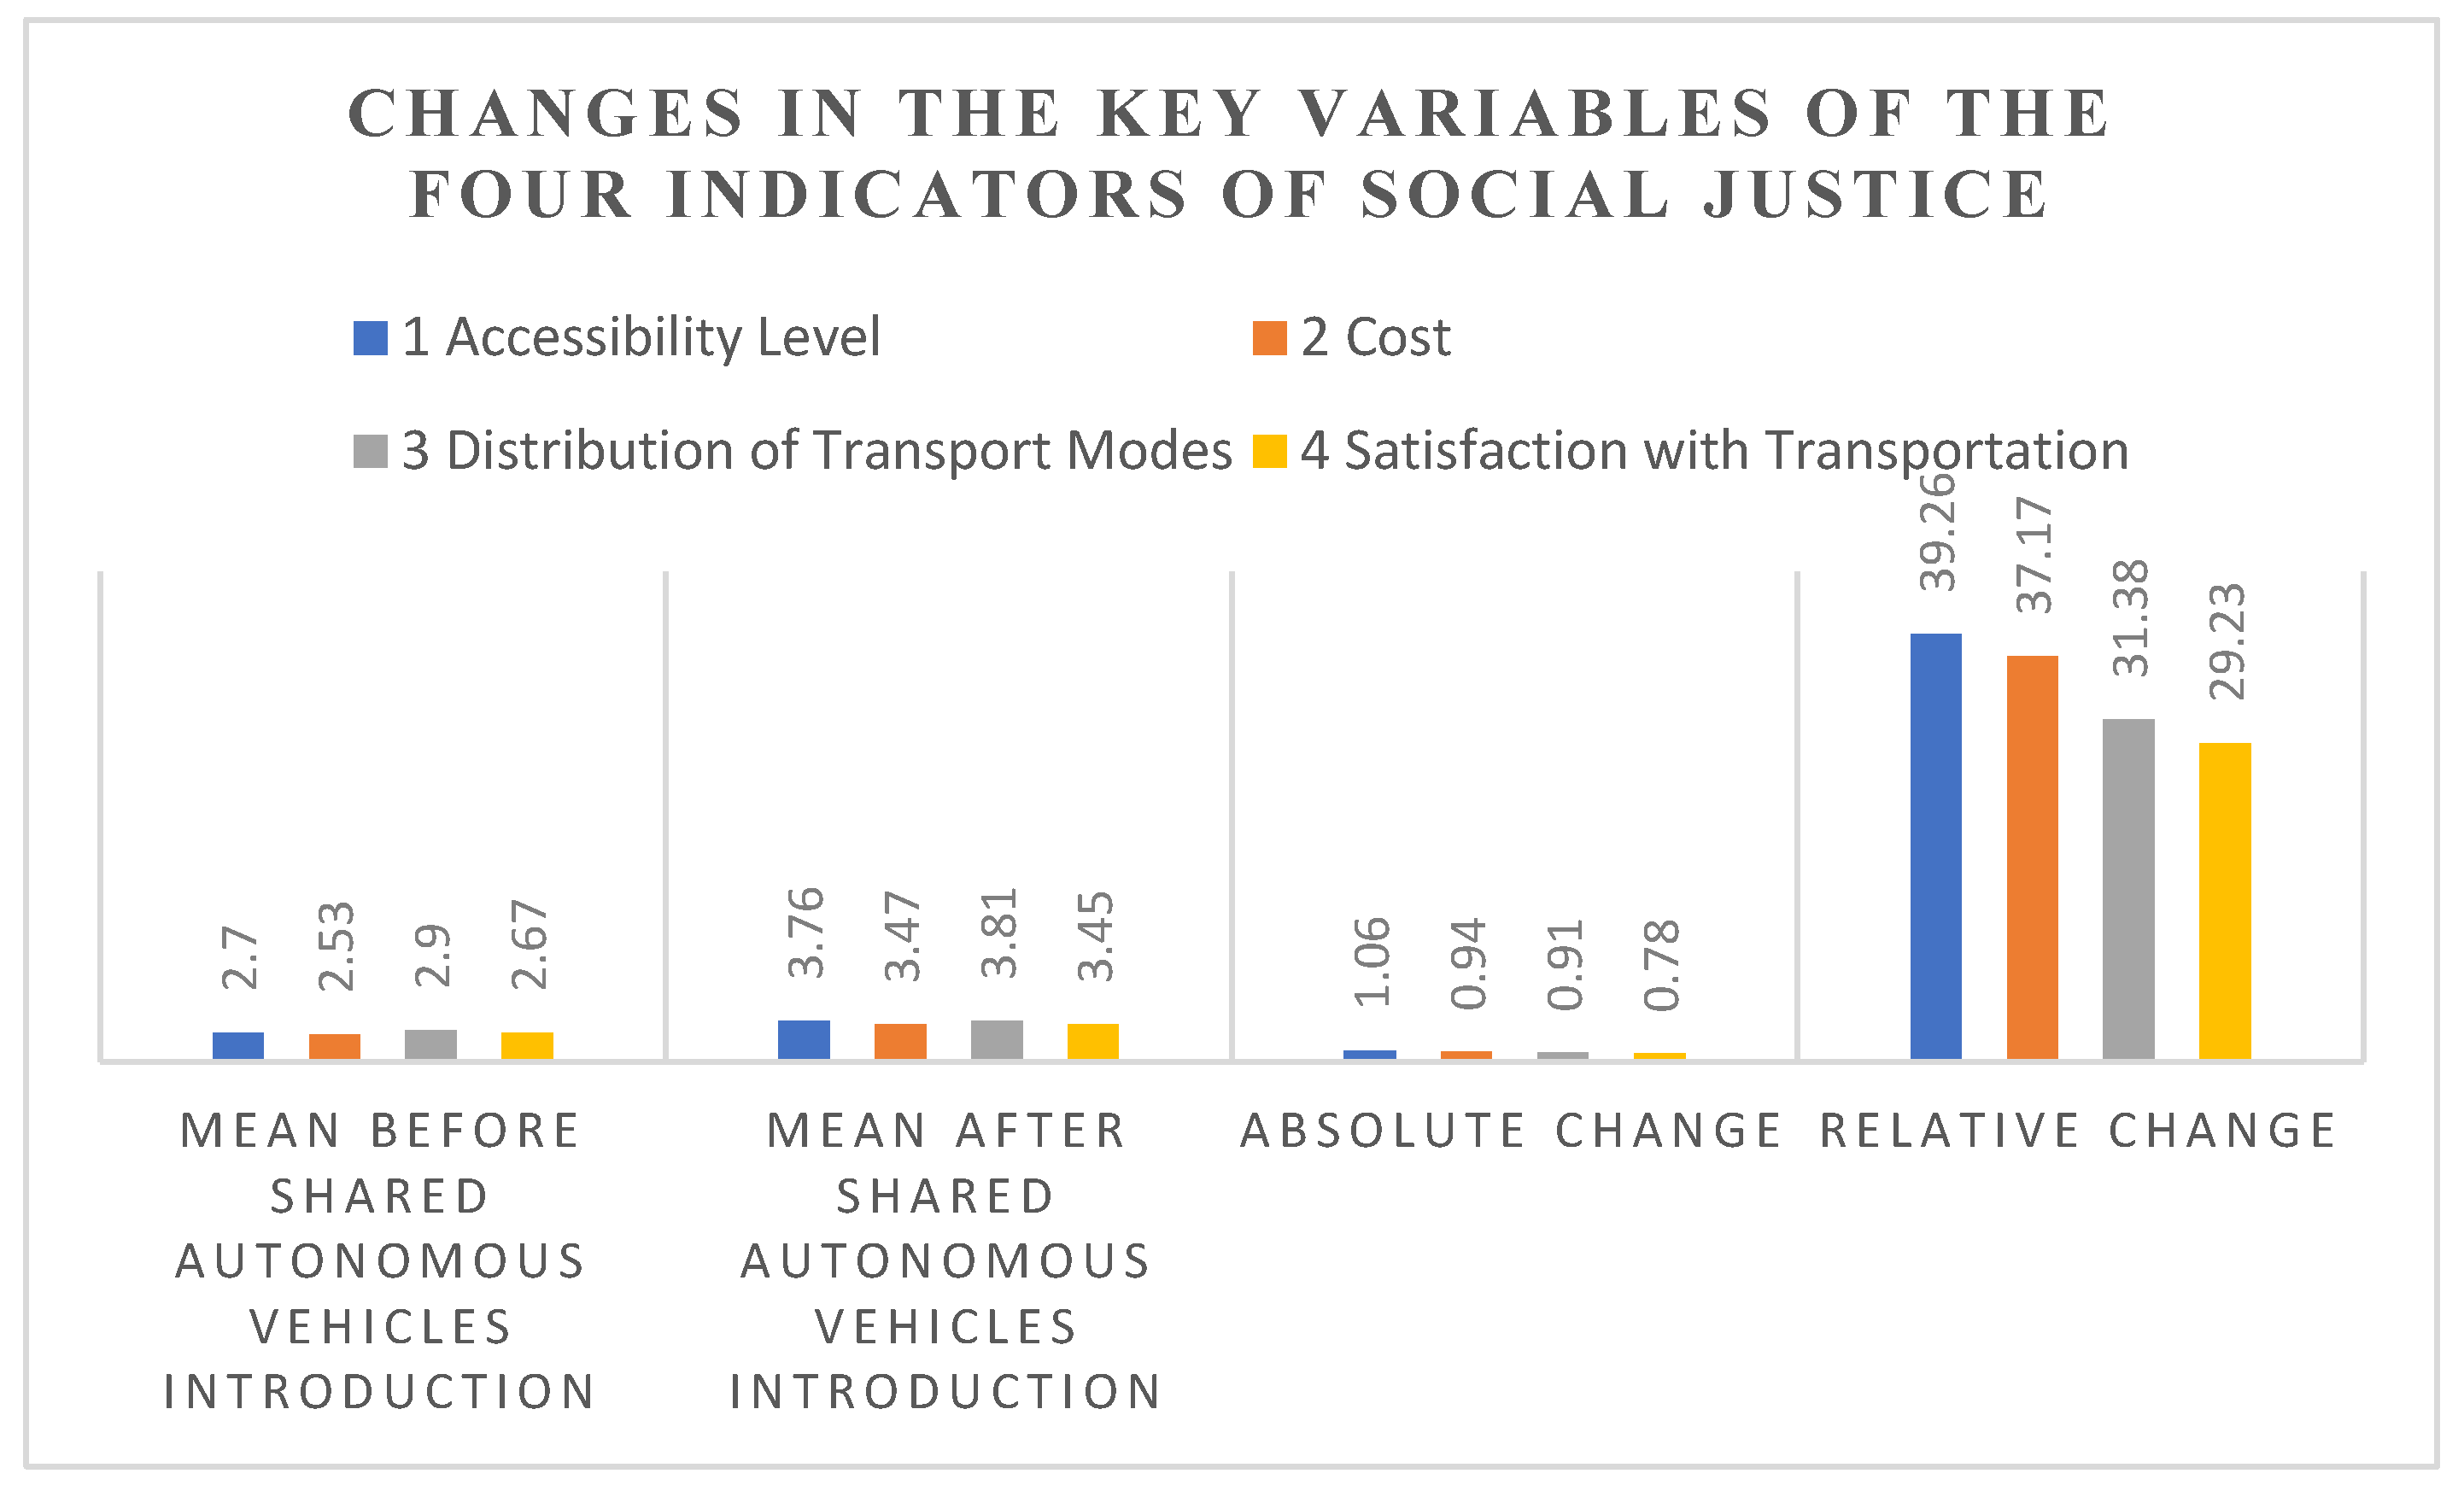

Table 1.
Demographic Characteristics of Experts Participating in the Construction of the Social Equity Utility Function.
Table 1.
Demographic Characteristics of Experts Participating in the Construction of the Social Equity Utility Function.
| Row | Variable | Category | Frequency | Percentage |
|---|---|---|---|---|
| 1 | Gender | Male Female Total |
15 5 20 |
75 25 100 |
| 2 | Age | 30–40 40–50 Above 50 Total |
6 9 5 20 |
30 45 25 100 |
| 3 | Education | Master’s Degree Phd Total |
8 12 20 |
40 60 100 |
| 4 | Work Experience | 10 years or less 11–20 years More than 20 years Total |
4 10 6 20 |
20 50 30 100 |
Table 2.
Frequency Analysis of Socio-Economic Variables for Children.
| Row | Variable | Category | Count | Percentage |
|---|---|---|---|---|
| 1 | Age | 7 to 18 | 220 | 100 |
| 2 | Gender | Male Female Total |
112 108 220 |
50.91 49.09 100 |
| 3 | Education | Diploma and below | 220 | 100 |
Table 3.
Frequency Analysis of Socio-Economic Variables for People with Disabilities.
| Row | Variable | Category | Count | Percentage |
|---|---|---|---|---|
| 1 | Age | 19-30 30-40 40-60 Total |
108 59 118 285 |
37.89 20.07 41.04 100 |
| 2 | Gender | Male Female Total |
145 140 285 |
50.88 49.12 100 |
| 3 | Education | Diploma and below Bachelor s Master’s Degree Phd Total |
80 152 49 4 285 |
28.07 53.33 17.19 1.40 100 |
Table 4.
Frequency Analysis of Socio-Economic Variables for Elderly Participants.
| Row | Variable | Category | Count | Percentage |
|---|---|---|---|---|
| 1 | Age | 60 and above Total |
318 318 |
100 100 |
| 2 | Gender | Male Female Total |
155 163 318 |
48.74 51.26 100 |
| 3 | Education | Diploma and below Bachelor s Master’s Degree Phd Total |
170 120 18 10 318 |
53.45 37.67 5.67 3.14 100 |
Table 5.
Questionnaire Analysis Based on the Four Social Justice Indicators for Vulnerable Groups.
| Row | Question | Option | Frequency (%) Before Introduction of Shared Autonomous Vehicles | Option | Frequency (%) After Introduction of Shared Autonomous Vehicles |
| 1 | How is your access to the transportation system? | Ver poor Poor Moderate Good Very Good Total |
235(28.56) 268(32.59) 201(24.41) 87(10.58) 32(3.89) 823(100) |
Ver poor Poor Moderate Good Very Good Total |
79(9.6) 115(14) 128(15.6) 298(36.2) 203(24.7) 823(100) |
| 2 | How do you evaluate the cost of using the transportation system? | Very low Low Moderate High Very High Total |
67(8.14) 95(11.54) 126(15.33) 295(35.84) 240(29.14) 823(100) |
Very low Low Moderate High Very High Total |
77(9.4) 233(28.3) 281(34.2) 149(18.1) 83(10.1) 823(100) |
| 3 | How do you evaluate the service provision of transportation modes during day and night hours? | Ver poor Poor Moderate Good Very Good Total |
218(26.5) 255(31) 198(24.1) 97(11.8) 55(6.7) 823(100) |
Ver poor Poor Moderate Good Very Good Total |
69(8.4) 81(9.85) 121(14.7) 285(34.7) 267(32.5) 823(100) |
| 4 | How do you evaluate your satisfaction with the transportation system? | Ver poor Poor Moderate Good Very Good Total |
234(28.5) 295(35.8) 189(22.9) 76(9.2) 29(3.5) 823(100) |
Ver poor Poor Moderate Good Very Good Total |
69(8.4) 81(9.85) 121(14.7) 285(34.7) 267(32.5) 823(100) |
Table 6.
Utility Function of Different Levels of Social Equity.
| Justice Level | Utility Function |
|---|---|
| Level 1 (Very Poor) | U1=0.323+ (-1.0844*x1) + (1.03394* x2) +(1.14527** X3)+ (1.30531**x4) |
| Level 2 (Poor) | U2 =( -0.80847**)+ (1.81655*** x2) +(-0.80221**x3)+ (-1.02511** x4) |
| Level 3 (Moderate) | U3 = (-.23364**x1)+ (1.38724***x2) +(-0.13131**X3)+ (-1.00189**x4) |
| Level 4 (Good) | U4 = (-1.73356***x1) + (0.90662**x2) + (1.21238**x3) +(-0.23592**x4) |
| Level 5 (Very Good) | U5 = (0.96231**x1) +(-1.28633*x2)+(0.53755**x3)+ (0.89234*** x4) |
Table 7.
Goodness-of-Fit indices for the Multinomial Logit Model in Analyzing Social Justice.
| Row | Goodness-of-Fit index | Value |
| 1 | Log-Likelihood Function (LB) | -142.04429 |
| 2 | Null Log-Likelihood (L0) | -201.17974 |
| 3 | Chi-square Test Statistic (df = 24) | 118.2709 |
| 4 | Significance Level | 0.000 |
| 5 | McFadden’s Pseudo R-squared (ρ²) | 0.2939434 |
| 6 | Akaike Information Criterion (AIC) | 316.1 |
| 7 | AIC per Observation (AIC/N) | 2.529 |
Table 8.
Changes in the Mean of Key Variables Before and After the Introduction of Shared Autonomous Vehicles.
Table 8.
Changes in the Mean of Key Variables Before and After the Introduction of Shared Autonomous Vehicles.
| Row | Variable | Mean Before Shared Autonomous Vehicles Introduction | Mean After Shared Autonomous Vehicles Introduction | Absolute Change | Relative Change |
| 1 | Accessibility Level | 2.7 | 3.76 | 1.06 | 39.26 |
| 2 | Cost | 2.53 | 3.47 | 0.94 | 37.17 |
| 3 | Distribution of Transport Modes | 2.9 | 3.81 | 0.91 | 31.38 |
| 4 | Satisfaction with Transportation | 2.67 | 3.45 | 0.78 | 29.23 |
Disclaimer/Publisher’s Note: The statements, opinions and data contained in all publications are solely those of the individual author(s) and contributor(s) and not of MDPI and/or the editor(s). MDPI and/or the editor(s) disclaim responsibility for any injury to people or property resulting from any ideas, methods, instructions or products referred to in the content. |
© 2025 by the authors. Licensee MDPI, Basel, Switzerland. This article is an open access article distributed under the terms and conditions of the Creative Commons Attribution (CC BY) license (http://creativecommons.org/licenses/by/4.0/).
Copyright: This open access article is published under a Creative Commons CC BY 4.0 license, which permit the free download, distribution, and reuse, provided that the author and preprint are cited in any reuse.


