Submitted:
24 June 2025
Posted:
26 June 2025
You are already at the latest version
Abstract
Burrowing mammals function as ecosystem engineers by creating spatial heterogeneity in soil structure and vegetation composition, thereby providing microhabitats for a wide range of organisms. These keystone species play a crucial role in maintaining lo-cal ecosystem functions and delivering ecosystem services. However, in Mongolia, where overgrazing has accelerated due to the expansion of a market-based economy, scientific knowledge remains limited regarding the impacts of human activities on such species.
In this study, we focused on the Siberian marmot (Marmota sibirica), an ecosystem en-gineer inhabiting typical Mongolian steppe ecosystems. We assessed the relationship between the spatial distribution of marmot burrows and vegetation conditions both inside and outside Hustai National Park. Burrow locations were recorded in the field, and the Normalized Difference Vegetation Index (NDVI) was calculated using Planet Dove satellite imagery (3 m spatial resolution). Through a combination of remote sensing analyses and vegetation surveys, we examined how the presence or absence of anthropogenic disturbance (i.e., livestock grazing) affects the ecological functions of marmots.
Our results showed that the distance between active burrows was significantly shorter inside the park (t = –2.68, p = 0.0087), indicating a higher population density. Further-more, a statistical approach using beta regression revealed a significant interaction between burrow type (active, non-active, off-colony area) and region (inside vs. out-side the park) on NDVI (e.g., outside × non-active: z = –5.229, p < 0.001). Notably, in areas with high grazing pressure outside the park, the variance in NDVI differed sig-nificantly depending on the presence or absence of burrows (e.g., July 2023, active vs. off-colony area: F = 133.46, p < 0.001). Combined with vegetation structure data from field surveys, our findings suggest that marmot burrowing activity may contribute to the enhancement of vegetation quality and spatial heterogeneity.
These results indicate that the Siberian marmot remains an important component in supporting the diversity and stability of steppe ecosystems, even under intensive grazing pressure. The conservation of this species may thus provide a promising strat-egy for utilizing native ecosystem engineers in sustainable land-use management.
Keywords:
marmots
; population density
; grazing disturbance
; grassland vegetation distribution
; ecosystem engineering
; NDVI
; Mongolian grassland
1. Introduction
Fossorial mammals are known to function as ecosystem engineers in many ecosystems, influencing plant composition and spatial heterogeneity through soil disturbance and structural modifications [1,2,3]. For instance, in North America, prairie dogs (Cynomys spp.) have been observed to clip vegetation around their burrows to secure visibility, and such disturbance is believed to promote the regeneration of nutrient-rich herbaceous plants [4].
These mammals often serve as keystone species or ecosystem engineers [5,6,7,8], providing habitat and refugia for other organisms that cannot create burrows themselves [9,10]. The prolonged use of burrows and the accumulation of feces and urine are also known to enhance soil nutrient content around burrow sites. In fact, the nitrogen and phosphorus levels in plant biomass near burrows have been reported to be 20–30% higher than in non-burrowed areas [4]. These changes in soil conditions can alter competitive interactions among plants, encouraging the establishment of different species around burrows [11] and resulting in spatially heterogeneous vegetation patterns. Such structural complexity serves as vital habitat for plants and animals adapted to microenvironments and contributes to the maintenance of local biodiversity [12,13].
The Siberian marmot (Marmota sibirica), inhabiting the Mongolian steppe, is one such example of an ecosystem engineer. This rodent species, belonging to the genus Marmota in the family Sciuridae, is distributed mainly across northeastern China, Mongolia, and parts of the Russian Federation, favoring hilly or mountainous steppe regions. In Mongolia, two subspecies are recognized: M. s. sibirica, found in central and eastern grasslands and the Khentii Mountains, and M. s. caliginosus, distributed from the Khangai and Khuvsgul Mountains to the Mongol Altai. Like other fossorial mammals, Siberian marmots create spatial heterogeneity in soil structure, nutrient distribution, and vegetation composition through their burrowing activity, providing microhabitats for insects and reptiles [14]. Their burrows also serve as important refuges for a variety of commensal species, including birds, reptiles, and insects, and are even used as denning sites by predators such as foxes and wolves, underscoring their foundational ecological role in the Mongolian steppe ecosystem [15,16,17].
However, the population of Siberian marmots has drastically declined in recent years due to excessive hunting and overgrazing [18]. It is estimated that around 70% of the population was lost during the 1990s due to overhunting and famine associated with droughts, and by 2007, the national population had fallen below 10 million individuals [19,20,21]. Although the Mongolian government implemented conservation policies, including hunting bans [22], the enforcement against poaching remains insufficient, and population recovery has not yet been achieved [23].
Meanwhile, in Hustai National Park—the focal area of this study—continuous conservation efforts by park rangers have maintained higher marmot population densities compared to other regions [16]. Nevertheless, the buffer zone located along the park’s periphery still experiences significant anthropogenic impacts such as grazing and cultivation [24], resulting in marked differences in vegetation and ecosystem structure inside and outside the park. Based on vegetation surveys, Suzuki (2013) reported that vegetation within the protected area had recovered, while degradation continued outside the park due to ongoing overgrazing [25]. Since the intensity of habitat modification by marmots is positively correlated with burrow density [26], it is essential to quantitatively assess their spatial distribution and ecological impact.
Today, many steppe regions of Mongolia are severely affected by overgrazing [27], leading to vegetation degradation, homogenization of plant communities [28,29], and concerns about declining biodiversity, including pollinators [30]. These changes negatively impact local pastoral systems [31,32] and may compromise the resilience of grassland ecosystems. Against this background, this study focuses on the potential role of marmots as agents of ecological modification and evaluates their contribution to soil structure improvement, enhanced water retention, and the maintenance of plant species diversity in grazed landscapes.
The aim of this study is to assess the Siberian marmot as a potential functional species that supports structural diversity in grassland ecosystems by analyzing the distribution of burrows and vegetation structure inside and outside Hustai National Park, Mongolia. Furthermore, we statistically examine how anthropogenic pressures—particularly grazing—affect the ecological function of marmots. This research offers important insights into the potential role of wild mammals in sustainable land management, particularly in the context of ongoing grassland degradation in Mongolia.
2. Materials and Methods
2.1. Survey Area
This study was conducted in Hustai National Park (HNP), located in Töv Province, Mongolia, approximately 100 km southwest of the capital, Ulaanbaatar. The park covers a total area of 50,620 hectares, with elevations ranging from 1,100 to 1,840 meters. Surrounding the park is a designated buffer zone that serves to mitigate anthropogenic impacts. The region has a semi-arid climate, with an average annual precipitation of approximately 232 mm, and is classified as part of Mongolia’s forest-steppe zone [33].
HNP was selected in 1990 as the reintroduction site for the Przewalski’s horse (Equus ferus przewalskii) and was designated as a nature reserve in 1993. It was later upgraded to national park status in 1998 [34,35]. Before 1993, the area was used as pastureland, but since its designation, natural vegetation recovery has been progressing within the park. In contrast, grazing continues in the surrounding buffer zone, where vegetation degradation has been noted [24].
2.2. Data Used
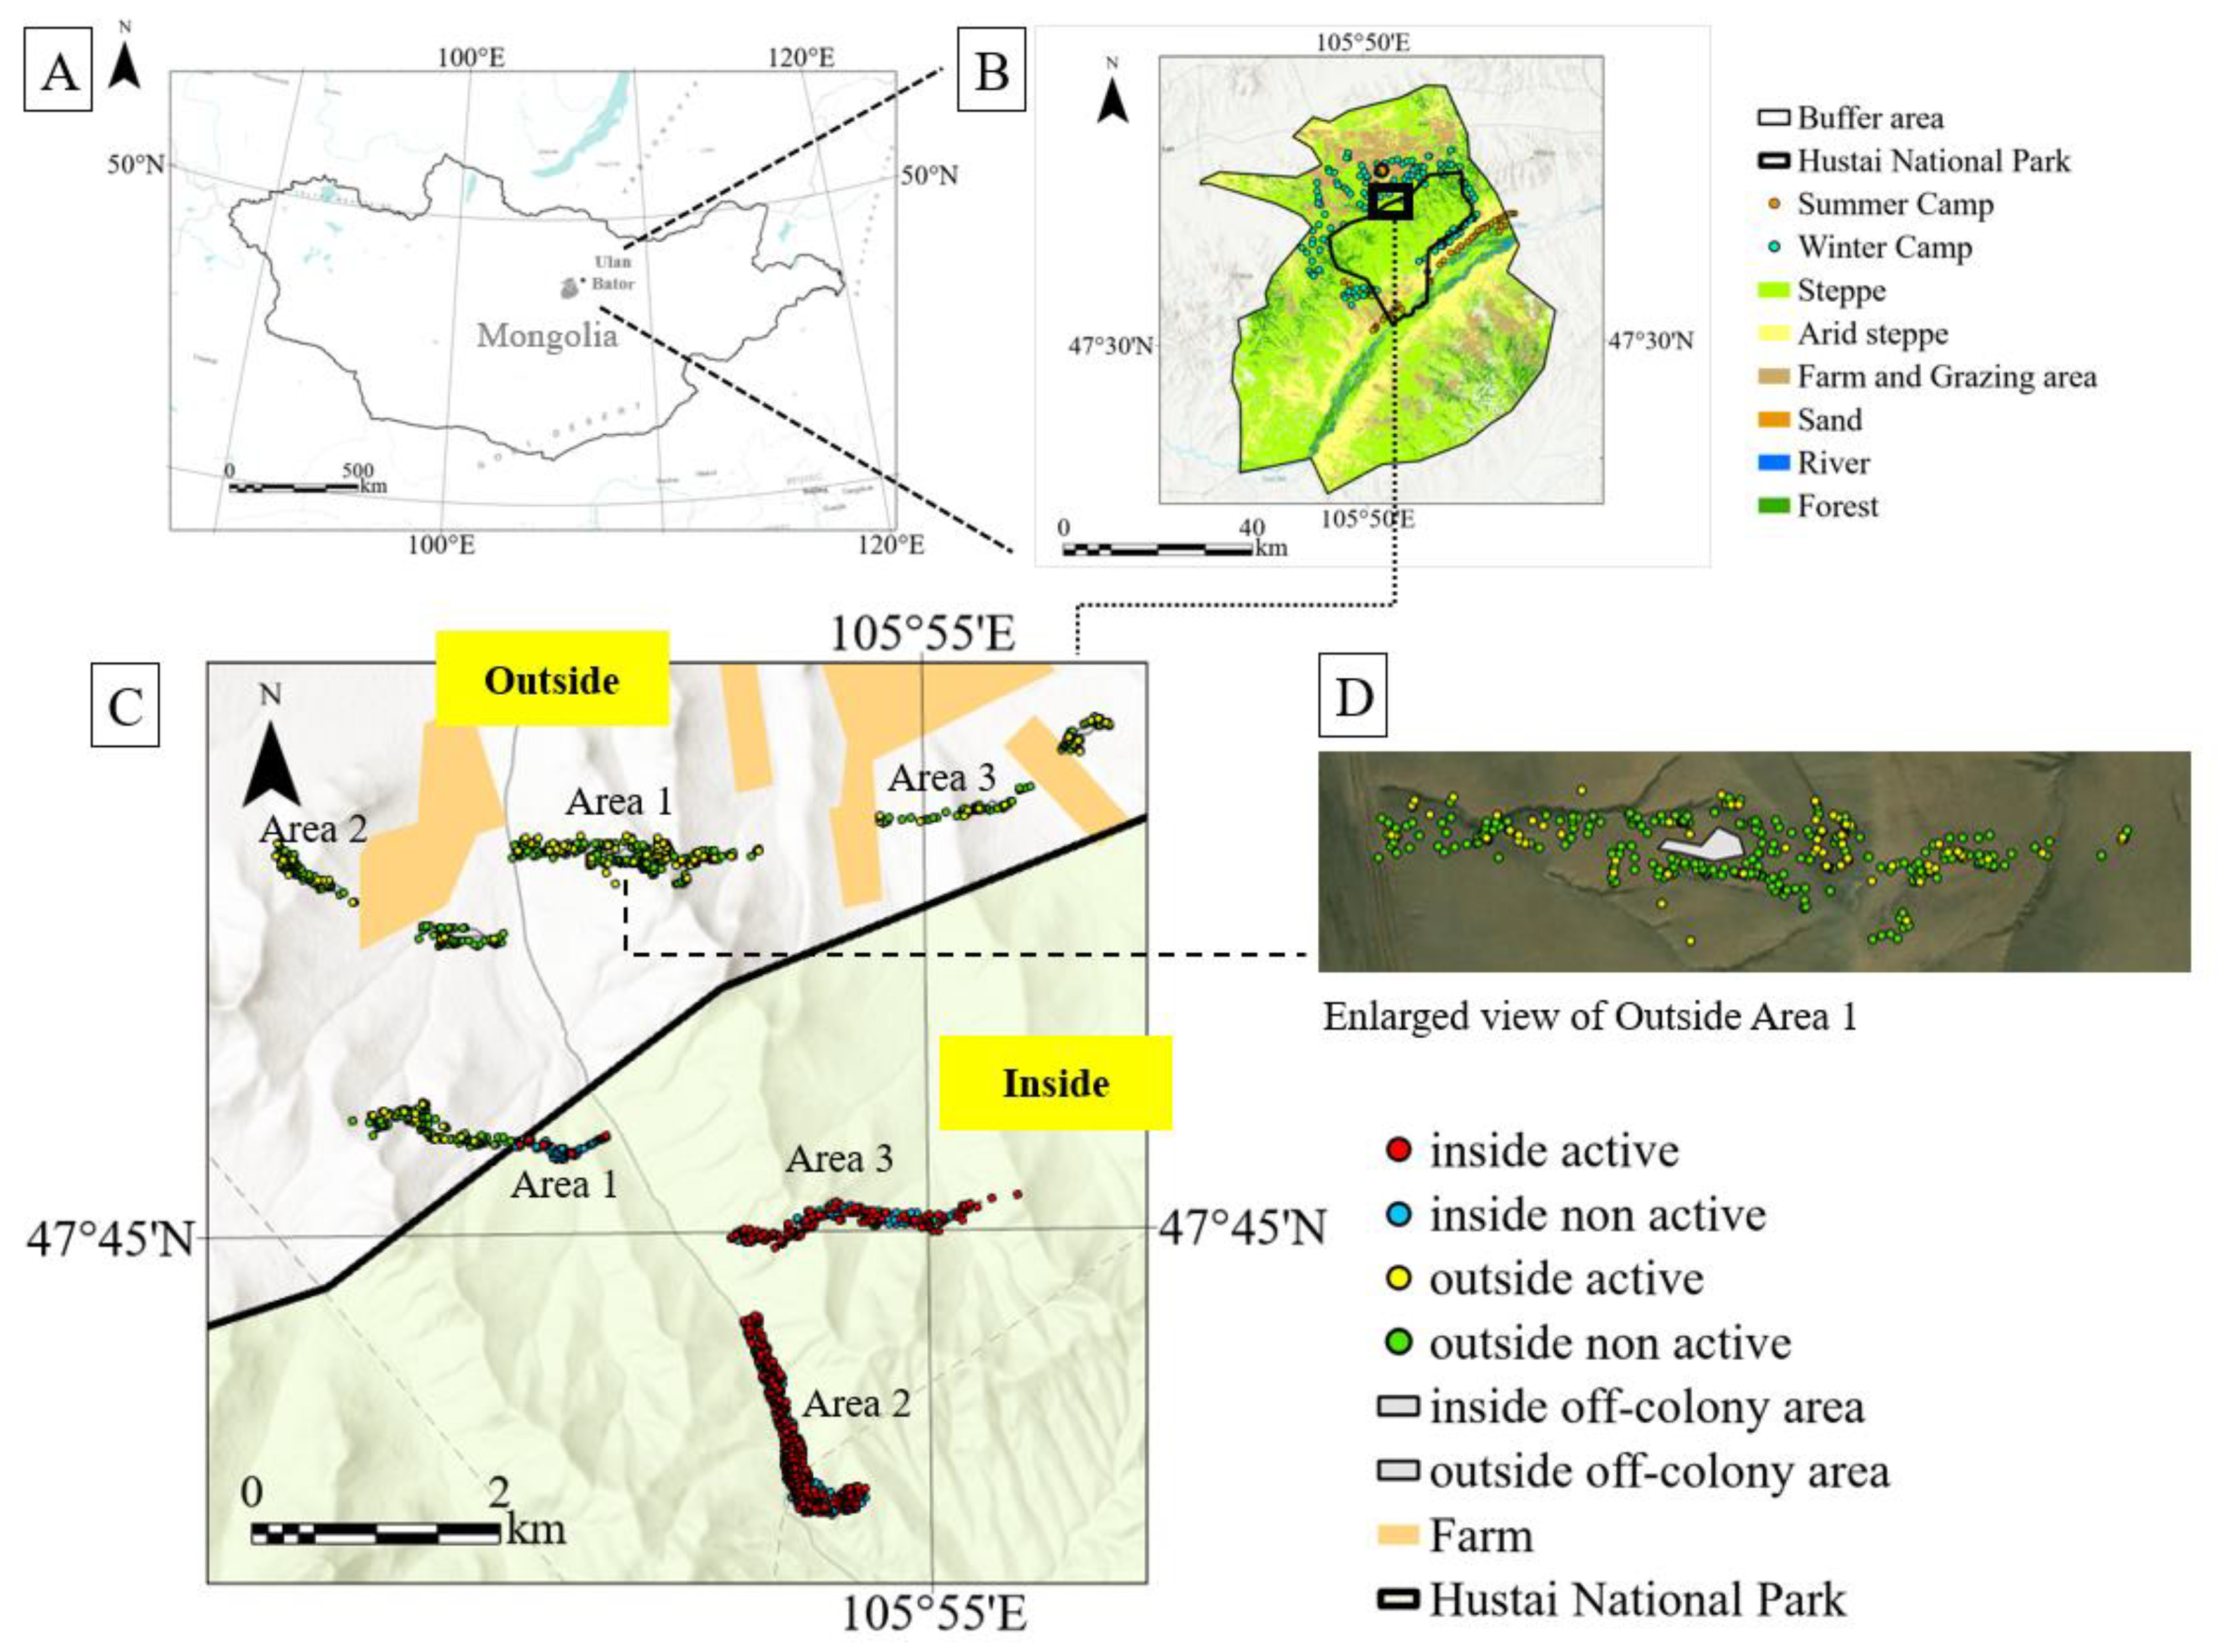
In a field survey conducted in May 2024, the locations of a total of 2,278 marmot burrows were recorded. Of these, 1,560 burrows were located inside the national park, comprising area 1 (active: 35, non-active: 279), area 2 (active: 465, non-active: 457), and area 3 (active: 188, non-active: 136). Outside the park, 718 burrows were recorded: area 1 (active: 81, non-active: 277), area 2 (active: 19, non-active: 187), and area 3 (active: 46, non-active: 108).
Burrow data were collected within six transect plots (100 m × 2,000 m each), three located inside and three outside the park. The geographic coordinates of all burrows within each plot were recorded using GPS.
Each burrow was classified as either “active” or “non-active” based on its condition. Active burrows were defined as those with visible mounds and signs of recent excavation or freshly disturbed soil [22]. In contrast, non-active burrows lacked soil mounds and showed signs of disuse, such as being overgrown with vegetation or covered in spider webs. One transect plot inside the park extended across the park boundary; the portion outside the boundary was treated as “outside the park” for analytical purposes.
Additionally, for comparison (off-colony areas), reference zones were selected within each transect plot where no burrows were observed. These areas were chosen based on their relatively flat topography and typical vegetation characteristics and were used as control areas in vegetation surveys and vegetation index analyses. Given the wide distribution of marmots, the absence of visible burrows does not guarantee the complete absence of marmot influence. Therefore, in this study, “off-colony areas” are defined as regions within the survey range where no burrows were observed, and interpretations involving these areas were made with due caution.
Figure 1.
Study area and location of marmot burrows (A,B) Location of Hustai National Park, Mongolia(C)shows the location of burrows in the survey plot and (D) Expanded map of the survey plot.
Figure 1.
Study area and location of marmot burrows (A,B) Location of Hustai National Park, Mongolia(C)shows the location of burrows in the survey plot and (D) Expanded map of the survey plot.
2.3. Analysis of Habitat Structure
Based on the recorded burrow location data, the nearest-neighbor distances (NND) for both active and non-active burrows within each transect plot were calculated using the “Near” tool in ArcGIS Pro 3.1.0 (Esri Inc.). This metric is crucial for understanding the spatial distribution of marmots and serves as a useful indicator of disturbance intensity, as burrow density reflects the degree of habitat modification [26].
2.4. Vegetation Survey
To evaluate the general trend of vegetation cover around marmot burrows, field-based vegetation surveys were conducted in August 2023 and August 2024. In 2023, five 3 m × 3 m quadrats were established at each of two habitat types: (1) active burrow mounds, including the burrow openings, and (2) off-colony areas where no burrows were present. In 2024, two additional quadrats were established in the same regions using the same methodology.
Given that active burrows typically include a substantial amount of bare ground, a 3 m × 3 m quadrat size was chosen to effectively capture the spatial heterogeneity of vegetation patterns influenced by bare patches. The following survey variables were recorded: vegetation cover was visually estimated as the percentage of ground covered by plants within each quadrat. Additionally, plant height was measured for four representative species—Artemisia adamsii, Artemisia frigida, Stipa krylovii, and Leymus chinensis—selected as indicator species of grassland condition due to their differing responses to grazing pressure and soil disturbance.
From these surveys, 28 plant species were recorded in the active burrow plots in 2023, and 20 species in 2024. In the off-colony plots, 27 species were found in 2023 and 23 species in 2024.
2.5. Vegetation Index Extraction and Analysis
To objectively assess vegetation activity, this study used the Normalized Difference Vegetation Index (NDVI), a widely applied index derived from the differential absorption and reflection of red and near-infrared (NIR) wavelengths by plant leaves. NDVI is commonly used to estimate photosynthetic activity, vegetation cover, biomass, leaf area index, and chlorophyll content [36,37]. NDVI is calculated using the following formula (Equation 1):
NDVI=(NIR−Red)/(NIR+Red) (1)
Spectral data were obtained from Planet Dove, a constellation of small satellites operated by Planet Labs Inc. Dove satellites provide imagery with eight spectral bands and a ground resolution of approximately 3 m. Image processing and NDVI calculation were performed using ENVI (Environment for Visualizing Images), provided by NV5 Geospatial Solutions.
NDVI values were derived from nine observation dates between 2023 and 2024. Using the “Extract Values to Points” tool in ArcGIS Pro 3.1.0, NDVI values were extracted at the centroid of each active and non-active burrow. Given the satellite’s spatial resolution of 3 m (≈900 m² per pixel), and the average mound area of active burrows measured in the field was 336.6 m² (n = 21, range: 41.5–1,622.9 m²; representing total mound area, thus actual bare soil area is smaller), a single pixel was sufficient to capture most or all of the burrow mound. In contrast, non-active burrows generally lacked prominent mounds or bare soil, which introduces an important distinction in interpreting NDVI values between burrow types.
For off-colony areas, sampling points were generated at 10 m intervals using the “Create Fishnet” tool in ArcGIS Pro 3.1.0, based on the definition provided in Section 2.2. A total of 169 points (inside the park) and 392 points (outside the park) were sampled, and NDVI values were extracted in the same manner.
For each date, the mean, standard deviation, maximum, and minimum NDVI values were calculated, and temporal trends were analyzed. As NDVI accuracy is compromised during snowy winter periods, data from November to March were excluded from the analysis.
2.6. Analysis of the Relationship Between Burrow Activity and NDVI
To examine the relationship between burrow activity and vegetation index (NDVI), a generalized linear mixed model (GLMM) with a beta distribution and logit link function was applied, accounting for the bounded nature of NDVI (ranging from 0 to 1). The model was implemented using the R software (R Core Team, 2025) and the glmmTMB package (version 4.2.1) [38].
Fixed effects included burrow location (area: inside, outside) and burrow type (active, non-active, off-colony area). Random effects were defined for nine survey plots: three inside the park (inside plot 1–3), three outside (outside plot 1–3), the boundary portion of inside plot 1 that extended beyond the park (treated as “boundary inside 1” and categorized as “outside”), and off-colony areas inside and outside the park.
Model selection was based on the Akaike Information Criterion (AIC). Residual diagnostics were performed using the DHARMa package, evaluating the uniformity, dispersion, and presence of outliers based on simulation-derived residuals.
3. Results
3.1. Habitat Structure and Activity Patterns of Marmots
To estimate marmot habitat conditions and population density inside and outside the protected area, we calculated the distances between burrows. Since marmots typically live in colonies with approximately 2.1–5.7 burrow entrances per hectare per family unit [19], the distance between burrows—particularly between active ones—serves as a more accurate indicator of their habitat use than simple burrow density.
Figure 2 shows the average nearest-neighbor distance between recorded burrows, while Figure 3 presents the number of burrows observed in each survey area and the proportion of those identified as active.
The average nearest-neighbor distance among active burrows was 10.50 m inside the park and 22.55 m outside the park, indicating a significantly shorter distance within the protected area. An independent two-sample t-test revealed that this difference was statistically significant (t = -2.68, p = 0.0087, p < 0.01, n = 671).
Moreover, the proportion of active burrows was higher inside the park, while the proportion of non-active burrows was lower (Figure 4). This suggests a denser spatial distribution of active individuals within the park, potentially indicating a higher population density of marmots. Overall, the results imply that marmots within the protected area exhibit higher burrow density and activity levels, suggesting the presence of more favorable habitat conditions.
3.2.1. Effects of the Protected Area and Marmot Burrows on Plant Community Structure (2023–2024)
We evaluated the sources of variation in plant community structure for the years 2023 and 2024 using non-metric multidimensional scaling (NMDS) based on Bray–Curtis dissimilarity and permutational multivariate analysis of variance (PERMANOVA, via the adonis2 function) [39]. The results for each year are summarized below.
Results for 2023
In 2023, the factor of protected area (area: inside vs. outside) had a significant effect on plant community composition (R² = 0.200, F = 4.36, p = 0.001). In contrast, the presence or absence of burrows (status: active burrow vs. off-colony area) and the interaction between area and status were not significant (p = 0.417 and p = 0.870, respectively). These results suggest that the main driver of community variation in 2023 was the protection status of the area, rather than the presence of marmot burrows.
Results for 2024
The NMDS analysis for 2024 yielded a low stress value (0.072), indicating a reliable two-dimensional representation of community structure. The PERMANOVA results showed that the protected area continued to significantly influence plant communities (R² = 0.216, F = 2.61, p = 0.027). Additionally, burrow presence (status) had a significant effect on community composition (R² = 0.299, F = 3.61, p = 0.004). The interaction between area and status was marginally significant (R² = 0.153, F = 1.84, p = 0.081), suggesting that the influence of burrows may differ depending on whether they are located inside or outside the protected area.

Table 1.
Results of PERMANOVA on Plant Community Composition Based on NMDS Analysis (2023–2024).
| Year | Factor | Df | Sum of Squares | R² | F | p-value | Significance |
|---|---|---|---|---|---|---|---|
| 2023 | Area (inside/outside) | 1 | 0.6576 | 0.2001 | 4.3645 | **0.001** | *** |
| Status (active burrow/off-colony area) | 1 | 0.1502 | 0.0457 | 0.9969 | 0.417 | ||
| Area × Status | 1 | 0.0678 | 0.0206 | 0.45 | 0.870 | ||
| 2024 | Area | 1 | 0.2775 | 0.2161 | 2.6054 | *0.027* | * |
| Status | 1 | 0.3844 | 0.2993 | 3.6084 | **0.004** | ** | |
| Area × Status | 1 | 0.1961 | 0.1527 | 1.841 | *0.081* | . (marginal) |
Table 2.
Vegetation survey results for the summer of 2023.
| 2023 | Inside | outside | ||||||
| active burrow | off-colony area | active burrow | off-colony area | |||||
| Artemisia adamsii | 13.6% | Artemisia adamsii | 22.8% | Stipa krylovii | 17.0% | Heteropappus hispidus | 19.0% | |
| Heteropappus hispidus | 9.8% | Carex duriuscula | 14.2% | Artemisia adamsii | 16.0% | Allium anisopodium | 12.0% | |
| Stipa krylovii | 9.2% | Leymus chinensis | 13.4% | Leymus chinensis | 9.2% | Stipa krylovii | 11.0% | |
- PERMANOVA = Permutational Multivariate Analysis of Variance.
- NMDS = Non-metric Multidimensional Scaling; a stress value < 0.1 indicates a reliable 2D representation.
- Significant effects (p < 0.05) are indicated with asterisks: p < 0.05 = *.p < 0.01 = **.p < 0.001 = ***.p < 0.1 = . (marginal)
- Bray–Curtis dissimilarity was used as the distance metric.
- Values in bold or asterisk-marked cells indicate statistically significant or marginally significant results.
・The top 3 coverages for each condition are shown % = coverages
Taken together, the results from 2023 and 2024 confirm that the management status inside and outside the protected area consistently influenced plant community composition. Moreover, the significant effect of marmot burrows on grassland vegetation observed in 2024 suggests that the ecological role of burrows may become more pronounced in certain years.
In particular, the interaction trend observed in 2024 implies that in the protected area—where marmot activity is dense—the environmental differences between burrowed and non-burrowed areas may be diminishing. In contrast, in non-protected areas, marmot burrows may contribute to the maintenance of grassland-type communities.
It is also worth noting that the 2023 vegetation survey was conducted prior to the transect-based burrow mapping. Therefore, the selection of “off-colony” areas in that year may have been less accurate and should be interpreted with caution.
・The top 3 coverages for each condition are shown % = coverages
In the 2024 survey, Heteropappus hispidus, an indicator species of degraded vegetation, showed the highest mean cover (19.5%) in the off-colony plots outside the park and was notably more abundant in these plots across both protected and non-protected areas. In contrast, Leymus chinensis, a dominant grassland species, exhibited the highest cover (25%) in colony plots outside the park, with a statistically significant difference compared to off-colony plots (0%) (t = 25.0, p = 0.025).
These findings suggest that marmot burrows may contribute to the recovery of grassland vegetation outside the park.
Meanwhile, inside the park, no significant differences were observed between colony and off-colony plots for either species. Typical grassland species such as Artemisia adamsii and Artemisia frigida were frequently recorded in both plot types within the park. This may be attributed to the high density of marmots, which results in less distinct environmental differences between burrowed and non-burrowed areas.
3.2.2. Comparison of Vegetation Height
In the 2024 survey, vegetation height was compared for four indicator species of grassland ecosystems (Stipa krylovii, Leymus chinensis, Artemisia frigida, and Artemisia adamsii) between active burrows and off-colony areas. For each species, t-tests were conducted based on two factors: area (inside/outside the park) and status (burrow/off-colony). The results are summarized in Table 5.
For Stipa krylovii, vegetation height on active burrows outside the park (mean: 55.5 cm) was significantly higher than that in off-colony areas (mean: 35.2 cm) (t = 3.59, p = 0.0027), suggesting that marmot burrows may promote the growth of herbaceous plants. In contrast, no significant difference was found inside the park (p = 0.836).
- For Artemisia frigida, vegetation height on active burrows inside the park (mean: 9.2 cm) was significantly lower than in off-colony areas (mean: 22.6 cm) (t = -6.04, p = 0.0004), indicating potential suppression of vegetation cover or growth on burrows.
- For Artemisia adamsii, vegetation height on active burrows outside the park (mean: 20.8 cm) was significantly higher than in off-colony areas (mean: 9.8 cm) (t = 4.18, p = 0.0041). However, due to a limited sample size, statistical testing could not be conducted for this species inside the park.
- For Leymus chinensis, no significant differences in vegetation height were observed in either area (inside: p = 0.191; outside: NA), suggesting that the impact of burrows may be limited for this species.
Although these findings are based on a small sample size and should be interpreted with caution, they indicate that marmot burrow disturbances can exert species-specific and context-dependent effects on plant growth. Marmot activity likely induces diverse micro-scale changes in vegetation structure across the landscape.
Table 4.
Comparison of grass height of each plant from vegetation survey in 2024 (unit: cm).
| Species | Area | Active Burrow Mean (n) | Off-Colony Area Mean (n) | Test Statistic | p-Value |
|---|---|---|---|---|---|
| Stipa krylovii | Inside | 59.3 (6) | 57.8 (6) | 0.214 | 0.836 |
| Stipa krylovii | Outside | 55.5 (6) | 35.2 (11) | 3.59 | 0.0027 |
| Leymus chinensis | Inside | 23.0 (6) | 28.0 (5) | -1.45 | 0.191 |
| Leymus chinensis | Outside | – (5) | – (0) | – | – |
| Artemisia frigida | Inside | 9.17 (6) | 22.6 (5) | -6.04 | <0.001 |
| Artemisia adamsii | Inside | – (0) | – (6) | – | – |
| Artemisia adamsii | Outside | 20.8 (6) | 9.83 (6) | 4.18 | 0.0041 |
Note: “–” indicates missing data or cases where statistical comparison was not available due to absence of observations.
3.3. Results of Burrow Activity and Vegetation Index (NDVI)
3.3.1. NDVI Distribution Characteristics and Model Fit
The Shapiro–Wilk test revealed that the NDVI values did not follow a normal distribution in most groups (p < 0.001), indicating the necessity of applying statistical methods appropriate for non-normal distributions. Accordingly, we employed a beta regression model, which accommodates continuous values bounded between 0 and 1.
The results of the beta regression indicated that some interaction terms between area and burrow type (active / non-active / off-colony area) were statistically significant (e.g., in 2023, outside × non-active: z = –5.229, p < 0.001). Furthermore, model comparison based on AIC showed that models including interaction terms had better fit than additive models (ΔAIC = 24.6 in 2023; ΔAIC = 58.6 in 2024).
These findings suggest that NDVI is influenced not only by burrow type but also by its interaction with spatial context—namely, whether the location is inside or outside the protected area.
Model diagnostics using DHARMa simulation-based residuals identified a small number of significant outliers (n = 34 in 2023; n = 41 in 2024). However, considering the total number of observations (14,060 in 2023 and 11,248 in 2024), the outlier frequency was very low (approximately 0.24–0.36%), and therefore unlikely to compromise the overall reliability of the models.
In addition, variance tests showed that the standard deviation ratio between observed data and model simulations ranged from 1.04 to 1.07, indicating that the model adequately captured the variability in NDVI distributions.
Table 5.
Summary of beta regression models for NDVI (2023 and 2024).
| Predictor | Estimate (2023) | Std. Error | z-Value | Estimate (2024) | Std. Error | z-Value | ||
|---|---|---|---|---|---|---|---|---|
| (Intercept) | –0.1198 | 0.0322 | –3.72 | –0.6123 | 0.0321 | –19.10 | ||
| area (outside) | –0.0532 | 0.0457 | –1.16 | –0.0641 | 0.0467 | –1.37 | ||
| burrow type (non-active) | 0.0827 | 0.0137 | 6.05*** | 0.0575 | 0.0162 | 3.56** | ||
| burrow type (off-colony area) | –0.1385 | 0.0635 | –2.18* | –0.0728 | 0.0626 | –1.16 | ||
| area × burrow type (non-active) | –0.1344 | 0.0257 | –5.23*** | –0.0950 | 0.0306 | –3.11** | ||
| area × burrow type (off-colony area) | –0.0063 | 0.0887 | –0.07 | –0.0278 | 0.0876 | –0.32 | ||
| Statistic | 2023 | 2024 | ||||||
| AIC (interaction model) | –16,285.7 | –13,792.7 | ||||||
| AIC (additive model) | –16,261.2 | –13,734.1 | ||||||
| ΔAIC (interaction – additive) | 24.6 | 58.6 | ||||||
Significance codes: ***p < 0.001, **p < 0.01, *p < 0.05.
3.3.2. Variance in NDVI Across Burrow Types
According to Levene’s tests conducted on a monthly basis, the variance in NDVI differed significantly among burrow types, with particularly clear differences observed between off-colony areas and the other types. These differences in variance were consistently significant in the outside area across all months, with F-values exceeding 100 in many comparisons (e.g., July 2023, active vs. off-colony area: F = 133.46, p < 0.001; see Appendix Table 1).
In contrast, differences in NDVI variance were relatively small in the inside area and were sometimes not statistically significant. This trend suggests that NDVI variation was higher around active and non-active burrows, whereas off-colony areas exhibited more stable values. These results imply that off-colony areas may be characterized by more homogeneous or suppressed vegetation conditions.
3.3.3. Visual Supplement
The boxplots of NDVI (Figure 4 and Figure 5) visually corroborate the statistical results, indicating greater variation around active and non-active burrows and narrower ranges in off-colony areas, especially in the outside area. These visual patterns support the interpretation that off-colony areas may possess more stable or uniform vegetation environments compared to burrow-associated sites.
4. Discussion
This study supports the hypothesis that the Siberian marmot (Marmota sibirica) functions as an ecosystem engineer by creating spatial heterogeneity in the Mongolian steppe grasslands, based on a comparative analysis between protected and non-protected areas [26].Statistical analysis of NDVI (Normalized Difference Vegetation Index) data revealed that marmot activity contributes to vegetation recovery and qualitative improvement even under high grazing pressure. Analysis of burrow density and distribution showed that the average distance between burrows in protected areas was significantly shorter (10.5 m), indicating higher population density. This result supports previous findings suggesting the presence of stable, high-density populations [40], and highlights the effectiveness of conservation measures.In contrast, the average distance between burrows outside the park was longer (22.6 m), suggesting lower population density, likely due to anthropogenic disturbances negatively affecting marmot habitat preference and colony formation. Interviews with rangers also indicated a perceived increase in marmot populations over the past 5–10 years, suggesting the potential for future expansion of distribution from protected areas to surrounding regions.
NDVI analysis revealed a significant interaction between burrow type and location (inside vs. outside the park). In particular, areas around active burrows exhibited higher NDVI values, indicating vegetation recovery and improved quality compared to off-colony areas. This tendency was especially pronounced outside the park, where greater seasonal NDVI variation was also observed. These findings support the hypothesis that marmot behaviors such as burrowing, fecal deposition, and seed dispersal enhance vegetation diversity and spatial heterogeneity.
These results suggest that marmot activity plays an important role in enhancing the resilience of steppe ecosystems and may function as localized “recovery patches,” especially in areas under high grazing pressure. NDVI values were generally higher inside the protected area, likely reflecting the influence of higher marmot densities. However, since NDVI is also affected by vegetation composition, the presence of highly reflective species such as Artemisia spp. should be taken into account. Additionally, off-colony areas were randomly selected from burrow-free zones, and potential site-selection bias should be considered.
Vegetation survey results indicated that, in addition to marmot density, the presence or absence of grazing significantly affects vegetation structure. In the 2024 survey, where the selection of off-colony areas was considered relatively appropriate, the cover of Artemisia adamsii and Stipa krylovii—species expected to increase with marmot disturbance—was higher outside the park. In contrast, Leymus chinensis, a species with high forage value [41], was abundant around burrows, while Heteropappus hispidus, an indicator of degradation, was less common. These results support both the validity of site selection and the role of marmots in modifying vegetation, and suggest that their disturbance effects may differ from those of other ecosystem engineers such as the Brandt’s vole (Lasiopodomys brandtii) [42].
Extensive livestock grazing continues outside the park, and because nomadic pastoralists generally travel less than 3 km, there is a high risk of overgrazing. The consistently low NDVI values in off-colony areas may reflect the effects of overgrazing, such as environmental homogenization, loss of plant diversity, and simplification of vegetation structure [15,43].
This study suggests that burrowing mammals like marmots may help maintain heterogeneity and complexity in grasslands, especially in heavily grazed areas. Marmot activity may help mitigate the impacts of overgrazing, such as soil compaction, reduced water infiltration, and nutrient loss [44], by maintaining or enhancing microhabitat conditions [45]. The high cover of nutritious plant species such as Leymus chinensis and Stipa krylovii around burrows provides further evidence of the marmot’s role as an ecological restoration agent.
Moreover, the movement patterns of wild herbivores such as the Mongolian gazelle are strongly correlated with NDVI, suggesting that marmot-induced vegetation heterogeneity may influence foraging behavior in wildlife [46,47,48]. It is important to note, however, that livestock and wild herbivores differ in grazing pressure and movement range, which may lead to different ecological impacts on vegetation and soil.
Several limitations remain in this study, including plant species selection, sample size in vegetation surveys, spatial resolution of NDVI data, and the need for more advanced statistical analyses. Further research is also needed on burrow age, soil nutrients, and interactions with commensal species such as birds and reptiles. Frequent reuse of marmot burrows by the corsac fox (Vulpes corsac) has been observed, and similar behavior has been reported in the Arctic fox (Vulpes lagopus) [8,10], indicating the need to further explore the ecosystem engineering effects of burrow reuse.
The ecological impact of marmot disturbance likely depends on burrow density, and future expansion of their range may increase modification intensity. Some studies have suggested that marmot activity is limited in areas with high livestock density [49], which does not contradict our findings. Rather, it reflects changes in marmot ecological function under anthropogenic pressure and suggests that balancing these dynamics will be key to future grassland management.
Although grasslands cover approximately 80% of Mongolia’s territory, only 19% was designated as protected areas as of 2021 [50,51]. Understanding the ecological role of marmots under different land-use contexts (protected vs. grazed) is essential for developing sustainable land-use strategies.
In conclusion, Marmota sibirica is an ecologically important species in the Mongolian steppe and should be prioritized for conservation. This study demonstrates that marmots can function as ecological restoration agents capable of maintaining the quality and functionality of grassland ecosystems even under anthropogenic pressure. Given that livestock numbers in Mongolia are closely tied to the national economy, reducing herd size is not a feasible solution [52]. Therefore, conserving and utilizing native ecosystem engineers like marmots could support both biodiversity and ecological functions, as well as the sustainability of pastoral systems. Future restoration strategies should actively incorporate the role of native ecosystem engineers, offering new opportunities for grassland management.
Author Contributions
HT and BH: Research plan and design, field work, data curation, software, validation, writing -original draft. UG and MI: field work, data curation, software, validation. KA: Review and editing and writing.
Funding
This research was supported by JSPS KAKENHI Grant Numbers (JP) 19H04362 and MEXT.
Data Availability
Data will be made available on request.
Acknowledgments
The authors would like to thank the many research students and professors who contributed to this study, including Ms. Manami Kikuchi, Ms. Miki Kinjo and Prof. Kazuaki Araki and Mr. Yosei Uchino. We also would like to thank all the Mongolian counterparts who assisted us in our field research. We would also like to thank all the members of the Hoshino Lab. of RGU.
Competing interest
The authors declare that they have no known competing financial interests or personal relationships that could have appeared to influence the work reported in this paper.
Appendix A
Table A1.
Levene’s Test for Homogeneity of Variance.
| Year | Month | Area | Comparison | F Value | Pr(>F) | Significance |
|---|---|---|---|---|---|---|
| 2023 | Jun | Inside | active vs non-active | 1.6856 | 0.1944 | n.s. |
| active vs off-colony | 19.41 | 1.19E-05 | *** | |||
| non-active vs off-colony | 25.757 | 4.77E-07 | *** | |||
| Outside | active vs non-active | 3.8999 | 0.04859 | * | ||
| active vs off-colony | 106.06 | < 2.2e-16 | *** | |||
| non-active vs off-colony | 115.81 | < 2.2e-16 | *** | |||
| 2023 | Jul | Inside | active vs non-active | 2.6713 | 0.1024 | n.s. |
| active vs off-colony | 25.562 | 5.27E-07 | *** | |||
| non-active vs off-colony | 19.292 | 1.26E-05 | *** | |||
| Outside | active vs non-active | 1.0398 | 0.3081 | n.s. | ||
| active vs off-colony | 133.46 | < 2.2e-16 | *** | |||
| non-active vs off-colony | 177.51 | < 2.2e-16 | *** | |||
| 2023 | Aug | Inside | active vs non-active | 23.42 | 1.45E-06 | *** |
| active vs off-colony | 7.2054 | 0.007412 | ** | |||
| non-active vs off-colony | 0.0665 | 0.7966 | n.s. | |||
| Outside | active vs non-active | 3.0339 | 0.08188 | . | ||
| active vs off-colony | 96.862 | < 2.2e-16 | *** | |||
| non-active vs off-colony | 182.43 | < 2.2e-16 | *** | |||
| 2023 | Sep | Inside | active vs non-active | 23.398 | 1.47E-06 | *** |
| active vs off-colony | 0.4516 | 0.5018 | n.s. | |||
| non-active vs off-colony | 7.1883 | 0.007481 | ** | |||
| Outside | active vs non-active | 0.5464 | 0.46 | n.s. | ||
| active vs off-colony | 181.59 | < 2.2e-16 | *** | |||
| non-active vs off-colony | 193.47 | < 2.2e-16 | *** | |||
| 2023 | Oct | Inside | active vs non-active | 9.032 | 0.002702 | ** |
| active vs off-colony | 5.0711 | 0.02459 | * | |||
| non-active vs off-colony | 20.634 | 6.37E-06 | *** | |||
| Outside | active vs non-active | 2.7936 | 0.09499 | . | ||
| active vs off-colony | 70.386 | 4.12E-16 | *** | |||
| non-active vs off-colony | 118.84 | < 2.2e-16 | *** | |||
| 2024 | Apr | Inside | active vs non-active | 0.3341 | 0.5633 | n.s. |
| active vs off-colony | 39.726 | 4.72E-10 | *** | |||
| non-active vs off-colony | 30.622 | 4.19E-08 | *** | |||
| Outside | active vs non-active | 0.3207 | 0.5713 | n.s. | ||
| active vs off-colony | 4.7067 | 0.03047 | * | |||
| non-active vs off-colony | 13.22 | 0.000289 | *** | |||
| 2024 | May | Inside | active vs non-active | 4.8423 | 0.02794 | * |
| active vs off-colony | 8.6904 | 0.003288 | ** | |||
| non-active vs off-colony | 24.639 | 8.37E-07 | *** | |||
| Outside | active vs non-active | 0.444 | 0.5054 | n.s. | ||
| active vs off-colony | 35.685 | 4.16E-09 | *** | |||
| non-active vs off-colony | 69.166 | 2.57E-16 | *** | |||
| 2024 | Jun | Inside | active vs non-active | 0.0069 | 0.9336 | n.s. |
| active vs off-colony | 17.613 | 2.99E-05 | *** | |||
| non-active vs off-colony | 18.283 | 2.12E-05 | *** | |||
| Outside | active vs non-active | 2.5934 | 0.1077 | n.s. | ||
| active vs off-colony | 107.89 | <2.2e-16 | *** | |||
| non-active vs off-colony | 119.88 | <2.2e-16 | *** | |||
| 2024 | Jul | Inside | active vs non-active | 2.4171 | 0.1203 | n.s. |
| active vs off-colony | 13.105 | 0.000312 | *** | |||
| non-active vs off-colony | 7.4029 | 0.006646 | ** | |||
| Outside | active vs non-active | 2.7545 | 0.09733 | . | ||
| active vs off-colony | 73.145 | <2.2e-16 | *** | |||
| non-active vs off-colony | 142.14 | <2.2e-16 | *** |
Significance codes: *** p < 0.001; ** p < 0.01; * p < 0.05; marginal significance (0.05 < p < 0.1); ns not significant.
References
- Reichman, O. J., & Seabloom, E. W. (2002). The role of pocket gophers as subterranean ecosystem engineers. Trends in Ecology & Evolution, 17(1), 44-49. [CrossRef]
- Davidson, A. D., Detling, J. K., & Brown, J. H. (2012). Ecological roles and conservation challenges of social, burrowing, herbivorous mammals in the world’s grasslands. Frontiers in Ecology and the Environment, 10(9), 477-486. [CrossRef]
- Sun, S., Dou, H., Wei, S., Fang, Y., Long, Z., Wang, J., ... & Jiang, G. (2021). A review of the engineering role of burrowing animals: Implication of Chinese Pangolin as an Ecosystem Engineer. Journal of Zoological Research, 3(3). [CrossRef]
- Whicker, A. D., & Detling, J. K. (1988). Ecological consequences of prairie dog disturbances. BioScience, 38(11), 778-785. [CrossRef]
- Wright, J. P., & Jones, C. G. (2006). The concept of organisms as ecosystem engineers ten years on: progress, limitations, and challenges. BioScience, 56(3), 203-209. Retrieved from https://www.researchgate.net/publication/202001805_The_Concept_of_Organisms_as_Ecosystem_Engineers_Ten_Years_On_Progress_Limitations_and_Challenges.
- Wesche, K., Nadrowski, K., & Retzer, V. (2007). Habitat engineering under dry conditions: the impact of pikas (Ochotona pallasi) on vegetation and site conditions in southern Mongolian steppes. Journal of Vegetation Science, 18(5), 665-674. [CrossRef]
- Prugh, L. R., & Brashares, J. S. (2012). Partitioning the effects of an ecosystem engineer: kangaroo rats control community structure via multiple pathways. Journal of Animal Ecology, 667-678. [CrossRef]
- Clark, H. O., Murdoch, J. D., Newman, D. P., & Sillero-Zubiri, C. (2009). Vulpes corsac (Carnivora: Canidae). Mammalian Species, (832), 1-8. [CrossRef]
- Andersen, M. L., Bennett, D. E., & Holbrook, J. D. (2021). Burrow webs: Clawing the surface of interactions with burrows excavated by American badgers. Ecology and Evolution, 11(17), 11559-11568. [CrossRef]
- Gharajehdaghipour, T., Roth, J. D., Fafard, P. M., & Markham, J. H. (2016). Arctic foxes as ecosystem engineers: increased soil nutrients lead to increased plant productivity on fox dens. Scientific reports, 6(1), 24020. [CrossRef]
- Hagenah, N., & Bennett, N. C. (2013). Mole rats act as ecosystem engineers within a biodiversity hotspot, the C ape F ynbos. Journal of Zoology, 289(1), 19-26. [CrossRef]
- Parsons, A. W., Apollonio, M., Krausman, P. R., & Rachlow, J. L. (2016). Pygmy rabbit burrows increase microhabitat heterogeneity in sagebrush-steppe ecosystems. Ecosphere, 7(6), e01334. [CrossRef]
- Valkó, O., Tölgyesi, C., Kelemen, A., Bátori, Z., Gallé, R., Rádai, Z., ... & Deák, B. (2021). Steppe Marmot (Marmota bobak) as ecosystem engineer in arid steppes. Journal of Arid Environments, 184, 104244. [CrossRef]
- Murdoch, J. D., Munkhzul, T., Buyandelger, S., Reading, R. P., & Sillero-Zubiri, C. (2009). The endangered Siberian marmot Marmota sibirica as a keystone species? Observations and implications of burrow use by corsac foxes Vulpes corsac in Mongolia. Oryx, 43(3), 431-434. [CrossRef]
- Buyandelger, S., & Otgonbayar, B. (2022). Mongolian marmot burrow influences an occupancy of Isabelline wheatear. Landscape and Ecological Engineering, 18(2), 239-245. [CrossRef]
- Becchina, R. A. (2020). Recovering Endangered Siberian Marmot (Marmota sibirica): Status and Distribution in a Steppe Region of Mongolia. Retrieved from https://scholarworks.uvm.edu/hcoltheses/331.
- Buyandelger, S., Baatargal, O., Bayartogtokh, B., & Reading, R. P. (2022). Ecosystem engineering influence of Mongolian marmots (Marmota sibirica) on small mammal communities in Mongolia. Journal of Asia-Pacific Biodiversity, 15(2), 172-179. [CrossRef]
- Kolesnikov, V. V., Brandler, O. V., Badmaev, B. B., Zoje, D., & Adiya, Y. (2009). Factors that lead to a decline in numbers of Mongolian marmot populations. Ethology Ecology & Evolution, 21(3-4), 371-379. [CrossRef]
- Buyandelger, S., Enkhbayar, T., Otgonbayar, B., Zulbayar, M., & Bayartogtokh, B. (2021). Ecosystem engineering effects of Mongolian marmots (Marmota sibirica) on terrestrial arthropod communities. Mongolian Journal of Biological Sciences, 19(1), 17-30. Retrieved from https://www.biotaxa.org/mjbs/article/view/66415.
- Townsend, S. E. (2009). Estimating Siberian marmot (Marmota sibirica) densities in the Eastern Steppe of Mongolia. Ethology Ecology & Evolution, 21(3-4), 325-338. [CrossRef]
- Fijn, N., & Terbish, B. (2021). The multiple faces of the marmot: associations with the plague, hunting, and cosmology in Mongolia. Human Ecology, 49(5), 539-549. [CrossRef]
- Thapaliya, K. (2008). Analysis of factors related to the distribution of red deer, Cervus elephus L., in Hustai National Park, Mongolia. ITC. Retrieved from https://www.researchgate.net/publication/237632048_Analysis_of_factors_related_to_the_distribution_of_Red_deer_Cervus_elephus_L_in_Hustai_National_Park_Mongolia.
- Suzuki, K., Kamijo, T., Jamsran, U., & Tamura, K. (2013). Evaluation of the effect of protected area designation by comparing steppe vegetation inside and outside Hustai National Park, Mongolia. Journal of Vegetation Science, 30(2), 85–93. [In Japanese]. [CrossRef]
- Yoshihara, Y., Okuro, T., Buuveibaatar, B., Undarmaa, J., & Takeuchi, K. (2010). Clustered animal burrows yield higher spatial heterogeneity. Plant Ecology, 206, 211-224. [CrossRef]
- International Monetary Fund. (2019). Mongolia: Overgrazing problem and its impact on grasslands. Retrieved from https://www.elibrary.imf.org/view/journals/002/2019/298/article-A002-en.xml.
- Shen, H., Dong, S., DiTommaso, A., Xiao, J., & Zhi, Y. (2021). N deposition may accelerate grassland degradation succession from grasses-and sedges-dominated into forbs-dominated in overgrazed alpine grassland systems on Qinghai-Tibetan Plateau. Ecological Indicators, 129, 107898. [CrossRef]
- Yang, C., & Sun, J. (2021). Impact of soil degradation on plant communities in an overgrazed Tibetan alpine meadow. Journal of Arid Environments, 193, 104586. [CrossRef]
- Yoshihara, Y., Ohkuro, T., Buuveibaatar, B., Undarmaa, J., & Takeuchi, K. (2010). Pollinators are attracted to mounds created by burrowing animals (marmots) in a Mongolian grassland. Journal of Arid Environments, 74(1), 159-163. [CrossRef]
- Ulziibaatar, M., & Matsui, K. (2021). Herders’ Perceptions about Rangeland Degradation and Herd Management: A Case among Traditional and Non-Traditional Herders in Khentii Province of Mongolia. Sustainability, 13(14), 7896. [CrossRef]
- Narmandakh, D., & Sakurai, T. (2022). Impact of Rangeland Degradation on Farm Performance and Household Welfare in the Case of Mongolia. Japanese Journal of Agricultural Economics, 24, 52-57. [CrossRef]
- Yoshihara, Y., Ohkuro, T., Bayarbaatar, B., & Takeuchi, K. (2009). Effects of disturbance by Siberian marmots (Marmota sibirica) on spatial heterogeneity of vegetation at multiple spatial scales. Grassland Science, 55(2), 89-95. [CrossRef]
- King, S. R., & Gurnell, J. (2005). Habitat use and spatial dynamics of takhi introduced to Hustai National Park, Mongolia. Biological Conservation, 124(2), 277-290. [CrossRef]
- Hustai National Park. (n.d.). Brief history of Hustai National Park establishment. Retrieved from https://www.hustai.mn/language/en.
- Rouse, J. W., Haas, R. H., Schell, J. A., & Deering, D. W. (1973). Monitoring vegetation systems in the Great Plains with ERTS. Third ERTS Symposium, NASA SP-351 I, 309–317. https://ntrs.nasa.gov/citations/19740022614.
- Kizilgeci, F., Yildirim, M., Islam, M. S., Ratnasekera, D., Iqbal, M. A., & Sabagh, A. E. (2021). Normalized Difference Vegetation Index and Chlorophyll Content for Precision Nitrogen Management in Durum Wheat Cultivars under Semi-Arid Conditions. Sustainability, 13(7), 3725. [CrossRef]
- Brooks, M. E., Kristensen, K., van Benthem, K. J., Magnusson, A., Berg, C. W., Nielsen, A., Skaug, H. J., Mächler, M., & Bolker, B. M. (2017). glmmTMB balances speed and flexibility among packages for zero-inflated generalized linear mixed modeling. The R Journal, 9(2), 378–400. https://journal.r-project.org/archive/2017/RJ-2017-066/index.html.
- Ballova, Z., Pekarik, L., Píš, V., & Šibík, J. (2019). How much do ecosystem engineers contribute to landscape evolution? A case study on Tatra marmots. Catena, 182, 104121. [CrossRef]
- Buuveibaatar, B., & Yoshihara, Y. (2012). Effects of food availability on time budget and home range of Siberian marmots in Mongolia. Mongolian Journal of Biological Sciences, 10(1-2), 25-31. Retrieved from https://www.biotaxa.org/mjbs/article/view/26596.
- Yokohama, M., Shimada, S. & Sekiyama, A. (2011). Vegetation and forage preference of livestock in the Mongolian steppe. Bulletin of Tokyo University of the Arts, 56(1), 1-9. Retrieved from https://nodai.repo.nii.ac.jp/records/458 [In Japanese].
- Kawashima, K., Hoshino, B., Ganzorig, S., Sawamuki, M., Asakawa, M., & Batsaikhan, N. (2012). Distribution and expansion of Microtus brandti in overgrazed areas in Mongolia. Grassland Science, 59(3), 217-224. [In Japanese]. [CrossRef]
- Yang, C., & Sun, J. (2021). Impact of soil degradation on plant communities in an overgrazed Tibetan alpine meadow. Journal of Arid Environments, 193, 104586. [CrossRef]
- Zhou, Y., Batelaan, O., Guan, H., Duan, L., Liu, T., Wang, Y., ... & Yang, B. (2024). Evaluation of the contributions of climate change and overgrazing to runoff in a typical grassland inland river basin. Journal of Hydrology: Regional Studies, 52, 101725. [CrossRef]
- Whitesides, C. J. (2015). Olympic marmot burrow densities and their effects on alpine soil properties. Physical Geography, 36(4), 293–307. [CrossRef]
- Miura, N., Ito, T. Y., Lhagvasuren, B., Enkhbileg, D., Tsunekawa, A., Takatsuki, S., ... & Mochizuki, K. (2004). Analysis of the seasonal migrations of Mongolian gazelle, using MODIS data. Int. Arch. Photogramm. Remote Sens. Spatial Inform. Sci., 35, 418-422. Retrieved from https://www.readkong.com/page/analysis-of-the-seasonal-migrations-of-mongolian-gazelle-5744763.
- Ito, T. Y., Sakamoto, Y., Lhagvasuren, B., Kinugasa, T., & Shinoda, M. (2018). Winter habitat of Mongolian gazelles in areas of southern Mongolia under new railroad construction: an estimation of interannual changes in suitable habitats. Mammalian Biology, 93, 13-20. [CrossRef]
- Harmse, C. J., Gerber, H., & Van Niekerk, A. (2022). Evaluating several vegetation indices derived from Sentinel-2 imagery for quantifying localized overgrazing in a semi-arid region of South Africa. Remote Sensing, 14(7), 1720. [CrossRef]
- Yoshihara, Y., Okuro, T., Buuveibaatar, B., Undarmaa, J., & Takeuchi, K. (2010). Complementary effects of disturbance by livestock and marmots on the spatial heterogeneity of vegetation and soil in a Mongolian steppe ecosystem. Agriculture, ecosystems & environment, 135(1-2), 155-159. [CrossRef]
- FAO. (n.d.). Mongolian grasslands and drylands: Overview of grazing lands and land use in Mongolia. Food and Agriculture Organization of the United Nations. Retrieved from https://www.fao.org/4/y8344e/y8344e0e.htm.
- WWF. (2021). The Parliament of Mongolia has approved 22 areas for national protected areas. World Wildlife Fund. Retrieved from https://www.wwf.mg/en/?346744/The-Parliament-of-Mongolia-has-approved-22-areas-for-national-protected-areas.
- Yoshihara, Y. (2013). Impact of overgrazing on ecosystems and proposals for grassland restoration in Mongolian steppe (Special Issue: Overuse and underuse of grassland ecosystems). Journal of Japanese Society of Grassland Science, 59(3), 212–216. [In Japanese] . [CrossRef]
Figure 2.
Average distance between burrows for each plot (calculated using the “near” tool in Arc GIS pro 3.1.0); points of extreme distance are due to the effects of field fragmentation.
Figure 2.
Average distance between burrows for each plot (calculated using the “near” tool in Arc GIS pro 3.1.0); points of extreme distance are due to the effects of field fragmentation.
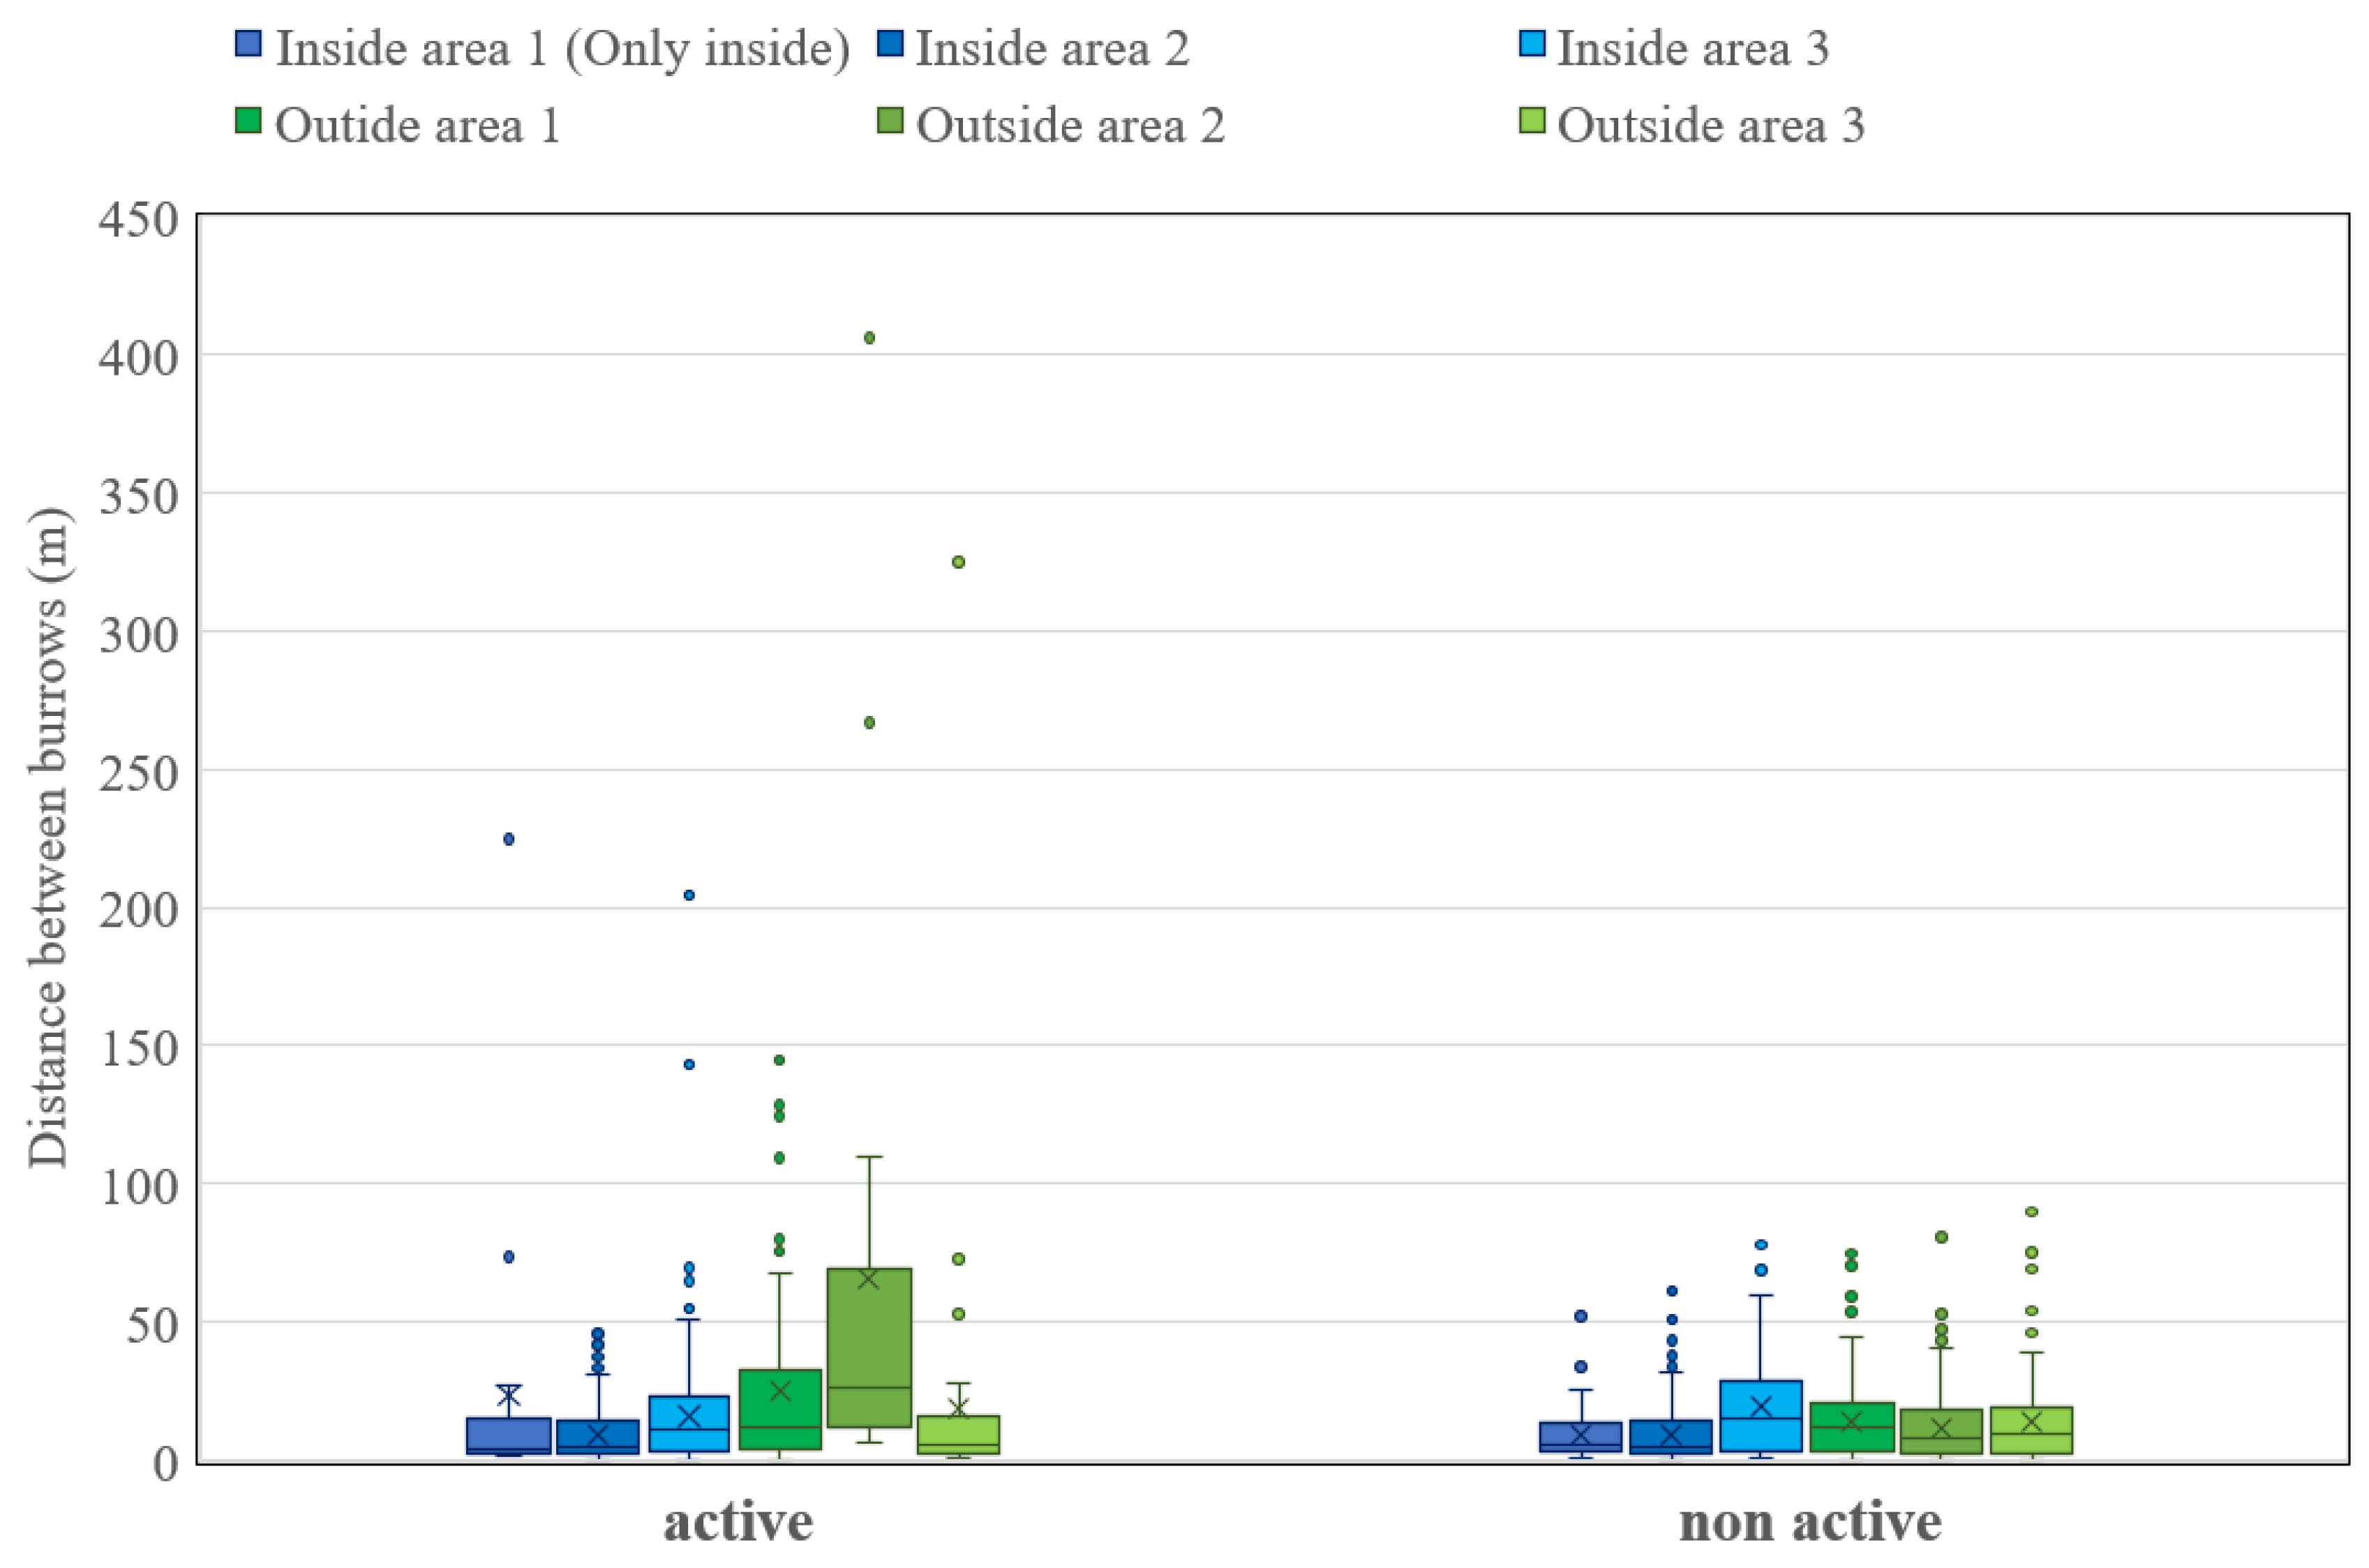
Figure 3.
Percentage of active and non-active burrows per study plot; inside average and outside average represent the average of the three plots, respectively.
Figure 3.
Percentage of active and non-active burrows per study plot; inside average and outside average represent the average of the three plots, respectively.
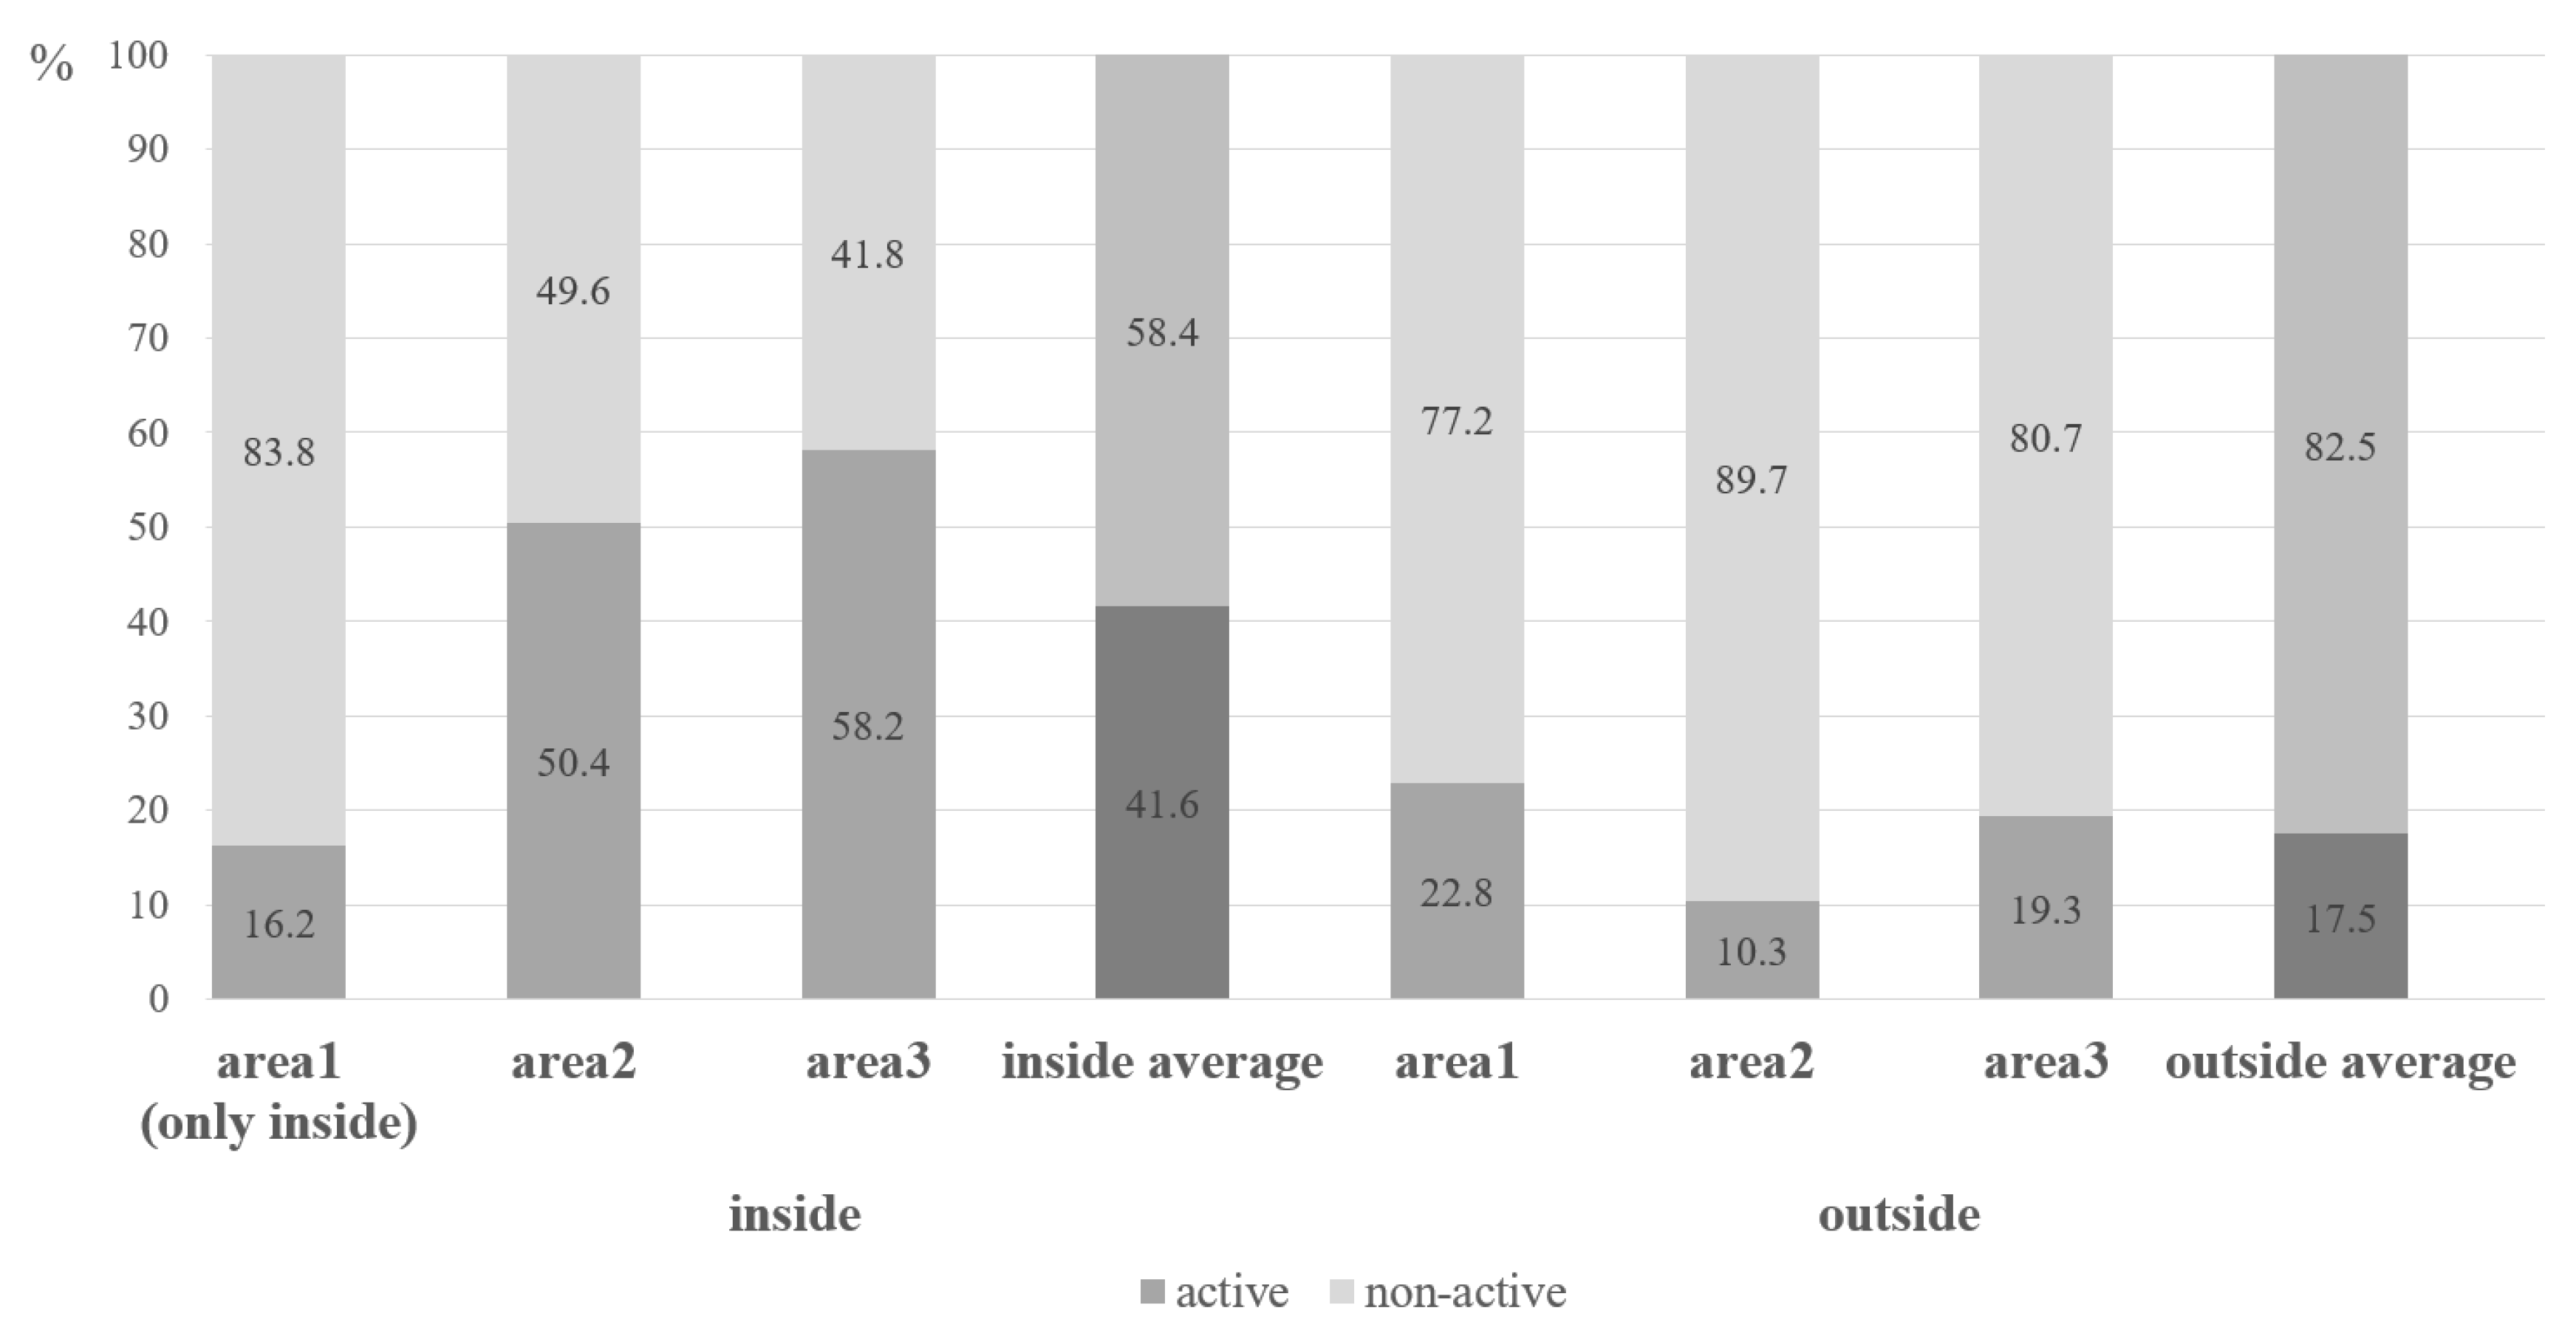
Figure 4.
Monthly NDVI Variation by Burrow Type and Area (2023).
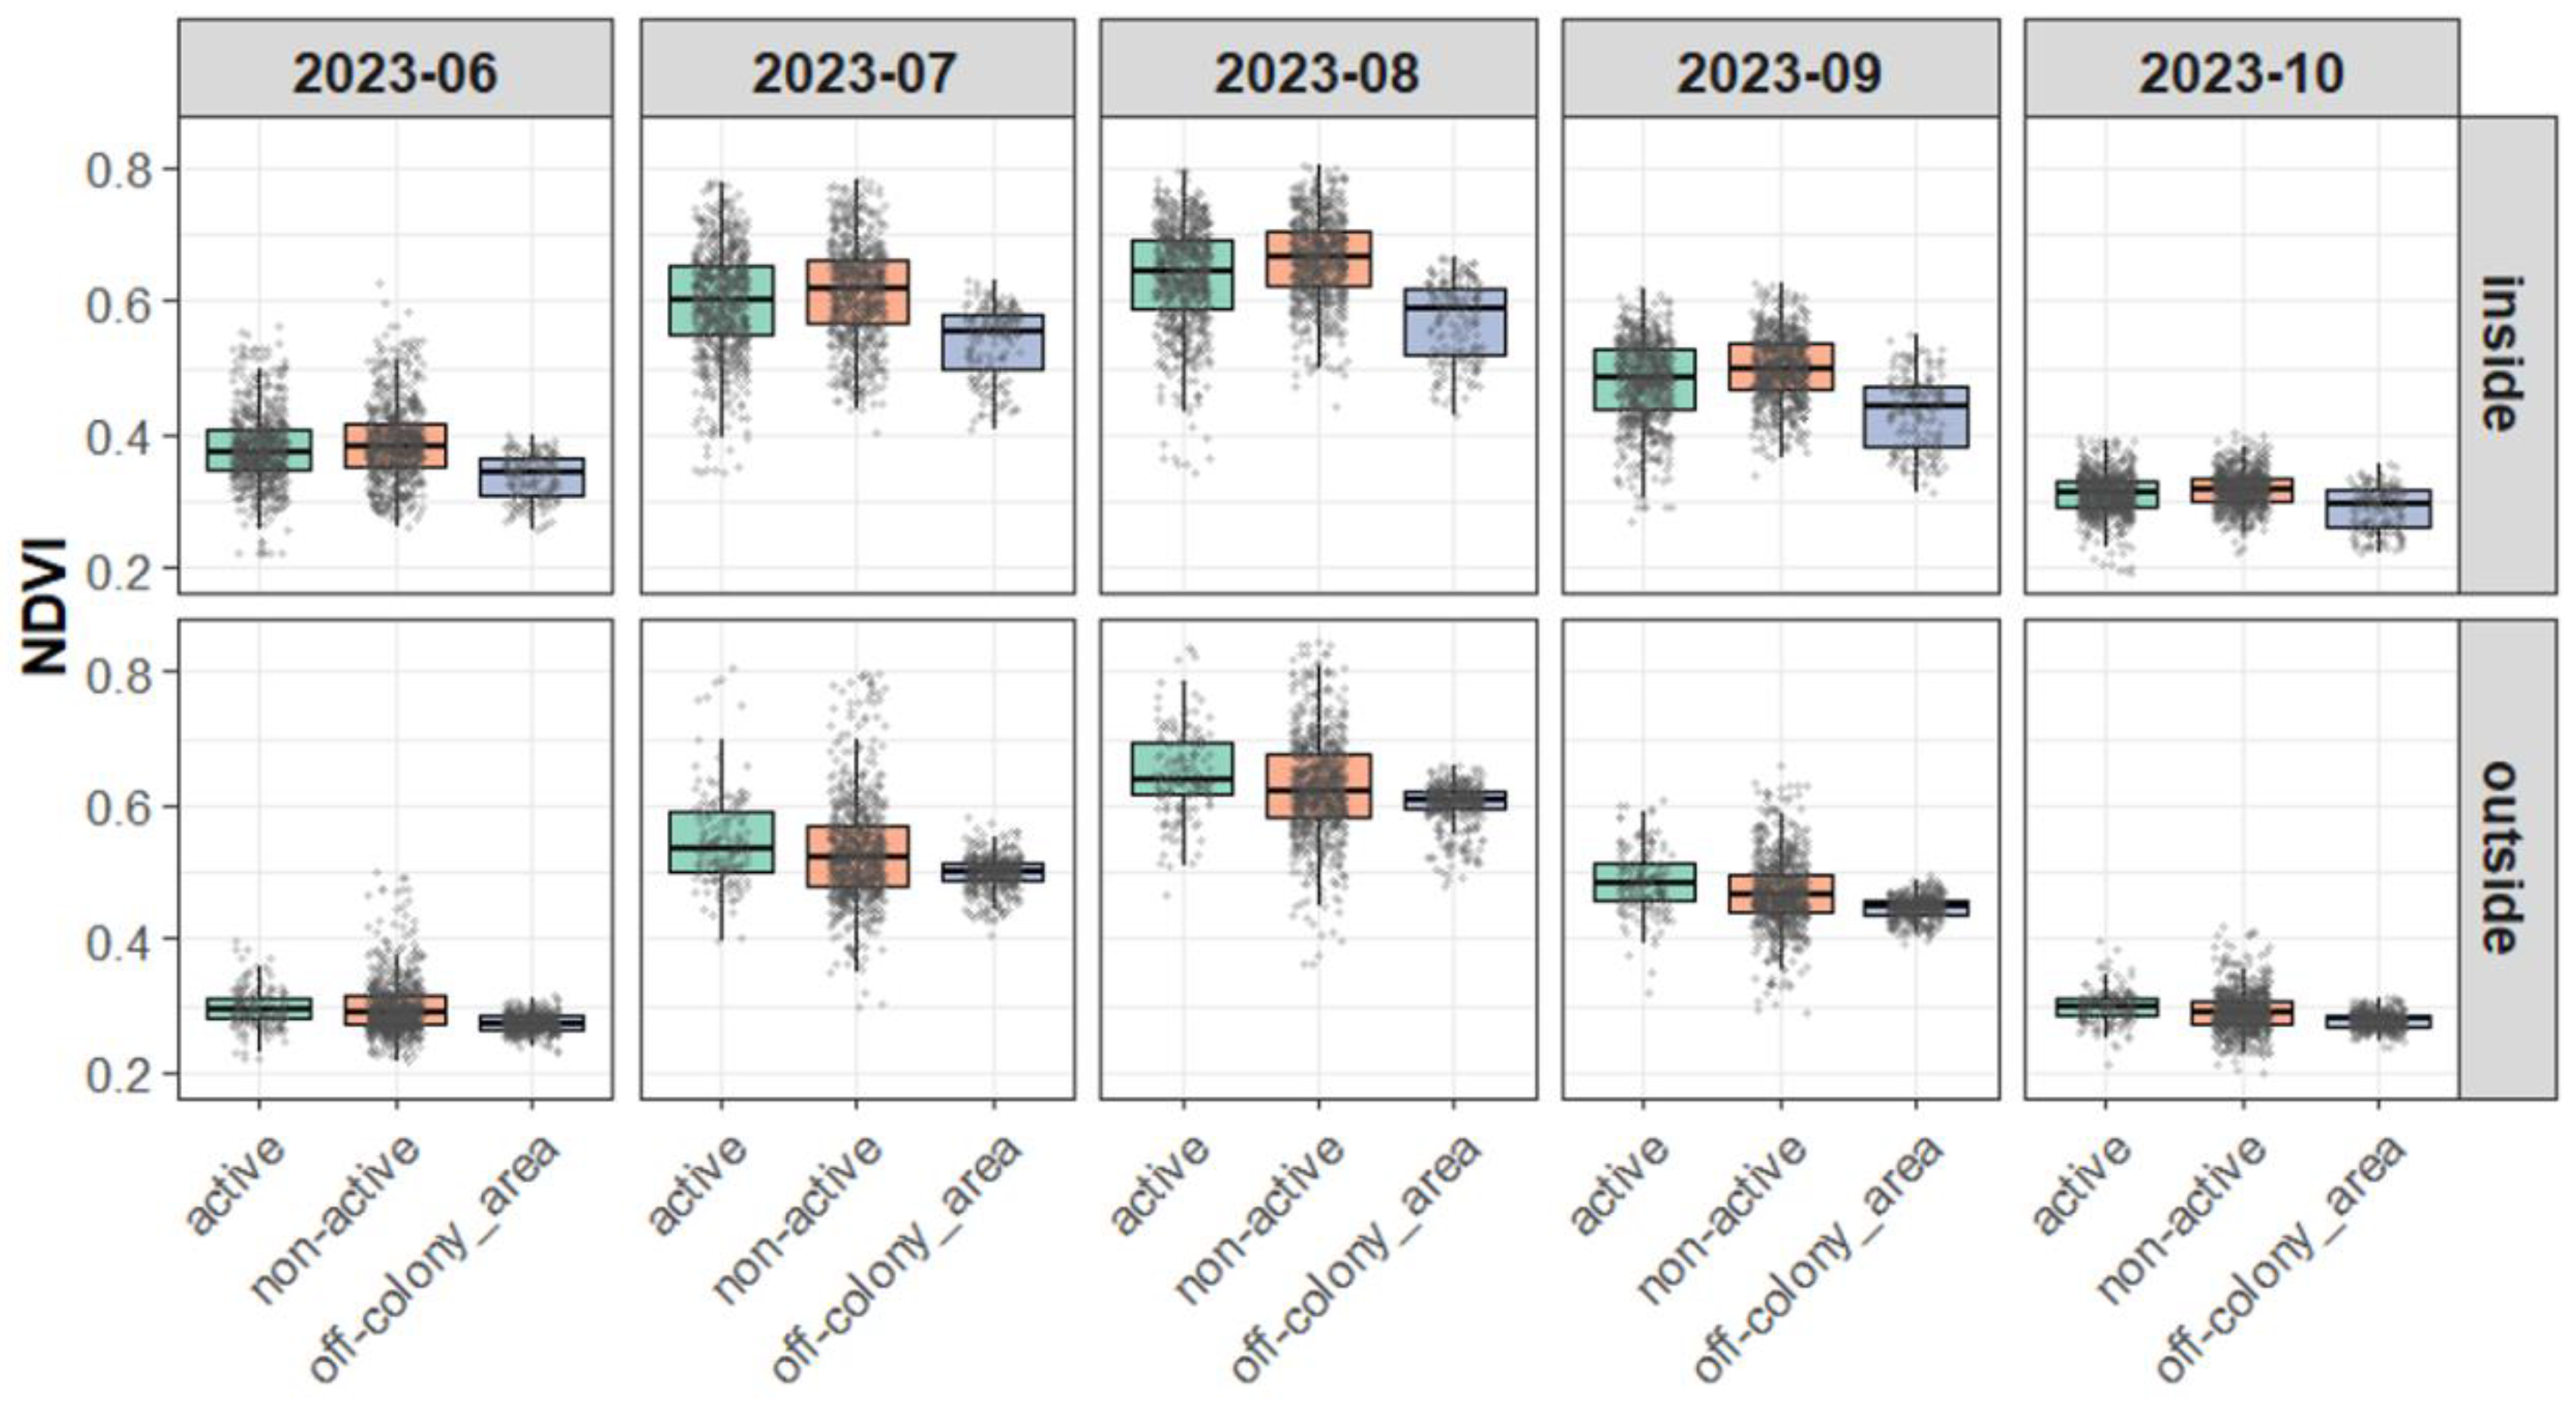
Figure 5.
Monthly NDVI Variation by Burrow Type and Area (2024).
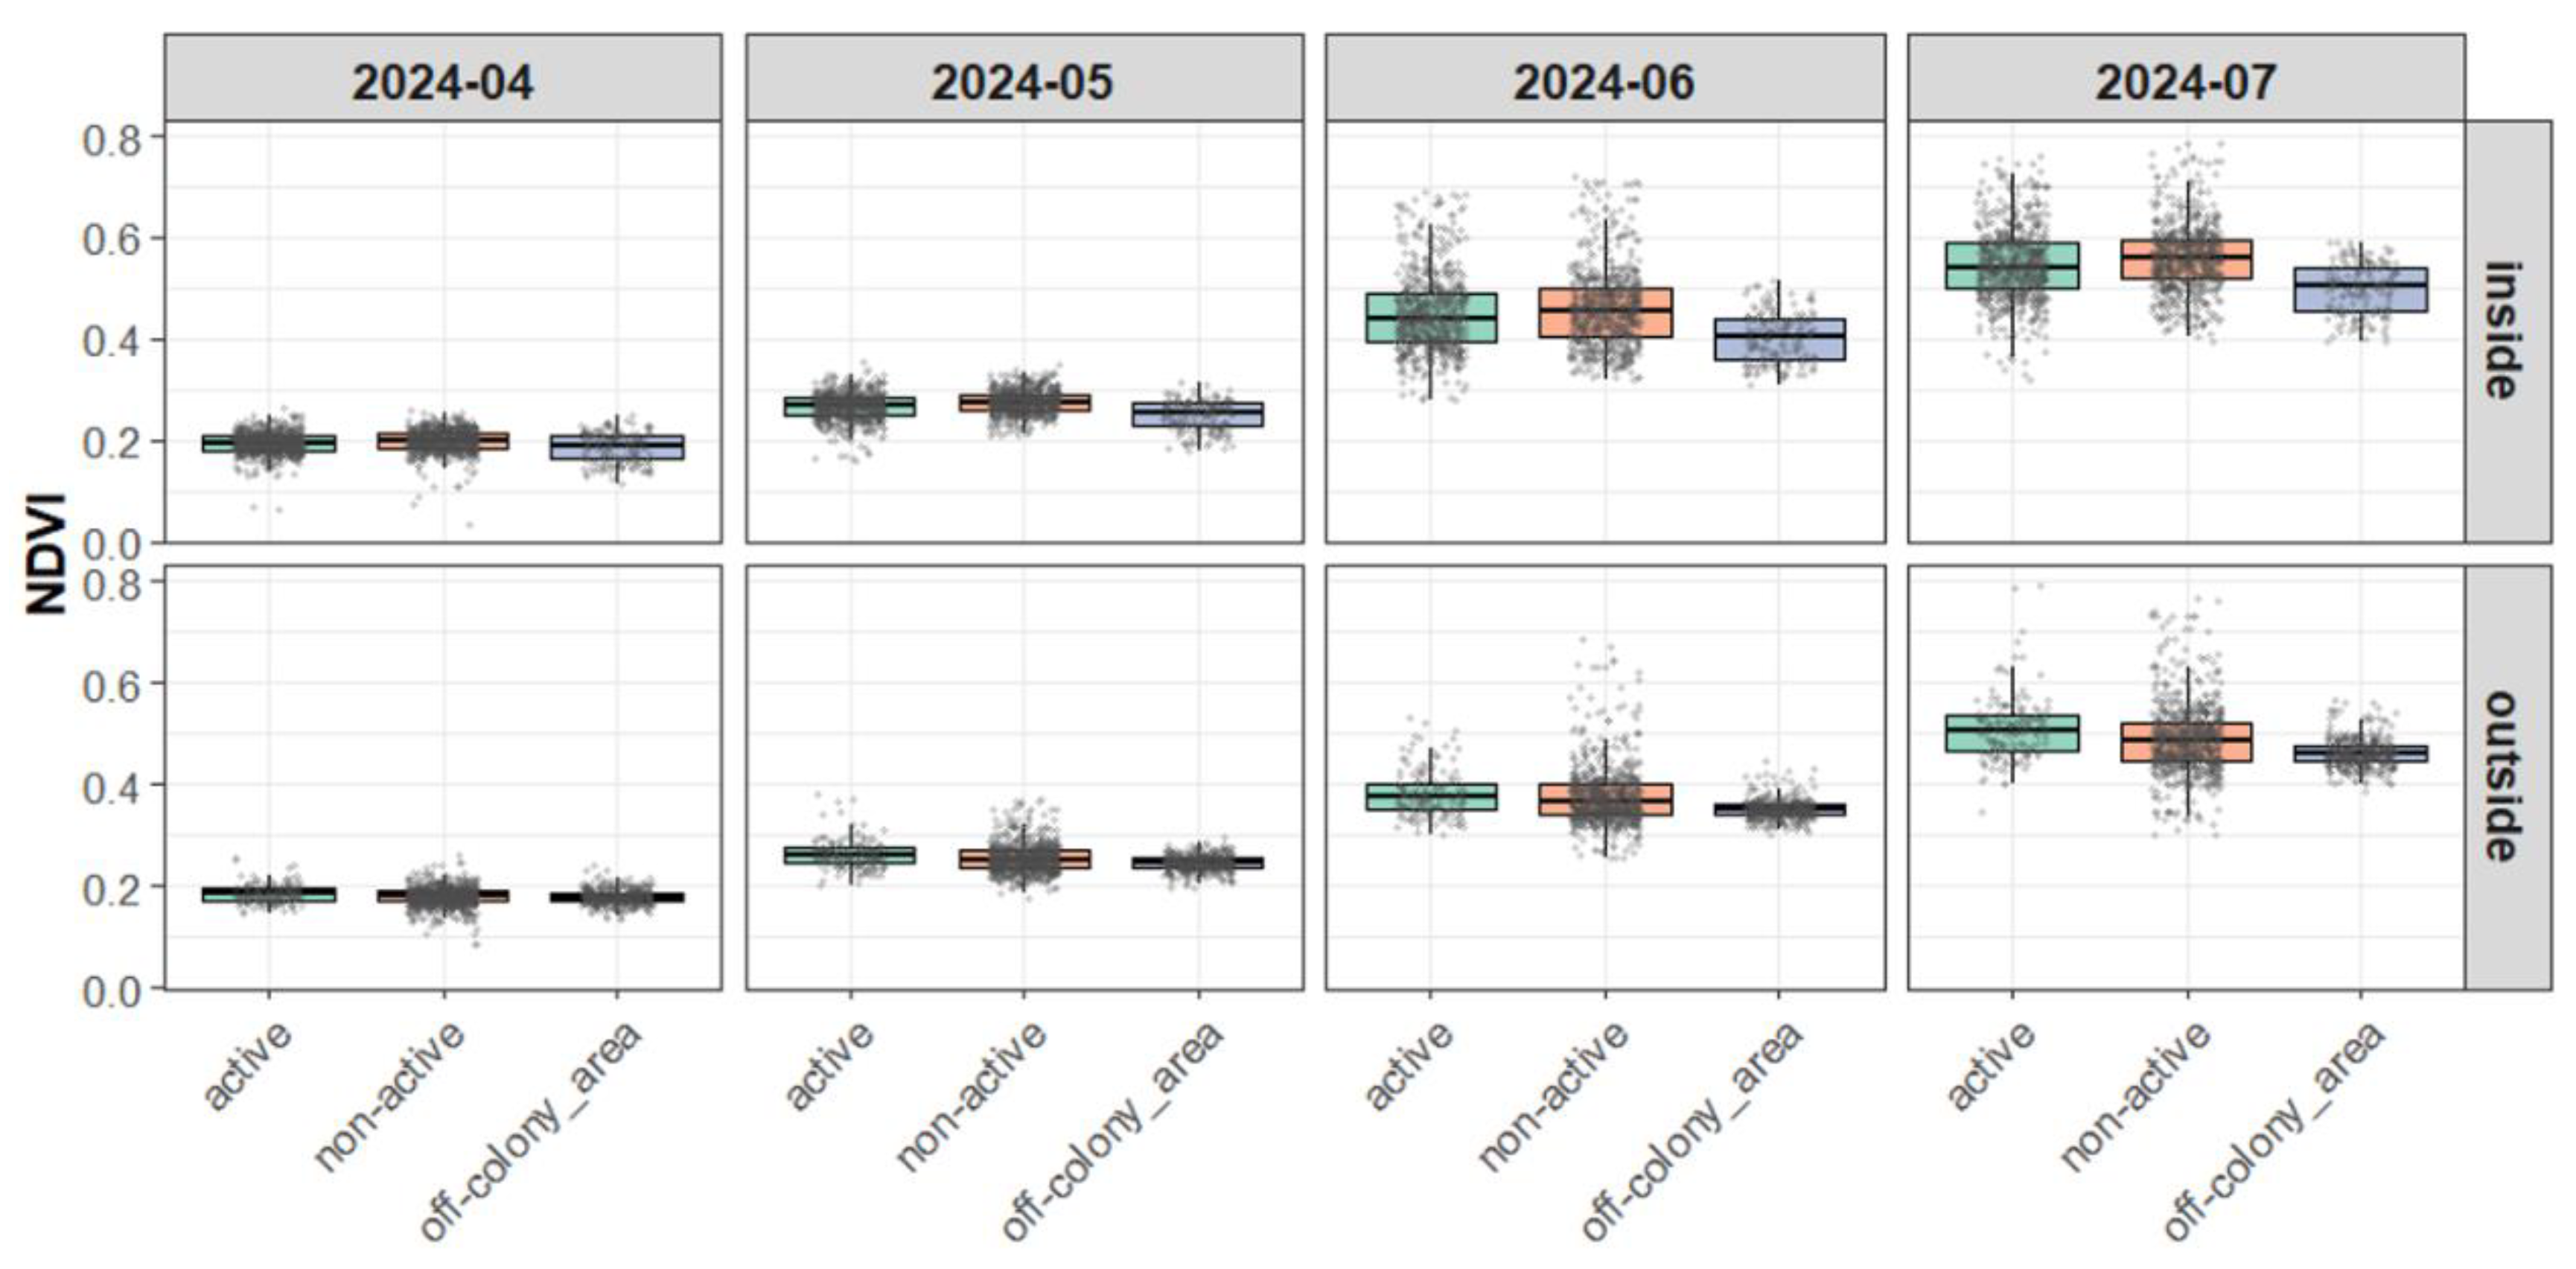
Table 3.
Vegetation survey results for the summer of 2024.
| 2024 | Inside | Outside | ||||||
| active burrow | off-colony area | active burrow | off-colony area | |||||
| Artemisia adamsii | 15.6% | Stipa krylovii | 22.5% | Leymus chinensis | 25.0% | Heteropappus hispidus | 19.5% | |
| Stipa krylovii | 10.0% | Artrmisia frigida | 8.5% | Stipa krylovii | 13.0% | Stipa krylovii | 14.0% | |
| Artemisia dracunculus | 7.2% | Cleistogenes squarrosa | 8.0% | Artemisia glauca | 11.0% | Cleistogenes squarrosa | 10.0% | |
Disclaimer/Publisher’s Note: The statements, opinions and data contained in all publications are solely those of the individual author(s) and contributor(s) and not of MDPI and/or the editor(s). MDPI and/or the editor(s) disclaim responsibility for any injury to people or property resulting from any ideas, methods, instructions or products referred to in the content. |
© 2025 by the authors. Licensee MDPI, Basel, Switzerland. This article is an open access article distributed under the terms and conditions of the Creative Commons Attribution (CC BY) license (http://creativecommons.org/licenses/by/4.0/).
Copyright: This open access article is published under a Creative Commons CC BY 4.0 license, which permit the free download, distribution, and reuse, provided that the author and preprint are cited in any reuse.


