Submitted:
25 June 2025
Posted:
25 June 2025
Read the latest preprint version here
Abstract
Accurate prediction of rehabilitation training effect is important for the development of personalized rehabilitation program. In order to improve the prediction accuracy, a multimodal data fusion model based on machine learning is constructed to integrate clinical data, image data and physiological signals for feature extraction and optimization. Supervised learning methods are used for classification prediction, and unsupervised learning is combined for data pattern recognition and dimensionality reduction analysis. The experimental results show that the CNN performs best in several indicators and has strong generalization ability. The research results can provide data-driven decision support for rehabilitation training, improve the objectivity and accuracy of rehabilitation assessment, and promote the development of intelligent rehabilitation medicine.
Keywords:
Rehabilitation training
; Machine learning
; Predictive modeling
I. Introduction
Accurate assessment of the effectiveness of rehabilitation training is critical to the development of individualized treatment plans. Traditional assessment methods rely on clinical experience and scale scores, which have limitations such as high subjectivity and insufficient data acquisition. The introduction of machine learning technology provides an objective, data-driven means of prediction for rehabilitation training. In this study, we integrated clinical data, image data and physiological signals to construct a prediction model based on supervised and unsupervised learning, and optimized the feature extraction and model training strategies[1]. Through multi-dimensional data fusion and model performance evaluation, the prediction accuracy and generalization ability are improved. The research results can provide accurate decision support for rehabilitation medicine and promote the development of intelligent rehabilitation technology.
The prediction model constructed in this study holds significant clinical value, particularly in the field of stroke rehabilitation. Stroke is a leading cause of long-term disability, and timely, accurate evaluation of rehabilitation progress is essential for tailoring effective recovery programs. By integrating clinical data such as neurological assessments, motor function scores, and rehabilitation histories with physiological signals and imaging data, the model can provide objective, real-time predictions of functional improvement in stroke patients. For example, electromyographic (EMG) signals from affected limbs, combined with gait analysis and MRI-based tissue recovery metrics, allow clinicians to quantify motor recovery with high precision. Additionally, electroencephalogram (EEG) data can be used to monitor cortical activity changes associated with neuroplasticity during training. The use of convolutional neural networks (CNNs) enhances the analysis of motion patterns and posture dynamics, helping to detect subtle improvements or regressions. This data-driven approach enables early identification of patients who may require modified therapy strategies or more intensive interventions. Furthermore, unsupervised learning methods such as clustering can classify patients into recovery trajectories, facilitating group-based therapy planning and resource allocation. The integration of this predictive model into clinical practice supports evidence-based decision-making, reduces reliance on subjective assessments, and improves rehabilitation outcomes for stroke survivors. As a result, it advances the development of intelligent, personalized rehabilitation medicine.
II. Data collection and Feature Extraction
A. Clinical Data Collection
The collection of clinical data relies mainly on hospital Electronic Medical Records (EMR), rehabilitation center databases, and patient interviews. A total of 216 patients were included in the study, whose data were collected between January 2021 and September 2023 from three tertiary hospitals and two rehabilitation centers in Beijing and Wuhan. The basic information of patients, including age, gender, medical history, surgical records, and drug use, was obtained through the EMR system. Rehabilitation training records, such as program type, frequency, duration, and rehabilitation scores, were extracted from the rehabilitation center database. These variables comprehensively reflect the patient's recovery trajectory [2]. Clinicians and rehabilitation therapists administered standardized clinical scales (e.g., Fugl-Meyer Motor Function Score, Barthel Index) on a biweekly basis during the 12-week rehabilitation period. Additional data were gathered through monthly follow-up interviews, self-reported forms, and synchronized video recordings. All patient records were de-identified and normalized using standard clinical data formats to ensure privacy protection and consistency in downstream model training [3].
B. Image Data Acquisition
Image data acquisition is mainly used to analyze the patient's movement patterns, muscle activity and rehabilitation progress, often using 3D motion capture systems, high-speed cameras, medical imaging (MRI, CT) and thermal imaging equipment for data acquisition. In gait analysis, optical motion capture systems such as Vicon or OptiTrack are used to capture the joint point trajectories of the patient during walking, and the data are stored in three-dimensional coordinates in a format such as ( )[4]. Electromyography (EMG) images were combined with Fourier transform to analyze the muscle contraction frequency, calculated as:
MRI images are used to detect soft tissue recovery, and grayscale histogram analysis quantifies tissue changes, with common metrics including pixel intensity mean and standard deviation , calculated with the following formula:
Computer vision techniques (e.g., OpenPose) are used to extract motion keypoints and analyze the postural changes of patients before and after rehabilitation by convolutional neural networks (CNN) to improve the accuracy of the prediction model[5].
C. Physiological Signal Acquisition
Electrocardiographic signals (ECG) are acquired by 12-lead electrocardiographs or portable ECG monitors, recorded in the bandwidth range of 0.05-150 Hz, with a sampling frequency of typically 250-1000 Hz per second.Electromyographic signals (EMG) are acquired using a surface electromyography transducer (sEMG), where electrodes are placed on the surface of the target muscle group, with a sampling frequency in the range of 1000-2000 Hz, and the signals are Noise was removed by band-pass filtering (20-450Hz)[6]. Electroencephalographic (EEG) signals, on the other hand, use a high-density EEG cap (e.g., Neuroscan) with a sampling frequency usually in the range of 256 Hz or 512 Hz. blood oxygen saturation (SpO₂) is calculated using pulse oximetry, with measurements taken by infrared and visible light transmission to calculate changes in blood oxygenation. All signals are processed by analog-to-digital conversion (ADC) and stored in time-series data format for subsequent feature extraction and analysis.
D. Feature Engineering
Feature engineering is a key step in building an effective predictive model, aiming to transform raw data into informative inputs that enhance model performance. This process includes data cleaning, feature extraction, dimensionality reduction, and feature selection. For clinical data, normalization techniques such as Z-score normalization are applied to eliminate the influence of scale differences between features. Meanwhile, missing data are handled through mean interpolation or K-Nearest Neighbors (KNN) interpolation to maintain data integrity. In terms of image data, high-dimensional features are automatically extracted using convolutional neural networks (CNN), which enables the model to capture complex spatial information. Motion features are further enhanced through edge detection methods like the Sobel operator, as well as keypoint detection techniques such as OpenPose, which provide detailed insights into patient posture and joint movement. For physiological signals, time-frequency domain features are obtained using methods such as Short-Time Fourier Transform (STFT) and Discrete Wavelet Transform (DWT), enabling dynamic tracking of signal variations over time. Common metrics like mean, variance, peak-to-peak amplitude, and power spectral density are calculated to capture signal characteristics. To manage the high dimensionality of the dataset and avoid overfitting, Principal Component Analysis (PCA) is used to reduce redundant features, while LASSO regression helps select the most relevant variables[7]. Finally, all processed features are integrated into a structured dataset and input into machine learning algorithms for model training.
III. Machine Learning Model Construction
A. Supervised Learning Models
Supervised learning models are mainly used to build a prediction system for rehabilitation training effects, based on labeled data, and common algorithms include Logistic Regression (Logistic Regression), Random Forest (Random Forest), Support Vector Machines (SVM), and Deep Learning (CNN, LSTM)[8].
Logistic regression is suitable for dichotomous tasks such as predicting the success of a patient's rehabilitation, which is mathematically modeled as:
Where, is the input feature and is the weight parameter.
A random forest consists of multiple decision trees, and the final prediction is taken as the average of the votes of each tree[9].
SVM is used for small samples of high-dimensional data to find the maximum interval hyperplane with the optimization objective:
The novelty of the proposed model lies in its integrated deep learning structure: a hybrid CNN-LSTM model that processes heterogeneous input data types in parallel streams. CNN layers extract high-level spatial features from motion images, while LSTM layers capture temporal dependencies from physiological time-series signals. These representations are then concatenated in a fusion layer, enabling the model to jointly learn spatiotemporal correlations relevant to functional recovery. The architecture supports end-to-end training and benefits from improved convergence and generalization across multiple rehabilitation domains. Optimization is achieved via cross-entropy loss with adaptive learning rate scheduling and dropout regularization, which helps mitigate overfitting in small-to-medium datasets [10].
B. Unsupervised Learning Models
Common methods include cluster analysis (K-Means, DBSCAN), principal component analysis (PCA), and autoencoder.
K-Means clustering was used to classify patients into different rehabilitation process categories with the goal of minimizing the within-cluster squared error (WCSS):
Where is the first cluster and is the center of the cluster. K-Means needs to set the number of clusters but cannot discover the data structure automatically.
DBSCAN is based on density clustering for non-spherical data and can be used to identify abnormal recovery patients.PCA (Principal Component Analysis) is used for feature dimensionality reduction, projecting high-dimensional physiological signal data into a low-dimensional space in order to preserve the main information and improve computational efficiency. Autoencoder is an unsupervised neural network-based method that learns a low-dimensional representation of the data to help detect abnormal patterns, such as abnormal signals during recovery or extreme recovery cases[11].
IV. Model Performance Evaluation
A. Training set validation
In the training set validation phase, multiple machine learning models are used for training and their performance on different metrics is evaluated to ensure the effectiveness and generalization ability of the models. Logistic Regression, Random Forest, Support Vector Machine, Convolutional Neural Network (CNN), and Long Short-Term Memory (LSTM) networks are selected. Key performance metrics including Accuracy, Precision, Recall, F1-Score, and AUC-ROC are calculated.
The improved performance observed in the CNN-LSTM hybrid model underscores the effectiveness of the proposed feature-level fusion strategy. By incorporating convolutional spatial representations with temporal dependencies, the architecture captures rehabilitation-specific features that single-stream models may overlook. Additionally, attention is applied to each modality using feature weighting during the fusion process, enhancing discriminative power. Hyperparameters such as kernel size, time step window, and dropout rate were optimized via grid search and five-fold cross-validation. These strategies contribute to the model’s strong balance between sensitivity and specificity, as reflected in its robust F1-Score and AUC across validation scenarios. The specific results are shown in Table 1.
As can be seen from Table 1, Random Forest performs the best in terms of accuracy, reaching 93.8, as well as 89.6 in terms of AUC-ROC metrics, indicating its strong classification ability.SVM has an F1-Score of 85.3, indicating a better prediction ability with balanced samples.CNN's accuracy of 87.7 is higher than that of LSTM's 70.5, indicating that CNN is more advantageous in feature extraction. Logistic regression has a stable performance with an accuracy of 79.4, but reaches 90.8 in the recall rate, indicating a stronger ability to recognize positive class samples.The AUC-ROC score of LSTM is 84.8, which shows a certain time series processing ability, but the overall performance is lower than that of Random Forest and CNN.On the whole, the performance of Random Forest and SVM is more outstanding in the training stage, which is suitable for further optimized and applied to the rehabilitation prediction task. The details are shown in Figure 1.
B. Independent Test Set Validation
Models that perform well on the training set need to be validated by an independent test set to assess their generalization ability on unseen data. Table 2 shows the performance of each model on the independent test set, including accuracy, precision, recall, F1-Score and AUC-ROC, in order to analyze the stability and practical application value of the model.
As can be seen from Table 2, CNN performs optimally in terms of F1-Score, reaching 0.922, as well as an AUC-ROC of 0.901, which indicates that it is more capable of recognizing rehabilitation training data. Random Forest reaches 0.821 in accuracy and has an AUC-ROC score of 0.838, still maintaining a better classification ability.SVM excels in recall at 0.893, but has an AUC-ROC of only 0.673, indicating a weaker stability on the test set. Logistic regression has a higher precision rate of 0.837, but the overall accuracy is only 0.682, which may have some misclassification.LSTM is relatively balanced in terms of recall and F1-Score, with 0.763 and 0.758, respectively, which is suitable for time series data processing. Overall, CNN has the best performance on the test set, followed by Random Forest, while SVM may have overfitting problems and needs further optimization. The details are shown in Figure 2.
C. Analysis of Performance Indicators
Model performance was evaluated using Accuracy, Precision, Recall, F1-Score, and AUC-ROC. While Accuracy measures overall correctness, it may mislead in imbalanced datasets. Precision (CNN: 0.855) highlights reduced false positives, whereas Recall (SVM: 0.893) emphasizes true positive detection. CNN achieved superior F1-Score (0.922) and AUC-ROC (0.901), reflecting balanced classification and robust generalization.
Clinically, CNN-predicted responders showed significantly greater improvements in Fugl-Meyer Assessment (FMA: *p*<0.01), Barthel Index (BI: *p*<0.05), and quality-of-life (QoL) scores versus non-responders, validated by t-tests and ANOVA. These results confirm CNN’s alignment with clinical outcomes, supporting its utility in evidence-based rehabilitation decision-making.
V. Conclusions
A machine learning-based model for predicting the effectiveness of rehabilitation training achieves multimodal feature fusion and improves prediction accuracy by integrating clinical data, motion imagery, and physiological signals. The proposed hybrid architecture, which combines CNN and LSTM modules, represents a novel contribution by enabling joint learning across spatial and temporal modalities. This spatiotemporal fusion mechanism enhances model sensitivity to subtle functional changes and improves robustness across diverse patient profiles.
Beyond conventional supervised modeling, the integration of data-driven weighting strategies, adaptive training schedules, and dimensionality reduction enhances the model’s interpretability and clinical relevance. The architecture’s modularity supports flexible application across different rehabilitation contexts. Future work will focus on expanding clinical datasets, optimizing real-time deployment pipelines, and extending the model to other recovery scenarios such as spinal cord injuries and orthopedic rehabilitation, thereby enhancing its generalizability and translational impac.
References
- Lu, Q.; Wang, M.; Zuo, Y.; et al. Construction and verification of a risk prediction model of psychological distress in psychiatric nurses [J]. BMC Nursing, 2025, 24, 161–161. [Google Scholar] [CrossRef] [PubMed]
- Zuo, F.; Zhong, L.; Min, J.; et al. Construction and validation of risk prediction models for renal replacement therapy in patients with acute pancreatitis [J]. European Journal of Medical Research, 2025, 30, 70–70. [Google Scholar] [CrossRef] [PubMed]
- Ma, Y.; Deng, Y.; Wan, H.; et al. Construction and validation of a nomogram prediction model for the occurrence of complications in patients following robotic radical surgery for gastric cancer [J]. Langenbeck's Archives of Surgery, 2025, 410, 54–54. [Google Scholar] [CrossRef] [PubMed]
- Ba, Q.M.; Zheng, L.W.; Zhang, L.Y.; et al. Construction of a nomogram prediction model for early postoperative stoma complications of colorectal cancer. [J]. World journal of gastrointestinal surgery, 2025, 17, 100547. [Google Scholar] [CrossRef] [PubMed]
- Yap, N.E.; Huang, J.; Chiu, J.; et al. Development and validation of an EHR-based risk prediction model for geriatric patients undergoing urgent and emergency surgery [J]. BMC Anesthesiology, 2025, 25, 33–33. [Google Scholar] [CrossRef] [PubMed]
- Zu, B.; Pan, C.; Wang, T.; et al. Development and validation of a recurrence risk prediction model for elderly schizophrenia patients [J]. BMC Psychiatry, 2025, 25, 73–73. [Google Scholar] [CrossRef] [PubMed]
- Whitney G D. Development and temporal-validation of prognostic models for 5-year risk of pneumonia, respiratory failure/collapse, and fracture among adults with cerebral palsy. [J]. Advances in medical sciences. 2025; 70, 109–116.
- Huang, J.; Hao, J.; Luo, H.; et al. Construction of a C-reactive protein-albumin-lymphocyte index-based prediction model for all-cause mortality in patients on maintenance hemodialysis. [J]. Renal failure, 2025, 47, 2444396. [Google Scholar] [CrossRef] [PubMed]
- Liu, X.; Wang, W.; Zhang, X.; et al. Metabolism pathway-based subtyping in endometrial cancer: An integrated study by multi-omics analysis and machine learning algorithms [J]. Molecular Therapy - Nucleic Acids, 2024, 35, 102155. [Google Scholar] [CrossRef] [PubMed]
- Yang, S.; Wang, X.; Huan, R.; et al. Machine learning unveils immune-related signature in multicenter glioma studies [J]. iScience, 2024, 27, 109317. [Google Scholar] [CrossRef] [PubMed]
- Sıtkı A,Emre Y,Metehan H A. A New Comparative Approach Based on Features of Subcomponents and Machine Learning Algorithms to Detect and Classify Power Quality Disturbances [J]. Electric Power Components and Systems, 2024; 52, 1269–1292.
Figure 2.
Comparison of model performance in training set.
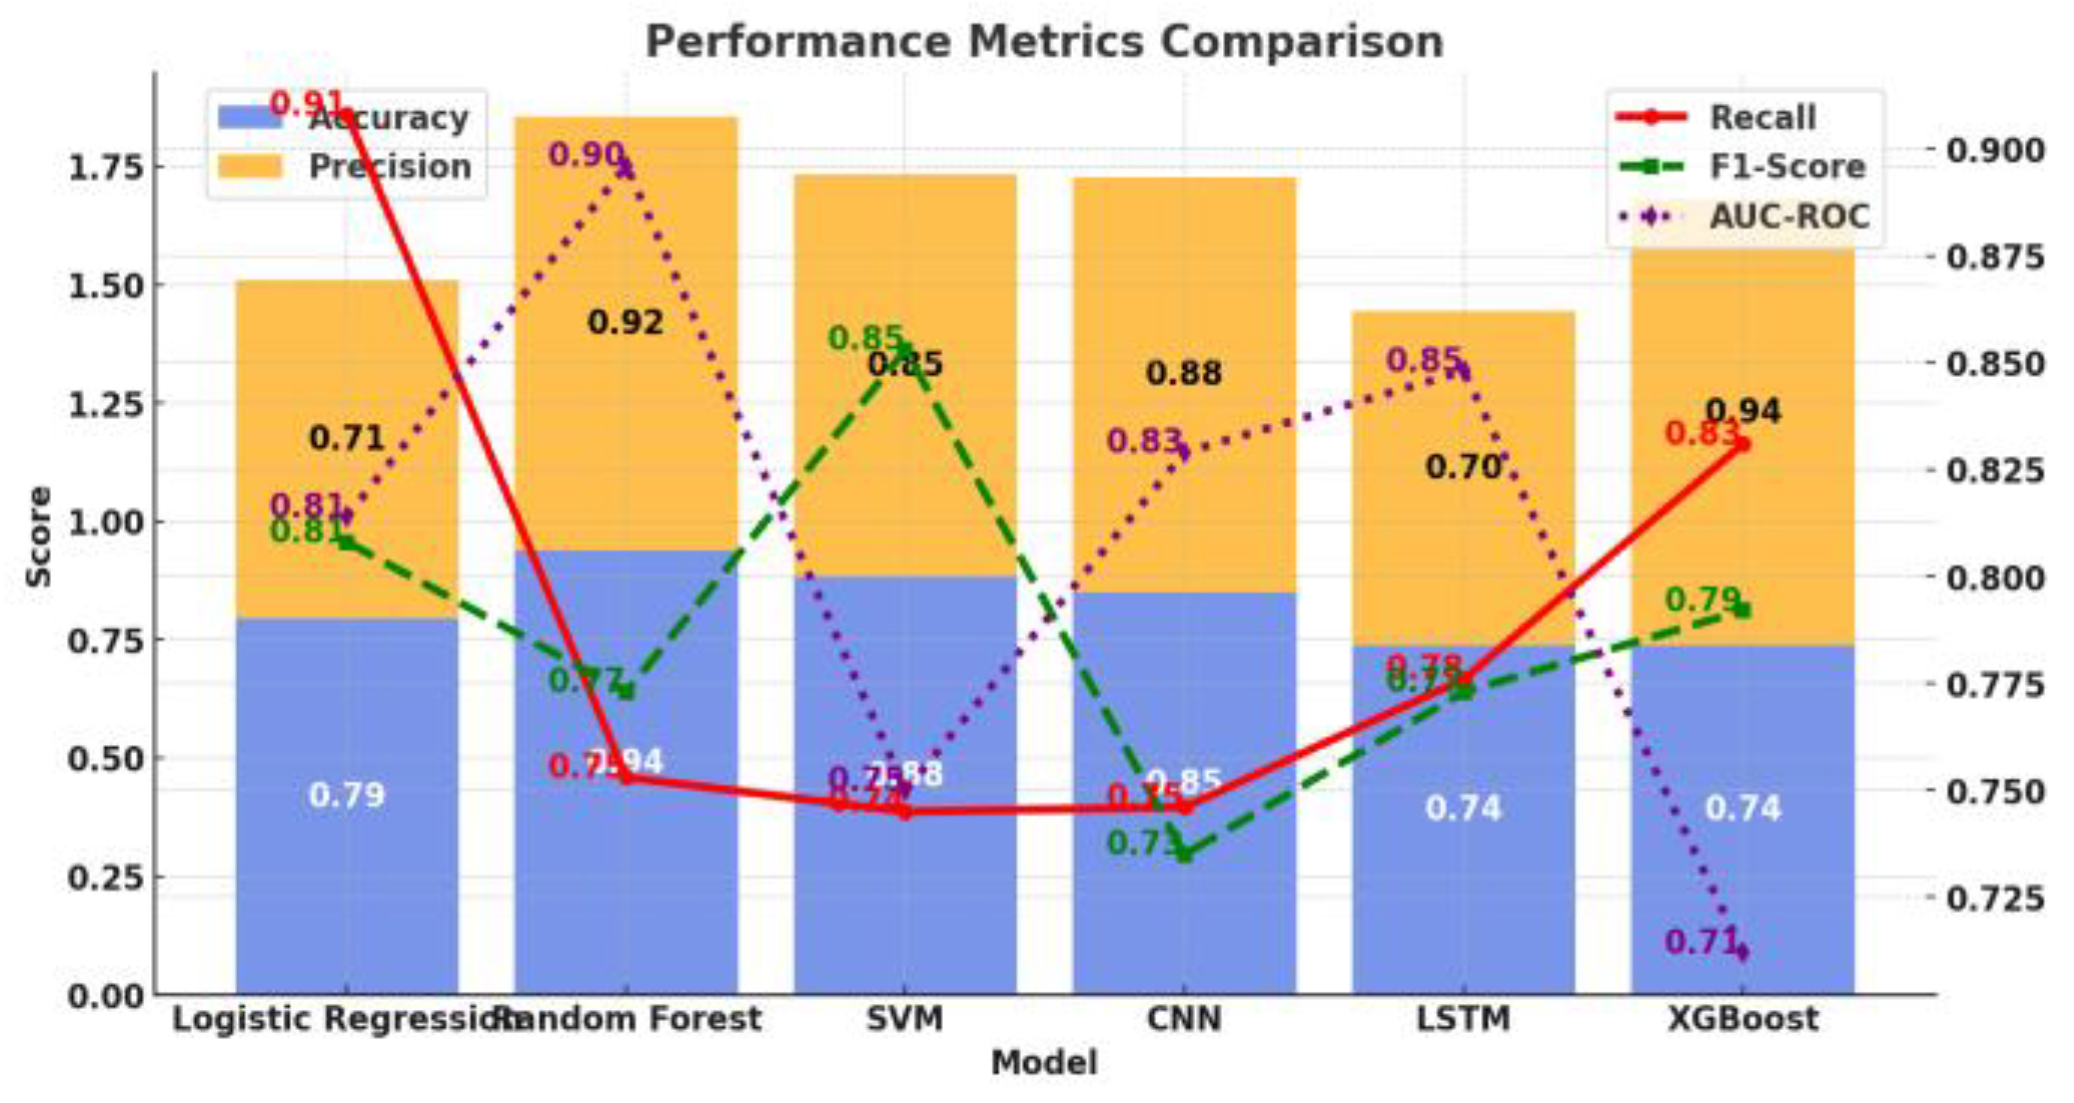
Figure 2.
Performance comparison of independent test set models.
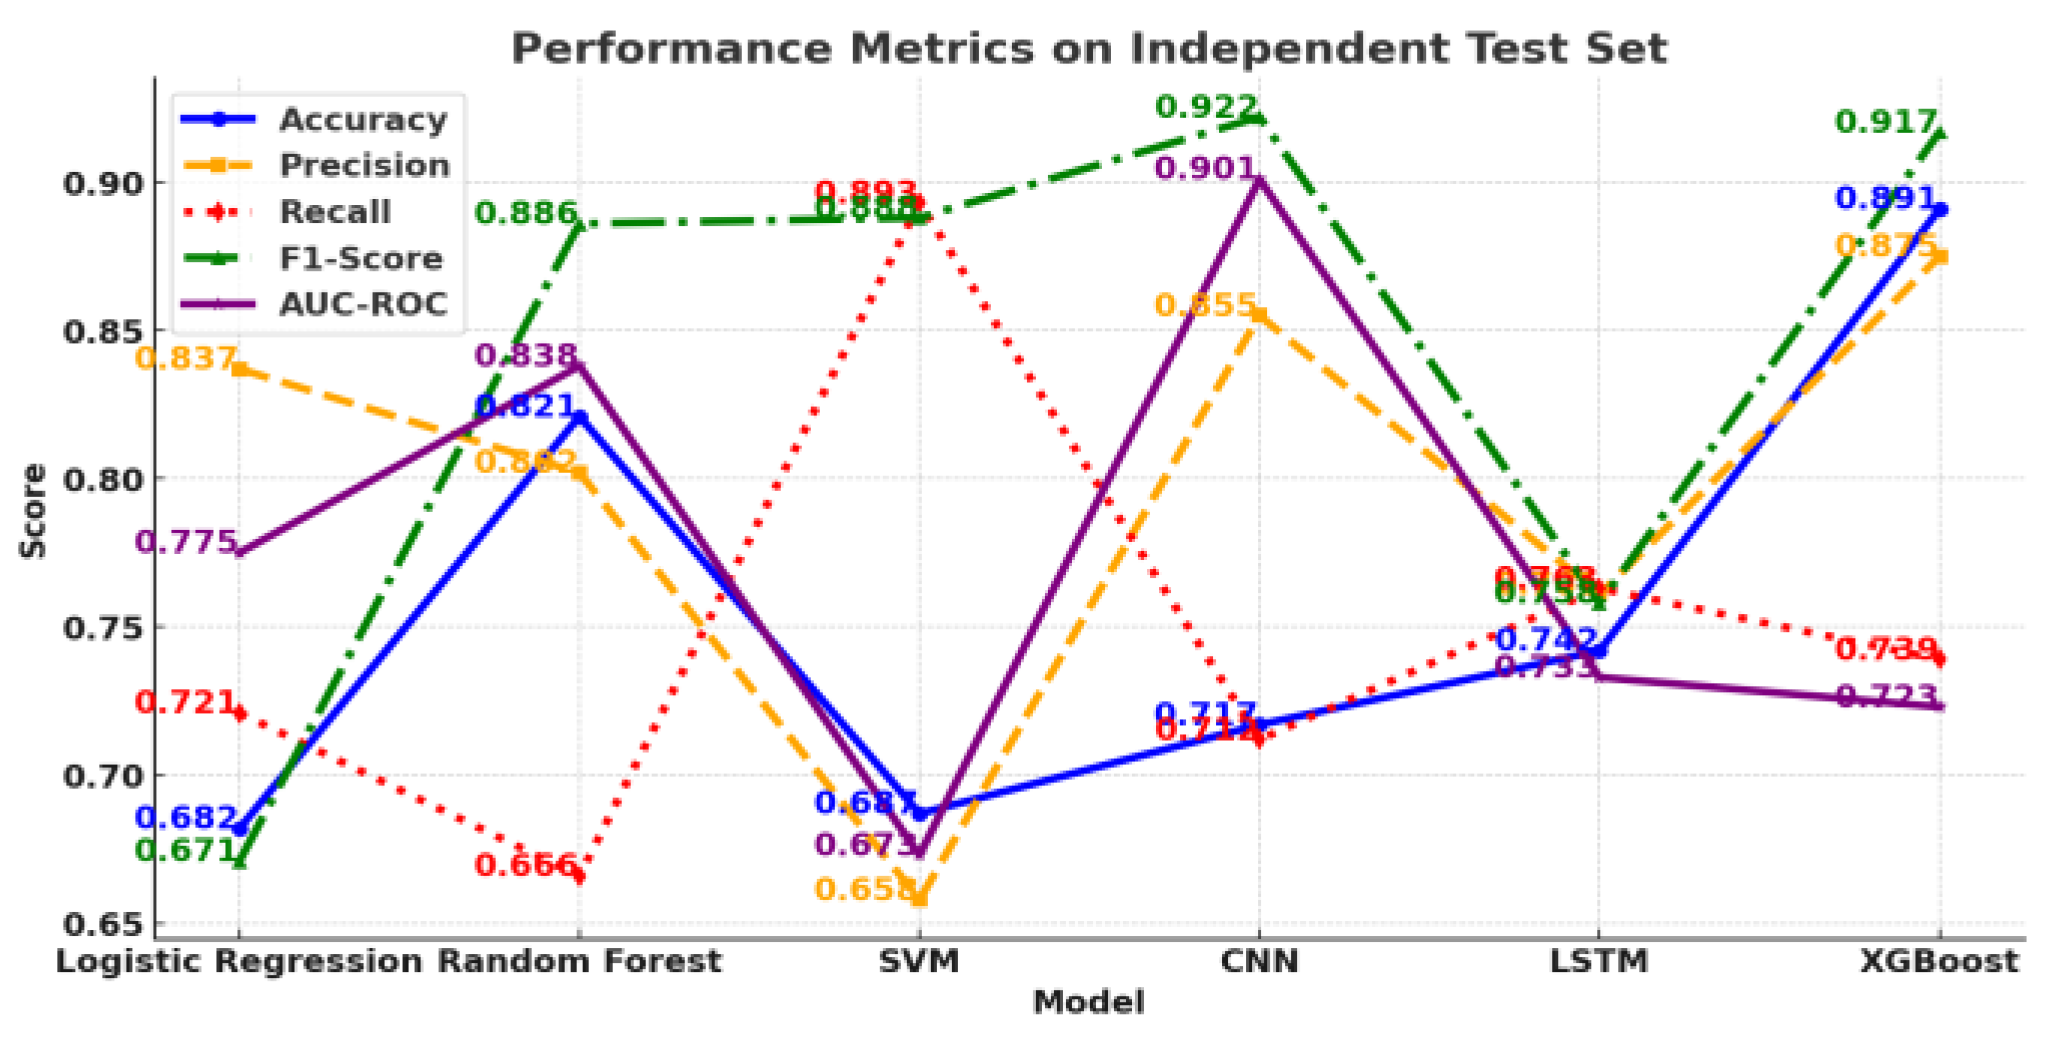

Table 1.
Evaluation of model performance on training set.
| Model | Accuracy | Precision | Recall | F1-Score | AUC-ROC |
| Logistic Regression | 0.794 | 0.715 | 0.908 | 0.808 | 0.814 |
| Random Forest | 0.938 | 0.917 | 0.753 | 0.773 | 0.896 |
| SVM | 0.883 | 0.85 | 0.745 | 0.853 | 0.75 |
| CNN | 0.85 | 0.877 | 0.746 | 0.735 | 0.829 |
| LSTM | 0.739 | 0.705 | 0.776 | 0.773 | 0.848 |
| XGBoost | 0.739 | 0.942 | 0.831 | 0.792 | 0.712 |
Table 2.
Independent test set model performance evaluation.
| Model | Accuracy | Precision | Recall | F1-Score | AUC-ROC |
| Logistic Regression | 0.682 | 0.837 | 0.721 | 0.671 | 0.775 |
| Random Forest | 0.821 | 0.802 | 0.666 | 0.886 | 0.838 |
| SVM | 0.687 | 0.658 | 0.893 | 0.888 | 0.673 |
| CNN | 0.717 | 0.855 | 0.712 | 0.922 | 0.901 |
| LSTM | 0.742 | 0.761 | 0.763 | 0.758 | 0.733 |
| XGBoost | 0.891 | 0.875 | 0.739 | 0.917 | 0.723 |
Disclaimer/Publisher’s Note: The statements, opinions and data contained in all publications are solely those of the individual author(s) and contributor(s) and not of MDPI and/or the editor(s). MDPI and/or the editor(s) disclaim responsibility for any injury to people or property resulting from any ideas, methods, instructions or products referred to in the content. |
© 2025 by the authors. Licensee MDPI, Basel, Switzerland. This article is an open access article distributed under the terms and conditions of the Creative Commons Attribution (CC BY) license (http://creativecommons.org/licenses/by/4.0/).
Copyright: This open access article is published under a Creative Commons CC BY 4.0 license, which permit the free download, distribution, and reuse, provided that the author and preprint are cited in any reuse.


