Submitted:
25 June 2025
Posted:
25 June 2025
You are already at the latest version
Abstract
Background/Objectives: Medicinal cannabis electronic vaporisation devices are growing in popularity worldwide; however, many variables can impact the precision and uniformity of this dosage form. Little is known about the chemical composition of cannabis and terpenes across the life cycle of such devices, raising concerns for both regulatory authorities and medical practitioners. Methods: This study investigated the chemical composition changes in cannabinoids and terpenes across two different cannabis distillates (high THC, no CBD; Balanced THC & CBD), and in two different vaporisation devices (i.e., batteries), across the life cycle of the cartridges. Samples were analysed using HPLC and GC-MS by an independent third party GMP-approved analytical laboratory. Results: When comparing to the published literature on dried cannabis flower vaporisation devices, medicinal cannabis vape carts appear to be more precise and consistent when delivering dose compared to label claim for the products tested. The consistency of the chemical profiles of the tested products also demonstrates that there was minimal to no degradation of cannabinoids and terpenes, as well as minimal to no isomerisation or polymerisation of terpenes. Conclusions: Whilst only a preliminary study, these results lay the foundation for future research to investigate the viability, precision, and standardisation that can be achieved with medicinal cannabis vape cartridges compared to vaporised and/or combusted flower. Future research on medicinal cannabis vapes should focus on improving technique for inhalation and sampling to be able to develop dosing guidelines, and dose form testing, for reproducible precision and patient safety.
Keywords:
Cannabis
; Vape
; Vaporisation
; Cannabinoids
; Terpenes
; Isomerisation
; Polymerisation
1. Introduction
The evolution of medicinal cannabis dosage forms has increasingly centred on vaporisation due to its rapid onset of pharmacological action and higher bioavailability compared to oral dosage forms.[1-4] In Australia, vaporisation has predominantly been implemented using Therapeutic Goods Administration (TGA)-registered medical devices designed for dried cannabis flower. However, a notable trend, particularly in the United States and Canada, has highlighted a shift towards vaporising cannabis extracts via devices (i.e., batteries) adapted from the e-cigarette industry.[5-7] This shift is gaining traction in Australia, presenting new opportunities and challenges in standardising dosing and optimising therapeutic efficacy. Nicotine and cannabis vapes are unapproved therapeutic goods in Australia, with patient access limited to Special Access Scheme (SAS) or Authorised Prescriber (AP) Scheme pathways.[8] With recent tightening of regulations and quality standards implemented on nicotine vapes in Australia by the TGA, this highlights a need to attempt to align medicinal cannabis (MC) vapes closer to standardised pharmaceutical medicines in order to alleviate regulatory and prescriber concerns relating to quality, safety, efficacy, and performance of the product.
Studies have demonstrated that vaporisation processes are influenced by numerous variables such as temperature, viscosity of the material, and design of the vaporising device.[2,6,9-12] For example, temperature distribution along the device heating element, and the interaction between vaporisation devices and material viscosity, can significantly impact cannabinoid and terpene extraction efficiency.[1,2] This is principally highlighted in dried flower vaporisation, where extraction efficiency is heavily influenced by temperature, leading to wasted cannabinoids and variable dosing, with as little as 21.6% of the dose being released at 170oC, and up to 71.2% of the dose released at 230oC. [2,10] Potential fractionation, degradation, isomerisation, or other chemical changes to the cannabinoids and terpenes during vaporisation raises critical questions about the consistency of dose delivery throughout the lifespan of a vape cartridge.[1] Additionally, research suggests that due to higher vapor pressures and vaporisation rates of terpenes compared with cannabinoids that terpene concentrations may decline over time, while cannabinoids such as cannabigerol (CBG) and cannabinol (CBN) tend to accumulate, altering the therapeutic profile compared to the labelled or claimed dose.[1,2] However, no studies were found in the literature that tests this thesis in vape distillate cartridges, with studies predominantly focusing on combusted (smoked) and vaporised dried flower.
This study aims to add to the literature by systematically analysing the chemical and physical changes occurring within vape cartridges over their entire usage cycle (i.e., from first draw until distillate exhaustion) by characterising any chemical profile changes across two different cannabis distillate vape cartridges and two different vaporisation devices. Using data on vaporised material mass, cannabinoid and terpene concentrations, and consistency of dose delivery, we investigate factors influencing vaporisation efficiency and therapeutic reliability.[1,2,13] Additionally, the impact of design elements, such as coil heating variability and airflow dynamics, will be explored to determine their role and influence in ensuring consistent cannabinoid and terpene delivery.[9]
This research also aims to address broader implications for regulatory agencies and clinical practice, aiming to provide information important for the decision-making process of medical prescribers and patients in utilising vaporised cannabis extracts as a viable and precise therapeutic option. With the increasing adoption of vape cartridges in medicinal cannabis markets worldwide, these insights are crucial to ensuring consistent and effective patient care and form a foundation in developing accurate and reproducible dose form testing, and eventually, clinically useful dose guidelines.
2. Materials and Methods
Materials
Two different commercially available cannabis vape distillates derived from two distinct cannabis chemovars were supplied by Australian Natural Therapeutics Group (ANTG) for this study. These included two ‘Rocky’ (containing 806mg/g THC, 2.7mg/g CBD, 843.1mg/g total cannabinoids and a total terpene concentration of 2.365% w/w; Batch: F-240481B, expiry: November 2025) and one ‘Juno’ (containing 285.6mg/g THC, 528.2mg/g CBD, 857.2mg/mL total cannabinoids and a total terpene concentration of 1.971% w/w; Batch: F-240502B, expiry: February 2025) vape cartridges, obtained utilising Short-Path Distillation (SPD) processes, and manufactured under Good Manufacturing Practice (GMP). These products were 1g in mass in ACTIVE™ C1 polyresin cartridges with a plastic barrel mouthpiece and comply with Australian regulatory requirements as outlined by the TGA’s Therapeutic Goods Orders (TGO) #93 (Standard for Medicinal Cannabis)[14] and TGO#100 (Microbiological Standards for Medicines).[15]
To investigate how vape battery performance influences the chemical profile of each vape cartridge, this study utilised two different types of devices (aka batteries) that reflect options commonly available on the market. The following vape devices were selected as one represents the most basic design that is commonly available to patients, with no voltage adjustment or extra features outside of inhalation activation (ACTIVETM Clone), and the other featured a more advanced technology that provides voltage-control that allows a consistent vaping technique (ACTIVETM Alpha).
One Rocky cartridge was attached to an ‘Alpha’ vape device and labelled as Rocky Alpha Pen (RAP). The Alpha is a 510-thread battery that is inhalation activated and features haptic vibration feedback with ACTIVE Pulse™ technology. Table 1 presents the Alpha’s heating cycle, where voltage is applied intermittently to maintain a consistent average temperature of the heating element. This battery has two settings: Low (2.6V output) and High (3.5V output). A 5-second timer, equivalent to a 5-second inhalation, was implemented in the experiment, allowing the Alpha battery to complete two full voltage cycles. The remaining cartridges were connected to a ‘Clone’ vape battery where the Rocky cartridge was labelled as Rocky Clone Pen (RCP), and the Juno cartridge was labelled as Juno Clone Pen (JCP). The Clone is also a 510-thread battery and is inhalation activated with only one standard setting with an output of 3.6V. RAP was set to high throughout the experiment as this setting closely matches the voltage of the Clone for comparison. All vape hardware utilised in this study were procured from Active™. (INSERT TABLE 1 HERE)
Experimental Method
To track material usage, each vape cartridge was weighed prior to and after experimentation using the OHAUS Pioneer PX4202 (4200g x 0.01g) precision balance. Each vape was paired to its own silicon tubing, with one end connected to the vape mouthpiece and the other end securely attached to a dedicated 1500cc manual fluid extractor. All components were sourced from Repco. To accurately simulate a 5-second inhalation, a timer was set. Following the activation of the timer, the valve was opened, and vapor was generated by pulling the pump handle in a slow and controlled manner which was standardized by the same operator throughout the experiment. Upon completion of the timer, any residual vapor that remained in the silicone tubing was allowed to settle into the fluid extractor by holding it in an upright (i.e., vertical) position, after which the valve was closed. Experimental runs were carried out sequentially, starting with RAP, followed by RCP and lastly JCP. The sequential procedure allowed for an average pause of 30-50 seconds between each simulated inhalation, allowing each vape cartridge to cool and minimize the risk of overheating the coils. This procedure was performed nine times for each vape cartridge (corresponding to nine simulated inhalations) which constituted a single set. Once a set was completed, each fluid extractor was allowed to rest for 5 minutes to let the vapor settle inside. As each vape cartridge neared depletion, it was observed that a small amount of distillate (enough to coat all apertures in the cartridge) would settle unevenly in a wave-like pattern at the bottom, preventing aperture saturation. This prompted the need to redistribute the distillate. An operator held the cartridge with the apertures facing away and swung back and forth to utilise centrifugal force to allow the distillate to flatten and create a level surface and re-saturate the apertures. The experimental method was repeated until the distillate in each cartridge did not visually touch all the apertures which indicated that it no longer delivered a standard therapeutic dose. However, an exception was made for RAP which remained unfinished. It was vaporised until it was determined (i.e. >50% of visual mass vaporised) that there would be significant data to draw conclusions on the analytical results.
Sampling Method
To capture the cannabinoids and terpenes, 40mL of 100% ethanol (batch ID: 11814001, sourced from Bacto) was transferred into each fluid extractor and then vigorously agitated by an operator for 3-minutes. Post-agitation, the operator opened the extractor’s valve and carefully pushed the plunger slowly towards the tubing inlet to check for any vapor that was not dissolved in the ethanol, followed by closing the valve to further agitate for an additional 30-60 seconds. Each fluid extractor was decanted into a 50mL volumetric flask and an additional ~10mL ethanol was added to all flasks until the meniscus reached the calibration mark. Each flask was inverted until the solution was uniform, and the contents were transferred into a 50mL amber bottle to protect samples from photodegradation. All samples were then labelled, packaged and shipped to Pharmalytics laboratory for analysis to assess the cannabinoid and terpene concentration of each set. Pharmalytics is an independent third-party analytical laboratory that is TGA-accredited and complies with GMP standards and is responsible for testing a substantial amount of medicinal cannabis products in Australia.
Sample Analysis
Terpenes
Pharmalytics utilised an internally developed and proprietary gas chromatography mass spectrometry (GC-MS) method, adapted for high-resolution and quantification of terpenes in cannabis-based matrices. The method is designated for research and quality analysis purposes and is not validated for GMP release testing.
Upon receipt, samples previously prepared in ethanol (as described in the Sampling Method) were filtered through a 0.2 µm regenerated cellulose membrane and transferred into amber HPLC vials. Quantification was performed using a proprietary multi-point calibration curve comprising reference terpene standards at nominal concentrations of approximately 0.1, 1.0, and 10.0 ppm. Each standard solution contained a defined mix of 28 terpene analytes, representative of the common volatile components found in cannabis.
Instrument setup included installation of a polar stationary phase capillary column (30 m × 0.25 mm × 0.5 µm), with chromatographic conditions optimised for terpene separation under split-mode injection. The analytical run employed selected ion monitoring (SIM) across multiple retention windows, enabling accurate integration and assignment of target analytes. Raw chromatographic data was processed using dedicated mass spectrometry quantitation software, with integrated peak areas and ion ratios reviewed against method-specific acceptance criteria to confirm identity and consistency of integration.
Only results exceeding a laboratory-defined threshold of 0.001% w/w were reported. Quantitative data were exported and delivered in structured format for internal statistical evaluation. The lab’s proprietary method parameters, calibration procedures, and data processing workflows are confidential and not publicly disclosed.
Cannabinoids
Quantitative analysis of cannabinoids was performed by Pharmalytics using a proprietary high-performance liquid chromatography (HPLC) method specifically designed and validated for the analysis of cannabis matrices. While the method is verified for use in regulated environments, detailed procedural elements remain proprietary to the analytical provider and are not disclosed to protect intellectual property.
Samples consisting of vaporised cannabis resin diluted in ethanol were filtered upon receipt using 0.2 µm regenerated cellulose membrane filters and transferred into amber autosampler vials to protect analytes from photodegradation. The samples required no additional preparation before injection.
Cannabinoid quantification was conducted using reverse-phase HPLC, employing a C18 column (100 mm × 2.1 mm × 1.8 µm) under gradient elution conditions. Mobile phases consisted of aqueous 0.1% formic acid (Phase A) and 0.05% formic acid in methanol (Phase B). The system was equipped with dual diode array detectors (DADs) to ensure sensitivity and precision across a wide concentration range.
Analytes were identified and quantified using diode array detection at multiple wavelengths, with cannabinoid-specific detection parameters (e.g., 270 nm for acidic cannabinoids, 234 nm for neutral THC). Calibration was conducted using certified reference standards for THCA (delta-9-tetrahydrocannabinolic acid)and related cannabinoids, and system suitability was confirmed by retention time reproducibility, peak area precision, and standard recovery criteria across the run.
Processed data were evaluated for integration quality and consistency. Only analyte concentrations exceeding the validated lower limit of quantification were reported. Quantitative outputs were securely exported in structured datasets for downstream statistical analysis by the study investigators. Due to the confidential nature of the laboratory’s analytical procedures, specific system parameters and calibration logic are not disclosed herein.
Data Analysis
Original raw data was received on the 8th of January, 2025 from Pharmalytics as a Microsoft Excel spreadsheet (CSV), and preliminary analysis was conducted by the first author using Microsoft Excel. The supplied raw data were then standardised by calculating the percentage contribution of each cannabinoid to total cannabinoids for each sample, and each terpene to total terpenes for each sample. The cannabinoids and terpenes were standardised against their totals as opposed to mass of dose achieved, as an accurate mass per sample was not possible given the experimental design, nor necessary to gather the data required for this experiment. Results were then converted to mass per inhalation. To analyse the consistency of the data, the mean and standard deviation was calculated for all data sets.
3. Results
The number of samples taken, total numbers of inhalations per vape product, and average mass of product vaporised are displayed in Table 2 and Table 3. JCP and RCP were exhausted after 153 and 189 inhalations respectively. JCP, RCP, and RAP achieved an average mass vaporised of 5.69mg, 4.29mg, and 1.58mg respectively. RAP resulted in the highest total inhalations whilst vaporising the lowest amount of material at 234 total inhalations, and 370mg of material vaporised. Given that each cart contains 1000mg of vape distillate, there would be 130mg of unused material remaining in JCP and 190mg remaining in RCP. Additional material could have been vaporised, however the mass moved during the last 130mg and 190mg in JCP and RCP would no longer reflect the mass of material moved in the previous 153 and 189 inhalations, resulting in increasing numbers of inhalations where minimal to no material is moved, or “dry hits” as it is known in the industry, potentially reducing the therapeutic benefit and symptom management given by the patients prescribed dosing regimen. (INSERT TABLE 2 and 3 HERE)

Table 2.
Samples and Total Inhalations.
| Vape SKU | Inhalations per Sample | Number of Samples | Total Inhalations |
|---|---|---|---|
| JCP | 9 | 17 | 153 |
| RCP | 9 | 21 | 189 |
| RAP | 9 | 27 | 234 |
Table 3.
Average Mass of Product Vaporised per Inhalation.
| Vape SKU | Starting Mass | Final Mass | Material Vaporised | Number of Inhalations | Average Mass per Inhalation |
|---|---|---|---|---|---|
| JCP | 9.33g | 8.46g | 870mg | 153 | 5.69mg |
| RCP | 9.27g | 8.46g | 810mg | 189 | 4.29mg |
| RAP | 9.31g | 8.94g | 370mg | 234 | 1.58mg |
The average mass of the major cannabinoids delta-9-tetrahydrocannabinol (THC) and CBD per inhalation based on product label claims is reported in Table 4. (INSERT TABLE 4 HERE).
Table 4.
Average Mass of Major Cannabinoids Delivered per Inhalation Based on Label Claim.
| Vape SKU | Average Mass per Inhalation | Average THC per Inhalation | Average CBD per Inhalation |
|---|---|---|---|
| JCP | 5.69mg | 1.71mg | 2.84mg |
| RCP | 4.29mg | 3.65mg | N/A |
| RAP | 1.58mg | 1.34mg | N/A |
By determining the average material vaporised by JCP and RCP at 840mg, it can be estimated that RAP would be exhausted with 160mg of material remaining unused, and a total number of inhalations at approximately 530. The minimum and maximum mass of material moved per inhalation is shown in Table 5. JCP and RCP showed high variability between the minimum and maximum doses delivered, however RAP showed more consistent data. (INSERT TABLE 5 HERE).
It can be observed in Figure 1, Figure 2 and Figure 3 and Table 6, Table 7 and Table 8 that no chemical profile changes were observed for the JCP, RCP, or RAP combinations for the measured cannabinoids. The data is also moderate to highly consistent when analysing against the standard deviation, as 80-85% of the data on average is within 1 standard deviation of the mean. (INSERT FIGURES 1-3 and Table 6, Table 7 and Table 8 HERE)
The terpene profile consistency is displayed in Table 9, Table 10 and Table 11 and show that the profiles of RCP and RAP are highly consistent, with JCP being moderate to highly consistent. The lower consistency of some the terpenes in JCP can be attributed to the variability in mass of dose displayed in Table 5, where lower sample mass has resulted in non-detectable amounts of certain terpenes that impacted averages and standard deviation (e.g. Fenchone and Cymene).
Figure 4 and Table 12 demonstrate that the terpene profiles for each vape product are highly consistent throughout the respective product life cycles. Two anomalies were present in the results displayed in Figure 4; however, these are likely due to analytical error or experimental error and had minimal impact on the consistency of the data.
Additionally, Table 13 further highlights the consistency of dosing that was observed in Table 5. The data has been analysed against the mean and standard deviation and found to be highly consistent, showing that the voltage control has a positive impact on consistent dosing. (INSERT FIGURE 4 and TABLE 12-13 HERE)
Figure 4.
Chemical Profile Change Analysis of Terpenes vs Total Terpenes + Cannabinoids.
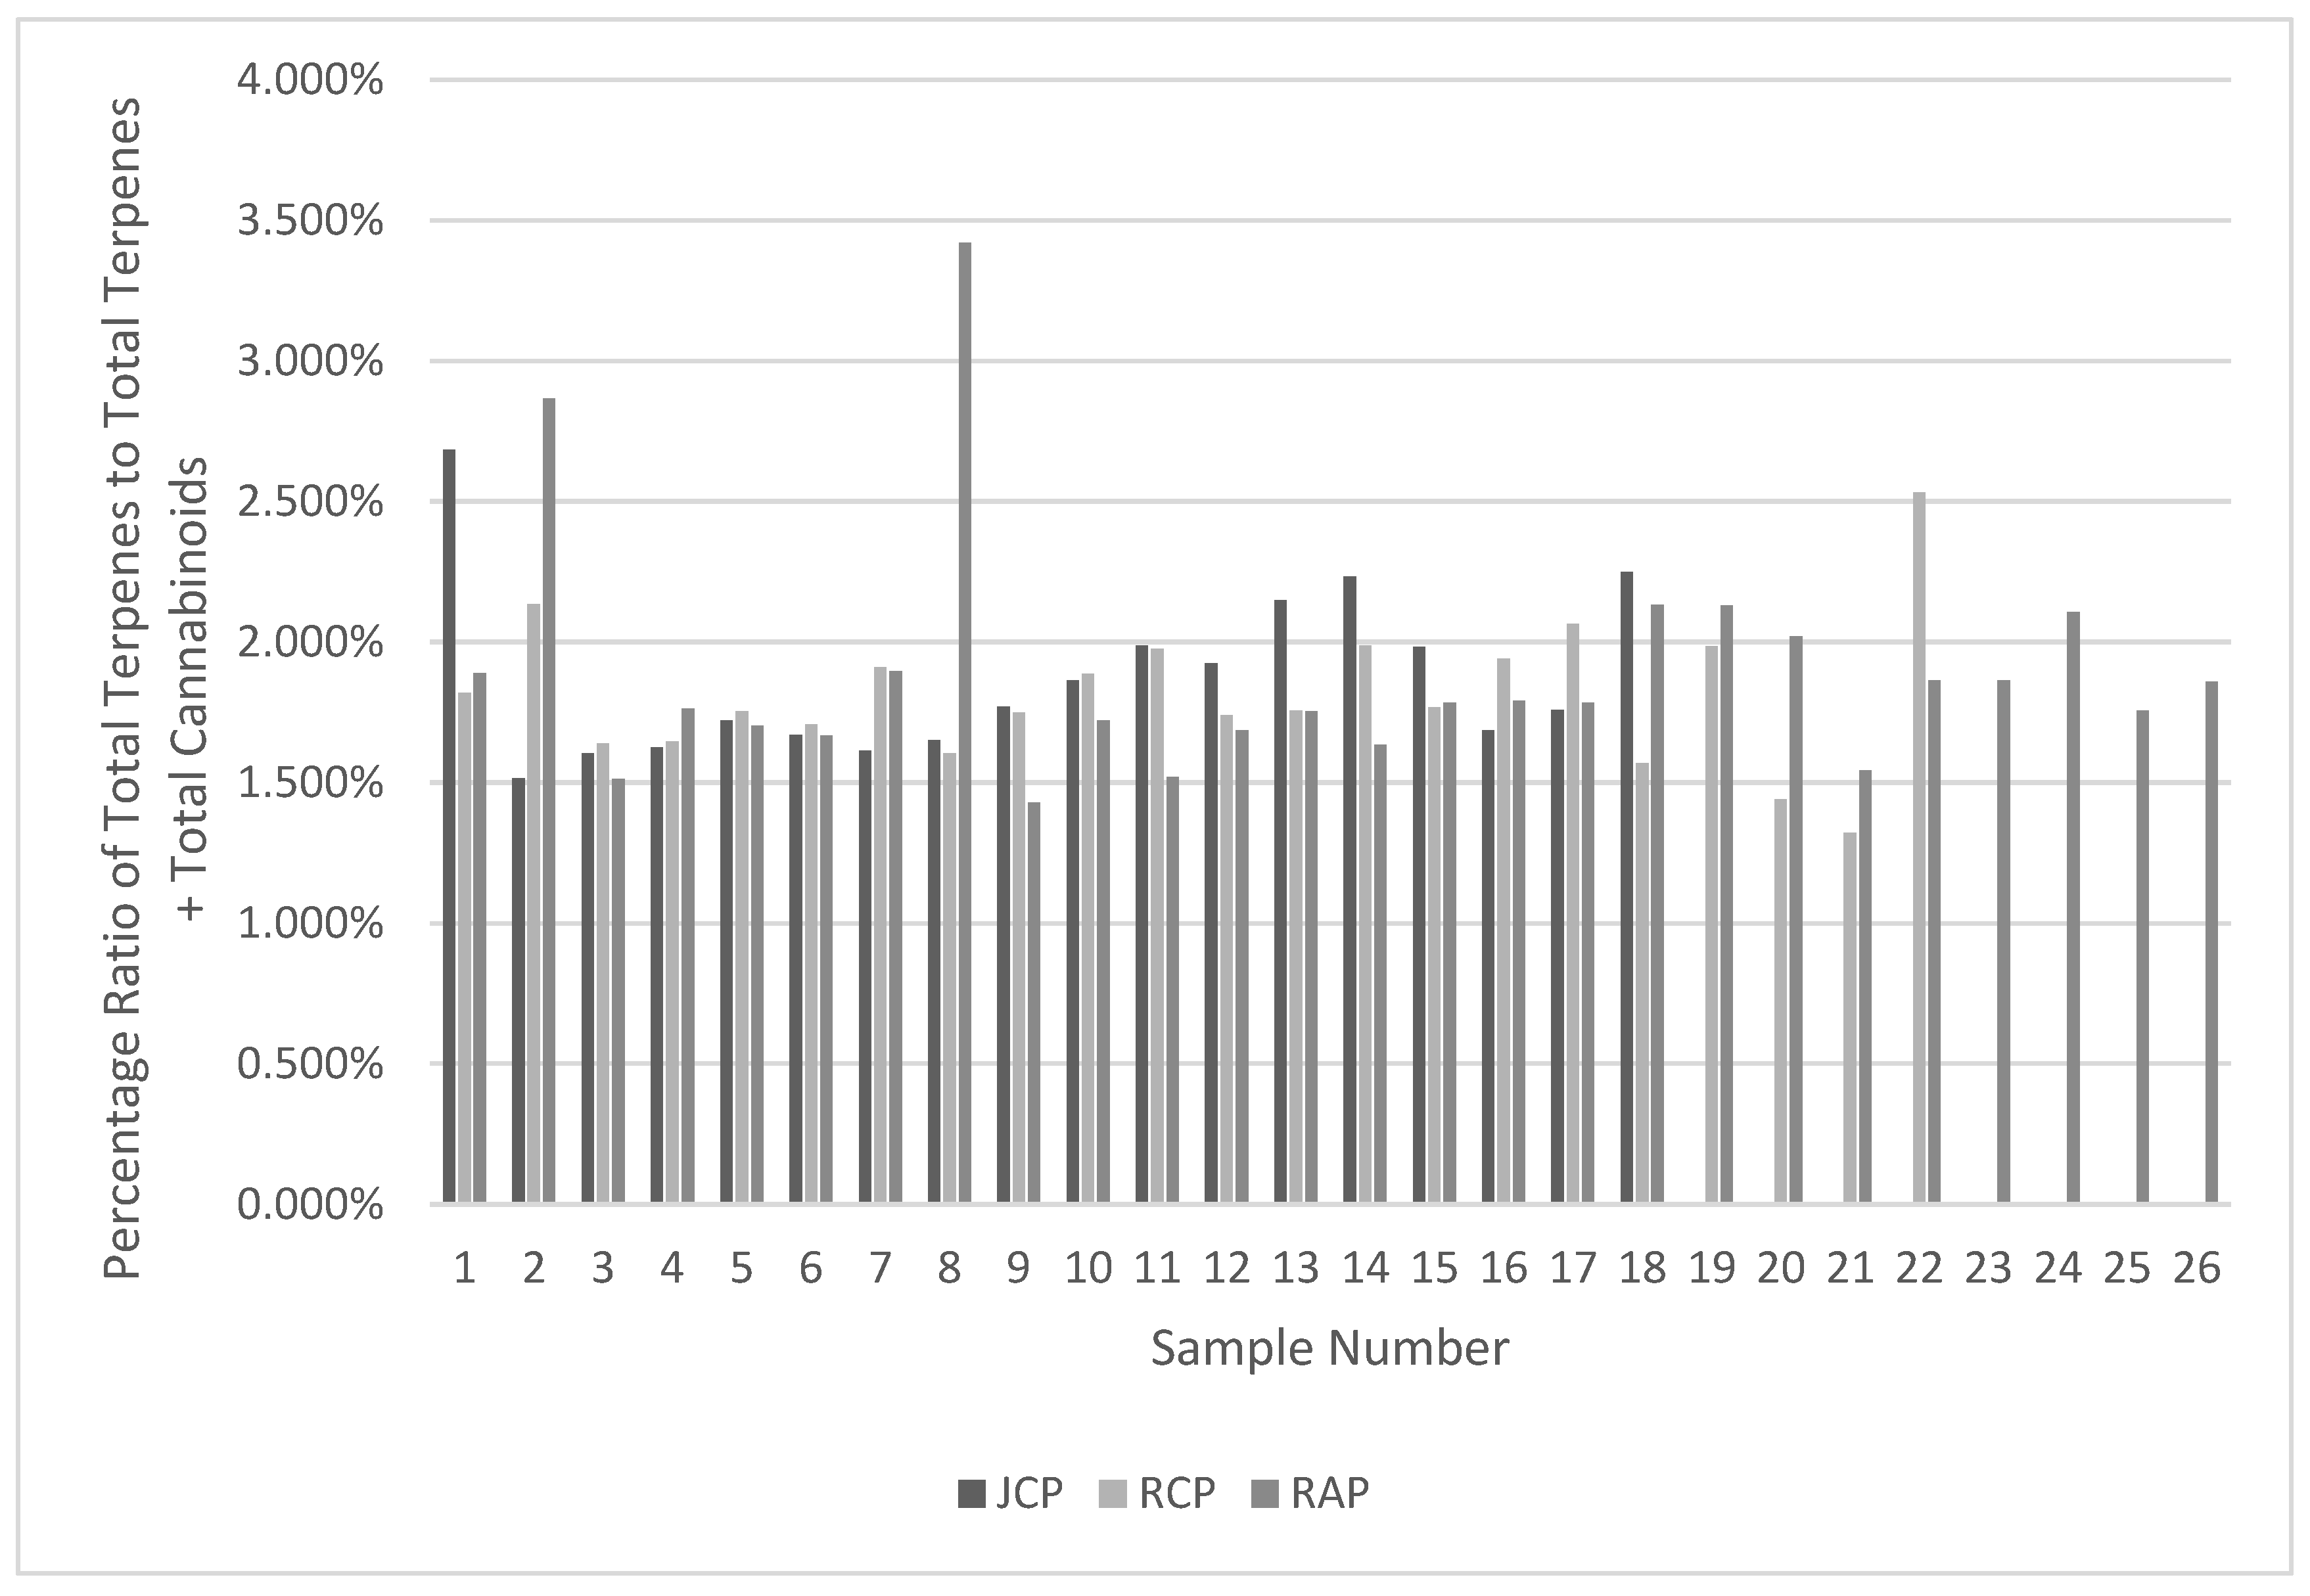
Table 12.
Determination of Consistency of Chemical Profile through the Life of the Vape: Terpenes vs Terpenes + Cannabinoids.
Table 12.
Determination of Consistency of Chemical Profile through the Life of the Vape: Terpenes vs Terpenes + Cannabinoids.
| Ratio of Total Terpenes to Total Terpenes + Total Cannabinoids | |||
|---|---|---|---|
| JCP | RCP | RAP | |
| Mean | 1.87% | 1.82% | 1.91% |
| Standard Deviation | 0.29% | 0.25% | 0.42% |
| % Within 1 SD | 77.78% | 77.27% | 85.19% |
Table 13.
Dose Consistency per Inhalation RAP.
| Vape SKU Combination: RAP – Dose consistency | |||||||||||
|---|---|---|---|---|---|---|---|---|---|---|---|
| 9-THC | CBC | CBCA | CBD | CBDA | CBG | CBGA | CBN | THCA | 8-THC | Total THC | |
| Mean | 1.349566 | 0.00173 | 0.000375 | 0.006993 | 0.001221 | 0.042955 | 0.000143 | 0.034386 | 0.00714 | 0 | 1.356706 |
| Standard Deviation | 0.407296 | 0.000913 | 0.00019 | 0.002816 | 0.000434 | 0.016339 | 0.000182 | 0.010311 | 0.002151 | 0 | 0.409408 |
| % Within 1 SD | 73.08% | 76.92% | 73.08% | 84.62% | 84.62% | 84.62% | 92.31% | 73.08% | 88.46% | 100.00% | 73.08% |
4. Discussion
This study was conducted to fill a gap in the literature whilst also highlighting the impact of vaporisation conditions, battery technology, and inhalation technique on the efficiency and consistency of dose when using medicinal cannabis vape carts. One of the main influences of battery technology on dose consistency and delivery is temperature. Temperature has been shown to play an important role in cannabinoid yield and rate of terpene extraction, where vaporisation temperatures between 170oC to 230oC can alter THC yield from 21.6% to 71.2% from the prescribed dose when vaporising dried flower, and due to pyrolytic destruction of cannabinoids, combusted flower achieves an average yield efficiency of approximately 36%.[2,3,10] Combustion achieves temperatures exceeding 900oC, whilst vape cartridges have been shown to achieve temperatures of 400oC-600oC. [3,11]
Considering the temperatures and yields achieved from vaporised and smoked dried cannabis flower, this study has demonstrated that medicinal cannabis vape carts used in this study are more precise and consistent when delivering dose compared to label claim. This was shown in the high consistency of chemical profiles displayed in Figure 1, Figure 2 and Figure 3 and Table 6, Table 7, and Table 8 and suggests that vaporisation temperatures of cannabis distillate in the range of 400oC-600oC is an appropriate range to achieve 100% yields and avoid chemical profile changes due to the higher temperatures of combustion. The consistency of the chemical profiles in this study also suggests that there was minimal to no degradation of cannabinoids and terpenes, as well as minimal to no isomerisation or polymerisation of terpenes as displayed in Table 9, Table 10 and Table 11. This could be due to the fast ramp up to vaporisation temperature of this technology, as well as avoiding the higher temperatures of combustion. Additionally, the higher chemical purity of the distillate when compared to the complex chemical profiles in dried cannabis flower is also a plausible explanation.
The absence of detectable chemical degradation or changes to cannabinoids and terpenes in this study, suggests that despite the adaptation of technology from the e-cigarette industry, that current devices are well engineered and can provide appropriate voltage and temperature control.[5-7] The current technology has also shown that it can provide dose to dose consistency when looking at the ACTIVE PulseTM voltage-controlled technology. The difference in average dose delivered between the higher averages of JCP and RCP compared to RAP would have been due to temperature differences between the voltage-controlled technology and the constant voltage technology. The ACTIVE PulseTM technology allowed for a lower temperature, and it was shown in Table 4 and Table 5 that the voltage control would have been responsible for the lower average dose delivered in RAP and the smaller gap in maximum and minimum dose mass delivered.
Dose consistency is important and is a major consideration for health care practitioners, medical prescribers, and patients alike. A major limitation in the design of this study is that it wasn’t able to achieve high consistency in dose delivery due to variability in operator technique when simulating inhalation. However, this weakness highlights the importance of consistent technique that needs to be employed by the patient when using the device. The differences between maximum and minimum dose delivered show what can be expected in a real-world scenario from a patient with poor technique. In future a computer-controlled vaporisation device should be used, where volume of air, flow rate, and inhalation time can be controlled by a program. Adding to this, a way to more accurately retrieve and weigh each sample to better analyse mass per inhalation will need to be developed to improve accuracy of dosage form testing.
The strength of this study is that the sampling technique and simulated inhalation used was able to achieve highly consistent results when analysing changes in the chemical profile of the two vape products across the two vape batteries, and across the life of the vape from the first inhalation to then last inhalation for JCP and RCP. As this was the main goal of the study, the results achieve should help to benefit and guide future studies.
5. Conclusions
The results obtained in this study will contribute to the growing catalogue of evidence supporting the feasibility of vaporised medicinal cannabis use, and begin a new chapter showcasing the viability, precision, and standardisation that can be achieved with medicinal cannabis vape cartridges compared to vaporised flower and combusted flower. This also highlights medicinal cannabis vapes as a viable option when looking for a faster and more bioavailable method of dose delivery over oral and other non-inhaled dosage forms. Future research on medicinal cannabis vapes should focus on improving technique for inhalation and sampling to be able to develop dosing guidelines and dose form testing, for reproducible precision and patient safety.
Author Contributions
Conceptualization, A.G.C.W., M.A.G.B. and J.S.; methodology, A.G.C.W.; formal analysis, A.G.C.W.; investigation, A.G.C.W., T.F. and M.A.G.B.; resources, M.A.G.B.; data curation, A.G.C.W. and R.K.; writing—original draft preparation, A.G.C.W., T.F., M.A.G.B. and J.S.; writing—review and editing, A.G.C.W., T.F., M.A.G.B., R.K. and J.S.; visualization, A.G.C.W.; project administration, A.G.C.W.; funding acquisition, A.G.C.W. All authors have read and agreed to the published version of the manuscript.
Funding
There was no specific external grant funding obtained for this research project. ANTG provided vape cartridges for investigation, and Pharmalytics donated expertise and analytical services.
Data Availability Statement
The full data sets for data presented in this study are available on request from the corresponding author.
Acknowledgments
Australian Natural Therapeutics Group (ANTG) is an Australian medicinal cannabis company with Good Agricultural Collection Practice (GACP) and Good Manufacturing Practice (GMP) certifications. This study forms part of ANTG’s BRIGHT (Building Research, Innovation, Growth and High-level Training) Program for internal staff, which supports research projects that attempt to answer questions and address gaps in scientific knowledge specific to medicinal cannabis, particularly those of a medical or regulatory interest. The authors wish to thank RK for his expertise in analytical chemistry and significant in-kind contribution for the analytical testing of samples for this research project.
Conflicts of Interest
AGCW, MAGB and JS are employed by ANTG in the Research and Development (R&D) Department. This research project forms part of ANTG’s BRIGHT program. JS also sits on the Board of the Australian Medicinal Cannabis Association (pro bono), the steering committee of Cannabis Clinicians Australia (pro bono) and the scientific advisory board of United in Compassion (pro bono), an Australian medicinal cannabis patient advocacy group. JS is a PhD candidate with NICM Health Research Institute at Western Sydney University (WSU). TF is a PhD candidate at NICM Health Research Institute at WSU and received a stipend that assisted in travel and accommodation requirements to participate in the research project.
Abbreviations
The following abbreviations are used in this manuscript:
| THC | Delta-9-Tetrahydrocannabinol |
| CBD | Cannabidiol |
| HPLC | High Performance Liquid Chromatography |
| GC-MS | Gas Chromatography-Mass Spectrometry |
| GMP | Good Manufacturing Practice |
| TGA | Therapeutic Good Administration |
| SAS | Special Access Scheme |
| AP | Authorised Prescriber |
| MC | Medicinal Cannabis |
| CBG | Cannabigerol |
| CBN | Cannabinol |
| THCA | Delta-9-Tetrahydrocannabinolic Acid |
| ANTG | Australian Natural Therapeutics Group |
| SPD | Short Path Distillation |
| TGO | Therapeutic Good Order |
| RAP | Rocky Alpha Pen combination |
| JCP | Juno Clone Pen combination |
| RCP | Rocky Clone Pen combination |
| SIM | Selected Ion Monitoring |
| DAD | Dual diode Array Detector |
| CSV | Comma Separated Values |
| GACP | Good Agricultural and Collection Practices |
| BRIGHT | Building Research Innovation Growth High-level Training |
| R&D | Research and Development |
References
- Lanz, C.; Mattsson, J.; Soydaner, U.; Brenneisen, R. Medicinal Cannabis: In Vitro Validation of Vaporizers for the Smoke-Free Inhalation of Cannabis. PLoS One 2016, 11, e0147286. [Google Scholar] [CrossRef] [PubMed]
- Pomahacova, B.; Van der Kooy, F.; Verpoorte, R. Cannabis smoke condensate III: the cannabinoid content of vaporised Cannabis sativa. Inhal Toxicol 2009, 21, 1108–1112. [Google Scholar] [CrossRef] [PubMed]
- Grotenhermen, F. Pharmacokinetics and pharmacodynamics of cannabinoids. Clin Pharmacokinet 2003, 42, 327–360. [Google Scholar] [CrossRef] [PubMed]
- Busardo, F.P.; Perez-Acevedo, A.P.; Pacifici, R.; Mannocchi, G.; Gottardi, M.; Papaseit, E.; Perez-Mana, C.; Martin, S.; Poyatos, L.; Pichini, S.; et al. Disposition of Phytocannabinoids, Their Acidic Precursors and Their Metabolites in Biological Matrices of Healthy Individuals Treated with Vaporized Medical Cannabis. Pharmaceuticals (Basel) 2021, 14. [Google Scholar] [CrossRef] [PubMed]
- Saran, S.K.; Salinas, K.Z.; Foulds, J.; Kaynak, O.; Hoglen, B.; Houser, K.R.; Krebs, N.M.; Yingst, J.M.; Allen, S.I.; Bordner, C.R.; et al. A Comparison of Vaping Behavior, Perceptions, and Dependence among Individuals Who Vape Nicotine, Cannabis, or Both. Int J Environ Res Public Health 2022, 19, 10392. [Google Scholar] [CrossRef] [PubMed]
- Giroud, C.; de Cesare, M.; Berthet, A.; Varlet, V.; Concha-Lozano, N.; Favrat, B. E-Cigarettes: A Review of New Trends in Cannabis Use. Int J Environ Res Public Health 2015, 12, 9988–10008. [Google Scholar] [CrossRef] [PubMed]
- Davenport, S. Price and product variation in Washington’s recreational cannabis market. Int J Drug Policy 2021, 91, 102547. [Google Scholar] [CrossRef] [PubMed]
- Cole, E.; Segan, C.; Filia, S.; Kyi, J.; Baird, D. Therapeutic vapes for smoking cessation and nicotine dependence. Aust Prescr 2024, 47, 171–176. [Google Scholar] [CrossRef] [PubMed]
- Oar, M.A.; Savage, C.H.; Rufer, E.S.; Rucker, R.P.; Guzman, J.A. Thermography of cannabis extract vaporization cartridge heating coils in temperature- and voltage-controlled systems during a simulated human puff. PLoS One 2022, 17, e0262265. [Google Scholar] [CrossRef] [PubMed]
- Hazekamp, A.; Ruhaak, R.; Zuurman, L.; van Gerven, J.; Verpoorte, R. Evaluation of a vaporizing device (Volcano) for the pulmonary administration of tetrahydrocannabinol. J Pharm Sci 2006, 95, 1308–1317. [Google Scholar] [CrossRef] [PubMed]
- Gieringer, D.; St. Laurent, J.; Goodrich, S. Cannabinoid Vaporization Analysis: Smoke vs Vaporized Cannabis. MAPS Bulletin 2004, 14, 7–12. [Google Scholar]
- Huestis, M.A. Human cannabinoid pharmacokinetics. Chem Biodivers 2007, 4, 1770–1804. [Google Scholar] [CrossRef] [PubMed]
- Eyal, A.M.; Berneman Zeitouni, D.; Tal, D.; Schlesinger, D.; Davidson, E.M.; Raz, N. Vapor Pressure, Vaping, and Corrections to Misconceptions Related to Medical Cannabis’ Active Pharmaceutical Ingredients’ Physical Properties and Compositions. Cannabis Cannabinoid Res 2023, 8, 414–425. [Google Scholar] [CrossRef] [PubMed]
- Therapeutic Goods (Standard for Medicinal Cannabis) (TGO93) Order 2017. Available online: https://www.legislation.gov.au/F2017L00286/latest/text (accessed on 8/02/2025).
- Therapeutic Goods (Microbiological Standards for Medicines) (TGO 100) Order 2018. Available online: https://www.legislation.gov.au/F2018L01685/latest/text (accessed on 8/02/2025).
Figure 1.
Analysis of Chemical Profile Changes for JCP.
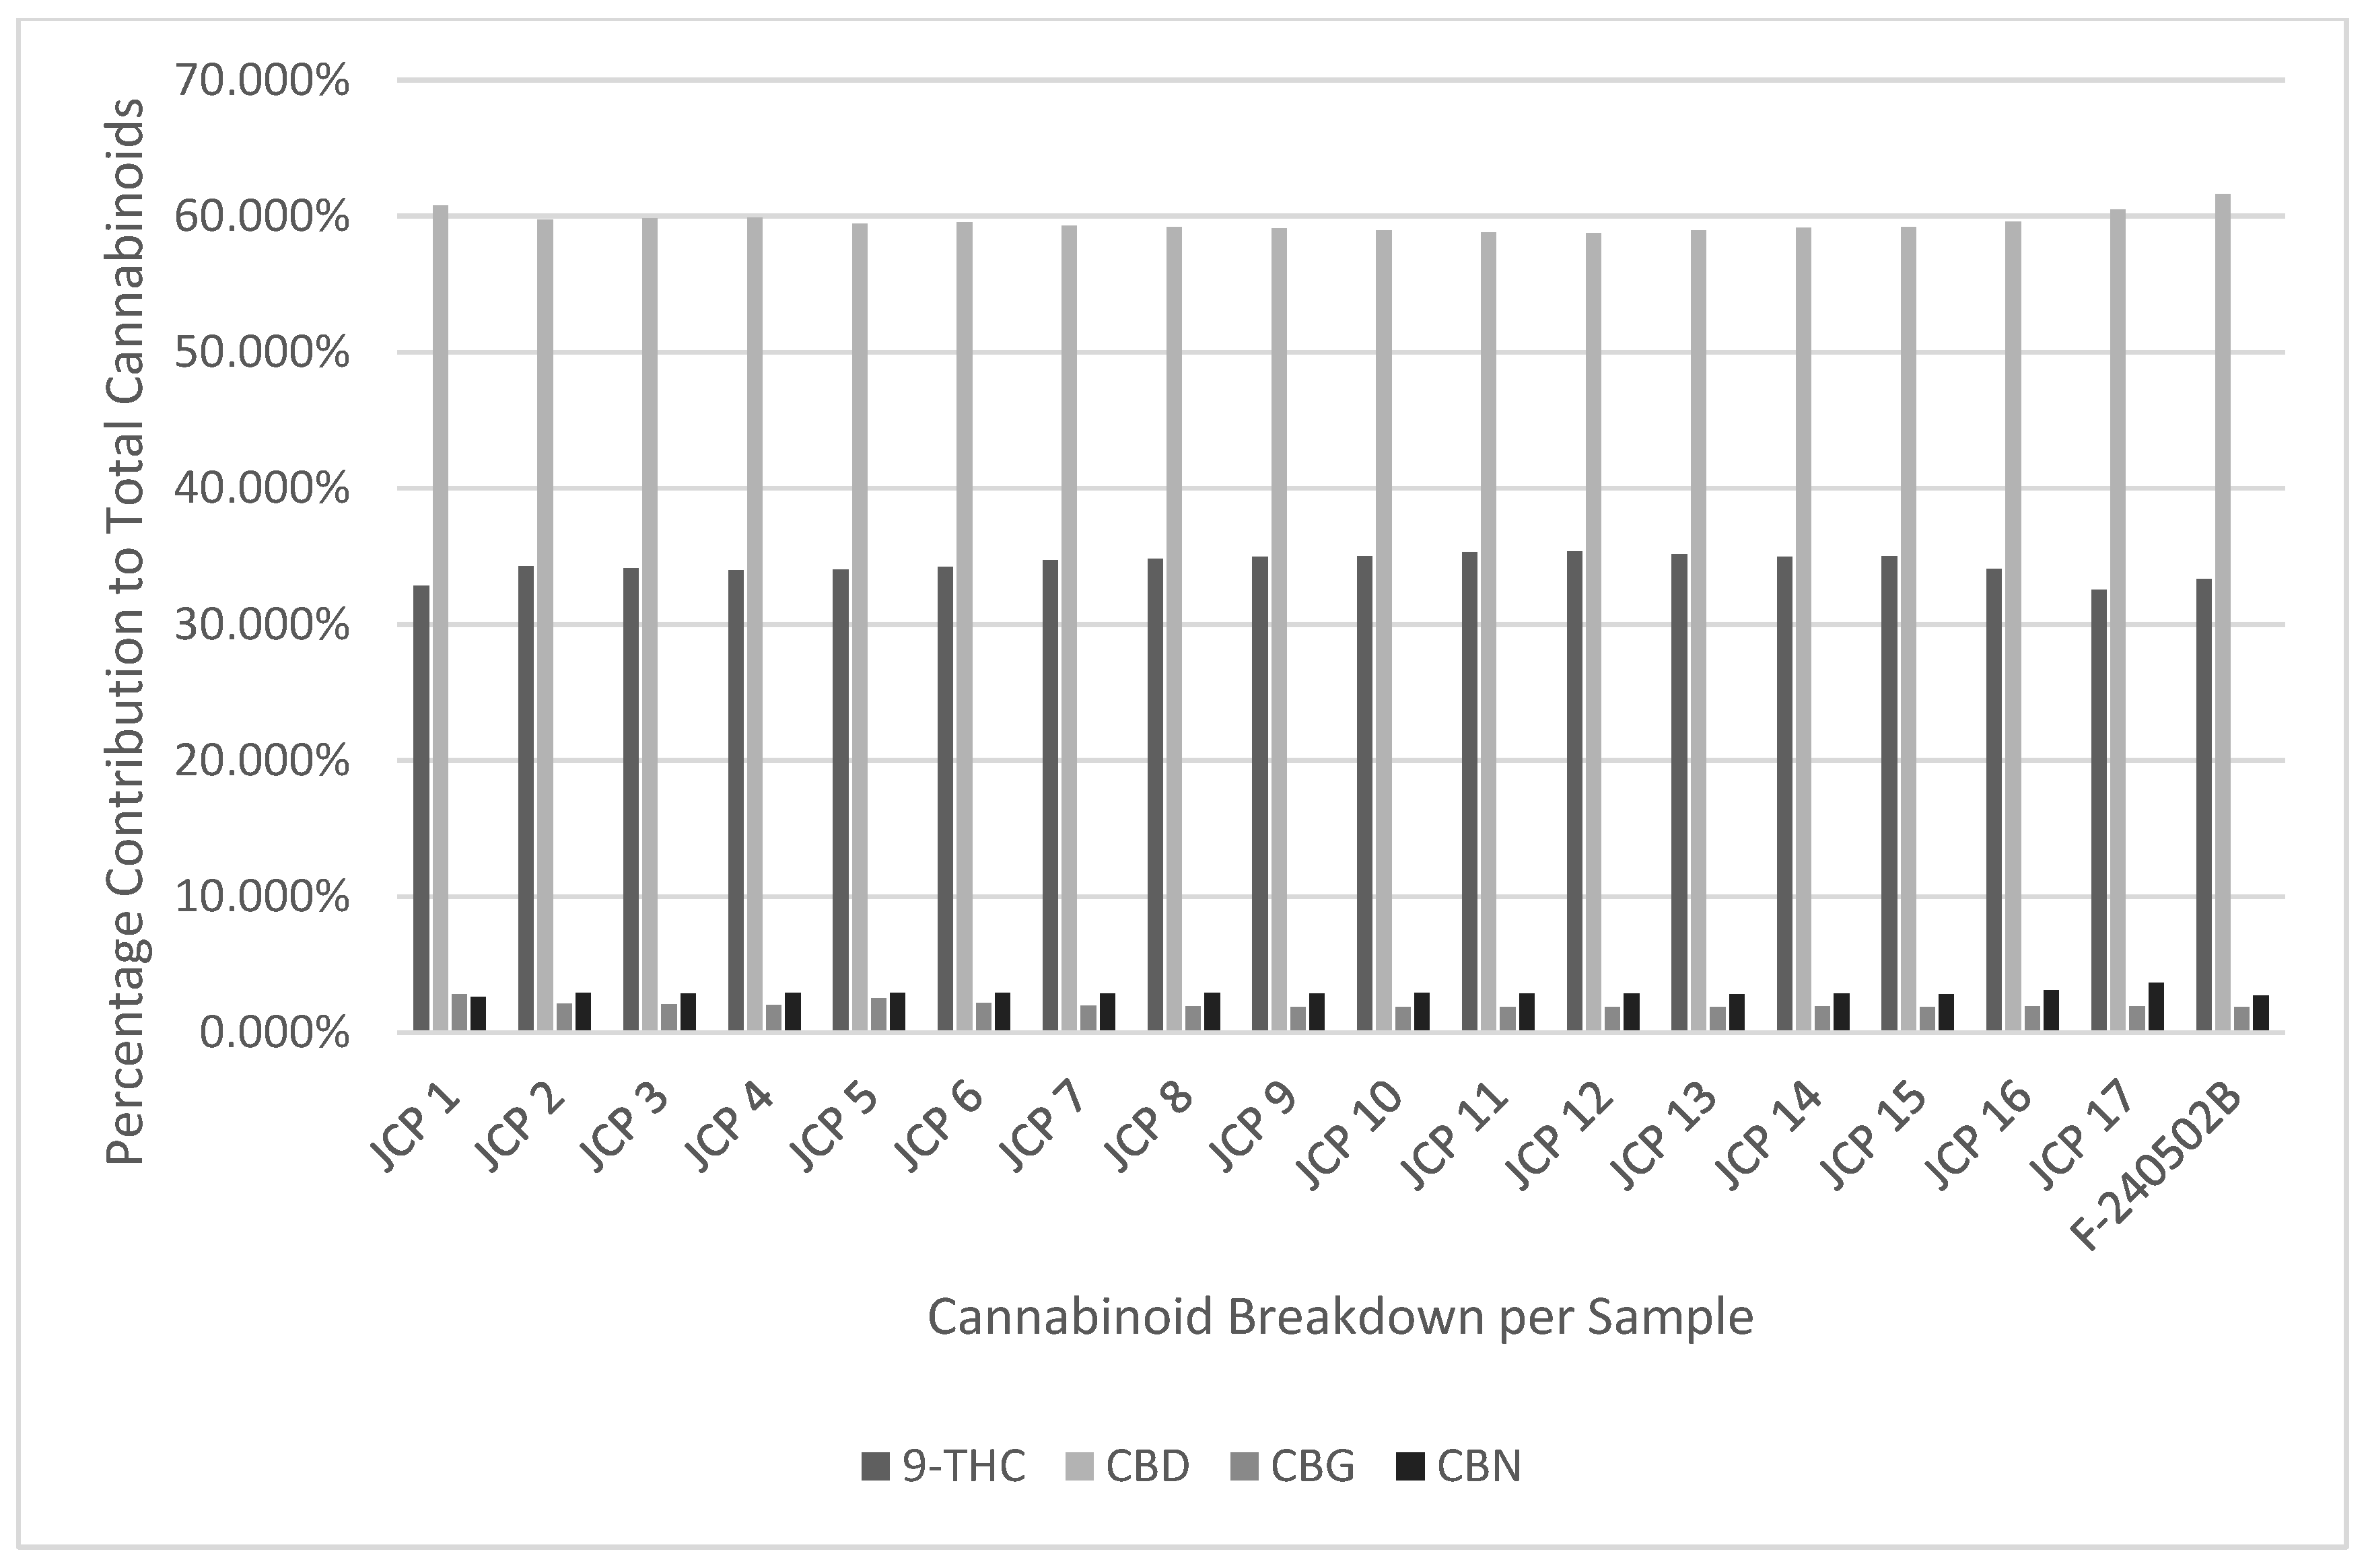
Figure 2.
Analysis of Chemical Profile Changes for RCP.
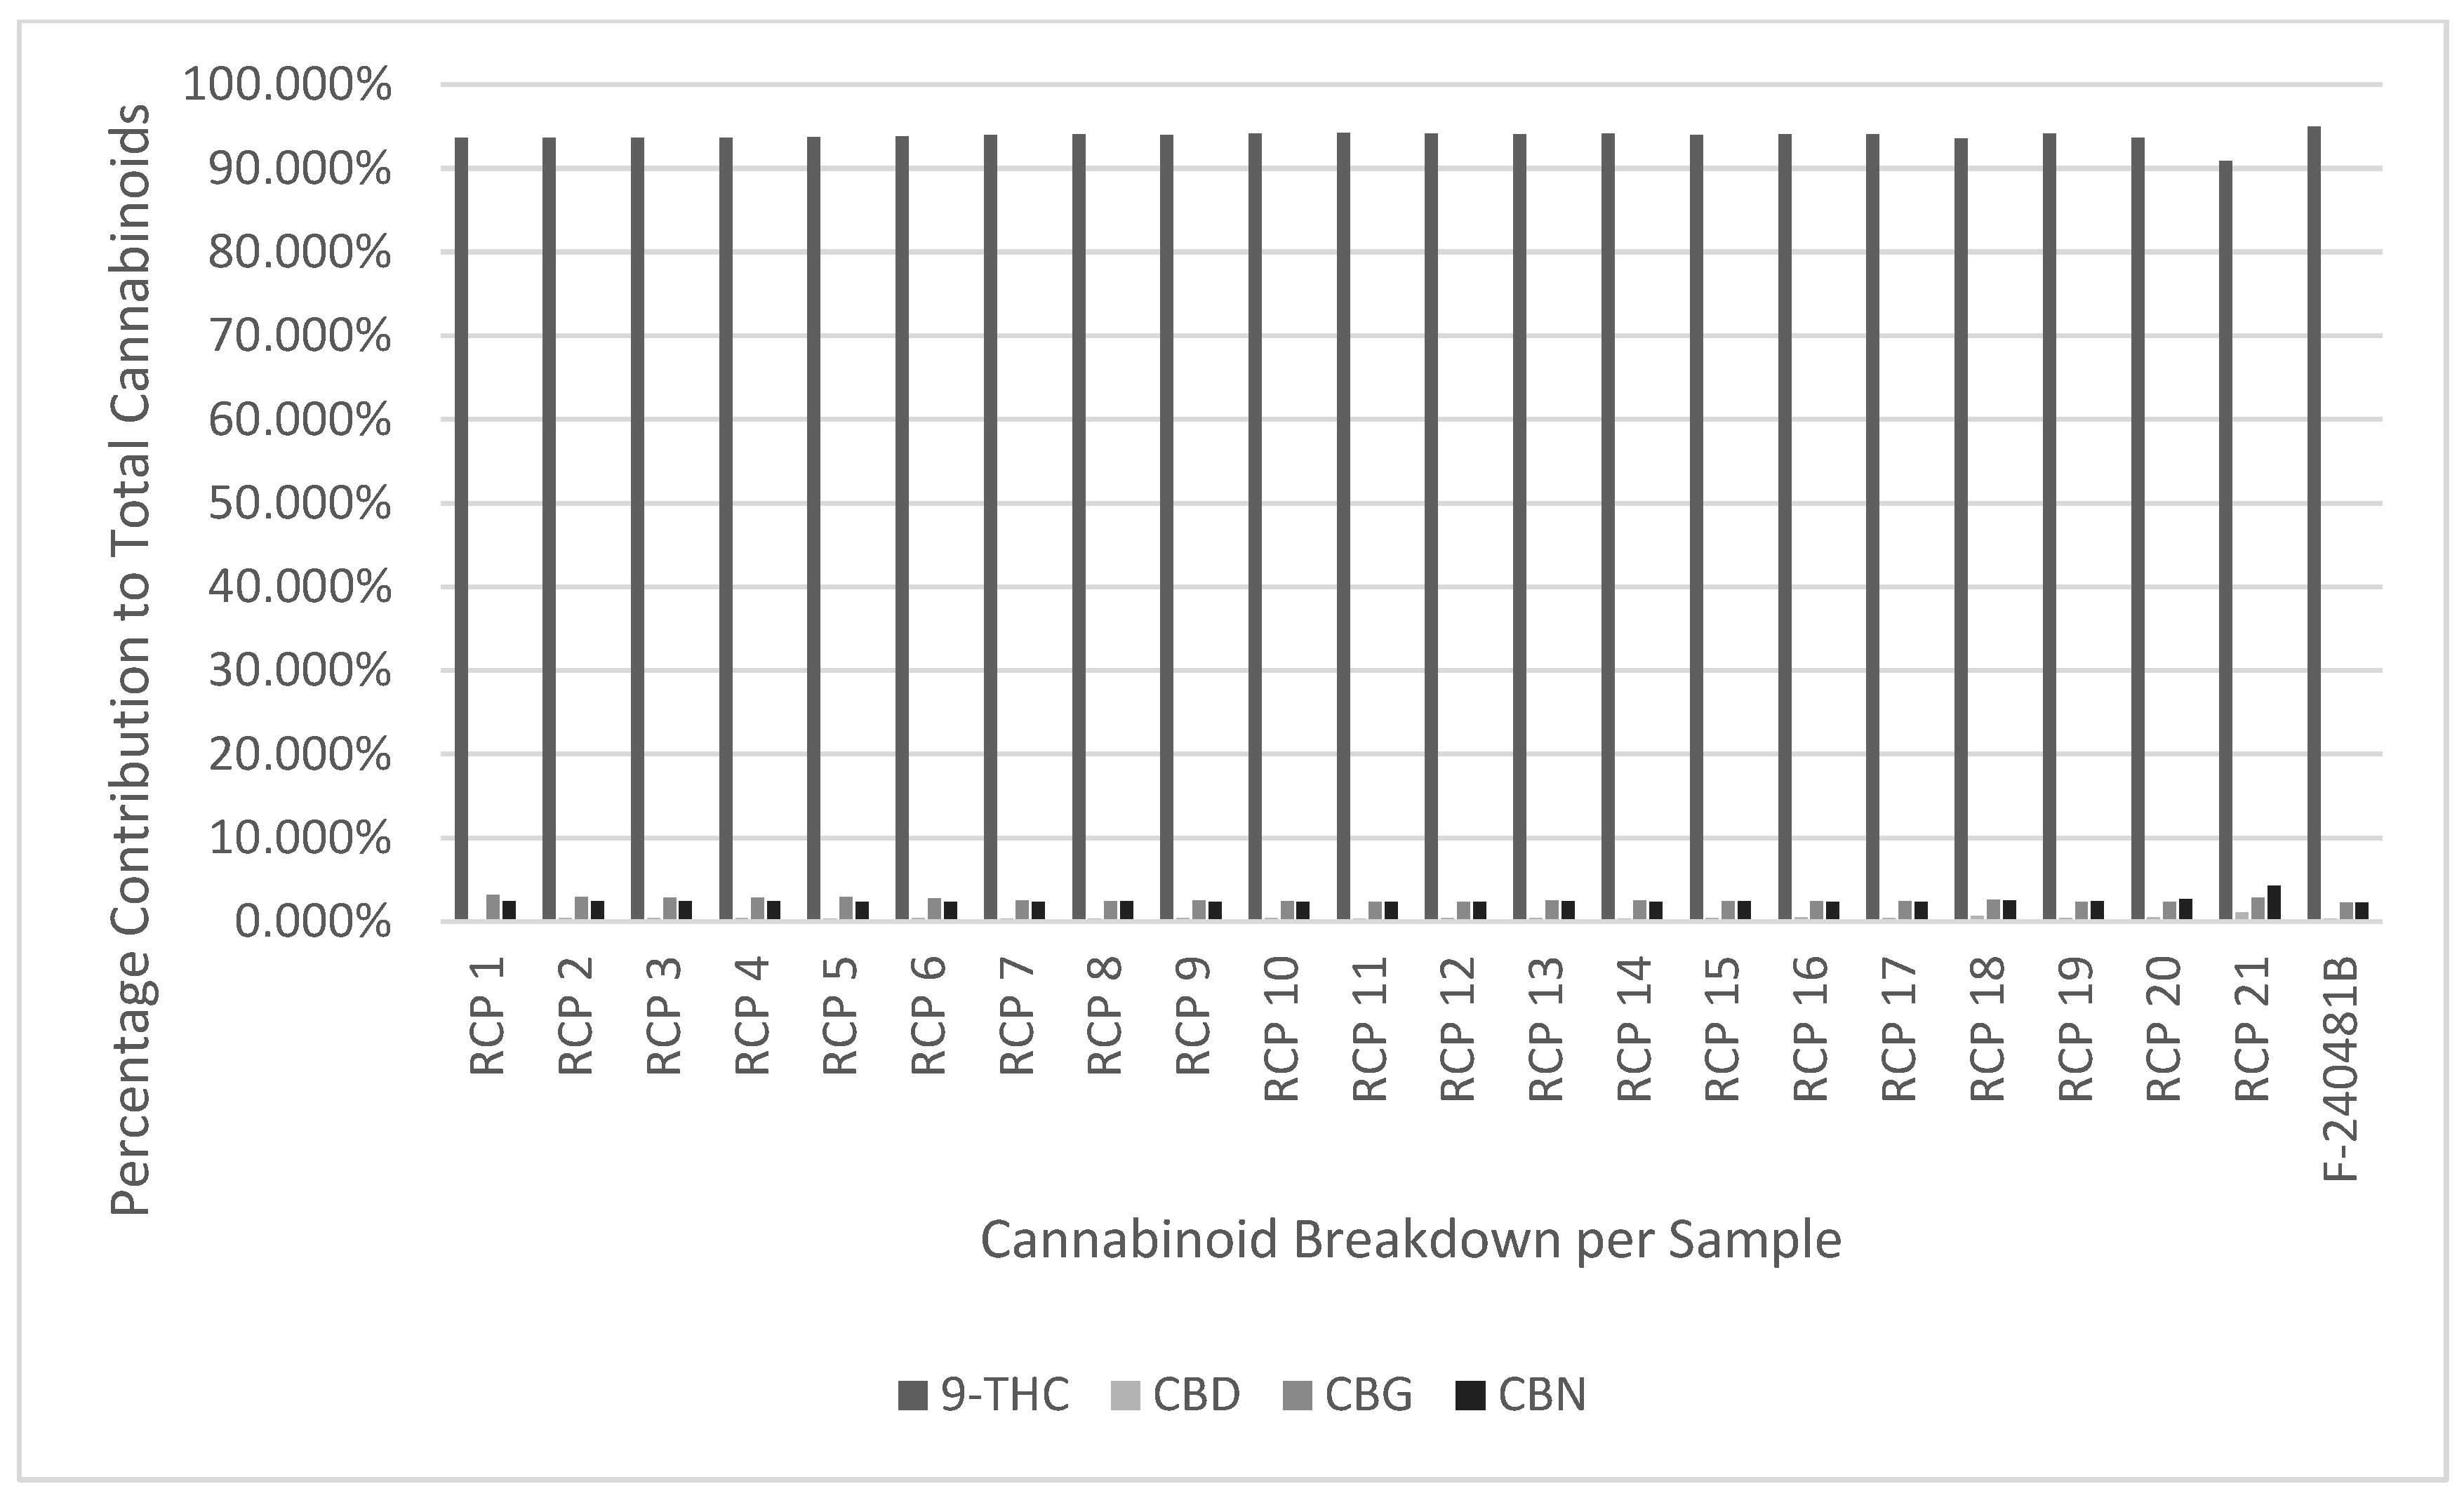
Figure 3.
Analysis of Chemical Profile Changes for RAP.
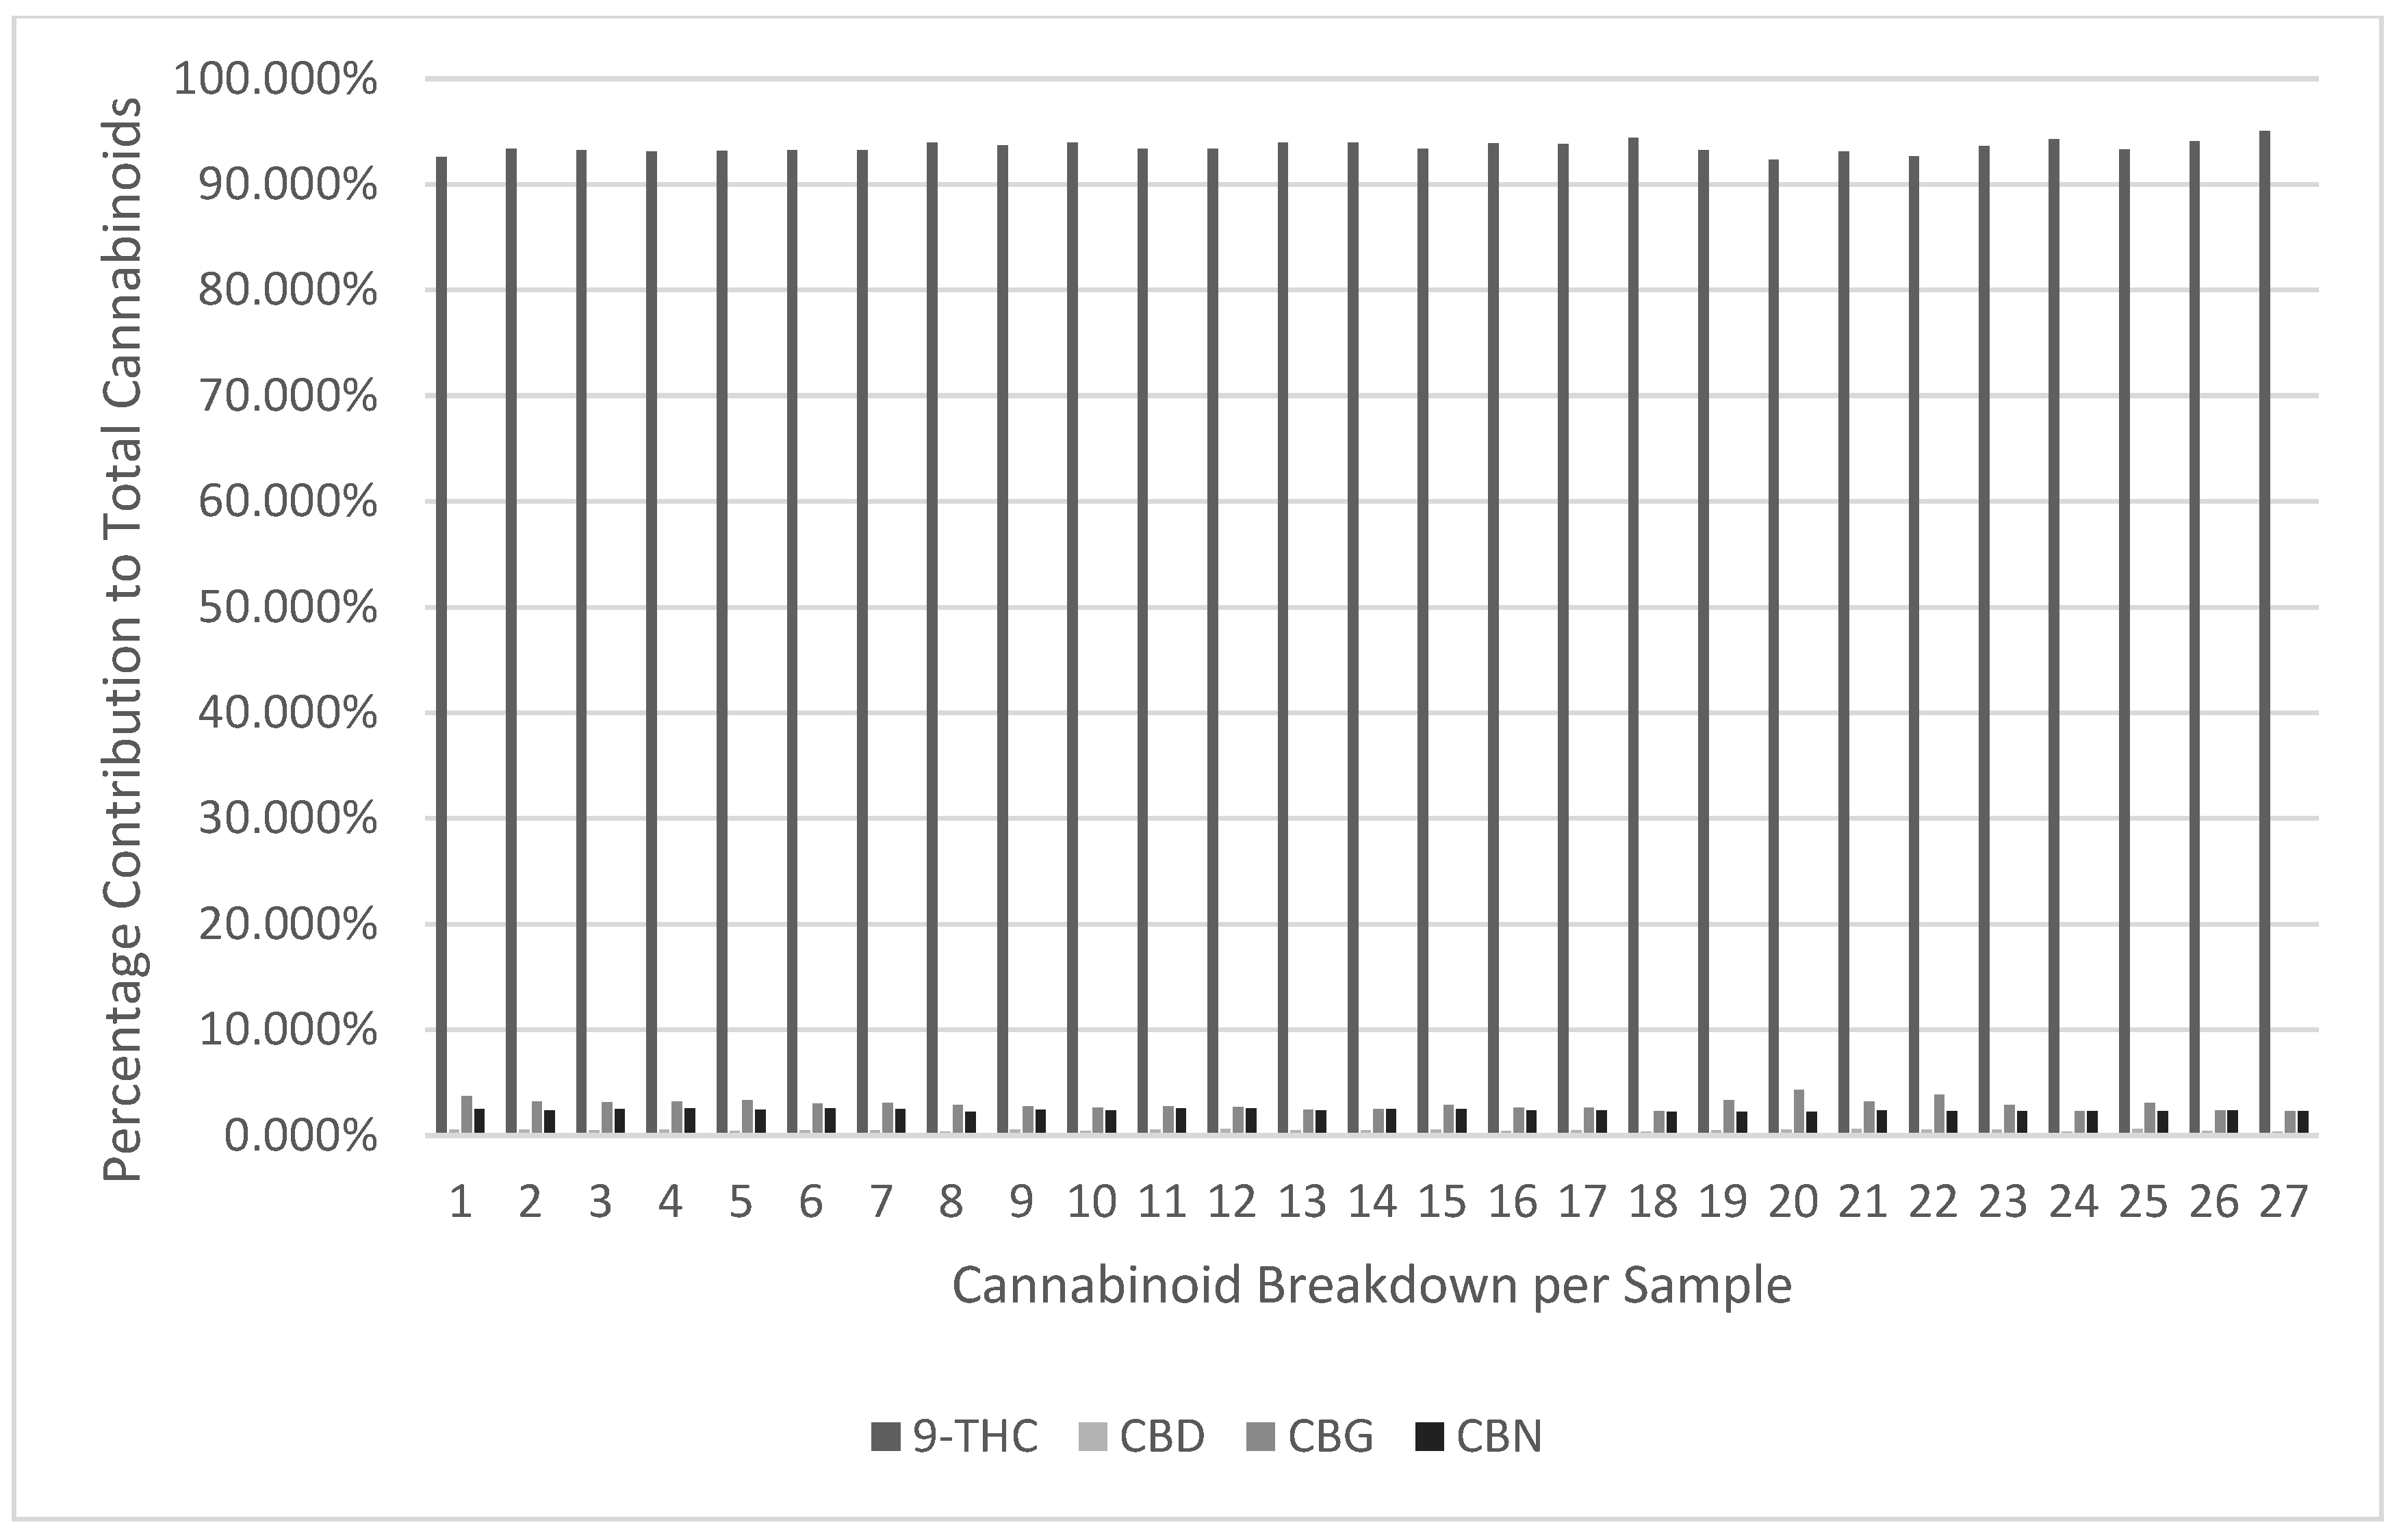
Table 1.
ACTIVE Pulse™ in the Alpha battery (Voltage is applied for the first two seconds and then cycles to zero voltage every alternate second exhibiting a "pulse").
Table 1.
ACTIVE Pulse™ in the Alpha battery (Voltage is applied for the first two seconds and then cycles to zero voltage every alternate second exhibiting a "pulse").
| Alpha Battery Pulse Sequence | ||
|---|---|---|
| Time (sec) | High Setting (V) | Low Setting (V) |
| 1 | 3.5 | 2.6 |
| 2 | 3.5 | 2.6 |
| 3 | 0 | 0 |
| 4 | 3.5 | 2.6 |
| 5 | 0 | 0 |
| 6 | 3.5 | 2.6 |
| 7 | 0 | 0 |
| 8 | 3.5 | 2.6 |
| 9 | 0 | 0 |
| 10 | 3.5 | 2.6 |
Table 5.
Minimum and Maximum Mass of Product Delivered per Inhalation.
| Vape SKU | Minimum Mass per Inhalation | Maximum Mass per Inhalation |
|---|---|---|
| JCP | 1.15mg | 13.10mg |
| RCP | 1.54mg | 8.67mg |
| RAP | 1.09mg | 3.52mg |
Table 6.
Determination of Consistency of Chemical Profile through the Life of the Vape: JCP.
| Vape SKU Combination: JCP | |||||||||||
|---|---|---|---|---|---|---|---|---|---|---|---|
| 9-THC | CBC | CBCA | CBD | CBDA | CBG | CBGA | CBN | THCA | 8-THC | Total THC | |
| Mean | 34.36% | 0.55% | 0.01% | 59.56% | 0.13% | 2.02% | 0.05% | 2.90% | 0.43% | 0.00% | 34.79% |
| Standard Deviation | 0.80% | 0.09% | 0.02% | 0.72% | 0.01% | 0.25% | 0.02% | 0.20% | 0.11% | 0.00% | 0.85% |
| % Within 1 SD | 66.67% | 72.22% | 94.44% | 72.22% | 77.78% | 88.89% | 83.33% | 83.33% | 94.44% | 100.00% | 72.22% |
Table 7.
Determination of Consistency of Chemical Profile through the Life of the Vape: RCP.
| Vape SKU Combination: RCP | |||||||||||
|---|---|---|---|---|---|---|---|---|---|---|---|
| 9-THC | CBC | CBCA | CBD | CBDA | CBG | CBGA | CBN | THCA | 8-THC | Total THC | |
| Mean | 93.85% | 0.16% | 0.02% | 0.40% | 0.09% | 2.55% | 0.00% | 2.47% | 0.46% | 0.00% | 94.30% |
| Standard Deviation | 0.72% | 0.04% | 0.00% | 0.17% | 0.02% | 0.24% | 0.00% | 0.40% | 0.10% | 0.00% | 0.67% |
| % Within 1 SD | 90.91% | 72.73% | 90.91% | 86.36% | 95.45% | 63.64% | 81.82% | 95.45% | 95.45% | 100.00% | 90.91% |
Table 8.
Determination of Consistency of Chemical Profile through the Life of the Vape: RAP.
| Vape SKU Combination: RAP | |||||||||||
|---|---|---|---|---|---|---|---|---|---|---|---|
| 9-THC | CBC | CBCA | CBD | CBDA | CBG | CBGA | CBN | THCA | 8-THC | Total THC | |
| Mean | 93.51% | 0.12% | 0.02% | 0.47% | 0.08% | 2.92% | 0.01% | 2.38% | 0.48% | 0.00% | 93.99% |
| Standard Deviation | 0.57% | 0.04% | 0.01% | 0.09% | 0.01% | 0.49% | 0.01% | 0.11% | 0.10% | 0.00% | 0.53% |
| % Within 1 SD | 77.78% | 62.96% | 74.07% | 62.96% | 70.37% | 70.37% | 92.59% | 62.96% | 96.30% | 100.00% | 74.07% |
Table 9.
Determination of Consistency of Terpene Profile through the Life of the Vape: JCP (non-detected terpenes not displayed).
Table 9.
Determination of Consistency of Terpene Profile through the Life of the Vape: JCP (non-detected terpenes not displayed).
| Vape SKU Combination: JCP | |||||||||||||||
|---|---|---|---|---|---|---|---|---|---|---|---|---|---|---|---|
| Myrcene | Alpha-Terpinene | Limonene | gamma-Terpinene | Cymene | Tepinolene | Fenchone | Linanolool | beta-Caryophyllene | alpha-humulene | alpha-Terpineol | Borneol | trans-Nerolidol | Caryophyllene oxide | alpha Bisabolol | |
| Mean | 0.70% | 0.02% | 1.17% | 0.01% | 0.10% | 0.83% | 0.13% | 22.25% | 36.55% | 11.83% | 8.63% | 2.86% | 1.82% | 4.10% | 9.01% |
| SD | 0.10% | 0.04% | 0.26% | 0.03% | 0.10% | 0.13% | 0.12% | 0.81% | 0.77% | 0.31% | 0.81% | 0.29% | 0.10% | 0.35% | 0.53% |
| % Within 1 SD | 77.78% | 94.44% | 72.22% | 94.44% | 61.11% | 61.11% | 33.33% | 55.56% | 88.89% | 83.33% | 72.22% | 72.22% | 61.11% | 72.22% | 66.67% |
Table 10.
Determination of Consistency of Terpene Profile through the Life of the Vape: RCP (non-detected terpenes not displayed).
Table 10.
Determination of Consistency of Terpene Profile through the Life of the Vape: RCP (non-detected terpenes not displayed).
| Vape SKU Combination: RCP | |||||||||||||||
|---|---|---|---|---|---|---|---|---|---|---|---|---|---|---|---|
| Myrcene | Limonene | Tepinolene | Fenchone | Linanolool | Isopulegol | beta-Caryophyllene | alpha-humulene | alpha-Terpineol | Borneol | Valencene | Geraniol | trans-Nerolidol | Caryophyllene oxide | alpha Bisabolol | |
| Mean | 0.21% | 1.92% | 0.10% | 0.03% | 21.88% | 0.26% | 32.02% | 10.20% | 13.07% | 3.16% | 0.51% | 0.02% | 0.08% | 6.25% | 10.30% |
| SD | 0.06% | 0.24% | 0.04% | 0.05% | 1.12% | 1.17% | 1.12% | 0.46% | 0.72% | 0.29% | 2.36% | 0.09% | 0.36% | 0.38% | 0.52% |
| % Within 1 SD | 86.36% | 72.73% | 81.82% | 77.27% | 90.91% | 95.45% | 95.45% | 90.91% | 86.36% | 90.91% | 95.45% | 95.45% | 95.45% | 72.73% | 81.82% |
Table 11.
Determination of Consistency of Terpene Profile through the Life of the Vape: RAP (non-detected terpenes not displayed).
Table 11.
Determination of Consistency of Terpene Profile through the Life of the Vape: RAP (non-detected terpenes not displayed).
| Vape SKU Combination: RAP | ||||||||||||||
|---|---|---|---|---|---|---|---|---|---|---|---|---|---|---|
| Myrcene | Limonene | Tepinolene | Linanolool | Isopulegol | beta-Caryophyllene | alpha-humulene | alpha-Terpineol | Borneol | Valencene | Geraniol | trans-Nerolidol | Caryophyllene oxide | alpha Bisabolol | |
| Mean | 0.20% | 2.20% | 0.01% | 24.33% | 0.21% | 30.21% | 9.68% | 13.91% | 2.45% | 0.42% | 0.02% | 0.06% | 6.34% | 9.95% |
| SD | 0.10% | 0.29% | 0.03% | 1.56% | 1.06% | 0.83% | 0.34% | 1.23% | 0.36% | 2.14% | 0.08% | 0.33% | 0.49% | 0.50% |
| % Within 1 SD | 62.96% | 74.07% | 88.89% | 88.89% | 96.30% | 70.37% | 85.19% | 74.07% | 62.96% | 96.30% | 96.30% | 96.30% | 66.67% | 77.78% |
Disclaimer/Publisher’s Note: The statements, opinions and data contained in all publications are solely those of the individual author(s) and contributor(s) and not of MDPI and/or the editor(s). MDPI and/or the editor(s) disclaim responsibility for any injury to people or property resulting from any ideas, methods, instructions or products referred to in the content. |
© 2025 by the authors. Licensee MDPI, Basel, Switzerland. This article is an open access article distributed under the terms and conditions of the Creative Commons Attribution (CC BY) license (http://creativecommons.org/licenses/by/4.0/).
Copyright: This open access article is published under a Creative Commons CC BY 4.0 license, which permit the free download, distribution, and reuse, provided that the author and preprint are cited in any reuse.


