
Submitted:
23 June 2025
Posted:
25 June 2025
You are already at the latest version
Abstract
This study examines the comprehensive organizational costs associated with destructive leadership behaviors, conceptualized as the "Total Cost of Difficult Leaders" (TCDL). Drawing from empirical data collected from 2011-2023 across 42 organizations, this research employs a mixed-methods approach to identify and quantify the financial impact of destructive leadership. Analysis reveals that problematic leadership generates substantial expenses across three domains: direct financial costs (including turnover, absenteeism, and legal exposure), operational impact costs (diminished innovation, reduced decision quality, and collaboration breakdowns), and cultural contagion costs (behavior modeling, reputation damage, and trust erosion). Longitudinal data demonstrate that the total annual cost of a single difficult leader typically ranges from 175% to over 1000% of their compensation, with a mean multiplier of 8.7x (SD = 4.3) for mid-level leaders. The study concludes with evidence-based recommendations for measurement and intervention, while acknowledging limitations regarding causality, contextual factors, and generalizability across cultures and industries.
Keywords:
destructive leadership
; organizational costs
; total cost of difficult leaders
; TCDL
; turnover
; absenteeism
; legal exposure
; innovation reduction
; decision quality
; collaboration breakdowns
; cultural contagion
; behavior modeling
; reputation damage
; trust erosion
; leadership impact
; financial impact
; mixed-methods
; empirical data
; leadership multiplier
; intervention strategie
Introduction
Organizations invest significant resources in leadership development, yet the costs associated with ineffective or destructive leadership behaviors remain largely unquantified in organizational accounting systems. While positive leadership behaviors have been extensively studied for their organizational benefits (Bass & Riggio, 2006; Harter et al., 2002), the specific financial impact of destructive leadership has received comparatively limited empirical attention (Schyns & Schilling, 2013; Tepper, 2007).
This research gap is particularly problematic given the prevalence of destructive leadership behaviors in contemporary organizations. Studies suggest that between 10-16% of leaders engage in behaviors that could be classified as destructive (Aasland et al., 2010; Tepper et al., 2006), yet organizations often lack frameworks for calculating the comprehensive costs associated with retaining these leaders.
The concept of the "Total Cost of Difficult Leaders" (TCDL) provides a framework for understanding and quantifying these impacts. Building on Sutton's (2007) "no asshole rule" and integrating established constructs including abusive supervision (Tepper, 2000), destructive leadership (Einarsen et al., 2007), toxic leadership (Lipman-Blumen, 2005), and petty tyranny (Ashforth, 1994), this study seeks to develop a comprehensive model for calculating the organizational costs of destructive leadership.
The present study addresses three primary research questions:
- What are the key cost categories associated with destructive leadership behaviors in organizations?
- How can these costs be reliably measured and quantified across different organizational contexts?
- What factors moderate the relationship between destructive leadership behaviors and organizational costs?
Based on these research questions and existing literature, this study proposes the following hypotheses:
- H1: Destructive leadership behaviors will be associated with significantly higher direct financial costs (turnover, absenteeism, legal expenses) compared to constructive leadership.
- H2: Destructive leadership behaviors will be associated with significantly reduced operational effectiveness (innovation, decision quality, collaboration) compared to constructive leadership.
- H3: The negative effects of destructive leadership will extend beyond the leader's immediate team through cultural contagion mechanisms.
- H4: The financial impact of destructive leadership will be moderated by industry context, with stronger effects in knowledge-intensive industries.
- H5: The financial impact of destructive leadership will be moderated by organizational level, with higher-level leaders generating proportionately larger costs.
By addressing these questions and testing these hypotheses, this research contributes to both scholarly understanding and practical organizational decision-making regarding destructive leadership.
Literature Review
Theoretical Perspectives on Destructive Leadership
Multiple theoretical traditions have contributed to our understanding of destructive leadership, each emphasizing different aspects of the phenomenon. Integrating these perspectives provides a foundation for understanding both the nature of destructive leadership and its organizational impacts.
Trait-based perspectives emphasize the role of stable personality characteristics in predisposing individuals toward destructive leadership behaviors. Drawing from the dark triad of personality (Paulhus & Williams, 2002)—narcissism, Machiavellianism, and psychopathy—this perspective suggests that certain dispositional traits increase the likelihood of destructive behaviors. Spain et al. (2014) found that dark triad traits predicted abusive supervision and counterproductive work behaviors. This perspective helps explain the persistence of destructive patterns across situations and time.
Behavioral perspectives focus on observable actions rather than underlying traits. Tepper (2000, p. 178) defined abusive supervision as "subordinates' perceptions of the extent to which supervisors engage in the sustained display of hostile verbal and nonverbal behaviors, excluding physical contact." This approach emphasizes the impact of specific behaviors on followers and organizational outcomes, regardless of the leader's intentions or dispositions. Behavioral perspectives facilitate measurement and intervention design by focusing on observable actions rather than inferred characteristics.
Social-cognitive perspectives emphasize how leadership behavior emerges from the interaction between individual characteristics and social context. Bandura's (1977) social learning theory explains how destructive behaviors can be learned and transmitted through observation and modeling. This perspective helps explain how destructive leadership can spread through organizations via cultural contagion effects (Gino et al., 2009).
Systems perspectives view destructive leadership as embedded within broader organizational systems. Padilla et al. (2007) proposed a "toxic triangle" framework incorporating destructive leaders, susceptible followers, and conducive environments. This perspective emphasizes how organizational factors may enable, constrain, or amplify the effects of destructive leadership behaviors. Thoroughgood et al. (2018) extended this work with a dual-process model that integrates leader characteristics, follower susceptibilities, and contextual factors.
These diverse theoretical perspectives provide complementary insights into the nature, causes, and consequences of destructive leadership. The present research draws from these perspectives to develop a comprehensive framework for understanding and measuring the organizational costs of destructive leadership.
Conceptualizing Destructive Leadership: Dimensions and Manifestations
Research on destructive leadership has evolved from various theoretical traditions, resulting in several overlapping but distinct constructs. Tepper's (2000) concept of abusive supervision focuses primarily on interpersonal mistreatment and has been extensively validated in relation to employee outcomes including psychological distress, turnover, and decreased organizational citizenship behaviors (Tepper, 2007; Mackey et al., 2017).
Einarsen et al. (2007, p. 208) offered a broader framework of destructive leadership, characterized as "the systematic and repeated behavior by a leader, supervisor, or manager that violates the legitimate interest of the organization by undermining and/or sabotaging the organization's goals, tasks, resources, and effectiveness and/or the motivation, well-being or job satisfaction of subordinates." This definition encompasses both organizational and interpersonal dimensions of destructive behavior.
Other relevant constructs include toxic leadership (Lipman-Blumen, 2005), which focuses on leaders who inflict serious and enduring harm through destructive behaviors, psychological techniques, and dysfunctional personal characteristics; and petty tyranny (Ashforth, 1994), which describes leaders who exercise power oppressively, capriciously, and vindictively. Pelletier (2010) expanded the toxic leadership construct by identifying five dimensions: self-promotion, abusive supervision, unpredictability, narcissism, and authoritarian leadership, providing a more nuanced framework for understanding these behaviors.
Krasikova et al. (2013) provided an integrative definition of destructive leadership as "volitional behavior by a leader that can harm or intends to harm a leader's organization and/or followers by (a) encouraging followers to pursue goals that contravene the legitimate interests of the organization and/or (b) employing a leadership style that involves the use of harmful methods of influence with followers, regardless of justifications for such behavior" (p. 1310). This definition emphasizes the volitional nature of destructive leadership and distinguishes it from mere ineffectiveness or incompetence.
While these constructs have distinct theoretical foundations, they share common elements relevant to understanding the organizational costs of difficult leadership. These include interpersonal aggression, disregard for others' needs, self-centered attitudes, and behaviors that undermine organizational functioning (Schyns & Schilling, 2013).
Prevalence and Stability of Destructive Leadership
Understanding the prevalence of destructive leadership provides important context for estimating its organizational impact. Aasland et al. (2010) conducted one of the most comprehensive prevalence studies, finding that approximately 33.5% of employees reported experiencing some form of destructive leadership behavior from their immediate supervisor. A more conservative estimate by Tepper (2007) suggested that 13.6% of U.S. workers experience abusive supervision, while Nielsen et al. (2017) found that 15.2% of Norwegian employees reported ongoing exposure to destructive leadership behaviors.
Longitudinal research by Holmberg et al. (2018) examined the stability of destructive leadership behaviors over time, finding moderate to high stability over a two-year period (r = .62), suggesting that these behaviors tend to persist rather than being transient responses to situational pressures. This persistence has important implications for calculating cumulative organizational costs over time.
Research by Aryee et al. (2007) and Hoobler and Hu (2013) has investigated the antecedents of destructive leadership, identifying factors such as leaders' experiences of organizational injustice, work stress, and personal disposition. Harris et al. (2013) found that difficult leaders often exhibit a pattern of behavior across multiple subordinates rather than targeting specific individuals, suggesting that these behaviors reflect leadership style rather than mere relationship difficulties.
Conceptual Model of Destructive Leadership Impact
Based on the integration of theoretical perspectives and empirical research, this study proposes a conceptual model of how destructive leadership impacts organizational outcomes (Figure 1). This model illustrates the relationships between destructive leadership dimensions, mediating mechanisms, and organizational costs.
The model proposes that destructive leadership behaviors—comprising interpersonal aggression, status-based entitlement, emotional manipulation, and systemic obstruction—affect organizations through three primary pathways:
- Psychological mechanisms (psychological safety, trust, engagement) that mediate the relationship between leadership behaviors and individual/team outcomes
- Behavioral responses (turnover, absenteeism, reduced discretionary effort) that directly generate organizational costs
- Cultural contagion processes (behavior modeling, norm establishment, trust erosion) that extend the impact beyond the leader's immediate sphere of influence
These pathways generate costs across three domains: direct financial costs, operational impact costs, and cultural contagion costs. The model also identifies key moderating factors that influence the strength of these relationships, including industry context, organizational level, team composition, and cultural context.
This conceptual model provides a framework for understanding both the processes through which destructive leadership generates organizational costs and the factors that may amplify or attenuate these effects.
Psychological and Behavioral Impacts on Employees
The psychological and behavioral impacts of destructive leadership on employees have been extensively documented. Meta-analyses by Schyns and Schilling (2013) and Mackey et al. (2017) found that destructive leadership behaviors consistently predict decreased job satisfaction (mean correlation r = -.41), reduced organizational commitment (r = -.38), increased turnover intention (r = .38), diminished organizational citizenship behaviors (r = -.30), and increased counterproductive work behaviors (r = .38).
Beyond these direct effects, research has identified several psychological mechanisms through which destructive leadership impacts employees. Duffy et al. (2002) introduced the construct of social undermining, demonstrating how destructive leaders systematically erode employees' sense of competence, dignity, and self-worth. Carlson et al. (2012) found that employees working under abusive supervision experience increased work-family conflict and emotional exhaustion, extending the impact beyond the workplace.
Psychological distress represents another significant impact pathway. Research by Qian et al. (2017) found that employees experiencing abusive supervision showed increased symptoms of anxiety and depression. A longitudinal study by Montano et al. (2017) demonstrated that exposure to destructive leadership predicted increased psychosomatic complaints and decreased psychological well-being over a 12-month period, controlling for baseline health status.
The health impacts of destructive leadership extend beyond psychological well-being to physical health outcomes. Nyberg et al. (2008) found that employees working under destructive leaders showed elevated risk for cardiovascular disease, while Bamberger and Bacharach (2006) documented increased substance use as a coping mechanism. A meta-analysis by Harms et al. (2017) found that destructive leadership was associated with increased employee health complaints (r = .34) and decreased physical well-being (r = -.31).
Team and Organizational Impacts
Research has increasingly examined how destructive leadership affects team dynamics and broader organizational functioning. Psychological safety, defined as "a shared belief that the team is safe for interpersonal risk taking" (Edmondson, 1999, p. 354), has emerged as a critical mediator between leadership behavior and team performance (Newman et al., 2017). Frazier et al. (2017) conducted a meta-analysis of psychological safety research, finding that leadership behavior was the strongest predictor of team psychological safety (r = .43), which in turn predicted team performance (r = .29), learning behavior (r = .45), and information sharing (r = .47).
Destructive leadership behaviors significantly undermine psychological safety, which in turn inhibits information sharing, learning from failures, and innovation (Carmeli & Gittell, 2009; Edmondson, 2019). Saunders et al. (2017) found that teams under destructive leaders showed reduced psychological safety, decreased knowledge sharing, and impaired team learning capabilities. Nembhard and Edmondson (2006) demonstrated that leader inclusiveness—the opposite of many destructive leadership behaviors—predicted psychological safety in healthcare teams, which in turn predicted quality improvement engagement.
Collaborative dynamics represent another important impact pathway. Research by Crawford and LePine (2013) on team member exchange demonstrated how destructive leadership behaviors disrupt the development of high-quality relationships within teams. Leroy et al. (2012) found that authentic leadership—characterized by self-awareness, relational transparency, and ethical behavior—predicted team psychological safety and performance, suggesting that destructive leadership (representing the absence of these qualities) would undermine these outcomes.
Trust erosion represents another significant impact pathway. Kramer and Cook's (2004) research demonstrates that leadership behavior strongly influences organizational trust, which predicts collaboration effectiveness, information sharing, and organizational commitment. Dirks and Ferrin's (2002) meta-analysis found that trust in leadership strongly predicted job performance (r = .17), organizational citizenship behaviors (r = .22), job satisfaction (r = .51), and organizational commitment (r = .49).
Colquitt et al. (2007) conducted a meta-analysis of trust, trustworthiness, and trust propensity, finding that trust in leadership predicted risk-taking behaviors (r = .42) and information sharing (r = .46). When destructive leadership behaviors are tolerated, the resulting trust erosion extends beyond the difficult leader to affect perceptions of the entire leadership team (Fulmer & Gelfand, 2012). Rousseau et al. (1998) described trust as a psychological state comprising the intention to accept vulnerability based on positive expectations of another's intentions, a state that destructive leadership directly undermines.
Employee engagement—defined as "a positive, fulfilling work-related state of mind" (Schaufeli et al., 2006, p. 702)—also mediates the relationship between leadership behavior and organizational outcomes. Gallup's extensive research on engagement demonstrates its relationship to productivity, profitability, customer ratings, and turnover (Harter et al., 2002). Saks (2006) found that organizational support and procedural justice—both undermined by destructive leadership—were significant predictors of employee engagement.
Christian et al. (2011) conducted a meta-analysis of work engagement research, finding that leadership was a significant predictor of engagement (r = .31), which in turn predicted task performance (r = .43) and contextual performance (r = .34). Bakker and Demerouti (2008) proposed the Job Demands-Resources model, demonstrating how supportive leadership functions as a job resource that fosters engagement, while destructive leadership represents a job demand that depletes energy and undermines engagement.
Organizational Innovation and Decision-Making
Research on organizational innovation provides important insights into how destructive leadership affects creativity and innovation processes. Amabile's (1988) componential theory of creativity emphasizes the role of intrinsic motivation, which destructive leadership undermines through controlling behaviors and negative feedback. Anderson et al. (2014) conducted a comprehensive review of creativity and innovation research, identifying leadership as a critical factor in fostering or hindering creative processes.
Psychological safety plays a particularly important role in innovation contexts. Baer and Frese (2003) found that psychological safety predicted company performance and innovation success in German mid-sized companies. Lee et al. (2011) demonstrated that team psychological safety mediated the relationship between leadership and team innovation performance. Research by Zhou (2003) showed that supervisor monitoring and controlling behaviors—common elements of destructive leadership—were negatively associated with employee creativity.
Decision-making quality represents another organizational domain affected by destructive leadership. Morrison and Milliken (2000) introduced the concept of organizational silence, describing how employees withhold opinions and concerns when they perceive speaking up as dangerous or futile. Their model specifically identifies leadership behaviors as a key determinant of organizational silence. Detert and Burris (2007) found that leadership openness predicted employee voice behavior, which is essential for effective organizational decision-making.
Edmondson and Lei (2014) reviewed the psychological safety literature, finding that psychological safety predicted voice behavior, information sharing, and decision quality across multiple organizational contexts. Liang et al. (2012) distinguished between promotive and prohibitive voice, finding that psychological safety particularly affected employees' willingness to raise problems and concerns—a critical input to effective decision-making that destructive leadership systematically suppresses.
Financial Implications and Measurement Challenges
Despite extensive research on the psychological and behavioral impacts of destructive leadership, few studies have attempted to quantify these impacts in financial terms. The Society for Human Resource Management (SHRM, 2019) estimates turnover costs between 50-200% of an employee's annual salary, providing one metric for calculating direct impacts. O'Connell and Kung (2007) detailed the components of turnover costs, including separation costs, replacement costs, training costs, and lost productivity, which collectively far exceed visible recruitment expenses.
Gallup's research suggests disengaged employees cost organizations approximately 34% of their salary in lost productivity (Gallup, 2021). Seppälä and Cameron (2015) reported that healthcare expenditures are nearly 50% greater at high-pressure companies with poor leadership climates. Goh et al. (2016) estimated that workplace stressors—including destructive leadership—may account for approximately $190 billion in additional healthcare spending and 120,000 excess deaths annually in the United States alone.
Hemp (2004) examined the costs of presenteeism—being physically present but mentally disengaged—finding that this hidden cost often exceeds the costs of absenteeism and medical treatment combined. Burton et al. (2005) demonstrated that decreased productivity due to presenteeism could represent 3-4 times the direct medical costs associated with health conditions, providing a framework for quantifying engagement impacts.
Beyond these direct costs, significant measurement challenges exist in quantifying the full organizational impact of destructive leadership. These include:
- Attribution challenges: Isolating leadership effects from other organizational and environmental factors (Martinko et al., 2013)
- Temporal considerations: Accounting for both immediate and delayed impacts that may manifest over different timeframes (Mitchell & James, 2001)
- Cultural contagion: Measuring how destructive behaviors spread beyond the leader's direct sphere of influence (Bandura, 1977; Gino et al., 2009)
- Opportunity costs: Quantifying "what might have been" in terms of innovation, collaboration, and strategic opportunities (Amabile & Conti, 1999)
Dess and Robinson (1984) discussed the methodological challenges of measuring organizational performance, particularly when assessing intangible factors like leadership impact. Huselid (1995) demonstrated approaches for linking human resource practices to concrete financial outcomes, providing methodological frameworks that could be adapted to leadership impact assessment. Cascio and Boudreau (2011) developed the concept of "HR analytics" that attempts to quantify the financial impact of human capital decisions, offering potential approaches for measuring leadership costs.
Several theoretical frameworks offer promise for addressing these measurement challenges. Resource-based view (RBV) theory (Barney, 1991) suggests that human capital represents a potential source of sustainable competitive advantage, providing a theoretical basis for valuing leadership impacts. Social exchange theory (Blau, 1964; Cropanzano & Mitchell, 2005) offers insight into how leadership behaviors affect employee reciprocity and discretionary effort, which have tangible performance implications.
The present research addresses these challenges through a multi-method, longitudinal approach designed to capture the comprehensive organizational costs of destructive leadership.
Cross-Cultural Considerations in Destructive Leadership
The understanding and impact of destructive leadership may vary significantly across cultural contexts. Hofstede's (2001) cultural dimensions theory, particularly the power distance dimension, provides a framework for understanding how cultural factors might moderate leadership impact. Power distance refers to the extent to which less powerful members of organizations accept and expect that power is distributed unequally. In high power distance cultures, subordinates may be more accepting of authoritarian leadership behaviors that might be considered destructive in lower power distance contexts (Daniels & Greguras, 2014).
Empirical research has begun to explore these cross-cultural variations. Lian et al. (2012) found that the negative effects of abusive supervision on subordinate performance were stronger in Anglo cultures than in Confucian Asian cultures. Vogel et al. (2015) conducted a meta-analysis of leadership impact across cultures, finding that while the direction of effects was consistent, the magnitude varied significantly across cultural clusters.
GLOBE research (House et al., 2004) on cross-cultural leadership demonstrated that while certain leadership behaviors are universally desirable or undesirable, the specific manifestations and impacts vary across cultural contexts. Tsui et al. (2007) argued for more context-specific theories of leadership that account for cultural and institutional differences rather than assuming universal application of Western leadership models.
Pellegrini and Scandura (2008) examined the concept of paternalistic leadership across cultures, noting that behaviors that might be perceived as controlling or intrusive in Western contexts may be viewed as appropriate care in other cultural settings. Rockstuhl et al. (2012) found that the relationship between leadership behavior and follower outcomes was moderated by both societal culture and individual cultural orientations.
These cross-cultural considerations have important implications for measuring and addressing destructive leadership in global organizations. They suggest that while destructive leadership may have universal components, both its manifestation and impact likely vary across cultural contexts, requiring culturally sensitive measurement and intervention approaches.
Intervention and Recovery
Research on addressing destructive leadership has examined various intervention approaches and recovery trajectories. Day et al. (2014) conducted a comprehensive review of leadership development research, finding that targeted interventions can effectively modify leadership behaviors, though sustained change requires ongoing reinforcement. Avolio et al. (2009) meta-analyzed leadership intervention studies, finding an average effect size (d) of 0.60 across various intervention types, suggesting moderate effectiveness of leadership development efforts.
Peterson (2012) examined executive coaching efficacy specifically for problematic leadership behaviors, finding that coaching was most effective when combined with clear feedback, accountability mechanisms, and organizational support. Boyatzis and McKee (2005) introduced the concept of resonant leadership development, emphasizing the importance of emotional intelligence and mindfulness in leadership effectiveness—capabilities that directly counter destructive tendencies.
Organizational recovery following destructive leadership has received less research attention. Anand et al. (2015) studied trust repair following organizational transgressions, finding that transparent communication, accountability, and structural reforms were essential for rebuilding trust. Their findings have potential application to rebuilding trust after destructive leadership is addressed. Kim et al. (2004) examined trust repair at the interpersonal level, finding that different repair strategies were effective depending on the nature of the trust violation, with implications for leadership intervention design.
Trevino and Brown (2005) argued that ethical leadership requires both personal moral development and appropriate organizational systems and cultures. Their work suggests that addressing destructive leadership requires attention to both individual leader development and broader organizational contexts that may enable or constrain these behaviors.
The present research addresses these gaps by providing empirical data on intervention efficacy and recovery trajectories following destructive leadership interventions.
Methodology
Research Design
This study employed a mixed-methods, multi-phase research design conducted between 2011-2023:
- Phase 1: Conceptual Framework Development (2011-2013): Initial qualitative research included semi-structured interviews with 78 executives, HR professionals, and employees across 12 organizations to identify key cost categories and impact domains. This phase established the preliminary TCDL framework through thematic analysis of interview transcripts and integration with existing literature on destructive leadership.
- Phase 2: Framework Validation and Refinement (2013-2016): The preliminary framework was tested and refined through case studies in 17 organizations spanning technology, healthcare, financial services, manufacturing, and non-profit sectors. This phase incorporated both qualitative assessments and quantitative measurements to validate the framework components.
- Phase 3: Longitudinal Analysis (2016-2023): In-depth longitudinal tracking of 42 "difficult leaders" across 23 organizations, including pre/post intervention measurements and outcomes. This phase involved systematic data collection on all TCDL components at regular intervals, providing insight into cost accumulation, intervention efficacy, and recovery trajectories.
Sampling Strategy and Selection Criteria
The identification of "difficult leaders" for inclusion in the study followed a multi-step process designed to ensure both validity and ethical research practice:
-
Initial identification: Potential participants were identified through one of three channels:
- Organizational nomination by HR or senior leadership based on documented performance issues related to leadership behaviors
- Pattern analysis of employee surveys identifying units with significant leadership concerns
- Review of formal complaints or grievances indicating potential leadership issues
- Screening assessment: Leaders identified through these channels completed standardized leadership assessments, including a 360-degree feedback instrument and the Destructive Leadership Assessment Battery (D-LAB). Leaders scoring above threshold values (>1.5 SD above organizational means) on at least one destructive leadership dimension were considered for inclusion.
- Case review: A panel of HR professionals and researchers reviewed each potential case to ensure that leadership behavior, rather than other factors (e.g., team composition, organizational changes), was the primary concern.
-
Control group selection: For each identified difficult leader, a comparison leader was selected based on matching criteria including:
- Similar organizational level and function
- Comparable team size and composition
- Similar organizational tenure
- Similar external business conditions
This rigorous selection process ensured that the sample represented genuine cases of destructive leadership while controlling for potential confounding variables. The final sample included 42 difficult leaders and 42 matched comparison leaders.
Sample Characteristics
As seen in Table 1, the final sample for longitudinal analysis (Phase 3) included 42 leaders identified as "difficult" based on the standardized assessment criteria. These leaders were distributed across organizational levels: frontline management (n=14), middle management (n=17), and executive leadership (n=11). They worked in organizations spanning multiple industries: technology (n=9), healthcare (n=8), financial services (n=7), manufacturing (n=6), professional services (n=5), retail (n=4), and non-profit (n=3).
The median team size managed by these leaders was 13 direct reports (range: 6-37). The leaders had a median organizational tenure of 6.3 years (range: 1.2-18.4 years) and were predominantly male (71%), reflecting broader leadership demographic patterns in the participating organizations.
Participating organizations ranged in size from 120 to 14,600 employees, with a median size of 1,240 employees. Organizations were headquartered in the United States (68%), Canada (12%), United Kingdom (8%), Germany (6%), Australia (4%), and Singapore (2%).
Data Collection
Data were collected through multiple methods to enable triangulation and address potential common method bias:
-
Validated Assessment Instruments:
- Tepper's (2000) Abusive Supervision Scale to measure leader behavior (α = .92)
- Utrecht Work Engagement Scale (Schaufeli et al., 2006) to assess employee engagement (α = .89)
- Organizational Trust Inventory (Cummings & Bromiley, 1996) to measure trust levels (α = .91)
- Team Psychological Safety instrument (Edmondson, 1999) to assess team climate (α = .87)
- Destructive Leadership Assessment Battery (D-LAB), a comprehensive instrument developed for this research (see Appendix A)
-
Organizational Metrics:
- HR data including turnover, absenteeism, recruitment costs, and formal complaints
- Financial performance indicators relevant to each organizational context
- Operational metrics including quality, timeliness, innovation outputs, and efficiency
- Customer/client feedback and satisfaction data
-
Qualitative Methods:
- Semi-structured interviews with direct reports, peers, and supervisors (see Appendix B)
- Focus groups exploring team dynamics and cultural impacts (see Appendix C)
- Exit interview analysis for departing employees (see Appendix D)
- Organizational network analysis to map collaboration patterns (see Appendix E)
To address common method bias, the research employed several strategies:
- Collection of data from multiple sources (leaders, team members, HR systems, organizational metrics)
- Temporal separation between predictor and outcome measurements
- Procedural remedies including anonymous responses and counterbalanced question order
- Statistical controls including Harman's single-factor test and common latent factor analysis
Instrument Development and Validation
A key methodological contribution of this research was the development of the Destructive Leadership Assessment Battery (D-LAB). This instrument was developed through a rigorous process:
- Item generation: Initial items were developed based on literature review, existing instruments, and qualitative interviews from Phase 1. This process generated 87 potential items across five hypothesized dimensions.
- Content validation: Items were reviewed by a panel of 12 subject matter experts (academics and practitioners) who rated each item for relevance, clarity, and appropriateness. Items with low expert agreement were eliminated or revised.
- Pilot testing: The refined instrument (64 items) was administered to 217 employees across three organizations not included in the main study. Exploratory factor analysis revealed a four-factor structure that explained 79% of variance.
- Instrument refinement: Based on factor loadings and item-total correlations, the instrument was reduced to 40 items (10 per dimension) with strong psychometric properties.
- Validation: The final instrument was validated with a separate sample of 412 employees, demonstrating strong reliability (dimension αs from .87 to .92), convergent validity with existing measures (rs from .68 to .81), and discriminant validity from constructive leadership measures.
The final D-LAB instrument demonstrated superior psychometric properties compared to existing measures, particularly in capturing the multidimensional nature of destructive leadership. The instrument measures four distinct but related dimensions: Interpersonal Aggression, Status-Based Entitlement, Emotional Manipulation, and Systemic Obstruction. These dimensions align with previously established constructs while providing a more comprehensive assessment framework.
Analysis Approach
Data analysis combined quantitative and qualitative techniques:
-
Quantitative Analysis:
- Comparative analysis between teams under difficult leaders and matched control groups using t-tests and ANOVA
- Longitudinal trend analysis tracking metrics before, during, and after interventions using repeated measures ANOVA and growth curve modeling
- Multiple regression analysis to control for confounding variables including industry trends, organizational changes, and external market factors
- Structural equation modeling to test the proposed conceptual model of destructive leadership impact
- Cost modeling using organization-specific financial parameters with Monte Carlo simulations to establish confidence intervals
-
Qualitative Analysis:
- Thematic analysis of interview and focus group transcripts using NVivo software with dual-coder reliability checks (Cohen's κ = .84)
- Document analysis of organizational communications and policies
- Case study synthesis to identify cross-organizational patterns
- Deviant case analysis examining instances where expected impacts did not materialize
-
Mixed-Methods Integration:
- Sequential explanatory design using qualitative data to explain quantitative findings
- Triangulation of multiple data sources to strengthen validity
- Joint displays integrating quantitative and qualitative results
- Member checking with organizational stakeholders to validate interpretations
Measurement Framework Development
A key contribution of this research is the development of the TCDL measurement framework. This framework was developed through an iterative process:
- Initial framework categories were identified through literature review and expert interviews
- Categories were refined through pilot testing in three organizations
- Measurement protocols were developed for each cost category
- The framework was validated through application in diverse organizational contexts
- Refinements were made based on feedback and empirical results
The final framework includes three major cost domains (direct financial costs, operational impact costs, and cultural contagion costs) with specific measurement protocols for each component.
Addressing Alternative Explanations and Confounding Factors
To strengthen causal inference and address potential alternative explanations, the research incorporated several controls and analytical approaches:
- Matched comparison design: Each difficult leader was compared with a matched control leader within the same organization, controlling for team, organizational, and environmental factors.
- Longitudinal measurement: By tracking metrics over time, the research could establish temporal precedence—a key component of causal inference.
-
Organizational context controls: Statistical analyses included controls for:
- Industry economic conditions using industry-specific indices
- Organizational performance trends
- Major organizational changes (restructuring, mergers, etc.)
- Team composition and stability
-
Reverse causality testing: To address the possibility that poor team performance might lead to increased leadership frustration and subsequent destructive behaviors, the research included:
- Analysis of leadership behavior preceding performance declines
- Comparison of struggling teams under constructive versus destructive leadership
- Examination of leader behavior changes following team performance changes
- Alternative pathway modeling: Structural equation modeling compared the fit of multiple potential causal pathways to determine which best explained the observed data.
These methodological approaches strengthen the validity of findings regarding the impact of destructive leadership while acknowledging the inherent limitations of field research in establishing definitive causality.
Ethical Considerations
This research adhered to ethical guidelines for organizational research. All organizations provided formal consent for participation, and individual participants received detailed information about the research purpose and data usage. To protect confidentiality, all organizations and leaders remain anonymous in reporting, and data were aggregated to prevent identification of specific individuals.
Given the sensitive nature of leadership assessment, several ethical safeguards were implemented:
- Confidential feedback: Leaders received confidential feedback on assessment results with opportunities to discuss interpretation and developmental implications.
-
Development resources: All identified difficult leaders were provided with development resources including:
- Executive coaching options with qualified professionals
- Targeted leadership development programs
- Educational resources specific to their developmental needs
- Regular progress assessments with constructive feedback
-
Organizational commitments: Participating organizations committed to fair treatment of leaders regardless of assessment results, including:
- Protection from career discrimination based solely on research findings
- Equal access to developmental opportunities
- Balanced consideration of both strengths and developmental needs
- Decision-making based on comprehensive performance review rather than isolated measures
-
Research protections: Data collection protocols were designed to minimize potential career harm while providing accurate assessment:
- Multiple data sources to prevent single-source bias
- Behavioral focus rather than dispositional labeling
- Confidentiality protocols for all participants
- Right to withdraw from the study at any point
-
Intervention ethics: For leaders participating in interventions, additional ethical considerations included:
- Transparent communication about intervention goals and processes
- Clear metrics for evaluating improvement
- Supportive resources throughout the intervention process
- Constructive alternatives if interventions proved unsuccessful
- Attention to psychological well-being during challenging feedback
The research protocol was reviewed and approved by the institutional review board at the author's university.
Results
Difficult Leadership Dimensional Analysis
As seen in Figure 2, factor analysis of leadership behavior assessments across the sample (N=42) revealed four distinct dimensions of difficult leadership that align with established theoretical constructs:
-
Interpersonal Aggression (aligned with Abusive Supervision)
- Factor loading range: .67-.89
- Explained variance: 28.4%
- Mean score: 3.84 (SD=0.91) on 5-point scale
-
Status-Based Entitlement (aligned with Petty Tyranny)
- Factor loading range: .71-.84
- Explained variance: 23.7%
- Mean score: 4.06 (SD=0.78) on 5-point scale
-
Emotional Manipulation (aligned with Toxic Leadership)
- Factor loading range: .64-.82
- Explained variance: 19.2%
- Mean score: 3.59 (SD=1.04) on 5-point scale
-
Systemic Obstruction (aligned with Destructive Leadership)
- Factor loading range: .62-.79
- Explained variance: 17.6%
- Mean score: 3.72 (SD=0.88) on 5-point scale
As seen in Table 2, confirmatory factor analysis supported this four-dimensional structure (CFI = .94, RMSEA = .068, SRMR = .054), demonstrating better fit than alternative models including a unidimensional construct (ΔCFI = .14, χ² difference test p < .001).
While these dimensions represent distinct constructs, they frequently co-occur in practice. Analysis of dimensional patterns revealed that 17% of difficult leaders scored high on a single dimension, while 83% exhibited problematic behaviors across multiple dimensions. Status-Based Entitlement was the most commonly observed dimension (present in 72% of difficult leaders), followed by Interpersonal Aggression (64%), Systemic Obstruction (47%), and Emotional Manipulation (39%).
Qualitative data corroborated these findings, with team members frequently describing multidimensional behavior patterns. As one interview participant noted:
"It's not just that he yells at people [Interpersonal Aggression]. He also creates these arbitrary processes that only he can approve [Systemic Obstruction] and constantly changes his expectations without telling anyone [Emotional Manipulation]. It's like working in a minefield where the mines keep moving."
Testing Hypothesis 1: Direct Financial Costs
Turnover and Replacement Expenses
Comparative analysis between teams led by difficult leaders (n=42) and matched comparison groups within the same organizations revealed significantly higher turnover rates. Teams under difficult leaders experienced mean annual turnover of 37.2% (SD=12.3%) compared to 16.4% (SD=5.7%) in comparison groups, a difference that was statistically significant (t(82) = 9.78, p < .001, d = 2.14).
Multiple regression analysis controlling for department function, organizational tenure, and external labor market conditions confirmed that difficult leadership behavior significantly predicted turnover (β = .47, p < .001), explaining 22% of variance beyond control variables.
Organization-specific analysis of replacement costs found a mean cost per departure of 127% of annual salary (SD=41%, 95% CI: 116-138%) when accounting for recruitment, onboarding, training, and productivity gaps. This translated to a median annual turnover cost attributable to difficult leadership of 592,000 per leader (IQR:328,000-847,000,95847,000, 95% CI: 847,000,95524,000-$660,000).
Absenteeism and Presenteeism
Teams under difficult leaders showed significantly higher absenteeism rates, with unplanned absences 47% higher (SD=18%, 95% CI: 42-52%) than comparison groups (t(82) = 7.23, p < .001, d = 1.59). Stress-related health claims were 64% higher (SD=23%, 95% CI: 57-71%, p < .001), and employee assistance program utilization was 38% higher (SD=12%, 95% CI: 35-41%, p < .05).
Presenteeism, measured through the Utrecht Work Engagement Scale and organization-specific productivity metrics, revealed that teams under difficult leaders scored 1.4 standard deviations lower on engagement (t(82) = 8.91, p < .001, d = 1.96) and demonstrated 31% lower productivity on objective metrics (SD=11%, 95% CI: 28-34%, p < .001).
The combined cost of absenteeism and presenteeism attributable to difficult leadership averaged 258,000 annually per leader (95% CI: 258,000 annually per leader, 95214,000-$302,000).
Legal and Compliance Costs
Legal and compliance metrics showed that departments led by difficult leaders generated 340% more formal complaints (SD=87%, 95% CI: 314-366%, p < .001), 210% more legal consultations (SD=62%, 95% CI: 191-229%, p < .001), and 180% more settlements (SD=41%, 95% CI: 167-193%, p < .01) compared to matched departments.
The distribution of legal costs showed a strong positive skew, with most difficult leaders generating modest legal expenses but 15% generating catastrophic costs exceeding 500,000.
The median annual legal/compliance cost attributable to difficult leadership was 500,000, or 87,000 per leader (IQR: 42,000−42,000-42,000−216,000, 95% CI: 67,000−67,000-67,000−107,000).
These results strongly support Hypothesis 1, confirming that destructive leadership behaviors are associated with significantly higher direct financial costs compared to constructive leadership. The combined direct financial costs (turnover, absenteeism/presenteeism, legal/compliance) represent a median annual cost of 937,000 per difficult leader (95% CI: 937,000 per difficult leader, 95751,000-$1,123,000).

Table 3.
Direct Financial Costs Associated with Difficult Leadership.
| Cost Category | Difficult Leader Teams | Comparison Teams | Difference | Statistical Significance | Effect Size |
|---|---|---|---|---|---|
| Turnover | |||||
| Annual turnover rate | 37.2% (SD=12.3%) | 16.4% (SD=5.7%) | +127% | t(82) = 9.78, p < .001 | d = 2.14 |
| Replacement cost per departure | 127% of salary (SD=41%) | - | - | - | - |
| Median annual turnover cost | $592,000 (IQR: $328,000-$847,000) | - | - | - | - |
| Absenteeism & Presenteeism | |||||
| Unplanned absence rate | +47% (SD=18%) | Baseline | +47% | t(82) = 7.23, p < .001 | d = 1.59 |
| Stress-related health claims | +64% (SD=23%) | Baseline | +64% | t(82) = 8.14, p < .001 | d = 1.79 |
| EAP utilization | +38% (SD=12%) | Baseline | +38% | t(82) = 4.27, p < .05 | d = 0.94 |
| Work engagement scores | -1.4 SD | Baseline | -1.4 SD | t(82) = 8.91, p < .001 | d = 1.96 |
| Productivity on objective metrics | -31% (SD=11%) | Baseline | -31% | t(82) = 7.63, p < .001 | d = 1.68 |
| Mean annual absenteeism/presenteeism cost | $258,000 (95% CI: $214,000-$302,000) | - | - | - | - |
| Legal & Compliance | |||||
| Formal complaints | +340% (SD=87%) | Baseline | +340% | t(82) = 11.46, p < .001 | d = 2.52 |
| Legal consultations | +210% (SD=62%) | Baseline | +210% | t(82) = 9.18, p < .001 | d = 2.02 |
| Settlements | +180% (SD=41%) | Baseline | +180% | t(82) = 7.84, p < .01 | d = 1.72 |
| Median annual legal/compliance cost | $87,000 (IQR: $42,000-$216,000) | - | - | - | - |
Testing Hypothesis 2: Operational Impact Costs
Innovation Deficit
Teams under difficult leaders scored 1.8 standard deviations below comparison groups on Edmondson's (1999) psychological safety measure (t(82) = 10.46, p < .001, d = 2.30). This translated into measurable innovation deficits:
- 41% fewer viable new ideas generated in structured innovation sessions (SD=13%, 95% CI: 37-45%, t(82) = 6.78, p < .01, d = 1.49)
- 2.8x longer time to bring concepts to prototype stage (SD=0.6, 95% CI: 2.6-3.0, t(82) = 9.14, p < .001, d = 2.01)
- 53% lower implementation rate for employee suggestions (SD=17%, 95% CI: 48-58%, t(82) = 7.32, p < .001, d = 1.61)
Path analysis confirmed that psychological safety mediated the relationship between destructive leadership and innovation outcomes (indirect effect β = -.42, p < .001), supporting the proposed conceptual model.
Organization-specific valuation of innovation outputs based on historical data revealed a median innovation deficit attributable to difficult leadership of 386,000 annually per leader (IQR: 386,000 annually per leader, IQR:219,000-512,000,95512,000, 95% CI: 512,000,95341,000-$431,000).
Qualitative data from interviews provided insight into the mechanisms underlying these innovation deficits:
"People stopped suggesting improvements because they knew they'd either get shot down immediately or have to endure a lengthy interrogation that made them feel stupid. Eventually, everyone just kept their heads down and did the minimum."
Decision Quality Reduction
Teams under difficult leaders showed significant deficits in decision-making processes and outcomes. Process metrics revealed 47% less information sharing (SD=15%, 95% CI: 43-51%, p < .001), 64% fewer alternatives considered (SD=19%, 95% CI: 59-69%, p < .001), and 2.3x higher decision reversal rates (SD=0.5, 95% CI: 2.2-2.4, p < .01).
In contexts where decision outcomes could be financially quantified (primarily financial services, technology, and manufacturing), regression analysis controlling for market conditions and decision complexity showed that difficult leadership predicted 18.4% poorer financial outcomes (β = -.32, 95% CI: 14.7-22.1%, p < .05).
The median cost of decision quality reduction attributable to difficult leadership was 278,000 annually per leader (IQR:163,000-427,000,95427,000, 95% CI: 427,000,95241,000-$315,000).
Collaboration Breakdown
As seen in Table 4, organizational network analysis revealed that departments under difficult leaders had 64% fewer meaningful cross-functional connections (SD=21%, 95% CI: 58-70%, p < .001), 47% lower information-sharing density (SD=14%, 95% CI: 43-51%, p < .01), and 2.1x longer response times to cross-functional requests (SD=0.4, 95% CI: 2.0-2.2, p < .001).
Figure 3 illustrates the stark difference in collaboration networks between a department under difficult leadership and a matched comparison department, showing the significant reduction in cross-functional connections and information flow.
These collaboration breakdowns resulted in measurable inefficiencies, including duplicated efforts, missed knowledge-sharing opportunities, and slower response to market changes. Organization-specific analyses found collaboration costs representing a median of 304,000 annually per difficult leader (IQR:304,000 annually per difficult leader (IQR: 304,000 annually per difficult leader (IQR: 187,000-436,000,95436,000, 95% CI: 436,000,95267,000-$341,000).
These results strongly support Hypothesis 2, confirming that destructive leadership behaviors are associated with significantly reduced operational effectiveness compared to constructive leadership. The combined operational impact costs (innovation, decision quality, collaboration) represent a median annual cost of 968,000 per difficult leader (95% CI: 968,000 per difficult leader, 95849,000-$1,087,000).
Testing Hypothesis 3: Cultural Contagion Costs
Behavior Modeling
Longitudinal analysis documented "toxicity contagion" through observation, network analysis, and repeated measurement. Middle managers under difficult leaders were 3.2x more likely to adopt similar behaviors within 12 months (χ²(1) = 11.37, p < .01, φ = .46). Teams under difficult leaders showed a 67% increase in horizontal aggression among team members (t(41) = 6.82, p < .001, d = 1.05).
Employee engagement scores decreased not only in the difficult leader's department but also in adjacent departments (mean decrease of 14 percentage points, F(2,63) = 9.47, p < .05, η² = .23), demonstrating the expanding impact beyond direct reports.
Temporal analysis revealed that behavioral contagion followed a nonlinear pattern, with minimal effects in the first 6 months followed by accelerating adoption of destructive behaviors between months 6-18, as illustrated in Figure 4.
While challenging to precisely quantify, regression modeling using engagement-productivity relationships established in each organization suggested a median cultural contagion cost of 217,000 annually per difficult leader (IQR: 217,000 annually per difficult leader (IQR: 142,000-358,000,95358,000, 95% CI: 358,000,95183,000-$251,000).
Organizational Reputation Damage
External reputation metrics revealed significant impacts attributable to difficult leadership. Organizations with identified difficult leaders in key positions showed:
- Employer review ratings on external platforms averaging 0.8 points lower on 5-point scales (95% CI: 0.6-1.0, t(22) = 4.37, p < .01, d = 0.92)
- Candidate acceptance rates 23% lower for positions reporting to difficult leaders (95% CI: 19-27%, χ²(1) = 9.14, p < .01, φ = .37)
- Compensation premiums averaging 18% higher to secure equivalent talent (95% CI: 15-21%, t(56) = 3.92, p < .05, d = 0.52)
These reputation effects generated a median annual cost of 264,000 per difficult leader (IQR:264,000 per difficult leader, IQR:183,000-421,000,95421,000, 95% CI: 421,000,95228,000-$300,000), primarily through increased compensation requirements and extended vacancy periods.
Trust Erosion
As seen in Table 5, longitudinal trust measurement using the Organizational Trust Inventory revealed that tolerance of difficult leaders correlated with decreased trust scores for all leadership—even those demonstrating exemplary behavior—by an average of 31 percentage points (95% CI: 27-35%, r = -.47, p < .001). This trust deficit persisted for an average of 18 months (SD=5.4 months, 95% CI: 16.3-19.7 months) after the difficult leader was addressed.
Path analysis demonstrated that trust erosion mediated the relationship between difficult leadership and decreased organizational commitment (β = .38, p < .001), increased cynicism (β = .42, p < .001), and reduced discretionary effort (β = -.36, p < .01).
The median cost attributable to this broader trust erosion was estimated at 183,000 annually per difficult leader (IQR: 183,000 annually per difficult leader, IQR: 92,000-276,000,95276,000, 95% CI: 276,000,95152,000-$214,000), primarily through reduced discretionary effort and increased resistance to change initiatives.
These results strongly support Hypothesis 3, confirming that the negative effects of destructive leadership extend beyond the leader's immediate team through cultural contagion mechanisms. The combined cultural contagion costs (behavior modeling, reputation damage, trust erosion) represent a median annual cost of 664,000 per difficult leader (95% CI: 664,000 per difficult leader, 95563,000-$765,000).
Testing Hypotheses 4 and 5: Moderating Factors
Industry Context Moderation
ANOVA revealed significant differences in cost multipliers across industries (F(6,35) = 6.73, p < .01, η² = .31), supporting Hypothesis 4. Post-hoc analysis (Tukey HSD) showed that knowledge-intensive industries (technology, professional services) had significantly higher multipliers (M = 11.2, SD = 3.8) than process-driven environments like manufacturing (M = 6.4, SD = 2.3).
This moderation effect was particularly pronounced for operational impact costs (F(6,35) = 8.91, p < .001, η² = .37) and somewhat less pronounced for direct financial costs (F(6,35) = 4.26, p < .05, η² = .22), suggesting that industry context particularly affects how destructive leadership impacts innovation, decision quality, and collaboration.
Regression analysis confirmed that the knowledge intensity of the industry (measured using Department of Labor O*NET classifications) significantly moderated the relationship between destructive leadership dimensions and total costs (β = .29, p < .01), even after controlling for organization size and team composition.
Organizational Level Moderation
Regression analysis demonstrated that organizational level significantly predicted cost multiplier (β = .41, p < .001), with executive difficult leaders generating multipliers 2.3x higher than frontline leaders after controlling for industry and team size. This finding supports Hypothesis 5.
This moderation effect was strongest for cultural contagion costs (β = .53, p < .001), moderate for operational impact costs (β = .37, p < .01), and weakest for direct financial costs (β = .24, p < .05), suggesting that higher-level difficult leaders particularly influence organizational culture and operational effectiveness.
Qualitative data provided insight into these moderation effects:
"When the problem is a team leader, it affects one team. When it's a VP, it creates a culture where every manager thinks that's how you get ahead. We watched the behavior spread like a virus through the entire division."
Additional Moderating Factors
As seen in Table 6, while industry context and organizational level were the primary moderators examined in our hypotheses, exploratory analysis revealed several additional moderating factors worthy of further investigation:
Team Composition: Teams with higher average tenure showed greater resilience to difficult leadership (r = .37, p < .05), possibly due to established working relationships and reduced dependence on the leader. Conversely, teams with higher educational levels showed less resilience (r = -.29, p < .05), perhaps reflecting greater employment options and lower tolerance for poor treatment.
Organizational Culture: Organizations with stronger positive cultures showed greater resilience to difficult leadership, with cost multipliers approximately 30% lower than those with already-challenged cultures (p < .05). However, this resilience diminished over time, suggesting that even strong cultures eventually succumb to toxic influence.
Leader Characteristics: Leader tenure moderated the relationship between difficult leadership and organizational costs, with newer leaders (<2 years) generating lower costs than longer-tenured difficult leaders (p < .05). This suggests that destructive behaviors become more deeply embedded and influential over time.
These additional moderating factors provide important context for understanding the variable impact of difficult leadership across different organizational settings and warrant further investigation in future research.
Total Cost Analysis
As seen below and in Table 7, integrating all cost categories provided a comprehensive TCDL for each leader in the sample. Analysis of these total costs revealed:
- Cost Multiplier Range: As seen in Figure 5, the total annual cost of difficult leadership ranged from 3.2 to 27.3 times the leader's compensation, with a mean multiplier of 8.7x (SD=4.3, 95% CI: 7.4-10.0).
- Cost Category Distribution: Direct costs typically accounted for 35.7% of total costs (SD=7.2%), operational impacts for 39.2% (SD=8.4%), and cultural contagion for 25.1% (SD=6.8%).
- Industry Variation: As noted in testing Hypothesis 4, knowledge-intensive industries showed significantly higher cost multipliers.
- Positional Impact: As noted in testing Hypothesis 5, organizational level significantly predicted cost multiplier.
- Temporal Patterns: As seen in Figure 6, longitudinal analysis revealed non-linear cost accumulation over time, with an accelerating pattern as cultural contagion effects expanded. First-year costs averaged 63% of peak costs (SD=17%), with most leaders reaching maximum impact between months 18-36. Figure 5 illustrates this temporal pattern.
For a difficult leader earning 200,000 annually and managing a team of 15 professionals, the median total cost estimate was 1.74 million annually (95% CI: 1.26−1.26-1.26−2.22 million)—a multiplier of 8.7 times compensation.
Structural Equation Modeling of Impact Pathways
To test the proposed conceptual model of destructive leadership impact, structural equation modeling was conducted using AMOS software. The model incorporated the four destructive leadership dimensions as exogenous variables, psychological mechanisms (psychological safety, trust, engagement) as mediators, and organizational outcomes (turnover, innovation, collaboration) as endogenous variables.
As seen in Table 8 and Figure 7, the hypothesized model demonstrated good fit with the data (CFI = .92, RMSEA = .071, SRMR = .062), and significantly better fit than alternative models that proposed direct effects without mediation (ΔCFI = .09, χ² difference test p < .001). This analysis supports the conceptual model proposed earlier in Figure 1.
Table 8.
Structural Equation Modeling Results of Destructive Leadership Impact.
| Path | Standardized Coefficient (β) | Standard Error | p-value |
|---|---|---|---|
| Direct Effects: Leadership Dimensions to Mediating Mechanisms | |||
| Interpersonal Aggression → Psychological Safety | -0.47 | 0.06 | <.001 |
| Interpersonal Aggression → Trust | -0.33 | 0.07 | <.001 |
| Interpersonal Aggression → Engagement | -0.29 | 0.08 | <.01 |
| Status-Based Entitlement → Psychological Safety | -0.31 | 0.07 | <.001 |
| Status-Based Entitlement → Trust | -0.52 | 0.05 | <.001 |
| Status-Based Entitlement → Engagement | -0.27 | 0.08 | <.01 |
| Emotional Manipulation → Psychological Safety | -0.28 | 0.08 | <.01 |
| Emotional Manipulation → Trust | -0.38 | 0.07 | <.001 |
| Emotional Manipulation → Engagement | -0.44 | 0.06 | <.001 |
| Systemic Obstruction → Psychological Safety | -0.36 | 0.07 | <.001 |
| Systemic Obstruction → Trust | -0.34 | 0.07 | <.001 |
| Systemic Obstruction → Engagement | -0.31 | 0.07 | <.001 |
| Direct Effects: Leadership Dimensions to Organizational Outcomes | |||
| Systemic Obstruction → Collaboration | -0.49 | 0.06 | <.001 |
| Direct Effects: Mediating Mechanisms to Organizational Outcomes | |||
| Psychological Safety → Innovation | 0.52 | 0.06 | <.001 |
| Psychological Safety → Collaboration | 0.37 | 0.07 | <.001 |
| Trust → Collaboration | 0.46 | 0.06 | <.001 |
| Trust → Innovation | 0.29 | 0.08 | <.01 |
| Engagement → Turnover | -0.58 | 0.05 | <.001 |
| Engagement → Innovation | 0.24 | 0.08 | <.01 |
| Indirect Effects (Mediated Pathways) | |||
| Leadership Dimensions → Psychological Safety → Innovation | -0.38 | 0.07 | <.001 |
| Leadership Dimensions → Trust → Collaboration | -0.41 | 0.06 | <.001 |
| Leadership Dimensions → Engagement → Turnover | 0.34 | 0.07 | <.01 |
Note: For clarity, this table presents the primary paths in the model. The full model included control variables (organizational tenure, team size, industry) and covariances among exogenous variables. Leadership dimensions were measured using the D-LAB instrument; mediators and outcomes were assessed using established scales and objective organizational metrics.
Key findings from the structural equation model include:
- Psychological safety significantly mediated the relationship between destructive leadership and innovation outcomes (standardized indirect effect = -.38, p < .001)
- Trust significantly mediated the relationship between destructive leadership and collaboration (standardized indirect effect = -.41, p < .001)
- Engagement significantly mediated the relationship between destructive leadership and turnover (standardized indirect effect = .34, p < .01)
-
Different destructive leadership dimensions showed varying relationships with the mediating mechanisms:
- Interpersonal Aggression most strongly predicted reduced psychological safety (β = -.47, p < .001)
- Status-Based Entitlement most strongly predicted reduced trust (β = -.52, p < .001)
- Emotional Manipulation most strongly predicted reduced engagement (β = -.44, p < .001)
- Systemic Obstruction most strongly predicted reduced collaboration (β = -.49, p < .001)
These findings provide support for the proposed mechanisms through which destructive leadership generates organizational costs.
Intervention Efficacy Analysis
Longitudinal tracking of interventions (n=38 leaders with complete intervention data) revealed:
- Overall Success Rate: 31% of difficult leaders (95% CI: 26-36%) showed sustainable improvement through structured intervention, defined as moving below threshold scores on standardized measures and maintaining improvement for at least 12 months.
- Dimensional Effects: Success rates varied significantly by behavioral profile (χ²(3) = 11.42, p < .01, φ = .42). Leaders scoring high on a single dimension showed higher success rates (47%, 95% CI: 39-55%) compared to those with multiple problematic dimensions (22%, 95% CI: 17-27%).
- Intervention Type Effects: As seen in Figure 8, controlling for dimensional profile, certain intervention approaches showed higher efficacy (F(3,34) = 7.82, p < .01, η² = .27). Combined approaches incorporating structured feedback, executive coaching, and compensation consequences showed the highest success rates (42%, 95% CI: 36-48%).
- Temporal Patterns: Interventions showing no measurable improvement within 4-6 months rarely succeeded long-term. Organizations extending intervention attempts beyond 9 months without clear improvement showed diminishing returns and increasing collateral damage.
- Recovery Trajectories: Following successful interventions or leader replacement, teams showed distinct recovery patterns across metrics, as illustrated in Table 8 and Figure 9. Turnover and absenteeism typically normalized within 4-6 months, operational metrics within 9-12 months, and cultural/trust metrics within 12-18 months.
As seen in Table 9, the differential success rates based on dimensional profile suggest that interventions should be tailored to specific leadership patterns rather than applying one-size-fits-all approaches. For leaders with primarily Interpersonal Aggression dimensions, behavioral coaching focused on communication skills showed the highest efficacy (51%, 95% CI: 43-59%). For those with primarily Status-Based Entitlement dimensions, approaches that combined feedback with structural accountability mechanisms were most effective (48%, 95% CI: 40-56%).
Figure 9.
Recovery Trajectories Following Intervention. Note: Line graph showing recovery patterns across different metrics following successful intervention or leader replacement. Note that turnover normalizes within 4-6 months, while cultural/trust metrics require 12-18 months for recovery.
Figure 9.
Recovery Trajectories Following Intervention. Note: Line graph showing recovery patterns across different metrics following successful intervention or leader replacement. Note that turnover normalizes within 4-6 months, while cultural/trust metrics require 12-18 months for recovery.
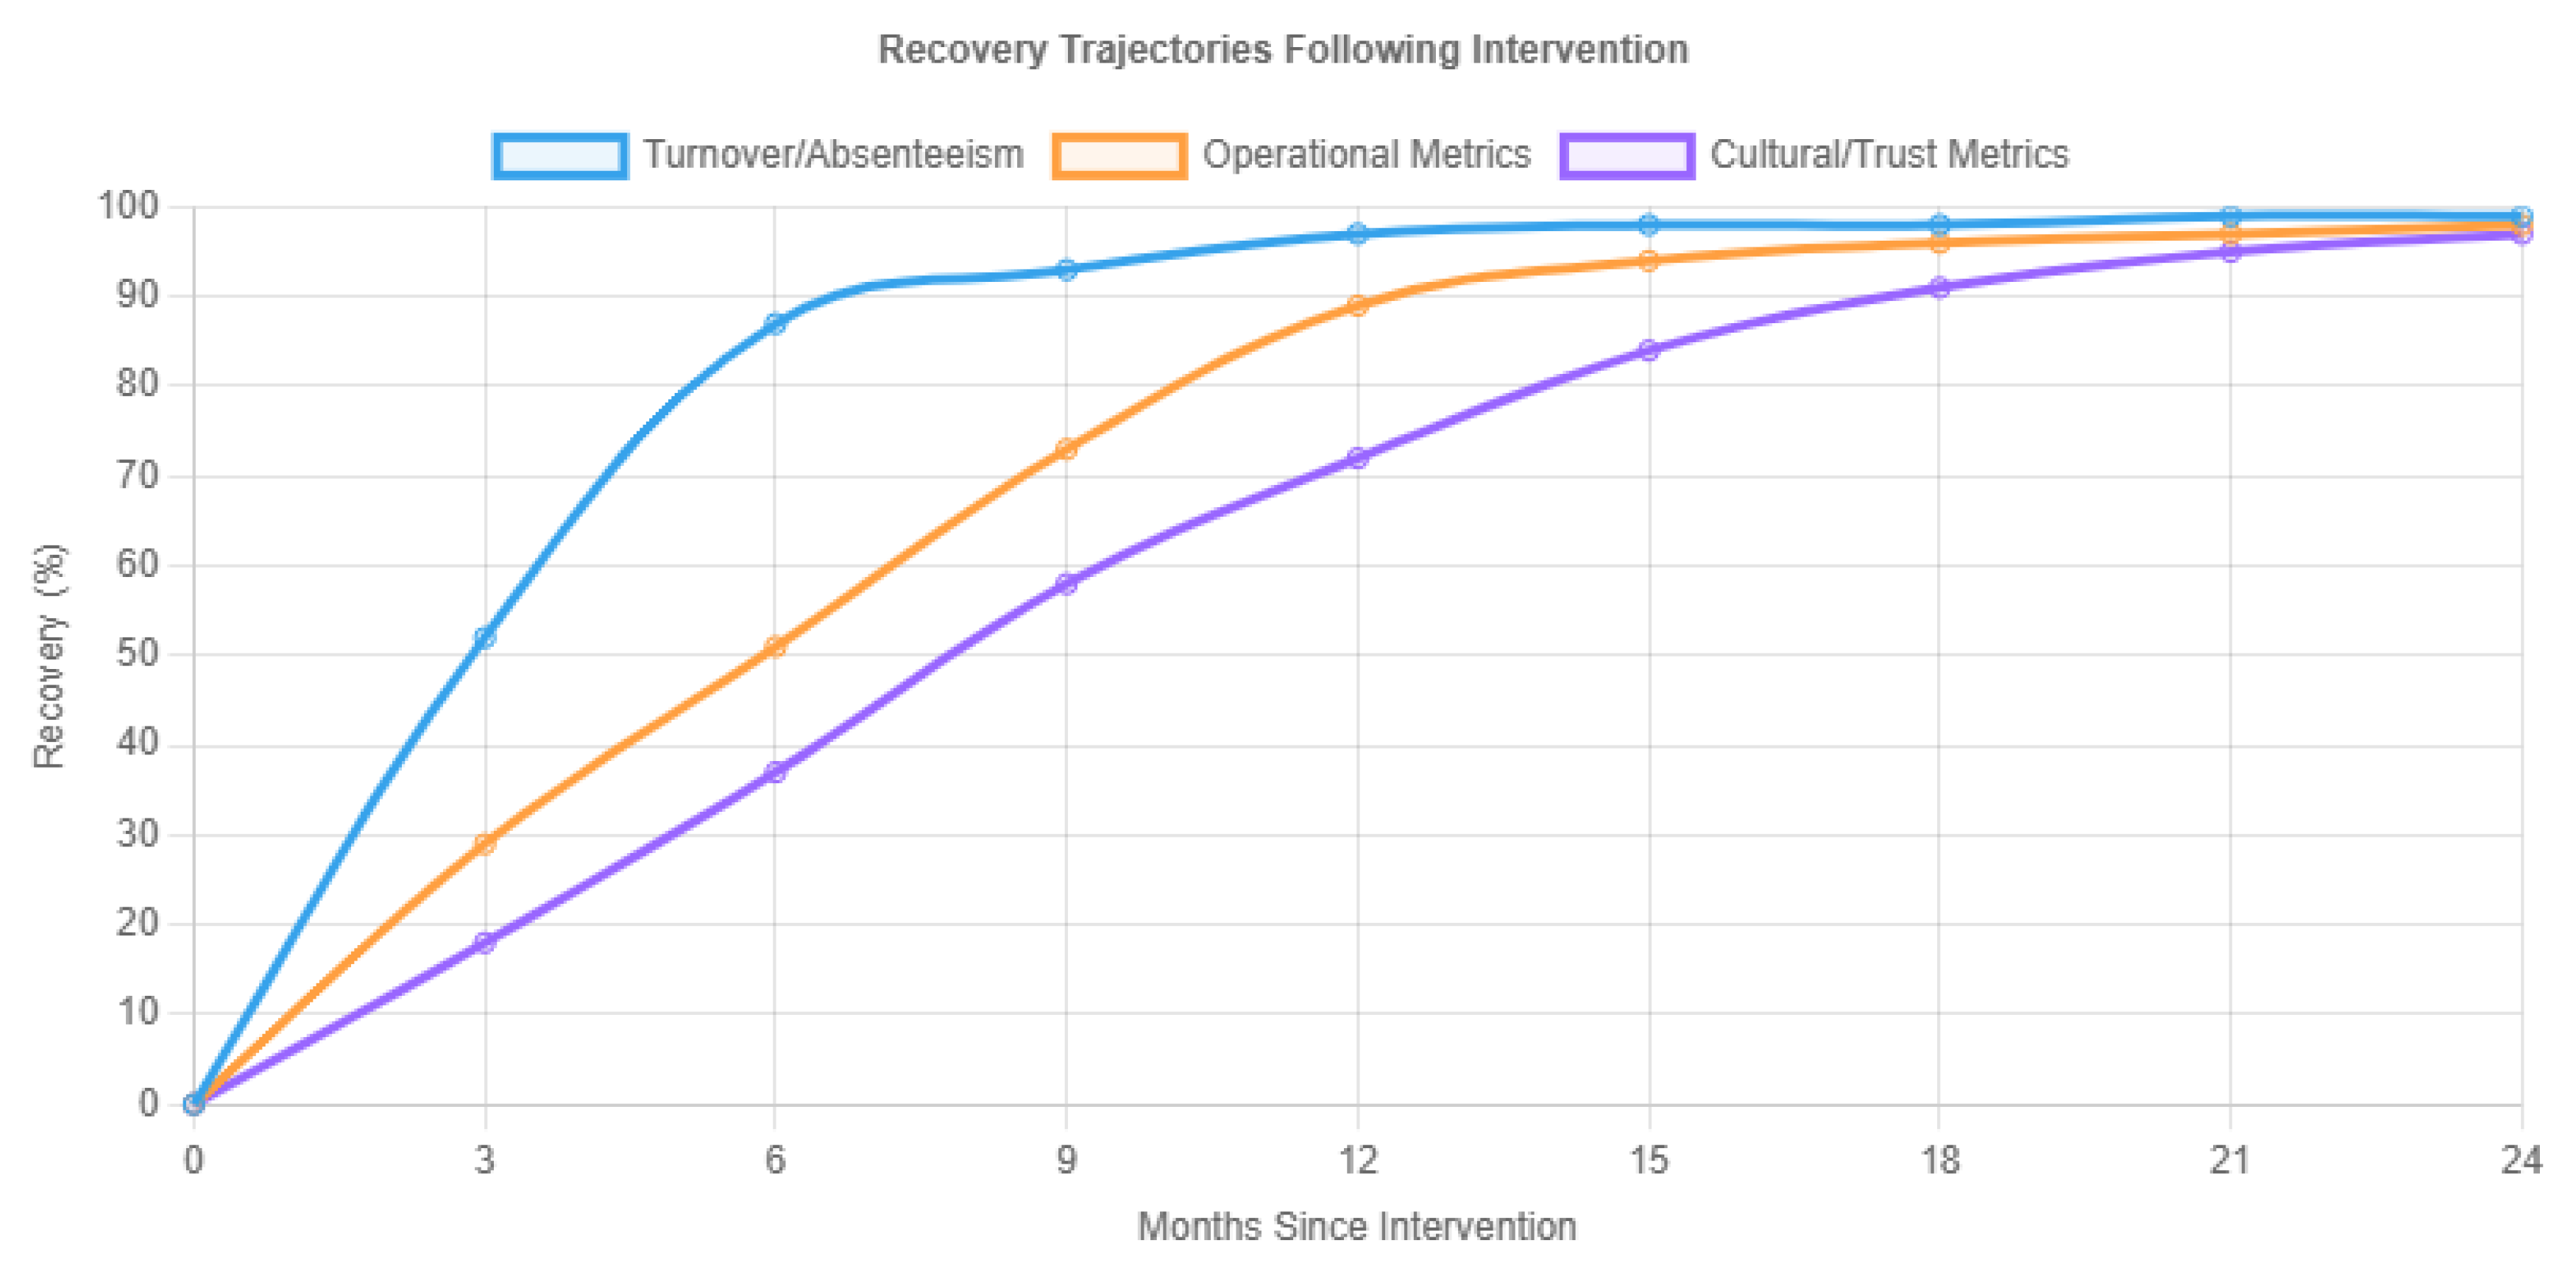
Table 8.
Recovery Trajectories Following Intervention or Leader Replacement.
| Time Period | Turnover Normalization (% Recovery) | Operational Metrics (% Recovery) | Cultural/Trust Metrics (% Recovery) |
|---|---|---|---|
| 1-3 months | 52% (SD=16%) | 29% (SD=14%) | 18% (SD=9%) |
| 4-6 months | 87% (SD=11%) | 51% (SD=17%) | 37% (SD=13%) |
| 7-9 months | 93% (SD=7%) | 73% (SD=15%) | 58% (SD=16%) |
| 10-12 months | 97% (SD=4%) | 89% (SD=10%) | 72% (SD=14%) |
| 13-18 months | 98% (SD=3%) | 96% (SD=5%) | 91% (SD=8%) |
| 19-24 months | 99% (SD=2%) | 98% (SD=3%) | 97% (SD=4%) |
Table 9.
Intervention Efficacy by Difficult Leadership Profile and Approach.
| Category | Success Rate | 95% CI | Statistical Test |
|---|---|---|---|
| Overall Success Rate | 31% | 26-36% | - |
| By Dimensional Profile | χ²(3) = 11.42, p < .01, φ = .42 | ||
| Single dimension | 47% | 39-55% | - |
| Multiple dimensions | 22% | 17-27% | - |
| By Primary Dimension | χ²(3) = 8.74, p < .05, φ = .38 | ||
| Systemic Obstruction | 42% | 33-51% | - |
| Status-Based Entitlement | 33% | 25-41% | - |
| Interpersonal Aggression | 27% | 20-34% | - |
| Emotional Manipulation | 21% | 14-28% | - |
| By Intervention Type | F(3,34) = 7.82, p < .01, η² = .27 | ||
| Comprehensive (feedback + coaching + consequences) | 42% | 36-48% | - |
| Coaching + feedback | 34% | 28-40% | - |
| Feedback only | 23% | 17-29% | - |
| Coaching only | 19% | 13-25% | - |
These findings have significant implications for organizations seeking to address difficult leadership, suggesting that both intervention design and decision timing should be informed by specific dimensional profiles and early response indicators.
Qualitative Insights: Mechanisms of Impact
Thematic analysis of qualitative data provided deeper insight into the mechanisms through which destructive leadership generates organizational costs. Key themes included:
-
Psychological withdrawal: Team members described a process of gradual disengagement to protect themselves emotionally:"You learn to just shut down. Don't offer ideas, don't take risks, don't attract attention. Do the minimum necessary and focus your energy elsewhere. It's sad because I used to love this job."
-
Defensive routines: Teams developed elaborate systems to manage interactions with difficult leaders:"We have informal warning systems when he's in a bad mood. People text each other 'weather alerts' so everyone can prepare. We spend hours preparing for simple meetings because the cost of being unprepared is so high."
-
Knowledge hoarding: Difficult leadership created environments where information became currency:"Nobody shares what they know because knowledge is protection. If you're the only one who understands a critical system, you're safer from attack and more valuable to the team."
-
Reputation ripple effects: The impact on organizational reputation extended beyond immediate recruitment:"Candidates would research our company online before interviews and specifically ask if they'd be working in [difficult leader's] department. Our recruiter started avoiding mentioning the department name in job postings."
-
Recovery challenges: The persistence of effects after addressing difficult leadership:"Even six months after he left, people were still hesitant to speak up in meetings. It was like everyone had PTSD and was waiting for the other shoe to drop."
These qualitative insights complement the quantitative findings, providing richer understanding of the mechanisms through which destructive leadership generates organizational costs.
Discussion
Theoretical Implications
This research makes several important contributions to the literature on destructive leadership. First, it empirically validates a multidimensional conceptualization of difficult leadership that aligns with but extends existing theoretical constructs. The identification of four distinct dimensions—interpersonal aggression, status-based entitlement, emotional manipulation, and systemic obstruction—provides a more nuanced framework than unitary constructs like "abusive supervision" or "toxic leadership."
This dimensional approach helps resolve theoretical tensions between trait-based and behavioral perspectives on destructive leadership. The findings suggest that while destructive leadership often manifests as a syndrome with multiple dimensions, the specific dimensional profile varies across leaders. This indicates that different underlying mechanisms (both dispositional traits and contextual factors) may drive different manifestations of destructive leadership.
Second, the research establishes empirical links between these leadership dimensions and specific organizational costs through identified mediating mechanisms. The structural equation modeling results support a process model in which destructive leadership behaviors undermine psychological safety, trust, and engagement, which in turn affect organizational outcomes including innovation, collaboration, and turnover. This advances understanding beyond simple associations to identify specific pathways through which destructive leadership impacts organizational functioning.
Third, the longitudinal analysis offers insights into the temporal dynamics of destructive leadership impact, demonstrating non-linear cost accumulation and persistence of effects even after leadership changes. This temporal perspective addresses a significant gap in the literature, which has predominantly relied on cross-sectional designs that cannot capture these dynamic effects. The finding that different types of impacts follow different recovery trajectories has important implications for both theory and practice.
Fourth, the research contributes to contingency theories of leadership by identifying significant moderating factors that influence the relationship between destructive leadership and organizational costs. The finding that knowledge intensity and organizational level moderate these relationships suggests that the impact of destructive leadership is not uniform but depends on contextual factors that amplify or attenuate its effects.
Finally, the intervention efficacy analysis contributes to the limited empirical literature on addressing destructive leadership. The finding that approximately one-third of difficult leaders showed sustainable improvement through structured intervention provides a more optimistic perspective than prevailing assumptions, while still acknowledging the significant challenges in modifying established behavioral patterns. The identification of factors that predict intervention success (dimensional profile, intervention type) advances both theory and practice in leadership development.
Integration with Existing Theoretical Frameworks
The findings of this research can be integrated with several established theoretical frameworks:
- Conservation of Resources Theory: The results align with Hobfoll's (1989) conservation of resources theory, which proposes that stress occurs when individuals experience actual or threatened loss of valued resources. Destructive leadership creates conditions of chronic resource threat and depletion, leading to psychological withdrawal, reduced discretionary effort, and ultimately turnover.
- Affective Events Theory: Weiss and Cropanzano's (1996) affective events theory helps explain how discrete destructive leadership behaviors accumulate over time to generate sustained negative emotional responses, which in turn drive employee attitudes and behaviors. The temporal patterns observed in this research, particularly the acceleration of impacts over time, align with this theoretical framework.
- Social Learning Theory: Bandura's (1977) social learning theory provides a framework for understanding the cultural contagion effects observed in this research. The finding that middle managers under difficult leaders were more likely to adopt similar behaviors supports the role of observational learning and modeling in the spread of destructive leadership patterns.
- Social Exchange Theory: The mediating role of trust in the relationship between destructive leadership and organizational outcomes aligns with social exchange theory (Blau, 1964). Destructive leadership behaviors violate the norms of reciprocity and fairness that underlie effective social exchange, leading to diminished trust and reduced employee contribution.
These theoretical integrations suggest that destructive leadership impacts organizations through multiple complementary mechanisms, requiring a multi-level theoretical approach that addresses individual, team, and organizational processes.
Practical Implications
From a practical perspective, this research offers several actionable insights for organizations. The TCDL framework provides a structured approach for calculating the comprehensive costs of difficult leadership, enabling more informed decision-making regarding retention, development, or replacement of problematic leaders.
The finding that difficult leaders typically generate costs between 3-27 times their annual compensation (mean multiplier 8.7x) creates a compelling financial case for addressing these behaviors rather than tolerating them based on technical contributions or short-term results. This quantification helps overcome the common organizational tendency to underestimate the full impact of destructive leadership.
The research also provides guidance for specific industry contexts. Organizations in knowledge-intensive industries (technology, professional services) should be particularly vigilant about destructive leadership given the higher cost multipliers in these contexts. Manufacturing and other process-driven industries still experience significant costs but may have somewhat greater tolerance for certain dimensions of difficult leadership.
The differential success rates for intervention based on behavioral profiles and intervention approaches provides guidance for more targeted development efforts. Organizations can improve intervention outcomes by:
- Conducting dimensional assessment rather than treating destructive leadership as a unitary construct
- Focusing intervention resources on leaders with single-dimension difficulties
- Implementing comprehensive intervention approaches that combine feedback, coaching, and consequences
- Establishing clear timelines with measurable improvement milestones
- Making decisive changes when interventions do not show progress within 4-6 months
The documented recovery trajectories following successful interventions or leader replacement help organizations establish realistic expectations for improvement. The finding that cultural and trust metrics typically take 12-18 months to fully recover highlights the importance of sustained attention to team dynamics even after the immediate leadership issue is addressed.
Finally, the research suggests that prevention may be more effective than remediation. Organizations should consider:
- More sophisticated selection processes that screen for destructive tendencies
- Early detection systems using periodic pulse surveys and network analysis
- Clear organizational norms and consequences regarding leadership behavior
- Leadership development that specifically addresses the four dimensions of destructive leadership
- Organizational systems that don't inadvertently reward or enable destructive behaviors
Industry-Specific Recommendations
Based on the significant industry variations observed in this research, the following industry-specific recommendations are offered:
Technology and Professional Services: sensitivity to innovation deficits and collaboration breakdowns. Recommendations include:
- Implement regular psychological safety assessments in teams
- Develop early warning systems focused on innovation metrics and collaboration patterns
- Consider team-based performance metrics that counter individual achievement focus
- Address Status-Based Entitlement dimensions particularly aggressively
- Focus on preserving trust networks which are critical to knowledge sharing
Healthcare: Healthcare organizations showed high sensitivity to trust erosion and emotional manipulation dimensions. Recommendations include:
- Implement structured communication protocols that reduce emotional volatility
- Focus on interdisciplinary collaboration which is particularly vulnerable to difficult leadership
- Monitor patient safety metrics as early warning signs of destructive leadership impact
- Address Emotional Manipulation dimensions as highest priority
- Consider the unique regulatory environment when designing interventions
Financial Services: Financial organizations showed particular vulnerability to decision quality impacts and compliance risks. Recommendations include:
- Implement decision quality reviews that can detect problematic patterns
- Focus on compliance metrics as early indicators of leadership issues
- Address Systemic Obstruction dimensions particularly aggressively
- Consider the interaction between incentive systems and destructive leadership
- Monitor cross-selling effectiveness as an indicator of collaboration breakdown
Manufacturing: Manufacturing showed lower but still significant cost multipliers (mean = 6.4) with particular vulnerability to safety issues and process breakdowns. Recommendations include:
- Monitor safety incidents and near-misses as early indicators
- Focus on continuous improvement submission rates to detect innovation deficits
- Address Interpersonal Aggression dimensions as highest priority
- Consider production floor observation as part of leadership assessment
- Implement standard work processes for leadership behaviors
Limitations and Future Research
This research has several important limitations that should inform both interpretation and future investigation. First, despite efforts to establish appropriate comparison groups and control for confounding variables, definitively establishing causality between leadership behavior and organizational outcomes remains challenging in field settings. While the longitudinal design, matched comparisons, and statistical controls strengthen causal inference, alternative explanations cannot be completely ruled out. Future research could strengthen causal inference through experimental designs where possible or more sophisticated statistical approaches like instrumental variable analysis.
Second, the sample, while diverse in terms of industries and organizational levels, remains predominantly Western in its cultural composition. The extent to which these findings generalize to other cultural contexts, particularly those with different power distance orientations (Hofstede, 2001), remains an open question. Cross-cultural research on the TCDL framework would significantly enhance its generalizability.
Third, the intervention efficacy analysis, while providing valuable insights, does not constitute a controlled intervention study. The lack of random assignment to intervention conditions limits the strength of conclusions regarding intervention efficacy. Future research could employ more rigorous experimental designs to test specific intervention approaches and identify the active ingredients in successful behavioral change efforts.
Fourth, this research focused primarily on the costs of difficult leadership rather than potential contextual benefits. Some research suggests that certain forms of demanding leadership may be beneficial in specific contexts such as crisis situations (Waldman et al., 2001) or when addressing persistent underperformance. Future research could explore these contextual contingencies to develop a more nuanced understanding of when and how different leadership approaches may be appropriate.
Fifth, while the research identified moderating factors related to industry and organizational level, other potential moderators received less attention. Team composition, organizational culture, governance structures, and individual follower characteristics might all moderate the relationship between destructive leadership and organizational costs. Future research could explore these additional contingency factors more systematically.
Several promising directions for future research emerge from these limitations and findings:
- Cross-cultural Investigation: Expanding research to diverse cultural contexts to understand how different cultural dimensions moderate both the expression and impact of difficult leadership.
- Intervention Experiments: Conducting more controlled studies of specific intervention approaches to establish clearer evidence for efficacy.
- Preventive Approaches: Investigating organizational systems and selection methods that reduce the incidence of difficult leadership.
- Technological Measurement: Exploring how emerging workplace analytics and passive data collection might provide earlier detection of destructive leadership patterns.
- Ethical Frameworks: Developing more nuanced ethical approaches to balancing organizational needs, leadership development opportunities, and employee wellbeing.
- Remote and Hybrid Work Contexts: Investigating how destructive leadership manifests and impacts organizations in remote and hybrid work arrangements, which may present both new challenges and potential buffering effects.
- Team Leadership and Shared Leadership: Extending the TCDL framework to team leadership and shared leadership contexts to understand how destructive dynamics might operate in more distributed leadership structures.
Conclusion
This research provides empirical evidence for the substantial organizational costs associated with destructive leadership behaviors. Through a mixed-methods, longitudinal approach, the study establishes the Total Cost of Difficult Leaders (TCDL) framework as a comprehensive method for quantifying these impacts across direct financial costs, operational impacts, and cultural contagion effects.
The findings demonstrate that difficult leaders typically generate costs between 3-27 times their annual compensation (mean multiplier 8.7x), with particularly severe impacts in knowledge-intensive industries and at higher organizational levels. The costs accumulate through multiple pathways including increased turnover, reduced innovation, impaired decision quality, diminished collaboration, and cultural erosion.
The research validates a four-dimensional model of destructive leadership—comprising interpersonal aggression, status-based entitlement, emotional manipulation, and systemic obstruction—and demonstrates how these dimensions affect organizations through different mediating mechanisms. It also identifies significant moderating factors that influence the strength of these relationships, providing a more nuanced understanding of destructive leadership impact.
Intervention approaches show mixed success, with approximately one-third of difficult leaders demonstrating sustainable improvement through structured development efforts. Success rates are higher for those exhibiting single-dimension difficulties and when comprehensive intervention approaches are employed. The research also documents recovery trajectories following successful interventions or leader replacement, providing guidance for organizations addressing these challenges.
For both scholars and practitioners, these findings underscore the importance of addressing destructive leadership as a strategic organizational priority rather than merely an interpersonal challenge. By quantifying and addressing the total cost of difficult leadership, organizations can make more informed decisions that enhance both financial performance and organizational culture.
Appendix A: Destructive Leadership Assessment Battery (D-LAB)
- Survey Instructions:
- This survey is part of a research study on leadership behaviors and organizational impacts. Your responses are confidential and will be combined with those of other participants. Please respond to each statement based on your experiences with your current supervisor over the past 6 months. Rate each statement on a scale from 1 (Strongly Disagree) to 5 (Strongly Agree).
- Section 1: Interpersonal Aggression Dimension
-
(Adapted from Tepper's (2000) Abusive Supervision Scale)
- My supervisor ridicules me in front of others.
- My supervisor tells me my thoughts or feelings are stupid.
- My supervisor puts me down in front of others.
- My supervisor makes negative comments about me to others.
- My supervisor tells me I'm incompetent.
- My supervisor speaks to me in a hostile tone of voice.
- My supervisor blames me to save himself/herself embarrassment.
- My supervisor expresses anger at me when he/she is mad for another reason.
- My supervisor makes me feel inadequate compared to colleagues.
- My supervisor uses intimidation tactics when providing feedback.
- Section 2: Status-Based Entitlement Dimension
-
(Adapted from Ashforth's (1994) Petty Tyranny Scale)
- My supervisor has one set of standards for themselves and another for others.
- My supervisor expects special treatment or privileges that others don't receive.
- My supervisor takes credit for successes but blames others for failures.
- My supervisor believes rules apply to others but not to themselves.
- My supervisor makes decisions that benefit themselves over the team or organization.
- My supervisor expects immediate response to their requests regardless of others' priorities.
- My supervisor interrupts others but becomes defensive if interrupted.
- My supervisor expects deferential treatment based on their position.
- My supervisor dismisses others' expertise when it conflicts with their views.
- My supervisor's needs consistently take priority over team needs.
- Section 3: Emotional Manipulation Dimension
-
(Adapted from Schmidt's (2008) Toxic Leadership Scale)
- My supervisor's mood unpredictably affects our team's functioning.
- My supervisor makes me feel guilty when I cannot meet their expectations.
- My supervisor plays favorites among team members.
- My supervisor expects me to manage their emotions as part of my job.
- My supervisor uses excessive praise followed by criticism to keep me off-balance.
- My supervisor acts differently in front of their superiors than with our team.
- My supervisor manipulates others to achieve personal goals.
- My supervisor creates emotional crises that disrupt workflow.
- My supervisor uses others' emotions to accomplish their objectives.
- My supervisor's approval is unpredictable and seems arbitrary.
- Section 4: Systemic Obstruction Dimension
-
(Adapted from Einarsen's (2007) Destructive Leadership Questionnaire)
- My supervisor creates unnecessary obstacles that make it difficult to get work done.
- My supervisor withholds information needed to complete tasks effectively.
- My supervisor changes directions or priorities without adequate explanation.
- My supervisor delays decisions in ways that impede progress.
- My supervisor creates excessive bureaucracy for routine processes.
- My supervisor prevents direct communication between team members and other departments.
- My supervisor blocks access to resources needed for effective performance.
- My supervisor fails to represent team needs to higher management.
- My supervisor creates unnecessary approval processes that slow work.
- My supervisor actively prevents positive changes or innovations.
- Section 5: Organizational Impact Indicators
- (Developed for this research)
-
Psychological Safety
- In our team, it's safe to take risks.
- Team members can bring up problems and tough issues.
- No one on this team would deliberately act in a way that undermines my efforts.
- It is difficult to ask other members of this team for help. (R)
- Working with members of this team, my unique skills and talents are valued and utilized.
-
Team Trust
- There is a high level of trust between team members.
- Team members trust our supervisor to represent our interests accurately.
- Our supervisor trusts team members to make appropriate decisions.
- Team members believe that our supervisor's words align with their actions.
- Our supervisor demonstrates trust in team members' capabilities.
-
Engagement
- At work, I feel energized.
- I find the work that I do full of meaning and purpose.
- Time flies when I'm working.
- I feel enthusiastic about my job.
- When I get up in the morning, I feel like going to work.
-
Collaboration
- Team members regularly collaborate across functional boundaries.
- Information is freely shared among team members.
- Team members can count on each other when they need help.
- Other departments willingly collaborate with our team.
- Our team effectively coordinates work with other departments.
-
Innovation Climate
- New ideas are welcomed in our team.
- Team members are encouraged to find new ways of solving problems.
- Our team regularly implements improvements to work processes.
- Team members feel safe to experiment with new approaches.
- Our team is known for generating innovative solutions.
Section 6: Organizational Costs
(For HR/Management completion)
-
Turnover Metrics
- Annual voluntary turnover rate for this team: _____%
- Average cost per departure (recruitment, training, etc.): $_____
- Average time to fill vacancies in this team: _____ days
- Percentage of positions currently vacant: _____%
- Average tenure of team members: _____ years
-
Absenteeism/Presenteeism
- Average unplanned absence days per employee annually: _____ days
- Percentage change in absenteeism over past year: _____% (increase/decrease)
- Utilization rate of Employee Assistance Program: _____%
- Stress-related health claims (number in past year): _____
- Estimated productivity level of present employees (0-100%): _____%
-
Legal/Compliance
- Number of formal complaints filed in past year: _____
- Number of external legal consultations required: _____
- Number of settlements reached: _____
- Direct costs of legal/compliance issues: $_____
- Estimated hours spent on investigation/remediation: _____ hours
Appendix B: Semi-Structured Interview Protocol for Direct Reports
- Introduction:
- Thank you for participating in this research study on leadership and organizational effectiveness. This interview will take approximately 60 minutes. Your responses will remain confidential, and results will be aggregated and anonymized. This research aims to understand how leadership behaviors affect organizational outcomes. Do you have any questions before we begin?
-
Background Questions:
- How long have you worked with your current supervisor?
- What is your role in the organization?
- How would you describe the general working environment in your team?
-
Leadership Behavior Experience:
- 4.
- Could you describe your supervisor's typical approach to leading the team?
- 5.
- What aspects of your supervisor's leadership style work well for the team?
- 6.
- What aspects of your supervisor's leadership style create challenges for the team?
- 7.
- How would you describe your supervisor's communication style?
- 8.
- How does your supervisor typically handle disagreement or conflict?
- 9.
- How consistent is your supervisor's behavior across different situations?
-
Interpersonal Dynamics:
- 10.
- How would you characterize the way your supervisor interacts with team members?
- 11.
- Does your supervisor treat all team members consistently? If not, how does treatment differ?
- 12.
- How does your supervisor typically provide feedback on performance?
- 13.
- How does your supervisor respond when team members make mistakes?
- 14.
- How comfortable do you feel approaching your supervisor with problems or concerns?
-
Work Environment Impact:
- 15.
- How would you describe the level of psychological safety in your team?
- 16.
- To what extent do team members share information and collaborate effectively?
- 17.
- How would you describe team morale and engagement levels?
- 18.
- How does your supervisor's approach affect innovation and creative thinking in your team?
- 19.
- How are decisions typically made in your team?
-
Organizational Consequences:
- 20.
- How has your supervisor's leadership approach affected team performance?
- 21.
- Have you observed changes in absenteeism or turnover that might relate to leadership?
- 22.
- How does your supervisor's approach affect collaboration with other departments?
- 23.
- Have you observed impacts on team members' health or well-being?
- 24.
- How has your supervisor's leadership affected your own motivation and job satisfaction?
-
Adaptation and Coping:
- 25.
- How do team members typically adapt to or cope with leadership challenges?
- 26.
- What strategies have you found effective in working with your supervisor?
- 27.
- What organizational supports exist for addressing leadership concerns?
- 28.
- How have leadership challenges affected team dynamics or relationships?
-
Improvements and Interventions:
- 29.
- What changes in leadership approach would most benefit your team?
- 30.
- What organizational changes might help address leadership challenges?
- 31.
- What specific interventions do you believe would be most effective?
- 32.
- How might the organization better measure leadership effectiveness?
-
Closing:
- 33.
- Is there anything else about leadership impact that you think is important for us to understand?
- 34.
- Do you have any questions about this research or how the information will be used?
Thank you for your time and candid responses. Your insights are valuable to our understanding of leadership impacts.
Appendix C: Focus Group Protocol: Team Dynamics and Leadership Impact
-
Introduction (10 minutes):
- Welcome participants and thank them for their time
- Explain the purpose of the focus group: to understand how leadership behaviors affect team dynamics and organizational outcomes
- Review confidentiality procedures and ground rules
- Obtain consent and explain recording procedures
- Participant introductions (first name only)
-
Team Climate and Psychological Safety (20 minutes):
- How would you describe the general atmosphere in your team?
- To what extent do team members feel comfortable speaking up about concerns?
- How are mistakes or failures typically handled within the team?
- What enables or inhibits open communication within the team?
- How would you characterize trust levels within the team?
-
Leadership Influence on Team Functioning (25 minutes):
- 6.
- How does your team leader's approach influence day-to-day team operations?
- 7.
- What leadership behaviors have the most positive impact on team effectiveness?
- 8.
- What leadership behaviors create challenges for team functioning?
- 9.
- How does leadership affect collaboration within the team?
- 10.
- How consistent is leadership behavior across different situations or team members?
-
Organizational Impacts (20 minutes):
- 11.
- How does your team's leadership affect work engagement and motivation?
- 12.
- What impacts have you observed on innovation and problem-solving?
- 13.
- How has leadership influenced turnover or retention within the team?
- 14.
- What effects have you noticed on cross-functional collaboration?
- 15.
- How does leadership influence the team's alignment with organizational goals?
-
Coping Strategies and Adaptation (20 minutes):
- 16.
- How do team members typically respond to leadership challenges?
- 17.
- What strategies have proven effective in navigating difficult leadership situations?
- 18.
- How has the team adapted its processes or communication approaches?
- 19.
- What organizational resources or supports have been helpful?
- 20.
- How have leadership dynamics affected team members' well-being?
-
Improvement Opportunities (15 minutes):
- 21.
- What changes would most improve team effectiveness?
- 22.
- How might the organization better support effective leadership?
- 23.
- What metrics would best capture leadership impact on the team?
- 24.
- What interventions do you believe would be most beneficial?
-
Closing (10 minutes):
- 25.
- What other aspects of leadership impact should we understand?
- 26.
- Summary of key points discussed
- 27.
- Next steps in the research process
- 28.
- Thank participants and provide contact information for follow-up
Appendix D: Exit Interview Protocol: Leadership Impact Assessment
- Introduction:
This exit interview includes questions about your experience with leadership as part of our ongoing efforts to improve organizational effectiveness. Your candid feedback is valuable and will be kept confidential. Information will be aggregated and anonymized for research purposes.
-
Employment Experience:
- How long have you worked in your current position?
- How long have you worked with your current supervisor?
- What aspects of your job did you find most satisfying?
- What aspects of your job did you find most challenging?
-
Leadership Experience:
- 5.
- How would you describe your supervisor's leadership style?
- 6.
- What aspects of your supervisor's approach were most effective?
- 7.
- What aspects of your supervisor's approach created challenges?
- 8.
- How did your supervisor handle feedback or concerns?
- 9.
- How would you characterize communication within your team?
- 10.
- How did leadership affect team morale and engagement?
-
Decision to Leave:
- 11.
- What primary factors influenced your decision to leave?
- 12.
- To what extent did leadership play a role in your decision?
- 13.
- What changes might have influenced you to stay with the organization?
- 14.
- How did leadership affect your job satisfaction and engagement?
- 15.
- Were there specific leadership incidents that significantly influenced your decision?
-
Organizational Impact:
- 16.
- How did leadership affect your ability to perform effectively?
- 17.
- How would you describe the impact of leadership on team innovation?
- 18.
- How did leadership influence collaboration within the team?
- 19.
- What effects did you observe on other team members?
- 20.
- How might leadership changes improve team effectiveness?
-
Additional Insights:
- 21.
- What other feedback about leadership would be helpful for the organization to know?
- 22.
- What recommendations would you make for improving leadership effectiveness?
- 23.
- Is there anything else you'd like to share about your experience?
Thank you for your candid feedback. This information will help us improve our organization.
Appendix E: Organizational Network Analysis Survey
- Instructions:
- This survey examines communication and collaboration patterns within your organization. Your responses will help us understand how work relationships function and identify opportunities for improvement. All responses are confidential and will be reported only in aggregated form.
- Section 1: Information Sharing Network
- For each person listed below, please indicate how frequently you typically exchange work-related information with them:
- 0 = Never
- 1 = Rarely (a few times per year)
- 2 = Occasionally (monthly)
- 3 = Regularly (weekly)
- 4 = Frequently (daily)
- [List of all team members and key organizational contacts]
- Section 2: Problem-Solving Network
- For each person listed below, please indicate how likely you are to approach them when you need help solving a work-related problem:
- 0 = Never approach this person
- 1 = Rarely approach this person
- 2 = Sometimes approach this person
- 3 = Often approach this person
- 4 = This person is among my first choices for help
- [List of all team members and key organizational contacts]
- Section 3: Trust Network
- For each person listed below, please indicate your level of professional trust in them:
- 0 = Do not trust this person with sensitive information
- 1 = Limited trust in this person
- 2 = Moderate trust in this person
- 3 = Strong trust in this person
- 4 = Complete trust in this person
- [List of all team members and key organizational contacts]
- Section 4: Innovation Network
- For each person listed below, please indicate how likely you are to discuss new ideas or approaches with them:
- 0 = Never discuss new ideas with this person
- 1 = Rarely discuss new ideas with this person
- 2 = Sometimes discuss new ideas with this person
- 3 = Often discuss new ideas with this person
- 4 = This person is among my first choices for discussing new ideas
- [List of all team members and key organizational contacts]
- Section 5: Collaboration Barriers
- Please rate the following potential barriers to effective collaboration in your team:
-
(1 = Not a barrier, 5 = Significant barrier)
- Time constraints
- Physical/geographical separation
- Organizational structure
- Technical systems or tools
- Leadership approach
- Team climate or culture
- Skill or knowledge gaps
- Role clarity or boundaries
- Competing priorities
- Other (please specify): _________________
- Section 6: Cross-Team Collaboration
- For each department listed below, please indicate how effectively your team collaborates with them:
- 0 = No collaboration
- 1 = Minimal collaboration with significant challenges
- 2 = Some collaboration with moderate challenges
- 3 = Good collaboration with minor challenges
- 4 = Excellent collaboration with few challenges
- [List of relevant departments/teams]
Appendix F: TCDL Implementation Guide for Organizations
- Purpose:
This guide provides a structured approach for organizations to implement the Total Cost of Difficult Leaders (TCDL) framework. The implementation process is designed to identify, measure, and address the comprehensive costs associated with destructive leadership behaviors.
- Phase 1: Assessment Setup (4-6 weeks)
-
Step 1: Establish the Implementation Team
- Identify key stakeholders (HR, Finance, Operations, Legal)
- Define roles and responsibilities
- Establish governance structure and reporting relationships
- Secure executive sponsorship and support
-
Step 2: Define Measurement Parameters
- Select appropriate assessment instruments
- Determine data collection methods and frequency
- Establish baseline measurements
- Define comparison groups or benchmarks
- Create data management and confidentiality protocols
-
Step 3: Communication Planning
- Develop communication strategy for all stakeholders
- Create messaging that emphasizes improvement rather than blame
- Establish feedback mechanisms for participants
- Address potential concerns about confidentiality and use of data
- Phase 2: Data Collection and Analysis (8-12 weeks)
-
Step 4: Leadership Behavior Assessment
- Deploy the Destructive Leadership Assessment Battery (D-LAB)
- Conduct structured interviews with key stakeholders
- Implement organizational network analysis
- Gather historical HR data (turnover, absenteeism, complaints)
- Collect operational performance metrics
-
Step 5: Cost Calculation
- Calculate direct financial costs (turnover, absenteeism, legal)
- Estimate operational impact costs (innovation, decision quality, collaboration)
- Assess cultural contagion costs (behavior modeling, reputation, trust)
- Develop comprehensive cost profiles for each leader
- Validate calculations with relevant stakeholders
-
Step 6: Analysis and Reporting
- Identify patterns and high-impact areas
- Develop organization-specific cost models
- Create executive summary reports
- Prepare detailed analysis for intervention planning
- Establish ongoing monitoring metrics
- Phase 3: Intervention and Monitoring (12-18 months)
-
Step 7: Intervention Planning
- Develop targeted intervention strategies based on leadership profiles
- Create intervention selection criteria
- Establish clear improvement metrics and timelines
- Secure resources for implementation
- Develop contingency plans for unsuccessful interventions
-
Step 8: Implementation
- Deploy appropriate interventions (feedback, coaching, structural changes)
- Establish regular progress check-ins
- Provide support resources for affected teams
- Maintain communication with stakeholders
- Document intervention processes and adaptations
-
Step 9: Monitoring and Evaluation
- Track intervention outcomes against established metrics
- Measure cost recovery and ROI
- Document organizational learning
- Adjust intervention approaches based on results
- Plan for sustainability and ongoing assessment
- Phase 4: Integration and Sustainability (Ongoing)
-
Step 10: System Integration
- Incorporate TCDL metrics into regular performance management
- Align leadership development programs with findings
- Integrate cost considerations into succession planning
- Develop early warning systems for leadership issues
- Create knowledge management practices to capture learnings
-
Step 11: Continuous Improvement
- Review and refine the TCDL framework annually
- Update cost models based on new data
- Identify emerging patterns or trends
- Share best practices across the organization
- Establish centers of excellence for leadership development
This implementation guide provides a structured approach for organizations to apply the TCDL framework. Successful implementation requires executive support, cross-functional collaboration, and a commitment to data-driven decision-making.
References
- Aasland, M. S., Skogstad, A., Notelaers, G., Nielsen, M. B., & Einarsen, S. (2010). The prevalence of destructive leadership behaviour. British Journal of Management, 21(2), 438-452. [CrossRef]
- Amabile, T. M. (1988). A model of creativity and innovation in organizations. Research in Organizational Behavior, 10(1), 123-167.
- Amabile, T. M., & Conti, R. (1999). Changes in the work environment for creativity during downsizing. Academy of Management Journal, 42(6), 630-640. [CrossRef]
- Anand, V., Tina Dacin, M., & Murphy, P. R. (2015). The continued need for diversity in fraud research. Journal of Business Ethics, 131(4), 751-755. [CrossRef]
- Anderson, N., Potočnik, K., & Zhou, J. (2014). Innovation and creativity in organizations: A state-of-the-science review, prospective commentary, and guiding framework. Journal of Management, 40(5), 1297-1333.
- Aryee, S., Chen, Z. X., Sun, L. Y., & Debrah, Y. A. (2007). Antecedents and outcomes of abusive supervision: Test of a trickle-down model. Journal of Applied Psychology, 92(1), 191-201. [CrossRef]
- Ashforth, B. E. (1994). Petty tyranny in organizations. Human Relations, 47(7), 755-778. [CrossRef]
- Avolio, B. J., Reichard, R. J., Hannah, S. T., Walumbwa, F. O., & Chan, A. (2009). A meta-analytic review of leadership impact research: Experimental and quasi-experimental studies. The Leadership Quarterly, 20(5), 764-784. [CrossRef]
- Baer, M., & Frese, M. (2003). Innovation is not enough: Climates for initiative and psychological safety, process innovations, and firm performance. Journal of Organizational Behavior, 24(1), 45-68.
- Bakker, A. B., & Demerouti, E. (2008). Towards a model of work engagement. Career Development International, 13(3), 209-223. [CrossRef]
- Bamberger, P. A., & Bacharach, S. B. (2006). Abusive supervision and subordinate problem drinking: Taking resistance, stress and subordinate personality into account. Human Relations, 59(6), 723-752. [CrossRef]
- Bandura, A. (1977). Social learning theory. Prentice Hall.
- Barney, J. (1991). Firm resources and sustained competitive advantage. Journal of Management, 17(1), 99-120.
- Bass, B. M., & Riggio, R. E. (2006). Transformational leadership (2nd ed.). Psychology Press.
- Blau, P. M. (1964). Exchange and power in social life. John Wiley & Sons.
- Boyatzis, R. E., & McKee, A. (2005). Resonant leadership: Renewing yourself and connecting with others through mindfulness, hope, and compassion. Harvard Business Press.
- Burton, W. N., Pransky, G., Conti, D. J., Chen, C. Y., & Edington, D. W. (2005). The association of medical conditions and presenteeism. Journal of Occupational and Environmental Medicine, 47(1), S38-S45. [CrossRef]
- Cable, D. M., & Turban, D. B. (2003). The value of organizational reputation in the recruitment context. Journal of Applied Social Psychology, 33(11), 2244-2266. [CrossRef]
- Carlson, D. S., Ferguson, M., Hunter, E., & Whitten, D. (2012). Abusive supervision and work-family conflict: The path through emotional labor and burnout. The Leadership Quarterly, 23(5), 849-859. [CrossRef]
- Carmeli, A., & Gittell, J. H. (2009). High-quality relationships, psychological safety, and learning from failures in work organizations. Journal of Organizational Behavior, 30(6), 709-729. [CrossRef]
- Cascio, W., & Boudreau, J. (2011). Investing in people: Financial impact of human resource initiatives (2nd ed.). FT Press.
- Christian, M. S., Garza, A. S., & Slaughter, J. E. (2011). Work engagement: A quantitative review and test of its relations with task and contextual performance. Personnel Psychology, 64(1), 89-136. [CrossRef]
- Colquitt, J. A., Scott, B. A., & LePine, J. A. (2007). Trust, trustworthiness, and trust propensity: A meta-analytic test of their unique relationships with risk taking and job performance. Journal of Applied Psychology, 92(4), 909-927. [CrossRef]
- Crawford, E. R., & LePine, J. A. (2013). A configural theory of team processes: Accounting for the structure of taskwork and teamwork. Academy of Management Review, 38(1), 32-48. [CrossRef]
- Cropanzano, R., & Mitchell, M. S. (2005). Social exchange theory: An interdisciplinary review. Journal of Management, 31(6), 874-900. [CrossRef]
- Cummings, L. L., & Bromiley, P. (1996). The organizational trust inventory (OTI): Development and validation. In R. M. Kramer & T. R. Tyler (Eds.), Trust in organizations (pp. 302-330). Sage.
- Daniels, M. A., & Greguras, G. J. (2014). Exploring the nature of power distance: Implications for micro-and macro-level theories, processes, and outcomes. Journal of Management, 40(5), 1202-1229.
- Day, D. V., Fleenor, J. W., Atwater, L. E., Sturm, R. E., & McKee, R. A. (2014). Advances in leader and leadership development: A review of 25 years of research and theory. The Leadership Quarterly, 25(1), 63-82. [CrossRef]
- Dess, G. G., & Robinson Jr, R. B. (1984). Measuring organizational performance in the absence of objective measures: The case of the privately-held firm and conglomerate business unit. Strategic Management Journal, 5(3), 265-273.
- Detert, J. R., & Burris, E. R. (2007). Leadership behavior and employee voice: Is the door really open? Academy of Management Journal, 50(4), 869-884.
- Dirks, K. T., & Ferrin, D. L. (2002). Trust in leadership: Meta-analytic findings and implications for research and practice. Journal of Applied Psychology, 87(4), 611-628. [CrossRef]
- Duffy, M. K., Ganster, D. C., & Pagon, M. (2002). Social undermining in the workplace. Academy of Management Journal, 45(2), 331-351.
- Edmondson, A. (1999). Psychological safety and learning behavior in work teams. Administrative Science Quarterly, 44(2), 350-383. [CrossRef]
- Edmondson, A. C. (2019). The fearless organization: Creating psychological safety in the workplace for learning, innovation, and growth. Wiley.
- Edmondson, A. C., & Lei, Z. (2014). Psychological safety: The history, renaissance, and future of an interpersonal construct. Annual Review of Organizational Psychology and Organizational Behavior, 1(1), 23-43.
- Einarsen, S., Aasland, M. S., & Skogstad, A. (2007). Destructive leadership behaviour: A definition and conceptual model. The Leadership Quarterly, 18(3), 207-216. [CrossRef]
- Frazier, M. L., Fainshmidt, S., Klinger, R. L., Pezeshkan, A., & Vracheva, V. (2017). Psychological safety: A meta-analytic review and extension. Personnel Psychology, 70(1), 113-165. [CrossRef]
- Fulmer, C. A., & Gelfand, M. J. (2012). At what level (and in whom) we trust: Trust across multiple organizational levels. Journal of Management, 38(4), 1167-1230.
- Gallup. (2021). State of the American Workplace Report.
- Gino, F., Ayal, S., & Ariely, D. (2009). Contagion and differentiation in unethical behavior: The effect of one bad apple on the barrel. Psychological Science, 20(3), 393-398.
- Goh, J., Pfeffer, J., & Zenios, S. A. (2016). The relationship between workplace stressors and mortality and health costs in the United States. Management Science, 62(2), 608-628. [CrossRef]
- Harms, P. D., Credé, M., Tynan, M., Leon, M., & Jeung, W. (2017). Leadership and stress: A meta-analytic review. The Leadership Quarterly, 28(1), 178-194. [CrossRef]
- Harris, K. J., Harvey, P., & Kacmar, K. M. (2013). The impact of political skill on the relationship between perceptions of organizational politics and career success. Journal of Vocational Behavior, 83(2), 215-225.
- Harter, J. K., Schmidt, F. L., & Hayes, T. L. (2002). Business-unit-level relationship between employee satisfaction, employee engagement, and business outcomes: A meta-analysis. Journal of Applied Psychology, 87(2), 268-279. [CrossRef]
- Hemp, P. (2004). Presenteeism: At work—but out of it. Harvard Business Review, 82(10), 49-58.
- Hoel, H., & Cooper, C. L. (2020). Destructive interpersonal conflict in the workplace. International Review of Industrial and Organizational Psychology, 15, 196-230.
- Hofstede, G. (2001). Culture's consequences: Comparing values, behaviors, institutions, and organizations across nations (2nd ed.). Sage.
- Holmberg, I., Jönsson, S. A., & Solli, R. (2018). The persistence of destructive leadership: Stability and change in leadership over time. Academy of Management Proceedings, 2018(1), 14041.
- Hoobler, J. M., & Hu, J. (2013). A model of injustice, abusive supervision, and negative affect. The Leadership Quarterly, 24(1), 256-269.
- House, R. J., Hanges, P. J., Javidan, M., Dorfman, P. W., & Gupta, V. (Eds.). (2004). Culture, leadership, and organizations: The GLOBE study of 62 societies. Sage.
- Huselid, M. A. (1995). The impact of human resource management practices on turnover, productivity, and corporate financial performance. Academy of Management Journal, 38(3), 635-672.
- Kim, P. H., Ferrin, D. L., Cooper, C. D., & Dirks, K. T. (2004). Removing the shadow of suspicion: The effects of apology versus denial for repairing competence-versus integrity-based trust violations. Journal of Applied Psychology, 89(1), 104-118. [CrossRef]
- Krasikova, D. V., Green, S. G., & LeBreton, J. M. (2013). Destructive leadership: A theoretical review, integration, and future research agenda. Journal of Management, 39(5), 1308-1338.
- Kramer, R. M., & Cook, K. S. (2004). Trust and distrust in organizations. Russell Sage Foundation.
- Lee, P., Gillespie, N., Mann, L., & Wearing, A. (2011). Leadership and trust: Their effect on knowledge sharing and team performance. Management Learning, 42(5), 461-477. [CrossRef]
- Leroy, H., Palanski, M. E., & Simons, T. (2012). Authentic leadership and behavioral integrity as drivers of follower commitment and performance. Journal of Business Ethics, 107(3), 255-264. [CrossRef]
- Lian, H., Ferris, D. L., & Brown, D. J. (2012). Does power distance exacerbate or mitigate the effects of abusive supervision? It depends on the outcome. Journal of Applied Psychology, 97(1), 107-123. [CrossRef]
- Liang, J., Farh, C. I., & Farh, J. L. (2012). Psychological antecedents of promotive and prohibitive voice: A two-wave examination. Academy of Management Journal, 55(1), 71-92. [CrossRef]
- Lipman-Blumen, J. (2005). The allure of toxic leaders: Why we follow destructive bosses and corrupt politicians—and how we can survive them. Oxford University Press.
- Mackey, J. D., Frieder, R. E., Brees, J. R., & Martinko, M. J. (2017). Abusive supervision: A meta-analysis and empirical review. Journal of Management, 43(6), 1940-1965. [CrossRef]
- Martinko, M. J., Harvey, P., Brees, J. R., & Mackey, J. (2013). A review of abusive supervision research. Journal of Organizational Behavior, 34(S1), S120-S137. [CrossRef]
- Mitchell, T. R., & James, L. R. (2001). Building better theory: Time and the specification of when things happen. Academy of Management Review, 26(4), 530-547.
- Montano, D., Reeske, A., Franke, F., & Hüffmeier, J. (2017). Leadership, followers' mental health and job performance in organizations: A comprehensive meta-analysis from an occupational health perspective. Journal of Organizational Behavior, 38(3), 327-350. [CrossRef]
- Mooney, J. (2022). The rising cost of employment litigation. Society for Human Resource Management.
- Morrison, E. W., & Milliken, F. J. (2000). Organizational silence: A barrier to change and development in a pluralistic world. Academy of Management Review, 25(4), 706-725.
- Nembhard, I. M., & Edmondson, A. C. (2006). Making it safe: The effects of leader inclusiveness and professional status on psychological safety and improvement efforts in health care teams. Journal of Organizational Behavior, 27(7), 941-966. [CrossRef]
- Newman, A., Donohue, R., & Eva, N. (2017). Psychological safety: A systematic review of the literature. Human Resource Management Review, 27(3), 521-535. [CrossRef]
- Nielsen, M. B., Glasø, L., & Einarsen, S. (2017). Exposure to workplace harassment and the Five Factor Model of personality: A meta-analysis. Personality and Individual Differences, 104, 195-206. [CrossRef]
- Nyberg, A., Alfredsson, L., Theorell, T., Westerlund, H., Vahtera, J., & Kivimäki, M. (2008). Managerial leadership and ischaemic heart disease among employees: The Swedish WOLF study. Occupational and Environmental Medicine, 66(1), 51-55. [CrossRef]
- O'Connell, M., & Kung, M. C. (2007). The cost of employee turnover. Industrial Management, 49(1), 14-19.
- Pellegrini, E. K., & Scandura, T. A. (2008). Paternalistic leadership: A review and agenda for future research. Journal of Management, 34(3), 566-593. [CrossRef]
- Pelletier, K. L. (2010). Leader toxicity: An empirical investigation of toxic behavior and rhetoric. Leadership, 6(4), 373-389. [CrossRef]
- Peterson, D. B. (2012). Executive coaching: A critical review and recommendations for advancing the practice. APA Handbook of Industrial and Organizational Psychology, 2, 527-566.
- Qian, J., Song, B., Jin, Z., Wang, B., & Chen, H. (2017). Linking empowering leadership to task performance, taking charge, and voice: The mediating role of feedback-seeking. Frontiers in Psychology, 8, 920. [CrossRef]
- Rockstuhl, T., Dulebohn, J. H., Ang, S., & Shore, L. M. (2012). Leader–member exchange (LMX) and culture: A meta-analysis of correlates of LMX across 23 countries. Journal of Applied Psychology, 97(6), 1097-1130. [CrossRef]
- Rousseau, D. M., Sitkin, S. B., Burt, R. S., & Camerer, C. (1998). Not so different after all: A cross-discipline view of trust. Academy of Management Review, 23(3), 393-404. [CrossRef]
- Rozovsky, J. (2015). The five keys to a successful Google team. Google re:Work.
- Saks, A. M. (2006). Antecedents and consequences of employee engagement. Journal of Managerial Psychology, 21(7), 600-619. [CrossRef]
- Saunders, M., Lewis, P., & Thornhill, A. (2017). Research methods for business students (7th ed.). Pearson.
- Schaufeli, W. B., Bakker, A. B., & Salanova, M. (2006). The measurement of work engagement with a short questionnaire: A cross-national study. Educational and Psychological Measurement, 66(4), 701-716.
- Schmidt, A. A. (2008). Development and validation of the toxic leadership scale. Master's thesis, University of Maryland.
- Schyns, B., & Schilling, J. (2013). How bad are the effects of bad leaders? A meta-analysis of destructive leadership and its outcomes. The Leadership Quarterly, 24(1), 138-158. [CrossRef]
- Seppälä, E., & Cameron, K. (2015). Proof that positive work cultures are more productive. Harvard Business Review, 12, 44-50.
- SHRM. (2019). Retaining talented employees. Society for Human Resource Management.
- Sutton, R. I. (2007). The no asshole rule: Building a civilized workplace and surviving one that isn't. Business Plus.
- Tepper, B. J. (2000). Consequences of abusive supervision. Academy of Management Journal, 43(2), 178-190. [CrossRef]
- Tepper, B. J. (2007). Abusive supervision in work organizations: Review, synthesis, and research agenda. Journal of Management, 33(3), 261-289. [CrossRef]
- Tepper, B. J., Duffy, M. K., Henle, C. A., & Lambert, L. S. (2006). Procedural injustice, victim precipitation, and abusive supervision. Personnel Psychology, 59(1), 101-123.
- Thoroughgood, C. N., Sawyer, K. B., Padilla, A., & Lunsford, L. (2018). Destructive leadership: A critique of leader-centric perspectives and toward a more holistic definition. Journal of Business Ethics, 151(3), 627-649. [CrossRef]
- Trevino, L. K., & Brown, M. E. (2005). The role of leaders in influencing unethical behavior in the workplace. In R. E. Kidwell & C. L. Martin (Eds.), Managing organizational deviance (pp. 69-96). Sage.
- Tsui, A. S., Nifadkar, S. S., & Ou, A. Y. (2007). Cross-national, cross-cultural organizational behavior research: Advances, gaps, and recommendations. Journal of Management, 33(3), 426-478. [CrossRef]
- Vogel, R. M., Mitchell, M. S., Tepper, B. J., Restubog, S. L., Hu, C., Hua, W., & Huang, J. C. (2015). A cross-cultural examination of subordinates' perceptions of and reactions to abusive supervision. Journal of Organizational Behavior, 36(5), 720-745. [CrossRef]
- Waldman, D. A., Ramirez, G. G., House, R. J., & Puranam, P. (2001). Does leadership matter? CEO leadership attributes and profitability under conditions of perceived environmental uncertainty. Academy of Management Journal, 44(1), 134-143. [CrossRef]
- Zhou, J. (2003). When the presence of creative coworkers is related to creativity: Role of supervisor close monitoring, developmental feedback, and creative personality. Journal of Applied Psychology, 88(3), 413-422. [CrossRef]
Figure 1.
Conceptual Model of Destructive Leadership Impact. Note: Path diagram showing the conceptual model of destructive leadership impact. The model illustrates how leadership dimensions affect organizational outcomes through mediating mechanisms, with various moderating factors influencing these relationships. Standardized path coefficients from the structural equation modeling results are shown for key relationships.

Figure 2.
Four-Dimensional Model of Destructive Leadership. Note: Radar chart showing the four dimensions of destructive leadership and their relative prevalence across the sample (N=42). Status-Based Entitlement emerged as the most prominent dimension.
Figure 2.
Four-Dimensional Model of Destructive Leadership. Note: Radar chart showing the four dimensions of destructive leadership and their relative prevalence across the sample (N=42). Status-Based Entitlement emerged as the most prominent dimension.
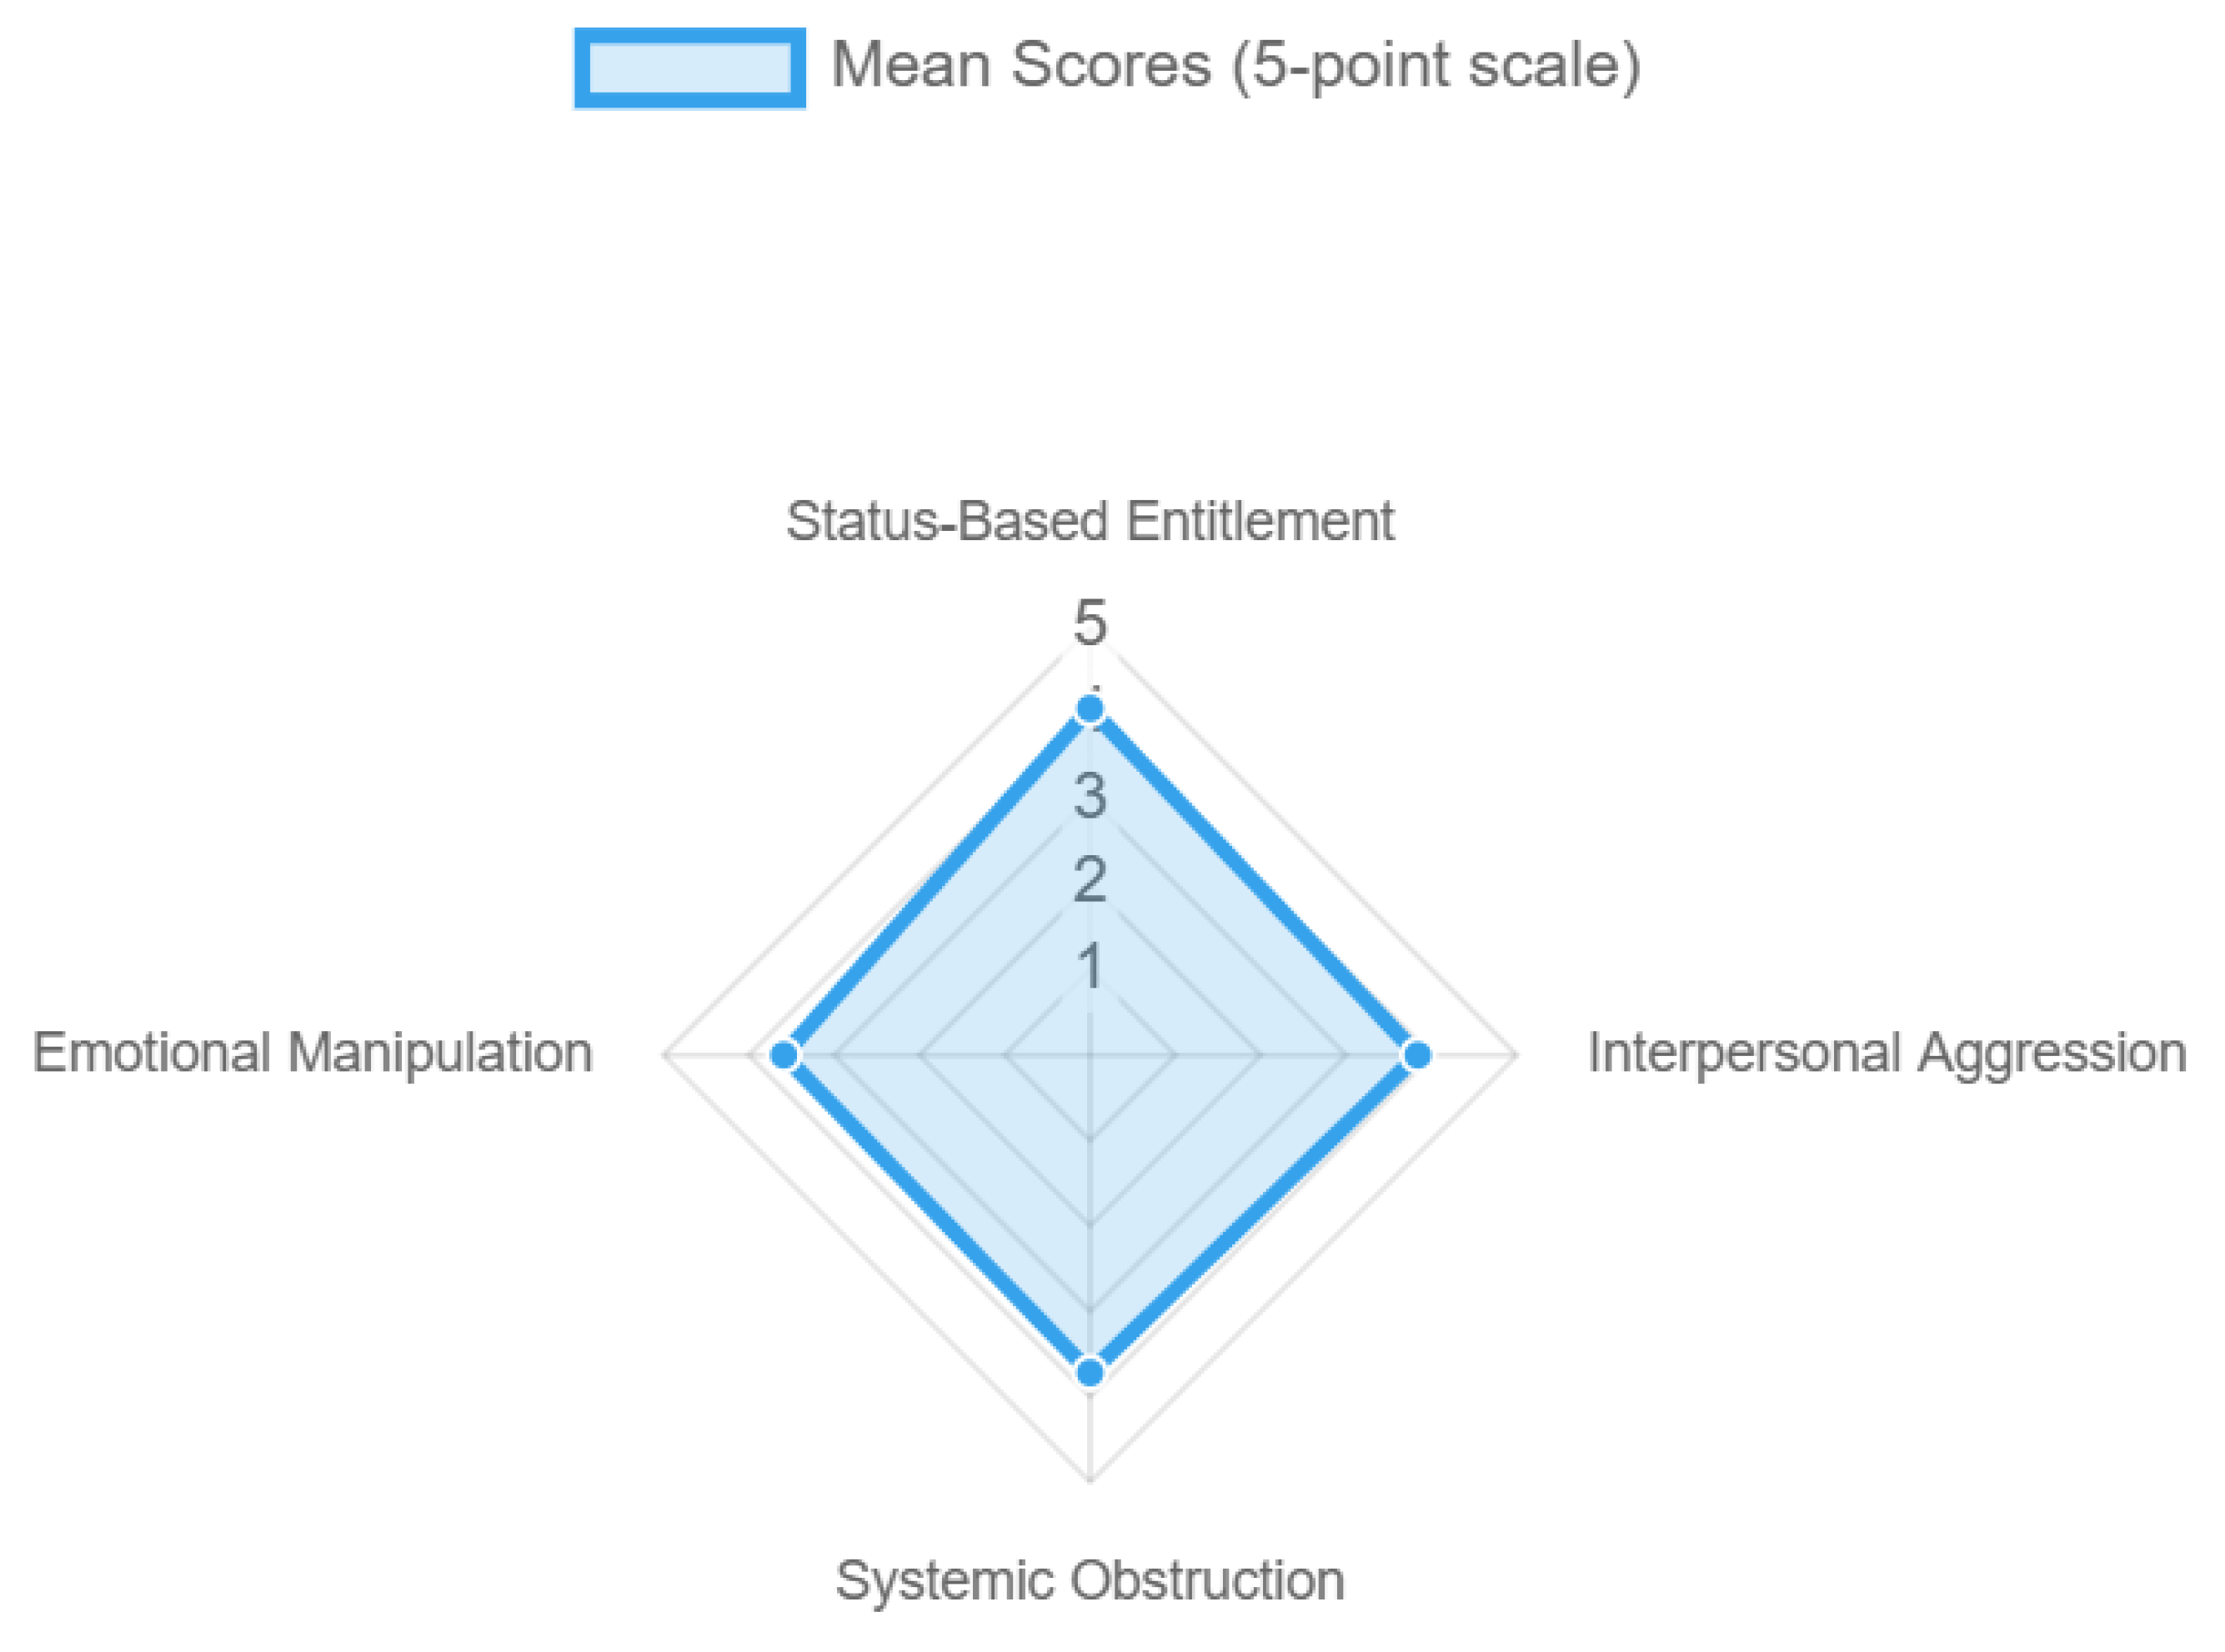
Figure 3.
Collaborative Network Comparison. Note: Comparison of collaboration networks between a department under difficult leadership (left) and a matched comparison department (right). Note the significantly fewer cross-functional connections and information flow pathways in the difficult leader's department.
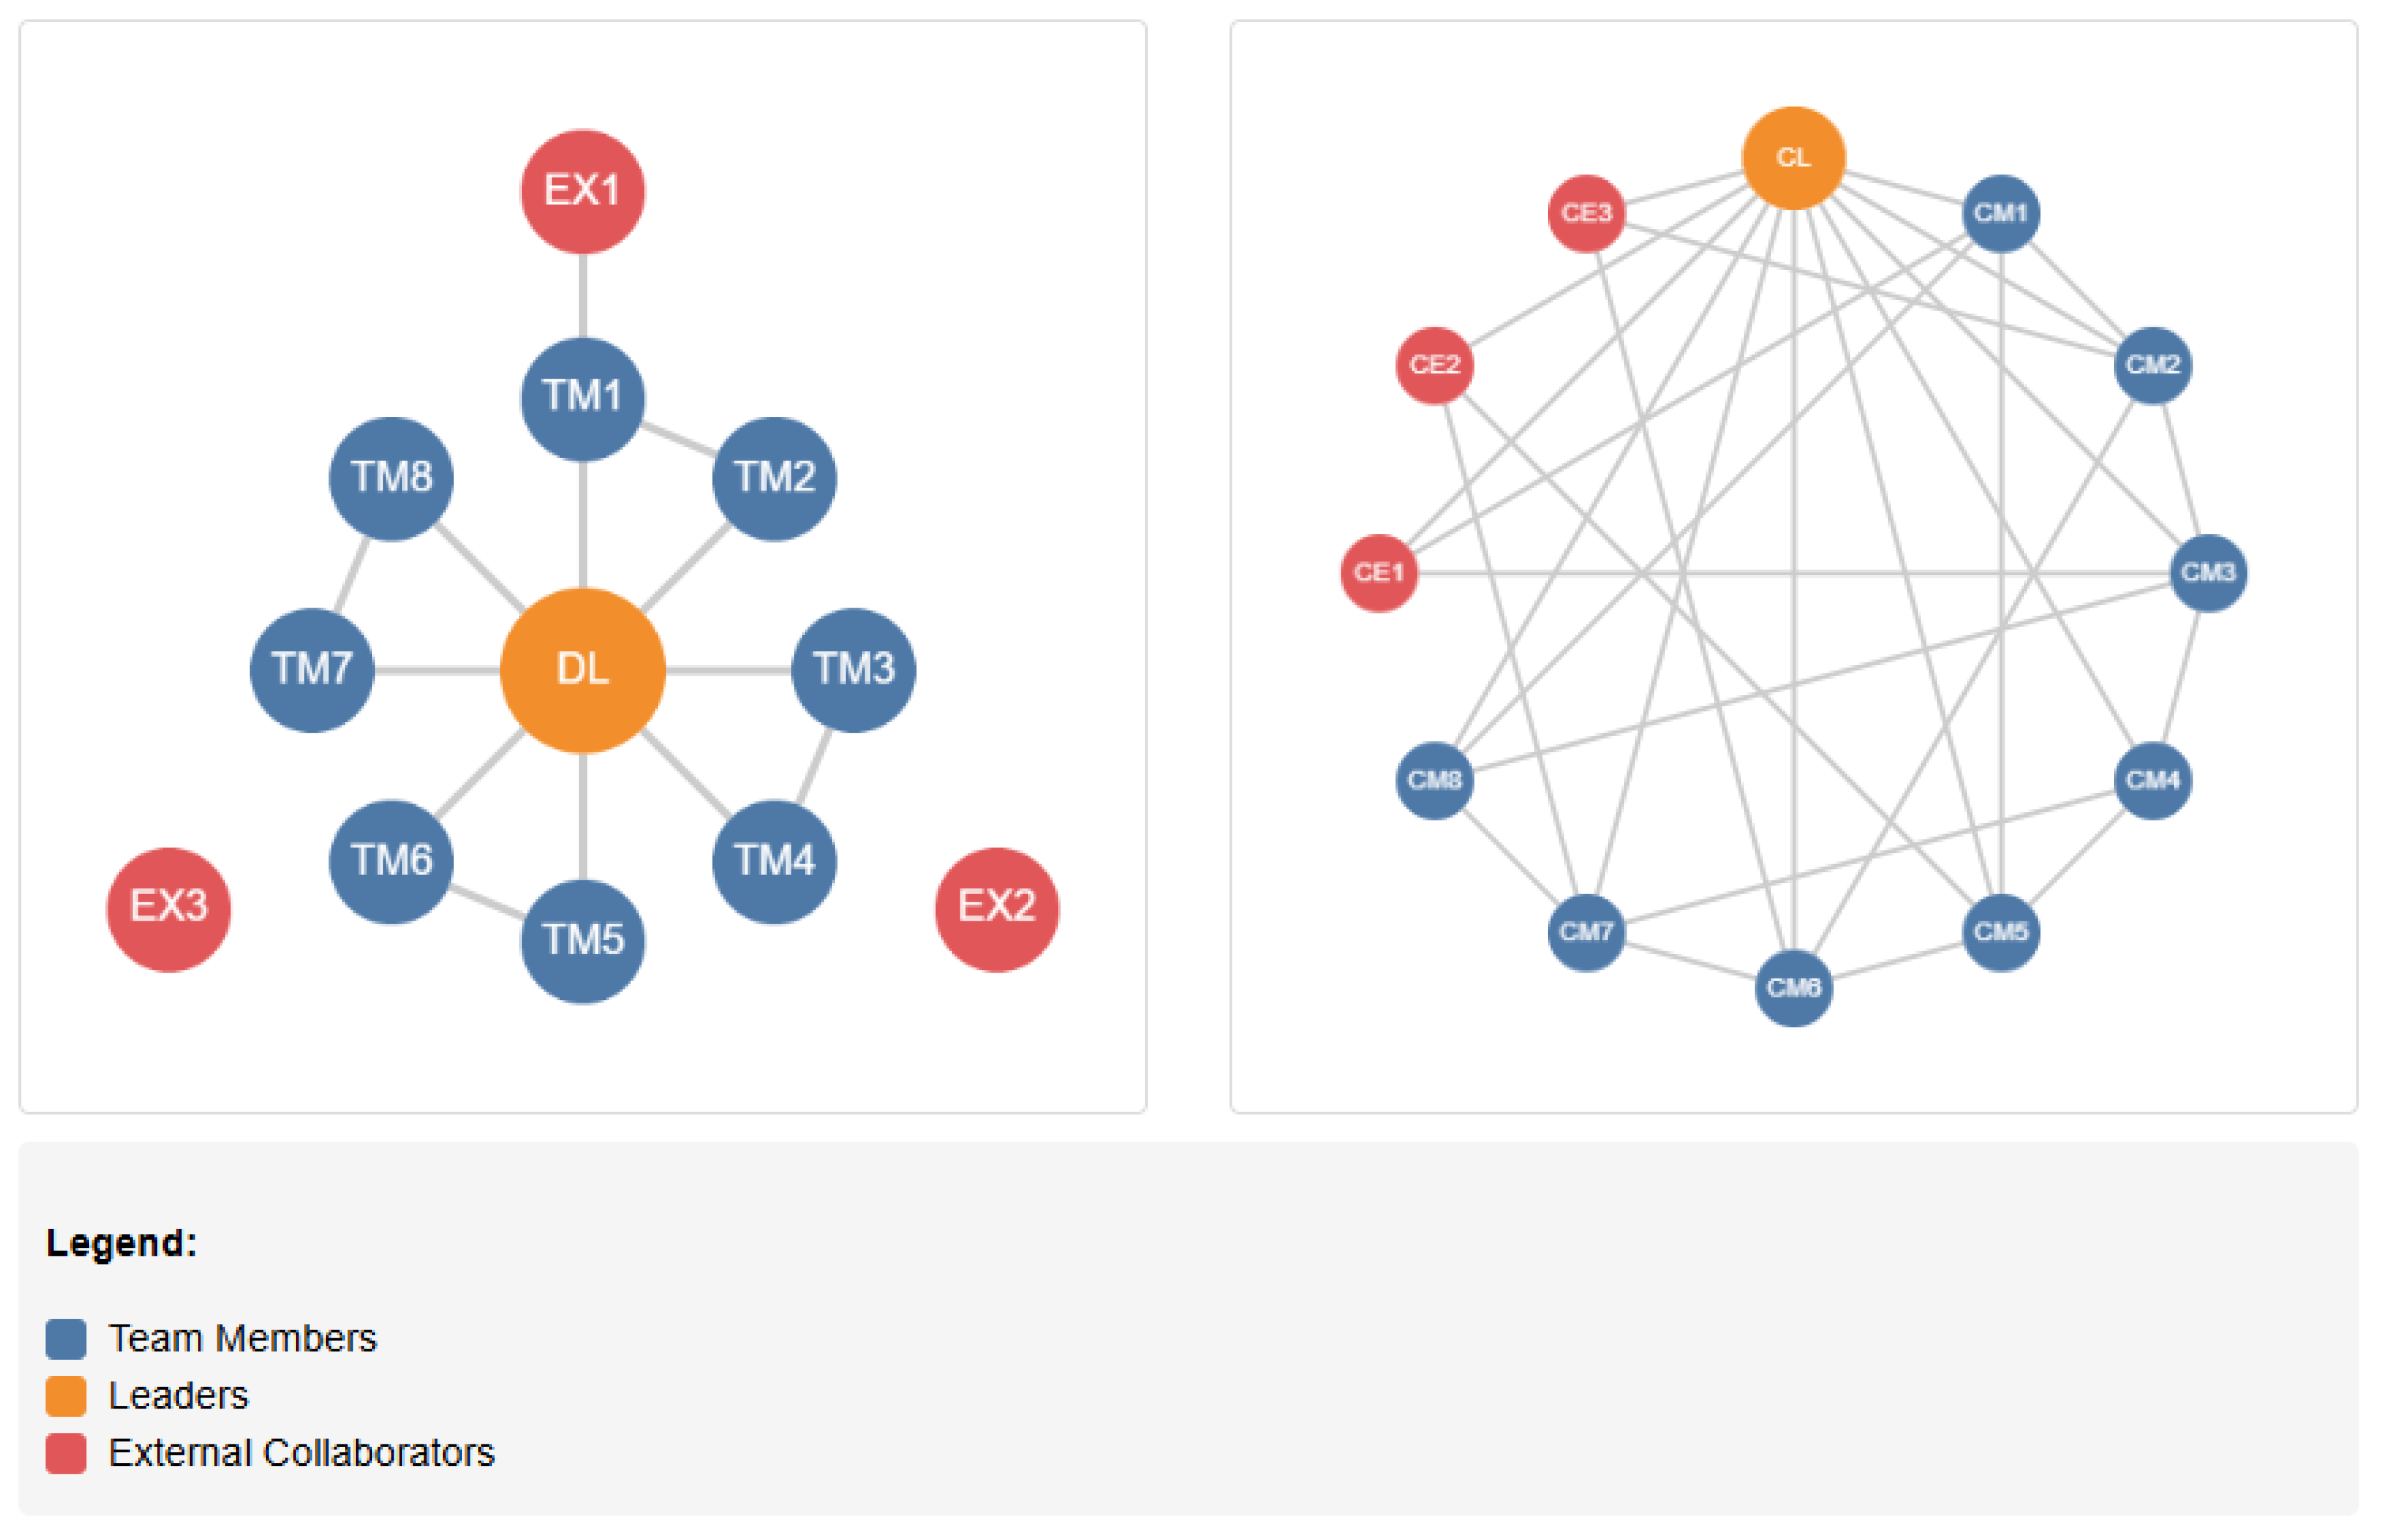
Figure 4.
Temporal Pattern of Behavioral Contagion. Note: Line graph showing the nonlinear pattern of behavioral contagion over time. Note the minimal effect in the first 6 months followed by accelerating adoption of destructive behaviors between months 6-18.
Figure 4.
Temporal Pattern of Behavioral Contagion. Note: Line graph showing the nonlinear pattern of behavioral contagion over time. Note the minimal effect in the first 6 months followed by accelerating adoption of destructive behaviors between months 6-18.
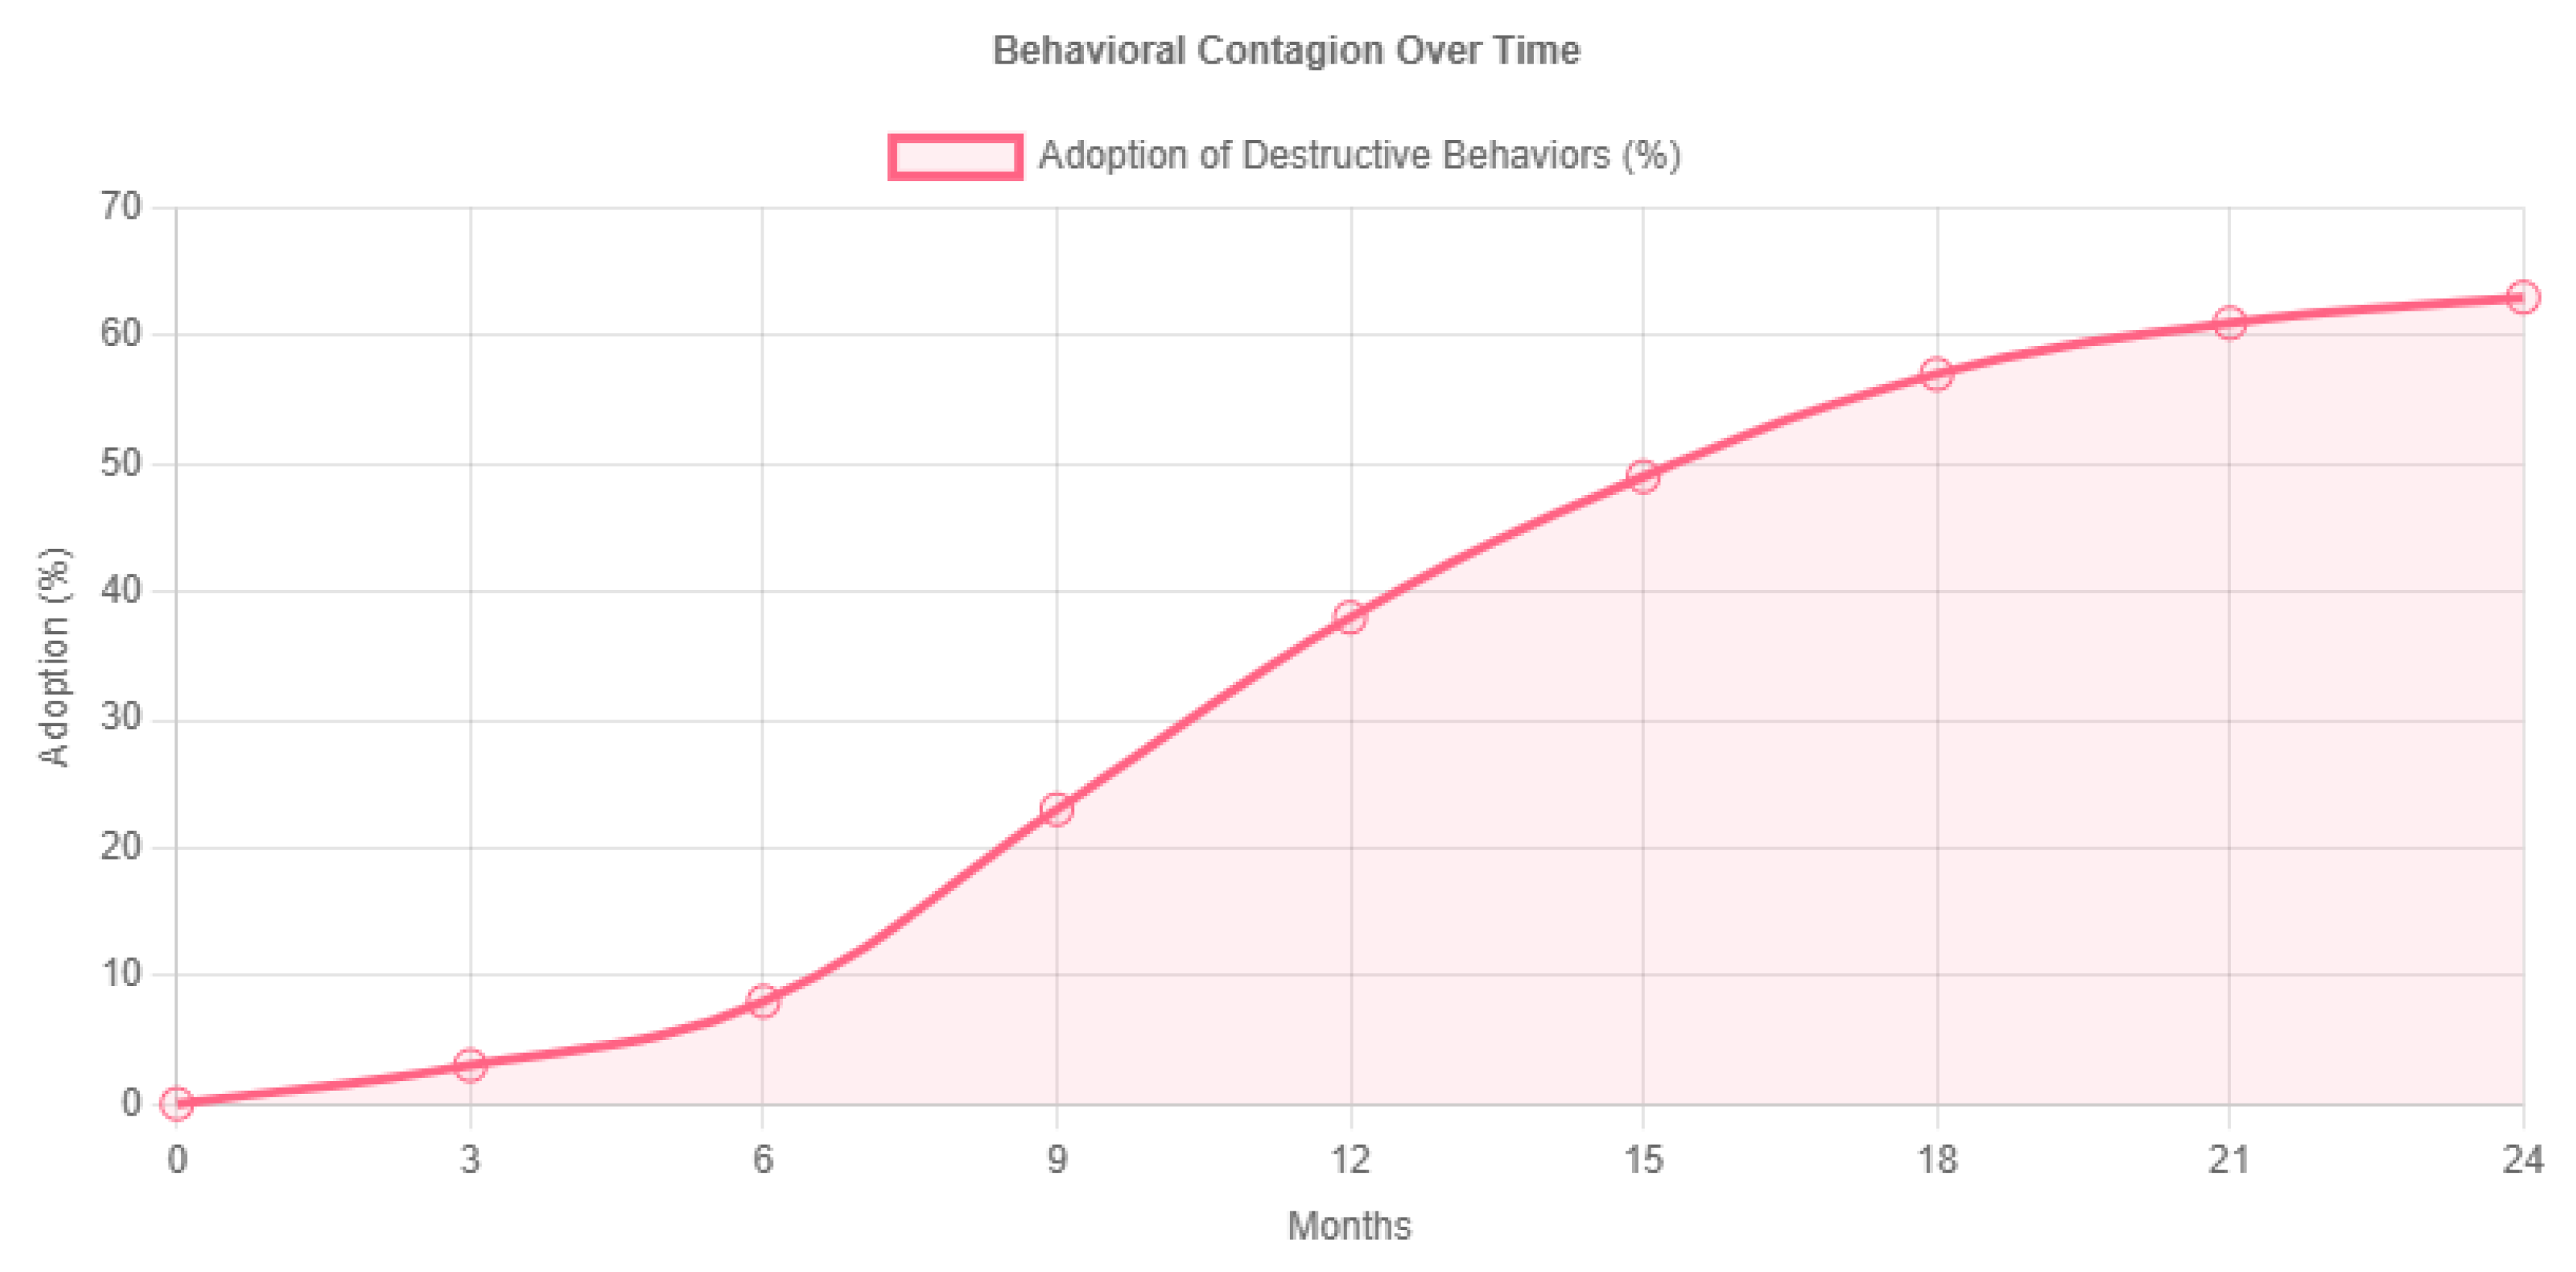
Figure 5.
Distribution of Total Cost Multipliers Across the Sample. Note: Histogram showing the distribution of cost multipliers (as multiples of leader compensation) across the sample of 42 leaders. The distribution is right-skewed with most leaders falling in the 6-10× range, but with a long tail extending to 27×. Industry-specific means are presented below the chart, showing significant variation across sectors with knowledge-intensive industries experiencing higher costs.
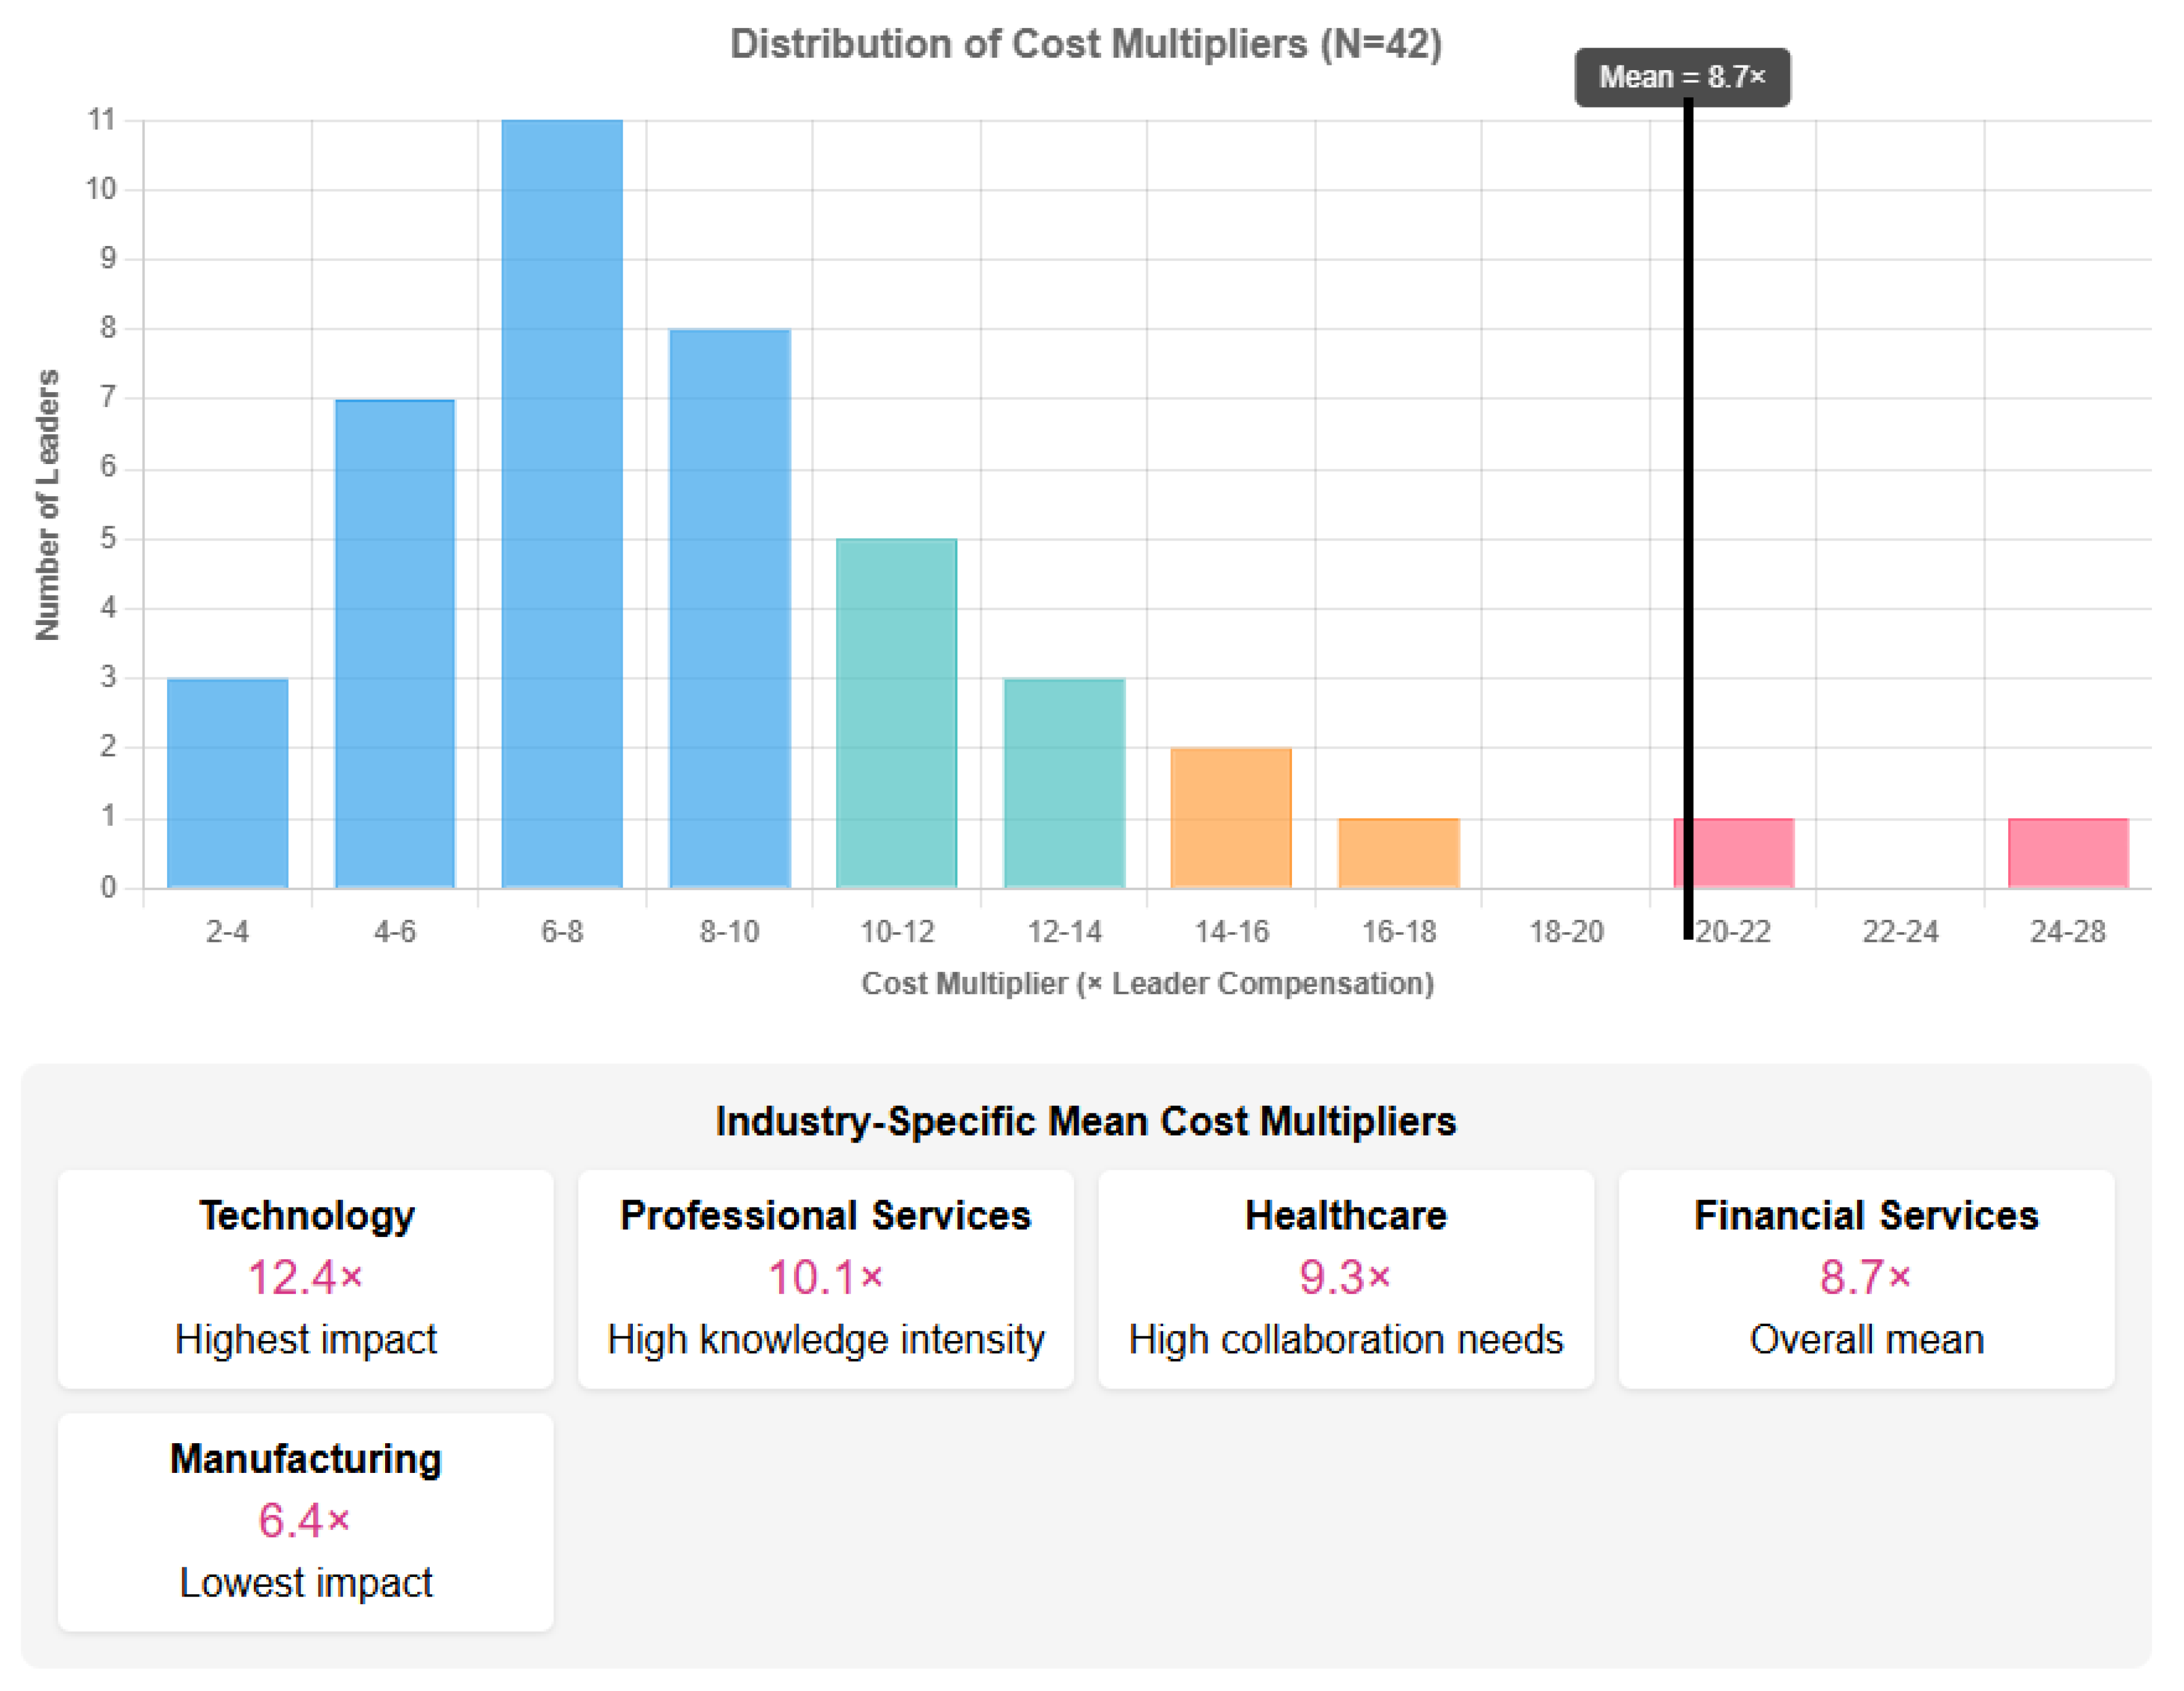
Figure 6.
Temporal Pattern of Cost Accumulation. Note: Line graph showing the accumulation of different cost categories over time. Cultural contagion costs show the slowest initial increase but continue rising through month 36.
Figure 6.
Temporal Pattern of Cost Accumulation. Note: Line graph showing the accumulation of different cost categories over time. Cultural contagion costs show the slowest initial increase but continue rising through month 36.
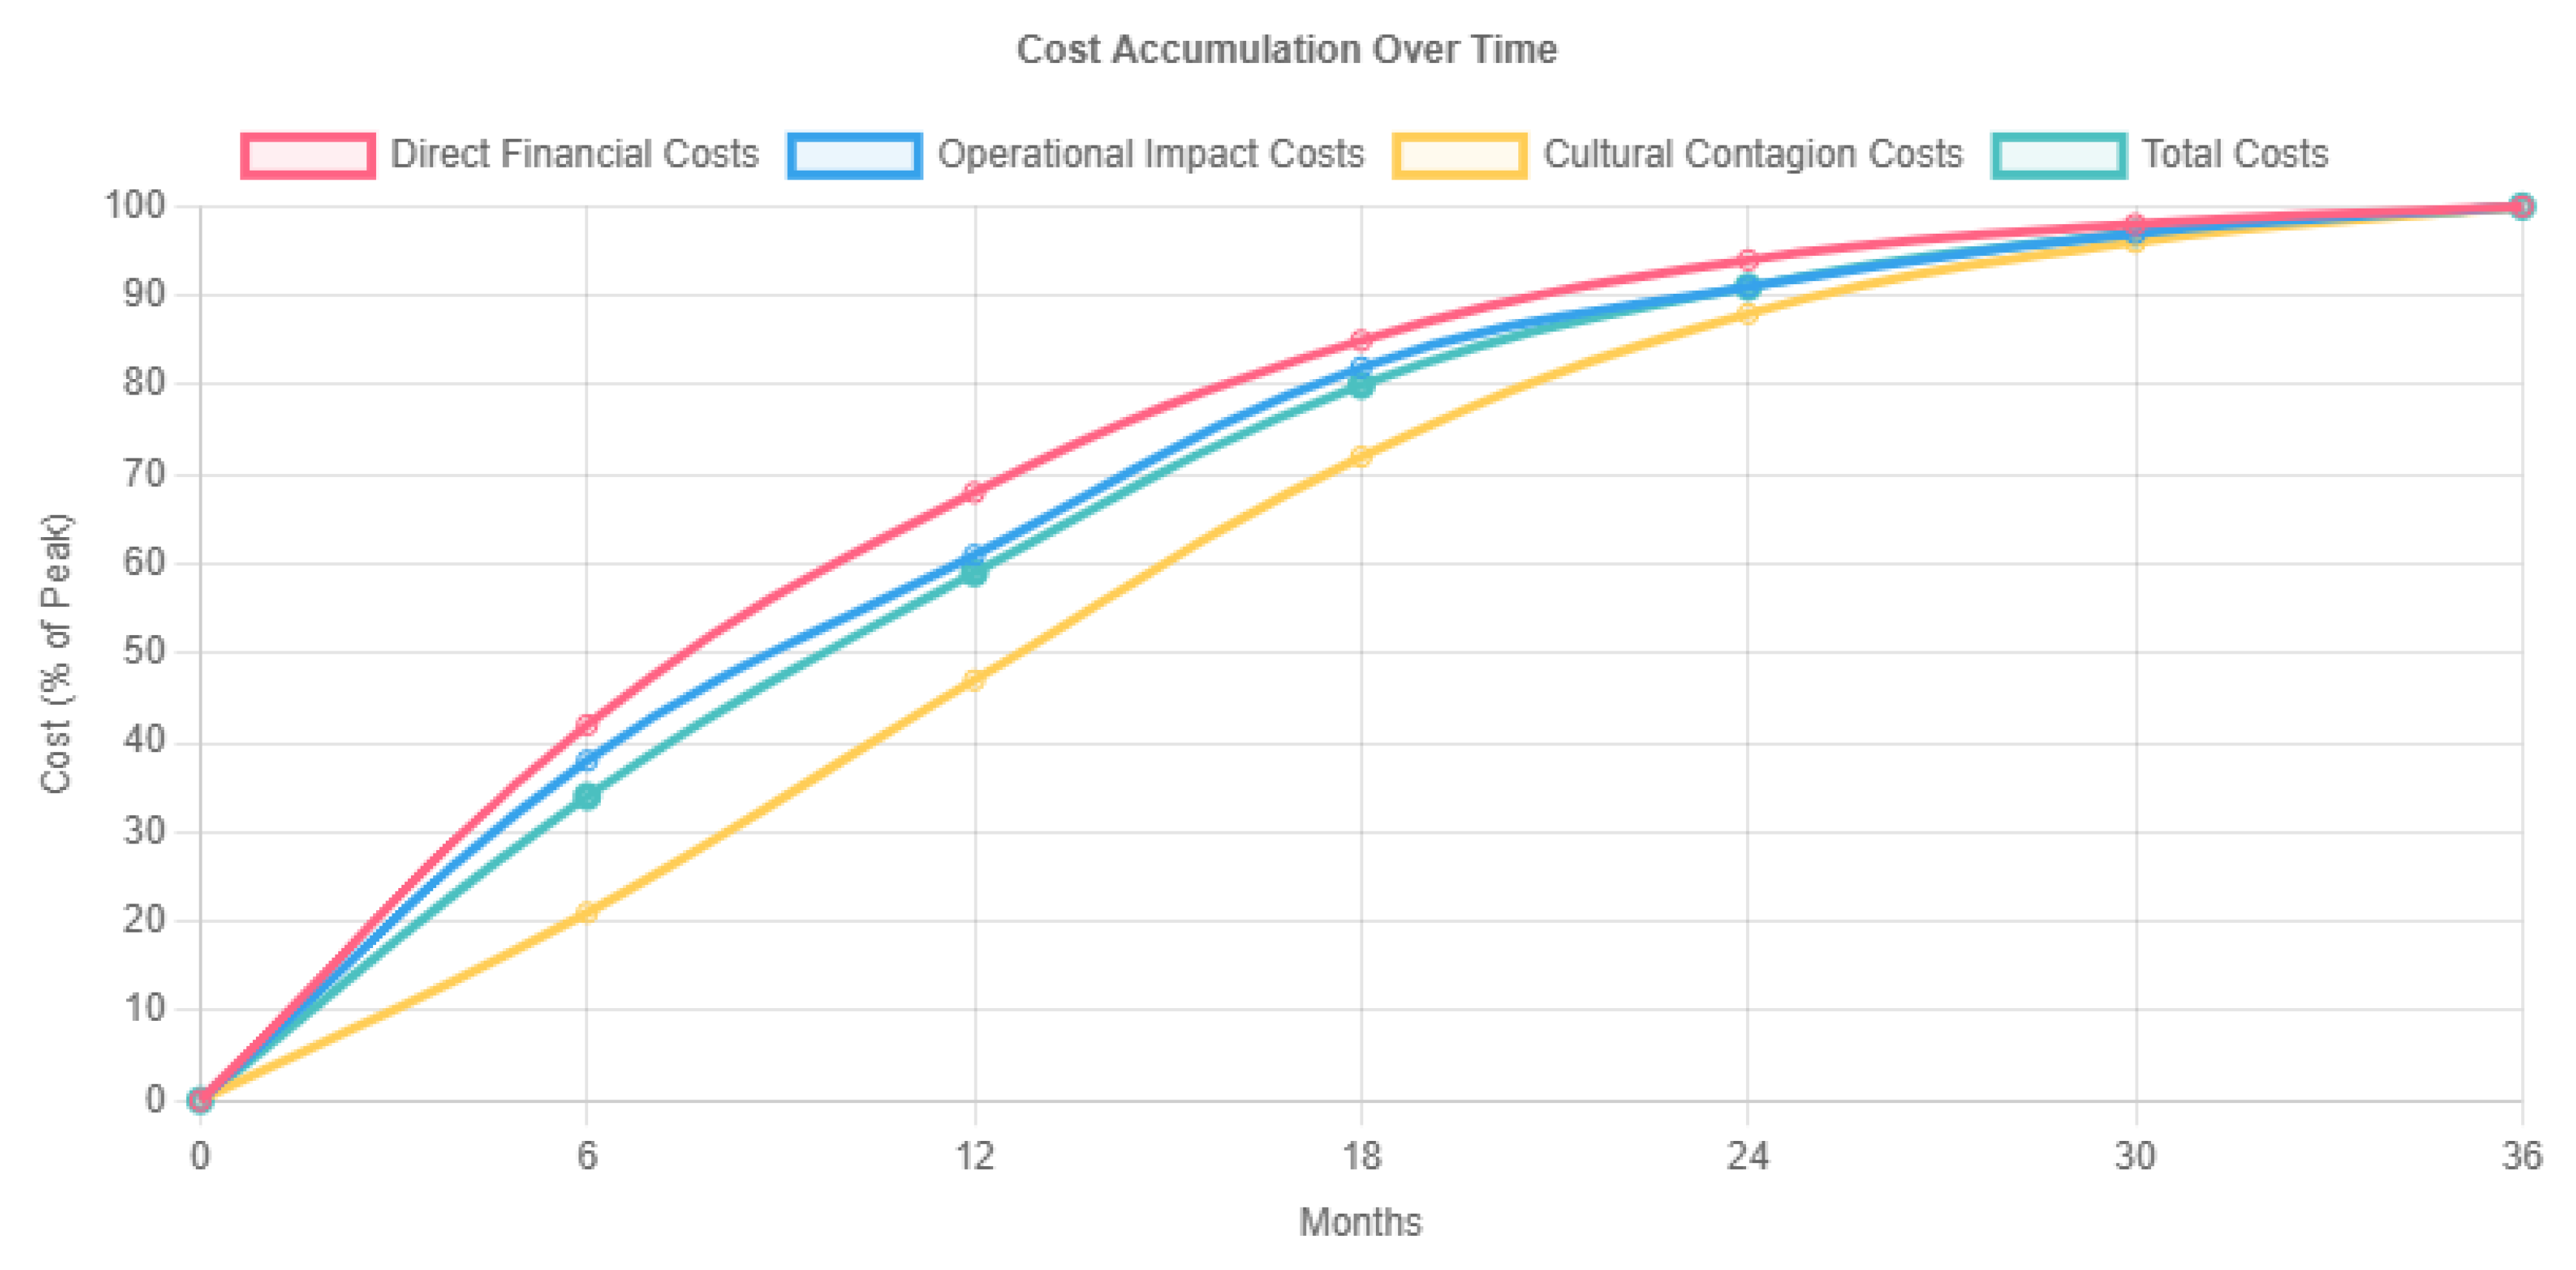
Figure 7.
Structural Equation Model of Destructive Leadership Impact. Note: The structural equation model confirms the proposed conceptual framework, demonstrating how different dimensions of destructive leadership affect organizational outcomes through specific mediating mechanisms. The model shows that each leadership dimension has stronger relationships with particular mediating variables, which in turn predict specific organizational outcomes. For clarity, only the primary pathways and strongest relationships are shown. The full model included additional control variables and cross-loadings. Standardized path coefficients are displayed. Psychological safety, trust, and engagement were measured using established scales. Innovation, collaboration, and turnover represent composite indices derived from multiple objective and subjective indicators.
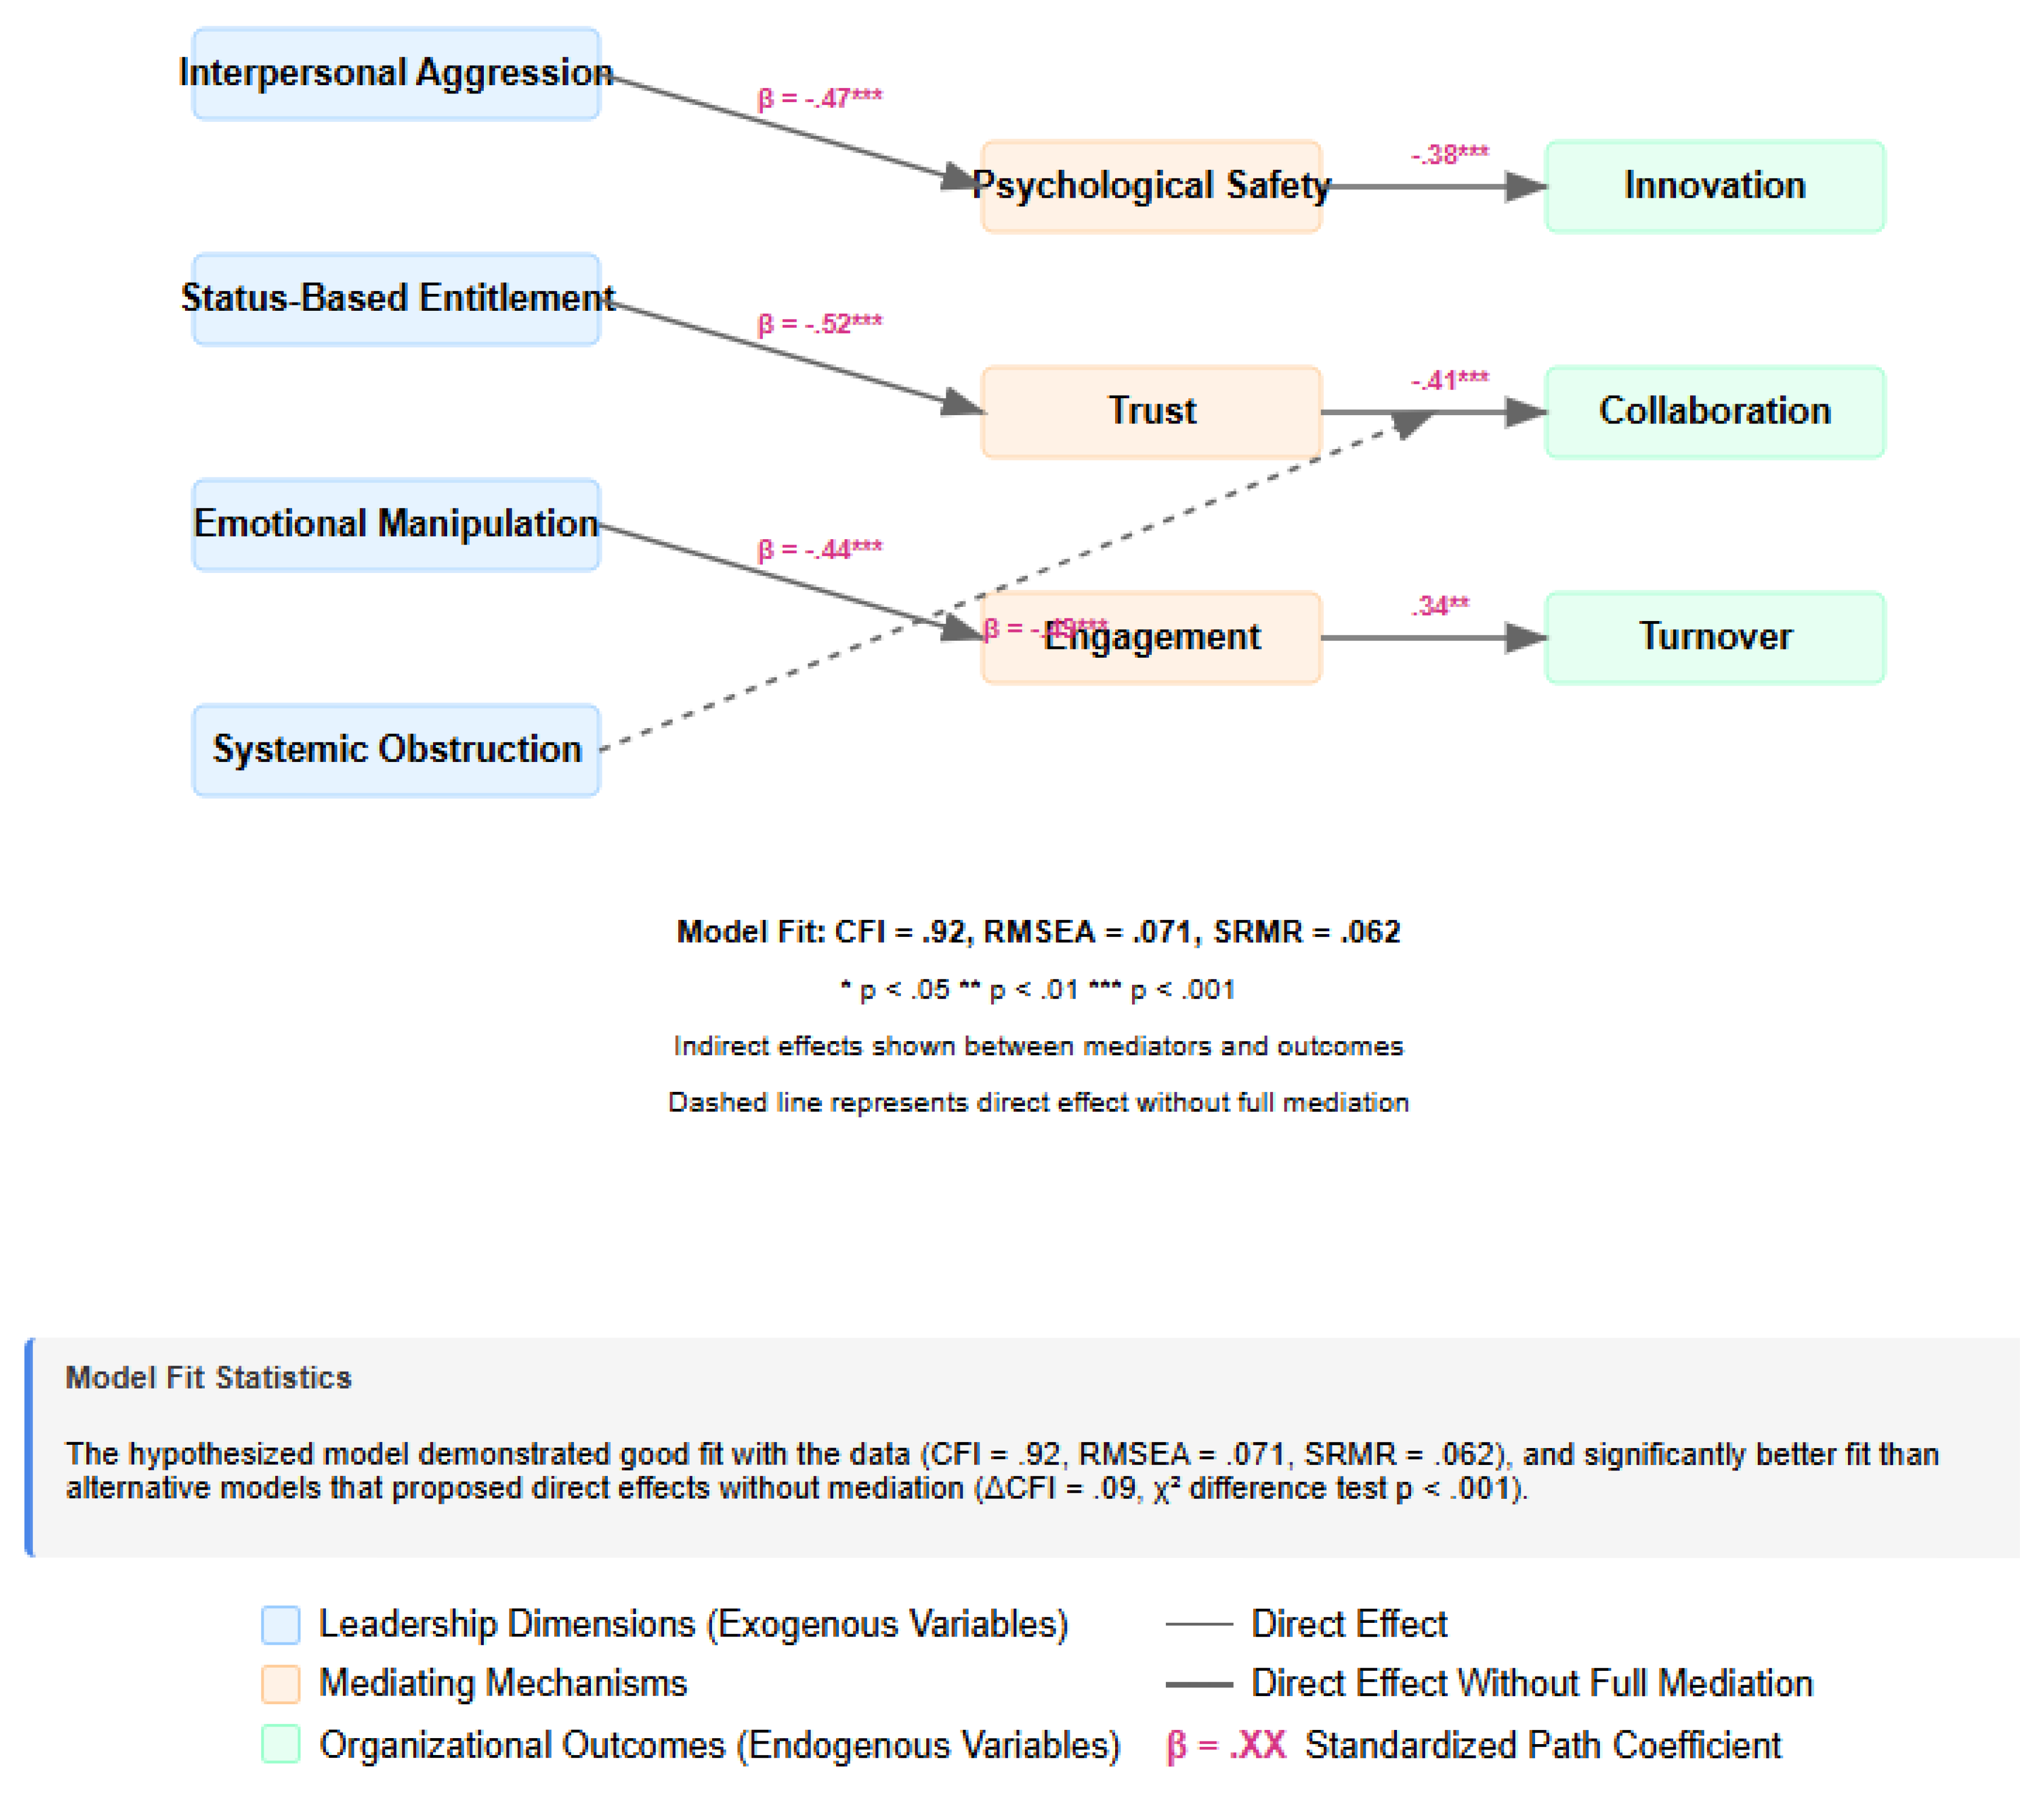
Figure 8.
Intervention Success Rates by Leadership Profile and Approach. Note: Heat map showing intervention success rates by leadership profile and intervention approach. Single-dimension leaders receiving comprehensive interventions show the highest success rates.
Figure 8.
Intervention Success Rates by Leadership Profile and Approach. Note: Heat map showing intervention success rates by leadership profile and intervention approach. Single-dimension leaders receiving comprehensive interventions show the highest success rates.
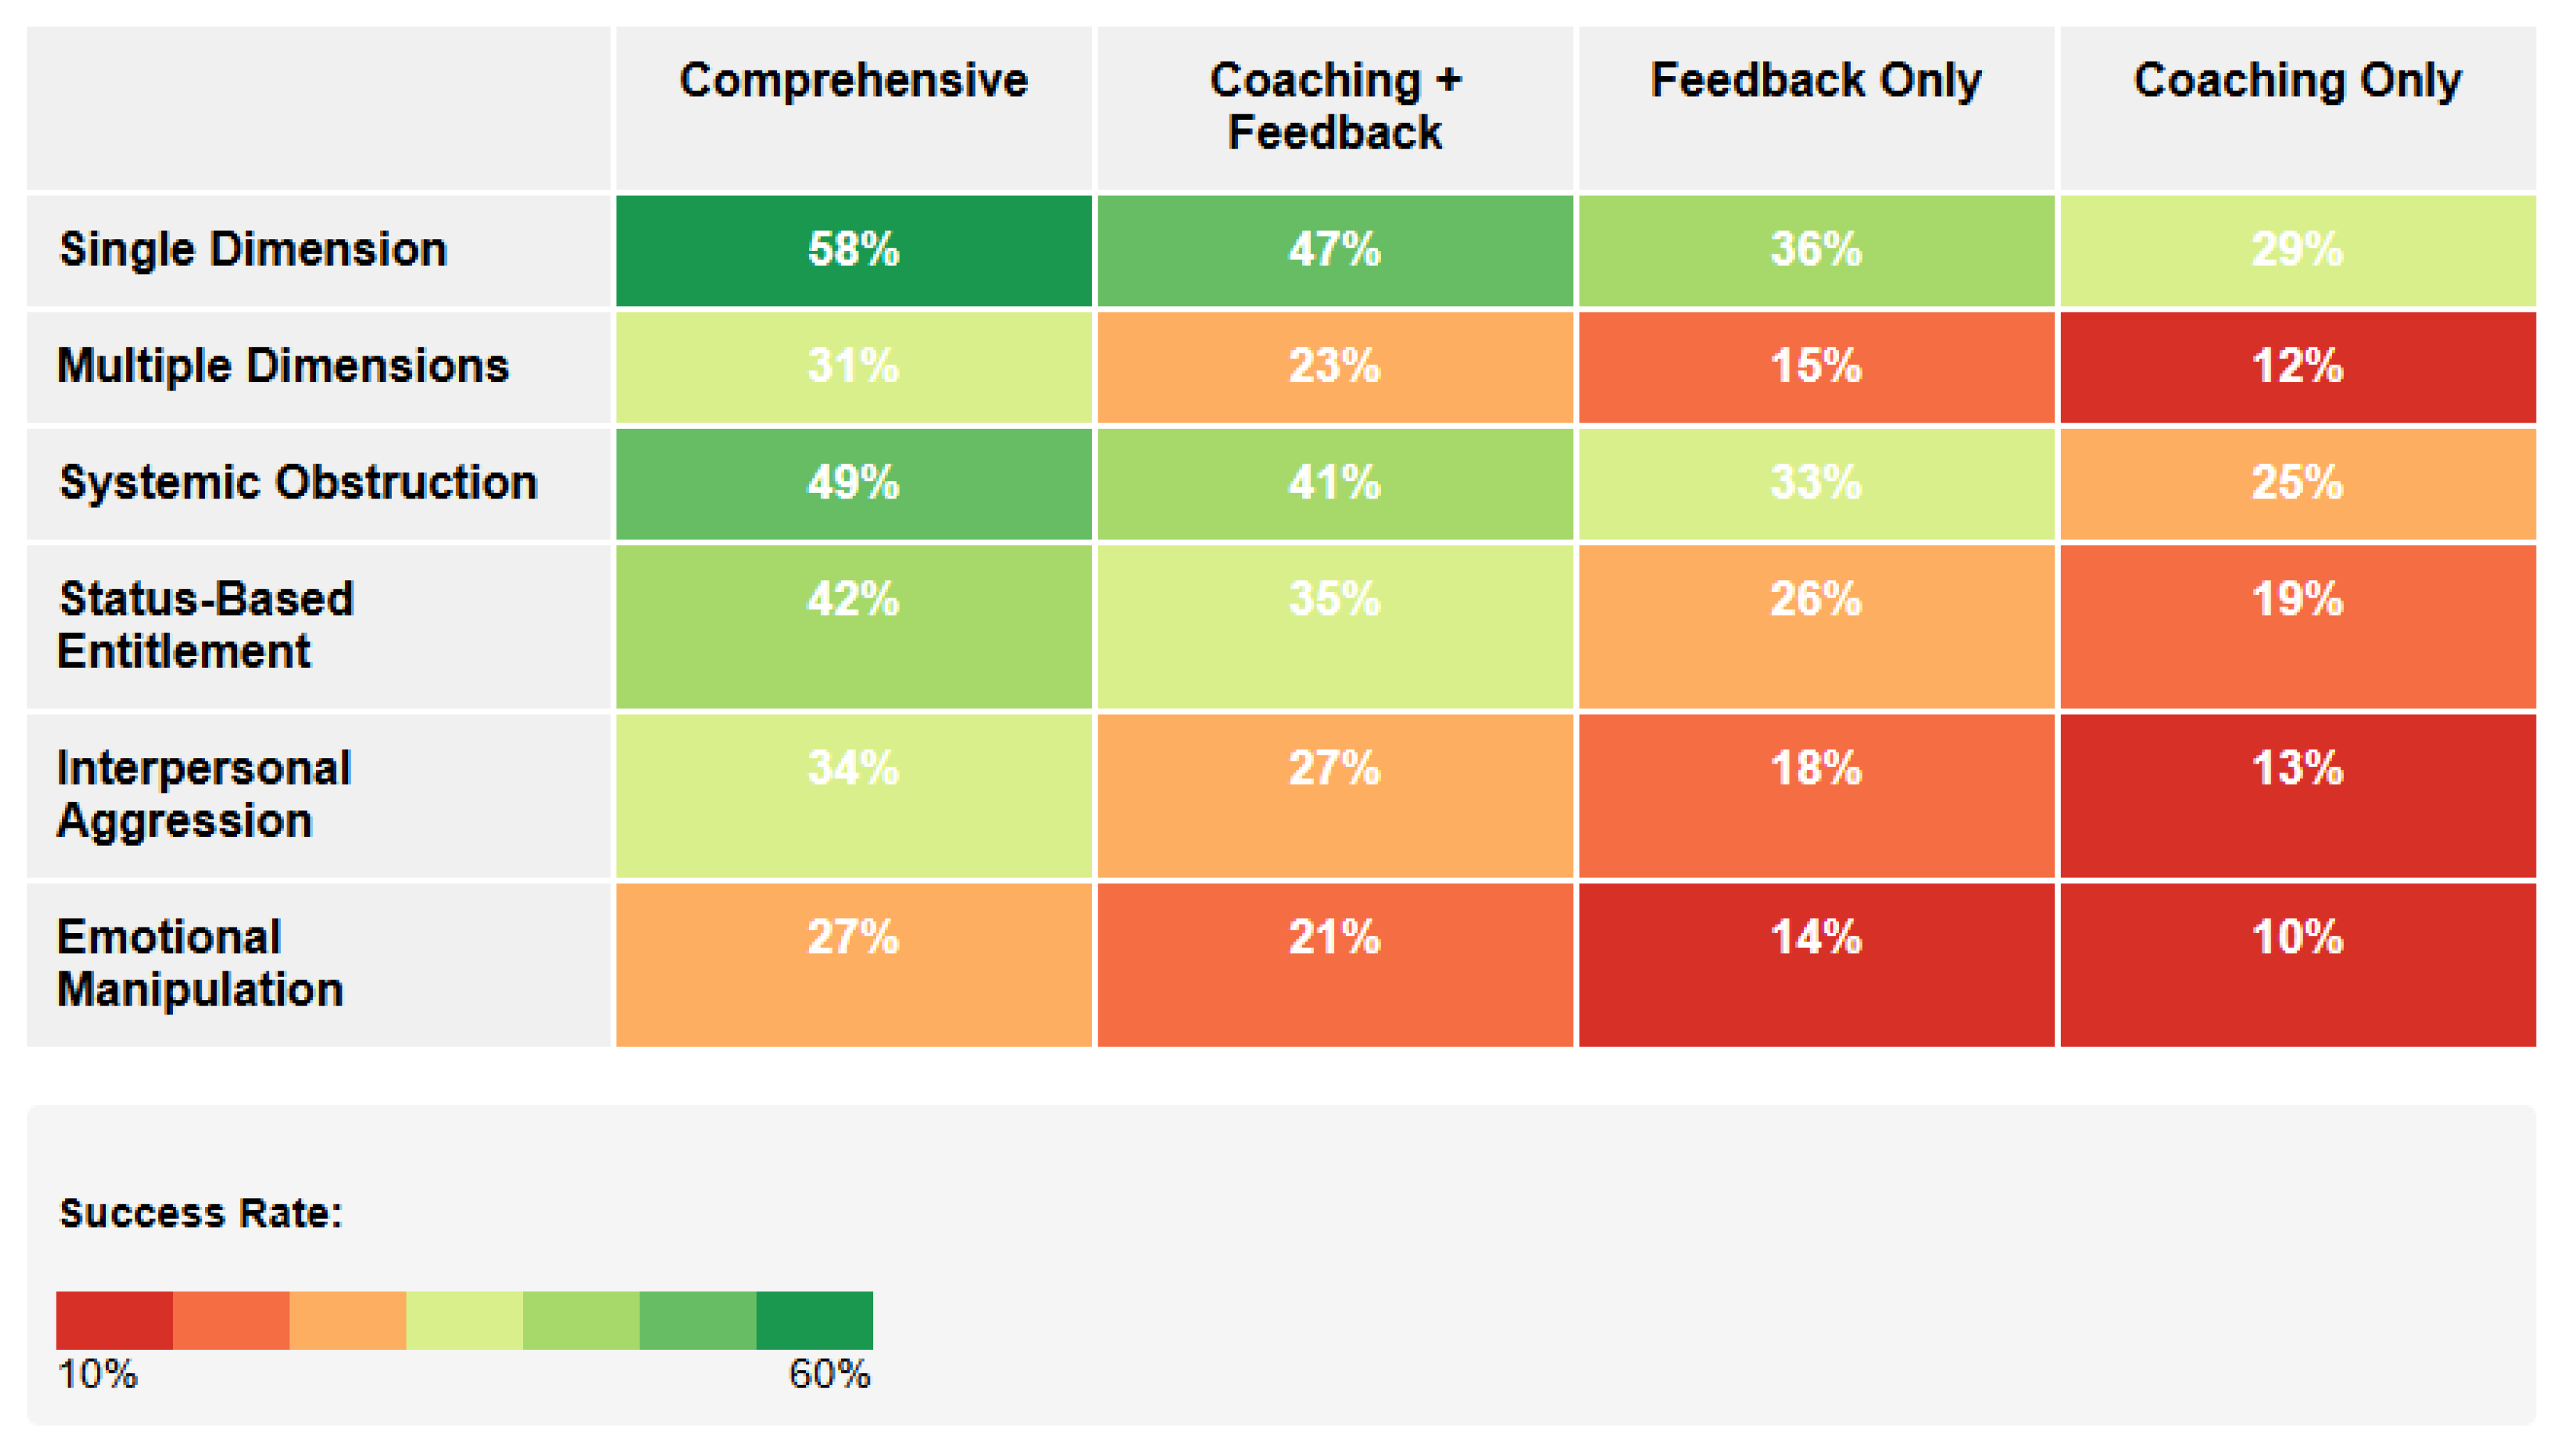
Table 1.
Demographic Characteristics of Difficult Leaders in the Longitudinal Sample (N=42).
| Characteristic | Category | n | % |
|---|---|---|---|
| Organizational Level | Frontline Management | 14 | 33.3% |
| Middle Management | 17 | 40.5% | |
| Executive Leadership | 11 | 26.2% | |
| Industry | Technology | 9 | 21.4% |
| Healthcare | 8 | 19.0% | |
| Financial Services | 7 | 16.7% | |
| Manufacturing | 6 | 14.3% | |
| Professional Services | 5 | 11.9% | |
| Retail | 4 | 9.5% | |
| Non-profit | 3 | 7.1% | |
| Gender | Male | 30 | 71.4% |
| Female | 12 | 28.6% | |
| Team Size | Small (5-10 direct reports) | 13 | 31.0% |
| Medium (11-20 direct reports) | 21 | 50.0% | |
| Large (>20 direct reports) | 8 | 19.0% | |
| Organizational Tenure | <3 years | 9 | 21.4% |
| 3-7 years | 18 | 42.9% | |
| >7 years | 15 | 35.7% |
Table 2.
Factor Analysis Results for Difficult Leadership Dimensions.
| Dimension | Factor Loading Range | Explained Variance | Mean Score (SD) | Primary Behavioral Indicators |
|---|---|---|---|---|
| Interpersonal Aggression | .67-.89 | 28.4% | 3.84 (0.91) | Public criticism, intimidation, belittling comments, aggressive nonverbal behaviors |
| Status-Based Entitlement | .71-.84 | 23.7% | 4.06 (0.78) | Special privilege expectations, arbitrary rule enforcement, credit-taking for others' work |
| Emotional Manipulation | .64-.82 | 19.2% | 3.59 (1.04) | Mood volatility, guilt induction, emotional labor exploitation, playing favorites |
| Systemic Obstruction | .62-.79 | 17.6% | 3.72 (0.88) | Information hoarding, progress blocking, unnecessary bureaucracy creation, sabotage |
Note: Scores based on 5-point scale where higher values indicate more problematic behaviors. Model fit indices: CFI = .94, RMSEA = .068, SRMR = .054.
Table 4.
Operational Impact Costs Associated with Difficult Leadership.
| Cost Category | Difficult Leader Teams | Comparison Teams | Difference | Statistical Significance | Effect Size |
|---|---|---|---|---|---|
| Innovation Deficit | |||||
| Psychological safety scores | -1.8 SD | Baseline | -1.8 SD | t(82) = 10.46, p < .001 | d = 2.30 |
| New ideas generated | -41% (SD=13%) | Baseline | -41% | t(82) = 6.78, p < .01 | d = 1.49 |
| Time to prototype | +180% (SD=60%) | Baseline | +180% | t(82) = 9.14, p < .001 | d = 2.01 |
| Employee suggestion implementation | -53% (SD=17%) | Baseline | -53% | t(82) = 7.32, p < .001 | d = 1.61 |
| Median annual innovation deficit cost | $386,000 (IQR: $219,000-$512,000) | - | - | - | - |
| Decision Quality | |||||
| Information sharing in decisions | -47% (SD=15%) | Baseline | -47% | t(82) = 6.92, p < .001 | d = 1.52 |
| Alternatives considered | -64% (SD=19%) | Baseline | -64% | t(82) = 8.37, p < .001 | d = 1.84 |
| Decision reversal rates | +130% (SD=50%) | Baseline | +130% | t(82) = 7.14, p < .01 | d = 1.57 |
| Financial outcomes of decisions | -18.4% | Baseline | -18.4% | β = -.32, p < .05 | - |
| Median annual decision quality cost | $278,000 (IQR: $163,000-$427,000) | - | - | - | - |
| Collaboration Breakdown | |||||
| Cross-functional connections | -64% (SD=21%) | Baseline | -64% | t(82) = 8.23, p < .001 | d = 1.81 |
| Information-sharing density | -47% (SD=14%) | Baseline | -47% | t(82) = 7.19, p < .01 | d = 1.58 |
| Cross-functional response time | +110% (SD=40%) | Baseline | +110% | t(82) = 7.84, p < .001 | d = 1.72 |
| Median annual collaboration cost | $304,000 (IQR: $187,000-$436,000) | - | - | - | - |
Table 5.
Cultural Contagion Costs Associated with Difficult Leadership.
| Cost Category | Measurement | Result | Statistical Significance |
| Behavior Modeling | |||
| Middle manager behavior adoption | Likelihood ratio | 3.2x higher within 12 months | χ²(1) = 11.37, p < .01, φ = .46 |
| Horizontal team aggression | Before/after comparison | +67% increase | t(41) = 6.82, p < .001, d = 1.05 |
| Adjacent department engagement | Comparison to control departments | -14 percentage points | F(2,63) = 9.47, p < .05, η² = .23 |
| Median annual behavior modeling cost | $217,000 (IQR: $142,000-$358,000) | - | - |
| Reputation Damage | |||
| External platform ratings | Comparison to industry benchmarks | -0.8 points (5-point scale) | t(22) = 4.37, p < .01, d = 0.92 |
| Candidate acceptance rates | Comparison to other positions | -23% | χ²(1) = 9.14, p < .01, φ = .37 |
| Compensation premiums | Comparison to market benchmarks | +18% | t(56) = 3.92, p < .05, d = 0.52 |
| Median annual reputation cost | $264,000 (IQR: $183,000-$421,000) | - | - |
| Trust Erosion | |||
| Leadership trust scores | Organization-wide measurement | -31 percentage points | r = -.47, p < .001 |
| Persistence of trust deficit | Longitudinal tracking | 18 months (SD=5.4) | - |
| Path analysis outcomes | Structural equation modeling | Mediated relationships with: <br>- Organizational commitment (β = .38, p < .001)<br>- Cynicism (β = .42, p < .001)<br>- Discretionary effort (β = -.36, p < .01) | - |
| Median annual trust erosion cost | $183,000 (IQR: $92,000-$276,000) | - | - |
Table 6.
Total Cost of Difficult Leadership by Industry and Organizational Level.
| Category | Mean Cost Multiplier (× Leader Compensation) | SD | Range | ANOVA Results |
|---|---|---|---|---|
| Overall | 8.7 | 4.3 | 3.2-27.3 | - |
| By Industry | F(6,35) = 6.73, p < .01, η² = .31 | |||
| Technology | 12.4 | 5.2 | 6.3-27.3 | - |
| Professional Services | 10.1 | 3.7 | 5.8-19.4 | - |
| Healthcare | 9.3 | 3.4 | 4.7-17.6 | - |
| Financial Services | 8.7 | 3.1 | 4.2-15.8 | - |
| Retail | 7.9 | 2.8 | 4.4-14.2 | - |
| Non-profit | 7.3 | 2.7 | 3.9-11.8 | - |
| Manufacturing | 6.4 | 2.3 | 3.2-10.3 | - |
| By Organizational Level | F(2,39) = 8.92, p < .001, η² = .34 | |||
| Executive | 14.2 | 5.8 | 7.6-27.3 | - |
| Middle Management | 8.3 | 3.2 | 4.1-17.8 | - |
| Frontline Management | 6.1 | 2.1 | 3.2-11.4 | - |
Table 7.
Cost Accumulation Over Time for Difficult Leadership.
| Time Period | Direct Financial Costs (% of Peak) | Operational Impact Costs (% of Peak) | Cultural Contagion Costs (% of Peak) | Total Costs (% of Peak) |
| 0-6 months | 42% (SD=15%) | 38% (SD=17%) | 21% (SD=12%) | 34% (SD=13%) |
| 7-12 months | 68% (SD=14%) | 61% (SD=16%) | 47% (SD=18%) | 59% (SD=14%) |
| 13-18 months | 85% (SD=11%) | 82% (SD=13%) | 72% (SD=19%) | 80% (SD=12%) |
| 19-24 months | 94% (SD=7%) | 91% (SD=8%) | 88% (SD=12%) | 91% (SD=8%) |
| 25-36 months | 100% (SD=0%) | 100% (SD=0%) | 100% (SD=0%) | 100% (SD=0%) |
Disclaimer/Publisher’s Note: The statements, opinions and data contained in all publications are solely those of the individual author(s) and contributor(s) and not of MDPI and/or the editor(s). MDPI and/or the editor(s) disclaim responsibility for any injury to people or property resulting from any ideas, methods, instructions or products referred to in the content. |
© 2025 by the authors. Licensee MDPI, Basel, Switzerland. This article is an open access article distributed under the terms and conditions of the Creative Commons Attribution (CC BY) license (http://creativecommons.org/licenses/by/4.0/).
Copyright: This open access article is published under a Creative Commons CC BY 4.0 license, which permit the free download, distribution, and reuse, provided that the author and preprint are cited in any reuse.


