Submitted:
21 June 2025
Posted:
24 June 2025
You are already at the latest version
Abstract
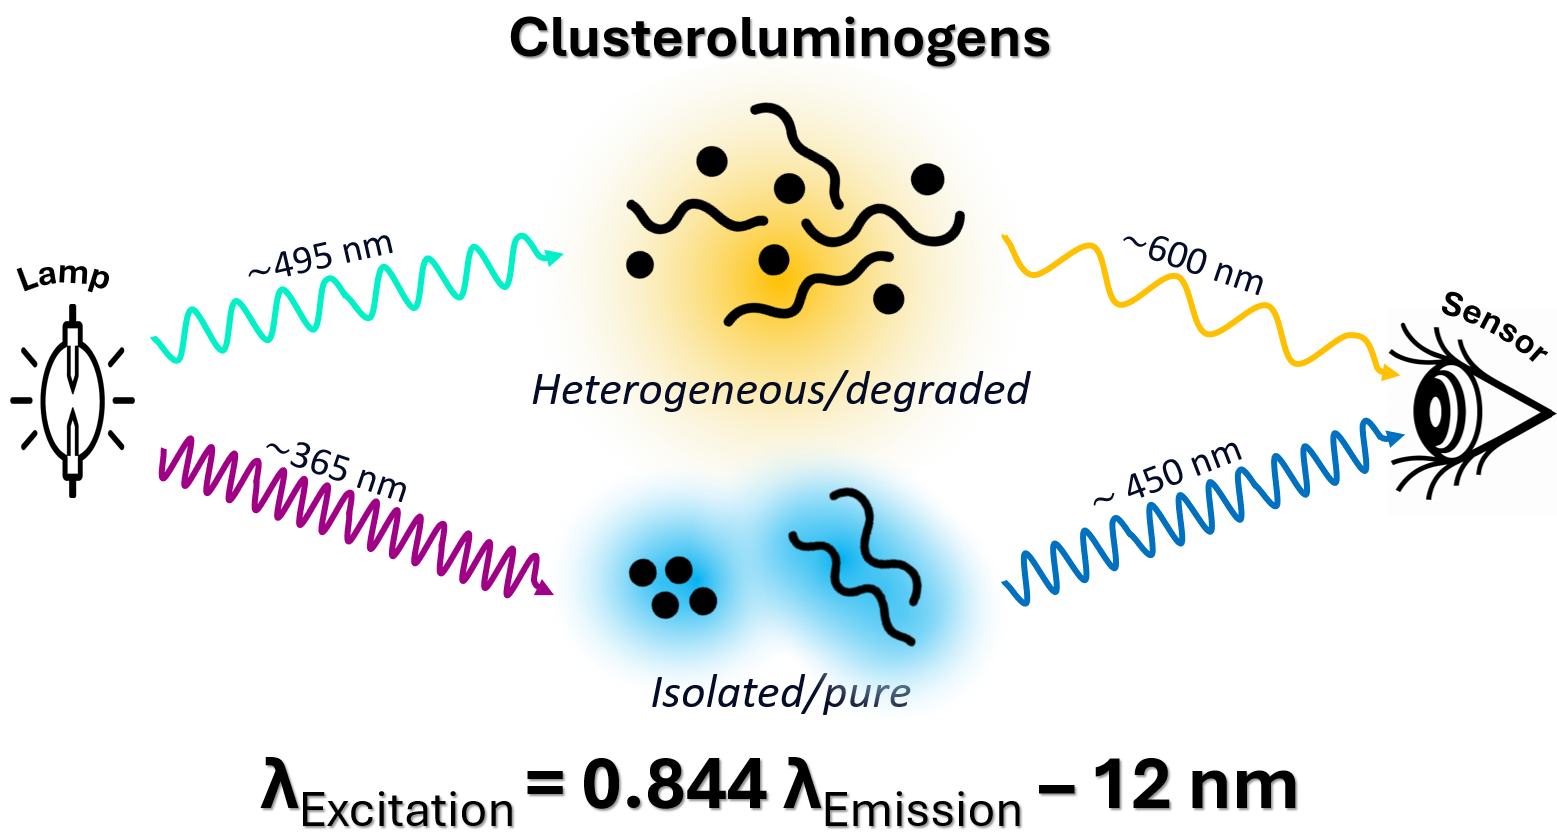
A key discovery of this study is the strong correlation (r = 0.96) between excitation and emission maxima across chemically distinct clusteroluminogens. All 157 evaluated peaks fall along a single regression line (Ex = 0.844 Em -12 nm), a pattern that was not valid for conventional fluorophores. This suggests a general principle of clusteroluminescence. We show that in lignocellulosic materials, peak positions reflect chemical interactions: isolated lignin and cellulose showed short excitation and emission wavelengths, while native wood exhibited longer wavelengths. Fungal or photoinduced degradation led to a further red-shift. These effects are attributed to increased molecular heterogeneity, reducing the effective energy gap within the lignocellulosic complex. We conclude that the spectral position reflects the degree of molecular interaction rather than the chemical structure of individual molecules. It may serve as a novel analytical parameter for assessing purity and degradation in a wide range of polymers.
Keywords:
clusteroluminescence
; through-space interaction
; excitation-emission correlation
; red-shift
; polymer luminescence
; excitation-dependent emission
; wood fluorescence
1. Introduction
In the recent years, clusteroluminogens have gained increasing attention. This new class of luminogens shows properties that help overcome typical problems of conventional fluorophores. Many clusteroluminogens are organic, biobased and biodegradable, abundant, cheap, non-toxic, water-soluble, and light-stable. They have huge potential for a wide range of applications, including nanosensors for ecosystem monitoring, markers in medical systems, materials for optoelectronics, encryption, and forensics. [1,2,3,4,5]
The physical principles underlying clusteroluminescence remain highly discussed. [6,7] It is widely accepted that clusteroluminescence originates from the spatial clustering of non-conjugated functional groups (e.g. hydroxyl, carbonyl, amino, or ester groups), which form through-space interactions. [8,9,10,11] As a result, the emission mechanism is substantially different from conventional fluorescence.
Interestingly, this phenomenon also occurs in naturally abundant polymeric materials such as lignocellulose in wood. For decades, wood was regarded as non-luminescent, except for a few strongly fluorescent species, [12,13] where the fluorescence is caused by specific soluble fluorophores. These rare exceptions must be carefully distinguished from the weak native blue luminescence of lignin, [14,15] cellulose [16,17] and other polysaccharides, [18,19] which is consistently present in all wood species [20,21] and can be shifted by various modifications of the wood chemistry. [21,22,23]
The native luminescence existing in all wood species can be attributed to clusteroluminescence. This conclusion is supported by the fact that wood shows the key characteristics that distinguish clusteroluminogens from fluorophores, as summarized by Zhang et al.Zhang et al.
Polysaccharides and lignin do not contain extended conjugated π-electron systems that could explain luminescence in the visible range. [25,26]
Their luminescence is greatly enhanced in the solid state, but negligible in dilute solutions, [25] also known as aggregation-induced emission.
Their excitation maxima lie at longer wavelengths than the absorption maxima. [27,28]
Their emission maxima depend on the excitation wavelength, shifting to longer wavelengths with increased excitation wavelength. [29,30,31] This excitation-dependent emission is a violation of Kasha’s rule, a basic principle in fluorescence. [32]
These characteristics of wood clusteroluminescence introduce methodological requirements, which have often been unaddressed in earlier studies. The majority of studies start from well-established rules in fluorescence analysis, like the similarity of absorption and excitation spectra, and the independence of emission wavelength from excitation. Accordingly, the absorption maximum is often chosen as the single excitation wavelength, which does not reveal the true emission maximum in systems with excitation-dependent emission. In conclusion, full excitation-emission-matrices (EEMs) are necessary to properly characterize clusteroluminescence.
This study takes wood and its major compounds as starting points for exploring clusteroluminescence. It aims to provide corresponding EEM data, placing them in the context of other clusteroluminogens and identifying commonalities and differences in their photophysical behaviour.
2. Material and Methods
2.1. Samples
In an exploratory approach, a broad range of lignocellulosic materials was selected and grouped into three categories: untreated wood, degraded wood, and isolated compound including related biopolymers.
In the unmodified class, 14 light-coloured wood species were chosen to reduce the effect of reabsorption: Abies alba, Acer ssp., Alnus glutinosa, Betula pendula, Carpinus betulus, Fagus sylvatica, Fraxinus excelsior, Ochroma ssp., Picea abies, Prunus avium sapwood, Terminalia superba, Tilia ssp., and Triplochiton scleroxylon. The degraded wood samples included Fagus sylvatica wood degraded by Trametes versicolor, Picea abies wood degraded by Serpula lacrymans, and photodegraded Acer ssp. wood. The isolated and related lignocellulosic materials comprised bacterial cellulose, cellulose for column chromatography, cotton nettle, chitin from shrimp shells, fluffy mycelium of Serpula lacrymans, D(+)Xylose, filter paper, microcrystalline cellulose with varying moisture content, and organosolv lignin from Eucalyptus ssp. A detailed list of sample origin and treatments is given in the supplementary material. All samples were stored in the dark at room temperature until measured, unless otherwise stated.
2.2. Fluorescence Spectroscopy
All solid samples were analysed in front-face configuration using a Hitachi F-7100 spectrofluorometer equipped with a solid sample holder and an additional light path-modifying device described elsewhere. [33] The spectra were corrected according to the specifications of the manufacturer, and a 20 nm moving-average smoothing was applied to the calibration curve. Powder samples were filled in a PMMA cuvette and measured in the same way as the other solid samples. Fluid and dispersed samples were analysed using a quartz cuvette in 90° configuration. Data collection was performed with the Hitachi FL Solutions software (Version 4.2). The spectral correction and the removal of scattering signals was carried out in MATLAB (Version R2023A) using the EEM filtering tool in the PLS Toolbox (Version 9.0, Eigenvector Research Inc., USA).
2.3. Literature Analysis
A total of 120 excitation maxima (Ex) and emission maxima (Em) of various clusteroluminogens were compiled from literature. To exclude conventional fluorescence, only peaks that met key criteria of clusteroluminescence were included: (1) absence of extended conjugated structures able to explain conventional fluorescence (2) an excitation maximum substantially different from the absorption maximum, and (3) excitation-dependent emission.
These clusteroluminogens included a range of polysaccharides, [34,35,36,37,38,39,40,41,42,43,44] lignin, [34,44] proteins, [36,45,46,47,48,49,50,51,52] small organic molecules, [53,54] synthetic polymers [55,56,57,58,59,60] and polymer dots or carbon dots. [61,62,63,64,65,66] A detailed list of substances, peak positions, and measurement conditions is provided in the supplementary material. These clusteroluminogens were compared with a reference dataset of conventional fluorophores. [67]
3. Results
Across all spectra included in this study, we found a strong correlation between the wavelengths of excitation and emission maxima. This included own measurements and literature spectra of lignocellulosics, proteins, synthetic polymers, organic small molecules, and polymer or carbon dots (Figure 1). The correlation coefficient was r = 0.96. A linear regression analysis yielded eq (1):
where Ex is the excitation maximum and Em is the emission maximum of the respective peak. The root mean squared error (RMSE) of these clusteroluminogens was 12 nm. In contrast, the projection of a set of conventional fluorophores [67] onto the regression line yielded an RMSE of 89 nm, indicating a rather random distribution. It can be safely concluded that eq (1) reflects a general principle in clusteroluminescence, while it is not valid for conventional fluorophores.
Ex = 0.844 Em – 12 nm
The lignocellulosics measured in this study also grouped along this regression line, with an RMSE of 14 nm. When measured in pure form, these chemical compounds of wood peaked at the lower end of the regression line, with Ex 310-360 nm and Em 388-460 nm (Figure 2a). Representative EEMs of isolated cellulose and lignin are shown Figure 2b and c, respectively.
4. Discussion
4.1. Correlation Between the Wavelengths of Excitation and Emission Maxima
The most striking observation in this study was the strict correlation between the wavelengths of excitation and emission maxima. The fact that this holds across chemically very different organic polymers suggests a new principle, contrary to conventional fluorescence (Figure 1). To the best of our knowledge, this has not been reported before.
We therefore propose to add the following point to the criteria of clusteroluminogens as listed by Zhang et al.:Zhang et al. “By empiric evidence, the wavelengths of the excitation (Ex) and emission (Em) maxima of clusteroluminogens follow a consistent relationship (r = 0.96), where the excitation maximum can be estimated by eq (1).”
In order to better reflect the underlying molecular phenomena, the wavelengths of excitation and emission maxima were converted into electron volts (eV), and a new regression analysis was performed in energy space. For theoretical consistency and simplicity, the regression was constrained to pass through the origin. This yielded eq (2):
where EEx and EEm are the excitation and emission energies, respectively. This means that on average, the excitation energy of clusteroluminogens is 22.4 % higher than their emission energy. The regression performance (r = 0.95; RMSE = 0.10675 eV) was comparable to the wavelength-based model described above.
EEx = 1.224 * EEm
For comparison, an unconstrained energy-based regression (i.e. one that allowed a non-zero intercept) produced an offset of -0.039 eV and an RMSE of 0.10668 eV. Given the small offset and the virtually identical RMSE, forcing the regression through the origin is well justified.
The variation in this study is partially explained by the fact that spectral correction was only applied in part of the reviewed studies, and values were recorded on different instruments. Both instrumental spectrum correction and inter-instrumental variations (even after correction) are reported to highly contribute to statistical error of fluorescence spectra. [68] Therefore, an RMSE of 12 nm is within expectations. Still, not all deviations from the above equations could completely be explained by instrumental error. Different classes of substances seemed to group left or right of the regression line (Figure 1).
The close correlation and the fact that it applies to a great variety of substances are a strong indication of an underlying energetic principle of through-space interactions in clusteroluminogens. Within this exploratory study, we provide a robust empirical observation that may inspire future research and detailed mechanistic explanations.
4.2. Analytical Interpretation of the Peak Position on the Regression Line
In a recent review, Zhao et al.Zhao et al. identified three key components of clusteroluminescence: (1) the presence of electron-rich moieties like hydroxyls, carbonyls, amines, amides etc., (2) their clustering, and (3) conformational rigidity of the clusters. Therefore, clusteroluminogens are generally sensitive to their surrounding environments, such as viscosity, temperature, pH, etc.
Zhang et al.Zhang et al. proposed that the “chromophore” in clusteroluminogens is built on inter- and intramolecular through-space conjugation. From isolated to linked and further to clustered forms, the energy gap decreases, resulting in a red-shifted clusteroluminescence. Based on that, cluster size is widely accepted to influence the emission wavelength of clusteroluminogens, where “size” refers to the molecular weight of polymers, diameter of nanoparticles, generations of dendrimers etc. [24]
Our interpretation of the peak shifts measured in this study is that not only cluster size, but structural heterogeneity (in particular with regard to functional groups) within a material effectively reduce the energy gap and are therefore responsible for the observed peak shifts. This conclusion is based on the following observations.
Across the lignocellulosic samples measured in this study, we observed a continuous red-shift with increasing structural heterogeneity within the materials. Bacterial cellulose, the purest form of cellulose [69] without residues of lignin, exhibited the shortest Ex and Em maxima of 315 and 384 nm, respectively (Figure 2b). Cotton nettle, as an example for a less pure sample, showed two peaks at longer excitation and emission wavelengths (335/425 and 360/460 nm, see supplementary material).
Furthermore, the typical peaks observed in isolated polysaccharides and lignin did not appear as distinct peaks or even as shoulders in the spectra of wood, and not at all in degraded wood. For example, cellulose is known to be relatively stable against photodegradation, [70] but its peaks were not observed in photodegraded wood (Figure 2f), not even as remnants. We explain this by a greater structural heterogeneity in degraded wood, i.e. the introduction of new electron-rich entities (e.g. carbonyl groups). These new entities interact with the existing ones, forming new energy levels and thereby effectively decreasing the energy gap.
Remarkably, the observed shifts were similar across the assessed fungal and photodegradation processes, although different wood compounds were degraded. While photodegradation preliminary degrades lignin, [70] Serpula lacrymans selectively metabolizes the polysaccharides in wood. [71] Trametes versicolor attacks both lignin and polysaccharides. [70] The chance that all three processes produce the same fluorophores is low. A common feature of these processes is that they are all oxidative and foster the formation of carbonyl and carboxyl groups, [20,70,72] but in different parts of the wood. Both carbonyl and carboxyl groups are known to participate in cluster formation. [6] This underlines the understanding of clusteroluminescence as a consequence of interactions between electron-rich entities rather than individual fluorophores.
To critically evaluate our interpretation of the structural heterogeneity as a factor driving peak shifts of clusteroluminogens, we evaluated factors associated with wavelength shifts reported in literature. A brief synthesis is presented in table 1.
Most of the reported red-shifts can be satisfactorily explained by the introduction of additional accessible energy levels decreasing the effective energy gap. In the upper part of Table 1, this involves introduction of new functional groups or heteroatoms (e.g. O, N, or S) into existing systems. This is referred to as increased structural heterogeneity above. The same effect (additional energy levels) can be achieved by rearrangement of existing structures as in the lower part of Table 1. Blue-shifts, on the contrary, mostly involve the decrease in accessible energy levels. This translates to removal of impurities in the upper part of Table 1, and reduction of cluster size or isolation of clusters (e.g. by dissolution of solids) in the lower part.
Taken together, the reviewed literature supports the hypothesis that structural heterogeneity is a key factor driving the observed red-shifts in clusteroluminescence. The introduction of new electron-rich groups increases the heterogeneity of clusteroluminescent entities. As a result, additional energy levels are formed, decreasing the energy gaps for through-space interaction. By contrast, isolated compounds (amino acids, polysaccharides, and lignin fragments) exhibit relatively short-wavelength emission, consistent with their lower structural heterogeneity.
For specific systems, the effects of heterogeneity require experimental validation. Investigations using model substances will be addressed in future studies.
4.3. Implications for Analytical Methods
Established spectral decomposition methods such as Parallel Factor Analysis (PARAFAC) have been highly successful in resolving dilute solutions of fluorophores in complex systems. [92,93,94] However, the properties of clusteroluminescence present a unique challenge and a major disruptive factor in fluorescence spectra, especially in concentrated or solid samples. While conventional factorization models assume independent spectral components with fixed excitation and emission spectra, they cannot be directly applied to the analysis of clusteroluminescence. Our results highlight the following key limitations that must be considered when analysing clusteroluminescence:
Variability in peak positions: The same substance can contribute to both short- and long-wavelength luminescence along the regression line (Figure 1), depending on its molecular environment (e.g. cellulose in pure form, in wood, or in degraded wood). This means that there is no specific peak position for one chemical compound in mixtures of clusteroluminogens.
Reduced number of independent variables: Since the excitation and emission maxima are not independent from each other (see eq (1)), the informative value of excitation-emission matrices (EEMs) is effectively reduced by one dimension. This decreases the specificity of EEMs when analysing clusteroluminogens.
Violation of Kasha’s rule: Unlike conventional fluorophores, clusteroluminogens emit from multiple emissive states, resulting in excitation-dependent emission. [9] The record of one excitation and one emission spectrum does therefore not reveal the true shape of a clusteroluminescence peak.
No linear correlation between concentration and intensity: Since clusteroluminogens emit best in concentrated and solid state, they cannot be dissolved or diluted without affecting their emission properties.
These challenges complicate the use of established trilinear algorithms in systems with extensive clusteroluminescence and underline the need for a novel analytical perspective. A fundamental research opportunity consists in the further development of shift-invariant factorization models like SIT [95] or complementary analytical approaches to better capture the unique spectral properties of clusteroluminescence.
As a first conceptual attempt especially suited for clusteroluminescence, we propose that the peak position along the excitation-emission regression line (Figure 1) should be considered a new analytic parameter, which provides information about the purity, heterogeneity, and cluster size of luminescent species within a material. Similar to synchronic fluorescence spectroscopy, excitation and emission wavelengths could be scanned simultaneously. Instead of a fixed offset, however, eq (1) would be the underlying rule. Figure 3 shows such a spectrum.
In this way, most relevant information from full EEMs is retained, while greatly reducing the amount of data. This approach offers several advantages:
Faster spectra acquisition: Instead of acquiring a full EEM, excitation and emission wavelengths can be scanned simultaneously.
Little to no sample preparation needed: Since clusteroluminogens emit best in the solid or concentrated state, clusteroluminescence enables direct measurement in front-face mode. This allows rapid and non-destructive analysis for industrial in-line and on-line applications.
Potential applications are widespread, including industrial process control, life sciences, material quality assessment, and the monitoring of ageing and degradation processes in polymers. In addition to spectroscopic techniques, the reduced dimensionality of the concept may inspire new imaging strategies. For instance, multispectral and luminescence imaging systems, from microscopy to large-scale sensing, could be adapted to specifically capture the important excitation/emission combinations of clusteroluminogens and display the peak position in a simple colour scale, spatially resolved per each pixel of an image.
5. Conclusions
The found regression line as a specific feature of clusteroluminogens may assist researchers in differentiating between conventional fluorescence and clusteroluminescence. In polymer analysis, it offers a potential tool for assessing clustering behaviour, material purity, ageing and other structural modifications without the need for full EEMs. Future research should refine this approach, integrate it into industrial monitoring systems, and explore its applicability beyond lignocellulosics.
Supplementary Materials
The following supporting information can be downloaded at the website of this paper posted on Preprints.org. Table S1: Origin and treatment of examined samples. Table S2: Peak positions of the clusteroluminogens. Figures S1-29: EEMs of examined samples.
Author Contributions
The manuscript was written through contributions of all authors. Frank B. Peters: Conceptualisation, Methodology, Validation, Formal analysis, Investigation, Data curation, Writing (Original draft), Visualisation. Andreas O. Rapp: Supervision, Writing – Review and Editing. All authors have given approval to the final version of the manuscript.
Data Availability Statement
The original data presented in the study are openly available in FigShare (add DOI).
Acknowledgments
The authors wish to thank the Department of Microbiology of the University of Innsbruck for kindly providing the field samples of Serpula lacrymans-attacked wood.
Conflicts of Interest
The authors declare no conflict of interest.
References
- Sakhno, T.V.; Sakhno, Y.; Kuchmiy, S.Y. Clusteroluminescence in Organic, Inorganic, and Hybrid Systems: A Review. Theor Exp Chem 2022, 58, 297–327. [Google Scholar] [CrossRef]
- Sakhno, T.V.; Sakhno, Y.E.; Kuchmiy, S.Y. Clusteroluminescence of Unconjugated Polymers: A Review. Theor Exp Chem 2023, 59, 75–106. [Google Scholar] [CrossRef]
- Chatterjee, D.P.; Pakhira, M.; Nandi, A.K. Fluorescence in "Nonfluorescent" Polymers. ACS Omega, Vol 3, Iss 9, Pp 11179-11183 (2018) 2020, 5, 30747–30766. [Google Scholar] [CrossRef]
- Wang, Z.; Zhang, H.; Li, S.; Lei, D.; Tang, B.Z.; Ye, R. Recent Advances in Clusteroluminescence. Top. Curr. Chem. (Cham) 2021, 379, 14. [Google Scholar] [CrossRef] [PubMed]
- Bresolí-Obach, R.; Castro-Osma, J.A.; Nonell, S.; Lara-Sánchez, A.; Martín, C. Polymers showing cluster triggered emission as potential materials in biophotonic applications. Journal of Photochemistry and Photobiology C: Photochemistry Reviews 2024, 58, 100653. [Google Scholar] [CrossRef]
- Zhao, Z.; Li, A.; Yuan, W.Z. Nonconventional Luminophores: Emission Mechanism, Regulation, and Applications. Acc. Chem. Res. 2025, 58, 612–624. [Google Scholar] [CrossRef]
- Liu, B.; Chu, B.; Zhu, L.; Zhang, H.; Yuan, W.-Z.; Zhao, Z.; Wan, W.-M.; Zhang, X.-H. Clusteroluminescence: A gauge of molecular interaction. Chinese Chemical Letters 2023, 34, 107909. [Google Scholar] [CrossRef]
- Tomalia, D.A.; Klajnert-Maculewicz, B.; Johnson, K.A.-M.; Brinkman, H.F.; Janaszewska, A.; Hedstrand, D.M. Non-traditional intrinsic luminescence: inexplicable blue fluorescence observed for dendrimers, macromolecules and small molecular structures lacking traditional/conventional luminophores. Progress in Polymer Science 2019, 90, 35–117. [Google Scholar] [CrossRef]
- Zhang, H.; Tang, B.Z. Through-Space Interactions in Clusteroluminescence. JACS Au 2021, 1, 1805–1814. [Google Scholar] [CrossRef]
- Tao, S.; Zhu, S.; Feng, T.; Zheng, C.; Yang, B. Crosslink-Enhanced Emission Effect on Luminescence in Polymers: Advances and Perspectives. Angew. Chem. Int. Ed Engl. 2020, 59, 9826–9840. [Google Scholar] [CrossRef]
- Tang, S.; Yang, T.; Zhao, Z.; Zhu, T.; Zhang, Q.; Hou, W.; Yuan, W.Z. Nonconventional luminophores: characteristics, advancements and perspectives. Chem. Soc. Rev. 2021, 50, 12616–12655. [Google Scholar] [CrossRef] [PubMed]
- Avella, T.; Dechamps, R.; Bastin, M. Fluorescence Study of 10,610 Woody Species from the Tervuren (Tw) Collection, Belgium. IAWA journal / International Association of Wood Anatomists 1988, 9, 346–352. [Google Scholar] [CrossRef]
- Wheeler, E.; Baas, P.; Gasson, P.E. IAWA List of Microscopic Features for Hardwood Identification. IAWA journal / International Association of Wood Anatomists 1989, 10, 219–332. [Google Scholar]
- Donaldson, L. Autofluorescence in Plants. Molecules 2020, 25, 2393. [Google Scholar] [CrossRef]
- Maceda, A.; Terrazas, T. Fluorescence Microscopy Methods for the Analysis and Characterization of Lignin. Polymers 2022, 14. [Google Scholar] [CrossRef] [PubMed]
- Olmstead, J.A.; Gray, D.G. Fluorescence Spectroscopy of Cellulose, Lignin and Mechanical Pulps: A Review. Journal of pulp and paper science : JPPS 1997, 23, J571. [Google Scholar]
- Ding, Q.; Han, W.; Li, X.; Jiang, Y.; Zhao, C. New insights into the autofluorescence properties of cellulose/nanocellulose. Scientific reports 2020, 10, 21387. [Google Scholar] [CrossRef]
- Wang, D.; Ju, J.; Wang, S.; Tan, Y. Research progress on the luminescence of biomacromolecules. Journal of Materials Science & Technology 2021, 76, 60–75. [Google Scholar] [CrossRef]
- Dou, X.; Zhou, Q.; Chen, X.; Tan, Y.; He, X.; Lu, P.; Sui, K.; Tang, B.Z.; Zhang, Y.; Yuan, W.Z. Clustering-Triggered Emission and Persistent Room Temperature Phosphorescence of Sodium Alginate. Biomacromolecules 2018, 19, 2014–2022. [Google Scholar] [CrossRef]
- Peters, F.B.; Rapp, A.O. Wavelength-dependent photodegradation of wood and its effects on fluorescence. Holzforschung 2021, 76, 60–67. [Google Scholar] [CrossRef]
- Peters, F.B.; Rapp, A.O. Moisture as key for understanding the fluorescence of lignocellulose in wood. Cellulose 2024, 31, 4149–4160. [Google Scholar] [CrossRef]
- Dal Fovo, A.; Cicchi, R.; Gagliardi, C.; Baria, E.; Fioravanti, M.; Fontana, R. Detecting Early Degradation of Wood Ultrastructure with Nonlinear Optical Imaging and Fluorescence Lifetime Analysis. Polymers 2024, 16. [Google Scholar] [CrossRef]
- Werner, T.; Pecina, H. Versuche zur Anwendung der Fluoreszenz-Spektroskopie in der Holztechnologie für die Bewertung von Pilzbefall in Holz. Holz als Roh- und Werkstoff 1995, 53, 49–55. [Google Scholar] [CrossRef]
- Zhang, H.; Zhao, Z.; McGonigal, P.R.; Ye, R.; Liu, S.; Lam, J.W.; Kwok, R.T.; Yuan, W.Z.; Xie, J.; Rogach, A.L.; et al. Clusterization-triggered emission: Uncommon luminescence from common materials. Materials Today 2020, 32, 275–292. [Google Scholar] [CrossRef]
- Xue, Y.; Qiu, X.; Wu, Y.; Qian, Y.; Zhou, M.; Deng, Y.; Li, Y. Aggregation-induced emission: the origin of lignin fluorescence. Polymer Chemistry 2016, 7, 3502–3508. [Google Scholar] [CrossRef]
- Du, L.-L.; Jiang, B.-L.; Chen, X.-H.; Wang, Y.-Z.; Zou, L.-M.; Liu, Y.-L.; Gong, Y.-Y.; Wei, C.; Yuan, W.-Z. Clustering-triggered Emission of Cellulose and Its Derivatives. Chin J Polym Sci 2019, 37, 409–415. [Google Scholar] [CrossRef]
- Zhang, H.; Wang, X.; Wang, J.; Chen, Q.; Huang, H.; Huang, L.; Cao, S.; Ma, X. UV–visible diffuse reflectance spectroscopy used in analysis of lignocellulosic biomass material. Wood Sci.Technol. 2020, 54, 837–846. [Google Scholar] [CrossRef]
- Khalid, A.; Zhang, L.; Tetienne, J.-P.; Abraham, A.N.; Poddar, A.; Shukla, R.; Shen, W.; Tomljenovic-Hanic, S. Intrinsic fluorescence from cellulose nanofibers and nanoparticles at cell friendly wavelengths. APL Photonics 2019, 4, 20803. [Google Scholar] [CrossRef]
- Djikanović, D.; Kalauzi, A.; Radotić, K.; Lapierre, C.; Jeremić, M. Deconvolution of lignin fluorescence spectra: A contribution to the comparative structural studies of lignins. Russ. J. Phys. Chem. 2007, 81, 1425–1428. [Google Scholar] [CrossRef]
- Takada, M.; Okazaki, Y.; Kawamoto, H.; Sagawa, T. Tunable Light Emission from Lignin: Various Photoluminescence Properties Controlled by the Lignocellulosic Species, Extraction Method, Solvent, and Polymer. ACS Omega, Vol 3, Iss 9, Pp 11179-11183 (2018) 2022, 7, 5096–5103. [Google Scholar] [CrossRef]
- Grönroos, P.; Bessonoff, M.; Salminen, K.; Paltakari, J.; Kulmala, S. Phosphorescence and fluorescence of fibrillar cellulose films. Nordic Pulp & Paper Research Journal 2018, 33, 246–255. [Google Scholar] [CrossRef]
- Kasha, M. Characterization of electronic transitions in complex molecules. Discuss. Faraday Soc. 1950, 9, 14. [Google Scholar] [CrossRef]
- Peters, F.B.; Rapp, A.O. A simple light path modifying device to reduce scattering in front-face fluorescence spectra. Methods Appl. Fluoresc. 2024, 12. [Google Scholar] [CrossRef]
- Auxenfans, T.; Terryn, C.; Paës, G. Seeing biomass recalcitrance through fluorescence. Sci Rep 2017, 7, 8838. [Google Scholar] [CrossRef] [PubMed]
- Hoque, M.; Kamal, S.; Raghunath, S.; Foster, E.J. Unraveling lignin degradation in fibre cement via multidimensional fluorometry. Sci Rep 2023, 13, 8385. [Google Scholar] [CrossRef] [PubMed]
- Nakamura, R.; Tanaka, Y.; Ogata, A.; Masakazu, N. Scientific evidence by fluorescence spectrometry for safflower red on ancient Japanese textiles stored in the Shosoin Treasure House repository. Studies in Conservation 2014, 59, 367–376. [Google Scholar] [CrossRef]
- Gong, Y.; Tan, Y.; Mei, J.; Zhang, Y.; Yuan, W.; Zhang, Y.; Sun, J.; Tang, B.Z. Room temperature phosphorescence from natural products: Crystallization matters. Sci. China Chem. 2013, 56, 1178–1182. [Google Scholar] [CrossRef]
- Jiang, J.; Lu, S.; Liu, M.; Li, C.; Zhang, Y.; Yu, T.B.; Yang, L.; Shen, Y.; Zhou, Q. Tunable Photoluminescence Properties of Microcrystalline Cellulose with Gradually Changing Crystallinity and Crystal Form. Macromolecular Rapid Communications 2021, 42, e2100321. [Google Scholar] [CrossRef]
- Li, M.; Li, X.; An, X.; Chen, Z.; Xiao, H. Clustering-Triggered Emission of Carboxymethylated Nanocellulose. Front. Chem. 2019, 7, 447. [Google Scholar] [CrossRef]
- Geng, Z.; Zhang, H.; Xiong, Q.; Zhang, Y.; Zhao, H.; Wang, G. A fluorescent chitosan hydrogel detection platform for the sensitive and selective determination of trace mercury(ii ) in water. J. Mater. Chem. A 2015, 3, 19455–19460. [Google Scholar] [CrossRef]
- Huang, J.; Wang, Y.-L.; Yu, X.-D.; Zhou, Y.-N.; Chu, L.-Q. Enhanced fluorescence of carboxymethyl chitosan via metal ion complexation in both solution and hydrogel states. International Journal of Biological Macromolecules 2020, 152, 50–56. [Google Scholar] [CrossRef] [PubMed]
- Dramićanin, T.; Lenhardt Acković, L.; Zeković, I.; Dramićanin, M.D. Detection of Adulterated Honey by Fluorescence Excitation-Emission Matrices. Journal of Spectroscopy 2018, 2018, 1–6. [Google Scholar] [CrossRef]
- Li, Q.; Wang, X.; Huang, Q.; Li, Z.; Tang, B.Z.; Mao, S. Molecular-level enhanced clusterization-triggered emission of nonconventional luminophores in dilute aqueous solution. Nat Commun 2023, 14, 409. [Google Scholar] [CrossRef] [PubMed]
- Radotić, K.; Kalauzi, A.; Djikanović, D.; Jeremić, M.; Leblanc, R.M.; Cerović, Z.G. Component analysis of the fluorescence spectra of a lignin model compound. Journal of Photochemistry and Photobiology B: Biology 2006, 83, 1–10. [Google Scholar] [CrossRef]
- Millington, K.R. Anomalous fluorescence of white hair compared to other unpigmented keratin fibres. Int. J. Cosmet. Sci. 2020, 42, 289–301. [Google Scholar] [CrossRef] [PubMed]
- Chen, X.; Luo, W.; Ma, H.; Peng, Q.; Yuan, W.Z.; Zhang, Y. Prevalent intrinsic emission from nonaromatic amino acids and poly(amino acids). Sci. China Chem. 2018, 61, 351–359. [Google Scholar] [CrossRef]
- Zhao, W.; Gao, M.; Kong, L.; Yu, S.; Zhao, C.; Chen, C. Chirality-Regulated Clusteroluminescence in Polypeptides. Biomacromolecules 2024, 25, 1897–1905. [Google Scholar] [CrossRef] [PubMed]
- Zhao, J.; Feng, F.; Tsai, M.; Zeng, H.; McLean, D.; Ruvolo, E.; Kollias, N.; Lui, H. Fluorescence Excitation Emission Matrix Spectroscopy for Endogenous Skin Fluorescence Characterization. Meet. Abstr. 2010; -01. [Google Scholar] [CrossRef]
- Komura, T.; Yamanaka, M.; Nishimura, K.; Hara, K.; Nishikawa, Y. Autofluorescence as a noninvasive biomarker of senescence and advanced glycation end products in Caenorhabditis elegans. NPJ Aging Mech. Dis. 2021, 7, 12. [Google Scholar] [CrossRef]
- Séro, L.; Sanguinet, L.; Blanchard, P.; Dang, B.T.; Morel, S.; Richomme, P.; Séraphin, D.; Derbré, S. Tuning a 96-well microtiter plate fluorescence-based assay to identify AGE inhibitors in crude plant extracts. Molecules 2013, 18, 14320–14339. [Google Scholar] [CrossRef]
- Bao, J.; Tong, C.; He, M.; Zhang, H. Luminescent polypeptides. Luminescence 2024, 39, e4594. [Google Scholar] [CrossRef]
- Xu, L.; Liang, X.; Zhong, S.; Gao, Y.; Cui, X. Clustering-Triggered Emission from Natural Products: Gelatin and Its Multifunctional Applications. ACS Sustainable Chem. Eng. 2020, 8, 18816–18823. [Google Scholar] [CrossRef]
- Zhang, Q.; Mao, Q.; Shang, C.; Chen, Y.-N.; Peng, X.; Tan, H.; Wang, H. Simple aliphatic oximes as nonconventional luminogens with aggregation-induced emission characteristics. J. Mater. Chem. C 2017, 5, 3699–3705. [Google Scholar] [CrossRef]
- Xie, W.; Deng, J.; Bai, Y.; Xiao, J.; Wang, H. Hydrogen-Bonding-Driven Nontraditional Photoluminescence of a β-Enamino Ester. Molecules 2023, 28. [Google Scholar] [CrossRef]
- Zhou, Q.; Cao, B.; Zhu, C.; Xu, S.; Gong, Y.; Yuan, W.Z.; Zhang, Y. Clustering-Triggered Emission of Nonconjugated Polyacrylonitrile. Small 2016, 12, 6586–6592. [Google Scholar] [CrossRef] [PubMed]
- Shang, C.; Wei, N.; Zhuo, H.; Shao, Y.; Zhang, Q.; Zhang, Z.; Wang, H. Highly emissive poly(maleic anhydride-alt-vinyl pyrrolidone) with molecular weight-dependent and excitation-dependent fluorescence. J. Mater. Chem. C 2017, 5, 8082–8090. [Google Scholar] [CrossRef]
- Miao, X.; Liu, T.; Zhang, C.; Geng, X.; Meng, Y.; Li, X. Fluorescent aliphatic hyperbranched polyether: chromophore-free and without any N and P atoms. Phys. Chem. Chem. Phys. 2016, 18, 4295–4299. [Google Scholar] [CrossRef]
- Chu, B.; Zhang, H.; Chen, K.; Liu, B.; Yu, Q.-L.; Zhang, C.-J.; Sun, J.; Yang, Q.; Zhang, X.-H.; Tang, B.Z. Aliphatic Polyesters with White-Light Clusteroluminescence. Journal of the American Chemical Society 2022, 144, 15286–15294. [Google Scholar] [CrossRef]
- Zhang, Y.; Fu, Q.; Shi, W. Synthesis and intrinsic blue fluorescence study of hyperbranched poly(ester-amide-ether). Sci. China Chem. 2010, 53, 2452–2460. [Google Scholar] [CrossRef]
- Wang, J.; Xu, L.; Zhong, S.; Yang, Y.; Feng, G.; Meng, Q.; Gao, Y.; Cui, X. Clustering-triggered emission of poly(vinyl) alcohol. Polym. Chem. 2021, 12, 7048–7055. [Google Scholar] [CrossRef]
- Zhu, S.; Zhang, J.; Wang, L.; Song, Y.; Zhang, G.; Wang, H.; Yang, B. A general route to make non-conjugated linear polymers luminescent. Chem. Commun. (Camb) 2012, 48, 10889–10891. [Google Scholar] [CrossRef]
- Zhu, S.; Meng, Q.; Wang, L.; Zhang, J.; Song, Y.; Jin, H.; Zhang, K.; Sun, H.; Wang, H.; Yang, B. Highly photoluminescent carbon dots for multicolor patterning, sensors, and bioimaging. Angew. Chem. Int. Ed Engl. 2013, 52, 3953–3957. [Google Scholar] [CrossRef] [PubMed]
- Zhu, S.; Wang, L.; Zhou, N.; Zhao, X.; Song, Y.; Maharjan, S.; Zhang, J.; Lu, L.; Wang, H.; Yang, B. The crosslink enhanced emission (CEE) in non-conjugated polymer dots: from the photoluminescence mechanism to the cellular uptake mechanism and internalization. Chem. Commun. (Camb) 2014, 50, 13845–13848. [Google Scholar] [CrossRef]
- Wang, J.; Sahu, S.; Sonkar, S.K.; Tackett II, K.N.; Sun, K.W.; Liu, Y.; Maimaiti, H.; Anilkumar, P.; Sun, Y.-P. Versatility with carbon dots – from overcooked BBQ to brightly fluorescent agents and photocatalysts. RSC Adv. 2013, 3, 15604. [Google Scholar] [CrossRef]
- Bavya, V.; Pillai, A.S.; Surendran, K.P.; T. P.D., R.; K.I., S. Fluorescent Carbon Dots from Bamboo Stem Waste: Synthesis, Characterization, and Inkjet Printing. ChemistrySelect 2024, 9. [Google Scholar] [CrossRef]
- Zattar, P.; Pires, A.; Mesquita, P. de; Pereira, J.; Vargas, F. Luminescent carbon dots obtained from cellulose and their applications as sensors for metal ions. Materials Chemistry and Physics 2022, 290, 126633. [Google Scholar] [CrossRef]
- McNamara, G. PubSpectra: Open Data Access Fluorescence Spectra, 2012. Available online: http://works.bepress.com/gmcnamara/9/.
- Cory, R.M.; Miller, M.P.; McKnight, D.M.; Guerard, J.J.; Miller, P.L. Effect of instrument-specific response on the analysis of fulvic acid fluorescence spectra. Limnol. Oceangr. Methods 2010, 8, 67–78. [Google Scholar] [CrossRef]
- Girard, V.-D.; Chaussé, J.; Vermette, P. Bacterial cellulose: A comprehensive review. J. Appl. Polym. Sci. 2024, 141. [Google Scholar] [CrossRef]
- Fengel, D.; Wegener, G. Wood: Chemistry, ultrastructure, reactions, Reprint der Orig.-Ausg. (ehem. de Gruyter); Kessel: Remagen, 2003; ISBN 3935638396. [Google Scholar]
- Watkinson, S.C.; Eastwood, D.C. Serpula lacrymans, Wood and Buildings. Adv. Appl. Microbiol. 2012, 78, 121–149. [Google Scholar] [CrossRef]
- Evans, P.D. Weathering of Wood and Wood Composites. In Handbook of wood chemistry and wood composites, 2.th ed.; Rowell, R.M., Ed.; CRC Press: Boca Raton, Fla, 2013; ISBN 9781439853801. [Google Scholar]
- Niyangoda, C.; Miti, T.; Breydo, L.; Uversky, V.; Muschol, M. Carbonyl-based blue autofluorescence of proteins and amino acids. PLoS One 2017, 12, e0176983. [Google Scholar] [CrossRef]
- Tarekegne, A.T.; Janting, J.; Ou, H. Strong visible-light emission in annealed poly(acrylic acid). Opt. Mater. Express 2020, 10, 3424. [Google Scholar] [CrossRef]
- Kollias, N.; Gillies, R.; Moran, M.; Kochevar, I.E.; Anderson, R.R. Endogenous skin fluorescence includes bands that may serve as quantitative markers of aging and photoaging. J. Invest. Dermatol. 1998, 111, 776–780. [Google Scholar] [CrossRef]
- Beisswenger, P.J.; Howell, S.; Mackenzie, T.; Corstjens, H.; Muizzuddin, N.; Matsui, M.S. Two fluorescent wavelengths, 440(ex)/520(em) nm and 370(ex)/440(em) nm, reflect advanced glycation and oxidation end products in human skin without diabetes. Diabetes Technol. Ther. 2012, 14, 285–292. [Google Scholar] [CrossRef] [PubMed]
- Risum, A.B.; Bevilacqua, M.; Li, C.; Engholm-Keller, K.; Poojary, M.M.; Rinnan, Å.; Lund, M.N. Resolving fluorescence spectra of Maillard reaction products formed on bovine serum albumin using parallel factor analysis. Food Res. Int. 2024, 178, 113950. [Google Scholar] [CrossRef] [PubMed]
- Morales, F.; van Boekel, M. A study on advanced Maillard reaction in heated casein/sugar solutions. International Dairy Journal 1997, 7, 675–683. [Google Scholar] [CrossRef]
- Shi, T.; Xu, L.; Wang, Y.-N.; Liu, S.-C.; Liu, Z.-H.; Zhao, G.-J.; Li, B.-Z.; Yuan, Y.-J. Aminated and amidated structures introduced by ethylenediamine pretreatment endow lignin with bright fluorescence. Green Chem. 2022, 24, 9040–9054. [Google Scholar] [CrossRef]
- Wang, J.; Wang, J.; Xiao, W.; Geng, Z.; Di Tan; Wei, L. ; Li, J.; Xue, L.; Wang, X.; Zhu, J. Lignin-derived red-emitting carbon dots for colorimetric and sensitive fluorometric detection of water in organic solvents. Anal. Methods 2020, 12, 3218–3224. [Google Scholar] [CrossRef]
- Liu, X.; Chu, B.; Xiong, Z.; Liu, B.; Tu, W.; Zhang, Z.; Zhang, H.; Sun, J.Z.; Zhang, X.; Tang, B.Z. Heteroatom-facilitated blue to near-infrared emission of nonconjugated polyesters. Mater. Horiz. 2024, 11, 1579–1587. [Google Scholar] [CrossRef]
- Chu, B.; Liu, X.; Xiong, Z.; Zhang, Z.; Liu, B.; Zhang, C.; Sun, J.Z.; Yang, Q.; Zhang, H.; Tang, B.Z.; et al. Enabling nonconjugated polyesters emit full-spectrum fluorescence from blue to near-infrared. Nat Commun 2024, 15, 366. [Google Scholar] [CrossRef]
- Hou, X.; Xu, J.; Zhou, P.; Dai, L.; Zhang, J.; Xiao, X.; Huo, K. A shining transmutation of lignin into multicolor carbon dots via the dynamic solvent-fractionation engineering. Chemical Engineering Journal 2023, 478, 147363. [Google Scholar] [CrossRef]
- Wang, R.; Xia, G.; Zhong, W.; Chen, L.; Chen, L.; Wang, Y.; Min, Y.; Li, K. Direct transformation of lignin into fluorescence-switchable graphene quantum dots and their application in ultrasensitive profiling of a physiological oxidant. Green Chem. 2019, 21, 3343–3352. [Google Scholar] [CrossRef]
- Liukko, S.; Tasapuro, V.; Liitiä, T. Fluorescence spectroscopy for chromophore studies on bleached kraft pulps. Holzforschung 2007, 61, 509–515. [Google Scholar] [CrossRef]
- He, B.; Zhang, J.; Zhang, J.; Zhang, H.; Wu, X.; Chen, X.; Kei, K.H.S.; Qin, A.; Sung, H.H.Y.; Lam, J.W.Y.; et al. Clusteroluminescence from Cluster Excitons in Small Heterocyclics Free of Aromatic Rings. Adv. Sci. (Weinh) 2021, 8, 2004299. [Google Scholar] [CrossRef]
- Ye, R.; Liu, Y.; Zhang, H.; Su, H.; Zhang, Y.; Xu, L.; Hu, R.; Kwok, R.T.K.; Wong, K.S.; Lam, J.W.Y.; et al. Non-conventional fluorescent biogenic and synthetic polymers without aromatic rings. Polym. Chem. 2017, 8, 1722–1727. [Google Scholar] [CrossRef]
- Zhao, Z.; Cai, Y.; Zhang, Q.; Li, A.; Zhu, T.; Chen, X.; Yuan, W.Z. Photochromic luminescence of organic crystals arising from subtle molecular rearrangement. Nat Commun 2024, 15, 5054. [Google Scholar] [CrossRef] [PubMed]
- Dhillon, A.K.; Barman, S.; Siddhanta, S. Unravelling the Mechanism of Cluster-Triggered Emission in Carboxy Nanocellulose and Modulation through the Conjugation of Plasmonic Nanoparticles for Analyte Detection. J. Phys. Chem. C 2025. [Google Scholar] [CrossRef]
- Zhao, E.; Lam, J.W.Y.; Meng, L.; Hong, Y.; Deng, H.; Bai, G.; Huang, X.; Hao, J.; Tang, B.Z. Poly [(maleic anhydride)- alt -(vinyl acetate)]: A Pure Oxygenic Nonconjugated Macromolecule with Strong Light Emission and Solvatochromic Effect. Macromolecules 2015, 48, 64–71. [Google Scholar] [CrossRef]
- Lai, Y.; Zhao, Z.; Zheng, S.; Yuan, W.Z. Polymorphism-Dependent Emission of Nonaromatic Luminophores. Acta Chimica Sinica 2021, 79, 93. [Google Scholar] [CrossRef]
- Murphy, K.R.; Stedmon, C.A.; Graeber, D.; Bro, R. Fluorescence spectroscopy and multi-way techniques. PARAFAC. Analytical Methods 2013, 5, 6557. [Google Scholar] [CrossRef]
- Murphy, K.R.; Stedmon, C.A.; Wenig, P.; Bro, R. OpenFluor– an online spectral library of auto-fluorescence by organic compounds in the environment. Analytical Methods 2014, 6, 658–661. [Google Scholar] [CrossRef]
- Bro, R. PARAFAC. Tutorial and applications. Chemometrics and Intelligent Laboratory Systems 1997, 38, 149–171. [Google Scholar] [CrossRef]
- Schneide, P.-A.; Bro, R.; Gallagher, N.B. Shift-invariant tri-linearity—A new model for resolving untargeted gas chromatography coupled mass spectrometry data. J. Chemometrics 2023, 37. [Google Scholar] [CrossRef]
Figure 1.
Clusteroluminescence peak positions of all excitation and emission maxima included in this study. For comparison, conventional fluorophoresMcNamara are shown in pale grey. A detailed list of the substances and references is provided in the supplementary material.
Figure 1.
Clusteroluminescence peak positions of all excitation and emission maxima included in this study. For comparison, conventional fluorophoresMcNamara are shown in pale grey. A detailed list of the substances and references is provided in the supplementary material.
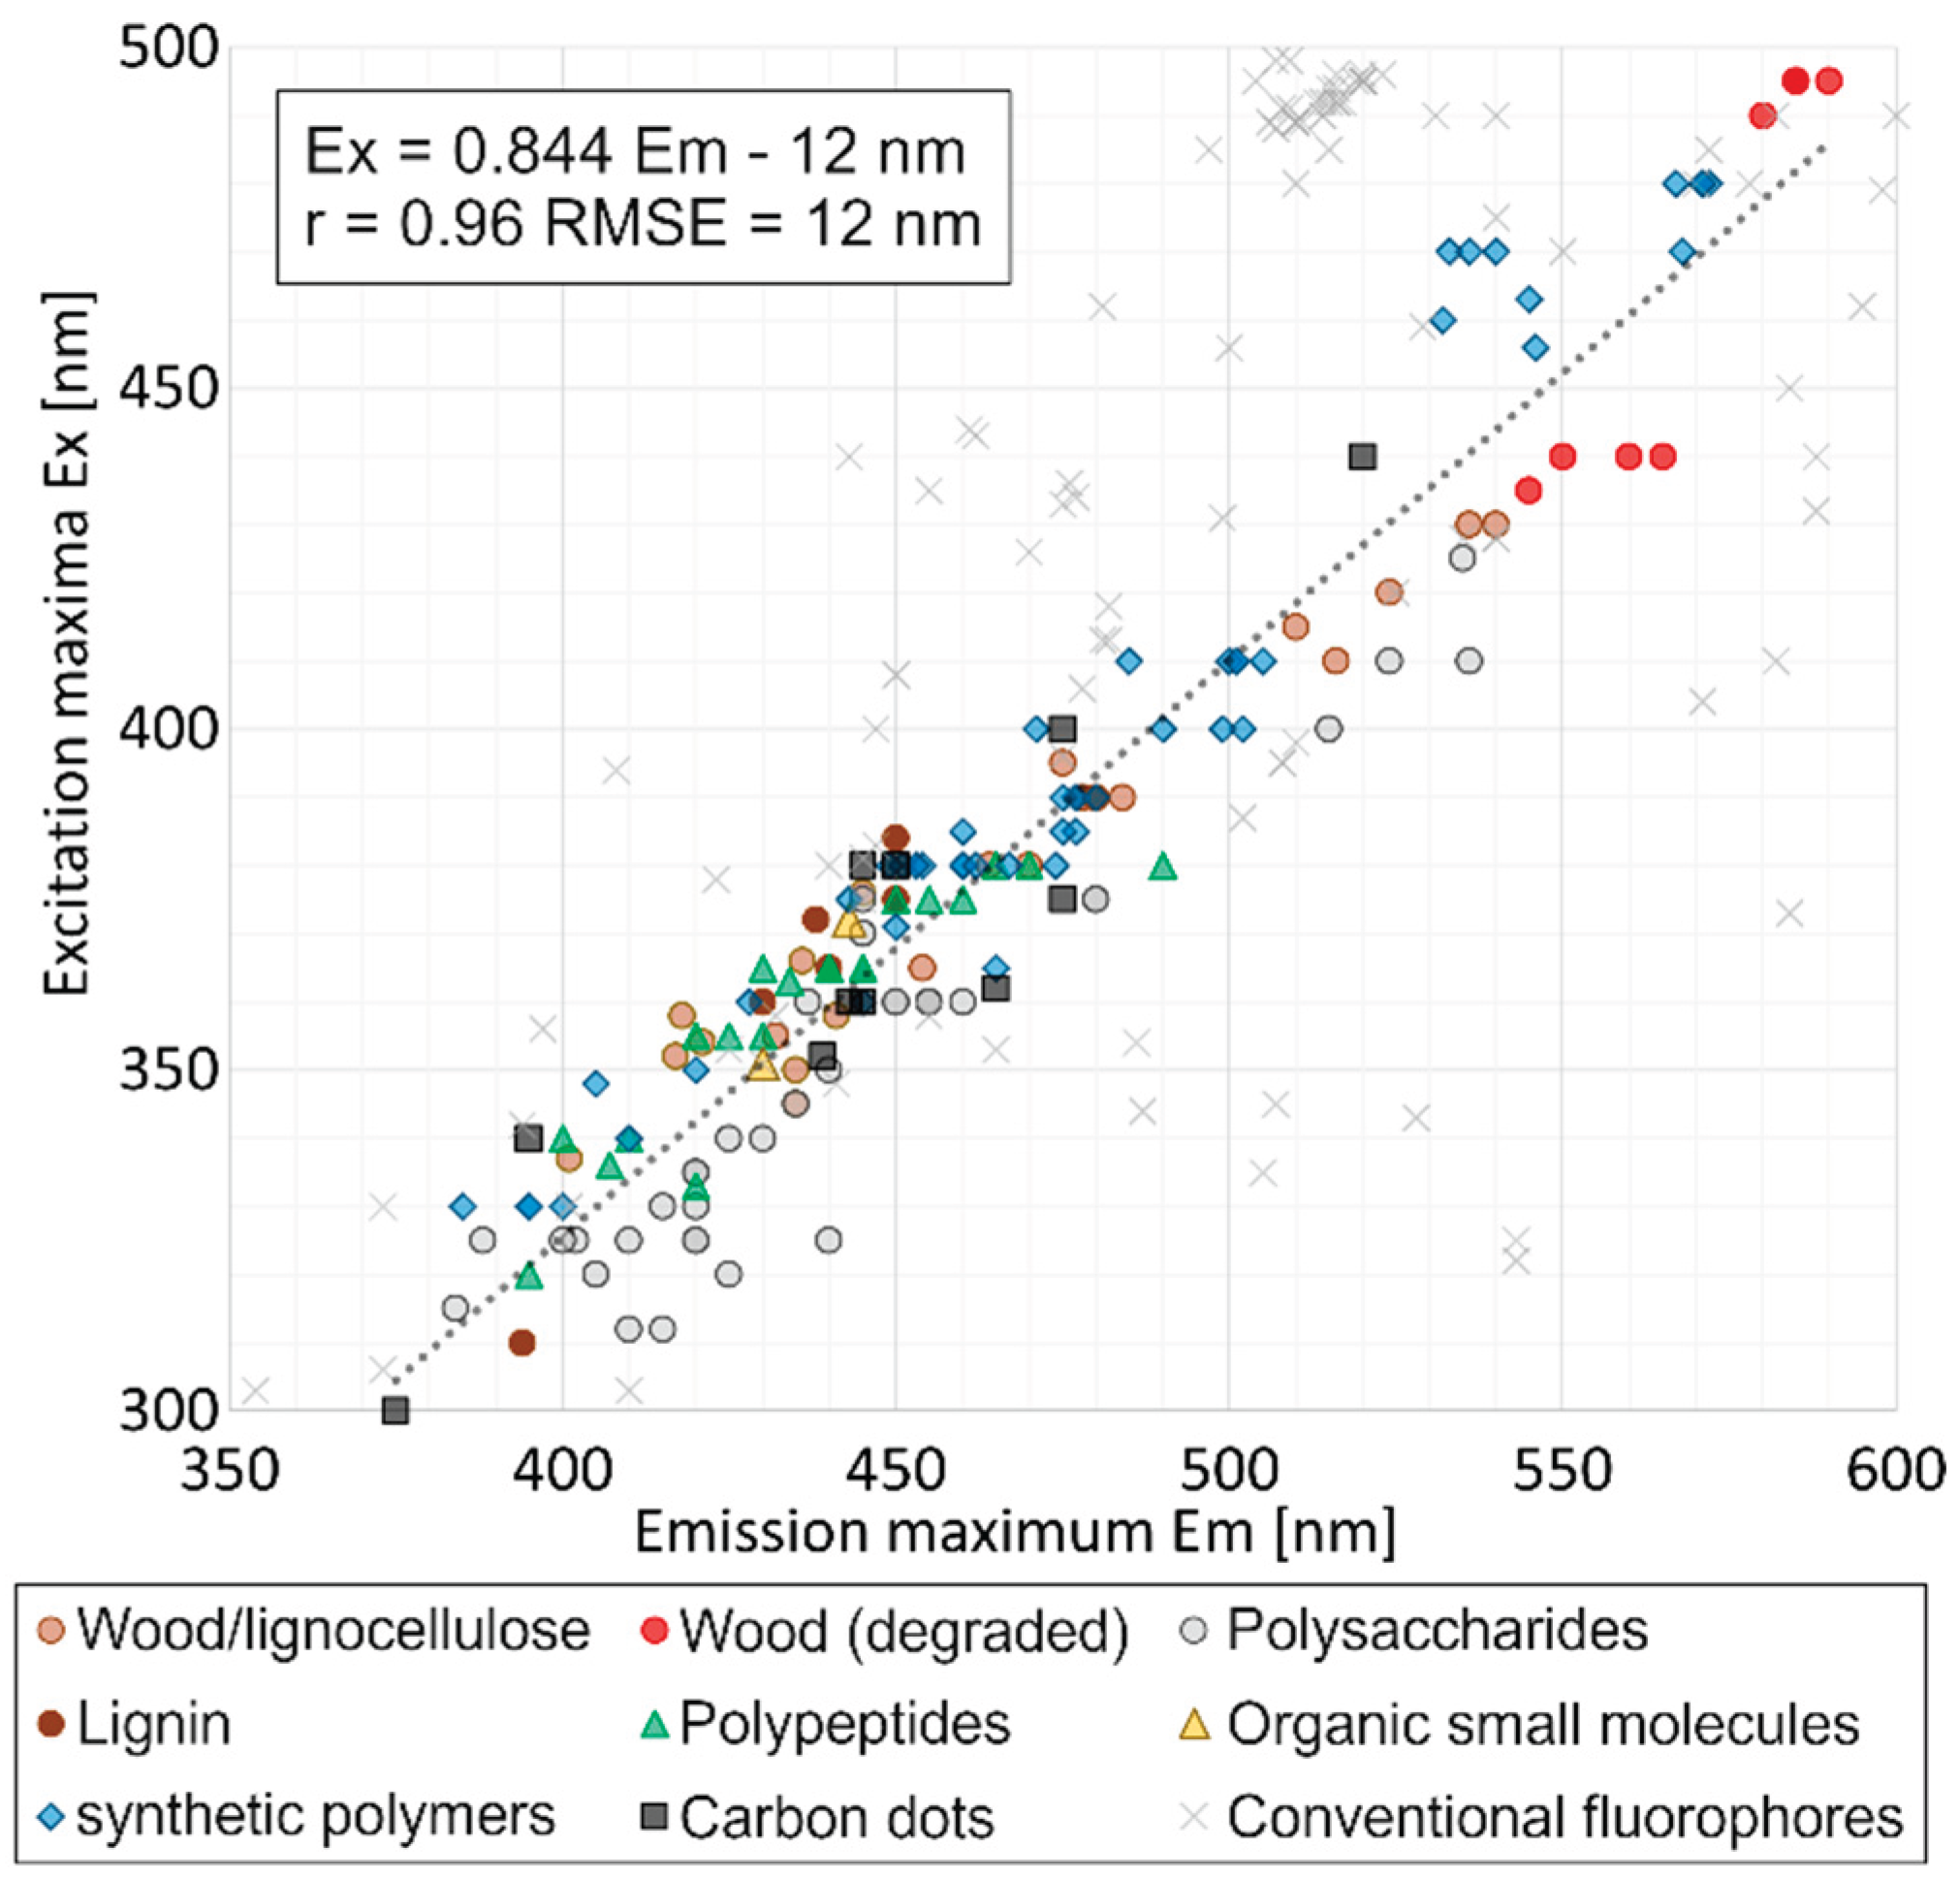
Figure 2.
(a) Peak positions of all examined wood species and isolated lignocellulosic compounds (b) Excitation-emission matrix (EEM) of solid bacterial cellulose (c) EEM of 0.1 % organosolv lignin of Eucalyptus ssp. in 60 % ethanol (d) EEM of untreated Acer ssp. wood (e) peak positions of wood species before (solid line) and after (broken line) various degradations. (f) EEM of photodegraded Acer ssp. wood.
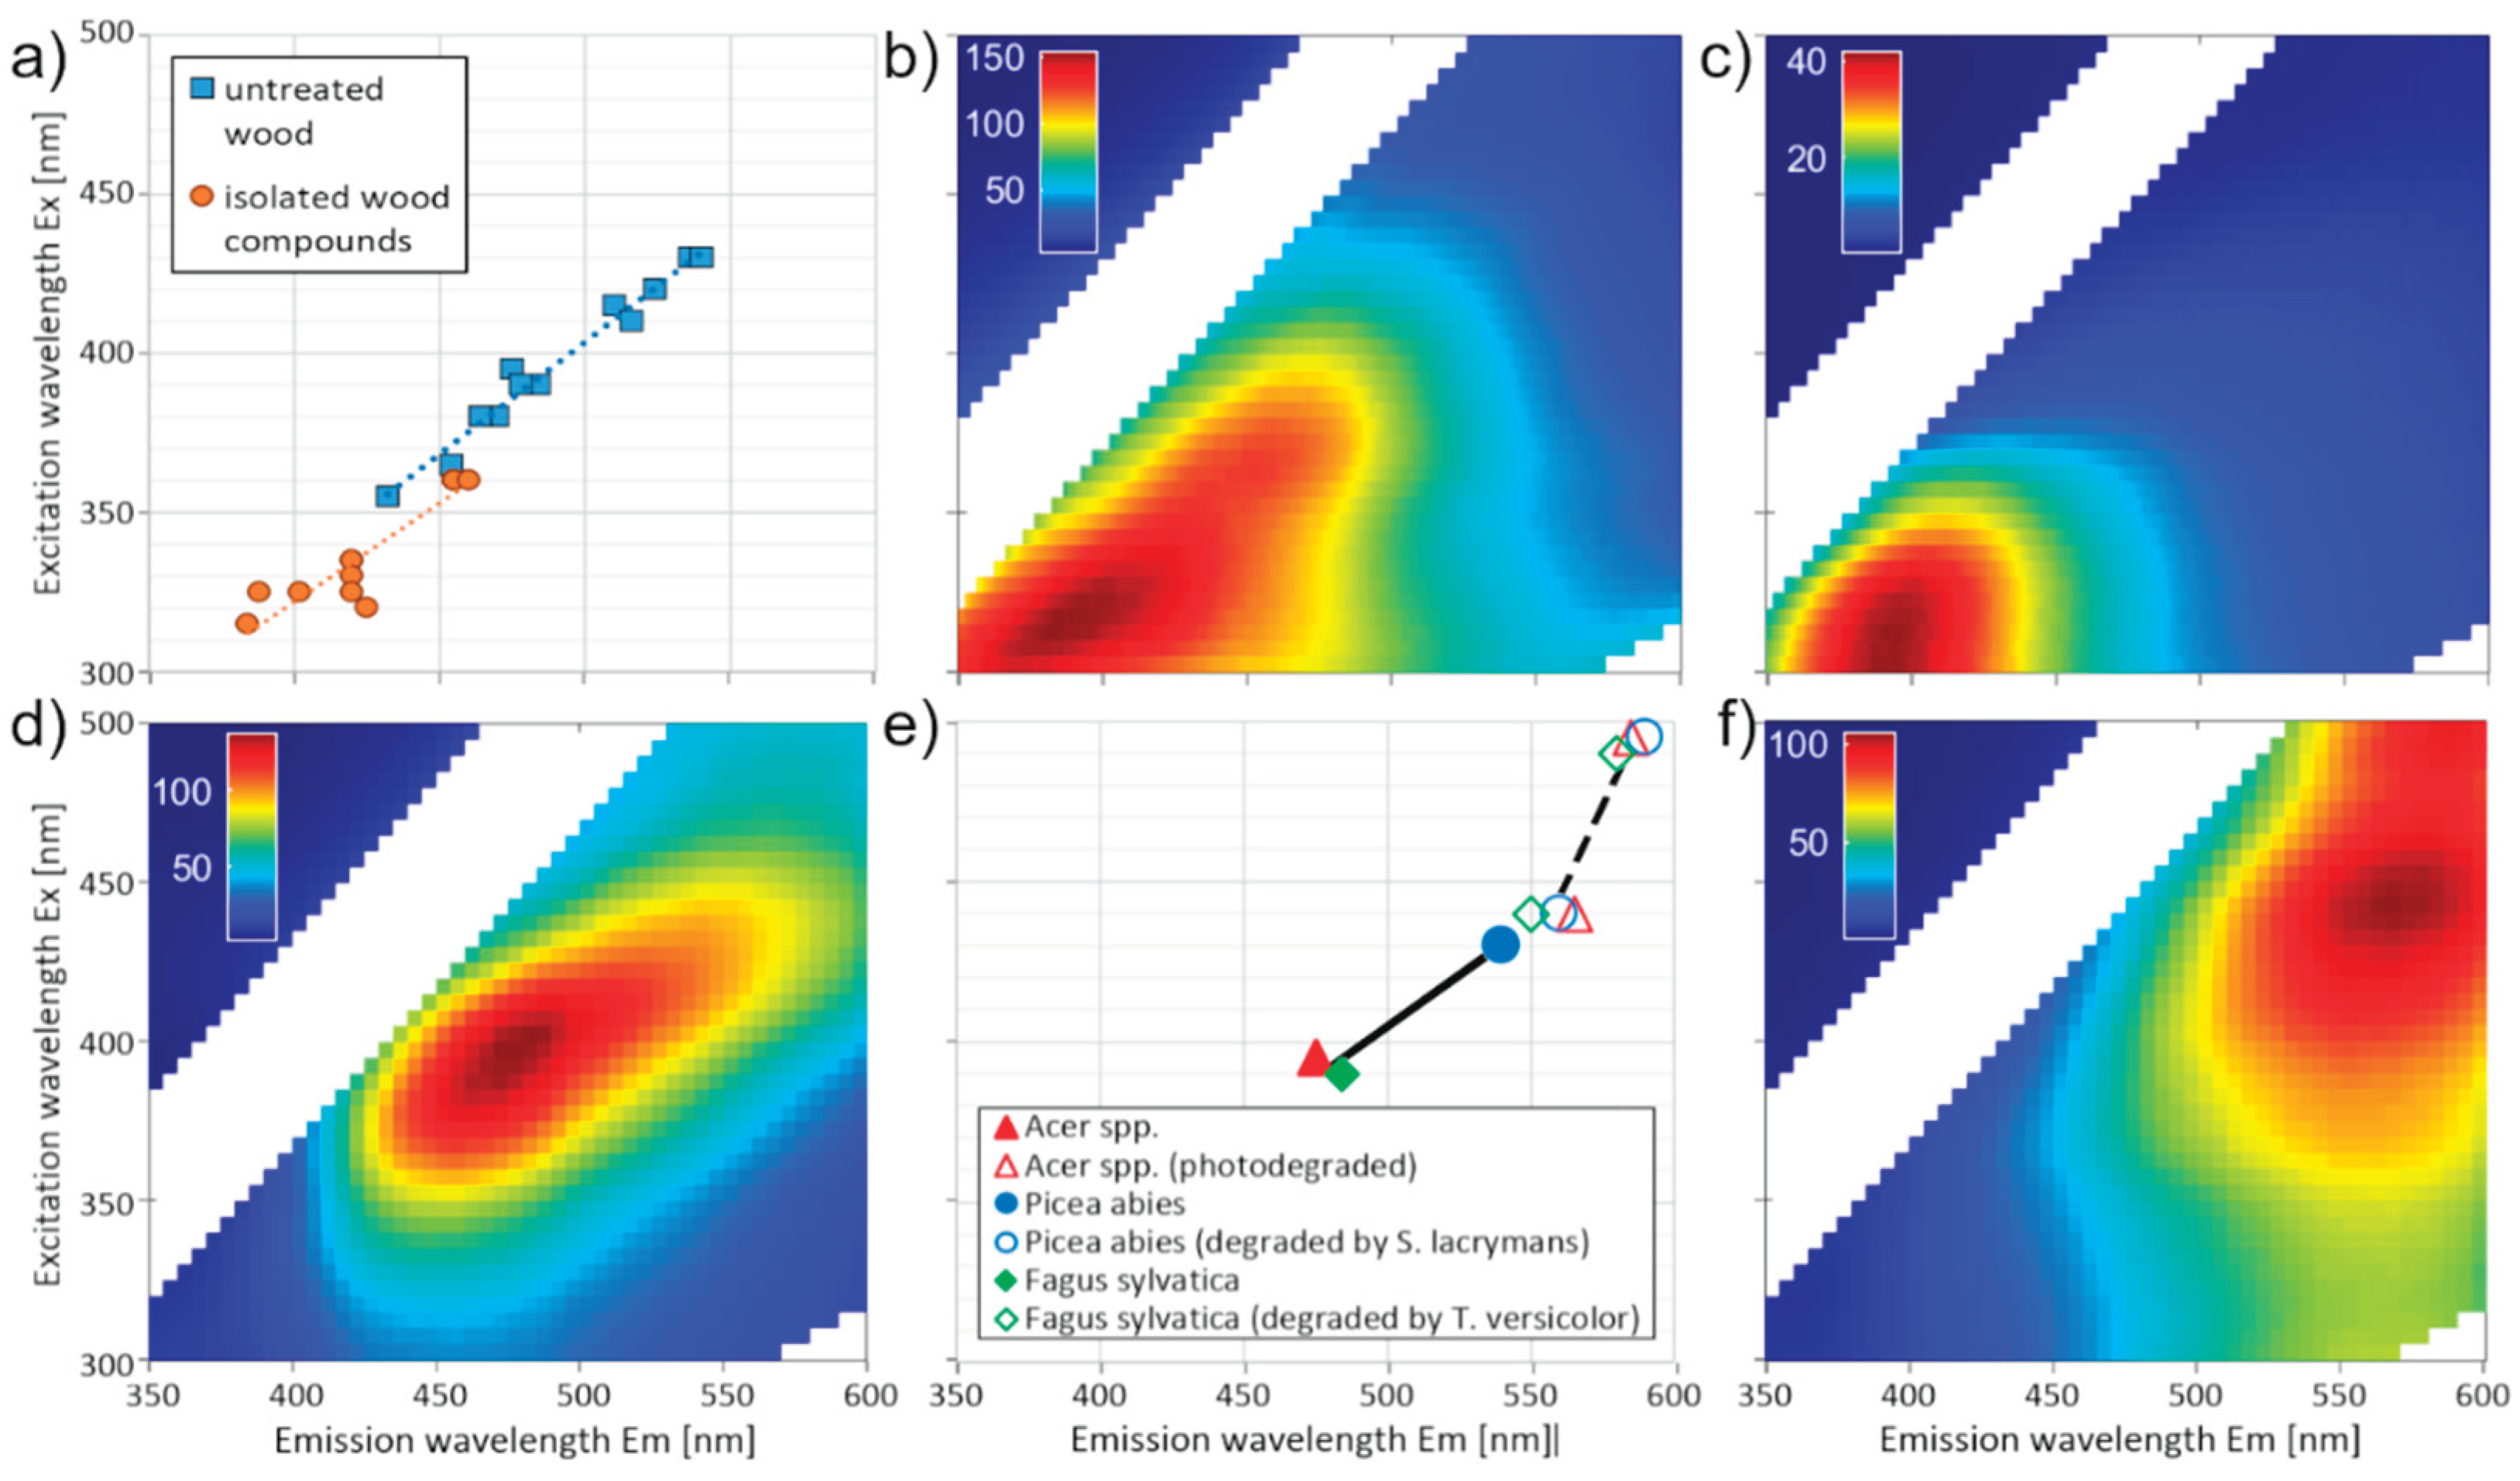
Figure 3.
Proposed two-dimensional spectrum for clusteroluminogens with fixed pairs of excitation and emission wavelength, based on eq (1). With this approach, all clusteroluminescence peaks of the four displayed samples were captured. For comparison, full EEMs can be found in Figure 2.
Figure 3.
Proposed two-dimensional spectrum for clusteroluminogens with fixed pairs of excitation and emission wavelength, based on eq (1). With this approach, all clusteroluminescence peaks of the four displayed samples were captured. For comparison, full EEMs can be found in Figure 2.
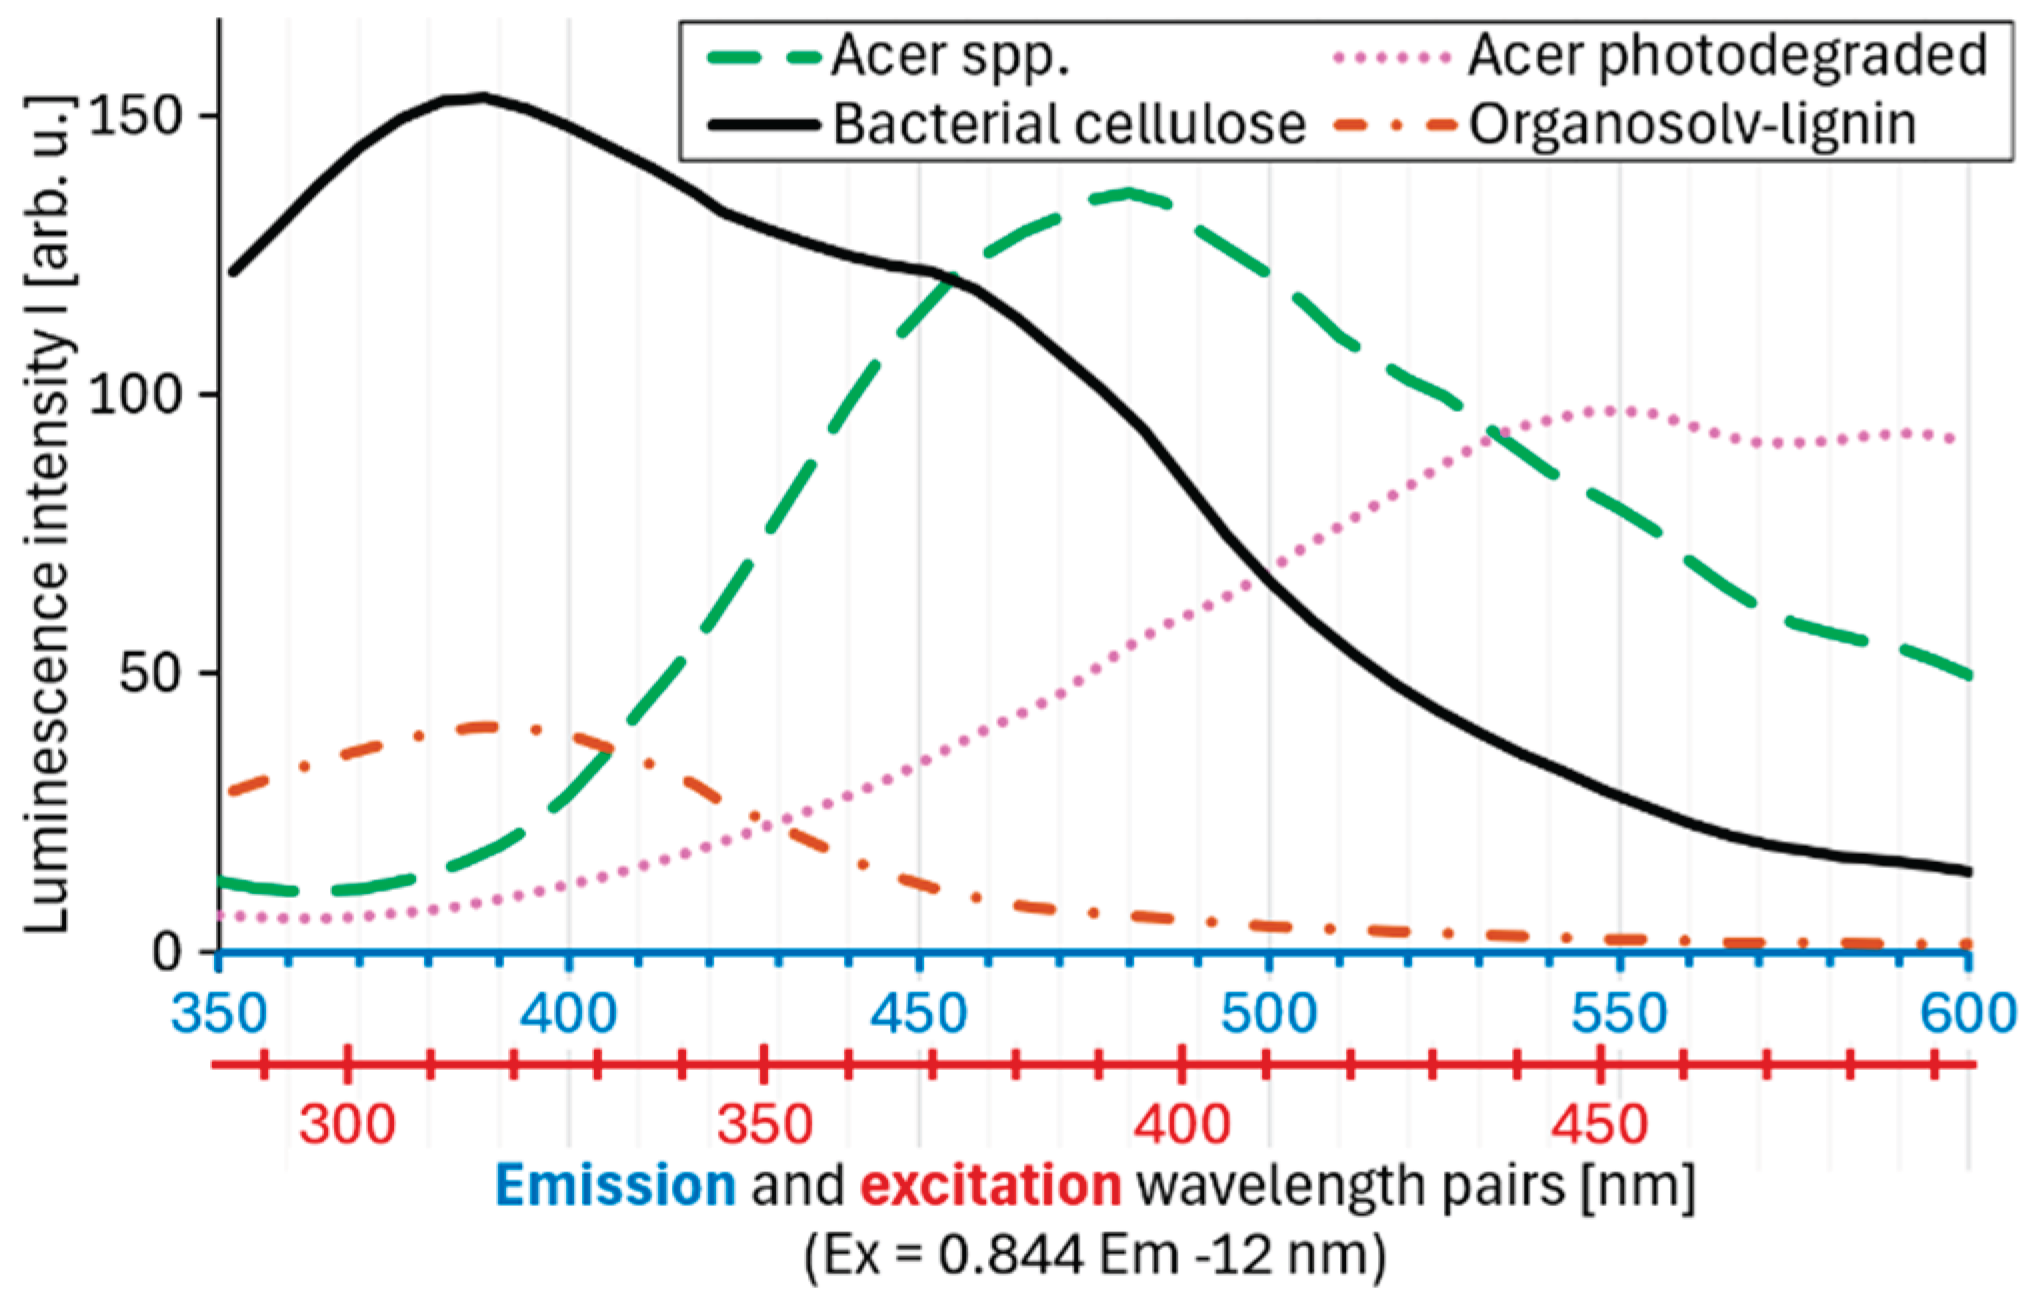

Table 1.
Factors associated with wavelength shifts in clusteroluminogens collected from literature.
| Factor | Shift | Substance | Ref. | |
|---|---|---|---|---|
| Chemical changes in the structural heterogeneity | Thermal ageing | Red | Proteins | [73] |
| Thermal degradation (200 to 400 °C) | Red | Poly(acrylic acid) | [74] | |
| Ageing by lifetime and photoageing | Red | Skin (mouse) | [75] | |
| Glycation (Maillard reaction) and oxidation | Red | Proteins, advanced glycation end products | [76,77,78] | |
| Photodegradation | Red | Wood | [20] | |
| Introduction of amino groups into an oxygenic clustering system | Red | Lignin | [79], [80] | |
| Introduction of N and S atoms into an oxygenic clustering system | Red | Aliphatic polyesters | [81], [82] | |
| Hydrothermal treatment | Red | Lignin | [83], [84] | |
| Increased variety of monomers used for copolymerisation | Red | Dehydrogenated polymer from 100 % coniferyl alcohol compared to 50 % coniferyl alc. with 50 % sinapyl alc. | [34] | |
| H2O2 bleaching (= reduction of carbonyl groups) | Blue | Mechanical pulp | [16], [85] | |
| Removal of impurities | Blue | Dithiosuccinimide | [86] | |
| Changes in interactions between existing cluster entities | Change of secondary structure (helix to straight to planar folded) | Red | Aliphatic polyesters | [58] |
| Increase of degree of polymerisation | Red | poly [(maleic anhydride-alt-vinyl) pyrrolidone] | [56] | |
| Increase of degree of polymerisation | Red | Oligo-L-alinine vs. poly-L-alanine | [87] | |
| Reversible molecular rearrangement (by light) | Red | Dimethyl terephthalate | [88] | |
| Ball milling from nanofibers to particles | Red | Cellulose nanofibers and nanoparticles | [28] | |
| Increase of pH (maximum Em at pH10) | Red | Carboxy-nanocellulose | [89] | |
| Transfer to solvents with electron-rich atoms | Red | Poly [(maleic anhydride)-alt-(vinyl acetate) | [90] | |
| Crystallisation from different solvent (polymorph) | Red/blue | Furan-maleic anhydride and furan-maleimide | [91] | |
| Dissolution of solids | Blue | Rice, starch, cellulose | [37] | |
| Dissolution of solids | Blue | Gelatin | [52] | |
| Dissolution of solids | Blue | Maleimide and succinimide | [86] | |
| Dissolution of solids | Blue | Aliphatic polyesters | [58] | |
| Steam explosion | Blue | Various lignocellulosics | [34] | |
| Moisture swelling | Blue | Pinus sylvestris wood | [21] |
Disclaimer/Publisher’s Note: The statements, opinions and data contained in all publications are solely those of the individual author(s) and contributor(s) and not of MDPI and/or the editor(s). MDPI and/or the editor(s) disclaim responsibility for any injury to people or property resulting from any ideas, methods, instructions or products referred to in the content. |
© 2025 by the authors. Licensee MDPI, Basel, Switzerland. This article is an open access article distributed under the terms and conditions of the Creative Commons Attribution (CC BY) license (http://creativecommons.org/licenses/by/4.0/).
Copyright: This open access article is published under a Creative Commons CC BY 4.0 license, which permit the free download, distribution, and reuse, provided that the author and preprint are cited in any reuse.


