
Submitted:
24 June 2025
Posted:
24 June 2025
You are already at the latest version
Abstract
Background/Objectives: Prematurity and low birth weight (LBW) drive infant morbidity and mortality, requiring nutritional interventions, especially in food-insecure settings. In Indonesia, regional disparities in food security hinder adequate nutrition for premature and LBW infants, exacerbating health challenges. The aim of study is to investigate and determine predictors of food insecurity that impact health outcomes in children born with prematurity and/or low birth weight. Methods: A cross-sectional study with 657 mothers with children aged 36-59 months was conducted using random sampling. Data was collected via standardized questionnaires and analyzed using chi-square tests and logistic regression. Results: Children of food-insecure households had a higher risk of LBW (AOR=1.89; 95% CI: 1.02–3.48). Low maternal education was associated with an increased risk of preterm birth (AOR=2.95; 95% CI:1.66–5.25). The increase in prematurity may increase the risk of underweight status (AOR=2.19; 95% CI:1.27–3.82). Food insecurity correlated with maternal education and maternal employment status (AOR=2.46; 95% CI: 1.31–4.63 and AOR=1.46; 95% CI: 1.03–2.07, respectively). Conclusion: Food insecurity exacerbates risks for underweight children, particularly in the prevalence of prematurity. Initiative strategies to improve child health outcomes are essential, including enhancing maternal nutrition knowledge to improve child feeding practices, promoting gender equality in career development, and reducing food insecurity.
Keywords:
Prematurity
; low birth weight
; food security
; maternal education
; child nutrition
1. Introduction
Globally, neonatal and under-five mortality remains a critical health issue, especially regarding regional health inequalities. Approximately 13.4 million preterm births worldwide were recorded in 2020, leading to an estimated 900,000 deaths in 2019 [1]. Indonesia was in the top five countries for the prevalence of preterm births, recording 675,700 cases in 2018 [2]. In 2023, the national premature birth rate was estimated at 11.1%, with notable regional variations, such as 6.9% of preterm births in East Java [3]. Despite significant progress in reducing prematurity, as well as its impact on neonatal mortality, showing significant progress in decreasing cases from 23 per 1,000 live births in 2012 to 10.7 per 1,000 in 2022 [4], challenges persist. This country has achieved the Sustainable Development Goal (SDG) target of reducing neonatal mortality to fewer than 12 deaths per 1,000 live births in each country [5]. Furthermore, prematurity and low birth weight in 2023 were the leading causes of 27.9% neonatal mortality in East Java [6]. Concurrently, urban areas like Surabaya indicated disproportionately high infant mortality rates, highlighting persistent inequalities in healthcare access and maternal health outcomes.
Low birth weight (LBW) is a significant contributor to neonatal mortality, accounting for 60-80% of neonatal deaths each year worldwide, with more than 20 million infants born with LBW annually [7]. LBW, often resulting from preterm birth, is a birth weight of less than 2,500 grams [8]. LBW may occur in both preterm and full-term birth due to growth retardation and is a major factor in neonatal mortality [9]. According to the World Health Organization (WHO), approximately 15% of babies worldwide experience LBW, with more than half of these cases occurring in Asia [8]. In Indonesia, the prevalence of LBW is recorded at 6.1% [10]. Previous research indicates that LBW is correlated with various factors, such as maternal education [11], socioeconomic status [12], nutritional deficiencies [13], anemia [13], and inadequate antenatal care [5,13,14]. In Indonesia, other factors associated with LBW include family size, nutritional status, maternal age, pregnancy complications, age at marriage, iron supplementation, and anemia status. Additionally, LBW also has a relationship with delayed breastfeeding, feeding refusal, impaired growth, and long-term developmental challenges [15].
The COVID-19 pandemic impacted household food security, indicating a concerning trend globally. The Food and Agriculture Organization (FAO) reported that around 828 million people faced hunger in 2021 [16]. Approximately 29.6% of the global population identified moderate to severe food insecurity by the end of 2022 [17]. The prevalence of food insecurity decreased from 35% in 2008 to 20.8% in 2015, which was attributed to rising household incomes and rapid economic growth in Indonesia. However, one in five Indonesians still faces severe food insecurity [18]. A significant finding from the National Socioeconomic Survey in Indonesia in 2021 was that 76% of children under five lived in food-insecure households. The breakdown of food insecurity levels showed that 17% experienced mild, 5% moderate, and 2% severe food insecurity [17]. This context underscores the urgent need for targeted interventions to address food insecurity, as it is closely linked to adverse health outcomes, including malnutrition among children [16].
Prior findings have revealed a significant correlation between food insecurity and adverse birth outcomes, such as prematurity and LBW. Studies indicated that food-insecure households are more susceptible to having infants with LBW and stunting, hence increasing the risk of chronic health problems, neurodevelopmental disorders, and higher mortality rates [19,20,21]. LBW infants face significantly higher mortality risks and long-term health complications, including cardiovascular diseases and cognitive impairments [20,22], with prevalence impacted by maternal factors, environmental factors, and socioeconomic status [23,24].
This study aims to examine these effects in food-secure and food-insecure households to explore further potential health inequalities. Despite these acknowledged risks, research is limited regarding how household food insecurity influences the impact of prematurity and LBW among children aged 36-59 months. Identifying these inequalities is important for developing specific approaches, as food-insecure households may endure more severe consequences, contributing to further long-term health inequalities.
2. Materials and Methods
2.1. Study Area and Period
The study area is Surabaya, the second-largest city in Indonesia, located approximately 800 kilometers east of Jakarta, the capital city of Indonesia. Surabaya serves as the capital of the East Java Province and is a major port city on the northern coast of Java Island. Surabaya is a highly urbanized city with a population of over 3 million people, according to the 2020 national census. The city is divided into 5 parts (east, west, center, north, and south), which are further subdivided into numerous neighborhoods, serving as the lowest administrative units. The study was conducted in April 2024. Twelve interviewers were involved in the data collection, who were college students in a Nutrition Program.
2.2. Study Design and Population
The study was conducted in Surabaya, Indonesia, focusing on children aged 36–59 months and their respective households. A cross-sectional study was carried out across five districts of the city—east, west, center, north, and south. The sampling process followed a multi-stage cluster random sampling approach, utilizing administrative divisions to ensure systematic selection. Initially, two sub-districts were randomly selected from each of the five regions, resulting in a total of 10 sub-districts. Within each selected district, respondents were recruited from public health centers (Posyandu), a community-based health program in Indonesia that plays a crucial role in providing basic health services, particularly for mothers and children. The source population for this research comprised all mothers or primary caregivers of children within the specified age range who were attending Posyandu in Surabaya. This approach ensured a geographically representative sample, allowing for a comprehensive analysis of the study variables across different geographic areas.
2.3. Sample Size Determination
Previous research recommended statistical methods that allow readers to verify results using the original data [25,26]. This principle should also apply to the description of sample size calculation or power analysis. Consequently, the subsequent considerations must be delineated when determining the sample size or statistical power.
GPower 3.1.9.4, a software used to calculate statistical power for various statistical tests, such as t-tests, F-tests, χ²-tests, z-tests, correlation tests, and other statistical analyses, was employed in this study. GPower can also be used to compute effect sizes and display the results graphically, making it suitable for conducting simulation studies and teaching processes. Cohen suggested that the effect sizes for correlations are 0.1 for “small,” 0.3 for “medium,” and 0.5 for “large” [25]. The author calculates the minimum sample for statistical tests in this research by setting the significance level (α) at 0.05, with an expected statistical power of 95%, and a medium effect size of 0.3. GPower software calculated that a minimum sample size is 134 mothers.
Women who were permanent residents or had spent the previous night in the designated households were qualified for interviews. The lists of mothers with children under five were obtained four weeks prior to data collection in each of the ten subdistricts, with a census conducted by the relevant local authority. A total of 657 mothers with at least one child aged between 36 to 59 months were randomly sampled from the public health center’s data. In cases where more than one child met this criterion, only one was selected. However, children with a diagnosed chronic illness, who were bedridden, or who had suffered a serious acute illness were excluded from the study. The same applied to any child with a physical deformity affecting the lower extremities or spine.
2.4. Data Management and Analysis
Data was collected using a structured, pretested questionnaire and analyzed through frequencies, percentages, means, and standard deviations. Univariate logistic regression was used to assess preterm birth and LBW as outcome variables. The study examined socioeconomic factors (income, food insecurity), maternal characteristics (age, education, employment), child demographics (gender, nutritional status), and infant and young child feeding (IYCF) practices (breastfeeding, complementary feeding). The analysis followed four steps: (a) descriptive analysis to evaluate relationships between variables; (b) variable selection prioritizing food insecurity, preterm birth, and LBW; (c) multivariable modeling to refine predictors; and (d) finalizing a model including key maternal and child factors.
Household food insecurity was measured using the Food Insecurity Experience Scale Survey Module (FIES-SM) from the Food and Agriculture Organization of the United Nations with 2 classifications: food-secure and food-insecure households. The FIES-SM measures food insecurity in the household by applying the Rasch model, determining the range of food insecurity as mild, moderate, or severe [27].
Anthropometric measurements, encompassing height and weight, were obtained from both children and caregivers. Body weight was recorded utilizing a portable electronic SECA 813 flat scale, and height was evaluated with a Shorr board. Sample size and power analysis were calculated from factors including effect size, significance level (α), statistical power (1-β), and the chosen statistical analysis method [26].
The nutritional status of children measured based on nutritional indices, such as height-for-age (HAZ) for stunting status, weight-for-age (WAZ) for underweight status, and weight-for-height (WHZ) for wasting status, was computed using the WHO Anthro v3.2.2 software and classified by applying the WHO 2006 standards. Z-scores of height-for-age <-2 SD indicated stunted, Z-scores of weight-for-age <-2 SD indicated underweight, and Z-scores of weight-for-height <-2 SD indicated wasted [28]. Chi-Square tests compared the nutritional status between food-secure and food-insecure households [29]. LBW (<2,500g) was identified through Posyandu records and linked to preterm birth (<37 weeks) or intrauterine growth restriction (IUGR). IYCF variables included breastfeeding exclusivity, complementary feeding timing, and feeding frequency, which influenced child nutrition and development [30,31,32].
2.5. Data Quality Assurance
To ensure data integrity, the questionnaire underwent pretesting (5% of the sample), and weighing scales were calibrated using a standard weight. Enumerators received training in survey administration, response recording, and anthropometric measurements. Daily reviews by the primary investigator ensured accuracy and completeness, with feedback provided as needed.
2.6. Data Processing and Analysis
Data were administered in Microsoft Excel and analyzed using RStudio. Anthropometric data were analyzed using WHO Anthro Plus v3.2.2 to evaluate nutritional status. Descriptive statistics described socio-demographic and other data, whereas bivariate and multivariable logistic regression identified connections among household food insecurity, preterm birth, LBW, and related variables. Variables with p-values less than 0.2 in bivariate analysis were incorporated into multivariable regression to control for confounders. Adjusted odds ratios (AOR), accompanied by 95% confidence intervals, evaluated the strength of connections, with p-values < 0.05 deemed statistically significant.
3. Results
3.1. Socio-Demographic and Economic Status of Respondents
A total of 657 mothers with children aged 36-59 years were randomly selected to participate in the study and included in the analysis. Among these, 38.51% of mothers were categorized as food-insecure, while 61.49% were classified as food-secure. Children from food-secure households showed better health outcomes, with 46.58% not stunted, 48.55% not underweight, and a majority having normal birth weight (54.79%). Furthermore, 50.99% of children without wastage were from food-secure households. Food insecurity was prevalent among 35.16% of low-income families. Households classified as food-insecure also had reduced access to safe drinking water, with 28.16% relying on mineral water and 0.46% on spring water (Table 1)
Children’s prematurity prevalence was noted at 44.29% with a mean of 37.33 (SD±2.40), and LBW was reported at 9.28% with a mean of 3.05 (±0.48). The nutritional assessments in this study revealed that the mean (±SD) Z-scores for stunting, wasting, and underweight status were below zero, specifically -1.10 (±1.62), -0.29 (±1.95), and -0.84 (±1.64), respectively. These findings indicate deviations from standard growth benchmarks and highlight the prevalence of malnutrition within the study population. A negative standard deviation (SD) in weight-for-age Z-score is a critical indicator of children’s malnutrition or suboptimal nutritional status. Household food insecurity was significantly associated with maternal education and employment status, as determined by the Chi-Square test. Additional factors influencing food insecurity included monthly household income, car and house ownership, and overall wealth status (Table 1).
3.2. Prevalence of Prematurity and Low Birth Weight and Other Characteristics
The majority of children who were not of LBW (68.49%) and did not experience preterm birth (42.01%) were not stunted. Children with normal birth weight (61.80%) and those born at term (38.36%) were more likely to initiate breastfeeding within one hour of birth. Most mothers were mature adults aged 30 to 39, with 46.60% delivering children of normal birth weight. These mothers were also more likely to introduce complementary feeding at six months (69.56%) for children with normal birth weight.
Furthermore, 52.82% of mothers who delivered children with normal birth weight had medium education levels (high school graduates). Among children with normal birth weight, 70.17% were not underweight, and 52.82% received meals two to three times daily, meeting recommended feeding frequency practices (Table 2).
The majority of children who were not of LBW (68.49%) and did not experience preterm birth (42.01%) were not stunted. Children with normal birth weight (61.80%) and those born at term (38.36%) were more likely to initiate breastfeeding within one hour of birth. Most mothers were mature adults aged 30 to 39 years, with 46.60% delivering children of normal birth weight. These mothers were also more likely to introduce complementary feeding on time, with 69.56% starting at six months for children with normal birth weight. Additionally, 52.82% of mothers with normal birth weight children had a medium level of education (high school graduates). Among children with normal birth weight, 70.17% were not underweight, and 52.82% adhered to the recommended feeding frequency of two to three meals daily. Regarding household wealth status, 41.40% of families resided in food-secure households (Table 2).
3.3. Factors Associated With Prematurity, Low Birth Weight, and Household Food Insecurity
This study revealed prematurity was significantly associated with maternal education, as mothers with lower education levels were nearly three times more likely to give birth neonate prematurely than mothers with higher educational levels (AOR = 2.95; 95% CI: 1.66–5.25; p < 0.001). Children who were born to lower monthly household income are 1.66 times more likely to be born premature compared to children from households with a high monthly income (AOR=1.66; 95% CI:0.60–4.57; p < 0.01). Furthermore, the analysis also indicated that prematurity significantly increased the likelihood of being underweight by 2.2 times (AOR = 2.19; 95% CI: 1.27–3.82; p < 0.01). This association remained significant in the adjusted model, where the adjusted odds ratio (AOR) was 2.19, suggesting that, even after controlling for potential confounders, premature birth remained an independent risk factor for underweight status (Table 3).
In the present study, logistic regression analysis demonstrated a significant association between LBW and household food insecurity after adjusting for confounding factors (AOR=1.89; 95% CI: 1.02–3.48). This means that children from food-insecure households are approximately 1.89 times more likely to experience LBW compared to children from food-secure households. Neonates who were born prematurely had a 2.20 times greater probability of having LBW (AOR=2.20; 95% CI:1.25–3.86). This study revealed that children who had LBW were fed 2.5 times less a day compared to those who had normal birth weight (AOR = 2.50; 95% CI: 1.01–6.14; p < 0.05) (Figure 1).
This study also found that low maternal education has a 2.46 times higher probability of being food-insecure (AOR=2.46; 95% CI:1.31-4.63). Accordingly, unemployed mothers had a 1.46 times higher probability of being food-insecure. Households with low monthly income were at a 3.36 times higher risk of being food-insecure (AOR=3.36; 95% CI: 0.71-15.83). Worse wealth was also 5 times more likely to be food-insecure (AOR=5.08; 95% CI: 1.59-16.28). While underweight children had significantly lower odds of experiencing food insecurity (AOR=0.53; 95% CI: 0.29-0.98), suggesting a potential inverse relationship between underweight status and food security (Figure 1).
4. Discussion
4.1. Low Birth Weight in Food-Secure and Food-Insecure Households
Our findings showed that food-insecure households were prevalent among children born with low birth weight (LBW) in Surabaya City, Indonesia. We found that food-insecure households have a 1.89 times higher risk of experiencing LBW compared to food-secure households. Consistent with previous findings, food insecurity was significantly associated with LBW [33,34]. Furthermore, previous findings indicated that food insecurity contributes to adverse health outcomes for mothers and children, reflecting maternal nutrition and health [34]. A previous study found that LBW not only denotes a singular health issue but also serves as a sentinel marker for long-term health trajectories. Children born with LBW exhibit increased vulnerability to a spectrum of developmental delays and chronic health conditions, including respiratory illnesses, cardiovascular complications, and higher rates of mortality in infancy and early childhood [35].
This study highlighted that premature infants are 2.2 times more likely to be born LBW. Likewise, premature infants who are delivered with LBW are more at risk of having infectious diseases because their immune systems are not completely developed, which may negatively impact child growth. This finding might also be consistent with previous findings showing the effect of urinary tract infection during pregnancy on adequate fetal growth and development, increasing the risk of preterm birth and LBW [36,37,38].
The present study revealed an interesting finding that infants with LBW were fed 2.5 times less than those born with normal birth weight. A previous study found that mothers with LBW infants are more likely to decide to give formula feeding instead of breastfeeding, due to concerns about adequate nutrition and growth [39]. This study indicated that formula feeding more effectively addresses their LBW infants’ growth needs. Prior investigations highlighted that LBW infants frequently encounter feeding difficulties caused by medical conditions and/or immature promotor development [40]. Therefore, infants with less feeding frequency may have feeding problems due to LBW and often struggle with feeding intolerance related to their medical state. Consequently, enteral feeding practices are necessary to regain birth weight.
4.2. Prematurity in Food-Secure and Food-Insecure Households
The relationship between food insecurity and prematurity requires further examination. This finding is not consistent with earlier studies, which suggested that household food insecurity was found as a predictive factor of prematurity [33,41]. However, the present study found that the risk of prematurity in food-insecure households was 1.1 times higher than in food-secure households, inviting a deeper inquiry into the multifaceted determinants of preterm birth. Following prior investigations, prematurity was associated with lower adulthood income [42,43] Therefore, living in low-income households posed a significantly higher risk of experiencing food insecurity [43].
Our analysis showed that prematurity has a significant relationship with maternal education, that is, mothers with lower education levels were nearly 3 times more likely to give birth prematurely than mothers with higher education levels, after adjusting for confounding factors. In contrast to previous study, this study revealed that maternal education may support decreasing preterm birth [44]. Higher maternal education is related to better health literacy [45], increased knowledge of healthy diets [46], and greater access to healthcare services [47,48]. This finding analyzed the effect of maternal education on these factors, which may possibly affect the health outcomes of children.
In order to address unobserved heterogeneity, we controlled a variety of variables that may potentially affect maternal education as well as child health outcomes, such as nutritional status. Interestingly, this study revealed the impact of prematurity on child health outcomes, such as underweight status, and found a significant association of preterm birth and underweight, namely that children having a preterm birth history were 2.2 times more likely to be underweight. Previous research also revealed that preterm birth was a strong predictor of underweight status in early childhood [49]. However, prematurity does not appear to have an effect on stunting and wasting status. In contrast to the previous study, mothers who give birth with a short duration of pregnancy contribute significantly to child growth which cause stunting [50]. These findings highlight the need for longitudinal studies to explore the long-term impact of prematurity and LBW on child health outcomes.
4.3. Comparison Findings in Food-Secure and Food-Insecure Households
The present study reported that lower maternal education corresponds to a heightened chance of food insecurity, indicating that less educated mothers face 2.46 times greater risk of being food-insecure. This aligns with two findings conducted in Southern Ethiopia, which reported that pregnant women with lower education had a higher risk of being food-insecure compared to the more educated [51,52]. Furthermore, the study revealed that educated pregnant women in food-secure households were more likely to have a higher dietary diversity score than those who were in food-insecure counterparts. The role of maternal education encourages household food insecurity with the knowledge and skills needed to improve food insecurity and manage resources effectively [53], for instance, by influencing their food choices and child meal plans to enhance adequate nutrition.
Based on the previous study, higher maternal education contributed to employment opportunities and reduced household food insecurity [54]. It indicates that maternal employment contributes to enhancing socioeconomic stability. Our study found that unemployed mothers are 1.46 times more likely to be food-insecure. Consistent with previous studies in Indonesia, our study indicated that employment status significantly impacts food insecurity, with unemployed mothers more vulnerable to being food-insecure [55]. These findings highlight the important role of mothers’ employment status in enhancing household food security, emphasizing the need for policies that campaign for job opportunities for women to alleviate food insecurity.
As a result, our analysis highlighted that low household monthly income exhibited more than three times higher odds of being food-insecure. This aligns with previous findings, which revealed that family income conditions were severely affected by food insecurity during the COVID-19 pandemic [56]. Families with lower income levels and unstable employment status are more prone to food insecurity, amplifying the risks of adverse birth outcomes. Additionally, UNICEF reports pointed out that close to half of the children with severe food insecurity are from low-income households [57]. Childhood poverty in early life (in children under five years) could harm and damage child survival, cognitive development, and growth. Moreover, some studies demonstrated that income support significantly reduces the experience of being food-insecure and increases food accessibility [58] particularly by enhancing food purchasing power.
Food insecurity is substantially associated with worse wealth status in a household, indicating elevated evidence among lower socioeconomic households. Our findings highlighted that households with worse wealth status experience significant food insecurity. Food-insecure households are up to five times more likely to experience food insecurity than their wealthier counterparts. This is consistent with findings from Zimbabwe, which demonstrated that worse wealth status is associated with socioeconomic inequalities. Wealth status was a main predictor of food insecurity and directly related to food accessibility and food purchasing power, affecting adequate nutrition for children [59]. Furthermore, when wealth status leads to food insecurity, it can further harm health outcomes, particularly in vulnerable risk groups, work capacity, and overall well-being, making it difficult for these food-insecure households to improve their wealth status. Likewise, previous research suggested that food insecurity can lead to increased weight and height growth among children [60,61]. This issue indicates that child malnutrition remains alarmingly high in poor households that experience severe food insecurity.
Our study revealed that underweight children exhibited significantly lower odds of being food secure, demonstrating an inverse relationship between underweight status and food security. This finding aligns with previous findings, which reported that household food insecurity was significantly predictive of malnutrition among children under five, having a particularly significant prediction on being underweight [62]. Similarly, children from food-insecure households have a considerably higher risk of being underweight than children who grew up in food-secure households. Additionally, a previous study found that children in food-insecure households may be nearly five times more likely to be underweight [63]. These findings underscore the urgent need for integrated strategies that aim to address food insecurity in order to improve child nutritional outcomes.
4.4. Strengths and Limitations
The study proved significant strengths by offering a comprehensive analysis of the relationship between food insecurity and its predictors, which have relationships with prematurity and LBW. The use of adjusted odds ratios (AOR) strengthens the findings by providing a more precise understanding of the likelihood of adverse health outcomes in food-insecure households after considering confounding factors. Moreover, this study’s analysis identified variables directly associated with prematurity and LBW. Both may have been direct and indirect predictors of food insecurity, which may subsequently exacerbate food insecurity.
The challenge in obtaining representative respondents was one of the limitations found in this study. Even though efforts were made to attempt to make sample reflect the broader population, certain groups may have limited representation due to a lack of sampling methods, or non-response bias. Additionally, a quantitative method was employed in this study, which identified correlations statistically but may not have identified the experiences behind food insecurity and health issues in children effectively. A qualitative method is suggested to provide future research with more comprehensive results, more complex insights, and deeper connections.
5. Conclusions
This study illustrates a complex connection between food insecurity, prematurity, and LBW that affects child health outcomes. Maternal education, monthly household income, and underweight are found as predictors directly associated with prematurity and food insecurity. However, these predictors, as well as other predictors such as mothers’ employment status, underweight children, and wealth status (including house and car ownership), have direct relationships with food insecurity. While a significant correlation was found between food insecurity and LBW, the evidence of prematurity did not demonstrate a similar trend. Furthermore, prematurity prevalence is at elevated risk of LBW and being underweight, which emphasizes the urgency of targeted intervention to diminish preterm birth and LBW. A comprehensive strategy should be implemented to mitigate food insecurity, prevent its adverse health consequences, and enhance mother and child health. Consequently, government policies must prioritize the empowerment of mothers through education, job opportunities for women, and the improvement of access to healthcare services.
Author Contributions
AD participated in designing the study, developing the questionnaires, administering the data collection, analyzing and interpreting the data, and writing the manuscript. NM participated in the statistical analysis, AS contributed to finding the research gap, RD contributed to data collection/survey coordination, AZB reviewed and edited the text, and FHJ participated in designing the study, developing the questionnaires, reviewing, and finalizing the manuscript. All authors reviewed and approved the final manuscript.
Funding
The financial support for this research was obtained from the Ministry of Foreign Affairs and Trade and managed by the Tempus Public Foundation in Hungary. Research was conducted by the cooperation of The Health Sciences Institution Hang Tuah Surabaya, Indonesia, as well as the Health Sciences Division, Doctoral College and the Department of Social Sciences, Faculty of Health Sciences, Semmelweis University, Hungary. The funding organization was involved in the data collection and manuscript writing processes.
Institutional Review Board Statement
Ethical approval was secured from the Health Research Ethics Committee of the National Research and Innovation Agency (NRIA) Indonesia Number: 039/KE.03/SK/02/2024. The study’s objectives, risks, advantages, confidentiality, and respondents’ responsibilities were comprehensively conveyed to parents in the local language. Data collection commenced solely upon the obtaining of informed written consent from respondents.
Informed Consent Statement
Informed consent was obtained from all respondents involved in this research.
Acknowledgments
The contribution of NM was supported by a grant funded by the National Research, Development, and Innovation Fund of Hungary (research project 143383).
Conflicts of Interest
The study was undertaken solely for academic purposes, and the authors declare no conflicts of interest.
Abbreviations
The following abbreviations are used in this manuscript:
| LBW | Low birth weight |
| CI | Confidence interval |
| AOR | Adjusted odds ratio |
| SDG | Sustainable development goal |
| FAO | Food and Agriculture Organization |
| WHO | World Health Organization |
| FIES-SM | Food insecurity experience scale survey module |
| IUGR | Intra-uterine growth restriction |
| IYCF | Infant and young child feeding |
| SD | Standard deviation |
| PET | polyethylene terephthalate |
References
- World Health Organization, “Preterm birth.” Accessed: Feb. 11, 2025. [Online]. Available: https://www.who.int/news-room/fact-sheets/detail/preterm-birth.
- “Born too soon: decade of action on preterm birth.” Accessed: Feb. 15, 2025. [Online]. Available: https://www.who.int/publications/i/item/9789240073890.
- “SKI 2023 Dalam Angka—Badan Kebijakan Pembangunan Kesehatan | BKPK Kemenkes.” Accessed: Jan. 07, 2025. [Online]. Available: https://www.badankebijakan.kemkes.go.id/ski-2023-dalam-angka/.
- “Data Warehouse—UNICEF DATA.” Accessed: Jan. 07, 2025. [Online]. Available: https://data.unicef.org/resources/data_explorer/unicef_f/?ag=UNICEF&df=GLOBAL_DATAFLOW&ver=1.0&dq=IDN.CME_MRM0.&startPeriod=1970&endPeriod=2024.
- Sampurna, M.T.A.; Handayani, K.D.; Utomo, M.T.; Angelika, D.; Etika, R.; Harianto, A.; Mahindra, M.P.; Efendi, F.; Kaban, R.K.; Rohsiswatmo, R.; et al. Determinants of neonatal deaths in Indonesia: A national survey data analysis of 10,838 newborns. Heliyon 2023, 9, e12980. [Google Scholar] [CrossRef] [PubMed]
- Dinas Kesehatan Provinsi Jawa Timur, “PROFIL KESEHATAN PROVINSI JAWA TIMUR TAHUN 2023”, Accessed: Jan. 07, 2025. [Online]. Available: https://dinkes.jatimprov.go.id/userfile/dokumen/PROFIL%20KESEHATAN%20PROVINSI%20JAWA%20TIMUR%20TAHUN%202023.pdf.
- K. M. Asma, F. Misu, and M. A. Islam, “The Impact of Social Safety Net Programs on Poverty, Food Security and Standard of Living in Bangladesh,” https://doi.org/10.1177/25166026221135328, vol. 5, no. 1, pp. 71–96, Nov. 2022. [CrossRef]
- “UNICEF-WHO Low birthweight estimates: Levels and trends 2000–2015 | UNICEF.” Accessed: Feb. 11, 2025. [Online]. Available: https://www.unicef.org/reports/UNICEF-WHO-low-birthweight-estimates-2019.
- Pusdekar, Y.V.; Patel, A.B.; Kurhe, K.G.; Bhargav, S.R.; Thorsten, V.; Garces, A.; Goldenberg, R.L.; Goudar, S.S.; Saleem, S.; Esamai, F.; et al. Rates and risk factors for preterm birth and low birthweight in the global network sites in six low- and low middle-income countries. Reprod. Heal. 2020, 17, 1–16. [Google Scholar] [CrossRef] [PubMed]
- R. D. Wulandari, A. D. Laksono, and R. Matahari, Policy to Decrease Low Birth Weight in Indonesia: Who Should Be the Target? Nutrients 2023, Vol. 15, Page 465, vol. 15, no. 2, p. 465, Jan. 2023. [CrossRef]
- Martinson, M.L.; Choi, K.H. Low birth weight and childhood health: the role of maternal education. Ann. Epidemiology 2019, 39, 39–45.e2. [Google Scholar] [CrossRef] [PubMed]
- Alam, J.; Islam, M.; Maniruzzaman; Ahmed, N.A.M.F.; Tawabunnahar, M.; Rahman, J.; Roy, D.C.; Mydam, J.; Farias, D. Socioeconomic inequality in the prevalence of low birth weight and its associated determinants in Bangladesh. PLOS ONE 2022, 17, e0276718. [CrossRef]
- Singh, D.; Manna, S.; Barik, M.; Rehman, T.; Kanungo, S.; Pati, S. Prevalence and correlates of low birth weight in India: findings from national family health survey 5. BMC Pregnancy Childbirth 2023, 23, 1–13. [Google Scholar] [CrossRef]
- Uwimana, G.; Elhoumed, M.; Gebremedhin, M.A.; Azalati, M.M.; Nan, L.; Zeng, L. Association between quality antenatal care and low birth weight in Rwanda: a cross-sectional study design using the Rwanda demographic and health surveys data. BMC Heal. Serv. Res. 2023, 23, 558. [Google Scholar] [CrossRef]
- Aryastami, N.K.; Shankar, A.; Kusumawardani, N.; Besral, B.; Jahari, A.B.; Achadi, E. Low birth weight was the most dominant predictor associated with stunting among children aged 12–23 months in Indonesia. BMC Nutr. 2017, 3, 1–6. [Google Scholar] [CrossRef]
- FAO, IFAD, UNICEF, WFP, and WHO, “The State of Food Security and Nutrition in the World 2022,” The State of Food Security and Nutrition in the World 2022, p. 209 p., Jul. 2022. [CrossRef]
- FAO, IFAD, UNICEF, WFP, and WHO, “The State of Food Security and Nutrition in the World 2023,” The State of Food Security and Nutrition in the World 2023, p. 316 p, Jul. 2023. [CrossRef]
- W. F. P. (WFP), D. K. Pangan, and K. Pertanian, Food Security and Vulnerability Atlas of Indonesia 2015. Dewan Ketahanan Pangan, Kementerian Pertanian and World Food Programme (WFP), 2015. Accessed: Jun. 02, 2025. [Online]. Available: https://wfp.tind.io/record/126674.
- Dinagde, D.D.; Wada, H.W.; Chewaka, M.T. Household food insecurity and associated factors among postpartum women in southern Ethiopia: a community based cross sectional study. Sci. Rep. 2024, 14, 1–9. [Google Scholar] [CrossRef]
- Fan, H.-C.; Chang, Y.-M.; Lee, J.-Y.; Wang, D.-S.; Chen, C.-M.; Hu, S.-W.; Chiang, K.-L.; Kuo, F.-C. The Prevalence and Risk Analysis of Cerebral Palsy and Other Neuro-Psychological Comorbidities in Children with Low Birth Weight in Taiwan: A Nationwide Population-Based Cohort Study. J. Clin. Med. 2024, 13, 3480. [Google Scholar] [CrossRef]
- Ramadhani, D.N.A.M.; Budhiastuti, U.R.; Murti, B. Meta-Analysis of the Effect of Exposure to Indoor Cigarette Smoke in Pregnant Women on the Risk of Infants Low Birth Weight. J. Epidemiology Public Heal. 2023, 8, 469–477. [Google Scholar] [CrossRef]
- Lee, J.; Costello, S.; Balmes, J.R.; Holm, S.M. The Association between Ambient PM2.5 and Low Birth Weight in California. Int. J. Environ. Res. Public Heal. 2022, 19, 13554. [Google Scholar] [CrossRef] [PubMed]
- Gebreslasie, K.Z.; Weldemariam, S.; Gebre, G.; Zenebe, D.; Mehari, M.; Birhane, A.; Dewey, R.S. Intimate partner violence during pregnancy and risks of low birth weight and preterm birth in hospitals of Tigray, Northern Ethiopia. Sci. Rep. 2024, 14, 1–7. [Google Scholar] [CrossRef] [PubMed]
- Bachwenkizi, J.; Liu, C.; Meng, X.; Zhang, L.; Wang, W.; van Donkelaar, A.; Martin, R.V.; Hammer, M.S.; Chen, R.; Kan, H. Maternal exposure to fine particulate matter and preterm birth and low birth weight in Africa. Environ. Int. 2022, 160, 107053. [Google Scholar] [CrossRef] [PubMed]
- Kang, H. Sample size determination and power analysis using the G*Power software. J. Educ. Evaluation Heal. Prof. 2021, 18, 17. [Google Scholar] [CrossRef]
- Uniform Requirements for Manuscripts Submitted to Biomedical Journals. JAMA 1997, 277, 927–934. [CrossRef]
- FAO, “Analyse the Data | Voices of the Hungry | Food and Agriculture Organization of the United Nations.” Accessed: Jun. 11, 2025. [Online]. Available: https://www.fao.org/in-action/voices-of-the-hungry/analyse-data/en/.
- Child growth standards.” Accessed: Jun. 01, 2025. [Online]. Available: https://www.who.int/tools/child-growth-standards.
- Applying the FIES | Voices of the Hungry | Food and Agriculture Organization of the United Nations.” Accessed: Jan. 07, 2025. [Online]. Available: https://www.fao.org/in-action/voices-of-the-hungry/using-fies/en/.
- J. A. McCoshen, P. A. Fernandes, M. L. Boroditsky, and J. G. Allardice, “Determinants of Reproductive Mortality and Preterm Childbirth,” Adv Organ Biol, vol. 1, no. C, pp. 195–223, 1996. [CrossRef]
- Cutland, C.L.; Lackritz, E.M.; Mallett-Moore, T.; Bardají, A.; Chandrasekaran, R.; Lahariya, C.; Nisar, M.I.; Tapia, M.D.; Pathirana, J.; Kochhar, S.; et al. Low birth weight: Case definition & guidelines for data collection, analysis, and presentation of maternal immunization safety data. Vaccine 2017, 35, 6492–6500. [Google Scholar] [CrossRef]
- Institute of Medicine Improving Birth Outcomes; The National Academies Press: Washington, DC, United States, 2003.
- Bater, J.; Lauer, J.M.; Ghosh, S.; Webb, P.; Agaba, E.; Bashaasha, B.; Turyashemererwa, F.M.; Shrestha, R.; Duggan, C.P.; Wilunda, C. Predictors of low birth weight and preterm birth in rural Uganda: Findings from a birth cohort study. PLOS ONE 2020, 15, e0235626. [Google Scholar] [CrossRef]
- Rocha, A.R.d.F.; Morais, N.d.S.d.; Azevedo, F.M.; Morais, D.d.C.; Priore, S.E. Maternal food insecurity increases the risk of low birth weight babies: Systematic review and meta-analysis. Acta Paediatr. 2024, 113, 2180–2188. [Google Scholar] [CrossRef]
- Terfa, Z.G.; Nantanda, R.; Lesosky, M.; Devereux, G.; Obasi, A.; Mortimer, K.; Khan, J.; Rylance, J.; Niessen, L.W. Household food insecurity, maternal nutrition, environmental risks and infants’ health outcomes: protocol of the IMPALA birth cohort study in Uganda. BMJ Open 2022, 12, e050729. [Google Scholar] [CrossRef]
- Wulandari, R.A.; Budihastuti, U.R.; Murti, B. Meta-Analysis the Effect of Urinary Tract Infection in Pregnant Women on Prematurity and Low Birth Weight. J. Matern. Child Heal. 2021, 6, 600–611. [Google Scholar] [CrossRef]
- Jana, A.; Weobong, B. Correlates of low birth weight and preterm birth in India. PLOS ONE 2023, 18, e0287919. [Google Scholar] [CrossRef] [PubMed]
- Bonatti, A.d.T.; Roberto, A.P.d.S.C.; de Oliveira, T.; Jamas, M.T.; Carvalhaes, M.A.d.B.L.; Parada, C.M.G.d.L. Do depressive symptoms among pregnant women assisted in Primary Health Care services increase the risk of prematurity and low birth weight? Rev. Latino-Americana de Enferm. 2021, 29. [Google Scholar] [CrossRef]
- Bhagyalekshmi, L.; Tomy, C.; Olickal, J.J.; Thankappan, K.R. A Cross-Sectional Study of the Prevalence and Determinants of Formula-Feeding Practices by Mothers in a Sub-district of Kerala, India. Cureus 2024, 16, e74706. [Google Scholar] [CrossRef] [PubMed]
- Marsubrin, P.M.T.; Aryadevi, N.N.B.; Medise, B.E.; Devaera, Y.; Nimbalkar, S.M. Key Influences on Oral Feeding Achievement in Preterm Infants: Insights From a Tertiary Hospital in Indonesia. Int. J. Pediatr. 2024, 2024, 8880297. [Google Scholar] [CrossRef] [PubMed]
- Richterman, A.; Raymonville, M.; Hossain, A.; Millien, C.; Joseph, J.P.; Jerome, G.; Franke, M.F.; Ivers, L.C. Food insecurity as a risk factor for preterm birth: a prospective facility-based cohort study in rural Haiti. BMJ Glob. Heal. 2020, 5, e002341. [Google Scholar] [CrossRef]
- Montemor, M.S.; Demarque, G.F.; Rodrigues, A.S.; Francisco, R.P.V.; de Carvalho, M.H.B. Association between preterm births and socioeconomic development: analysis of national data. BMC Public Heal. 2022, 22, 1–10. [Google Scholar] [CrossRef]
- Ahmed, A.M.; Pullenayegum, E.; McDonald, S.D.; Beltempo, M.; Premji, S.S.; Pole, J.D.; Bacchini, F.; Shah, P.S.; Pechlivanoglou, P.; Class, Q.A. Association between preterm birth and economic and educational outcomes in adulthood: A population-based matched cohort study. PLOS ONE 2024, 19, e0311895. [Google Scholar] [CrossRef]
- Granés, L.; Torà-Rocamora, I.; Palacio, M.; De la Torre, L.; Llupià, A.; Garzon, S. Maternal educational level and preterm birth: Exploring inequalities in a hospital-based cohort study. PLOS ONE 2023, 18, e0283901. [Google Scholar] [CrossRef]
- Long, Y.; Jia, C.; Luo, X.; Sun, Y.; Zuo, W.; Wu, Y.; Wu, Y.; Kaierdebieke, A.; Lin, Z. The Impact of Higher Education on Health Literacy: A Comparative Study between Urban and Rural China. Sustainability 2022, 14, 12142. [Google Scholar] [CrossRef]
- Prasetyo, Y.B.; Permatasari, P.; Susanti, H.D. The effect of mothers’ nutritional education and knowledge on children’s nutritional status: a systematic review. Int. J. Child Care Educ. Policy 2023, 17, 1–16. [Google Scholar] [CrossRef]
- Adhikari, T.; Sahu, D.; Nair, S.; Saha, K.B.; Sharma, R.K.; Pandey, A. Factors associated with utilization of antenatal care services among tribal women. Indian J. Med Res. 2016, 144, 58–66. [Google Scholar] [CrossRef] [PubMed]
- Ade, A.D.; Guthi, V.R.; Kondagunta, N.; Kumar, D.S.S.; Deekala, R.; Vallepalli, C.; Prathyusha, T.V.D. Improving access to utilize the healthcare services facilitated by ASHAs, ANMs and medical officers of PHC among scheduled tribe pregnant women: An interventional study. J. Fam. Med. Prim. Care 2024, 13, 3856–3863. [Google Scholar] [CrossRef] [PubMed]
- Jańczewska, I.; Wierzba, J.; Jańczewska, A.; Szczurek-Gierczak, M.; Domżalska-Popadiuk, I. Prematurity and Low Birth Weight and Their Impact on Childhood Growth Patterns and the Risk of Long-Term Cardiovascular Sequelae. Children 2023, 10, 1599. [Google Scholar] [CrossRef] [PubMed]
- Santosa, A.; Arif, E.N.; Ghoni, D.A. Effect of maternal and child factors on stunting: partial least squares structural equation modeling. Clin. Exp. Pediatr. 2022, 65, 90–97. [Google Scholar] [CrossRef]
- A. S. Areba et al., “Factors associated with food insecurity among pregnant women in Gedeo zone public hospitals, Southern Ethiopia,” Front Public Health, vol. 12, p. 1399185, Aug. 2024. [CrossRef]
- Lemi, T.B.; Ababor, G.N.; Abdulahi, M. Relationship between household food insecurity and minimum dietary diversity among pregnant women attending antenatal care at public health facilities in Fiche town, Oromia region, Central Ethiopia: A facility-based cross-sectional study. BMJ Open 2025, 15, e088621. [Google Scholar] [CrossRef]
- Zinga, J.; McKay, F.H.; Lindberg, R.; van der Pligt, P. Experiences of Food-Insecure Pregnant Women and Factors Influencing Their Food Choices. Matern. Child Heal. J. 2022, 26, 1434–1441. [Google Scholar] [CrossRef]
- Tan, B.C.; Cheah, W.L.; Law, L.S. Demographic characteristics are associated with children’s nutritional status: Findings from a pilot study on food insecure households in Simunjan district, Sarawak. Malays. J. Nutr. 2023, 29. [Google Scholar] [CrossRef]
- Abdullah, N.A.; Nasution, Z.; Hamid, S.B.A. Impact of Pandemic COVID-19 towards Food Insecurity and Dietary Diversity Among B40 Mothers Living in Urban Areas in Selangor. 2024, 20, 3–11. [CrossRef]
- Das Shuvo, S.; Hossain, S.; Riazuddin; Mazumdar, S.; Roy, D.; Dida, G.O. Factors influencing low-income households’ food insecurity in Bangladesh during the COVID-19 lockdown. PLOS ONE 2022, 17, e0267488. [CrossRef]
- UNICEF, “Child Food Poverty: Nutrition deprivation in early childhood—UNICEF DATA.” Accessed: Apr. 07, 2025. [Online]. Available: https://data.unicef.org/resources/child-food-poverty-report-2024/.
- Shahzad, M.A.; Qing, P.; Rizwan, M.; Razzaq, A.; Faisal, M. COVID-19 Pandemic, Determinants of Food Insecurity, and Household Mitigation Measures: A Case Study of Punjab, Pakistan. Healthcare 2021, 9, 621. [Google Scholar] [CrossRef]
- Lukwa, A.T.; Siya, A.; Zablon, K.N.; Azam, J.M.; Alaba, O.A. Socioeconomic inequalities in food insecurity and malnutrition among under-five children: within and between-group inequalities in Zimbabwe. BMC Public Heal. 2020, 20, 1–11. [Google Scholar] [CrossRef]
- Disha, A.; K., S.K.; H., N.P.; T., D.M.; T., R.M.; Purnima, M.; Rahul, R. Household Food Insecurity Is Associated with Higher Child Undernutrition in Bangladesh, Ethiopia, and Vietnam, but the Effect Is Not Mediated by Child Dietary Diversity. J. Nutr. 2013, 143, 2015–2021. [CrossRef] [PubMed]
- Luna, K.L.D.; Talavera, M.T. Influences of wealth index, family size, food security, and diet diversity status in the growth of Filipino school-age children in farming households. 2022, 1. [CrossRef]
- Aghamohammadi, V.; Nasiri, K.; Bazyar, H.; Mohammadi, E.; Moghaddam, H.R.; Masoudi, M.R.; Ivanbagha, R.; Behzad, A.; Ezzati, M. Association of Household Food Insecurity with Stunting and Underweight Among Iranian Children Aged 2—5 Years old. Iran. J. Pediatr. 2024, 34. [Google Scholar] [CrossRef]
- E. H. Aden and S. A. Mohammed, “Household Food Insecurity and Its Association with Nutritional Status of Children 6–59 Months of Age in Kebridehar City | Aden | Indonesian Food and Nutrition Progress.” Accessed: Apr. 07, 2025. [Online]. Available: https://jurnal.ugm.ac.id/ifnp/article/view/90356/40460.
Figure 1.
Food Insecurity Pathway on The Impact of Prematurity and Low Birth Weight (LBW).
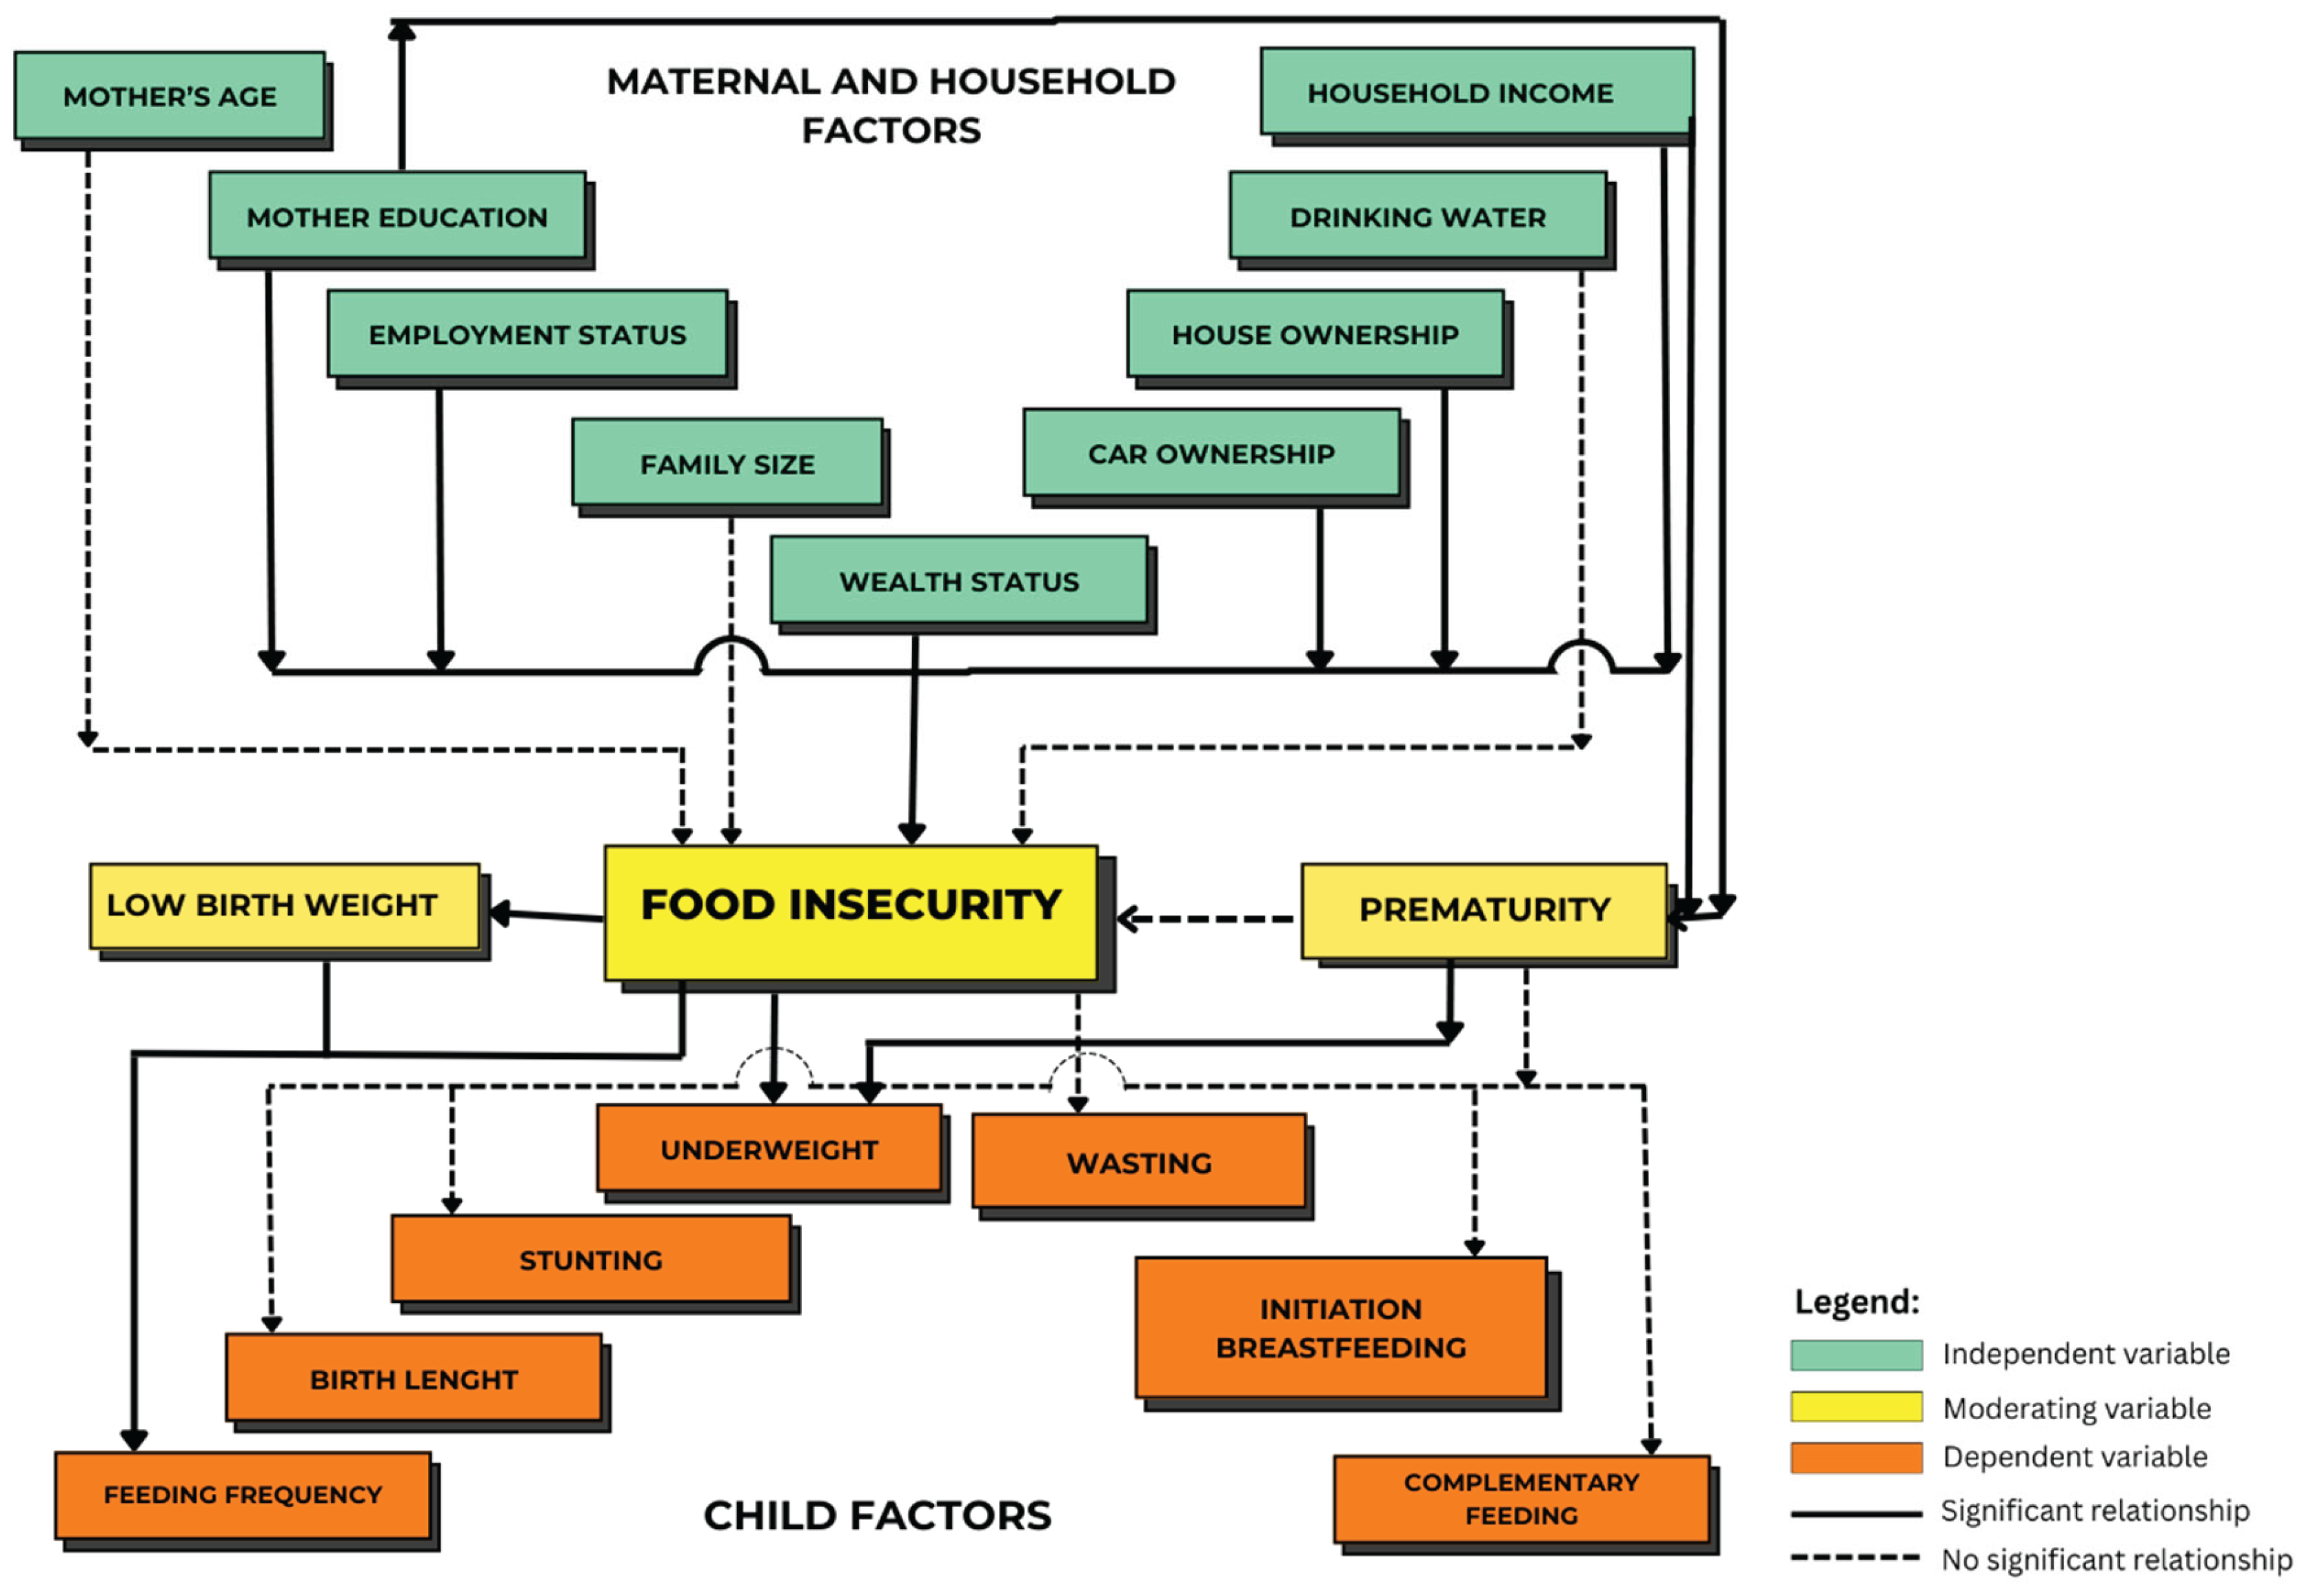

Table 1.
Maternal factors, household characteristics, and child factors among food secure and insecure households in Indonesia (N=657).
Table 1.
Maternal factors, household characteristics, and child factors among food secure and insecure households in Indonesia (N=657).
| Characteristics | Mean (±SD) | Food Insecure | Food Secure | Total | Chi-square (p-value) |
|---|---|---|---|---|---|
| n (%) | n (%) | n (%) | |||
| Maternal and household factors | |||||
|
Mother’s age Teen Mothers Young Adult Mothers Mature Adult Mothers Advanced Age Mothers |
32.79 (±6.21) |
0 (0.00) 87 (13.24) 123 (18.72) 43 (6.54) |
1 (0.15) 133 (20.24) 213 (32.42) 57 (8.68) |
1 (0.15) 220 (33.49) 336 (51.14) 100 (15.22) |
0.51 |
|
Maternal education Low Education Medium Education High Education |
93 (14.16) 141 (21.46) 19 (2.89) |
90 (13.70) 235 (35.77) 79 (12.02) |
183 (27.85) 376 (57.23) 98 (14.92) |
0.00* | |
|
Mothers’ employment status Not employed Employed |
166 (25.27) 87 (13.24) |
213 (32.42) 191 (29.07) |
379 (57.69) 278 (42.31) |
0.00* | |
|
Family size Small Family Medium Family Large Family |
51 (7.76) 170 (25.88) 32 (4.87) |
63 (9.59) 279 (42.47) 62 (9.44) |
114 (17.35) 449 (68.34) 94 (14.31) |
0.25 | |
|
Monthly household income Low income Medium income High income |
231 (35.16) 20 (3.04) 2 (0.30) |
319 (48.55) 67 (10.20) 18 (2.74) |
550 (83.71) 87 (13.24) 20 (3.04) |
<0.00* | |
|
Drinking water Tap water Mineral water (in glass/PET bottle) Borehole Springwater |
54 (8.22) 185 (28.16) 11 (1.67) 3 (0.46) |
69 (10.50) 316 (48.10) 15 (2.28) 4 (0.61) |
123 (18.72) 501 (76.26) 26 (3.95) 7 (1.07) |
0.52 f | |
|
House Ownership Yes No |
67 (10.20) 186 (28.31) |
146 (22.22) 258 (39.27) |
213 (32.42) 444 (67.58) |
0.01** | |
|
Car Ownership Yes No |
10 (1.52) 243 (36.99) |
73 (11.11) 331 (50.38) |
83 (12.63) 574 (87.37) |
<0.00* | |
|
Wealth Status (self-assessment) rather better off average rather worse off |
74 (11.26) 164 (24.96) 15 (2.28) |
128 (19.48) 272 (41.40) 4 (0.61) |
202 (30.75) 436 (66.36) 19 (2.89) |
0.00* | |
| Child factors | |||||
|
Child gender Boy Girl |
134 (20.40) 119 (18.11) |
192 (29.22) 212 (32.27) |
326 (49.62) 331 (50.38) |
0.18 | |
|
Prematurity Preterm birth Normal birth |
37.33 (±2.40) |
108 (16.44) 145 (22.07) |
183 (27.85) 221 (33.64) |
291 (44.29) 366 (55.71) |
0.51 |
|
Birth weight Low birth weight Normal birth weight |
3.05 (±0.48) |
17 (2.59) 236 (35.92) |
44 (6.70) 360 (54.79) |
61 (9.28) 596 (90.72) |
0.07 |
|
Birth length Short birth length Normal birth length Long birth length |
42 (6.39) 207 (31.51) 4 (0.61) |
64 (9.74) 331 (50.38) 9 (1.37) |
106 (16.13) 538 (81.89) 13 (1.98) |
0.83 | |
|
Stunting Stunted Not stunted |
-1.10 (±1.62) |
68 (10.35) 185 (28.16) |
98 (14.92) 306 (46.58) |
166 (25.27) 491 (74.73) |
0.45 |
|
Wasting Wasted Not wasted |
-0.29 (±1.95) |
37 (5.63) 216 (32.88) |
69 (10.50) 335 (50.99) |
106 (16.13) 551 (83.87) |
0.41 |
|
Underweight Underweight Normal |
-0.84 (±1.64) |
63 (9.59) 190 (28.92) |
85 (12.94) 319 (48.55) |
148 (22.53) 509 (77.47) |
0.25 |
|
Initiation of breastfeeding Less than one hour Between 1 and 23 hours More than 24 hours |
176 (26.79) 44 (6.70) 33 (5.02) |
267 (40.64) 80 (12.18) 57 (8.68) |
443 (67.43) 124 (18.87) 90 (13.70) |
0.64 | |
|
Age at starting complementary feeding Less than 6 months 6 months More than 6 months |
28 (4.26) 182 (27.70) 43 (6.54) |
39 (5.94) 316 (48.10) 49 (7.46) |
67 (10.20) 498 (75.80) 92 (14.00) |
0.15 | |
|
Feeding frequency 2 times 2–3 times 3–6 times and more |
42 (6.39) 148 (22.53) 63 (9.59) |
67 (10.20) 243 (36.99) 94 (14.31) |
109 (16.59) 391 (59.51) 157 (23.90) |
0.89 | |
|
Exclusive breastfeeding Yes No |
19 (2.89) 234 (35.62) |
34 (5.18) 370 (56.32) |
53 (8.07) 604 (91.93) |
0.68 | |
|
Ever breastfeeding Yes No |
93 (14.16) 160 (24.35) |
152 (23.14) 252 (38.36) |
245 (37.29) 412 (62.71) |
0.82 | |
|
Baby weaning less than 6 months Between 6 months–24 months 24 months or more Still breastfeeding |
47 (7.15) 88 (13.39) 111 (16.89) 7 (1.07) |
77 (11.72) 115 (17.50) 186 (28.31) 26 (3.96) |
124 (18.87) 203 (30.90) 297 (45.21) 33 (5.02) |
0.10 | |
*p < 0.001, **p < 0.01, ***p < 0.05.
Table 2.
Prevalence of prematurity and low birth weight among children under five and other characteristics (N=657).
Table 2.
Prevalence of prematurity and low birth weight among children under five and other characteristics (N=657).
| Characteristics | Prematurity | LBW | ||
|---|---|---|---|---|
| Normal n (%) |
Preterm Birth n (%) |
No LBW n (%) |
LBW n (%) |
|
|
Child gender Boy Girl |
184 (28.01) 182 (27.70) |
142 (21.61) 149 (22.68) |
294 (44.75) 302 (45.97) |
32 (4.87) 29 (4.41) |
|
Stunting Not stunted Stunted |
||||
| 276 (42.01) | 215 (32.72) | 450 (68.49) | 41 (6.24) | |
| 90 (13.70) | 76 (11.57) | 146 (22.22) | 20 (3.04) | |
|
Wasting Wasted Not wasted |
60 (9.13) 306 (46.58) |
46 (7.00) 245 (37.29) |
98 (14.92) 498 (75.80) |
8 (1.22) 53 (8.07) |
|
Underweight Underweight Normal |
||||
| 80 (12.18) | 68 (10.35) | 135 (20.55) | 13 (1.98) | |
| 286 (43.53) | 223 (33.94) | 461 (70.17) | 48 (7.31) | |
|
Initiation of breastfeeding Less than one hour Between 1 and 23 hours More than 24 hours |
252 (38.36) 65 (9.89) 49 (7.46) |
191 (29.07) 59 (8.98) 41 (6.24) |
406 (61.80) 113 (17.20) 77 (11.72) |
37 (5.63) 11 (1.67) 13 (1.98) |
|
Age at starting complementary feeding Less than 6 months 6 months More than 6 months |
38 (5.78) 284 (43.23) 44 (6.70) |
29 (4.41) 214 (32.57) 48 (7.31) |
60 (9.13) 457 (69.56) 79 (12.02) |
7 (1.07) 41 (6.24) 13 (1.98) |
|
Feeding frequency 2 times 2–3 times 3–6 times and more |
58 (8.83) 220 (33.49) 88 (13.39) |
51 (7.76) 171 (26.03) 69 (10.50) |
103 (15.68) 347 (52.82) 146 (22.22) |
6 (0.91) 44 (6.70) 11 (1.67) |
|
Ever breastfeeding Yes No |
342 (52.05) 24 (3.65) |
262 (39.88) 29 (4.41) |
550 (83.71) 46 (7.00) |
54 (8.22) 7 (1.07) |
|
Exclusive breastfeeding Yes No |
129 (19.63) 237 (36.07) |
116 (17.66) 175 (26.64) |
224 (34.09) 372 (56.62) |
21 (3.20) 40 (6.09) |
|
Baby weaning less than 6 months Between 6 months–24 months 24 months or more still breastfeeding |
70 (10.65) 115 (17.50) 164 (24.96) 17 (2.59) |
54 (8.22) 88 (13.39) 133 (20.24) 16 (2.44) |
111 (16.89) 183 (27.85) 275 (41.86) 27 (4.11) |
13 (1.98) 20 (3.04) 22 (3.35) 6 (0.91) |
|
Household Food Insecurity Food-secure Food-insecure |
221 (33.64) 108 (22.07) |
183 (27.85) 253 (16.44) |
360 (54.790 236 (35.92) |
44 (6.70) 17 (2.59) |
|
Mother’s age Teen Mothers Young Adult Mothers Mature Adult Mothers Advanced Age Mothers |
0 (0.00) 127 (19.30) 182 (27.70) 57 (8.68) |
1 (0.20) 93 (14.20) 154 (23.40) 43 (6.50) |
1 (0.20) 199 (30.30) 306 (46.60) 90 (13.70) |
0 (0.00) 21 (3.20) 30 (4.57) 10 (1.52) |
|
Maternal education Low Education Medium Education High Education |
86 (13.09) 216 (32.88) 64 (9.74) |
97 (14.76) 160 (24.35) 34 (5.18) |
159 (24.20) 347 (52.82) 90 (13.70) |
24 (3.65) 29 (4.41) 8 (1.22) |
|
Mothers’ employment status Not employed Employed |
210 (31.96) 156 (23.74) |
169 (25.72) 122 (18.57) |
350 (53.27) 246 (37.44) |
29 (4.41) 32 (4.87) |
|
Family size Small Family: 3 members Medium Family: 4-6 members Large Family: more than 6 members |
67 (10.20) 248 (37.75) 51 (7.76) |
47 (7.15) 201 (30.59) 43 (6.54) |
106 (16.13) 405 (61.64) 85 (12.94) |
8 (1.22) 44 (6.70) 9 (1.37) |
|
Monthly household income Low income Medium income High income |
315 (47.95) 39 (5.94) 12 (1.83) |
235 (35.77) 48 (7.31) 8 (1.22) |
498 (75.80) 79 (12.02) 19 (2.89) |
52 (7.91) 8 (1.22) 1 (0.15) |
|
Drinking water Tap water Mineral water (in glass/PET bottle) Borehole Springwater |
63 (9.59) 284 (43.23) 17 (2.59) 2 (0.30) |
60 (9.13) 217 (33.03) 9 (1.37) 5 (0.76) |
113 (17.20) 456 (69.41) 21 (3.20) 6 (0.91) |
10 (1.52) 45 (6.85) 5 (0.76) 1 (0.15) |
|
House Ownership Yes No |
119 (18.11) 247 (37.6) |
94 (14.31) 197 (29.98) |
196 (29.83) 400 (60.88) |
17 (2.59) 44 (6.7) |
|
Car Ownership Yes No |
42 (6.39) 324 (49.32) |
41 (6.24) 250 (38.05) |
79 (12.02) 517 (78.69) |
4 (0.61) 57 (8.68) |
|
Wealth Status rather better off average rather worse off |
115 (17.50) 237 (36.07) 14 (2.13) |
87 (13.24) 199 (30.29) 5 (0.76) |
183 (27.85) 395 (60.12) 18 (2.74) |
19 (2.89) 41 (6.24) 1 (0.15) |
Table 3.
Determinant Analysis on Prematurity, Low Birth Weight, and Household Food Insecurity with Multivariable Logistic Regression.
Table 3.
Determinant Analysis on Prematurity, Low Birth Weight, and Household Food Insecurity with Multivariable Logistic Regression.
| Characteristics | Prematurity | Low Birth Weight (LBW) | Food Insecurity | |||
|---|---|---|---|---|---|---|
| COR (95%CI) | AOR (95%CI) | COR (95%CI) | AOR (95%CI) | COR (95%CI) | AOR (95%CI) | |
|
Household Food Insecurity Food secure Food insecure |
1 1.11 (0.81–1.53) |
1 1.70 (0.95–3.04) |
1.89 (1.02–3.48)*** |
|||
|
Maternal education Low Education Medium Education High Education |
2.12 (1.28–3.53)** 1.39 (0.88–2.22) 1 |
2.95 (1.66–5.25)* 1.82 (1.09–3.04)*** |
1.70 (0.73–3.94) 0.94 (0.42–2.13) 1 |
1.51 (0.58–3.96) 0.76 (0.31–1.85) |
4.30 (2.41–7.67)* 2.49 (1.45–4.29)* 1 |
2.46 (1.31–4.63)** 1.59 (0.89–2.86) |
|
Mothers’ employment status Unemployed Employed |
1.03 (0.75–1.41) 1 |
0.64 (0.38–1.08) 1 |
0.60 (0.34–1.05) |
1.71 (1.24–2.37)* 1 |
1.46 (1.03–2.07)*** |
|
|
Monthly household income Low income Medium income High income |
1.12 (0.45–2.78) 1.85 (0.69–4.97) 1 |
0.86 (0.33–2.27) 1.66 (0.60–4.57)** |
1.98 (0.26–15.12) 1.92 (0.23–16.33) 1 |
1.78 (0.22–14.43) 1.87 (0.21–16.42) |
6.52 (1.50-28.36)*** 2.69 (0.57-12.58) 1 |
3.36 (0.71–15.83)** 2.41 (0.48–12.15) |
|
House Ownership Yes No |
0.99 (0.71–1.38) 1 |
0.79 (0.44–1.42) 1 |
0.64 (0.45–0.90)** 1 |
0.84 (0.58–1.23) |
||
|
Car Ownership Yes No |
1.27 (0.80–2.00) 1 |
1.51 (0.89–2.54) |
0.46 (0.16–1.30) 1 |
0.37 (0.12–1.16) |
0.19 (0.09–0.37)* 1 |
0.31 (0.15–0.64)* |
|
Wealth Status rather better off average rather worse off |
1 1.11 (0.79–1.55) 0.47 (0.16–1.36) |
1 0.99 (0.56–1.77) 0.54 (0.68–4.23) |
1 1.04 (0.74–1.47) 6.49 (2.08–20.27)* |
0.96 (0.67–1.39) 5.08 (1.59–16.28)** |
||
|
Prematurity Preterm Birth Normal |
|
2.24 (1.30–3.85)** 1 |
2.20 (1.25–3.86)** |
0.90 (0.66–1.23) 1 |
||
|
Stunting Stunted Not stunted |
1.08 (0.76–1.54) 1 |
1.50 (0.85–2.65) 1 |
1.15 (0.80–1.64) 1 |
|||
|
Wasting Wasted Not wasted |
0.96 (0.63–1.46) 1 |
0.77 (0.35–1.66) 1 |
0.83 (0.54–1.28) 1 |
|||
|
Underweight Underweight Normal |
2.24 (1.30–3.85)** 1 |
2.19 (1.27–3.82)** |
0.59 (0.33–1.06) 1 |
0.53 (0.29–0.98)*** |
||
|
Feeding frequency 2 times 2–3 times 3–6 times or more |
1 0.88 (0.58–1.35) 0.89 (0.55–1.46) |
1 2.18 (0.90–5.25) 1.29 (0.46–3.61) |
2.50 (1.01–6.14)*** 1.45 (0.51–4.15) |
1 0.97 (0.63 -1.50) 1.07 (0.65–1.76) |
||
*P < 0.001, **P < 0.01, ***p < 0.05.
Disclaimer/Publisher’s Note: The statements, opinions and data contained in all publications are solely those of the individual author(s) and contributor(s) and not of MDPI and/or the editor(s). MDPI and/or the editor(s) disclaim responsibility for any injury to people or property resulting from any ideas, methods, instructions or products referred to in the content. |
© 2025 by the authors. Licensee MDPI, Basel, Switzerland. This article is an open access article distributed under the terms and conditions of the Creative Commons Attribution (CC BY) license (http://creativecommons.org/licenses/by/4.0/).
Copyright: This open access article is published under a Creative Commons CC BY 4.0 license, which permit the free download, distribution, and reuse, provided that the author and preprint are cited in any reuse.


