
Submitted:
23 June 2025
Posted:
24 June 2025
You are already at the latest version
Abstract
We investigated how water restriction affects plant-plant interactions in two Mediter-ranean shrubs, Thymus carnosus and Retama monosperma. The aim was to test whether intra- and interspecific interactions between these species respond differently to drought. A greenhouse experiment was conducted with 5-month-old seedlings from seeds col-lected in El Rompido, (Huelva, Spain), grown in a factorial design under three interaction types (interspecific, isolation, and intraspecific). After a 7-month growth phase, a wa-ter-restriction treatment was applied. Growth and branching were measured before drought treatment, while shoot water potential and photochemical efficiency of chlo-rophyll were monitored weekly during the treatment. At the end of the experiment, biomass allocation was analysed, and leaf samples were collected for stable isotope analysis. Results showed a negative effect of Retama on Thymus regarding access to be-lowground resources and drought response, while Thymus exhibited an intraspecific facilitation effect, improving growth and reducing water stress. Despite producing less below- and above-ground biomass, Thymus showed a better physiological response to drought than Retama. These results highlight how drought can alter the balance between competition and facilitation in plant interactions. Given the predicted increase in drought frequency and severity, understanding these effects is relevant to predicting vegetation dynamics under global climate change.
Keywords:
biomass allocation
; plant-plant interaction
; Retama monosperma
; shoot water potential
; Thymus carnosus
; stable isotopes
1. Introduction
Intra- and interspecific interactions control the composition of plant communities and can affect community attributes, such as species diversity or resistance to invasion [1,2]. However, these plant-plant interactions can be altered by multiple factors, including climate conditions, nutrient availability [3], and soil microbial communities. Among these environmental change drivers, water availability plays a crucial role. In this sense, extreme drought events—expected to become more frequent and intense in the Mediterranean region [4,5]—can significantly influence belowground processes, ultimately modifying plant-plant interactions and reshaping community dynamics [1,6,7].
Mediterranean ecosystems, like other water-limited environments, experience pulses of water availability and discrete precipitation with drought periods, making them especially sensitive to increase frequency of these extreme drought events [8,9,10]. Rainfall variability and unpredictability impose strong constraints on plants, significantly affecting individual survival [11] and community dynamics [12]. In Mediterranean dune ecosystems, with a seasonality strongly marked by hot, dry summers, vegetation is highly dependent on rainfall patterns and water availability [13]. Climate predictions point to a generalised decrease in precipitation for the Mediterranean region by 2050, with fewer rainy days concentrated more in winter, and longer dry periods between rainfall events [4,5,14,15], as has already been observed in recent years. In fact, according to meteorological records, arid climates (type B according to Köppen) in the Iberian Peninsula have doubled their extent, increasing from 10% to 21% of the surface area, mainly at the expense of temperate climates (Type C climates), which have decreased [16]. Therefore, Mediterranean ecosystems are highly vulnerable to climate-induced changes in water availability [15,17], which may alter species distribution and plant-plant interactions [18].
Plant-plant interactions play a key role in the establishment of new species, particularly the seedling stage, which is one of the most critical phases influencing species persistence within plant communities [19,20]. Seedlings and juveniles are generally more sensitive to dehydration than seeds or adult plants [9,21]. Consequently, many species establish under the canopy of other plants, where higher humidity levels promote survival, a phenomenon known as the "nurse effect" [22]. Additionally, differences in seedlings' size and ontogenetic stage can affect the outcome of interspecific competition [23].
The net balance of species interactions is determined by the combination of positive and negative influences, both direct and indirect [24,25]. Studying each factor in isolation is crucial for understanding its specific effects and impact at different levels, such as the root system, canopy, water availability, or shade. This approach can offer valuable insights into the role of individual interactions and their consequences on plant performance and community dynamics.
Functional balance theory [26,27] states that the growth of the belowground fraction is promoted in response to water or mineral nutrient scarcity, while the aerial parts of the plant are favoured under conditions of low light or CO2 [28,29]. This aligns with the biomass allocation theory proposed by [30]. Belowground resource competition can be intense and has been associated with spatial segregation of roots [31,32], as plants alter their root production in the presence of other plants [33,34,35]. Roots can either avoid other roots [36,37] or, conversely, proliferate in their presence [38], interfering with or inhibiting the growth of neighbouring roots [39,40,41], using secondary compounds [41]. Therefore, knowing how species function belowground is very important in determining their competitive ability against other plants. Additionally, fine-root interference plays a critical role in determining the competitive success of a species [42,43].
We selected two native woody species representative of Mediterranean shrub vegetation that naturally co-exist, Thymus carnosus Boiss and Retama monosperma (L.) Boiss. T. carnosus is a protected species with medicinal and culinary uses, while R. monosperma is described as a key species in ecosystem restoration and erosion control, as it has been used for dune stabilization [44]. This species also possesses medicinal properties [16,45]. R. monosperma can be considered an expansive species, as it is spreading and increasing in abundance within its original range [46]. Several studies have reported negative impacts of expansive species on plant communities, which can be comparable to those of non-native species [47]. In fact, the expansion of R. monosperma has posed significant conservation challenges for several T. carnosus native populations [48,49], prompting efforts to reduce Retama density to improve T. carnosus habitats [50]. Studying these two species and their interactions is crucial to understand, how plants respond to drought and competition and will also contribute to gain insight into the potential threat posed by R. monosperma to the endangered T. carnosus, contributing to a better understanding of their physiological responses, competitive dynamics, and implications for conservation.
Under natural conditions, the interaction of adult individuals of T. carnosus with R. monosperma has been observed to have a negative net effect on Thymus [48,51,52]. However, it is still unknown whether this is the result of the allocation of biomass towards the photosynthetic part to the detriment of the root fraction due to the effect of the shade of the R. monosperma canopy, according to the theory of [30]; or whether there is a direct competition between the roots of both species for underground resources. Despite the documented negative interaction, the influence of drought on this relationship and below-ground competition between the species has not been thoroughly explored. These previous studies [48,51,52] provide a solid basis to explore how drought influences species dynamics and whether below-ground competition for resources plays a role in their responses to water stress and survival under climate change scenarios. Given the projected escalation in both the frequency and severity of drought events [53], assessing their effect on plant-plant interactions within the context of global climate change is crucial. By conducting a controlled drought experiments, we can evaluate how water stress affects plants during a critical developmental phase -the active growth period- while minimizing the influence of other environmental stressors, such as high temperatures or nutrient scarcity. This approach enhances our understanding of how shifts in rainfall patterns may affect ecosystems under future climate scenarios.
Within this aim, a greenhouse experiment was set up to evaluate the impact of drought on plant-plant interactions. We aimed to assess whether the ability of the focal species to resist and recover after drought was differently affected by the intra- or interspecific interactions (competition or facilitation) between the species. Specifically, our objectives were to determine (1) the effect of intra- or interspecific interaction on biomass allocation patterns in Thymus carnosus and Retama monosperma under two levels of water availability and (2) the effect of intra- or interspecific interaction on the physiological performance of plants under two levels of water availability. The experiment was conducted with five-month-old seedlings of both species (to eliminate the shading effect of Retama on Thymus) in three interaction scenarios: interspecific, intraspecific, and isolated. After seven months of co-growth, plants were subjected to a five-week water restriction period, avoiding exposure to high temperatures to simulate a water deficit scenario outside the summer season. This approach is particularly relevant, as previously mentioned, given that climate change projections indicate an increased frequency of droughts during the growing season (winter), which could have significant ecological consequences. Plant responses to competition were analysed through growth, physiological and biomass allocation measurements.
Given the already known competition for water between the two species and the negative effect on T. carnosus under natural conditions [51], the starting hypothesis is that the presence of R. monosperma will negatively affect the water status and physiological performance of T. carnosus under greenhouse conditions. Following the Functional Balance Theory, the growth of the belowground fraction would be promoted at the expense of the aerial parts under drought conditions. Studying how these species respond to drought and interact with each other can have practical implications for ecosystem management and conservation.
2. Results
2.1. Growth Pattern Before the Water Restriction Experiment
We found significant differences in growth patterns among the study species under well-watered conditions. In Thymus relative elongation rate (RER) measured 59 days after transplanting was significantly lower in the T-r combination than T-T and T (Figure 1a). Although by day 117 these differences were not significant, over the study period the T-T combination exhibited the highest elongation rates while T and T-r were similar (Figure 1b). Branching patterns mirrored these trends, with T-T branching the most during the whole study period (Figure 2). Apart from the differences between combinations, significant differences were also detected over time and in the interaction between combinations and time, as summarised in Table 1.
When analysing the temporal evolution of RER (Figure 1a) and branch number (Figure 1a) for Retama combinations, isolated individuals (R) initially showed greater elongation and branch increase than those growing with Thymus (R-t). However, by day 117, RER equalised between the two groups, with R-t exhibiting even higher branching. Total length and branching were greater in T-T plants from Thymus combinations and in R plants from Retama combinations (Figure 1b, and 2b).
Total elongation values shown in Figure 2b represent the sum of the elongation of all branches per plant. Numerous branches de1eloped throughout the 117-day growth period, contributing to the high total values observed. For instance, Retama plants (from the R combination) showed a mean total elongation of 1132 cm over the entire study period considering the elongation of all branches. However, the mean length per branch was 18 cm, with an average of 69 branches per plant. In contrast, Thymus’s branches had a mean branch length of 3.1 cm, with an average of 89 branches per plant, resulting in a total mean elongation of 234.2 cm per plant.
Comparing the species with each other, Retama demonstrated a significantly higher RER than Thymus, reaching a mean value of almost 14 cm day-1 per plant. At the same time, Thymus did not exceed 6 cm day-1 (reached by T-T) through the study period (Figure 1). The opposite was true for branching, with Thymus exhibiting higher average branching, particularly in the T-T combination. Retama barely exceeded 68 total branches on average per plant, while Thymus showed a minimum of 86 branches (T-r) and a maximum average of 142 total branches per plant (T-T). The relation between the number of branches and total elongation was significantly positive for both species and all interaction combinations, showing that neither intra- nor inter-specific competition modified species-specific growth strategy (Figure 3).
2.2. Water Restriction Experiment
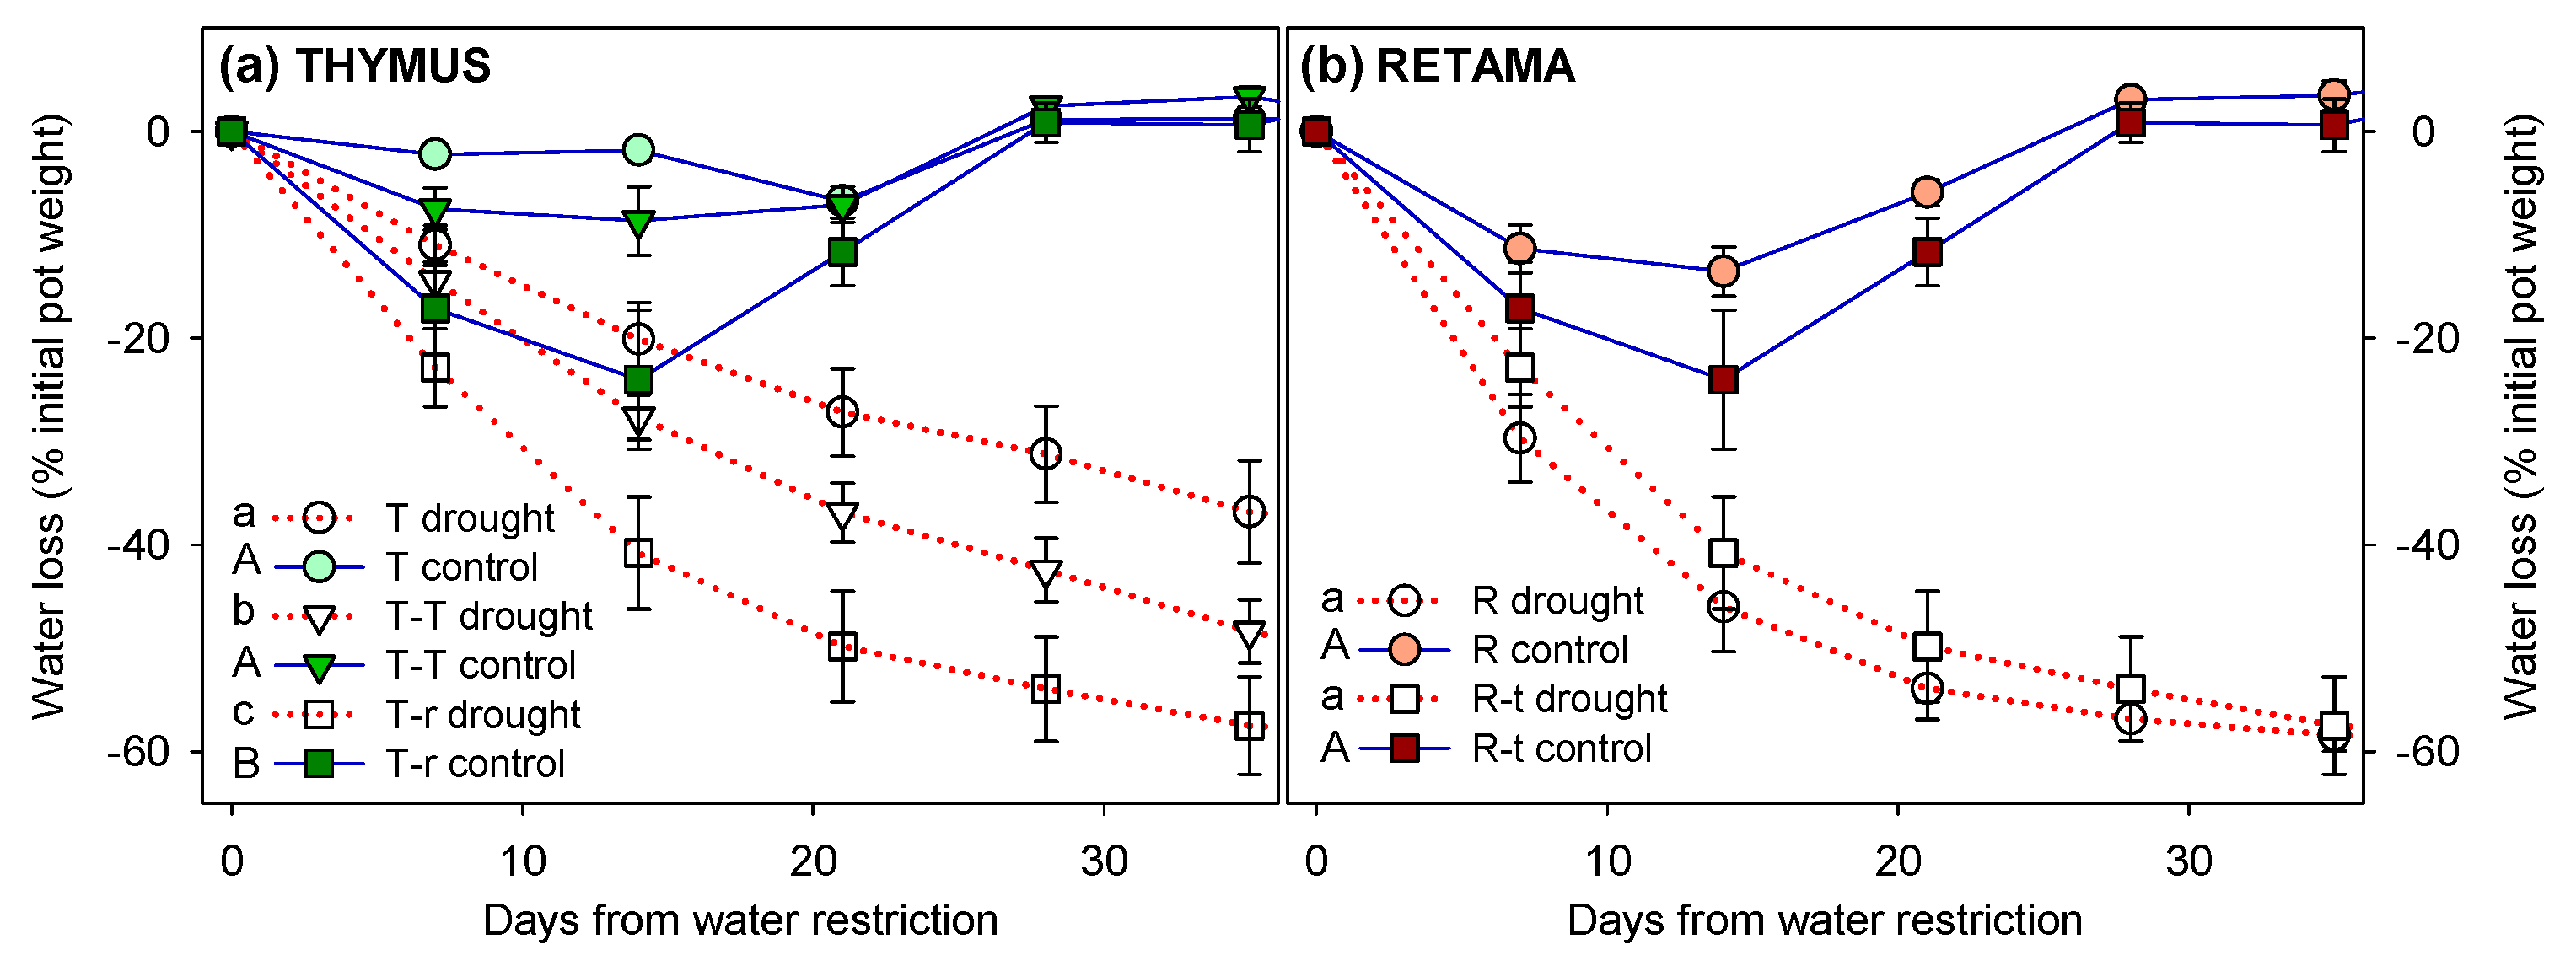
After the imposition of water restriction, drought pots lost moisture rapidly, with a final weight reduction of 38% in T, 51% in T-T, and 58% in both R and T-r pots (the latter corresponding to the same pots as R-t, but named differently depending on the species measured) (Figure A1). Significant differences in weight loss were observed between drought and control pots across all combinations after the 6-week treatment period. In control pots, no significant differences were found among combinations, whereas in drought conditions, T-r and R pots exhibited significantly greater weight loss than T or T-T pots. Additionally, T-r control pots showed a sharper weight loss during the first two weeks compared to other combinations, until re-watering to FC was applied.
2.2.1. Shoot Water Potential
During the six-week water restriction treatment, no significant differences in Ψm were observed among the four control combinations. In the water restriction pots, all plants in combinations involving Retama exhibited a significant, progressive, and similar temporal decrease pattern in Ψm, reaching values well below -2 MPa in both Thymus and Retama. However, Thymus individuals growing alone (T) and those under intraspecific competition (T-T) showed no significant differences in Ψm between control and water restriction treatment by the end of the experiment (Figure 4). After the recovery irrigation, Ψm increased across all combinations with no significant differences between control and drought plants. The three-way ANOVA for Thymus revealed a significant effect for the three factors: competition, time, and watering (Table 2). In contrast, Retama did not show significant differences for the competition factor, indicating a similar response to water restriction whether growing alone or in competition with Thymus (Figure 4b).
2.2.2. Photochemical Efficiency
Significant differences were found in photochemical efficiency (ΦPSII) and maximum photochemical efficiency (Fv/Fm) on Thymus plants across competition treatments, as well as in all interactions between competition, watering, and time (Figure 5a, c, Table 2). The results indicate that the drought response of Thymus plants depended on the competition treatment in which they were growing (Figure 5a). Plants in the T-T combinations showed the highest ΦPSII and Fv/Fm values, whereas T-r plants exhibited the lowest. In Retama, differences in ΦPSII and Fv/Fm were observed between competition treatments (Figure 5b, d indicated next to the legend with different letters). However, no significant differences in Fv/Fm were detected between drought and control Retama plants at the end of the watering treatment across competition scenarios. Notably, Fv/Fm values never dropped below a mean of 0.74."
In summary, the fluorescence measurements showed the effect of Thymus-Retama interspecific competition both in control and drought conditions, more notably than the effect of the drought itself.
2.3. Biomass Allocation
The final biomass allocation in Thymus combinations showed little difference between drought and control treatments, except for T-T, which exhibited a higher BR/BA in drought individuals (Figure 6). When comparing the three combinations, higher BR/BT and BR/BA were found in control plants of T-r compared to T-T, with intermediate values in T, while there were no differences for drought plants. The two-way ANOVA revealed the same trends for Thymus, with the only significant differences attributed to the competition factor in BR/BT and BR/BA (Table 3). In this case, T-T differed significantly from both T-r and T, with these combinations showing overall higher values of both parameters than T-T (post-hoc, Figure 6a).
Retama showed differences between watering treatments, with lower BS/BT and consequently higher allocation to root biomass in drought-treated plants, although the differences were significant only in the case of R-t (Figure 6c). The two-way ANOVA showed significant results for both variables and BR/BA in both the competition factor and the watering treatment, though not in their interaction (Table 3). Overall values indicated lower BS/BT for R-t, with higher BR/BT and BR/BA compared to R.
Retama achieved significantly higher final biomasses than Thymus, averaging over 2g of roots per plant compared to 0.25 g for Thymus (F=310.9, P<0.001), and over 7 g of aboveground biomass (stems) compared to 2.7g for Thymus (1 g in stems and 1.7g in leaves) (F=99.2, P<0.001). No differences were found among Thymus combinations for any of the final biomasses (roots, stems, or leaves).
2.4. Leaf Chemistry Analyses
Leaf C and N content, δ13C, and δ15N isotopes, and C/N ratio did not show differences between control and drought plants in any combination. However, Thymus plants exhibited a significantly higher leaf C content (48-50%) than Retama plants (43%), regardless of the competition treatment (Table 4 and Table 5). Leaf N content (1.5%) and C/N ratio (30-40) did not differ between combinations.
3. Discussion
Our findings support the initial hypothesis that water restriction has a stronger physiological impact on T. carnosus when interacting with R. monosperma. The results suggest that underground competition for water may be a key factor driving the decline in water potential of this endangered species. While this interspecific competition does not show a significant effect on Thymus biomass, results suggest that intraspecific interactions seem to enhance both growth and drought tolerance on T. carnosus.
Despite having access to the same nutrient concentrations under optimal greenhouse conditions with constant watering, Thymus growth rates were lower than those of Retama. According to [54], plants naturally inhabiting poor soils, such as dune sands, inherently exhibit lower growth rates than those inhabiting more fertile soils, due to adaptations to conserve the scarce available resources. However, R. monosperma, being an N-fixing species, would be adapted to fertile soils that it fertilises, creating a positive feedback loop that promotes higher growth rates [55]. Moreover, in dune ecosystems with low vegetation cover, high elongation rates can provide a competitive advantage for seedlings by occupying space and excluding competing plants by shading them [27], as would be the case of R. monosperma over T. carnosus Retama might be reflecting a different successional strategy [56], likely due to its greater nutrient acquisition capacity [54] and growth rate.
Regarding T. carnosus interactions, plants under intraspecific competition exhibited greater total elongation and number of branches compared to those in interspecific competition or growing in isolated plants, indicating a facilitative effect within the species. Although theory supports that intraspecific competition should be stronger than interspecific competition, our results suggest that facilitation can override competitive impacts under certain conditions. This pattern aligns with previous findings, where intraspecific facilitation has been shown to mitigate competition [57,58,59]. Using pots and fertilized soil may have influenced plant responses compared to field conditions with lower water and nutrient availability, potentially reducing abiotic stress. However, these conditions were consistent across both intra- and interspecific interactions.
Our results on physiological responses to different plant interaction scenarios indicate that T. carnosus exhibits greater resilience in water-limited environments, likely due to its lower water demand and potentially more efficient water-use strategies. Comparing the Ψm values recorded in this experiment with those reported under field conditions [51], we found that Thymus plants in control treatments (T, T-T, or T-r) exhibited Ψm values similar to those observed in autumn and winter under natural conditions, indicating that our experimental setup replicated field water availability during these seasons. Under water restriction, Ψm varied with plant interactions. Isolated Thymus maintained Ψm values comparable to autumn and winter field conditions, showing no water stress. In contrast, Thymus under intraspecific competition resulted in Ψm values (-1,3 MPa) similar to field isolated T. carnosus in summer (-1.2 MPa). However, Thymus under interspecific competition (T-r) experienced a stronger decline in Ψm (-2.4 MPa), exceeding the typical summer values for this association in the field (-1.5 MPa). This results suggest that R. monosperma intensified water limitation for T. carnosus under experimental conditions, consistent with field observations, where Retama’s water use strongly regulates local soil water balance, potentially exerting competitive pressure on coexisting species [51]. These results align with findings by [60], who reported that during periods of limited soil water, the greater competitive ability of Stipa tenacissima reduced the water status of Cistus clusii.
Despite being plants of same age growing under similar conditions, R. monosperma showed a higher water demand than T. carnosus in all combinations. as reflected in its significantly lower Ψm values. Retama plants in control treatments showed less water stress (-1 MPa) than field values (-1.2 MPa) in autumn [51]. However, under water restriction and interspecific competition, they exhibited higher stress than field plants in summer (-2 MPa), regardless of T. carnosus presence. This suggests that T. carnosus had little effect on R. monosperma in terms of underground competition and that Retama struggles to cope with drought when access to deep water sources is restricted. In field conditions, R. monosperma can access the water table year-round [51], explaining its ability to withstand seasonal droughts. While pot experiments do not fully replicate natural rooting conditions, they allow the isolation of soil water deficit effects from other environmental factors such as temperature, nutrients, or light. Additionally, our water restriction treatment was applied during the growing period rather than during the seasonal summer drought, as we aimed to assess the impact of projected precipitation declines. This may explain differences with field observations, where drought typically occurs after the growth period.
As species adapted to semiarid environments, the photosynthetic apparatus of T. carnosus and R. monosperma remained unaffected under water restriction conditions, even though drought was imposed during the active growth period rather than the typical summer dry season. The observed decrease in ΦPSII was fully reversible after a short period of darkness adaptation (as indicated by stable Fv/Fm values), indicating that the observed photoinhibition was a photoprotective mechanism rather than a sign of photoinhibitory damage [61]. The maintenance of constant Fv/Fm values above 0.75 in both species confirmed the absence of significant drought-induced damage to photosystem II [62]. This resilience aligns with previous studies on Mediterranean shrubs, such as Phillyrea angustifolia [63] and other labiates, like Rosmarinus officinalis or Lavandula stoechas [61]. These findings support observations from natural conditions in Mediterranean coastal dunes, where no decrease in maximum photochemical efficiency was recorded after the entire summer drought period [48].
However, interspecific competition (T-r, R-t) resulted in lower ΦPSII values than those observed in isolated or intraspecific competition treatments (T-T), under control and water restriction conditions at the end of the water limitation treatment. Similar declines in photochemical efficiency under interspecific competition have been reported in Mediterranean species [64], highlighting the impact of resource partitioning and competition for belowground water. Interestingly, T. carnosus plants under intraspecific interaction (T-T) appeared to have a facilitative effect, as indicated by higher ΦPSII values than isolated plants, a phenomenon previously observed in other Mediterranean shrubs where clustering can enhance microclimatic buffering [65,66,67]. The benefits of intraspecific interactions have also been reported to be larger in severe environments like water-limited ecosystems [68]. Overall, our results show that ΦPSII was more affected by competition than by water restriction, reinforcing the role of species interactions in shaping physiological responses under water-limited environments, as seen in various arid and semiarid ecosystems [60,69].
Our experiment was conducted with plants of the same age, simulating the scenario where two seedlings of both species grow close together. The greater growth of Retama (both in elongation and final biomass) resulted in asymmetric resource competition, disadvantaging Thymus from the first year due to Retama exploiting larger soil volumes, with an average root biomass eight times greater. Biomass allocation patterns provided further insights into the physiological responses of Thymus and Retama under different interaction scenarios. Among all recorded biomass variables, differences were only found in those related to root allocation.
In the case of the control treatment, Thymus plants in the T-r combination exhibited higher root allocation, both as BR/BA and BR/BT ratios, than those in the T-T combination. Thus, under interspecific competition, Thymus allocated more biomass to roots than plants from intraspecific interaction, likely as a response to competition with Retama. However, the highest root investment was observed in Retama, regardless of interaction type. Since the root system is positively associated with the belowground competitive ability [70], the observed higher root allocation could confer Retama a competitive advantage during drought periods.
Although all combinations increased root allocation in response to water restriction, this shift was only significant in Thymus under intraspecific interaction, suggesting an adjustment in water uptake strategies. A characteristic adaptation of Mediterranean perennial scrublands to drought is the increasing allocation of biomass to roots, reducing the evaporation surface relative to the absorptive area [71]. Adjusting the root-to-total biomass ratio is an effective mechanism for controlling water loss during drought [72,73], as higher BR/BT ratios reflect a strategy to maximize water uptake [9,74,75]. Likely due to this significant increase in root investment compared to the control treatment, the physiological status of Thymus under intraspecific competition was not as adversely affected by water restriction as it was under interspecific competition. This suggests that Thymus plants benefit from intraspecific interactions. Although intraspecific competition is generally expected to be stronger than interspecific competition [27,76,77], because individuals of the same species require similar environmental conditions, in our study, Thymus plants responded to drought differently depending on the type of interaction, exhibiting competitive responses under interspecific interactions but facilitative responses under intraspecific interactions. As stated by [39], interactions between species are highly variable and can be either positive or negative depending on environmental conditions.
The response in root allocation was even more pronounced in Retama, particularly in the R-t combination (BR/BT: 27.01% in drought vs. 21.86% in control), reinforcing its greater water demand than Thymus. These findings highlight the importance of belowground competition in shaping Thymus–Retama interactions and suggest that soil water dynamics may be a key factor in determining competitive outcomes in Mediterranean environments. Moreover, the combined effect of Retama’s competition and water limitation likely altered the response of Thymus in the T-r combination, as root competition can limit root biomass allocation [25], potentially leading to lower Ψm values and constrained root development.
Leaf biochemistry also provided further insights into the physiological responses of Thymus and Retama under different interaction scenarios. The more negative δ13C of the Retama-Thymus interaction plants under water restriction (Table 4) further supports this assumption. This stable isotope serves as an indicator of long-term water use efficiency, integrating plant responses throughout growth [78]. More negative δ13C values (depleted in 13C) typically reflect reduced stomatal control, as observed in the R-t combination. This pattern aligns with the lower Ψm values we found in plants under this interaction treatment and suggests a limited ability of Retama to regulate water loss under drought conditions. These findings reinforce the idea that Retama does not follow a highly conservative water-use strategy as indicated by its more negative δ¹³C values and lower Ψm. Instead, it appears to tolerate drought by relying on deep soil water access in natural conditions, rather than by tightly regulating stomatal conductance.
Although the final foliar N content was similar across all combinations, δ15N was lower in both T-r and R-t. plants. This decrease in δ15N may indicate N scarcity due to greater use during growth [79] or increased nitrogen use efficiency, potentially driven by changes in soil nitrogen dynamics or shifts in nitrogen uptake strategies. For instance, 15N-depleted nitrogen could be transferred from mycorrhizal fungi or N2-fixing bacteria to the plants [80,81]. The presence of Rhizobium nodules on the roots of some Retama plants (personal observation) supports the hypothesis that N2 fixed by bacteria was transferred to the plants. Despite fertilisation to prevent nodulation, an N deficit could have occurred due to the higher growth rate of Retama under interspecific competition. This may have led to an increase in BR/BT and BR/BA ratios in T-r control plants to enhance nutrient uptake, as the BR/BT ratio has been linked not only to water restriction but also to nutrient uptake efficiency [39,54,82].
4. Materials and Methods
4.1. Study Species
Thymus carnosus (Lamiaceae, hereafter Thymus) is an evergreen coastal shrub endemic to the southwestern Iberian Peninsula. It has been classified as critically endangered (CR) in Spain since [83] and is in decline in Portugal [84]. It is also listed as a species of community interest under the EU Habitats Directive [85]. Thymus can reach 45 cm in height, with small, linear, fleshy leaves and a deep root system exceeding 1 m, allowing access to groundwater [51]. It coexists with R. monosperma throughout most of its range, making the study of Retama’s shading effects crucial for its conservation.
Retama monosperma (L.) Boiss (Fabaceae, hereafter Retama) is a leafless woody shrub that can grow up to 4 m in height and 9 m in diameter. It is a nitrogen-fixing shrub native to the southwestern Iberian Peninsula and northwestern Morocco [86]. It thrives in sandy coastal soils, particularly on stabilized and semi-stabilized dunes and marsh borders [87]. Despite being a native species, Retama exhibits invasive behavior within its distribution range due to its high expansion rates and ability to modify environmental conditions [51,52,88].
4.2. Experimental Design
To assess the impact of drought on the interactions between Thymus carnosus and Retama monosperma, we conducted a water-restriction experiment in a greenhouse at the University of Seville.
Seeds of both selected species were collected from Flecha del Rompido (Huelva), a Mediterranean climate area with winter rainfall and summer drought. The mean annual temperature was 18.2 °C, and the mean annual precipitation was 583 mm. The seeds were planted in seedling cell trays with a commercial substrate composed of peat, perlite, lime (1:1:1), and nutrients. We used a total of 1048 Thymus seeds and 600 Retama seeds. Thymus seeds were planted without pre-treatment, while Retama seeds were subjected to a 30-second boiling water bath to break dormancy and stimulate germination [89,90]. Thymus seeds exhibited a 15.5% germination rate (63 out of 1048 seeds), while even with pre-treatment, only 8.3% of Retama seeds germinated (50 out of 600 seeds).
The pots were maintained in the greenhouse at the Universidad de Sevilla under controlled temperature, ranging from 21-25 ºC, and relative humidity of 40-60%. The plants received natural ambient light supplemented with halogen lamps from 8:00 to 16:00 hours daily using Philips SON-T Agro 400W lamps.
To avoid Rhizobium nodule formation on Retama plants, a liquid commercial fertilizer (including N, P, K, Mg, Fe, Ca, S, Mn, and Zn) was added quarterly with watering, as nodule formation and maintenance are energetically expensive, and plants with access to combined nitrogen may not invest in nodules [91]. This ensured that pots with Retama did not receive an extra nitrogen supply, preventing any unbalanced results among the study pots.
4.3. Plant Transplanting
Five months after germination, the seedlings were transplanted into 2.2 L pots filled with the same substrate described above (peat, perlite, lime, and nutrients, 1:1:1). Mean plant size in height at transplant was 5 cm for Thymus plants and 12 cm for Retama. To determine the competition's effect, interspecific and intraspecific interactions were established with two individuals per pot and compared with a control treatment consisting of one isolated individual per pot.
The species combinations in the pots were as follows (Figure 7):
- Control: 36 pots with one Thymus plant (T) and 15 pots with one Retama plant (R);
- Intraspecific competition: 36 pots with two Thymus plants (T-T),
- Interspecific competition 36 pots with one Thymus and one Retama plant, (T-r or R-t).
The first letter of the interaction indicates the species whose measurements were recorded (T-r refers to measurements made on Thymus and R-t refers to measurements made on Retama, corresponding to a single shared pot).
In summary, a total of 123 pots were used in the experiment with 36 pots for each combination, except for the R combination which had 15 replicates due to the low number of Retama seedlings obtained. After seven months of growth under these combination conditions, the one-year-old plants were subjected to a five-week water restriction experiment. After this period, the plants were rehydrated.
Throughout the experiment, the greenhouse conditions maintained an average temperature of 22ºC and a relative humidity of 70%, replicating the typical conditions experienced in May and November, based on the 30-year average climatological data for Huelva from AEMET for the period of 1971-2000. The aim was to simulate a water deficit scenario outside the summer season, avoiding exposure to high temperatures.
4.4. Morphological Measurements
To assess changes in species growth due to interactions, the length and branching of the seedlings were measured after transplanting and before the water restriction treatment for four months. The length of each branch was measured from base to tip, and the total branch length per plant was calculated as the sum of all individual branch lengths. Additionally, the number of branches per plant was recorded.
Measurements were taken from the plants in each plot at 14-15-day intervals at the beginning of the transplant and monthly from the second month onwards. The relative elongation rate (RER) and the increase in stem branching (ΔB) were calculated as:
RER = (Lt-Lt-1)/Δt (1).
ΔB = Bt – Bt-1 (2)
where Lt represents the sum of the lengths of all branches of a plant, t and t-1 refer to two consecutive measurement dates, Δt represents the number of days between these two dates, and B is the total number of branches per plant.
4.5. Water Restriction Experiment
The experiment was conducted in spring (April-May) to simulate drought conditions outside the typical summer dry period. The plants used in this phase were one-year-old, having grown for five months before transplanting and then seven months under different interaction scenarios. During this first year, all pots were watered to field capacity (FC) to ensure optimal growth.
For the water restriction experiment, two levels of watering regimes for each combination were applied: 1) drought plants (D), were watered twice a week with 25 ml each time (50 ml weekly); and 2) control plants (C), were watered twice a week with 100 ml each time (200 ml weekly) the first two weeks and up to FC for the rest of the experiment. After 35 days of water restriction treatment, when water potential values lower than those obtained under natural conditions were recorded [51], the plants were watered back to FC and the recovery of leaf water potential values was assessed (see methods below).
Soil water content was monitored gravimetrically throughout the experiment by weighing the pots, considering the initial maximum FC recorded previously in the water treatment. This allowed us to adjust irrigation in control plants to ensure they were sufficiently irrigated. Accordingly, control plants were subjected to additional irrigation to reach FC after the second week. Since the drought experiment aimed to observe the plants' physiological response rather than inducing mortality, we watered drought pots twice a week to keep the plants alive during the experiment, instead of eliminating watering.
Between fourteen and sixteen pots per combination and irrigation treatment were used, with 7-8 plants measured on alternate weeks to avoid consecutive measurements on the same plant. All pots were alternately distributed and rotated every week to prevent a possible greenhouse environmental effect due to differences in incident radiation or shading by neighbouring plants.
4.6. Physiological Measurements
One week before the application of the water restriction treatment, and weekly thereafter for five weeks, midday shoot water potential (Ψm, MPa), effective quantum yield (ΦPSII), and maximum quantum yield (Fv/Fm) were measured. To assess plant recovery, Ψm was measured again one week after the end of the water restriction experiment.
Chlorophyll fluorescence was measured using a portable fluorometer (mini-PAM, Walz, Effeltrich, Germany) with a pulse amplitude modulation technique. The fluorescence was excited by a pulse of modulated red light from an LED (type H-3000 Stanley) connected to a fibre optic. The maximum photochemical efficiency of PSII (Fv/Fm) was determined as (Fm−Fo)/Fm, where Fo and Fm represent basal and maximal fluorescence of dark-adapted leaves over 20 minutes. Effective photochemical efficiency (ΦPSII) was estimated in leaves exposed to natural light conditions using ΦPSII = (F'm− F)/F'm, with F'm being maximal and F being steady-state fluorescence under actinic irradiance [62]. Measurements were conducted from 10:00 to 12:00 h solar time on three leaves per plant, with mean values per plant used for statistical analysis.
Midday shoot water potential (Ψm) was measured using a pressure chamber (Manofrigido, Lisbon, Portugal) on terminal shoots that were excised and measured immediately. Measures were taken between 12:30 and 14:00 (solar time), to record the maximum water deficit of the day when the minimum values are reached.
4.7. Biomass Measurement
At the end of the water restriction and recovery treatment, the plants were harvested, separated into stems, leaves, and roots, and dried in a forced-air oven at 60°C for 48 h. The final biomass of leaves, stems, and roots was determined by weighing. From the dried biomasses, the following parameters were calculated: leaf biomass allocation (BL/BT; leaf biomass/total biomass), stem biomass allocation (BS/BT; stem biomass/total biomass), and root biomass allocation (BR/BT; root biomass/total biomass). The root biomass to aboveground biomass ratio (BR/BA) was also calculated as an indicator of the allocation pattern [92,93].
4.8. Leaf and Cladodes Isotopic Analysis and N and C Content
Five to seven leaf samples (cladodes in the case of Retama) from each treatment and combination (except R treatment) were collected at the end of the drought treatment to determine the carbon content (%C), nitrogen content(%N), C/N ratio, and the isotopes δ13C and δ15N. Although commercial fertiliser was used to avoid the influence of N2 fixation by Retama, its final N foliar content was analysed to confirm the absence of any significant contribution, as root nodule formation had been detected in some plants at the end of the experiment.
The cladodes and leaves collected were dried at 60ºC for 72 h and ground using a ball mill (Retsch, Haan, Germany). The samples were then combusted using an elemental analyser (Carlo Erba EA, Milan, Italy) interfaced with a continuous flow stable isotope ratio mass spectrometer (SIRA II, VG-Isotech, Middlewich, UK). Samples were standardised to IAEA.N2, IAEACH-4 and IAEA-CH-6 (International Atomic Energy Agency). The isotope ratios of C and N were expressed relative to VPD (vapour pressure deficit) for δ13C and to atmospheric N2 for δ15N. The analytical error estimated was 0.05‰ for C and 0.2‰ for N. The isotope measurements were presented in notation δ as:
δ (‰) = 1000*(Rsample –Rstandard)/ Rstandard
where R is the isotope ratio (13C/12C and 15N/14N) of the foliage samples and the standards respectively.
The N and C content of the collected leaves was also determined from the combusted samples in the elemental analyser (Carlo Erba EA, Milan, Italy) coupled to the isotope ratio mass spectrometer.
4.8. Statistical Analysis
The effect of plant interaction (combinations) on relative elongation rate (RER) was assessed through repeated measures ANOVA with time as the within-subject factor and combinations as the between-subject factor. A one-way ANOVA was performed to evaluate differences between combinations at each measurement date. Branching increment (ΔR) was analysed using the non-parametric Kruskal-Wallis and Mann-Whitney U tests. Additionally, a Pearson correlation analysis was used to explore the relationship between elongation and branch number.
Differences in pot weights during the water restriction treatment were analysed using repeated measures ANOVA for control and drought individuals, with time as the within-subject factor and combinations as the between-subject factor, to assess differences in soil moisture between combinations over the five weeks.
The effects of plant interactions and water restriction on shoot water potential, as well as effective and maximum fluorescence were analysed using a three-way ANOVA, with combination, watering, and time as fixed factors. Differences between drought and control plants across combinations were tested using a one-way ANOVA. Additionally, a two-way ANOVA was performed separately for drought and control treatments to assess its effect on biomass variables and C and N content, C/N ratio, δ13C, and δ15N, with combination and watering as fixed factors. Notably, repeated measures ANOVA was not applied to physiological variables as different plants were measured on alternating weeks. Post-hoc comparisons were conducted using Tukey’s test.
All data were tested for normality using the non-parametric Kolmogorov-Smirnov test. The statistical analyses were performed with SPSS v. 29.0.1 (IBM SPSS Statistic Inc., Chicago, IL).
5. Conclusions
By experimentally restringing water, we showed that soil water availability drives both intraspecific and interspecific interactions between two shrub species. As reported in previous studies, intraspecific competition in Thymus-Retama interactions was less intense than interspecific competition. Overall, our results underscore the role of belowground competition in shaping Thymus–Retama interactions and highlight how soil water dynamics influence competitive outcomes in Mediterranean environments. Given the projected increase in drought frequency and severity due to climate change, particularly outside the summer period, our findings suggest that interactions with Retama seedlings may hinder the recruitment of T. carnosus. In contrast, well stablished Thymus populations could facilitate seedling establishment by acting as nurse plants under favourable conditions. These results highlight how drought can alter the balance between competition and facilitation with important implications for the conservation of endangered Mediterranean endemic shrubs. By identifying specific biotic interactions that may either constrain or support population persistence, this study contributes to a better understanding of vegetation responses to future climatic scenarios.
Author Contributions
Conceptualization, MZ. MCDB and MPE.; methodology, MZ, and MPE; formal analysis, MZ and MPE.; investigation, MPE.; resources, MZ, and MCDB.; data curation, MPE and MZ.; writing—original draft preparation, MZ, MPE, JBGFand LAC; writing—review and editing, LAC, MZ, JBGF and MCDB; visualization, LAC, MZ.; funding acquisition, MCDB and MZ. All authors have read and agreed to the published version of the manuscript.
Funding
This research was funded by the Spanish Ministerio de Educación y Ciencia (project reference: CGL2005-02142).
Data Availability Statement
Data available under request.
Acknowledgments
We thank Celia Rodríguez and Alba Cuecas for their invaluable assistance during the long hours in the greenhouse work. We are also grateful to Jose María and Jesús managers of the greenhouse facility at the Universidad de Sevilla, for their constant support and practical solutions to any logistical challenges.
Conflicts of Interest
The authors declare no conflicts of interest. The funders had no role in the design of the study; in the collection, analyses, or interpretation of data; in the writing of the manuscript; or in the decision to publish the results.
Abbreviations
The following abbreviations are used in this manuscript:
| RER | Relative elongation rate; |
| ΔR | Branching increment; |
| Ψm | Shoot water potential |
| ΦPSII | Effective photochemical efficiency; |
| Fv/Fm | Maximum photochemical efficiency; |
| BL/BT | Leaf mass allocation |
| BS/BT | Stem mass allocation |
| BR/BT | Root mass allocation |
| BR/BA | Root biomass to aboveground biomass ratio; |
| δ13C | Carbon isotope signature (¹³C/¹²C) |
| δ15N | Nitrogen isotope signature (¹⁵N/¹⁴N) |
Appendix A
Figure A1.
Evolution of water loss during the water restriction treatment, expressed as the percentage decrease in pot weight relative to the initial weight on day 0 (pre-treatment) and relative to field capacity (FC), reflecting cumulative loss through evapotranspiration during drought treatment (day 0 = pre-treatment) (mean ± SE). Significant differences between combinations over the entire treatment period are indicated next to the legend with different letters (lowercase for drought pots, uppercase for control pots; ANOVAR, P<0.05).
References
- Kaisermann, A.; de Vries, F.T.; Griffiths, R.I.; Bardgett, R.D. Legacy Effects of Drought on Plant–Soil Feedbacks and Plant–Plant Interactions. New Phytologist 2017, 215, 1413–1424. [Google Scholar] [CrossRef] [PubMed]
- van der Putten, W.H.; Bardgett, R.D.; Bever, J.D.; Bezemer, T.M.; Casper, B.B.; Fukami, T.; Kardol, P.; Klironomos, J.N.; Kulmatiski, A.; Schweitzer, J.A.; et al. Plant–Soil Feedbacks: The Past, the Present and Future Challenges. Journal of Ecology 2013, 101, 265–276. [Google Scholar] [CrossRef]
- Brooker, R.W. Plant–Plant Interactions and Environmental Change. New Phytologist 2006, 171, 271–284. [Google Scholar] [CrossRef]
- Hammond, W.M.; Williams, A.P.; Abatzoglou, J.T.; Adams, H.D.; Klein, T.; López, R.; Sáenz-Romero, C.; Hartmann, H.; Breshears, D.D.; Allen, C.D. Global Field Observations of Tree Die-off Reveal Hotter-Drought Fingerprint for Earth’s Forests. Nat Commun 2022, 13, 1761. [Google Scholar] [CrossRef]
- Lloret, F.; Jaime, L.A.; Margalef-Marrase, J.; Pérez-Navarro, M.A.; Batllori, E. Short-Term Forest Resilience after Drought-Induced Die-off in Southwestern European Forests. Science of The Total Environment 2022, 806, 150940. [Google Scholar] [CrossRef] [PubMed]
- Kardol, P.; Campany, C.E.; Souza, L.; Norby, R.J.; Weltzin, J.F.; Classen, A.T. Climate Change Effects on Plant Biomass Alter Dominance Patterns and Community Evenness in an Experimental Old-Field Ecosystem. Global Change Biology 2010, 16, 2676–2687. [Google Scholar] [CrossRef]
- Ploughe, L.W.; Jacobs, E.M.; Frank, G.S.; Greenler, S.M.; Smith, M.D.; Dukes, J.S. Community Response to Extreme Drought (CRED): A Framework for Drought-Induced Shifts in Plant–Plant Interactions. New Phytologist 2019, 222, 52–69. [Google Scholar] [CrossRef]
- Evenari, M.; Noy-Meir, I.; Goodall, D.W. Hot Deserts and Arid Shrublands; Elsevier, 1985; ISBN 978-0-444-42296-5.
- Padilla, F.M.; Miranda, J.D.; Jorquera, M.J.; Pugnaire, F.I. Variability in Amount and Frequency of Water Supply Affects Roots but Not Growth of Arid Shrubs. Plant Ecol 2009, 204, 261–270. [Google Scholar] [CrossRef]
- Stuart-Haëntjens, E.; De Boeck, H.J.; Lemoine, N.P.; Mänd, P.; Kröel-Dulay, G.; Schmidt, I.K.; Jentsch, A.; Stampfli, A.; Anderegg, W.R.L.; Bahn, M.; et al. Mean Annual Precipitation Predicts Primary Production Resistance and Resilience to Extreme Drought. Science of The Total Environment 2018, 636, 360–366. [Google Scholar] [CrossRef]
- Joffre, R.; Rambal, S.; Ratte, J.P. The Dehesa System of Southern Spain and Portugal as a Natural Ecosystem Mimic. Agroforestry Systems 1999, 45, 57–79. [Google Scholar] [CrossRef]
- Seifan, M.; Tielbörger, K.; Kadmon, R. Direct and Indirect Interactions among Plants Explain Counterintuitive Positive Drought Effects on an Eastern Mediterranean Shrub Species. Oikos 2010, 119, 1601–1609. [Google Scholar] [CrossRef]
- Van der Maarel, E. Dry Coastal Ecosystems: Polar Regions and Europe; Ecosystems of the world, 2A; London: Amsterdam. 1993; ISBN 978-0-444-87348-4. [Google Scholar]
- IPCC Climate Change 2023 Synthesis Report. In Climate Change 2023: Synthesis Report. Contribution of Working Groups I, II and III to the Sixth Assessment Report of the Intergovernmental Panel on Climate Change; IPCC: Geneva, Switzerland, 2023; pp. 35–115 ISBN. [CrossRef]
- Maestre, F.; Eldridge, D.; Soliveres, S.; Kéfi, S.; Delgado-Baquerizo, M.; Bowker, M.; García-Palacios, P.; Gaitan, J.; Gallardo, A.; Lazaro, R.; et al. Structure and Functioning of Dryland Ecosystems in a Changing World. Annual Review of Ecology, Evolution, and Systematics 2016, 47. [Google Scholar] [CrossRef]
- Chazarra Bernabé, A.; Lorenzo Mariño, B.; Romero Fresneda, R.; Moreno García, J.V. Evolución de los climas de Köppen en España en el periodo 1951-2020; Agencia Estatal de Meteorología, 2022.
- Lavorel, S.; Canadell, J.; Rambal, S.; Terradas, J. Mediterranean Terrestrial Ecosystems: Research Priorities on Global Change Effects. Global Ecology & Biogeography Letters 1998, 7, 157–166. [Google Scholar] [CrossRef]
- Domènech, R.; Vilà, M. Response of the Invader Cortaderia Selloana and Two Coexisting Natives to Competition and Water Stress. Biol Invasions 2008, 10, 903–912. [Google Scholar] [CrossRef]
- Grime, J.P.; Hillier, S.H. The Contribution of Seedling Regeneration to the Structure and Dynamics of Plant Communities, Ecosystems and Larger Units of the Landscape. Seeds: the ecology of regeneration in plant communities 2000, 361–374. [Google Scholar] [CrossRef]
- Harper, J.L. Population Biology of Plants; Academic Press, 1977; ISBN 978-0-12-325850-2.
- Evans, C.E.; Etherington, J.R. The Effect of Soil Water Potential on Seedling Growth of Some British Plants. New Phytologist 1991, 118, 571–579. [Google Scholar] [CrossRef]
- Niering, W.A.; Whittaker, R.H.; Lowe, C.H. The Saguaro: A Population in Relation to Environment. Science 1963, 142, 15–23. [Google Scholar] [CrossRef]
- Mingo, A. Size-Uneven Competition and Resource Availability: A Factorial Experiment on Seedling Establishment of Three Mediterranean Species. Plant Biosystems - An International Journal Dealing with all Aspects of Plant Biology 2009, 143, 181–189. [Google Scholar] [CrossRef]
- Callaway, R.; Pugnaire, F. Facilitation in Plant Communities. Functional Plant Ecology 1999, 623–648. [Google Scholar]
- Pugnaire, F.I.; Luque, M.T. Changes in Plant Interactions along a Gradient of Environmental Stress. Oikos 2001, 93, 42–49. [Google Scholar] [CrossRef]
- Brouwer, R. Nutritive Influences on the Distribution of Dry Matter in the Plant. NJAS 1962, 10, 399–408. [Google Scholar] [CrossRef]
- Peperkorn, R.; Werner, C.; Beyschlag, W. Phenotypic Plasticity of an Invasive Acacia versus Two Native Mediterranean Species. Funct Plant Biol 2005, 32, 933–944. [Google Scholar] [CrossRef]
- Arndt, S.K.; Wanek, W. Use of Decreasing Foliar Carbon Isotope Discrimination during Water Limitation as a Carbon Tracer to Study Whole Plant Carbon Allocation. Plant, Cell & Environment 2002, 25, 609–616. [Google Scholar] [CrossRef]
- Poorter, H.; Nagel, O.W. The Role of Biomass Allocation in the Growth Response of Plants to Different Levels of Light, CO2, Nutrients and Water: A Quantitative Review. Functional Plant Biology 2000, 27. [Google Scholar] [CrossRef]
- Smith, T.; Huston, M. A Theory of the Spatial and Temporal Dynamics of Plant Communities. Vegetatio 1989, 83, 49–69. [Google Scholar] [CrossRef]
- Brisson, J.; Reynolds, J.F. Effects of Compensatory Growth on Population Processes: A Simulation Study. Ecology 1997, 78, 2378–2384. [Google Scholar] [CrossRef]
- Casper, B.B.; Jackson, R.B. Plant Competition Underground. Annual Review of Ecology, Evolution, and Systematics 1997, 28, 545–570. [Google Scholar] [CrossRef]
- Campbell, B.D.; Grime, J.P. A New Method of Exposing Developing Root Systems to Controlled Patchiness in Mineral Nutrient Supply. Annals of Botany 1989, 63, 395–400. [Google Scholar] [CrossRef]
- de Kroons, H.; Hutchings, M.J. Morphological Plasticity in Clonal Plants: The Foraging Concept Reconsidered. Journal of Ecology 1995, 83, 143–152. [Google Scholar] [CrossRef]
- Gersani, M.; Abramsky, Z.; Falik, O. Density-Dependent Habitat Selection in Plants. Evolutionary Ecology 1998, 12, 223–234. [Google Scholar] [CrossRef]
- Mahall, B.E.; Callaway, R.M. Root Communication among Desert Shrubs. Proceedings of the National Academy of Sciences 1991, 88, 874–876. [Google Scholar] [CrossRef] [PubMed]
- Schenk, H.J. Root Competition: Beyond Resource Depletion. Journal of Ecology 2006, 94, 725–739. [Google Scholar] [CrossRef]
- Gersani, M.; Brown, J. s.; O’Brien, E.E.; Maina, G.M.; Abramsky, Z. Tragedy of the Commons as a Result of Root Competition. Journal of Ecology 2001, 89, 660–669. [Google Scholar] [CrossRef]
- Armas, C.; Pugnaire, F.I. Belowground Zone of Influence in a Tussock Grass Species. Acta Oecologica 2011, 37, 284–289. [Google Scholar] [CrossRef]
- Bais, H.P.; Vepachedu, R.; Gilroy, S.; Callaway, R.M.; Vivanco, J.M. Allelopathy and Exotic Plant Invasion: From Molecules and Genes to Species Interactions. Science 2003, 301, 1377–1380. [Google Scholar] [CrossRef]
- Bertin, C.; Weston, L.A.; Huang, T.; Jander, G.; Owens, T.; Meinwald, J.; Schroeder, F.C. Grass Roots Chemistry: Meta-Tyrosine, an Herbicidal Nonprotein Amino Acid. Proceedings of the National Academy of Sciences 2007, 104, 16964–16969. [Google Scholar] [CrossRef]
- Beyer, F.; Hertel, D.; Jung, K.; Fender, A.-C.; Leuschner, C. Competition Effects on Fine Root Survival of Fagus Sylvatica and Fraxinus Excelsior. Forest Ecology and Management 2013, 302, 14–22. [Google Scholar] [CrossRef]
- Caldwell, M.M.; Manwaring, J.H.; Durham, S.L. Species Interactions at the Level of Fine Roots in the Field: Influence of Soil Nutrient Heterogeneity and Plant Size. Oecologia 1996, 106, 440–447. [Google Scholar] [CrossRef]
- Villar-Salvador, P.; Cuesta, B. Retama Monosperma (L.) Boiss. y Retama Sphaerocarpa (L.) Boiss. In; 2013; pp. 342–353 ISBN 978-84-8014-846-7.
- Kith y Tasara, M. El problema de las dunas del SO de España. Montes 1946, 11, 414–419. [Google Scholar]
- Möllerová, J. Notes on Invasive and Expansive Trees and Shrubs. J. For. Sci. 2005, 51, 19–23. [Google Scholar] [CrossRef]
- Hejda, M.; Sádlo, J.; Kutlvašr, J.; Petřík, P.; Vítková, M.; Vojík, M.; Pyšek, P.; Pergl, J. Impact of Invasive and Native Dominants on Species Richness and Diversity of Plant Communities. Preslia 2021, 93, 181–201. [Google Scholar] [CrossRef]
- Esquivias, M.P.; Zunzunegui, M.; Díaz Barradas, M.C.; Álvarez-Cansino, L. Competitive Effect of a Native-Invasive Species on a Threatened Shrub in a Mediterranean Dune System. Oecologia 2015, 177, 133–146. [Google Scholar] [CrossRef]
- Muñoz Vallés, S.; B. Gallego Fernández, J.; Dellafiore, C.; Cambrollé, J. Effects on Soil, Microclimate and Vegetation of the Native-Invasive Retama Monosperma (L.) in Coastal Dunes. Plant Ecol 2011, 212, 169–179. [CrossRef]
- García-de-Lomas, J.; Fernández, L.; Martín, I.; Saavedra, C.; Rodríguez-Hiraldo, C.; Gallego-Fernández, J.B. Management of Coastal Dunes Affected by Shrub Encroachment: Are Rabbits an Ally or an Enemy of Restoration? J Coast Conserv 2023, 27, 8. [Google Scholar] [CrossRef]
- Esquivias, M.P.; Zunzunegui, M.; Barradas, M.C.D.; Álvarez-Cansino, L. The Role of Water Use and Uptake on Two Mediterranean Shrubs’ Interaction in a Brackish Coastal Dune Ecosystem. Ecohydrology 2014, 7, 783–793. [Google Scholar] [CrossRef]
- Zunzunegui, M.; Esquivias, M.; Oppo; Gallego-Fernández, J. Interspecific Competition and Livestock Disturbance Control the Spatial Patterns of Two Coastal Dune Shrubs. Plant and Soil 2012, 354, 299–309. [CrossRef]
- Naumann, G.; Alfieri, L.; Wyser, K.; Mentaschi, L.; Betts, R.A.; Carrao, H.; Spinoni, J.; Vogt, J.; Feyen, L. Global Changes in Drought Conditions Under Different Levels of Warming. Geophysical Research Letters 2018, 45, 3285–3296. [Google Scholar] [CrossRef]
- Lambers, H.; Poorter, H. Inherent Variation in Growth Rate Between Higher Plants: A Search for Physiological Causes and Ecological Consequences. In Advances in Ecological Research; Begon, M., Fitter, A.H., Eds.; Academic Press, 1992; Vol. 23, pp. 187–261.
- Rascher, K.G.; Hellmann, C.; Máguas, C.; Werner, C. Community Scale 15N Isoscapes: Tracing the Spatial Impact of an Exotic N2-Fixing Invader. Ecology Letters 2012, 15, 484–491. [Google Scholar] [CrossRef]
- Fogarty, G.; Facelli, J.M. Growth and Competition of Cytisus Scoparius, an Invasive Shrub, and Australian Native Shrubs. Plant Ecology 1999, 144, 27–35. [Google Scholar] [CrossRef]
- Fajardo, A.; McIntire, E.J.B. Under Strong Niche Overlap Conspecifics Do Not Compete but Help Each Other to Survive: Facilitation at the Intraspecific Level. Journal of Ecology 2011, 99, 642–650. [Google Scholar] [CrossRef]
- Martinez-Oró, D.; Parraga-Aguado, I.; Querejeta, J.I.; Conesa, H.M. Importance of Intra- and Interspecific Plant Interactions for the Phytomanagement of Semiarid Mine Tailings Using the Tree Species Pinus Halepensis. Chemosphere 2017, 186, 405–413. [Google Scholar] [CrossRef]
- Noto, A.E.; Hughes, A.R. Genotypic Diversity Weakens Competition within, but Not between, Plant Species. Journal of Ecology 2020, 108, 2212–2220. [Google Scholar] [CrossRef]
- Armas, C.; Pugnaire, F.I. Plant Interactions Govern Population Dynamics in a Semi-arid Plant Community. Journal of Ecology 2005, 93, 978–989. [Google Scholar] [CrossRef]
- Munné-Bosch, S.; Alegre, L. The Xanthophyll Cycle Is Induced by Light Irrespective of Water Status in Field-Grown Lavender (Lavandula Stoechas) Plants. Physiologia Plantarum 2000, 108, 147–151. [Google Scholar] [CrossRef]
- Genty, B.; Briantais, J.-M.; Silva, J.B.V.D. Effects of Drought on Primary Photosynthetic Processes of Cotton Leaves. Plant Physiology 1987, 83, 360–364. [Google Scholar] [CrossRef]
- Peñuelas, J.; Munné-Bosch, S.; Llusià, J.; Filella, I. Leaf Reflectance and Photo- and Antioxidant Protection in Field-Grown Summer-Stressed Phillyrea Angustifolia. Optical Signals of Oxidative Stress? New Phytologist 2004, 162, 115–124. [Google Scholar] [CrossRef]
- Valladares, F.; Sánchez-Gómez, D. Ecophysiological Traits Associated with Drought in Mediterranean Tree Seedlings: Individual Responses versus Interspecific Trends in Eleven Species. Plant Biology 2006, 8, 688–697. [Google Scholar] [CrossRef] [PubMed]
- Callaway, R.M.; Walker, L.R. Competition and Facilitation: A Synthetic Approach to Interactions in Plant Communities. Ecology 1997, 78, 1958–1965. [Google Scholar] [CrossRef]
- Maestre, F.T.; Callaway, R.M.; Valladares, F.; Lortie, C.J. Refining the Stress-gradient Hypothesis for Competition and Facilitation in Plant Communities. Journal of Ecology 2009, 97, 199–205. [Google Scholar] [CrossRef]
- Gimeno, T.E.; Escudero, A.; Valladares, F. Different Intra- and Interspecific Facilitation Mechanisms between Two Mediterranean Trees under a Climate Change Scenario. Oecologia 2015, 177, 159–169. [Google Scholar] [CrossRef] [PubMed]
- Gómez-Aparicio, L. The Role of Plant Interactions in the Restoration of Degraded Ecosystems: A Meta-Analysis across Life-Forms and Ecosystems. Journal of Ecology 2009, 97, 1202–1214. [Google Scholar] [CrossRef]
- Holmgren, M.; Gómez-Aparicio, L.; Quero, J.L.; Valladares, F. Non-Linear Effects of Drought under Shade: Reconciling Physiological and Ecological Models in Plant Communities. Oecologia 2012, 169, 293–305. [Google Scholar] [CrossRef]
- Rajaniemi, T.K. Why Does Fertilization Reduce Plant Species Diversity? Testing Three Competition-Based Hypotheses. Journal of Ecology 2002, 90, 316–324. [Google Scholar] [CrossRef]
- Sardans, J.; Peñuelas, J. Plant-Soil Interactions in Mediterranean Forest and Shrublands: Impacts of Climatic Change. Plant Soil 2013, 365, 1–33. [Google Scholar] [CrossRef]
- Correia, O.; Martins, A.; Catarino, F. Comparative Phenology and Seasonal Foliar Nitrogen Variation in Mediterranean Species of Portugal. Ecologia Mediterranean 1992, 18, 7–18. [Google Scholar] [CrossRef]
- Werner, C.; Correia, O.; Beyschlag, W. Two Different Strategies of Mediterranean Macchia Plants to Avoid Photoinhibitory Damage by Excessive Radiation Levels during Summer Drought. Acta Oecologica 1999, 20, 15–23. [Google Scholar] [CrossRef]
- Fernández, R.J.; Reynolds, J.F. Potential Growth and Drought Tolerance of Eight Desert Grasses: Lack of a Trade-Off? Oecologia 2000, 123, 90–98. [Google Scholar] [CrossRef]
- Reich, P.B.; Tjoelker, M.G.; Walters, M.B.; Vanderklein, D.W.; Buschena, C. Close Association of RGR, Leaf and Root Morphology, Seed Mass and Shade Tolerance in Seedlings of Nine Boreal Tree Species Grown in High and Low Light. Functional Ecology 1998, 12, 327–338. [Google Scholar] [CrossRef]
- Hodge, A.; Stewart, J.; Robinson, D.; Griffiths, B.S.; Fitter, A.H. Spatial and Physical Heterogeneity of N Supply from Soil Does Not Influence N Capture by Two Grass Species. Functional Ecology 2000, 14, 645–653. [Google Scholar] [CrossRef]
- Olson, B.E.; Blicker, P.S. Response of the Invasive Centaurea Maculosa and Two Native Grasses to N-Pulses. Plant and Soil 2003, 254, 457–467. [Google Scholar] [CrossRef]
- Dawson, T.E.; Mambelli, S.; Plamboeck, A.H.; Templer, P.H.; Tu, K.P. Stable Isotopes in Plant Ecology. Annual Review of Ecology and Systematics 2002, 33, 507–559. [Google Scholar] [CrossRef]
- Högberg, P. Tansley Review No. 95 15 N Natural Abundance in Soil-Plant Systems. New Phytol 1997, 137, 179–203. [Google Scholar] [CrossRef]
- Evans, R.D. Physiological Mechanisms Influencing Plant Nitrogen Isotope Composition. Trends in Plant Science 2001, 6, 121–126. [Google Scholar] [CrossRef] [PubMed]
- Hobbie, E.A.; Högberg, P. Nitrogen Isotopes Link Mycorrhizal Fungi and Plants to Nitrogen Dynamics. New Phytologist 2012, 196, 367–382. [Google Scholar] [CrossRef] [PubMed]
- Cornelissen, J.; Lavorel, S.; Garnier, E.; Diaz, S.; Buchmann, N.; Gurvich, D.; Reich, P.; ter Steege, H.; Morgan, H.D.G.; Van der Heijden, M.; et al. Handbook of Protocols for Standardised and Easy Measurement of Plant Functional Traits Worldwide. Australian Journal of Botany, v.51, 335-380 (2003) 2003, 51. [Google Scholar] [CrossRef]
- Cabezudo, B.; Talavera, S.; Blanca, G.; Cueto, M.; Valdés, B.; Hernández Bermejo, J.; Herrera, C.; Rodríguez Hiraldo, C.; Navas, D. Lista roja de la flora vascular de Andalucía; Consejería de Medio Ambiente: Sevilla, 2005; p. 126 p.; ISBN 978-84-96329-62-1.
- Carapeto, A.; Francisco, A.; Pereira, P.; Porto, M. Lista Vermelha da Flora Vascular de Portugal Continental.; Botânica em Português; Sociedade Portuguesa de Botânica, Associação Portuguesa de Ciência da Vegetação – PHYTOS e Instituto da Conservação da Natureza e das Florestas.; Imprensa Nacional-Casa da Moeda: Lisboa, 2000; Vol. 7; ISBN 978-972-27-2876.
- Directiva 97/62/CE Directiva 97/62/CE del Consejo de 27 de octubre de 1997 por la que se adapta al progreso científico y técnico la Directiva 92/43/CEE, relativa a la conservación de los hábitats naturales y de fauna y flora silvestres; 1997; Vol. 305.
- Talavera, S.; Castroviejo, S. Flora Iberica: plantas vasculares de la Penínsular Ibérica e Islas Baleares : Vol. VII (I) Leguminosae (partim); Editorial CSIC - CSIC Press, 1999; ISBN 978-84-00-07821-8.
- Gallego-Fernández, J.B.; Muñoz-Valles, S.; Dellafiore, C.M. Spatio-Temporal Patterns of Colonization and Expansion of Retama Monosperma on Developing Coastal Dunes. J Coast Conserv 2015, 19, 577–587. [Google Scholar] [CrossRef]
- Muñoz-Vallés, S.; Gallego-Fernández, J.B.; Cambrollé, J. The Role of the Expansion of Native-Invasive Plant Species in Coastal Dunes: The Case of Retama Monosperma in SW Spain. Acta Oecologica 2014, 54, 82–89. [Google Scholar] [CrossRef]
- Pérez-Fernández, M.; Gómez Gutiérrez, J.M.; Pérez-Fernández, M.; Gómez Gutiérrez, J.M. Importancia e interpretación de la latencia y germinación de semillas en ambientes naturales. In Proceedings of the Restauración de ecosistemas mediterráneos; Universidad de Alcalá, 2003; pp. 87–112.
- Pérez-Fernández, M.; Gómez-Gutiérrez, J.M. Importancia e Interpretación de La Latencia y Germinación de Semillas En Ambientes Naturales. In; 2003; pp. 87–112 ISBN 978-84-8138-549-6.
- Streeter, J.; Wong, P.P. Inhibition of Legume Nodule Formation and N2 Fixation by Nitrate. Critical Reviews in Plant Sciences 1988, 7, 1–23. [Google Scholar] [CrossRef]
- Gower, S.T.; Vogt, K.A.; Grier, C.C. Carbon Dynamics of Rocky Mountain Douglas-Fir: Influence of Water and Nutrient Availability. Ecological Monographs 1992, 62, 43–65. [Google Scholar] [CrossRef]
- Perkins, S.R.; Keith Owens, M. Growth and Biomass Allocation of Shrub and Grass Seedlings in Response to Predicted Changes in Precipitation Seasonality. Plant Ecology 2003, 168, 107–120. [Google Scholar] [CrossRef]
Figure 1.
Relative elongation rate (RER) between successive measurement dates (a) and total elongation (b) considering in both cases the sum of the elongation of all the branches of a plant over the entire study period (mean + SE). Significant differences between species combinations are indicated by letters above the columns (lowercase for Thymus and uppercase for Retama; one-way ANOVA, Tukey's post-hoc for Thymus; P<0.05). No letters indicate absence of significant differences.
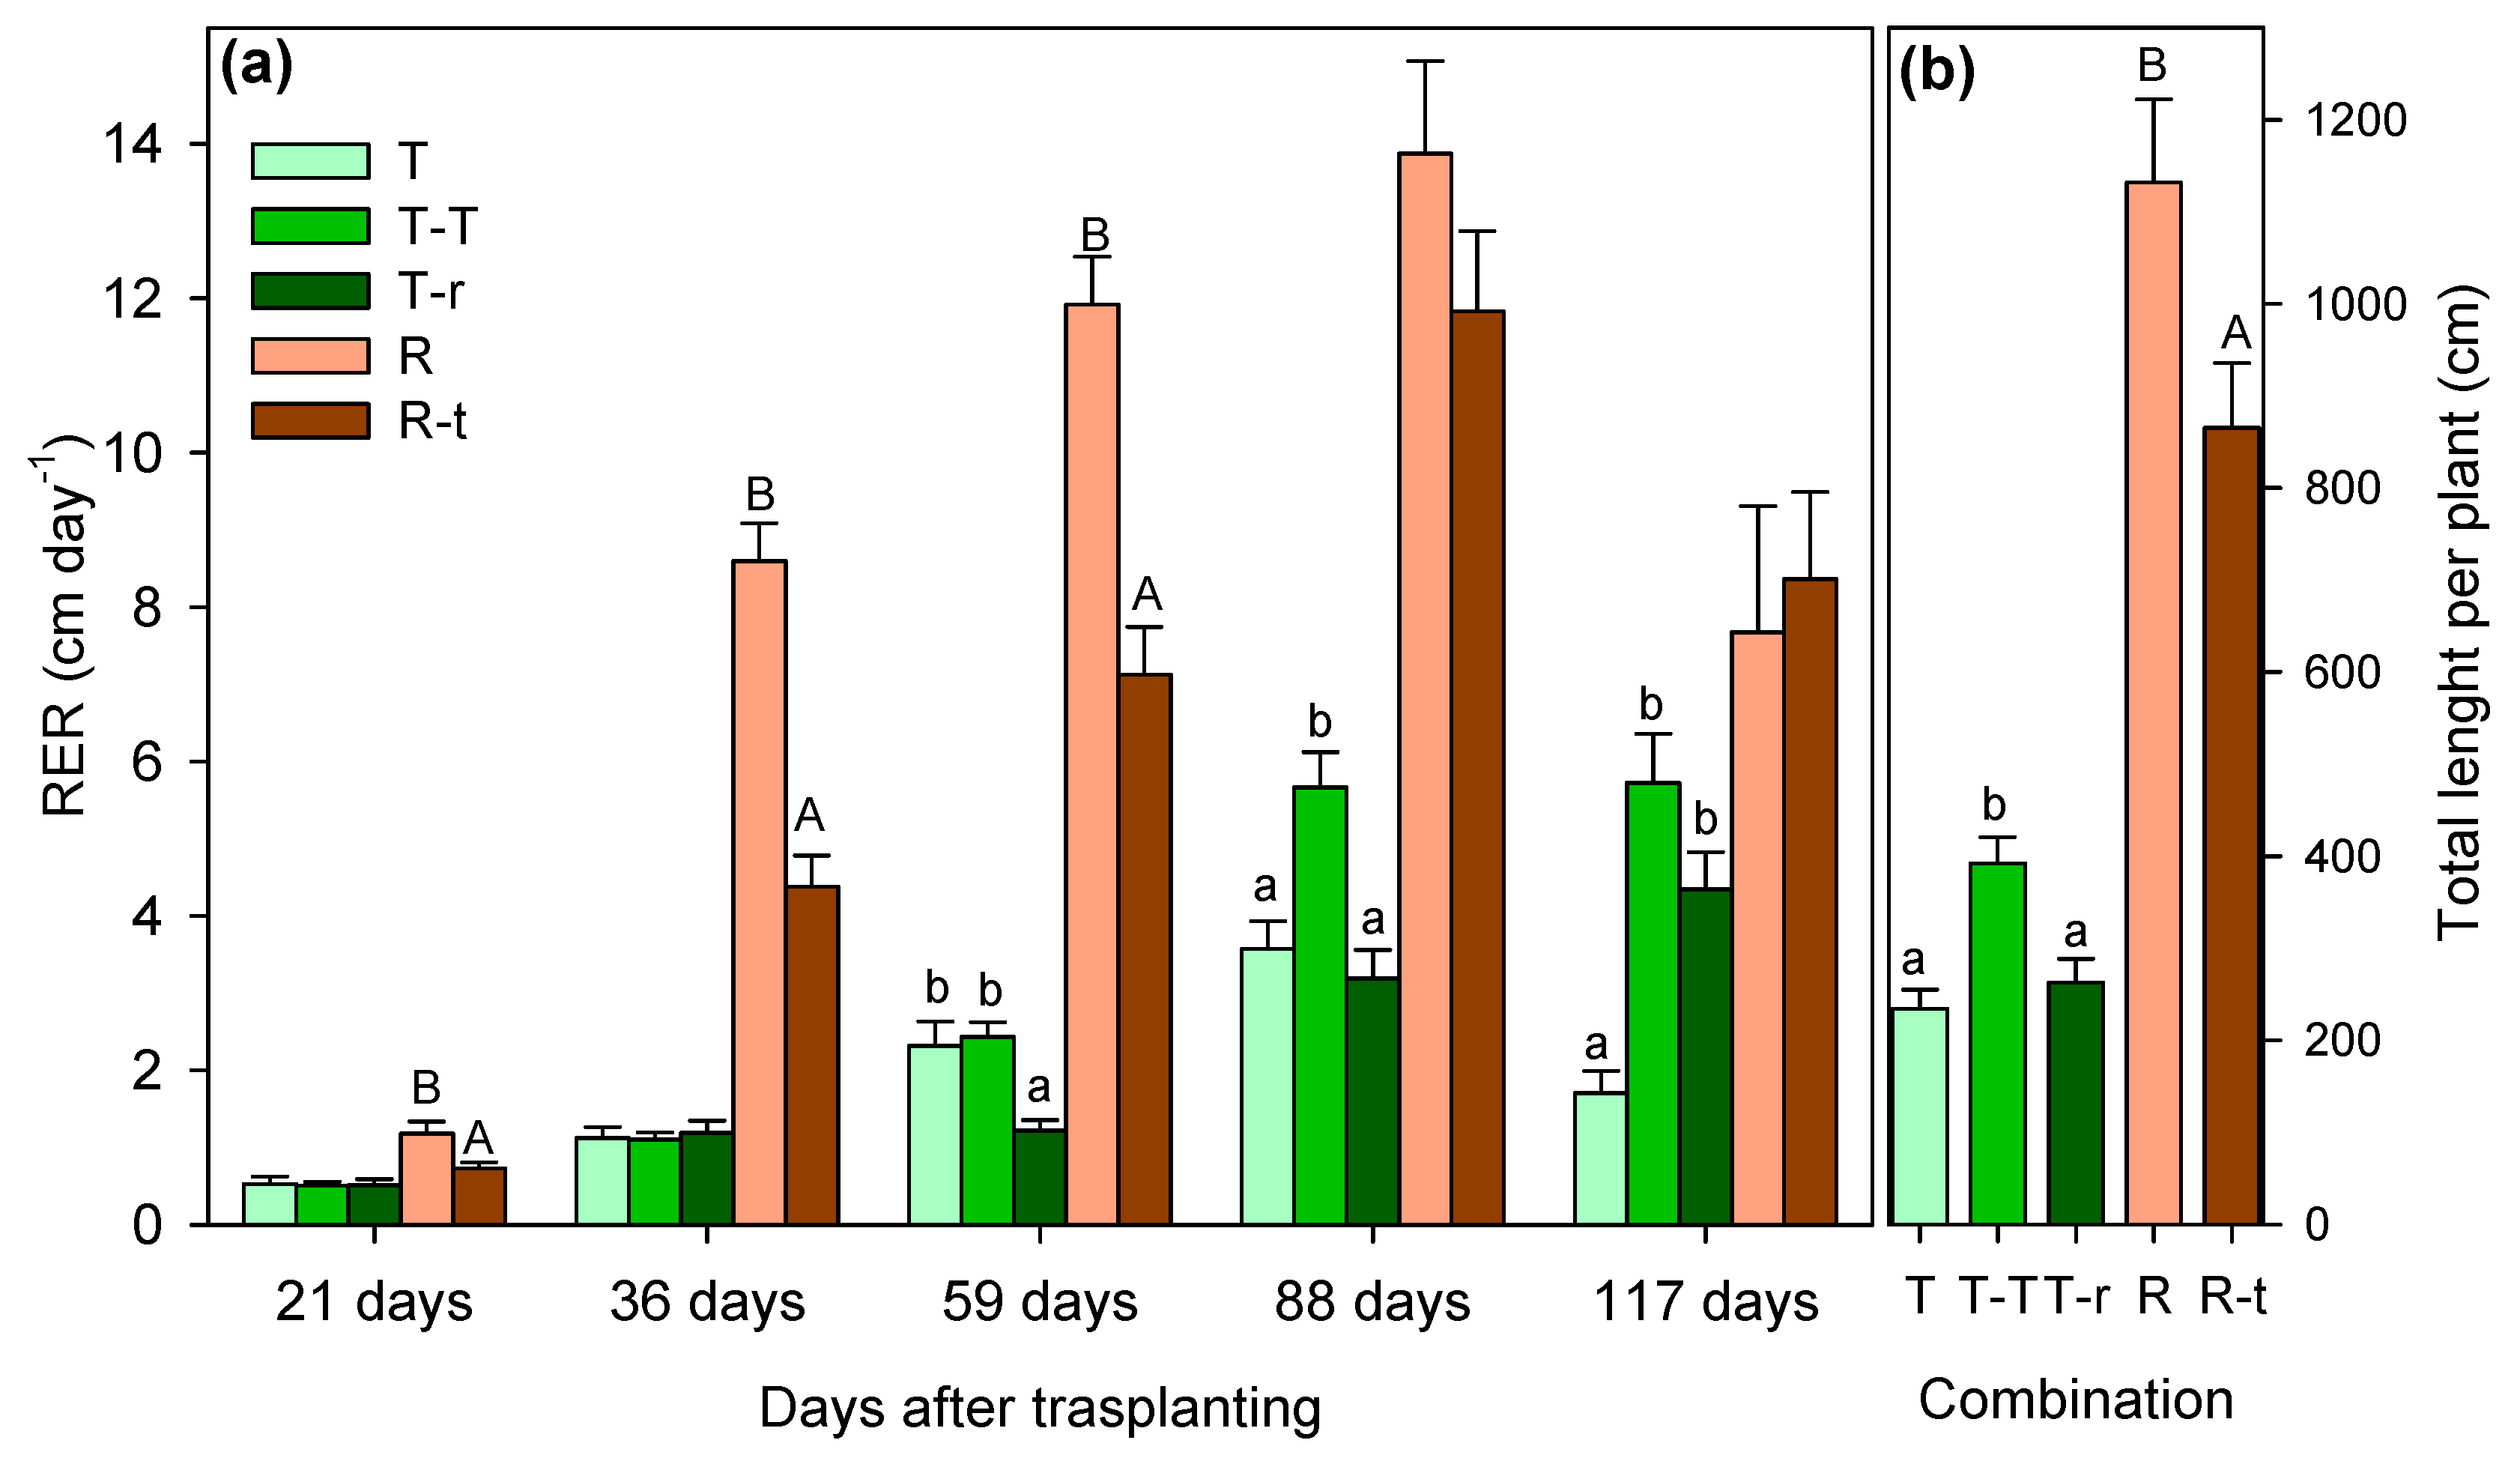
Figure 2.
Increase in the number of branches (ΔR) between successive measurement dates (a) and total branch number (b) at the end of the study period (mean + SE). Significant differences between species combinations are indicated by letters above the columns (lowercase for Thymus and uppercase for Retama; Kruskal-Wallis followed by Mann-Whitney U test, P<0.05).
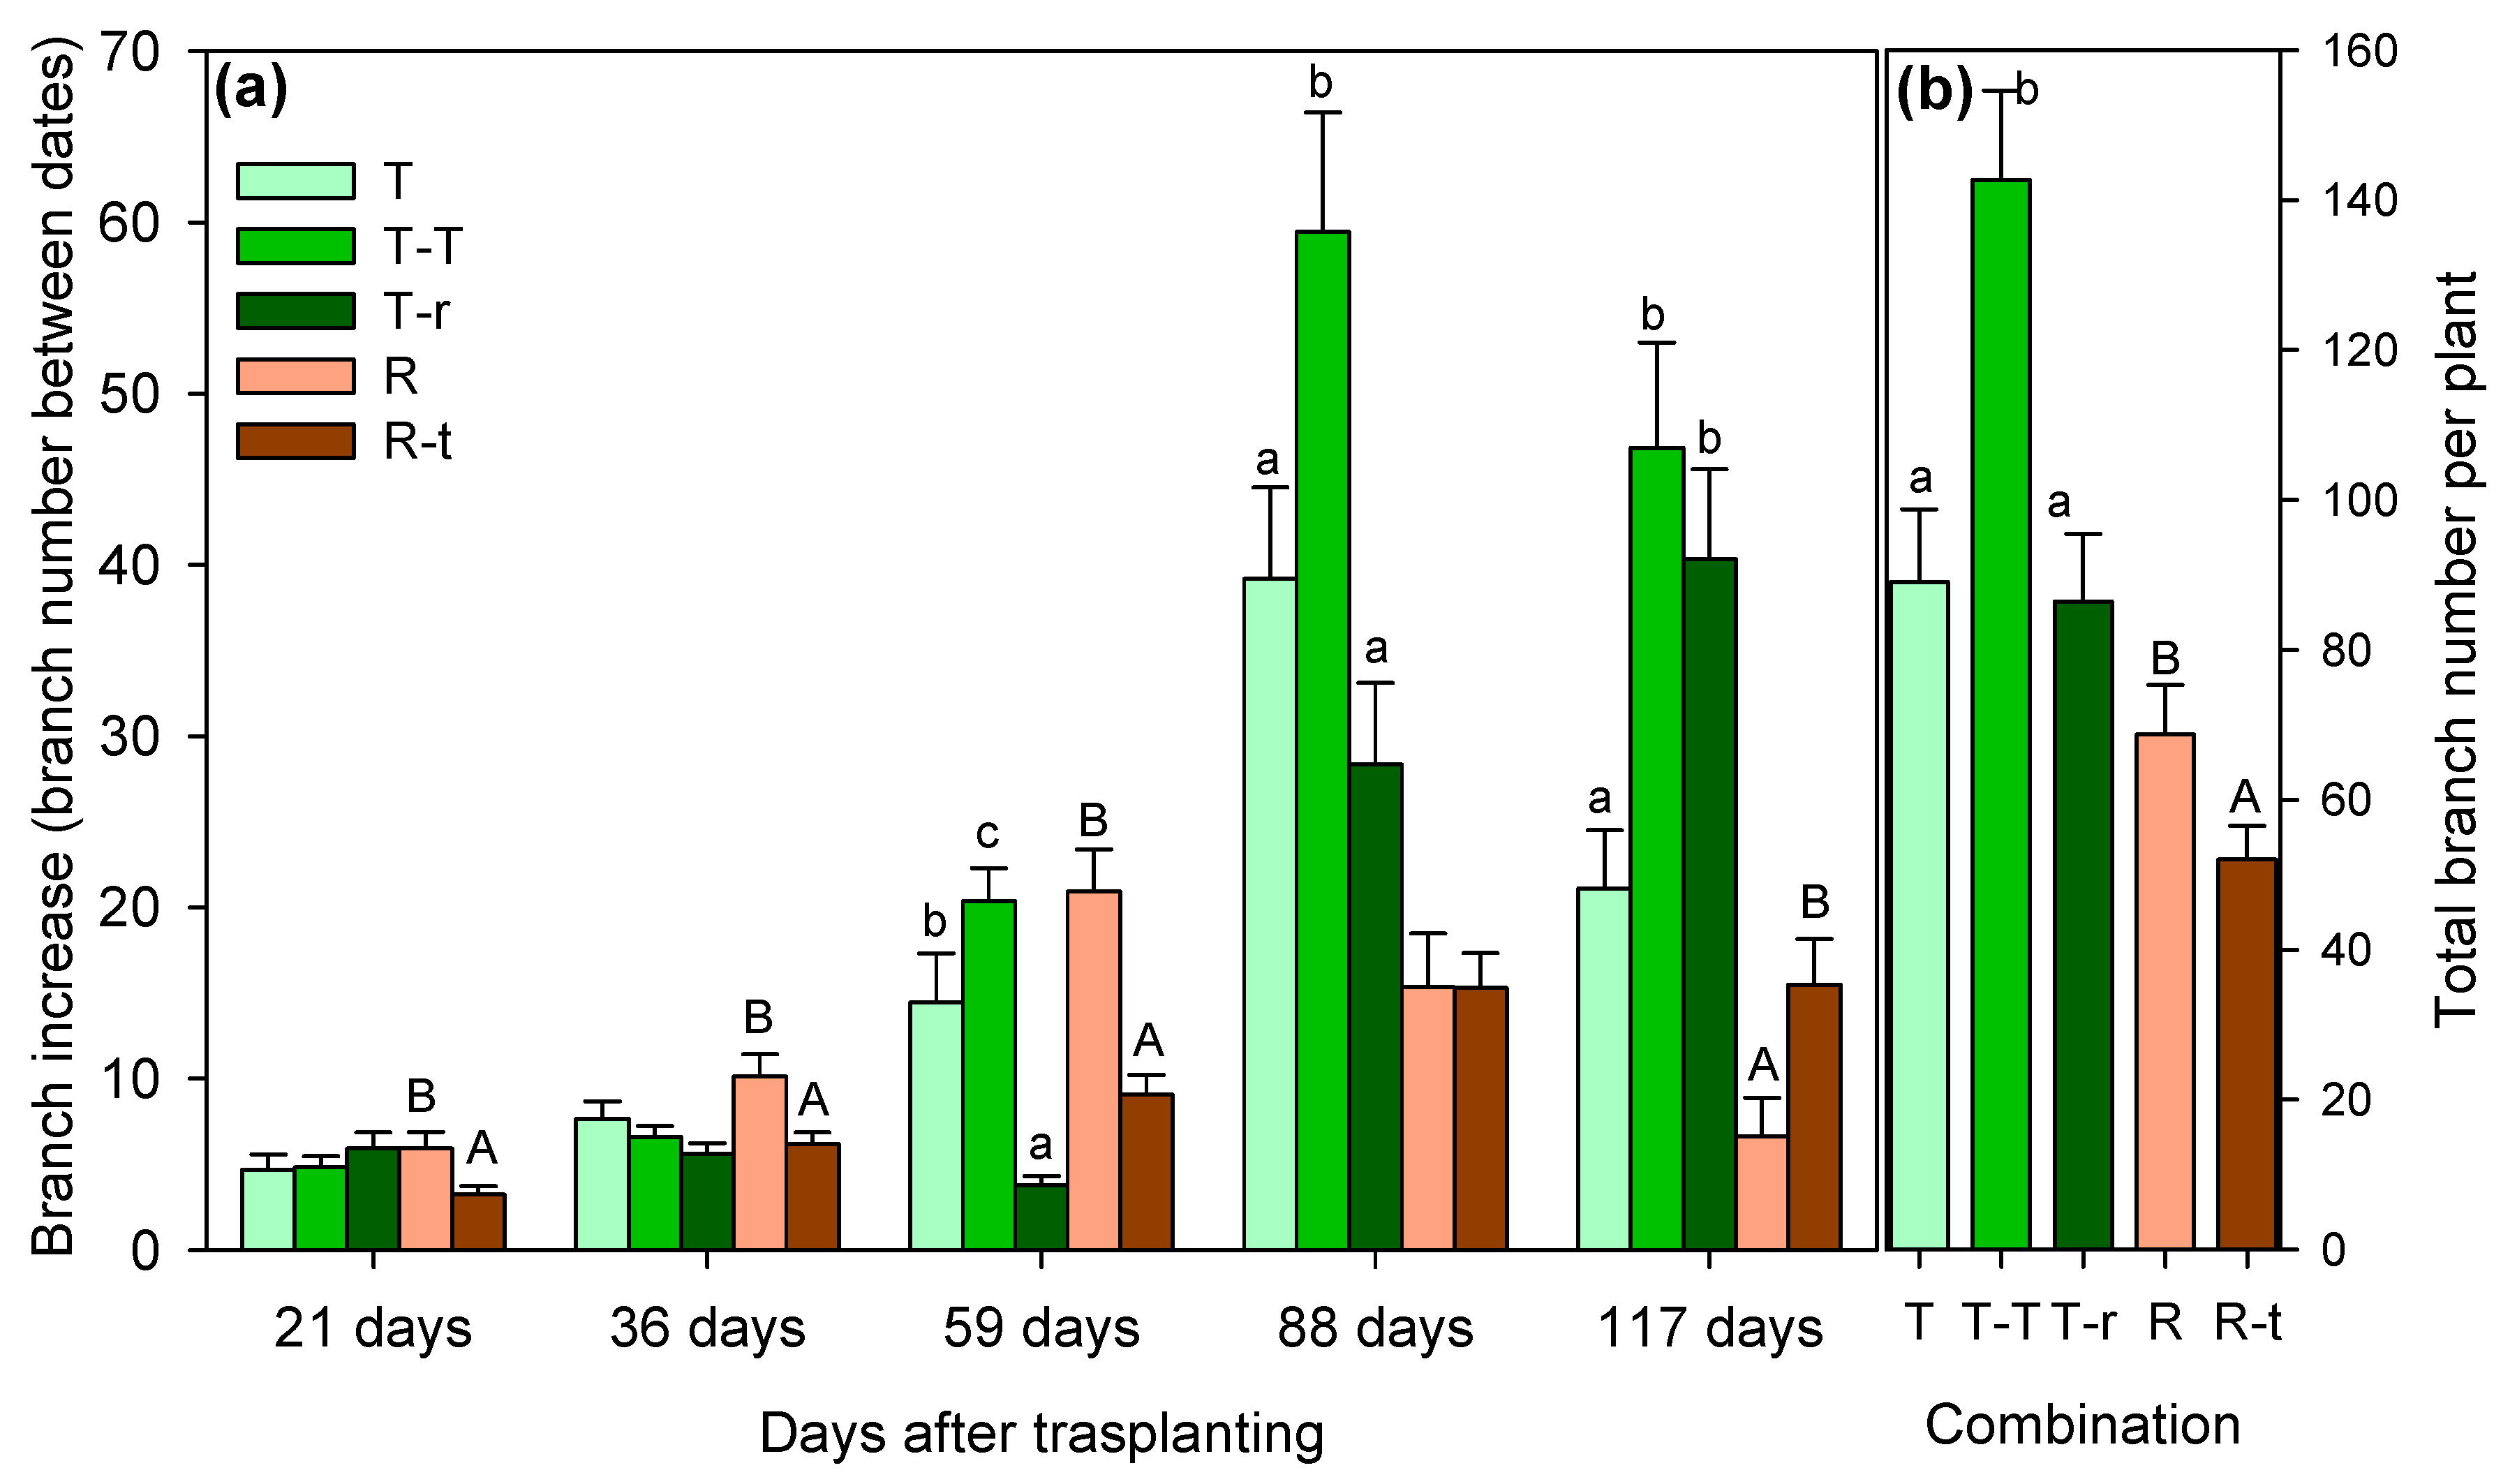
Figure 3.
Correlation between the sum of the elongation of all the branches of a plant and branch number at the end of the study period. Spearman's r is next to the legend (* P<0.01 and ** P<0.001). Each point represents an individual.
Figure 3.
Correlation between the sum of the elongation of all the branches of a plant and branch number at the end of the study period. Spearman's r is next to the legend (* P<0.01 and ** P<0.001). Each point represents an individual.
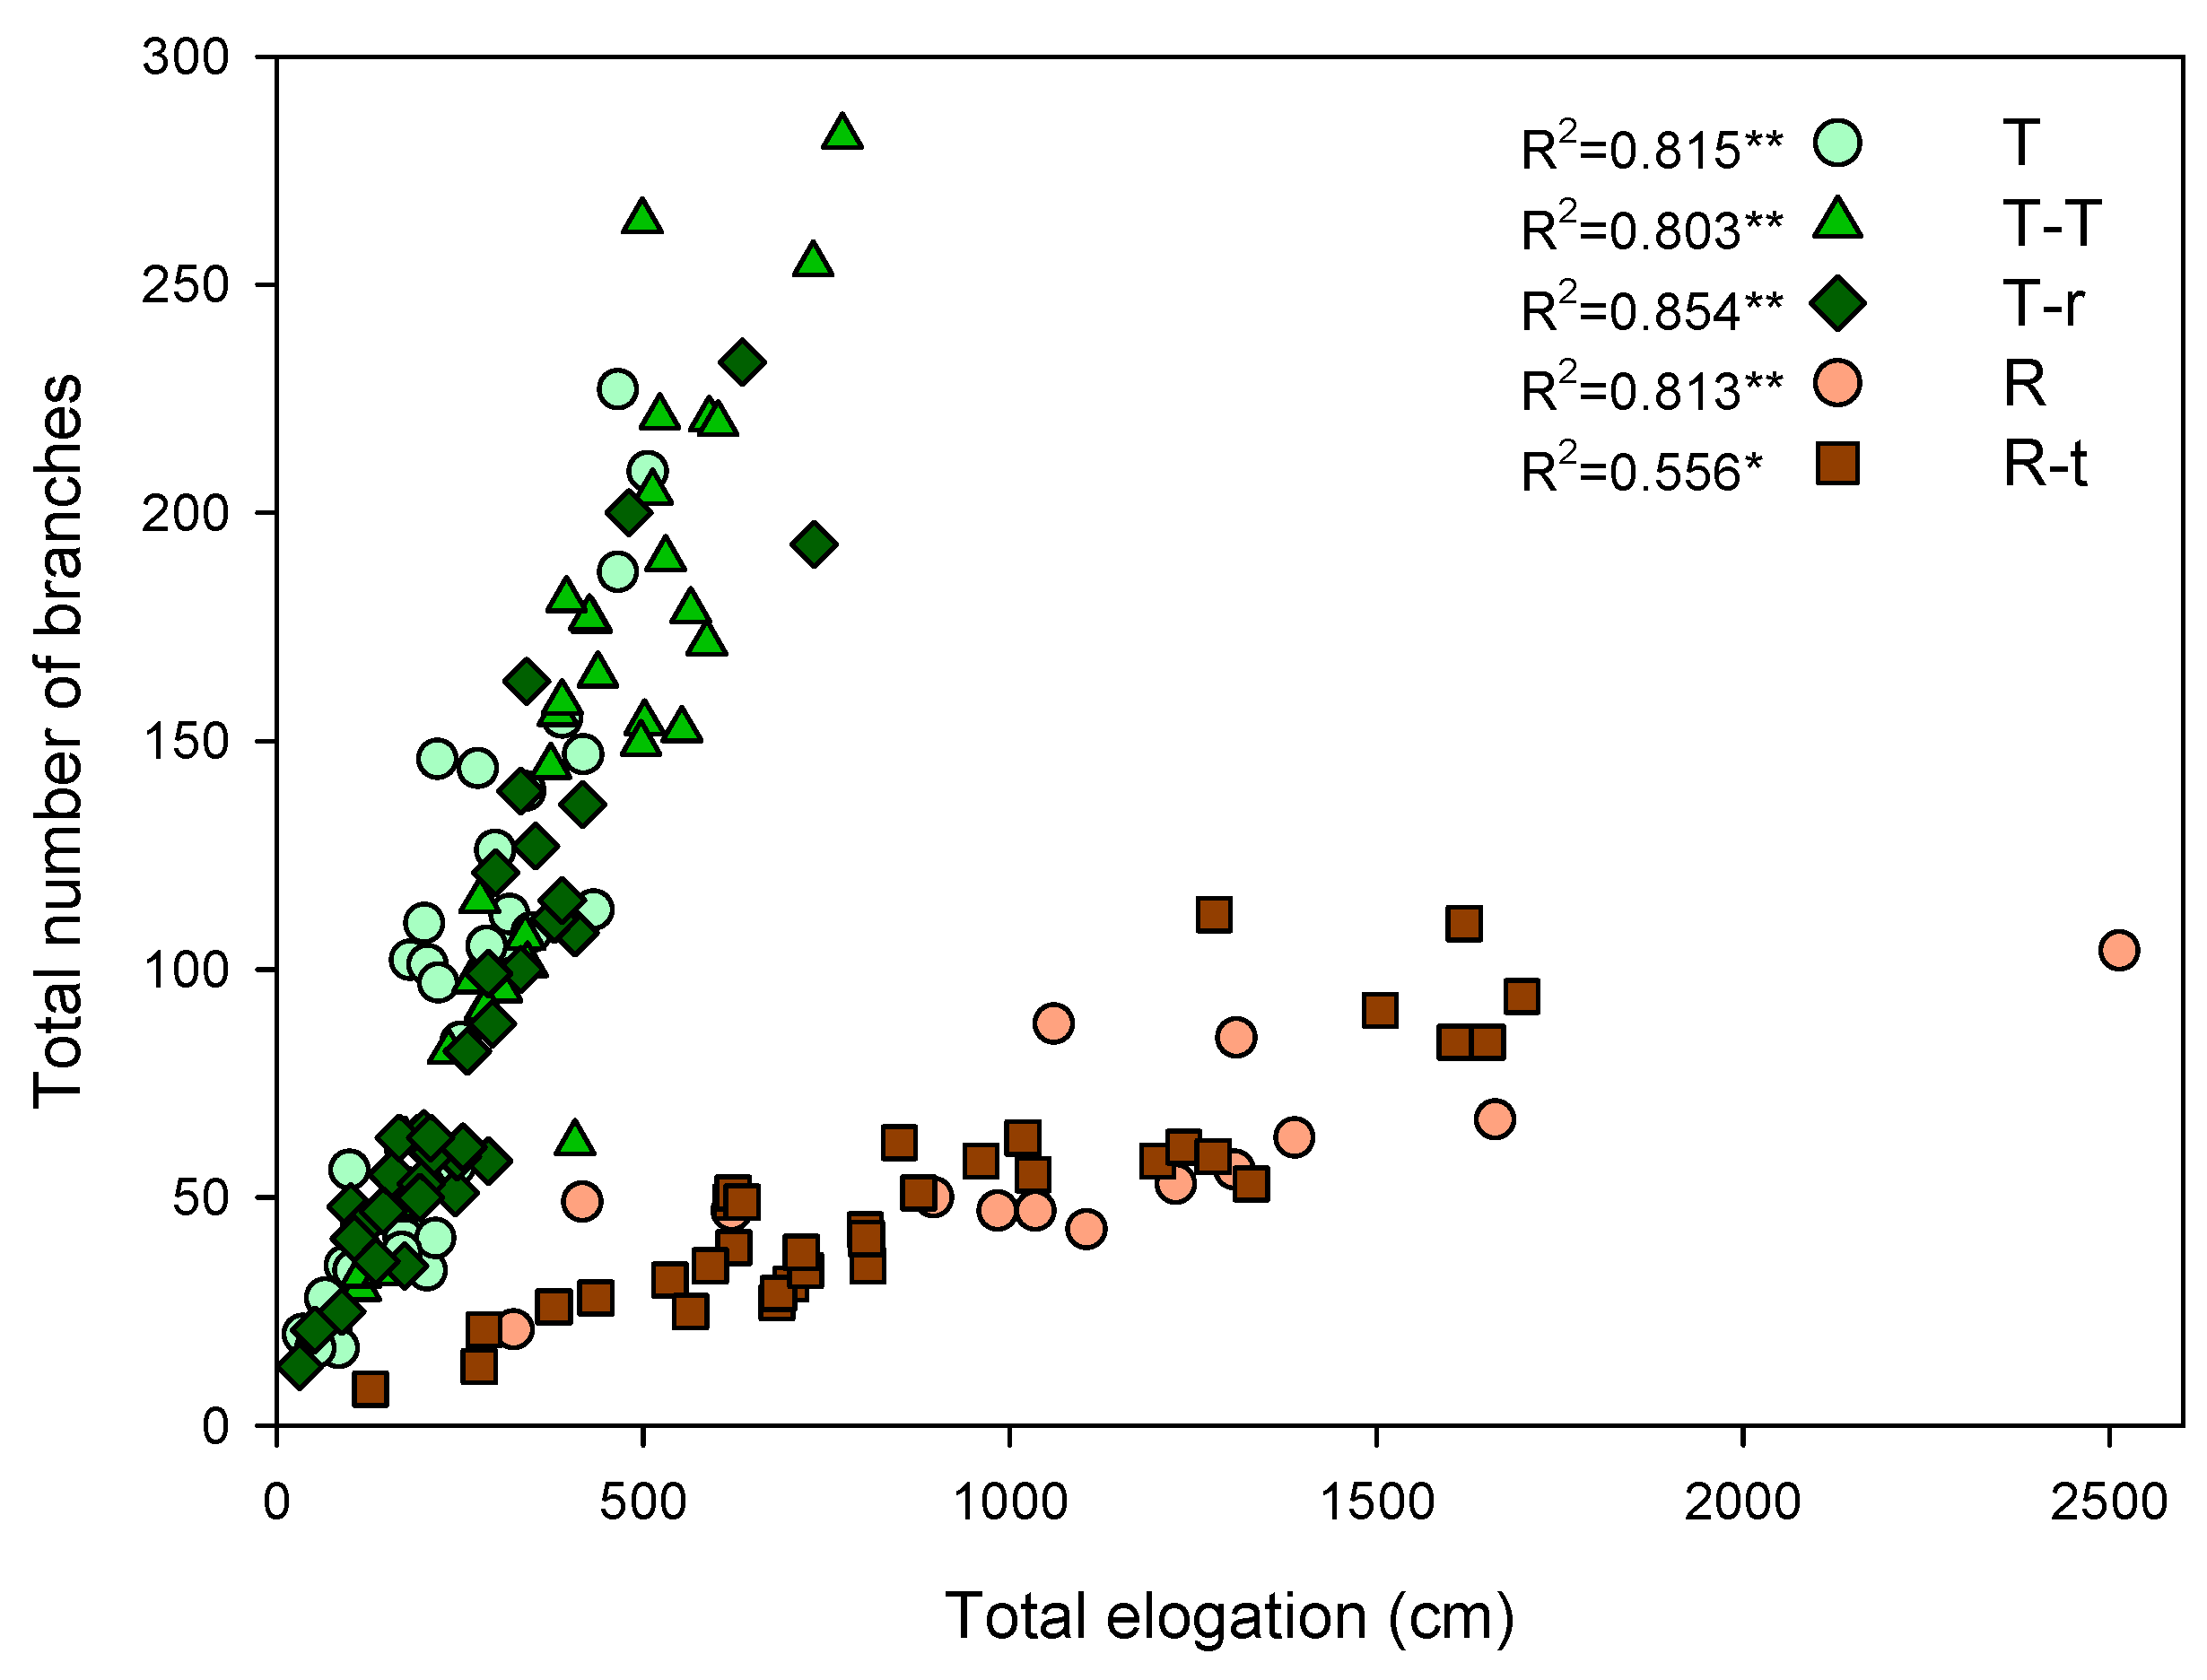
Figure 4.
Evolution of midday shoot water potential (mean + SE) in Thymus (a) and Retama (b) combinations throughout the water restriction treatment (Day 0 = pre-drought; Day 49 = recovery). Significant differences between combinations over the entire treatment period are indicated next to the legend with different letters (lowercase for drought individuals and uppercase for control individuals, analysed using two-way ANOVA; overall significance analysed by three-way ANOVA is indicated in uppercase black letters; P<0.05). Asterisk denotes significant pairwise differences between control and water restriction treatments on each measurement time point. The arrow marks the recovery irrigation event.
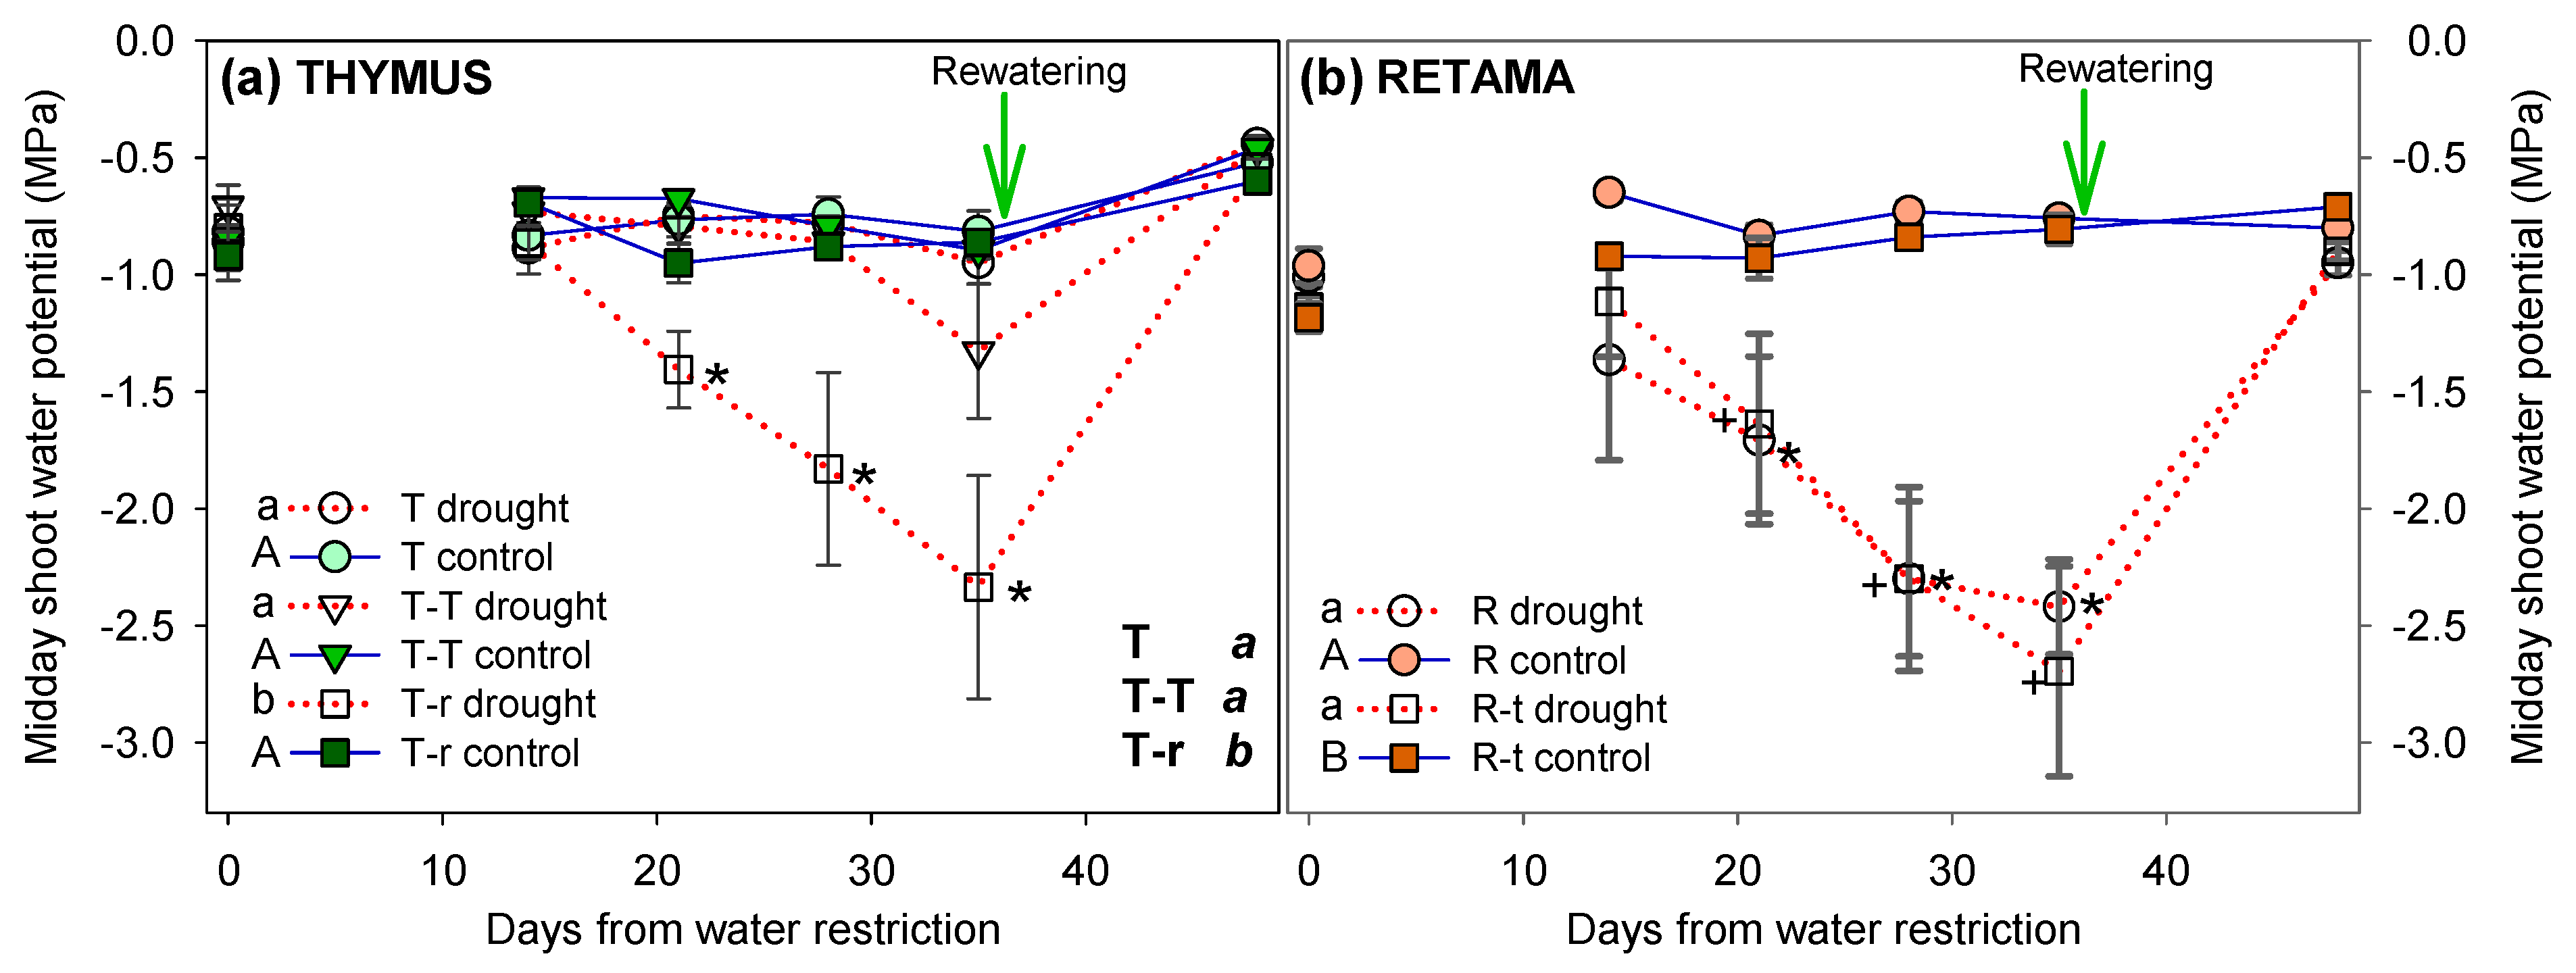
Figure 5.
Effective photochemical efficiency (ΦPSII) and maximum photochemical efficiency (Fv/Fm) of Thymus, T, T-T and T-r, (a, c) and Retama combinations (mean + SE), R, R-t, (b, d), throughout the drought treatment (day 0 = before water restriction). Significant differences between combinations over the entire treatment period are indicated next to the legend with different letters (lowercase for drought individuals and uppercase for control individuals, analysed using two-way ANOVA; overall significance analysed by three-way ANOVA is indicated in uppercase black letters; P<0.05). Asterisk denotes significant pairwise differences between control and water restriction treatments on each measurement time point.
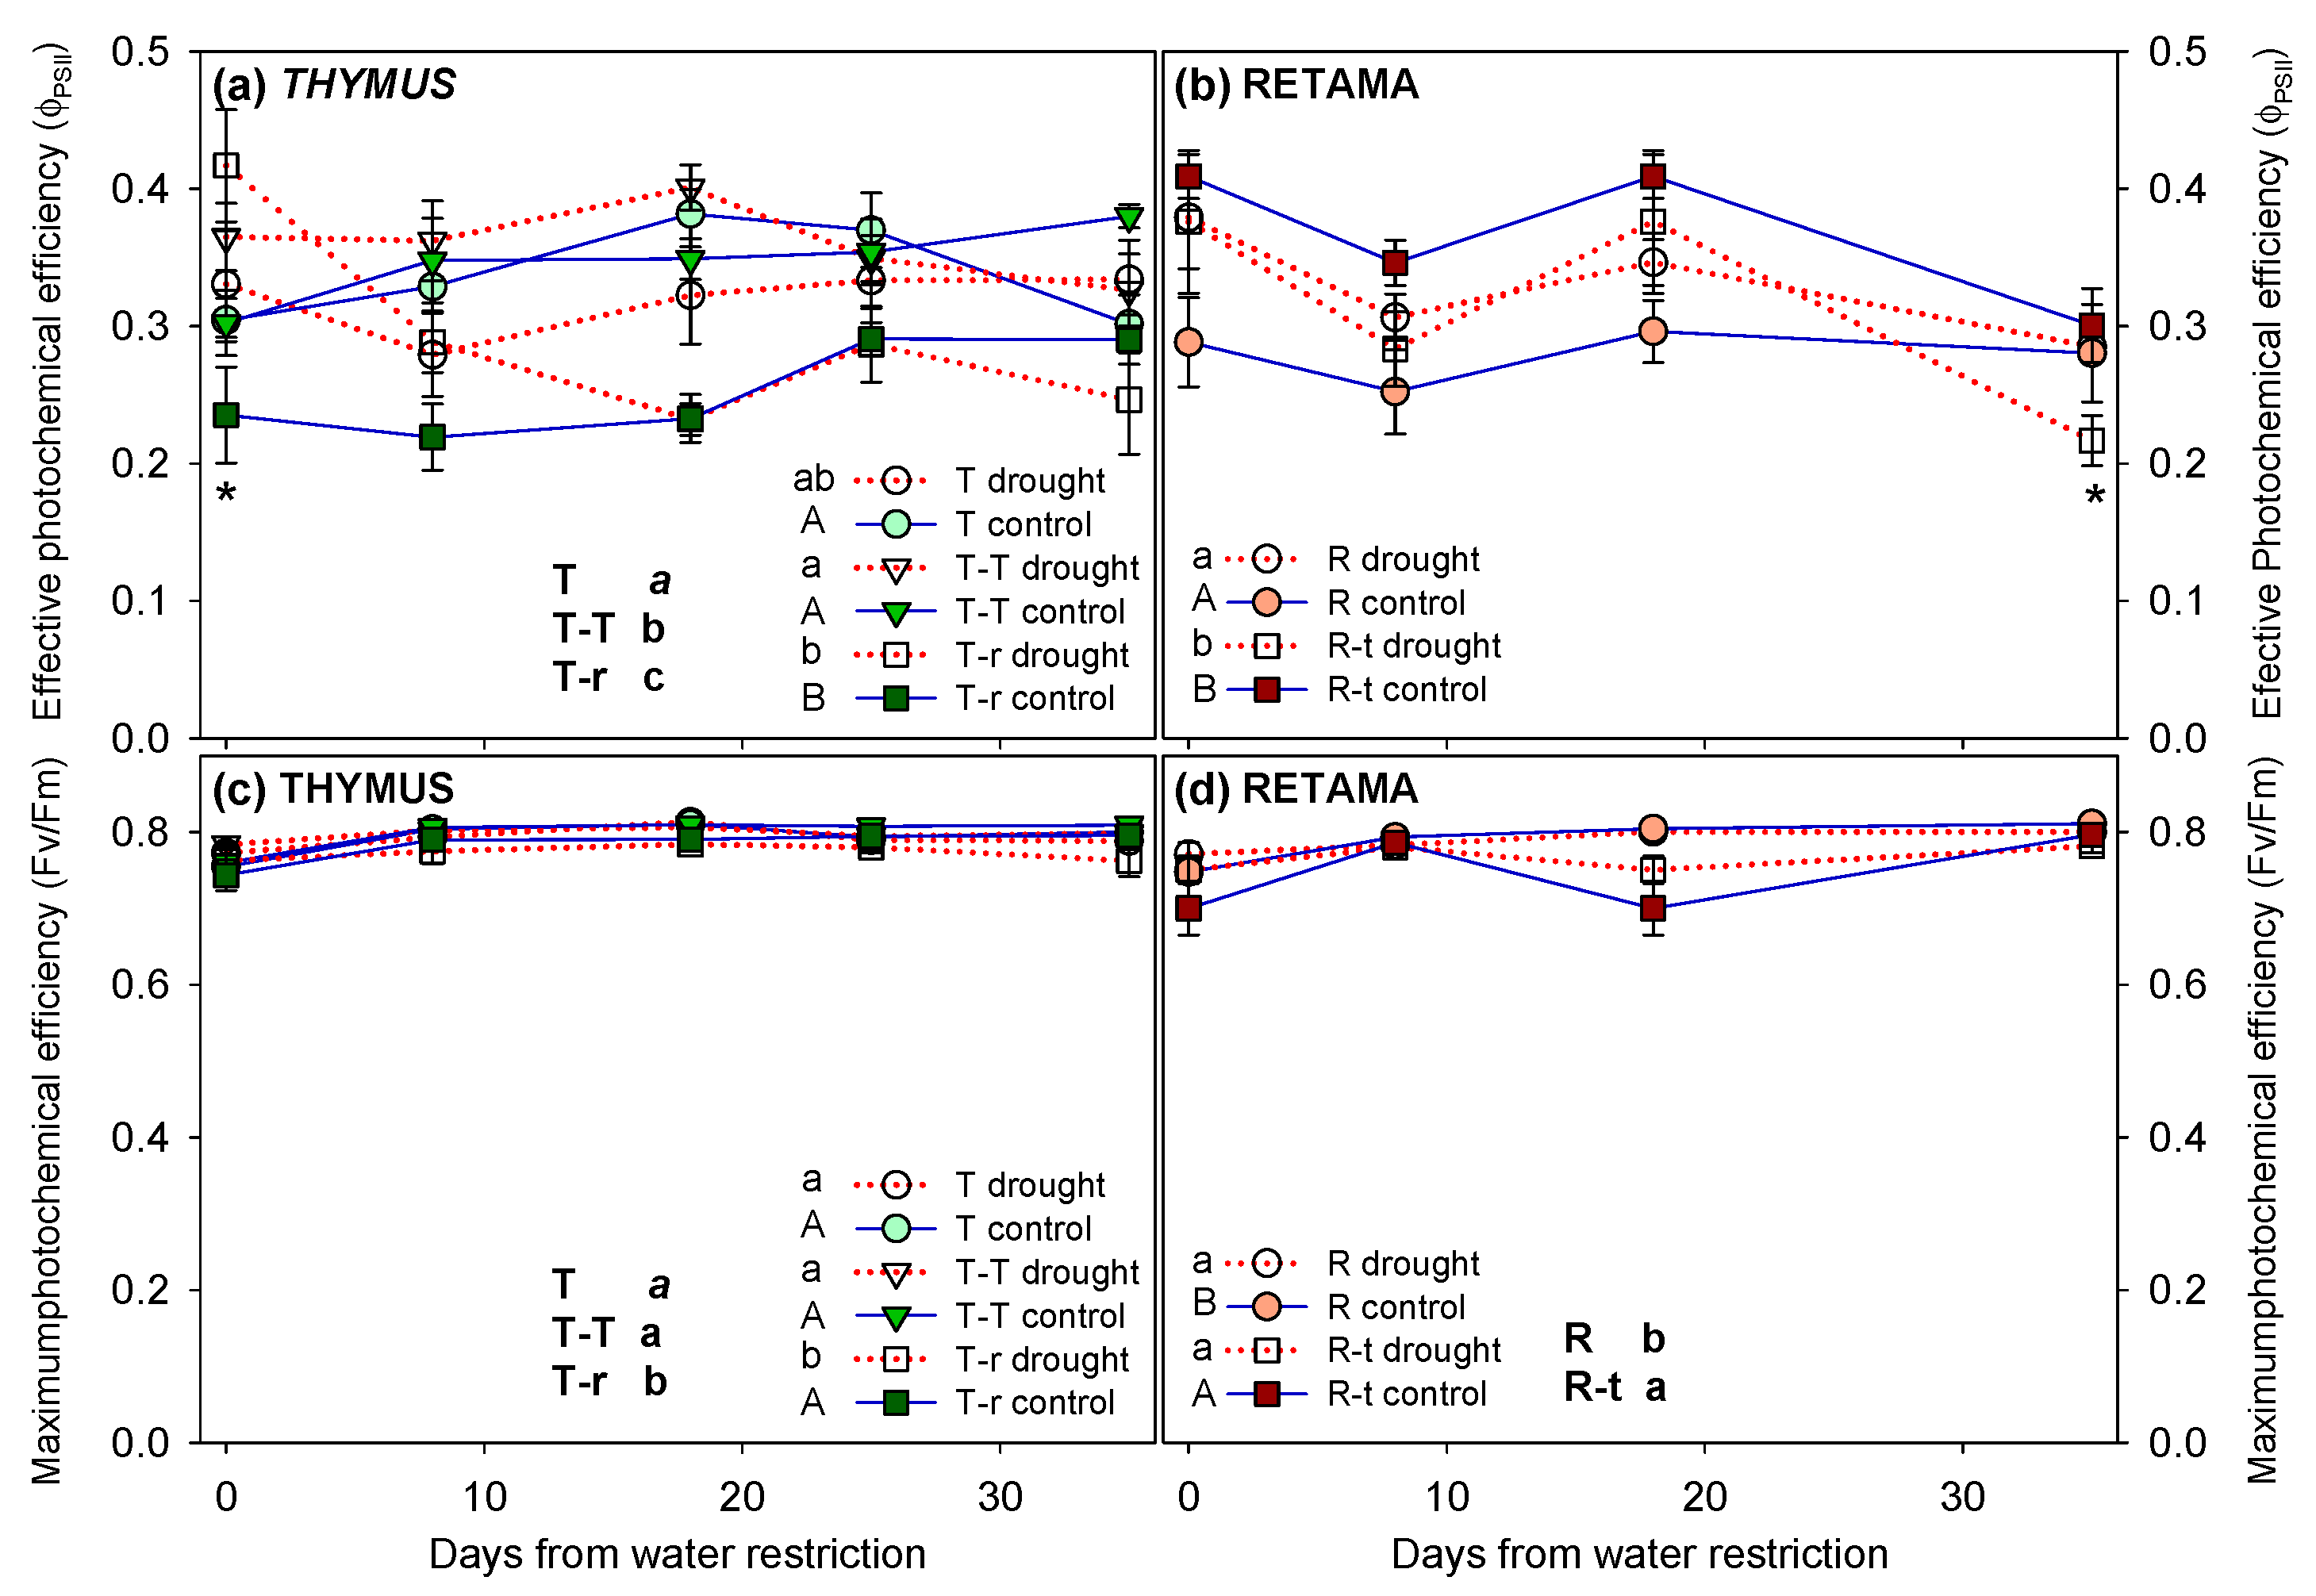
Figure 6.
Allocation of leaf biomass (Bleaves), stem biomass (Bstems/Btotal), root biomass (Broots/Btotal), and root-to-shoot ratio (Broots/Baerial) in Thymus (a) and Retama (b) combinations under control and drought treatments (Mean + SE). Different letters indicate significant differences between competition treatments (lowercase letters for Thymus and uppercase for Retama; P<0.05). Asterisks over pairs of bars in panels, a and c, indicate significant pairwise differences between control and water restriction treatments within each combination (P<0.05).
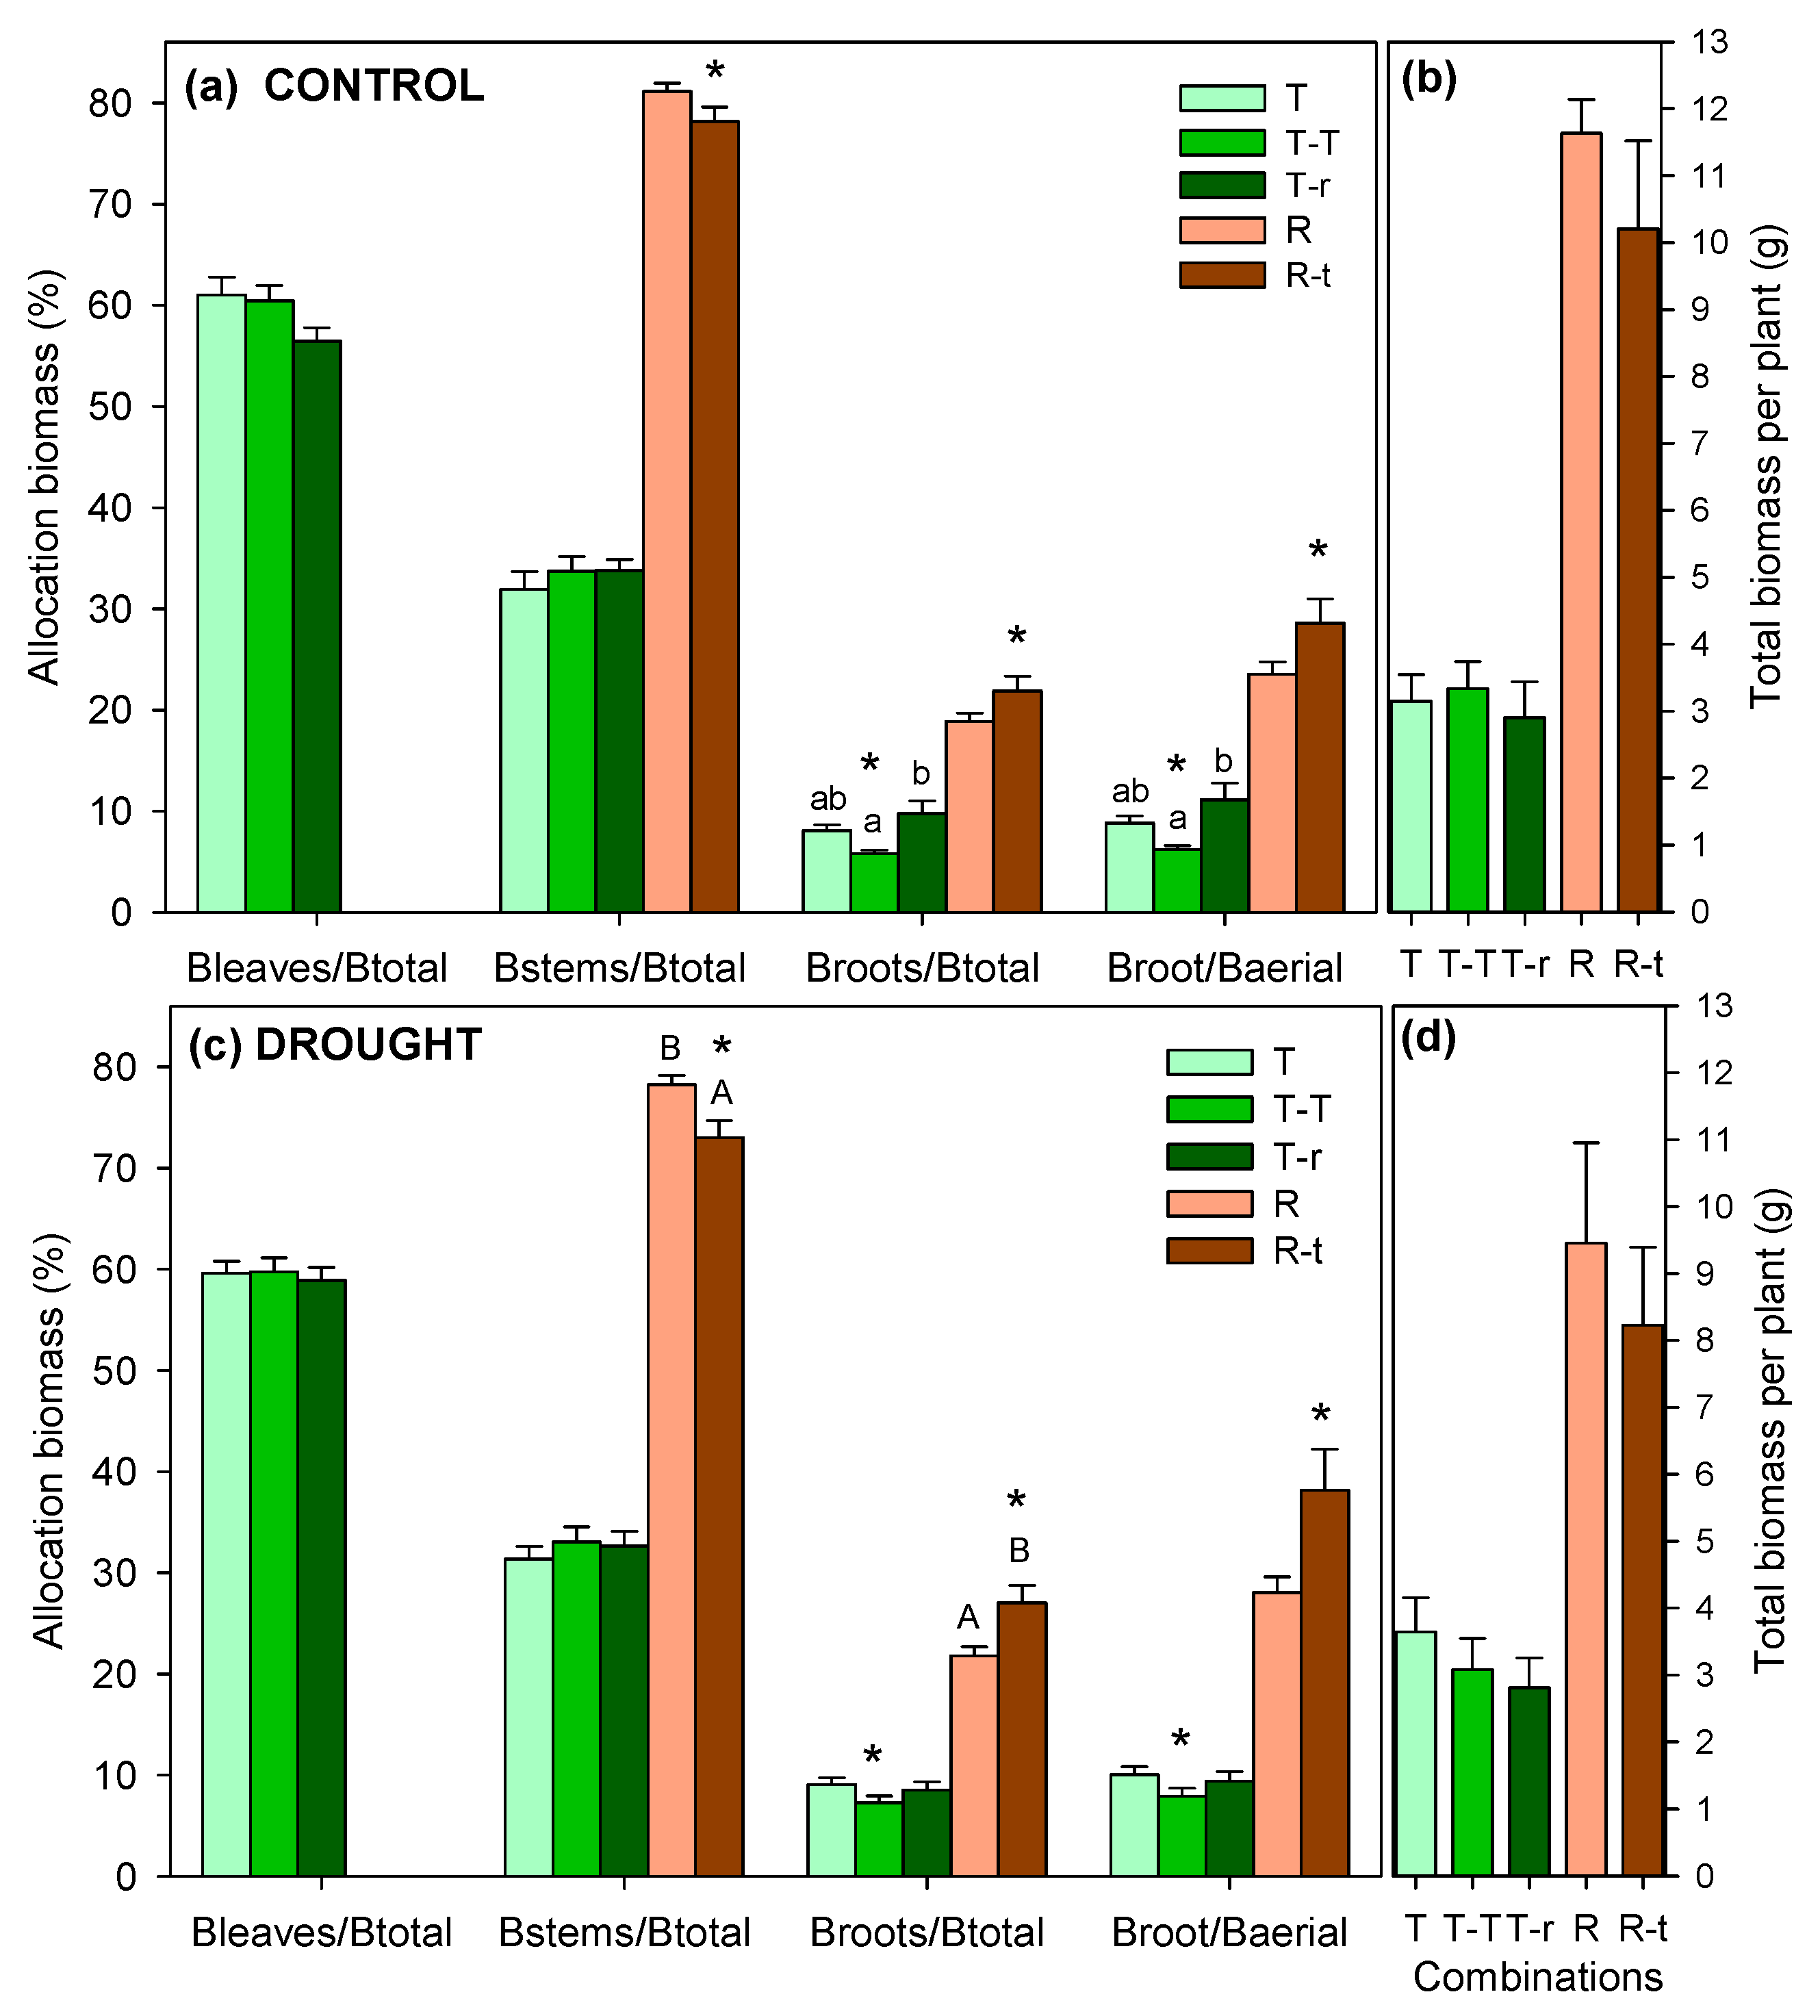
Figure 7.
Diagram illustrating the different experimental combinations, the measurements taken, and the timeline for each phase (Five months in pots after germination, seven months under different combinations, five weeks of drought and two weeks of rehydration).
Figure 7.
Diagram illustrating the different experimental combinations, the measurements taken, and the timeline for each phase (Five months in pots after germination, seven months under different combinations, five weeks of drought and two weeks of rehydration).
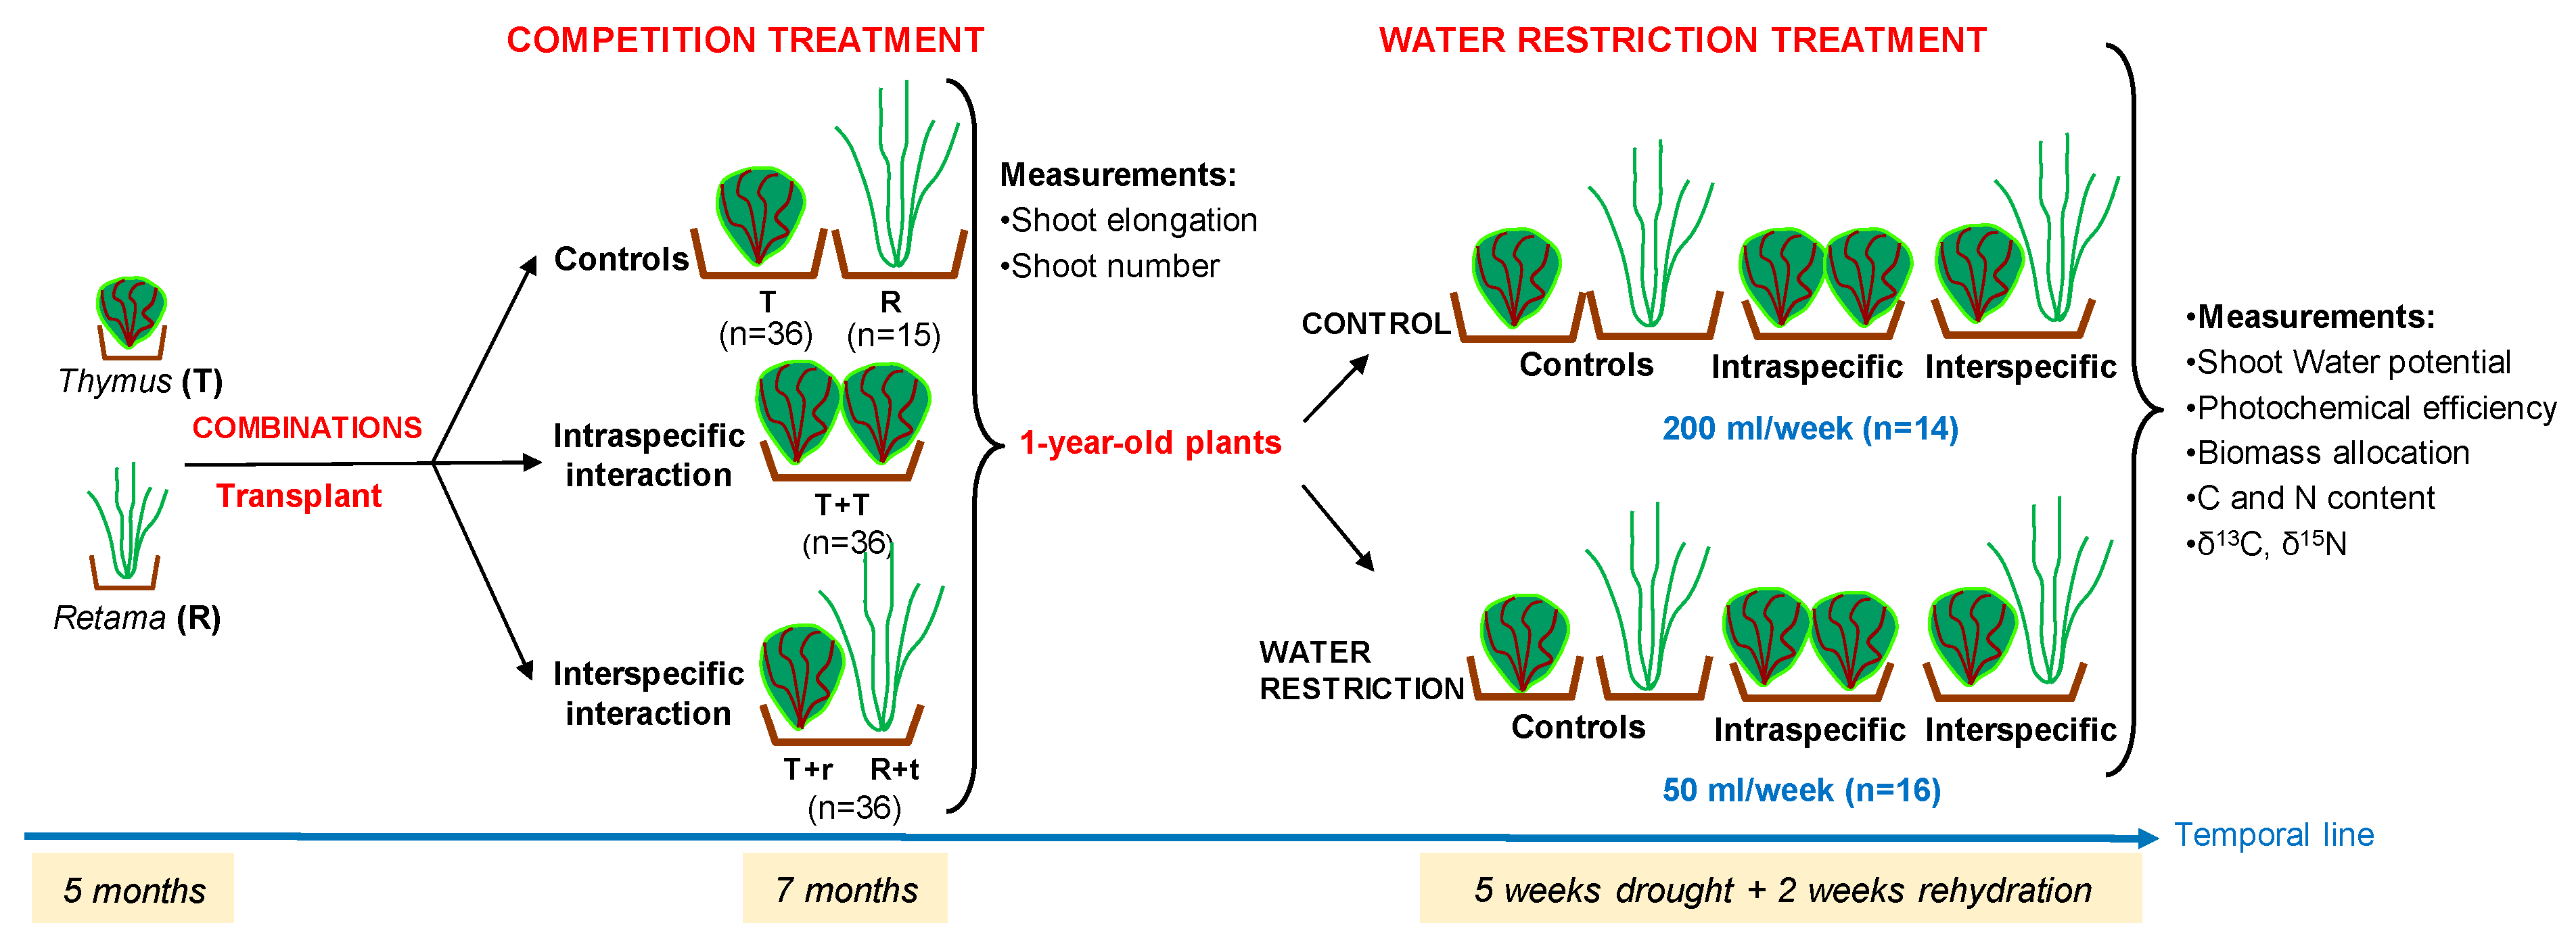

Table 1.
Results of repeated measures ANOVA for the factors competition and time on relative elongation rate (RER). Thymus and Retama are shown separately. Significant values (P<0.05) are indicated in bold.
Table 1.
Results of repeated measures ANOVA for the factors competition and time on relative elongation rate (RER). Thymus and Retama are shown separately. Significant values (P<0.05) are indicated in bold.
| RER | Thymus | Retama | ||||
|---|---|---|---|---|---|---|
| df | F | P | df | F | P | |
| Competition | 2 | 6.8 | 0.001 | 1 | 4.678 | 0.036 |
| Time | 4 | 318.5 | 0.001 | 4 | 46.332 | 0.000 |
| Competition*Time | 8 | 10.1 | 0.001 | 4 | 0.548 | 0.463 |
Table 2.
Results of the three-way ANOVA for the effect of the factors competition (C), watering (W), and time (T) during the drought experiment on the variables shoot water potential (Ψm), effective photochemical efficiency (ΦPSII), and maximum photochemical efficiency (Fv/Fm). Thymus and Retama are shown separately. Significant values (P<0.05) are indicated in bold.
| Ψm | ΦPSII | Fv/Fm | |||||||
| Thymus | df | F | P | df | F | P | df | F | P |
| Competition | 2 | 15.830 | 0.001 | 2 | 26.994 | 0.001 | 2 | 15.486 | 0.001 |
| Watering | 1 | 13.621 | 0.001 | 1 | 2.091 | 0.150 | 1 | 2.199 | 0.140 |
| Time | 5 | 13.089 | 0.001 | 4 | 0.954 | 0.434 | 4 | 20.989 | 0.001 |
| C * W | 2 | 8.641 | 0.001 | 2 | 3.156 | 0.045 | 2 | 0.883 | 0.415 |
| C * T | 10 | 2.805 | 0.003 | 8 | 2.630 | 0.009 | 8 | 0.454 | 0.887 |
| W * T | 5 | 5.607 | 0.001 | 4 | 5.110 | 0.001 | 4 | 5.057 | 0.001 |
| C * W * T | 10 | 2.437 | 0.009 | 8 | 2.424 | 0.016 | 8 | 0.229 | 0.985 |
| Retama | df | F | P | df | F | P | df | F | P |
| Competition | 1 | 0.240 | 0.625 | 1 | 0.225 | 0.636 | 1 | 8.335 | 0.005 |
| Watering | 1 | 52.657 | 0.001 | 1 | 0.000 | 0.983 | 1 | 0.001 | 0.977 |
| Time | 5 | 6.152 | 0.001 | 3 | 8.028 | 0.001 | 3 | 13.240 | 0.001 |
| C * W | 1 | 0.198 | 0.657 | 1 | 15.172 | 0.001 | 1 | 0.030 | 0.864 |
| C * T | 5 | 0.108 | 0.990 | 3 | 1.964 | 0.125 | 3 | 0.859 | 0.466 |
| W * T | 5 | 7.250 | 0.001 | 3 | 1.263 | 0.292 | 3 | 3.348 | 0.022 |
| C * W * T | 5 | 0.266 | 0.931 | 3 | 0.194 | 0.900 | 3 | 0.621 | 0.603 |
Table 3.
Results of the two-way ANOVA for the effect of the factors competition (C) and the watering (W) on the variables allocation of biomass to leaves (BL/BT), to stems (BS/BT), to roots (BR/BT), and root-to-aboveground ratio (BR/BA). Significant values (P<0.05) are indicated in bold. Thymus and Retama are shown separately.
| Thymus | BL/BT | BS/BT | BR/BT | BR/BA | ||||||||
| df | F | P | df | F | P | df | F | P | df | F | P | |
| Competition | 2 | 1.520 | 0.225 | 2 | 0.881 | 0.418 | 2 | 7.339 | 0.001 | 2 | 6.996 | 0.002 |
| Watering | 1 | 0.135 | 0.715 | 1 | 0.467 | 0.496 | 1 | 0.418 | 0.520 | 1 | 0.287 | 0.593 |
| C*W | 2 | 0.656 | 0.522 | 2 | 0.021 | 0.979 | 2 | 1.949 | 0.149 | 2 | 1.988 | 0.143 |
| BS/BT | BR/BT | BR/BA | ||||||||||
| Retama | df | F | P | df | F | P | df | F | P | |||
| Competition | 1 | 5.618 | 0.023 | 1 | 5.618 | 0.023 | 1 | 4.719 | 0.036 | |||
| Watering | 1 | 5.456 | 0.025 | 1 | 5.456 | 0.025 | 1 | 4.115 | 0.050 | |||
| C*W | 1 | 0.449 | 0.507 | 1 | 0.449 | 0.507 | 1 | 0.551 | 0.463 | |||
Table 4.
Results of leaf C content (%C), leaf N content (%N), C/N ratio, δ13C, and δ15N. Mean and standard deviation (SD) are shown. Letters denote differences between competition treatments for each variable. Lowercase letters indicate differences for control individuals (C), italic lowercase letters indicate differences for water restriction individuals (D, one-way ANOVA; P<0.05); and uppercase letters denote global differences between combinations (two-way ANOVA; P<0.05).
| %C | %N | C/N | δ13C | δ15N | |||||||||||||||||
|---|---|---|---|---|---|---|---|---|---|---|---|---|---|---|---|---|---|---|---|---|---|
| treatment | C | D | C | D | C | D | C | D | C | D | |||||||||||
| T | Mean | 47.9 | ab | 47.9 | a | 1.5 | 1.4 | 32.8 | 39.7 | -28.8 | -27.0 | a | 5.1 | a | 4.1 | a | |||||
| SD | 1.3 | 1.6 | 0.4 | 0.6 | 9.7 | 16.1 | 2.1 | 3.6 | 1.8 | 1.6 | |||||||||||
| T-T | Mean | 49.1 | a | 49.0 | a | 1.7 | 1.5 | 31.8 | 34.5 | -28.5 | -28.6 | ab | 3.7 | ab | 3.3 | ab | |||||
| SD | 1.6 | 1.1 | 0.5 | 0.4 | 9.0 | 8.2 | 2.7 | 1.1 | 0.3 | 0.6 | |||||||||||
| T-r | Mean | 49.6 | a | 50.0 | a | 1.4 | 1.6 | 35.3 | 33.9 | -29.1 | -29.3 | ab | 2.8 | b | 2.6 | b | |||||
| SD | 3.6 | 2.7 | 0.3 | 0.4 | 6.3 | 9.7 | 2.1 | 1.4 | 0.5 | 1.0 | |||||||||||
| R-t | Mean | 42.9 | b | 42.9 | b | 1.4 | 1.3 | 32.9 | 36.2 | -30.5 | -31.3 | b | 2.5 | b | 2.7 | b | |||||
| SD | 1.6 | 2.0 | 0.4 | 0.3 | 8.2 | 8.6 | 0.8 | 0.9 | 1.8 | 1.0 | |||||||||||
Table 5.
Results of the two-way ANOVA for the effect of combination and watering on the variables leaf C content (%C), leaf N content (%N), C/N ratio, δ13C, and δ15N on Thymus plants. Significant values (P<0.05) are indicated in bold.
Table 5.
Results of the two-way ANOVA for the effect of combination and watering on the variables leaf C content (%C), leaf N content (%N), C/N ratio, δ13C, and δ15N on Thymus plants. Significant values (P<0.05) are indicated in bold.
| % C | % N | C/N | δ13C | δ15N | |||||||||||
|---|---|---|---|---|---|---|---|---|---|---|---|---|---|---|---|
| df | F | P | df | F | P | df | F | P | df | F | P | df | F | P | |
| Competition | 3 | 20.886 | 0.001 | 3 | 0.956 | 0.423 | 3 | 0.359 | 0.783 | 3 | 4.212 | 0.011 | 3 | 6.698 | 0.001 |
| Watering | 1 | 0.038 | 0.847 | 1 | 0.940 | 0.338 | 1 | 1.554 | 0.220 | 1 | 0.059 | 0.809 | 1 | 1.114 | 0.297 |
| C*W | 3 | 0.029 | 0.993 | 3 | 0.632 | 0.599 | 3 | 0.638 | 0.595 | 3 | 0.684 | 0.567 | 3 | 0.380 | 0.768 |
Disclaimer/Publisher’s Note: The statements, opinions and data contained in all publications are solely those of the individual author(s) and contributor(s) and not of MDPI and/or the editor(s). MDPI and/or the editor(s) disclaim responsibility for any injury to people or property resulting from any ideas, methods, instructions or products referred to in the content. |
© 2025 by the authors. Licensee MDPI, Basel, Switzerland. This article is an open access article distributed under the terms and conditions of the Creative Commons Attribution (CC BY) license (http://creativecommons.org/licenses/by/4.0/).
Copyright: This open access article is published under a Creative Commons CC BY 4.0 license, which permit the free download, distribution, and reuse, provided that the author and preprint are cited in any reuse.


