Submitted:
23 June 2025
Posted:
23 June 2025
You are already at the latest version
Abstract
Concrete is a cornerstone material in the construction industry owing to its versatile performance; however, its inherent brittleness, low tensile strength, and poor permeability resistance limit its broader application. Graphene, with its exceptional thermal conductivity, stable lattice structure, and high specific surface area, presents a transformative solution to these challenges. Despite its promise, comprehensive studies on the multifunctional properties and underlying mechanisms of graphene-enhanced concrete remain scarce. In this study, we developed a novel concrete composite incorporating cement, coarse sand, crushed stone, water, and graphene, systematically investigating the effects of graphene dosage and curing duration on its performance. Our results demonstrate that graphene incorporation markedly improves the material’s density, brittleness, thermal conductivity, and permeability resistance. Notably, the graphene-reinforced concrete exhibited a 44% increase in compressive strength, a 7.5% enhancement in photothermal absorption capacity, and a 200% reduction in water permeability compared to conventional concrete. Additionally, the composite showed a 5.5% decrease in maximum heat release and a 13% increase in heat storage capacity. These findings underscore the significant potential of graphene-reinforced concrete for advanced construction applications, offering superior mechanical strength, thermal regulation, and durability.
Keywords:
Graphene
; concrete
; performance analysis
; mechanism study
Concrete is recognized for its sustainability, low cost, and favorable structural properties, making it a predominant building material worldwide. It is extensively utilized in infrastructure, commercial buildings, and residential construction. However, the continuous growth of the concrete industry has led to an increasing demand for cement and aggregates, resulting in heightened CO2 emissions. Consequently, the development of high-performance, multifunctional concrete is essential for advancing a sustainable and resource-efficient construction industry [1,2,3,4].
Currently, extensive research has been conducted on the mechanical properties of concrete incorporating steel slag, fibers, and other materials. These studies provide innovative insights into the application of novel concrete in modern construction [5,6]. Hongjian Lin et al. investigated the effects of various mixtures of high-toughness polypropylene (HTPP) fiber on the flexural strength, compressive strength, and stress-strain behavior of ceramite concrete. They analyzed the action mechanism of HTPP fiber reinforcement in ceramic concrete using scanning electron microscopy. This study provides important theoretical support for the structural analysis and design of this type of concrete [7]. This-Thuy-Hang Nguyen et al. incorporated steel slag material into concrete as a substitute for coarse aggregate and investigated the relationship between the compressive strength of steel slag concrete and age. The results indicated that the compressive strength of the concrete increased rapidly within the first 7 days before gradually slowing down [8]. Steel fiber reinforced concrete (SFRC) is widely recognized for its excellent properties (Vladimir Radoji). To investigate the influence of steel fibers on the mechanical properties of concrete, steel fibers were incorporated into beams to evaluate the compressive strength of the concrete [9].
Wasim Abbass et al. conducted a comprehensive evaluation of the compressive strength and flexural strength of concrete incorporating various lengths and diameters of steel fibers, as well as different water-cement ratios. Both compressive and flexural strengths were found to be significantly improved. Additionally, they proposed an analytical model to describe the stress-strain relationship under compression in steel fiber reinforced concrete (SFRC) [10]. Ozer Zeybek et al. partially replaced cement with waste glass powder (WGP) and examined the effects of varying proportions of WGP on the compressive strength, splitting tensile strength, and flexural strength of concrete. They determined the optimal WGP ratio and developed empirical equations to predict these mechanical properties of the concrete [11]. Currently, the rapid economic development is driving a continual increase in total energy consumption, with energy use related to heating and operating buildings becoming the third largest contributor to social energy consumption [12,13]. Currently, energy savings in buildings can primarily be achieved through innovations in building materials and structures, as well as the comprehensive utilization of renewable energy sources. As a renewable energy option, solar energy is both clean and efficient. By integrating solar energy storage into building envelope structures, it is possible to significantly reduce energy consumption and meet the energy demands of buildings [14,15,16]. However, solar energy is intermittent and unpredictable, making it unavailable throughout the day. Therefore, efficient conversion of solar energy and effective energy storage solutions are essential [17]. Therefore, the photothermal performance of novel concrete materials has become a research hotspot. Al-Tamimi et al. utilized hemp concrete, which possesses low thermal conductivity and high specific heat capacity, to minimize energy loss through the building envelope. They employed modeling analysis using ANSYS Fluent software to investigate the influencing factors on energy storage and loss [18]. Chin et al. incorporated a composite material, consisting of activated carbon derived from oil palm kernel shells (OPKS) and paraffin wax, into concrete. They conducted thermogravimetric analysis (TGA) and thermal cycle tests to determine the melting temperature, latent heat, solidification temperature, and compressive strength. Their study investigated the thermal storage performance of concrete mixed with the paraffin-OPKS activated carbon composite material [19]. Chang et al. evaluated the thermal conductivity, specific heat capacity, thermal expansion coefficient, and compressive strength of concrete upon the addition of GA admixtures in varying proportions and PCM-HSB at different replacement rates. They determined the optimal ratio of GA-PEG-HSB concrete, the best replacement rate of PCM-HSB, and the most effective amount of GA [20]. Additionally, concrete, being a porous material, can improve its impermeability through the incorporation of slag, polymers, and ceramisite [21,22,23]. Pang Chen et al. utilized alkali-activated slag cementing material (AASCM), characterized by rapid hardening, early strength development, high strength, and low carbon content, for the repair of damaged concrete [24]. Through tests on water penetration, chloride ion penetration, and microanalysis, it was demonstrated that alkali-activated slag cementing material (AASCM) enhances the impermeability of repaired specimens. Wenrui Yang et al. incorporated basalt fiber (BF) at various volume ratios into concrete, and the results of permeability resistance tests indicated that BF significantly improved the overall density, permeability resistance, and corrosion resistance of the concrete [25]. Graphene possesses high thermal conductivity, a stable lattice structure, excellent heat transfer capability, and significant strength, making it an effective thermal conductivity enhancer. Its remarkable mechanical, photothermal, chemical, and electrical properties have led to its widespread application across various fields [26,27]. Shah et al. investigated the microstructure, mechanical properties, and durability of concrete enhanced with graphene and graphene-based compounds as additives. Their analysis revealed that these additives significantly improve the mechanical properties and longevity of concrete [28]. Ji et al. reviewed recent advancements in the synthesis and manufacturing of graphene nanocomposites across various energy storage systems. They also discussed the latest developments in the production and application of energy storage materials, along with the future prospects and potential challenges associated with energy storage applications [29].
The novelty of this paper lies in the integration of graphene into concrete as a photothermal material for offshore cities with high humidity levels. This study investigates the mechanical properties, thermal properties, and impermeability of the concrete, exploring the effects of graphene content and curing duration on these properties. Furthermore, the working mechanism of graphene-reinforced concrete is elucidated. The results demonstrate that the incorporation of an appropriate amount of graphene into concrete enhances its mechanical properties, photothermal performance, and impermeability.
Experimental Program
Characterization of Materials
The cement utilized in this study was P·O42.5R grade ordinary Portland cement, produced by Anhui Conch Cement Co., Ltd. The coarse sand (particle size ranging from 1 to 5 mm) and crushed stone (particle size ranging from 12 to 15 mm) were sourced from standard manufacturing facilities. Graphene was supplied by Tianjin Jiayin Nano Technology Co., Ltd.
A specific quantity of graphene was selected for subsequent analyses, and the results of these analyses are presented as follows: Transmission Electron Microscopy (TEM) was employed to observe the submicroscopic or ultrastructural characteristics of the material, facilitating a deeper understanding of its properties. X-ray Powder Diffraction (XRD) was used to analyze the crystal structure, phase composition, grain size, crystallinity, lattice parameters, crystal orientation, texture, and stress of the materials. X-ray Photoelectron Spectroscopy (XPS) enabled the determination of the chemical properties and surface composition of the samples by measuring the binding energy of electrons. Additionally, Raman Spectroscopy was utilized to investigate the molecular structure and composition of the substances.
Sample Preparation
The instruments utilized in this study include an analytical balance manufactured by Shanghai Shangping Instrument Co., Ltd., an ultrasonic material emulsion disperser (model TH-100), and an adjustable high-speed homogenizer (model FSH-2A), with daily tap water as the dispersing medium.
According to the specifications for the target test block, the mass ratios of cement, coarse sand, stone, and water are as follows: m (cement) : m (coarse sand) : m (stone) : m (water) = 1:0.58:1.39:0.47 (see Figure 1a). The total volume of the concrete mixture is 0.02 m³, resulting in a total mass of approximately 52.6 kg. The graphene contents for the target test blocks were set at 4.728 g, 8.944 g, 14.184 g, and 18.912 g. Accordingly, four groups of dispersion liquids with varying graphene concentrations were prepared, corresponding to mass ratios of cement to graphene of 1:002, 1:004, 1:006, and 1:008, respectively.To prepare the dispersion solution, each amount of graphene was first weighed using an analytical balance and placed in a 500 mL beaker. Subsequently, 400 mL of water was added, and the mixture was subjected to vibration using a 325 W ultrasonic material emulsifier for 5 minutes. This was followed by stirring with an adjustable high-speed homogenizer at a speed of 8000 rpm for 3 minutes. Finally, an additional 1038 mL of water was added, and the mixture was stirred until homogeneous, resulting in a graphene dispersion (see Figure 1b).The graphene dispersion was then mixed with the concrete, stirred at 1000 rpm for 5 minutes, and poured into a mold that had been coated with a release agent. The mixture was slightly above the upper edge of the mold before being placed on a shaking table for vibration compaction. The concrete test blocks were prepared within 3 hours post-dispersion configuration (see Figure 1c). To prevent water evaporation after the test blocks were formed, they were immediately covered with an impermeable film. The curing conditions for the test blocks were maintained at a temperature of 18°C and a relative humidity of 90%, with curing durations of 3 days, 7 days, and 28 days.
As illustrated in Figure 2, a total of 20 test blocks with dimensions of 100 mm × 100 mm × 100 mm were prepared for this experiment. Each set comprised four test blocks, including one group without graphene and four groups containing suspensions with varying graphene concentrations. The first three test blocks in each group underwent compressive testing, while the fourth test block in each group was used for photothermal and impermeability testing.
Mechanical Tests
The compressive strength of the test blocks was evaluated on the 3rd, 7th, and 28th days of curing. A rock pressure testing machine (model UH-200, manufactured by Youhongyan Measurement and Control Technology Co., Ltd.) was employed to measure the compressive strength of the cubic test blocks. The loading rate was set at 0.5 MPa/s, with force loading as the applied method, and the oil temperature maintained at 29°C. Testing was terminated upon reaching 30% of the peak force after failure. The failure process was monitored and recorded for both before and after 40% of the peak strength of the test block.
Photothermal Experiment
The amount of graphene incorporated into concrete significantly influences its photothermal conversion capacity; however, this increase in graphene content also enhances heat conduction, leading to faster heat dissipation. Consequently, a competitive interaction exists between these two properties, necessitating an examination of the impact of graphene content on the thermal characteristics of concrete.
In this study, five samples with identical curing times but varying graphene contents were subjected to photothermal experiments. As illustrated in Figure 7a, the experimental setup included a thermocouple thermometer (model: RE-Y2101B) from People Electric Appliance Group Co., Ltd., a temperature sensor, and a reflective indoor heater (rated power: 700W, model: RSN22-S07J) from Guangdong Rongsheng Electric Appliance Co., Ltd. According to Figure 7b, temperature sensors were embedded at the front, back, top, and left sides of each test block to monitor temperature variations from multiple directions. The distance between the reflective indoor heater and the test block was maintained constant throughout the experiment. Initially, the infrared light source was preheated for 1 minute, after which the test block was irradiated for 10 minutes, with temperature recordings taken every 30 seconds. Following the irradiation, the reflective indoor heater was turned off, and temperature readings continued every 30 seconds for an additional 10 minutes. To minimize potential experimental errors, the tests were conducted concurrently over three consecutive days.
Impermeability Test
Concrete is inherently porous and hydrophilic. In practical applications, water infiltration can lead to issues such as skin peeling of walls, resulting in indoor dampness and other negative effects. Consequently, it is essential to investigate the influence of graphene on the permeability of concrete test blocks [30].
Currently, various methods are available for evaluating the impermeability of concrete. In reference [31], a pore grid model was established using X-ray tomography (CT) to analyze the microstructure of concrete. The permeability coefficient obtained through numerical simulation was compared with experimental values derived from permeability tests. Reference [32] examined the permeability height of concrete via anti-seepage tests. Additionally, reference [33] emphasized that effective impermeability is crucial for the long-term durability and mechanical properties of concrete, as it helps mitigate issues such as cracking and other detrimental phenomena. As illustrated in Figure 10a, this study employed the methodology described in the literature by immersing five completely dried test blocks in water, ensuring a specified distance between the blocks. The initial water level was set 2.5 cm above the base of the test blocks.
Results and Discussion
As shown in Figure 3a, the two-dimensional lamellar structure of the graphene material is clearly visible, exhibiting areas of light and dark contrast. This variation is attributed to interactions between the graphene and the substrate, as well as thermal stress and other factors that lead to the formation of folds and ripples.
X-ray Diffraction (XRD) analysis was conducted using a 20 kV X-ray diffractometer (model DX-2700BH), with a 2θ range from 10 to 70 degrees. As depicted in Figure 3b, a narrower half-height width typically indicates a larger grain size and fewer lattice defects, suggesting that the graphene possesses a higher degree of crystallinity. Furthermore, a sharp diffraction peak is observed at an angle of 26.3°, corresponding to the graphene crystal surface. According to calculations based on Bragg’s law, the interlayer spacing of the graphene is approximately 0.34 nm.
Raman spectroscopy is an effective technique for assessing the quality of graphene by characterizing its bonding structure. Raman analysis was conducted using a LabRam HR 800 Raman spectrometer, with a scanning range of 0 to 4000 cm⁻¹. As illustrated in Figure 3c, the Raman spectrum of graphene exhibits three characteristic peaks: the D peak at 1318 cm⁻¹, the G peak at 1580 cm⁻¹, and the 2D peak at 2628 cm⁻¹ [34]. The D peak is relatively weak and corresponds to the vibrations of sp³ hybridized carbon atoms, which are typically associated with defects or edges in the graphene lattice. In contrast, the G peak is the sharpest and most intense, representing the fundamental lattice vibration mode of graphene, arising from the in-plane vibrations of sp² hybridized carbon atoms. The 2D peak is a symmetric single peak that results from a biphonon resonance process; it possesses high intensity and serves as a key indicator for determining the number of graphene layers.The intensity ratios ( I(D)/I(G) ) and ( I(2D)/I(G) ) are used to assess the quality of graphene. The intensity ratio of the D-band to the G-band, I(D)/I(G)=0.83, indicates a low defect density and high crystallinity, confirming the high quality of the CVD-grown graphene. Furthermore, the intensity ratio of the 2D-band to the G-band, I(2D)/I(G)=2.66, suggests an ideal number of layers and superior material quality, demonstrating its suitability for the present study [35,36].
X-ray Photoelectron Spectroscopy (XPS) analysis was conducted using a PHI Quantera XPS system to determine the elemental composition of the graphene. As presented in Figure 4, curve fitting of the high-resolution XPS spectra revealed peak intensities for the elements O, N, and C at 20455.58, 54383.66, and 215663.8, respectively, with corresponding binding energies of 532.36 eV for O, 399.26 eV for N, and 284.83 eV for C. The C1s spectral peak is particularly significant, as it represents the 1s electron binding energy of carbon atoms in graphene. The symmetry and sharpness of the C1s peak indicate that the carbon atoms are in a highly uniform sp² hybridization state and exhibit good crystallinity.
Mechanical Property
As illustrated in Figure 5a, the test block doped with graphene exhibited fewer cracks and maintained better structural integrity after failure, suggesting that graphene enhances the strength and toughness of concrete, thereby inhibiting the propagation of macroscopic cracks and preventing the transition of microscopic cracks to the macroscopic level.
Figure 5b presents the measurements of the height of the damaged test blocks, which were recorded as 8.3 cm, 9.0 cm, 9.5 cm, 10.0 cm, and 8.2 cm, respectively. From Figure 5c, it is evident that, in terms of compressive failure, test block numbered 2-1 displayed a larger size, improved compactness, and superior integrity compared to the other test blocks after failure, indicating its excellent compressive performance.
In Figure 5c, the failure mode of the test block without graphene predominantly initiated at the edges and corners, with cracks progressively extending toward the opposite end, resulting in the detachment of large fragments during failure. In contrast, the damage observed in the graphene-doped test block began with only a few small cracks; the extent of crack propagation was limited, and the overall integrity of the block remained good upon failure, with only a minor number of small fragments detaching.
In summary, the incorporation of an appropriate amount of graphene significantly enhances the strength and structural density of concrete.
The stress-strain curve provides a comprehensive representation of the mechanical properties and deformation characteristics of materials under stress. As illustrated in Figure 6a, the stress-strain curve of the undoped graphene test block exhibits a relatively low slope in the initial rising section, whereas the curve for the graphene-doped test block demonstrates a steeper slope in the same region. This indicates that the incorporation of a certain amount of graphene enhances the elastic modulus of concrete, allowing it to effectively bear and transfer stress, thereby improving the compressive strength of the material.According to Figure 6b, after 28 days of curing, the compressive strength of the graphene-modified concrete increased by as much as 44% compared to the control group. However, it is crucial to maintain an appropriate concentration of graphene dispersion; excessively high concentrations can lead to a reduction in the strength of the test block. This reduction occurs because, while graphene effectively transfers stress and enhances the toughness of concrete, it can also promote crack bridging and improve hydration, thereby increasing compressive strength.Nonetheless, the relationship between graphene content and compressive strength is complex, influenced by multiple mechanisms. When present in excessive amounts, graphene tends to agglomerate, leading to uneven dispersion. This agglomeration can interfere with the cement hydration process due to the coating of cement particles and can result in the formation of additional pores and weak interfaces due to stacking, ultimately reducing the compressive strength of the concrete. Thus, it is evident that the correlation between graphene content and concrete strength is not linear.
Photothermal Property
Figure 7.
a) A physical image of the experimental groups. b) A schematic diagram of the experimental groups. C) The temperature changes of the front, back, upper and left surfaces of test blocks 1-4 with time.
Figure 7.
a) A physical image of the experimental groups. b) A schematic diagram of the experimental groups. C) The temperature changes of the front, back, upper and left surfaces of test blocks 1-4 with time.
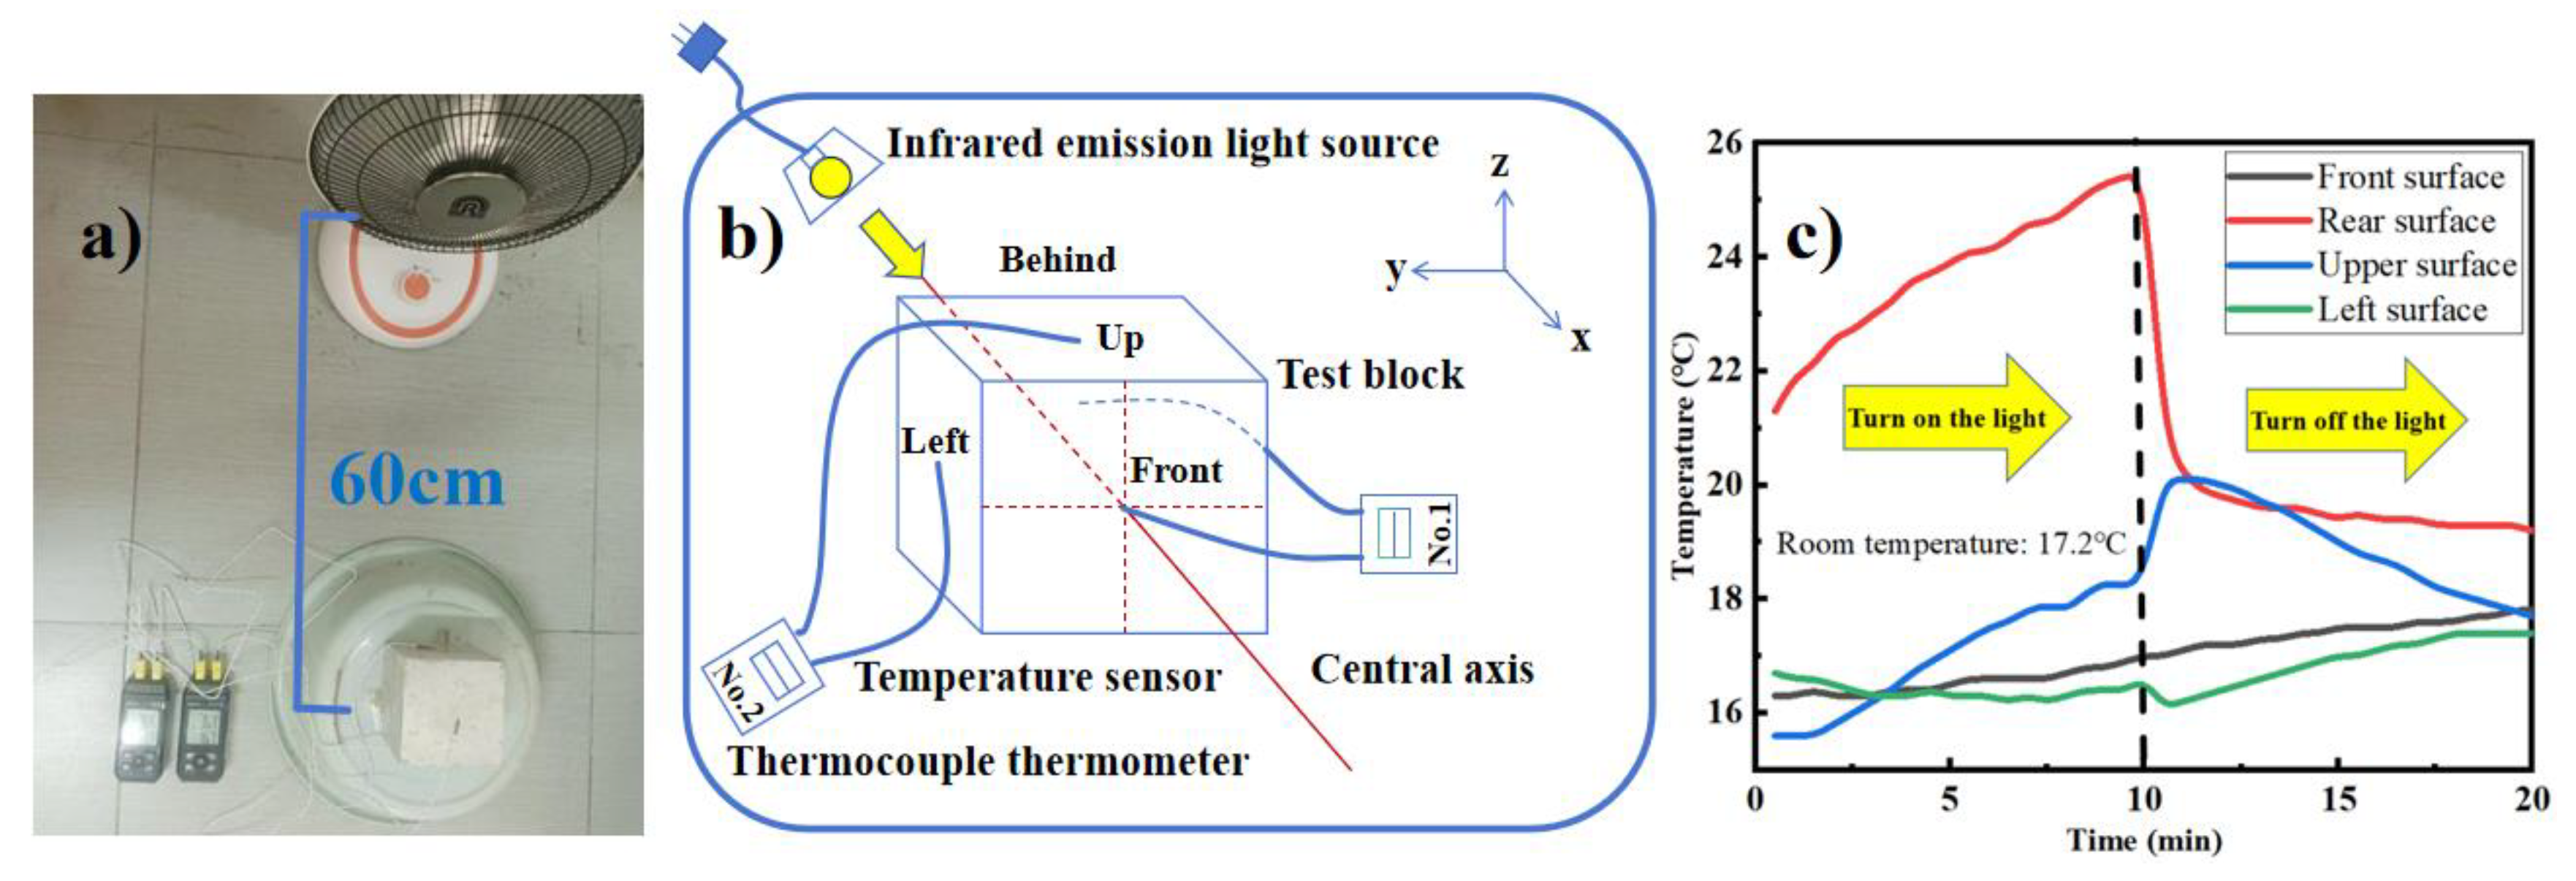
The temperature variations of test blocks 1-4, which did not contain graphene, were examined during both the placement and removal of the light source. As shown in Figure 7c, during the first 10 minutes, under the influence of the light source, the temperature of the surface and the upper surface of the test blocks consistently increased, while the temperature of the left surface gradually decreased. In the final 10 minutes, after the light source was removed, the temperature of the back surface of the test block continued to decline. The upper surface temperature initially rose before subsequently decreasing, influenced by heat conduction within the test block, while the temperature of the left surface slowly increased. Throughout the entire process, the temperature of the front surface exhibited a continuous rise.
Given that the back surface of the test block is directly exposed to the light source, its temperature change is crucial for evaluating the heat absorption performance of the test block. To provide a direct reflection of this thermal performance, we will discuss the peak temperature attained by each test block during irradiation. According to Figure 8a, with increasing graphene content, the surface temperature of the test blocks demonstrated an upward trend. This indicates that graphene significantly enhances the heat absorption capacity of the test blocks, with the heat absorption capacity of the graphene-modified concrete reaching up to 7.5% higher than that of the control concrete.
The investigation of surface temperature variations in the test blocks facilitates the analysis of differences in heat release performance among the various samples. Below, we analyze the peak temperature of the upper surface of the test blocks. As illustrated in Figure 8b, the peak surface temperature of the graphene-doped test blocks is significantly lower than that of the undoped test blocks. This finding suggests that graphene enhances the dissipation of heat from the test block to lower temperature regions, with the graphene content in test blocks 3 and 4 proving particularly effective for heat release. Consequently, the heat release capacity of the graphene-modified concrete is reduced by up to 5.5% relative to that of the control concrete.
To assess the thermal storage performance of the test blocks over an extended duration, the blocks were subjected to irradiation from a light source for 1 hour, and the temperatures of the front and back surfaces were recorded at 5-minute intervals. Following the removal of the light source, temperature readings were taken every minute. This temperature variation study aids in analyzing the differences in heat storage performance across the different test blocks. As shown in Figure 9a, the peak surface temperatures of test blocks from groups 2 to 4 are significantly higher than those of the test blocks in group 1. This indicates that a certain amount of graphene improves the heat storage capacity of concrete.During the cooling phase, the surface temperatures of the first and fifth test blocks exhibited a sharp decline. In contrast, the surface temperatures of the second and third groups dropped more gradually, further demonstrating that the incorporation of graphene enhances the thermal storage capacity of the concrete. Figure 9b indicates that the maximum heat storage capacity is achieved when the mass ratio of cement to graphene is 1:004, resulting in a heat storage capacity that is up to 13% greater than that of the control concrete.
In summary, graphene exhibits remarkable photothermal conversion performance when utilized for wall insulation. Its high specific surface area enables concrete to absorb and store a significant amount of heat while efficiently dispersing that heat across one side of the wall, thereby preventing local heat accumulation. Additionally, graphene possesses a broad-spectrum light absorption capability (covering ultraviolet, visible, and infrared wavelengths), which substantially enhances the wall's ability to capture sunlight. When there is a substantial temperature differential between indoor and outdoor environments, and heat is conducted through the wall, graphene facilitates a more uniform distribution of heat within the wall structure, thereby reducing heat loss to the exterior and moderating temperature fluctuations. However, excessive amounts of graphene can lead to the formation of micron-sized agglomerates, which diminish the specific surface area. This agglomeration can also induce light scattering, resulting in a reduced effective path for photothermal conversion. Furthermore, the poor interface between the aggregates and the cement matrix can create a thermal resistance layer, ultimately weakening the overall heat transfer efficiency.
Impermeability
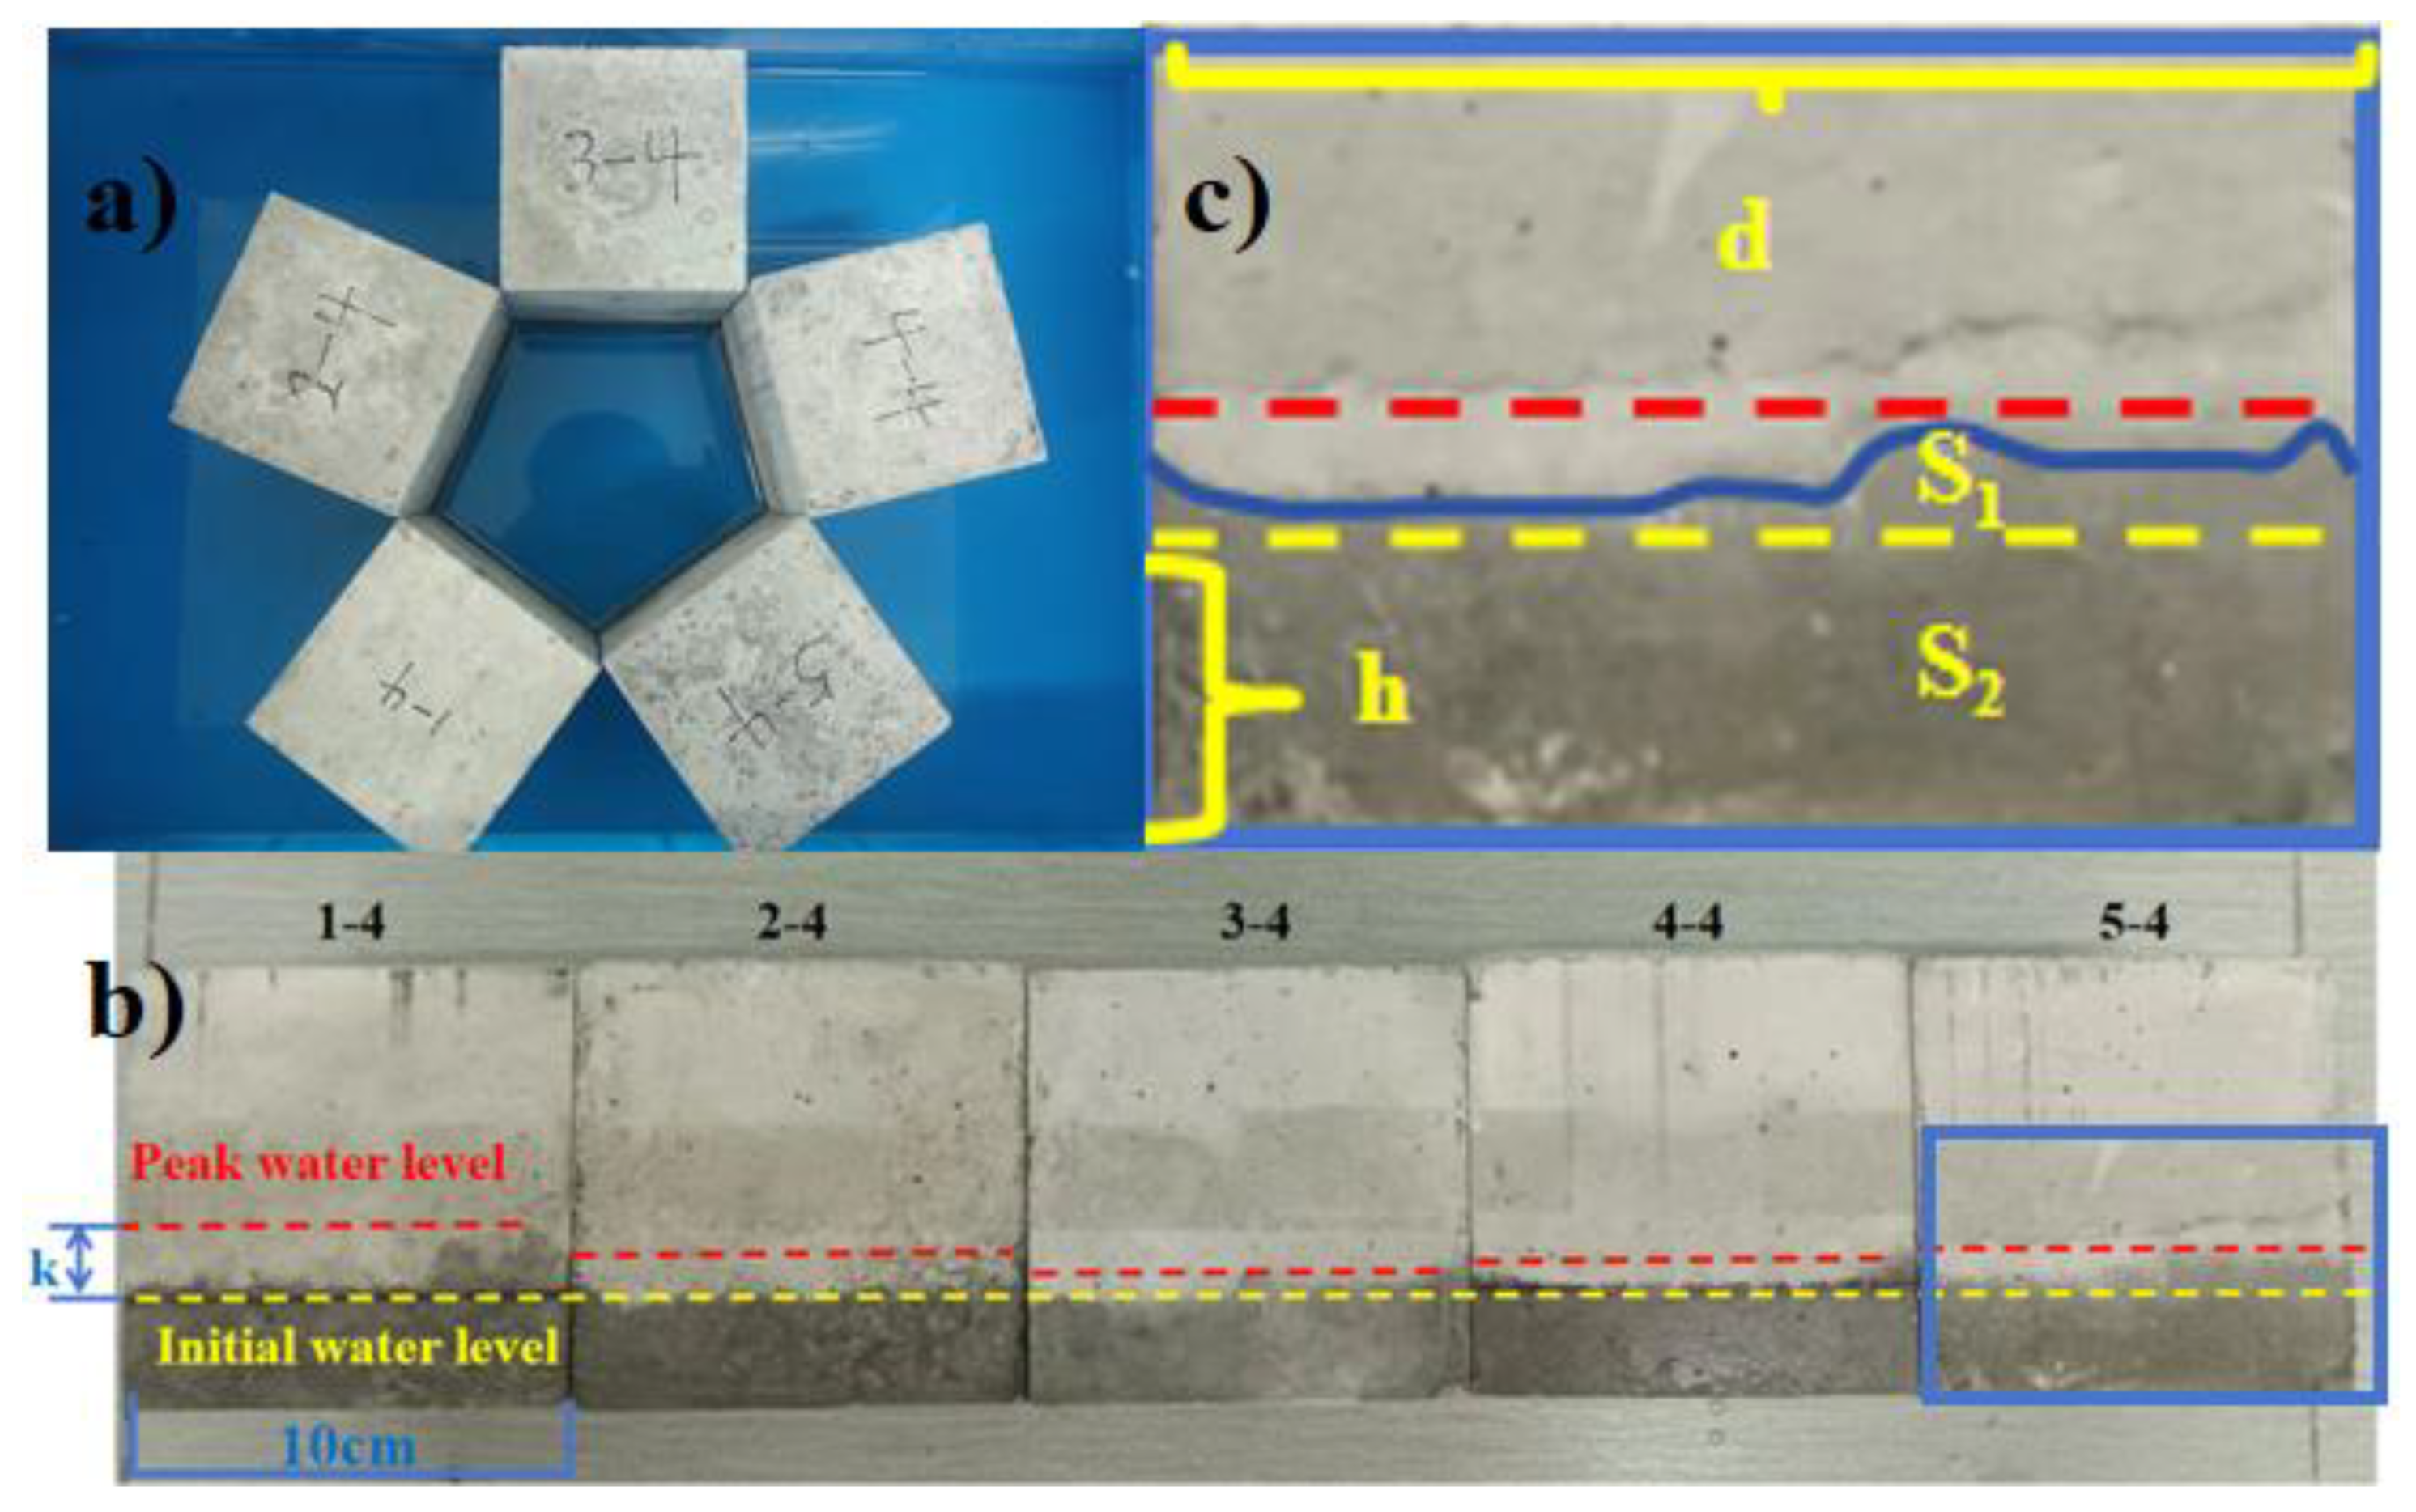
Under the combined influence of surface tension and capillary action, water ascends beyond the initial water level. The vertical distance between the initial water level and the maximum water level attained is defined as the penetration depth. Both the peak water level and the penetration depth are recorded after a 7-day period, with the maximum penetration depth denoted as k(see Figure 10b).
As illustrated in Figure 10c, the surface corresponding to the maximum penetration depth (k) for each test specimen is selected as the analysis plane. The area infiltrated by water on this surface is designated as the seepage area (S). The seepage area is quantitatively assessed to facilitate a comparative analysis of the seepage performance across different test specimens, thereby elucidating the impact of graphene on the permeability resistance of concrete. The seepage area is calculated using the following formula:
where (S) represents the water seepage area,(S1) denotes the corresponding seepage area at the initial water level, as illustrated in Figure d,(S2) represents the seepage area after the test block was immersed in water for 7 days, showing an increase relative to S1, as shown in Figure d,(h) is initial infiltrating height of test block and (d) is test block side length,(s) represents the area of a square with a side length of 1c,(n) represents the number of squares in S2 with a side length of 1cm. To facilitate the calculation of S2, we divide the region into a number of squares of area (s). Squares smaller than half of s are ignored, and squares larger than half of s are counted as 1.
Figure 10.
a) Impermeability test diagram. b) The test block was soaked in water for 4 days. c) Water seepage area diagram.
Figure 10.
a) Impermeability test diagram. b) The test block was soaked in water for 4 days. c) Water seepage area diagram.
As shown in Table 1, the penetration depth (k) of graphene-doped test blocks is significantly lower compared to that of undoped test blocks. Moreover, the water seepage area of test blocks 2-4, 3-4, and 5-4 is markedly reduced relative to that of test blocks 1-4 and 5-4. These findings indicate that graphene effectively fills the internal pores of concrete, enhancing its microstructure and thereby imparting improved permeability resistance. Furthermore, graphene promotes the directional growth of C-S-H gel on its surface, forming a denser network structure that significantly reduces the infiltration path of ions.There exists an optimal dosage range for graphene to enhance the impermeability of concrete. Within this range, graphene is uniformly dispersed, and the most pronounced improvement in impermeability is observed at a cement-to-graphene mass ratio of 1:0.04, where the permeability is reduced by approximately 200%. However, when the mass ratio of cement to graphene increases to 1:0.08, the permeability resistance of the test blocks diminishes due to the formation of local weak interfaces, interfacial defects, and graphene agglomeration, leading to a significant increase in the seepage area.
Conclusions
In conclusion, this study investigates the performance of graphene-reinforced concrete, which is influenced by multiple mechanisms, including physical filling, binding with cement hydration products, heat conduction, bridging, and stress dispersion. The incorporation of an optimal amount of graphene into concrete significantly enhances its mechanical, photothermal, and impermeability properties. Compared to the control group, the compressive strength of graphene-reinforced concrete increased by 44%. In terms of photothermal performance, the heat absorption capacity improved by up to 7.5%, while the heat release capacity decreased by up to 5.5%, resulting in an overall increase in heat storage capacity by up to 13%. When applied to building walls, this material can effectively reduce the heat and cold loads of the building, decrease cooling and heating demands, enhance the thermal regulation performance of internal walls, and improve indoor comfort. Additionally, this material shows potential for applications in oil exploitation and other fields. Regarding impermeability, the water permeability of graphene-reinforced concrete was significantly reduced by approximately 200%, making it suitable for use in building walls, reclamation projects, and other applications where water infiltration needs to be minimized. These findings demonstrate the multifunctional benefits of graphene-reinforced concrete, offering significant advancements in both structural and environmental performance.
Author Contributions
Conceptualization,JS.; methodology, J.S. and M.W.; validation, M.Wand P.W; resources, J.S.; data curation, M.W. and Y.W; writing—original draft, M.W. and M.Y. writing—review and editing, M.W. ,D.Z., X.C. and W.D. All authors have read and agreed to the publishedversion of the manuscript.
Funding
This study is supported by the Natural Science Foundation of Tianjin (Fund No. 24JCYBJC00610).
Data Availability Statement
The raw data supporting the conclusions of this article will be madeavailable by the authors on request.
Conflicts of Interest
The authors declare no conflicts of interest.
References
- Seifert W, Lieboldt M. Ressourcenverbrauch im globalen Stahlbetonbau und Potenziale der Carbonbetonbauweise: globale Herausforderungen des Bauwesens[J]. Beton-und Stahlbetonbau, 2020, 115(6): 469-478. https://onlinelibrary.wiley.com/doi/10.1002/best.201900094.
- Li W, Lin X, Bao D W, et al. A review of formwork systems for modern concrete construction[C]//Structures. Elsevier, 2022, 38: 52-63. https://www.sciencedirect.com/science/article/abs/pii/S2352012422000911.
- Sosoi G, Abid C, Barbuta M, et al. Experimental investigation on mechanical and thermal properties of concrete using waste materials as an aggregate substitution[J]. Materials, 2022, 15(5): 1728. https://www.mdpi.com/1996-1944/15/5/1728.
- Leithy M, Gomaa E, Gheni A A, et al. Utilizing waste latex paint toward improving the performance of concrete[J]. Construction and Building Materials, 2023, 391: 131661. https://www.sciencedirect.com/science/article/abs/pii/S0950061823013740.
- Li M, Lu Y, Liu Y, et al. Influence of the Steel Slag Particle Size on the Mechanical Properties and Microstructure of Concrete[J]. Sustainability, 2024, 16(5): 2083. https://www.mdpi.com/2071-1050/16/5/2083.
- Long W, Wang Y. Effect of pine needle fibre reinforcement on the mechanical properties of concrete[J]. Construction and Building Materials, 2021, 278: 122333. https://www.sciencedirect.com/science/article/abs/pii/S0950061821000933.
- Lin H, Zhu B, Yuan J, et al. Study on the impact of HTPP fibers on the mechanical properties of ceramsite concrete[J]. Case Studies in Construction Materials, 2023, 19: e02471. https://www.x-mol.com/paper/1749832109895946240?adv.
- Nguyen T T H, Phan D H, Mai H H, et al. Investigation on compressive characteristics of steel-slag concrete[J]. Materials, 2020, 13(8): 1928. https://www.mdpi.com/1996-1944/13/8/1928.
- Radojičić V, Radulović R, Tarić M, et al. The influence of the steel fibers on improvement of mechanical characteristic of concrete[J]. Mechanics Based Design of Structures and Machines, 2022, 50(8): 2929-2939. https://www.tandfonline.com/doi/full/10.1080/15397734.2020.1798782.
- Abbass W, Khan M I, Mourad S. Evaluation of mechanical properties of steel fiber reinforced concrete with different strengths of concrete[J]. Construction and building materials, 2018, 168: 556-569. https://www.sciencedirect.com/science/article/abs/pii/S0950061818304136.
- Zeybek Ö, Özkılıç Y O, Karalar M, et al. Influence of replacing cement with waste glass on mechanical properties of concrete[J]. Materials, 2022, 15(21): 7513. https://www.mdpi.com/1996-1944/15/21/7513.
- Raatikainen M, Skön J P, Leiviskä K, et al. Intelligent analysis of energy consumption in school buildings[J]. Applied energy, 2016, 165: 416-429. https://www.sciencedirect.com/science/article/abs/pii/S0306261915016451.
- Chwieduk D A. Towards modern options of energy conservation in buildings[J]. Renewable Energy, 2017, 101: 1194-1202. https://www.sciencedirect.com/science/article/abs/pii/S0960148116308515?via%3Dihub.
- Long J, Lu J, Jiang M, et al. Study on solar energy utilization characteristics of a solar building integrated wall[J]. Applied Thermal Engineering, 2020, 175: 115289. https://www.x-mol.com/paper/1254945821461209088?adv.
- Peng J, Yan J, Zhai Z, et al. Solar energy integration in buildings[J]. Applied Energy, 2020, 264: 114740. https://www.sciencedirect.com/science/article/abs/pii/S030626192030252X?via%3Dihub.
- Yin Y, Chen H, Zhao X, et al. Solar-absorbing energy storage materials demonstrating superior solar-thermal conversion and solar-persistent luminescence conversion towards building thermal management and passive illumination[J]. Energy Conversion and Management, 2022, 266: 115804. https://www.sciencedirect.com/science/article/abs/pii/S0196890422006008.
- Qiao X, Kong X, Fan M. Phase change material applied in solar heating for buildings: A review[J]. Journal of Energy Storage, 2022, 55: 105826. https://www.sciencedirect.com/science/article/abs/pii/S2352152X2201814X.
- Al-Tamimi A S, Qasem N A A, Bindiganavile V. Thermal performance evaluation of hempcrete masonry walls for energy storage in cold weather[J]. Applied Thermal Engineering, 2024, 248: 123304. https://www.x-mol.com/paper/1786861385353375744?adv.
- Chin C O, Yang X, Paul S C, et al. Development of thermal energy storage lightweight concrete using paraffin-oil palm kernel shell-activated carbon composite[J]. Journal of Cleaner Production, 2020, 261: 121227. https://www.sciencedirect.com/science/article/abs/pii/S0959652620312749.
- Chang H, Jiang S, Wang H, et al. Experimental study on the performance of phase change energy storage concrete for energy piles based on Gum Arabic and PEG-600[J]. Geothermics, 2023, 114: 102802.
- Guo B, Wang C, Ma X, et al. Research on Impermeability of underwater non-dispersible concrete in saline soil[J]. Materials, 2022, 15(22): 7915. https://www.sciencedirect.com/science/article/pii/S0375650523001566.
- Tan B, Qu L, Xia Y, et al. Experimental Study on Improving the Impermeability of Concrete under High-Pressure Water Environments Using a Polymer Coating[J]. Applied Sciences, 2024, 14(18): 8507. https://www.mdpi.com/2076-3417/14/18/8507.
- Yan S, Zhang M. Study on anti-permeability of specified density concrete[C]//IOP Conference Series: Materials Science and Engineering. IOP Publishing, 2020, 758(1): 012072. https://iopscience.iop.org/article/10.1088/1757-899X/758/1/012072.
- Chen P, Li Y, Zhang J, et al. Influence of interface agent and form on the bonding performance and impermeability of ordinary concrete repaired with alkali-activated slag cementitious material[J]. Journal of Building Engineering, 2024, 94: 110043. https://www.sciencedirect.com/science/article/abs/pii/S2352710224016115?via%3Dihub.
- Yang W, Huang Y, Tang Z, et al. Impermeability performance and corrosion resistance mechanism of basalt fiber recycled concrete under the coastal tidal environment[J]. Construction and Building Materials, 2024, 411: 134510. https://www.sciencedirect.com/science/article/abs/pii/S0950061823042290?via%3Dihub.
- Khabisi M A, Roudini G, Barahuie F, et al. Evaluation of phase change material-graphene nanocomposite for thermal regulation enhancement in buildings[J]. Heliyon, 2023, 9(11). https://www.cell.com/heliyon/fulltext/S2405-8440(23)08907-7?_returnURL=https%3A%2F%2Flinkinghub.elsevier.com%2Fretrieve%2Fpii%2FS2405844023089077%3Fshowall%3Dtrue.
- Singh N, Sharma V, Kapoor K. Graphene in construction: enhancing concrete and mortar properties for a sustainable future[J]. Innovative Infrastructure Solutions, 2024, 9(11): 428. https://link.springer.com/article/10.1007/s41062-024-01719-8?utm_source=xmol&utm_medium=affiliate&utm_content=meta&utm_campaign=DDCN_1_GL01_metadata.
- Shah A H, Rasool F, Mir S B, et al. Enhancing concrete properties with graphene and graphene-based additives: a comprehensive analysis of their effect on microstructure and macrostructure of concrete[J]. Iranian Journal of Science and Technology, Transactions of Civil Engineering, 2024, 48(4): 1817-1836. https://link.springer.com/article/10.1007/s40996-023-01313-5?utm_source=xmol&utm_medium=affiliate&utm_content=meta&utm_campaign=DDCN_1_GL01_metadata.
- Ji L, Meduri P, Agubra V, et al. Graphene-based nanocomposites for energy storage[J]. Advanced Energy Materials, 2016, 6(16): 1502159. https://advanced.onlinelibrary.wiley.com/doi/abs/10.1002/aenm.201502159.
- Xu K, Ren S, Song J, et al. Colorful superhydrophobic concrete coating[J]. Chemical engineering journal, 2021, 403: 126348. https://www.sciencedirect.com/science/article/abs/pii/S1385894720324761.
- He K, Ye C, Deng Y, et al. Study on the microscale structure and anti-seepage properties of plastic concrete for cut-off walls modified with silica fume: Experiment and modelling[J]. Construction and Building Materials, 2020, 261: 120489. https://www.sciencedirect.com/science/article/abs/pii/S0950061820324946?via%3Dihub.
- Zhang B, Li Q, Ma R, et al. An experimental investigation on the impermeability and durability of concrete with a novel and multifunctional hydrophobic admixture addition[J]. Structural Concrete, 2022, 23(2): 836-848. https://onlinelibrary.wiley.com/doi/abs/10.1002/suco.202100263.
- Dimov D, Amit I, Gorrie O, et al. Ultrahigh performance nanoengineered graphene–concrete composites for multifunctional applications[J]. Advanced functional materials, 2018, 28(23): 1705183. https://advanced.onlinelibrary.wiley.com/doi/full/10.1002/adfm.201705183.
- Prasad A, Chaichi A, Mahigir A, et al. Ripple mediated surface enhanced Raman spectroscopy on graphene[J]. Carbon, 2020, 157: 525-536. https://www.sciencedirect.com/science/article/abs/pii/S0008622319309923?via%3Dihub.
- Khan M A, Zhang B, Ahmad M, et al. Optimizing concrete sustainability with bagasse ash and stone dust and its impact on mechanical properties and durability[J]. Scientific reports, 2025, 15(1): 1385.
- Hamed N, Serag M I, El-Attar M M, et al. High early strength concrete incorporating waste derived nanomaterials for sustainable construction[J]. Scientific Reports, 2024, 14(1): 30602. https://www.nature.com/articles/s41598-024-81178-4?utm_source=xmol&utm_medium=affiliate&utm_content=meta&utm_campaign=DDCN_1_GL01_metadata_scirep.
Figure 1.
Test block preparation flow chart. a) Material preparation. b) Graphene dispersion configuration. c) The test block was prepared by mixing the materials and graphene dispersion.
Figure 1.
Test block preparation flow chart. a) Material preparation. b) Graphene dispersion configuration. c) The test block was prepared by mixing the materials and graphene dispersion.
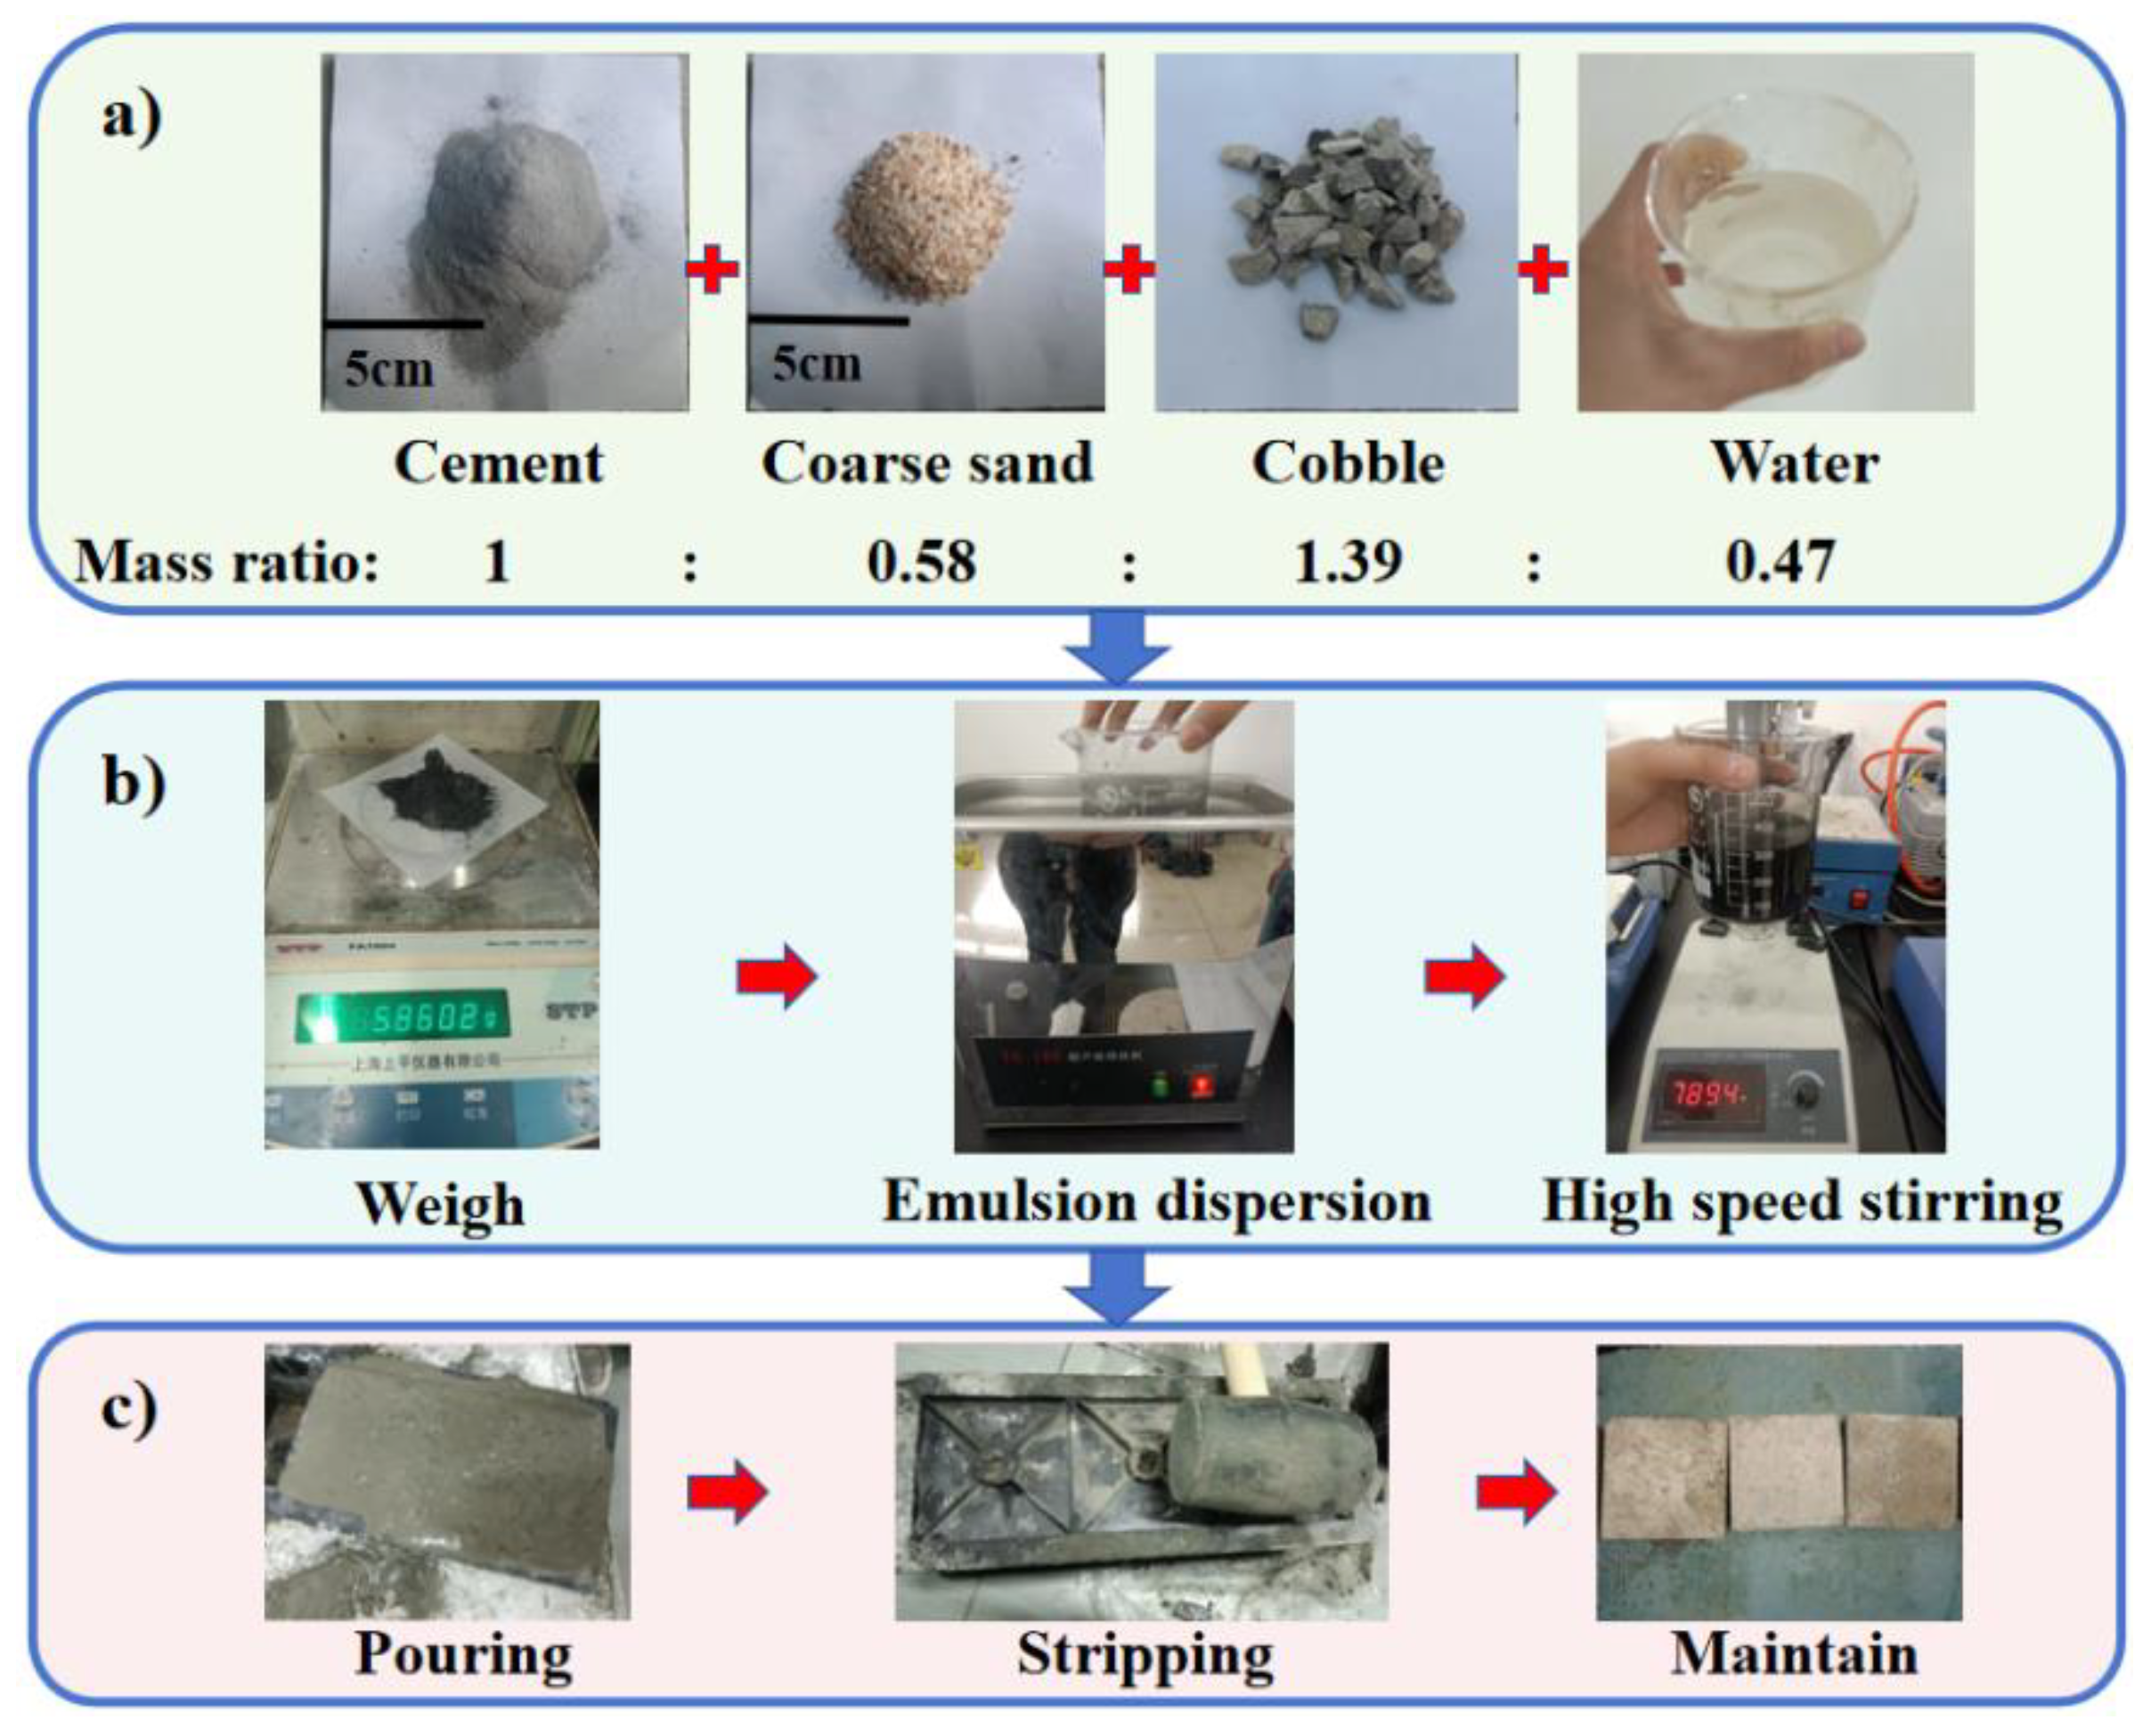
Figure 2.
Block grouping.
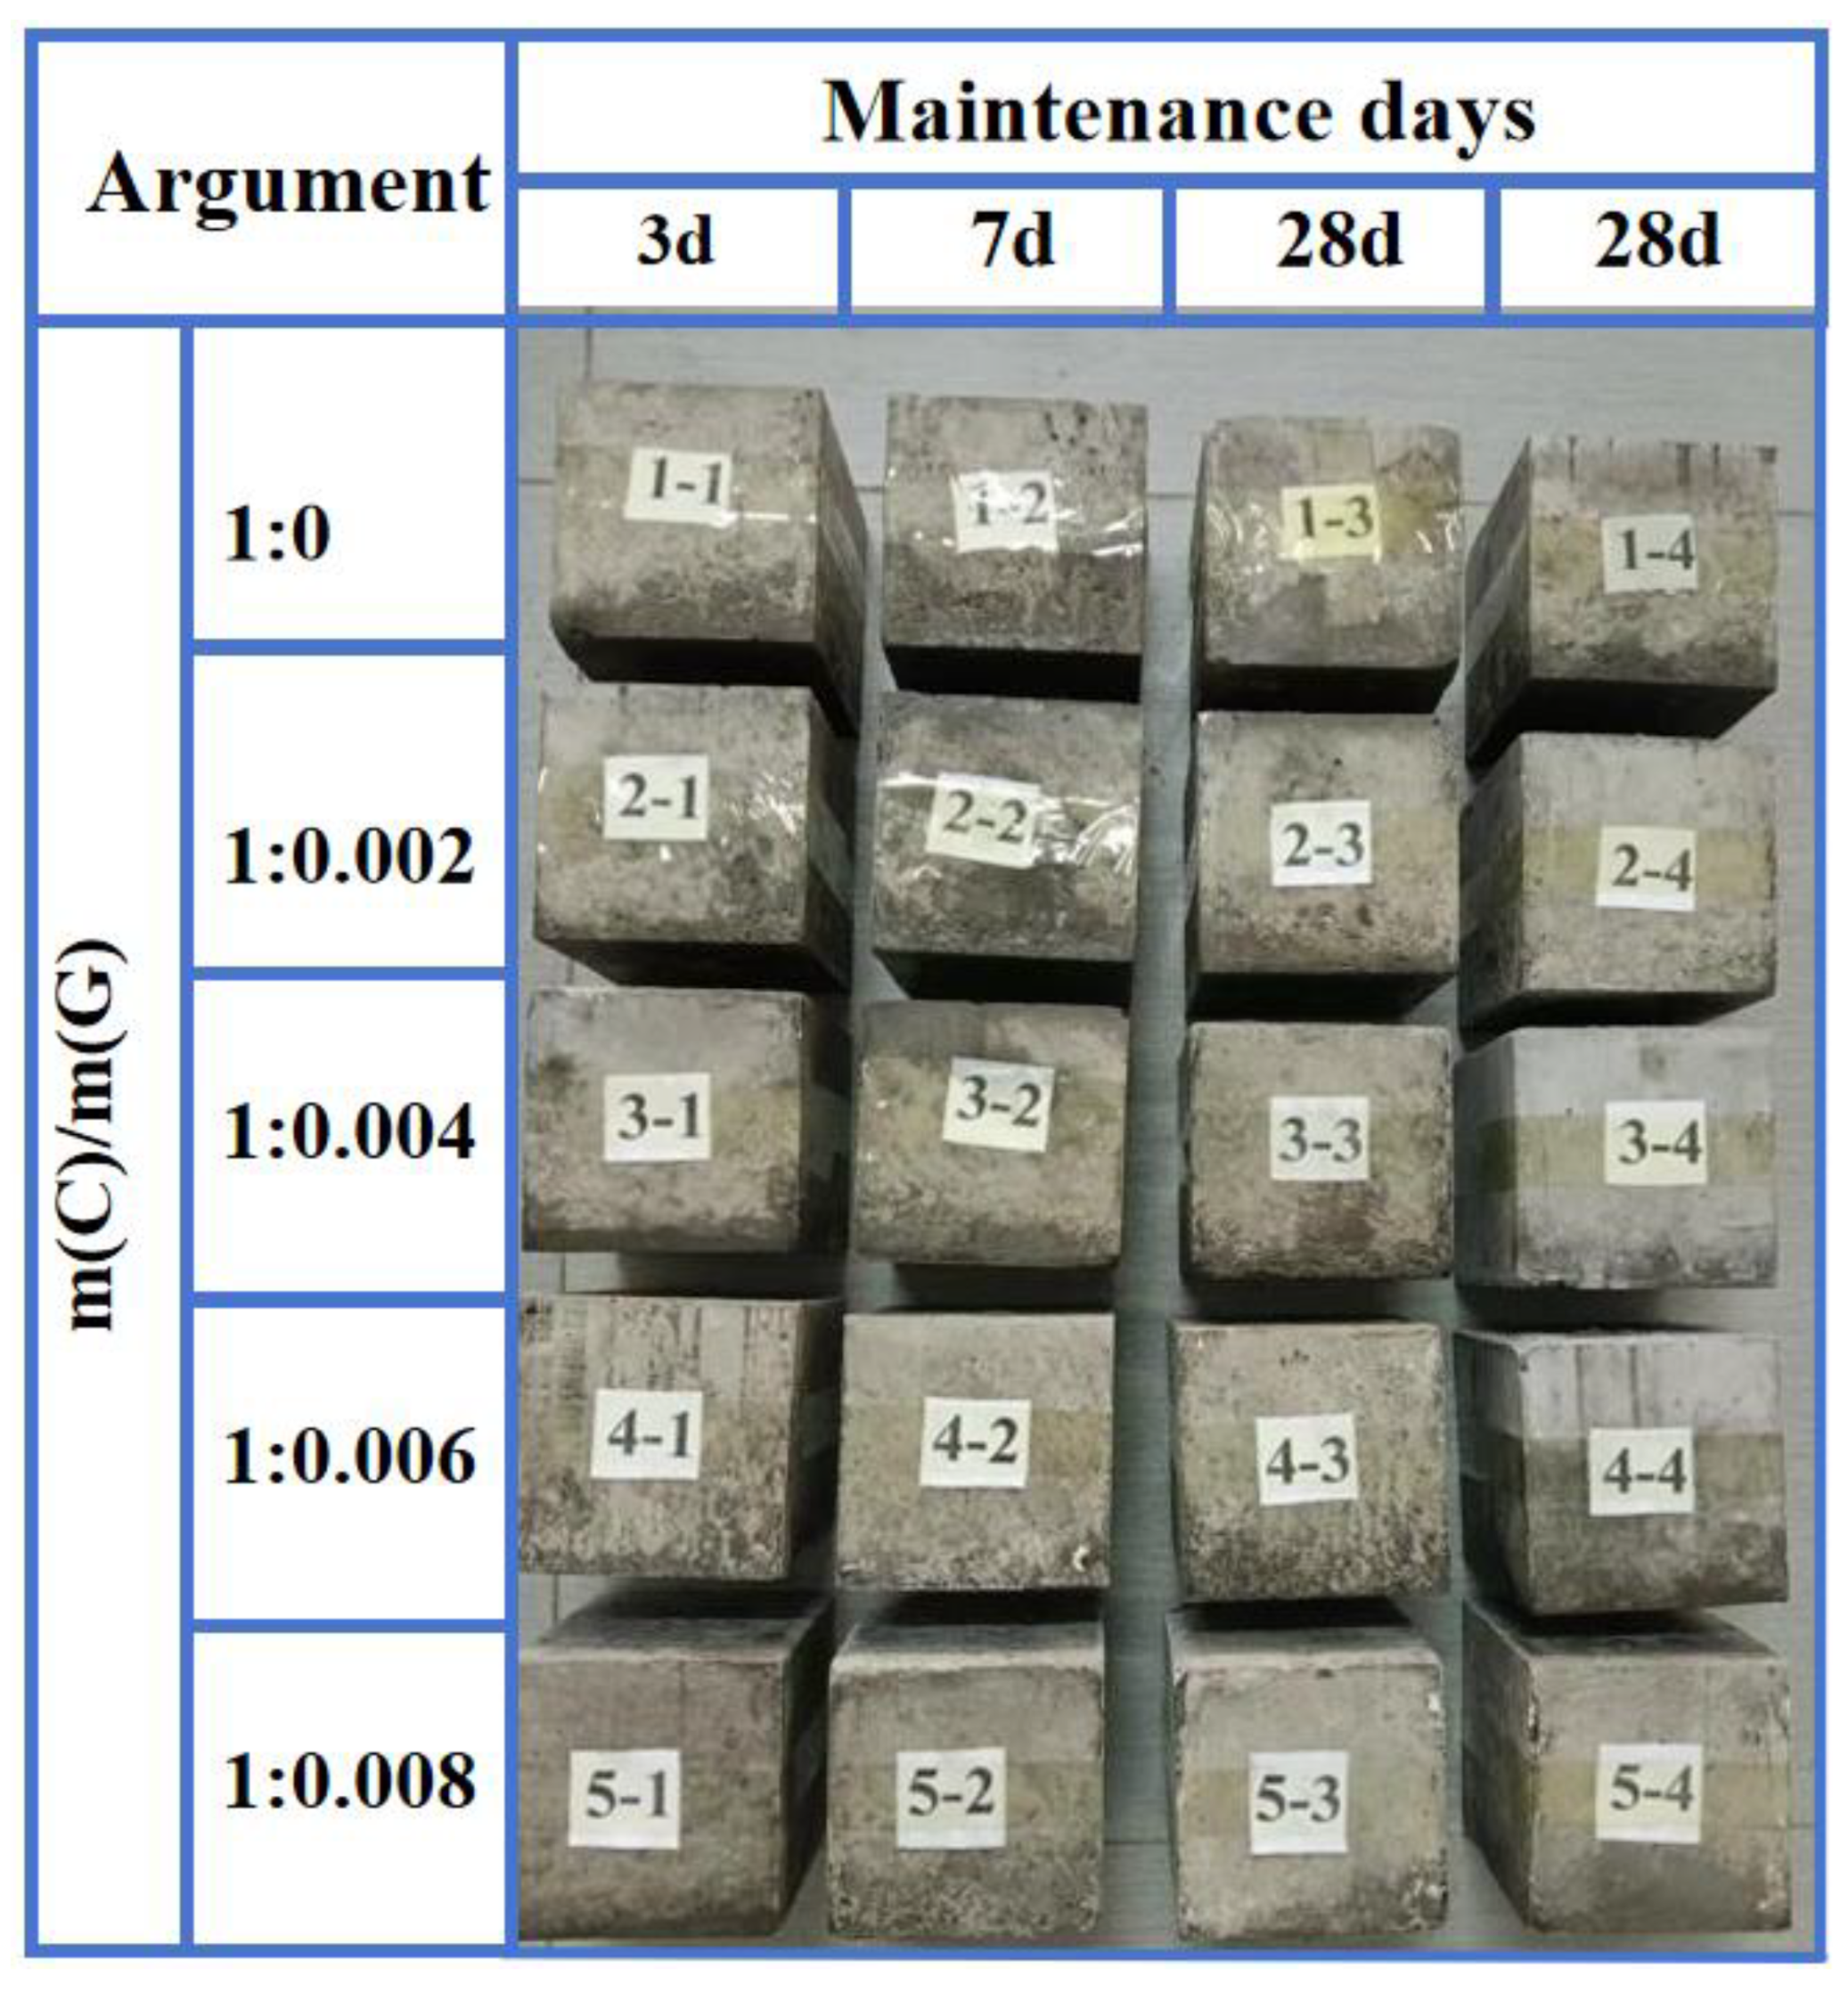
Figure 3.
a) TEM image of graphene. b) XRD diffraction image of graphene. c) Raman spectrum of graphene.
Figure 3.
a) TEM image of graphene. b) XRD diffraction image of graphene. c) Raman spectrum of graphene.
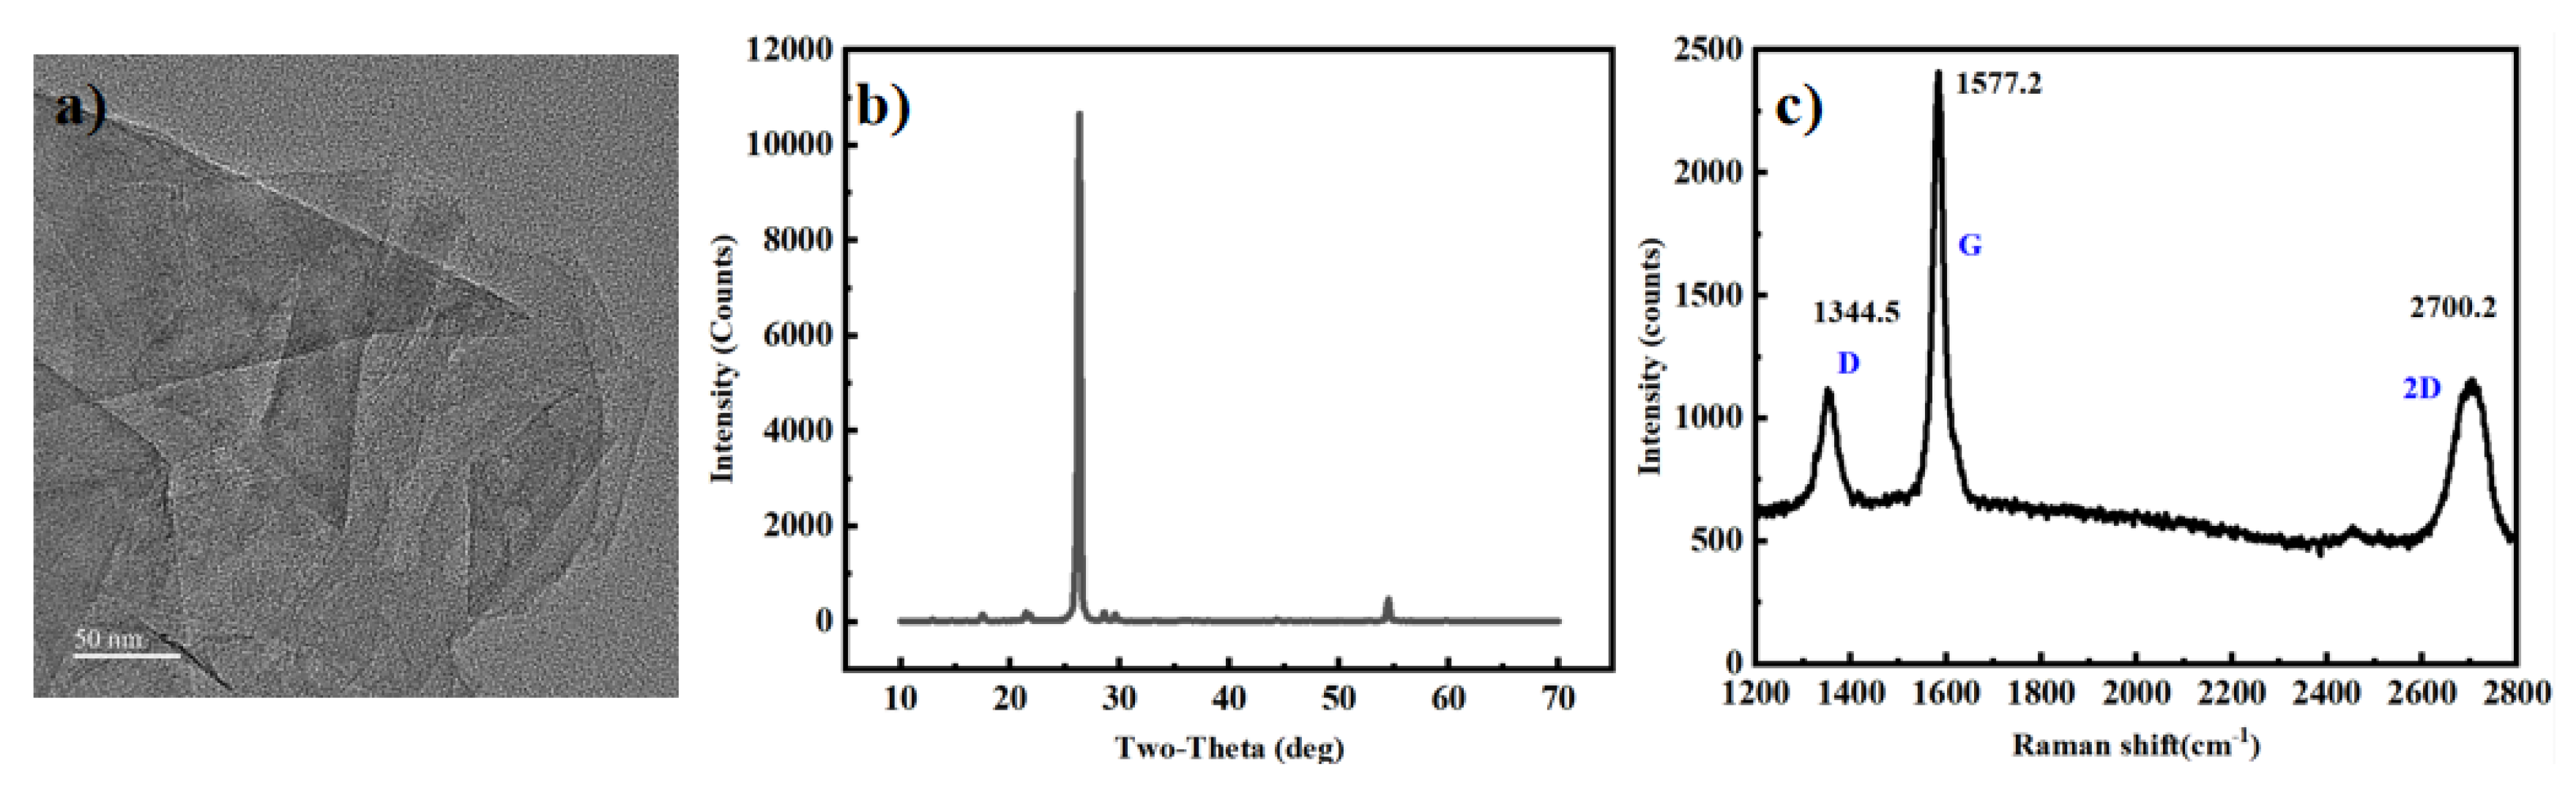
Figure 4.
a) Graphene XPS superposition spectrogram. b) Spectrum of O element in graphene. c) N spectrum in graphene. d) Spectrum of C element in graphene.
Figure 4.
a) Graphene XPS superposition spectrogram. b) Spectrum of O element in graphene. c) N spectrum in graphene. d) Spectrum of C element in graphene.
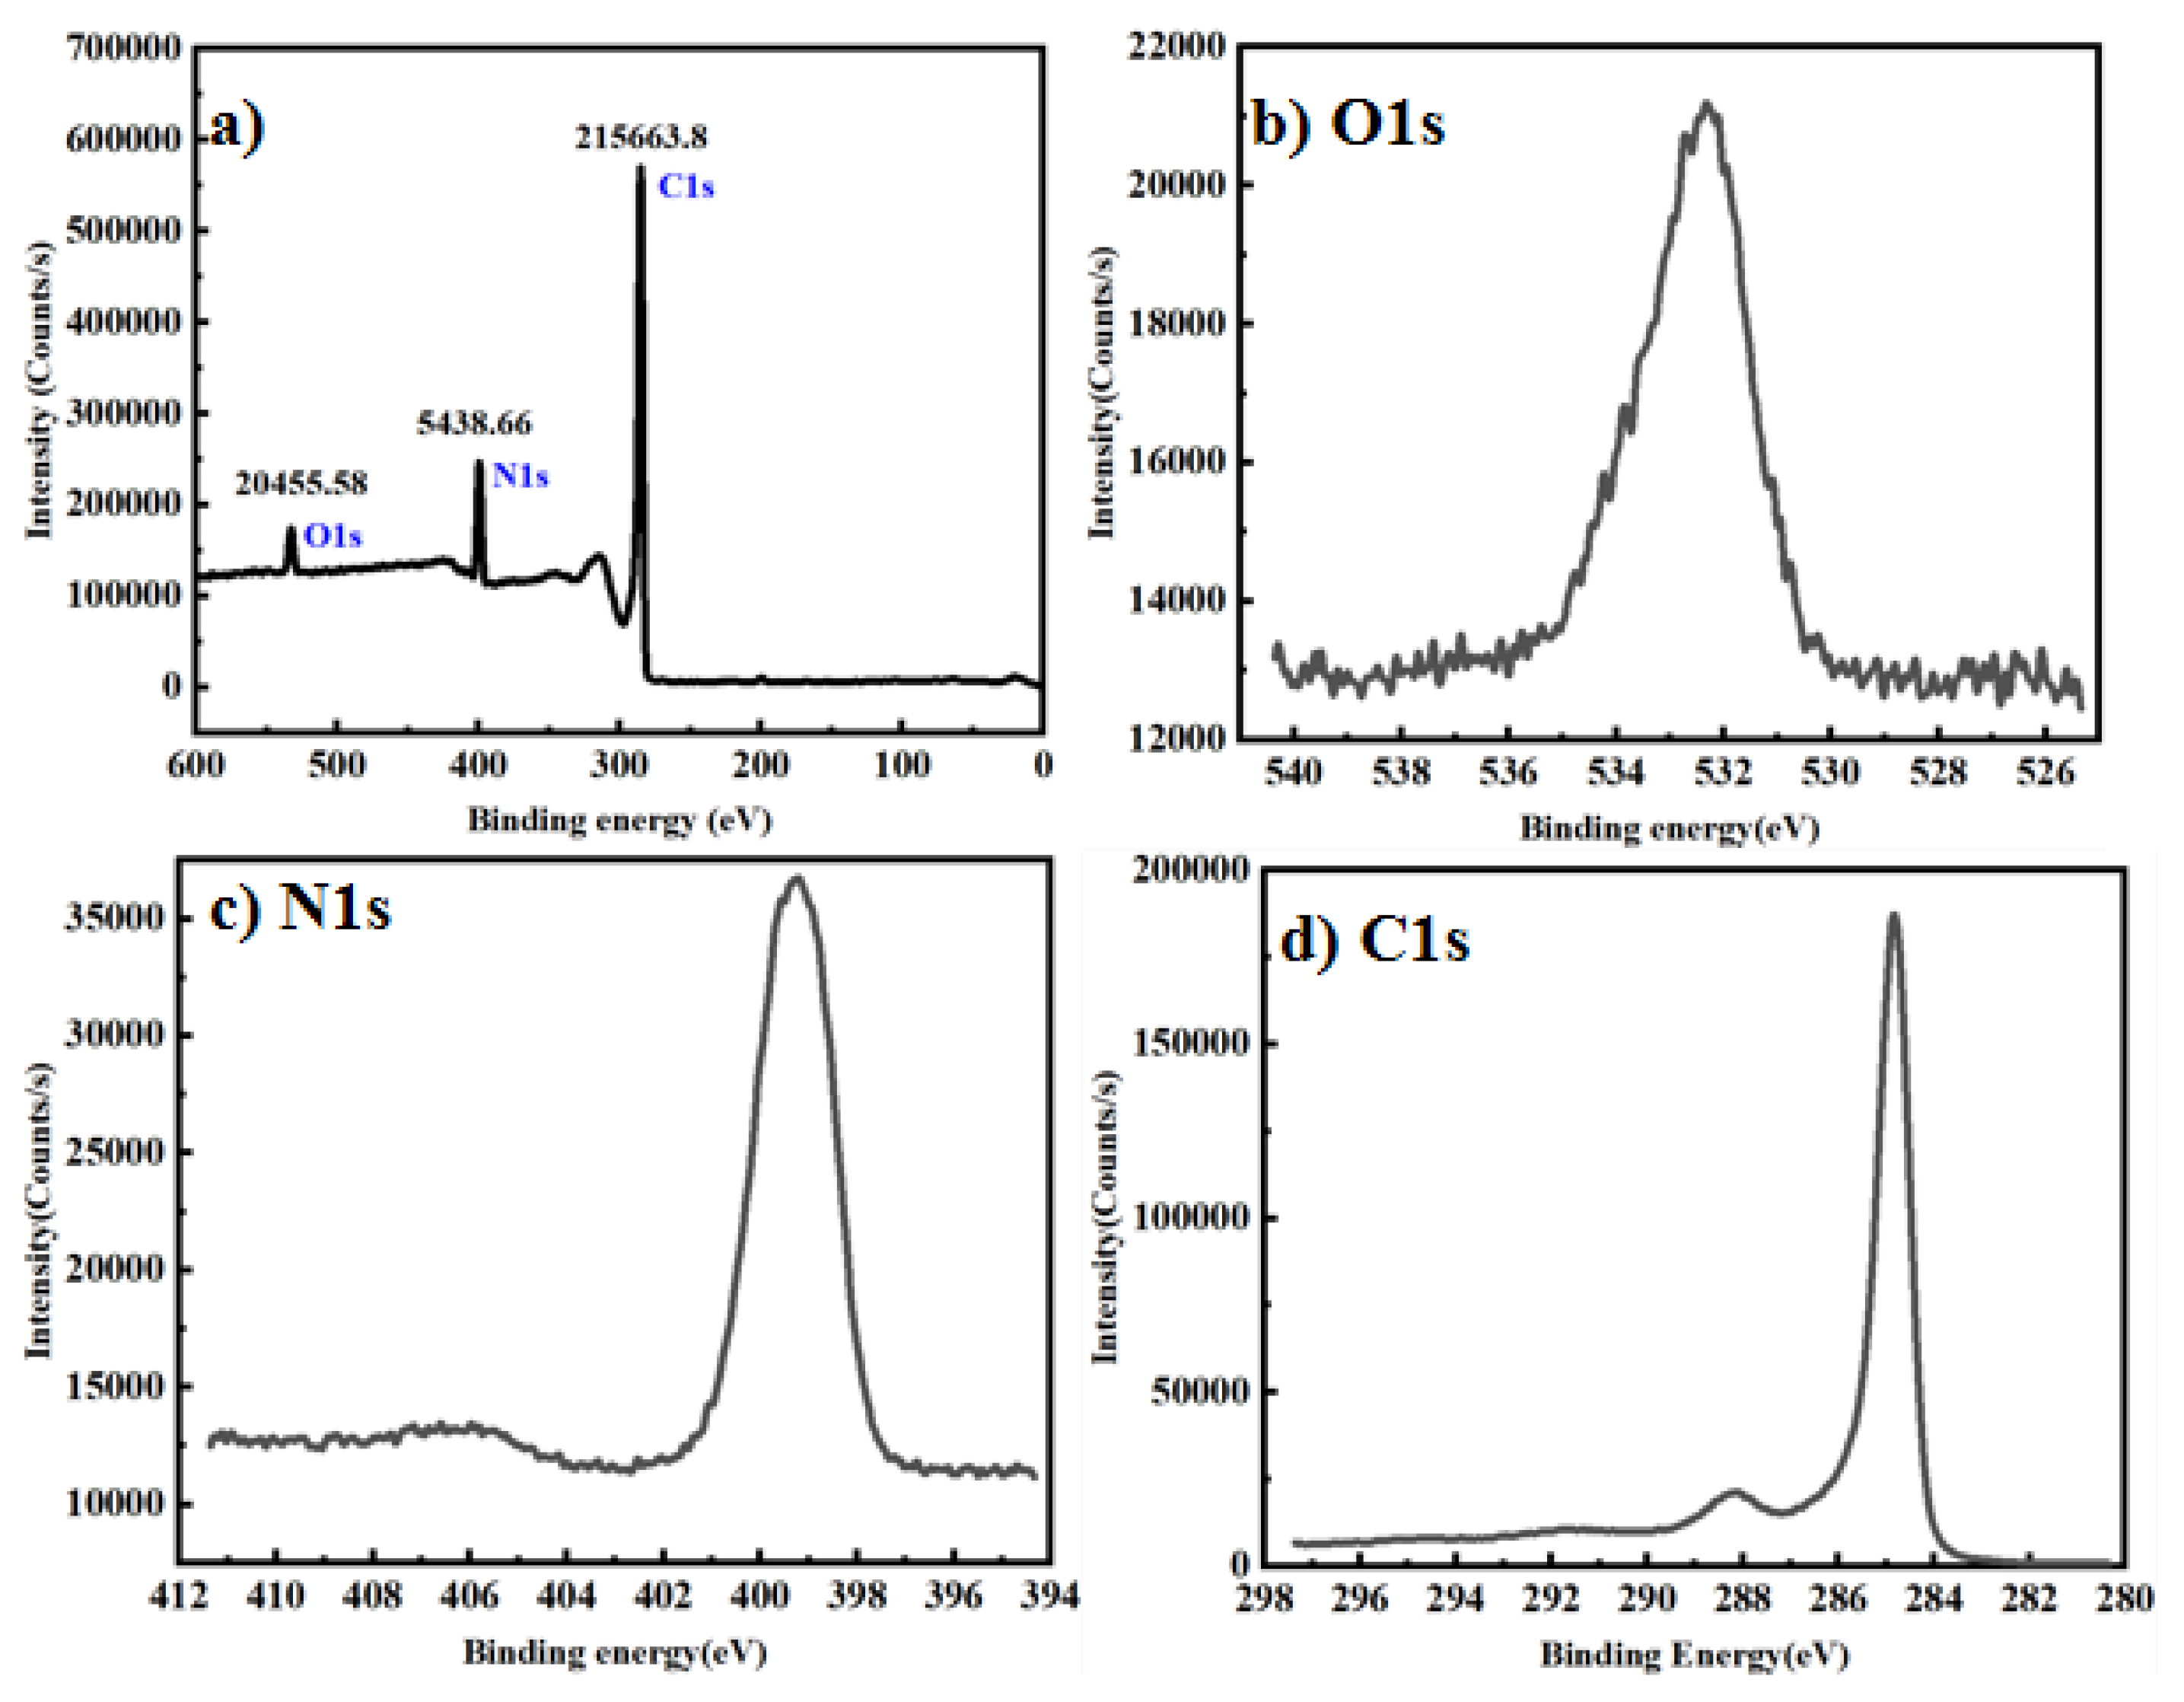
Figure 5.
a) Compression failure of 3d test block. c) 3d test block compression failure specimen diagram. b) Comparison of damage over time between undoped and doped specimens.
Figure 5.
a) Compression failure of 3d test block. c) 3d test block compression failure specimen diagram. b) Comparison of damage over time between undoped and doped specimens.
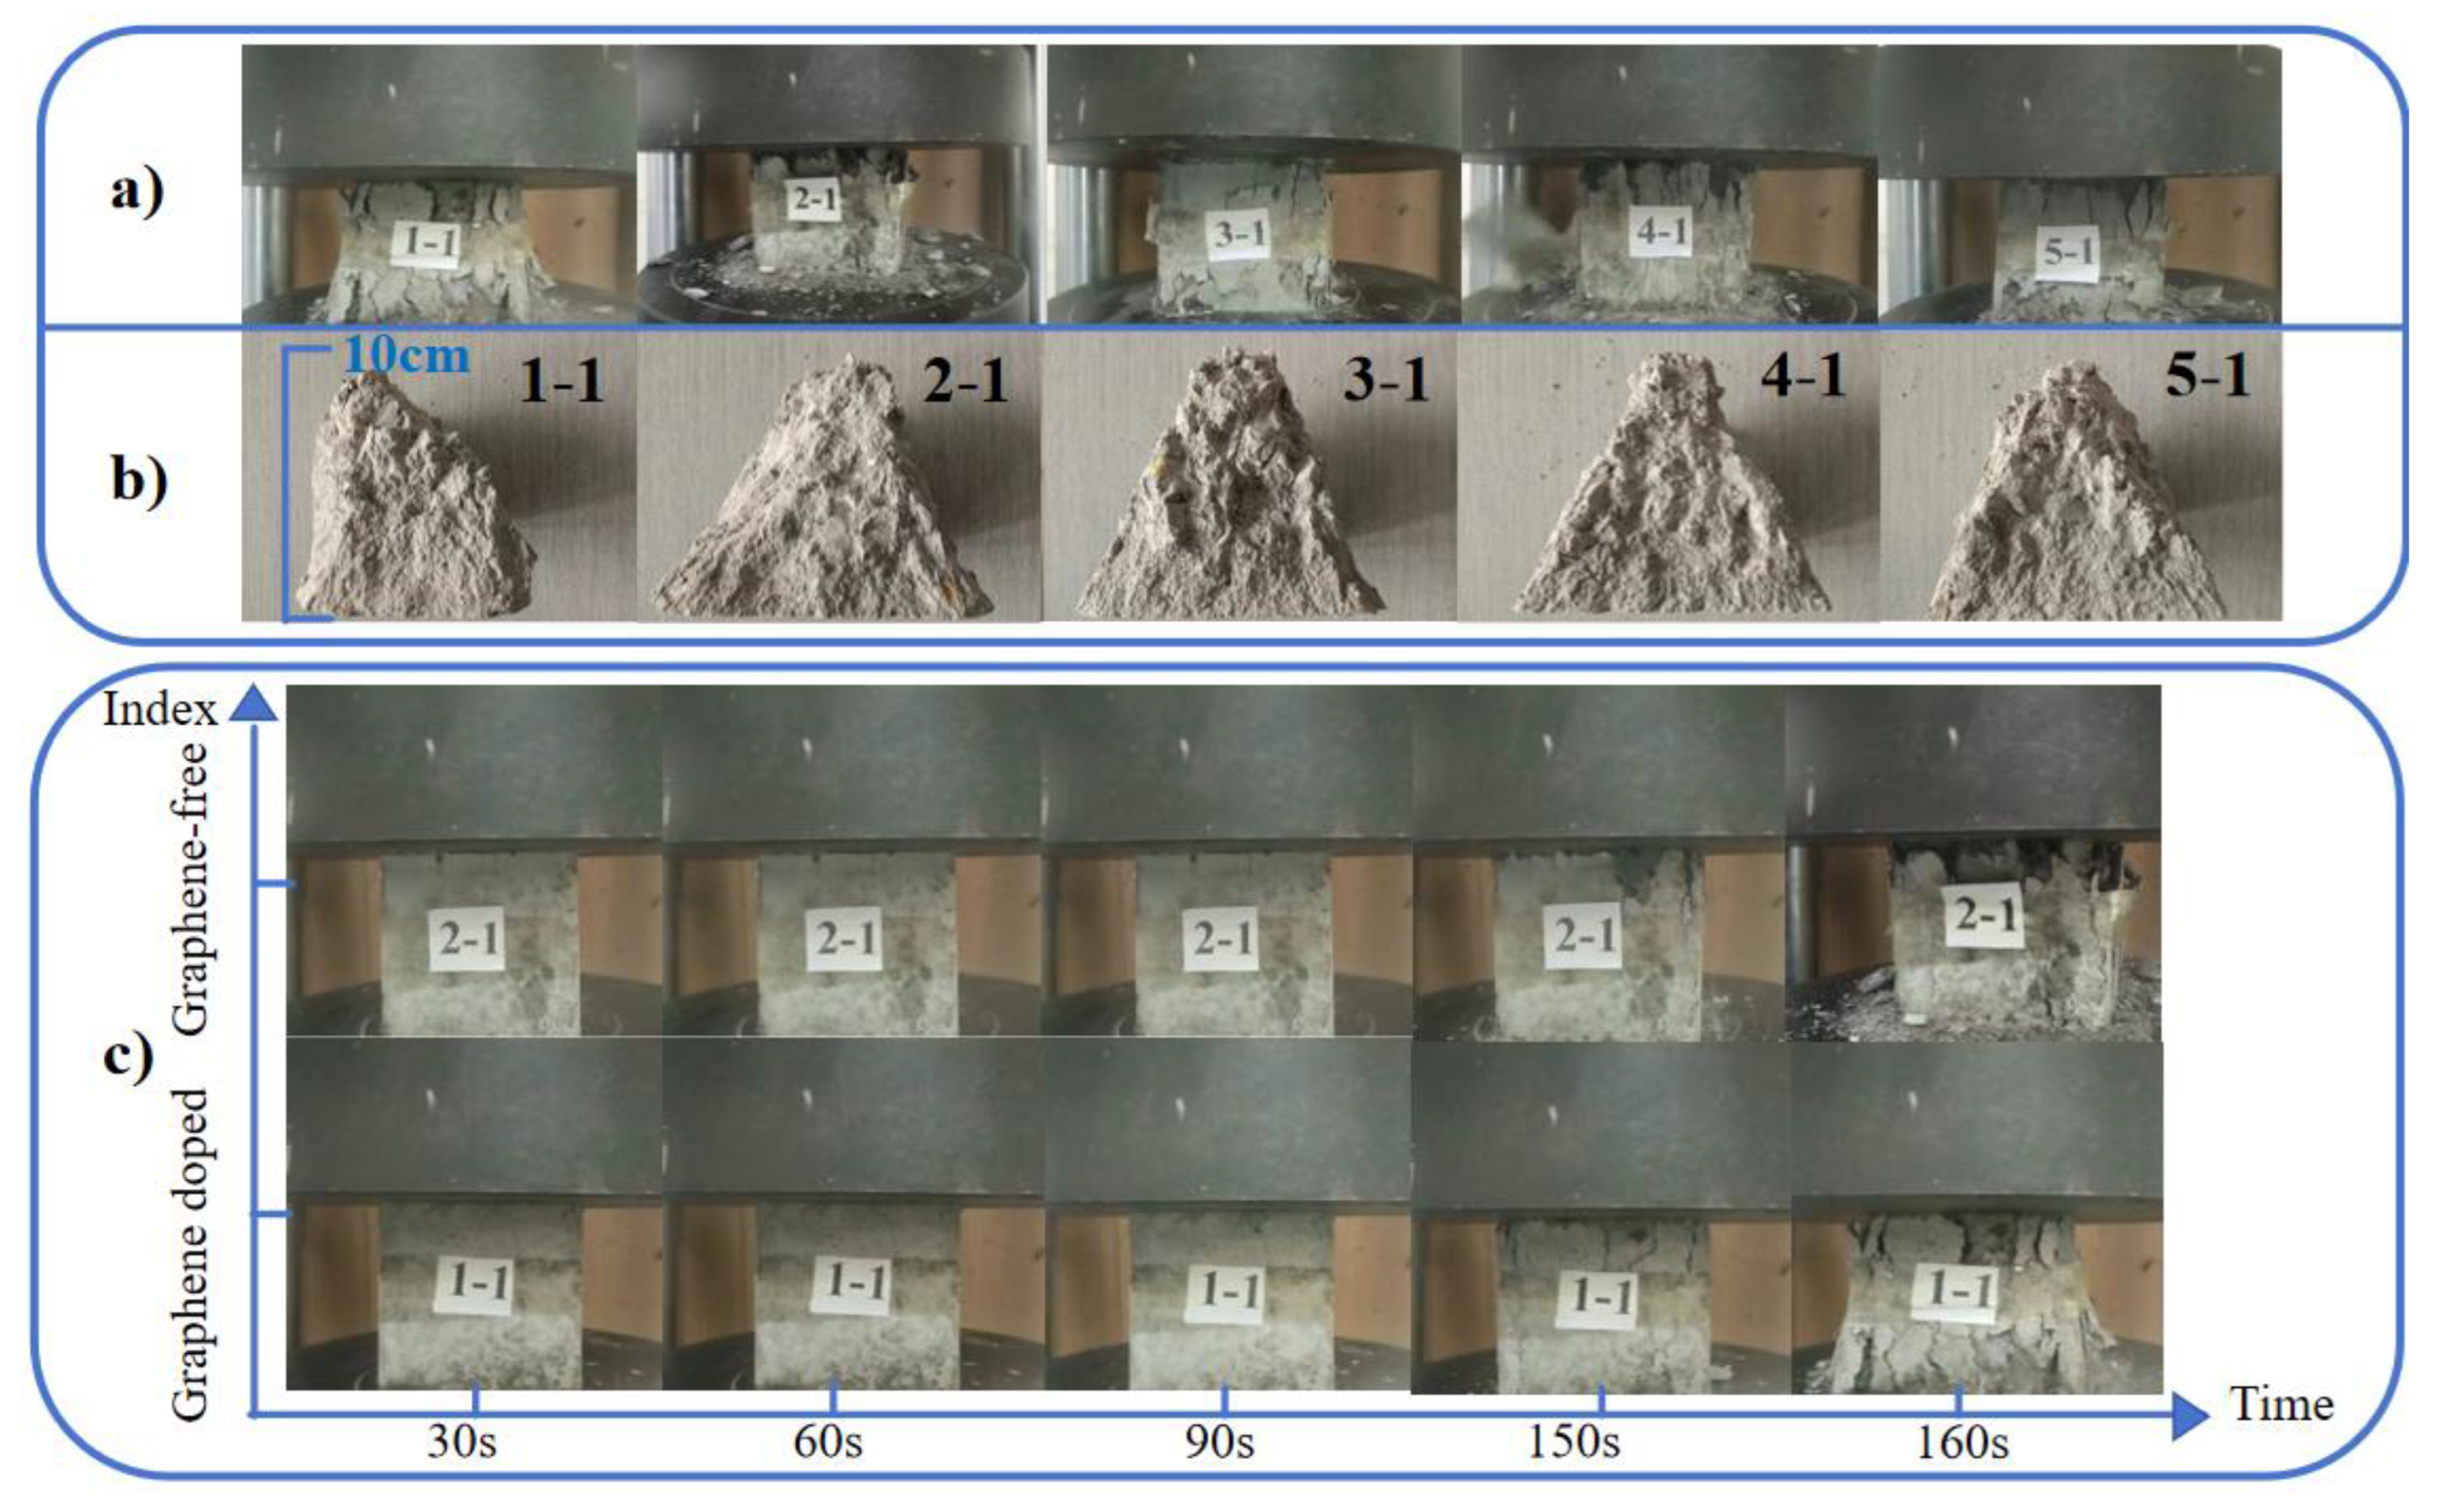
Figure 6.
a) Stress-strain curve of the test block after curing for 3 days. b) Comparison of compressive strength of test blocks with different graphene content during curing for 3, 7 and 28 days.
Figure 6.
a) Stress-strain curve of the test block after curing for 3 days. b) Comparison of compressive strength of test blocks with different graphene content during curing for 3, 7 and 28 days.
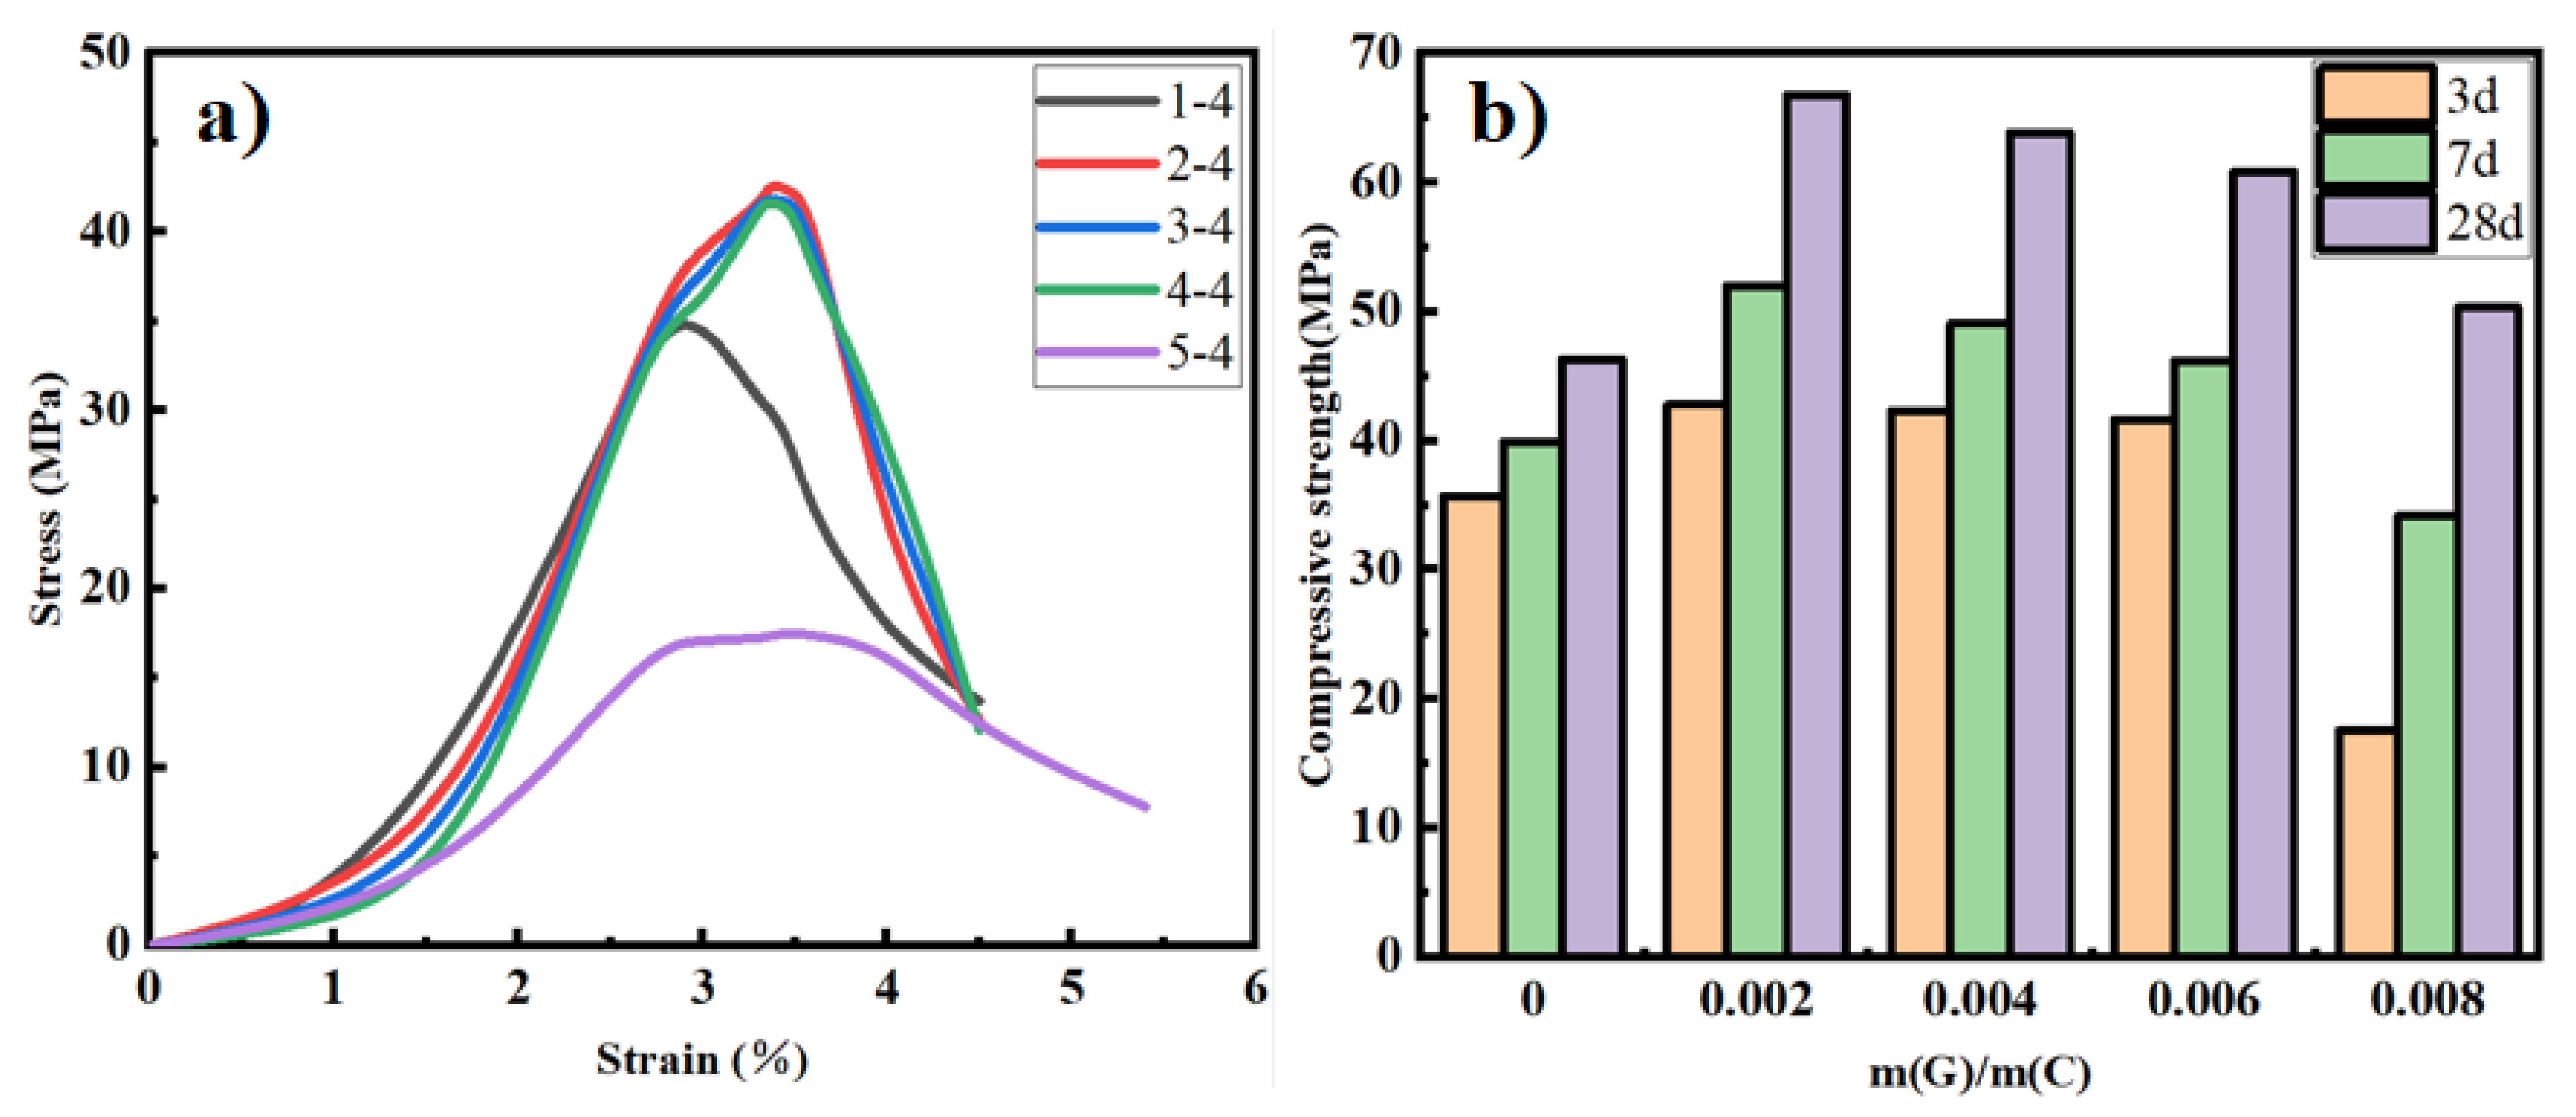
Figure 8.
a) Plot of surface temperature change over time after test block. b) The surface temperature of the test block changes over time.
Figure 8.
a) Plot of surface temperature change over time after test block. b) The surface temperature of the test block changes over time.
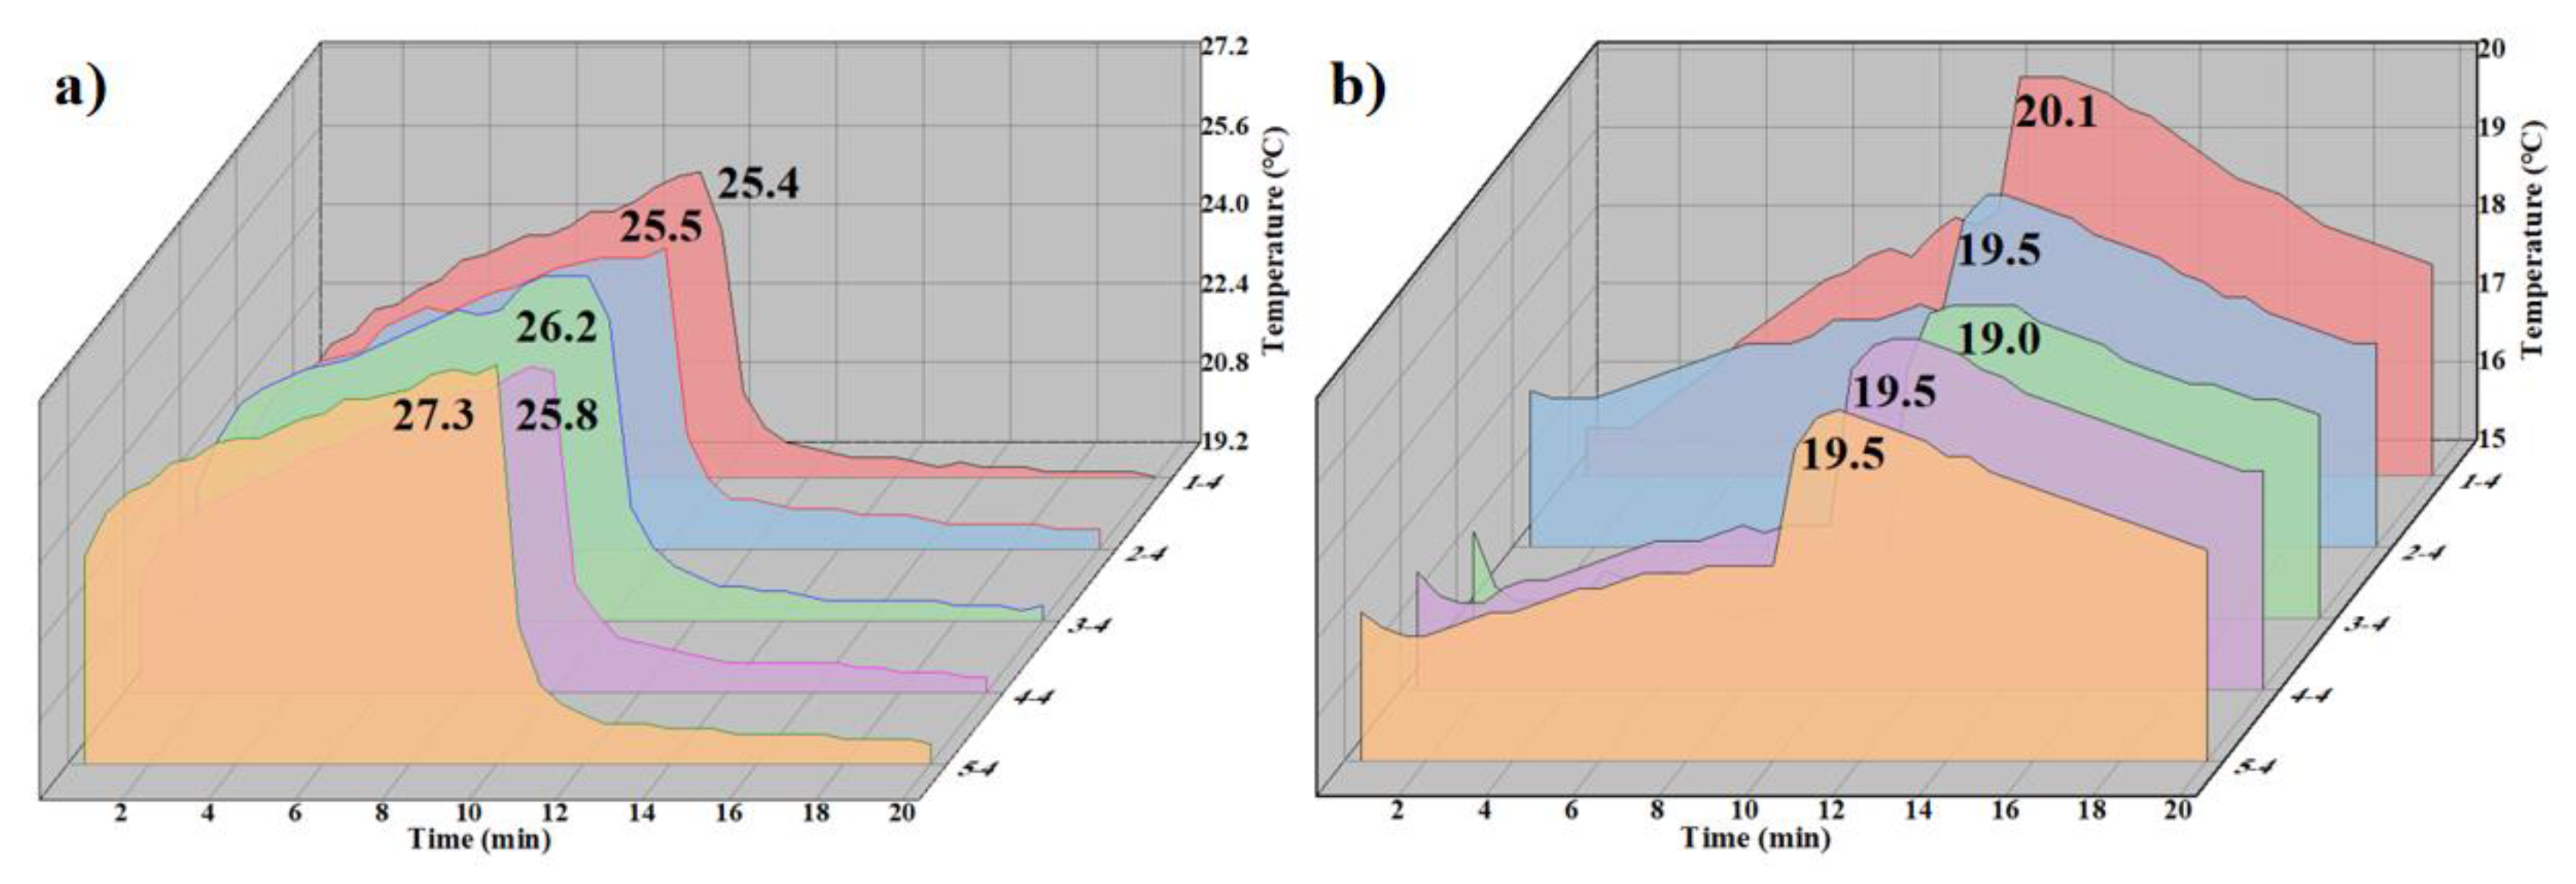
Figure 9.
a) Plot of surface temperature change over time after test block. b) The relationship between the difference between the peak surface temperature and the initial temperature (ΔT) after the test block and the amount of graphene.
Figure 9.
a) Plot of surface temperature change over time after test block. b) The relationship between the difference between the peak surface temperature and the initial temperature (ΔT) after the test block and the amount of graphene.
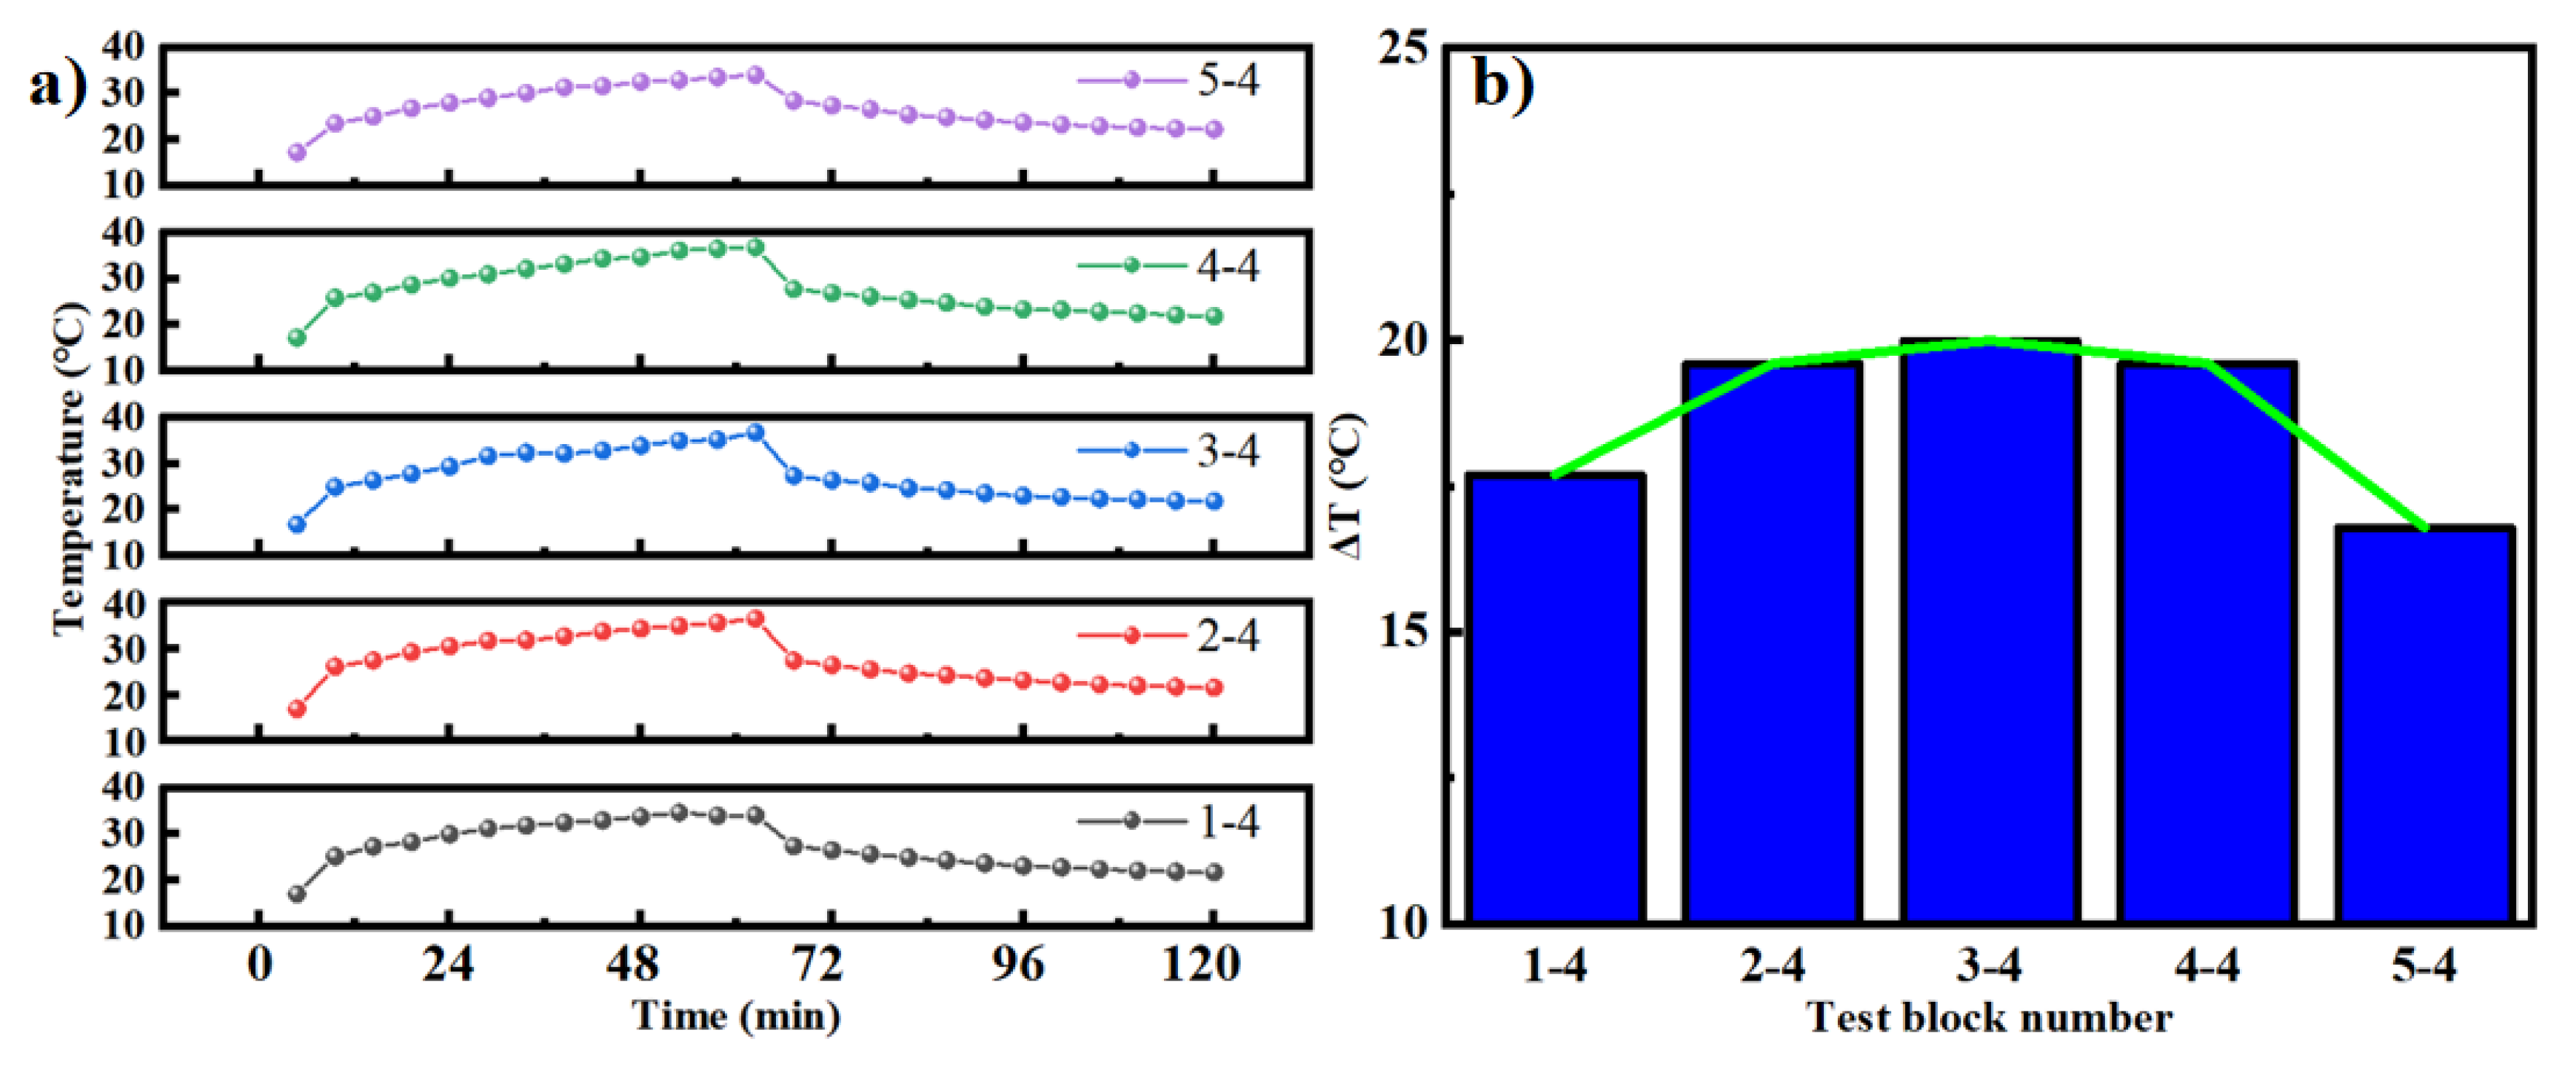

Table 1.
Test result of block impermeability test.
| S. No. | k(cm) | S(cm2) |
|---|---|---|
| 1-4 | 1.5 | 29.5 |
| 2-4 | 1.0 | 25 |
| 3-4 | 0.5 | 25 |
| 4-4 | 0.8 | 26 |
| 5-4 | 0.9 | 30 |
Disclaimer/Publisher’s Note: The statements, opinions and data contained in all publications are solely those of the individual author(s) and contributor(s) and not of MDPI and/or the editor(s). MDPI and/or the editor(s) disclaim responsibility for any injury to people or property resulting from any ideas, methods, instructions or products referred to in the content. |
© 2025 by the authors. Licensee MDPI, Basel, Switzerland. This article is an open access article distributed under the terms and conditions of the Creative Commons Attribution (CC BY) license (http://creativecommons.org/licenses/by/4.0/).
Copyright: This open access article is published under a Creative Commons CC BY 4.0 license, which permit the free download, distribution, and reuse, provided that the author and preprint are cited in any reuse.


