
Submitted:
20 June 2025
Posted:
24 June 2025
You are already at the latest version
Abstract
Mozambique soils are known for an unbalanced agronomic and environmental composition that results in poor agricultural production yields. However, agriculture is the main economic activity of Mozambique, and soils must be characterised for their elemental deficiencies and/or excesses. This paper sampled nine farms from the Manica and Sussundenga districts (Manica province) in three campaigns in 2021/2022, 2022/2023 and 2023/2024 (before and after the rainy seasons). They were subjected to an agronomical and environmental chemical analysis to assess their quality, from the fertility and environmental contamination point of view. A multivariate data analysis methodology was used based on cluster and discriminant analysis. The analysis of 23 agronomical soil variables suggested four clusters of soils characterised by deficiencies and excess elements that must be corrected to improve the yield and quality of agricultural production. Moreover, the multivariate analysis of the metal composition (Ba, Cr, Co, Cu, Pb, Ni, V and Zn) of soil samples from the second campaign and the third campaign, before and after the rainy season, suggested five clusters with pristine composition and with different metal pollutants composition and concentrations. The information obtained in this study allows scientific comprehension of agricultural soil quality, which is crucial for designing agronomic and environmental corrective measures to improve food quality and quantity in the Manica and Sussundenga districts and ensure environmental, social, and economic sustainability.
Keywords:
agricultural farms
; soil properties
; classification
; multivariate data analysis
1. Introduction
Soil quality assessment can be a critical socio-economic indicator of the wealth of farmers. Indeed, agricultural yields depend on soil fertility and, under low-input nature agriculture in developing countries, where crops are produced for household consumption and income, low soil quality results in poor farmers [1,2]. Understanding the relation between soil fertility and poverty is particularly important in countries where most of the population depends on agriculture, like Mozambique, where the currently used 9 million hectares of arable land are mainly managed by family farming [3,4]. However, in sub-Saharan Africa, the lack of economic and technical resources, and a strategic program to characterise and improve the soil health/fertility of the countries, which are known to be of poor quality, is an obstacle to the sustainable management of soil and consequently to the wealth of nations. Indeed, agricultural soils become poorer if no corrective measures are progressively taken. Moreover, soil degradation poses risks to the environment, economy and society [5]. African soils are depleted of nutrients, with the corresponding even sharper decline in fertility, leading to very low crop yields [6]. Although the existing information about the soils in Mozambique is very scarce, there is a consensus on the poor fertility of these soils [7,8,9,10,11].
The first step in sustainable soil quality management is its diagnosis and monitoring. According to the European proposal of the Soil Monitoring Law, soil health is a multidimensional parameter defined as “the physical, chemical and biological condition of the soil determining its capacity to function as a vital living system and to provide ecosystem services” [5]. Consequently, obtaining information about soil quality and fertility is mandatory to define a sustainable soil health management strategy. Other factors besides the intrinsic soil characteristics are critical for crop production management: infrastructure and related high transport costs, inadequate institutional support, and political instability [6].
Soil fertilisation is a standard mandatory routine to maintain or restore soil quality. However, in sub-Saharan African countries, the high cost of fertilisers is an obstacle to this happening [12]. Also, the depletion of other soil substances that influence crop yields, such as micronutrients and organic matter, is a reality which contributes to very low agricultural productivity and farmers’ poverty. Indeed, low fertiliser use is one of the factors contributing to the slow growth of agricultural productivity in Africa. Data from 2009 suggested that Africa accounts for less than 1% of global fertiliser consumption [13,14]. The only way to successfully resolve this problem is through subsidies. The experience of subsidising corn production in Malawi allowed production to triple, going from a deficit in 2005 to a surplus in 2007, which allowed food prices to fall and corn to be exported to neighbouring countries [14].
The problem of poor soil health gives rise to another issue, in addition to low productivity, the existence of poor nutritional quality in the food produced [2,15,16,17]. The food produced in soils with zinc deficit may be responsible for the child stunting [15]. Also, negative correlations were observed between the available soil concentrations of copper and manganese with child morbidity and child wasting [2]. There is enough consensus about the direct link between the soil and people’s health [2,15,16,17].
Besides the agronomical soil quality, which will be responsible for the crop yields and nutritional quality, agricultural soils must follow environmental quality standards to protect human health from toxic substances. Heavy metals are of particular concern because they can have a natural (geological) origin or an anthropogenic contribution from mining activities [11,18,19,20,21]. Also, this type of pollutant tends to accumulate in the environment [22,23,24,25,26].
In this paper, the results of the hierarchical cluster and discriminant analysis of soils from nine farms in the Manica and Sussundenga districts (Manica, Mozambique) will be presented and discussed. Agronomical chemical characteristics and heavy metals will be evaluated. The agronomical chemical characteristics evaluated are: extractable K, Mg, Ca; Micronutrients Fe, Mn, Zn, Cu and B; exchangeable Na, K, Ca, Mg, Al and cation exchange capacity (CEC); Fertility properties as pH(KCl), pH(H2O), extractable P, soil organic carbon, organic matter; nitrogen Kjeldahl, nitrogen inorganic, conductivity and texture as sand, clay and silt percentage. The set of heavy metal evaluated were Ba, Cr, Co, Cu, Pb, Ni, V and Zn. The environmental quality of the soils will be discussed on the basis of the cluster and discriminant analysis. The agronomical and environmental assessment of the soils under investigation will be done.
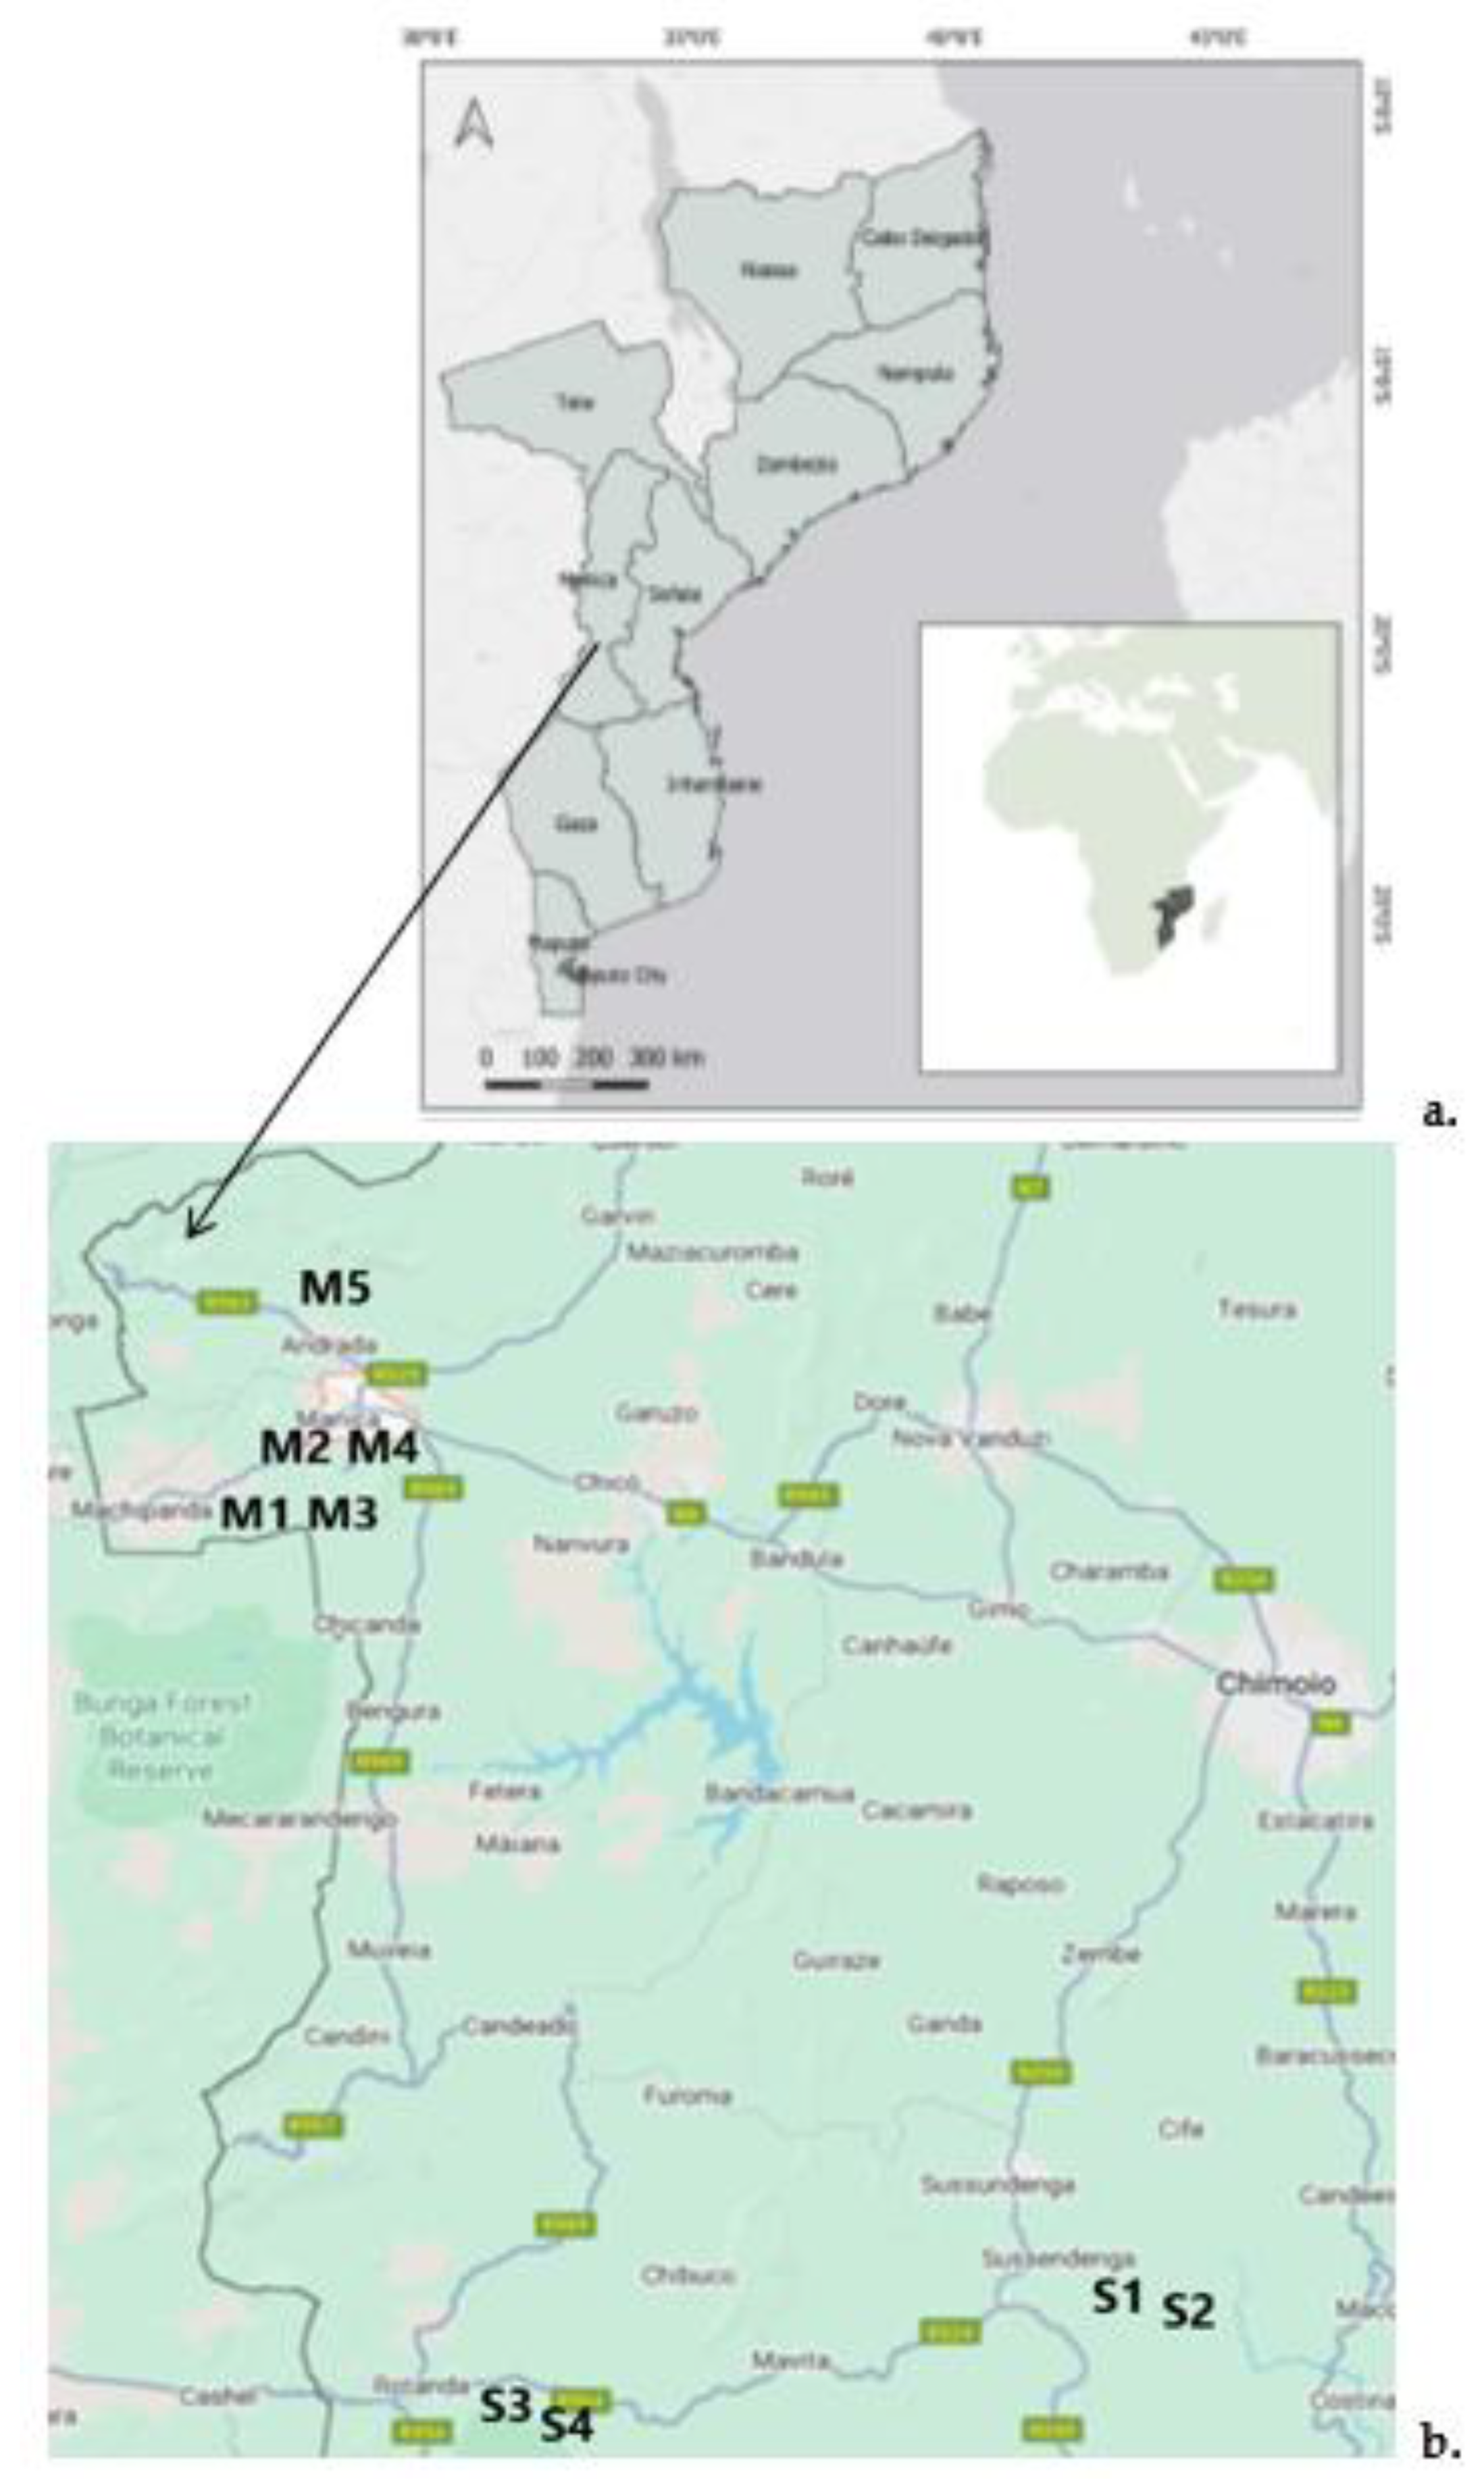
This paper will classify soils from nine farms in the Manica and Sussundenga districts of the Manica province in Mozambique (Figure 1), based on agronomical and environmental parameters. A preliminary analysis of the soils from this province has already been made [11] and, in this work, more farms and more sampling campaigns were included to obtain a more representative classification of the soils from the neighbouring districts of Manica and Sussundenga. The agronomical and environmental assessment of the area under investigation will be done. The results obtained in this study will allow the definition of a rational strategic plan to reverse the degradation trend of agricultural soils, improving the health of soils and populations, and reversing the trend of impoverishment.
Figure 1.
The map of Mozambique (with its provinces) (a.) with the amplification of the Manica province (extracted from Google map), in the Manica and Sussundenga districts, where the soil samples were collected.
Figure 1.
The map of Mozambique (with its provinces) (a.) with the amplification of the Manica province (extracted from Google map), in the Manica and Sussundenga districts, where the soil samples were collected.
2. Materials and Methods
2.1. Study Area
The study area focuses on two districts in the Manica province (centre of Mozambique adjacent to the frontier with Zimbabwe), namely the Manica and Sussundenga districts (Figure 1). Some of the farms under investigation have already been preliminary characterised [11]. Still, in the present study, more soils from the farms of Manica and Sussundenga districts were added to the samples, and one more campaign, 2023/2024, before and after the rainy season, was considered for all soil samples.
2.2. Soil Sampling
Soils were sampled in agricultural farms in the Manica province, namely five samples in the Manica district (Fields M1 to M5) and four samples in the Sussundenga district (Fields S1 to S4) (Figure 1). The areas of the nine farms and their agricultural productions are: M1 - 7 ha: corn, green beans, banana, lettuce, cucumber, strawberries and okra; M2 - 2 ha: corn, tomatoes and beans; M3 – 1 ha: corn, beans and tomatoes; M4 - 1 ha: corn, beans and tomatoes; M5 – 20 ha: bananas and lychee; S1 - 1.5 ha: corn and sesame; S2 - 1 ha: corn and beans; S3 - 1 ha: corn and beans; and, S4 – 1 ha: corn and soy.
Samples were collected in three campaigns (2021/2022, 2022/2023 and 2023/2024). In each of them samples were obtained before and after the rainy season in the following periods (Table S1): 2021/2022 campaign - September and October 2021 (before the rainy season) and April 2022 (after the rainy season; 2022/2023 campaign - September 2022 (before the rainy season) and April 2023 (after the rainy season); 2023/2024 campaign - September 2023 (before the rainy season) and April 2024 (after the rainy season).
2.3. Preparation and Analysis of the Soils
The soil preparation and agronomical chemical analysis were done as previously described [11]. Metals were analysed within the TerrAttesT package by inductively coupled plasma-mass spectrometry (ICP-MS) at Eurofins Analytico B.V., according to the reference method NEN-EN-ISO 17294-2.
2.4. Data Analysis
The multivariate analysis of the data obtained, 23 agronomical chemical characteristics and 8 heavy metal, were implemented separately with SPSS® version 28.0.1.0 statistical package from IBM® company. To explore and understand the clustering and dimensionality of the data, unsupervised hierarchical cluster analysis (HCA) and discriminant analysis (DA) were performed. For the HCA were use non-standardized or Z scores standardized by variable between-groups linkage and Ward’s methods. The distance or similarity measure used in clustering was the squared Euclidean distance. With this analysis is possible to verify the characteristics of each cluster, understanding of the data structure and identifying distinct clusters [27]. For the discriminant analysis (DA) was used the stepwise method with Wilk’s lambda method. The discriminant analysis was based on the previous results found by cluster analysis. The DA is complementary to HCA allowing to verify linear relations between the variables of the data and identify which variables contribute more for the separations of the clusters [28].
3. Results and Discussion
3.1. Agronomical Properties Classification
Table S2 shows the results of the agronomical chemical analysis of the five soils sampled in the three campaigns (2021/2022. 2022/2023 and 2023/2024) plus more four soils sampled in the last campaign (2023/2024). The analysis of this table, and as previously discussed [11], all the soils are extremely to strongly acidic (pH ranging from 4.5 and 5.6. with an average of 5.0±0.3), have no salinity problems (conductivity ranging from 4.2 to 11.8 mS/m), have negative charge, are cation exchangers and are characterized by a low amount of soil organic matter (SOM) ranging from 0.67% to 1.83% with an average 1.3±0.3%. Also, these soils have non-measurable concentrations of extractable boron and exchangeable aluminum. For this reason these two variables will not be considered in the analysis, and the other 23 variables will be used for the multivariate classification.
Boron is an essential plant nutrient and, since the beginning of the XX century, it was found that its application resulted in the increase of crop production yields [29]. Besides the quantity, boron deficiency may affect the quality of the products [29]. The boron deficiency in the soil from Manica and Sussudenga can be dealt by the choice of more tolerable crops or varieties or to the boron fertilizer use [29].
The multivariate hierarchical cluster analysis of the agronomical properties of the soils data in Table S2 resulted in the dendogram shown in Figure 2 – dendograms obtained using other clustering strategies have a similar result. Four clusters of soils are observed (Clusters A1, A2, A3 and A4), which compositions is described in Table 1. Also, cluster number two may be divided into two subclusters (subclusters A2A and A2B).
Figure 2.
Dendogram obtained using between-group linkage method.
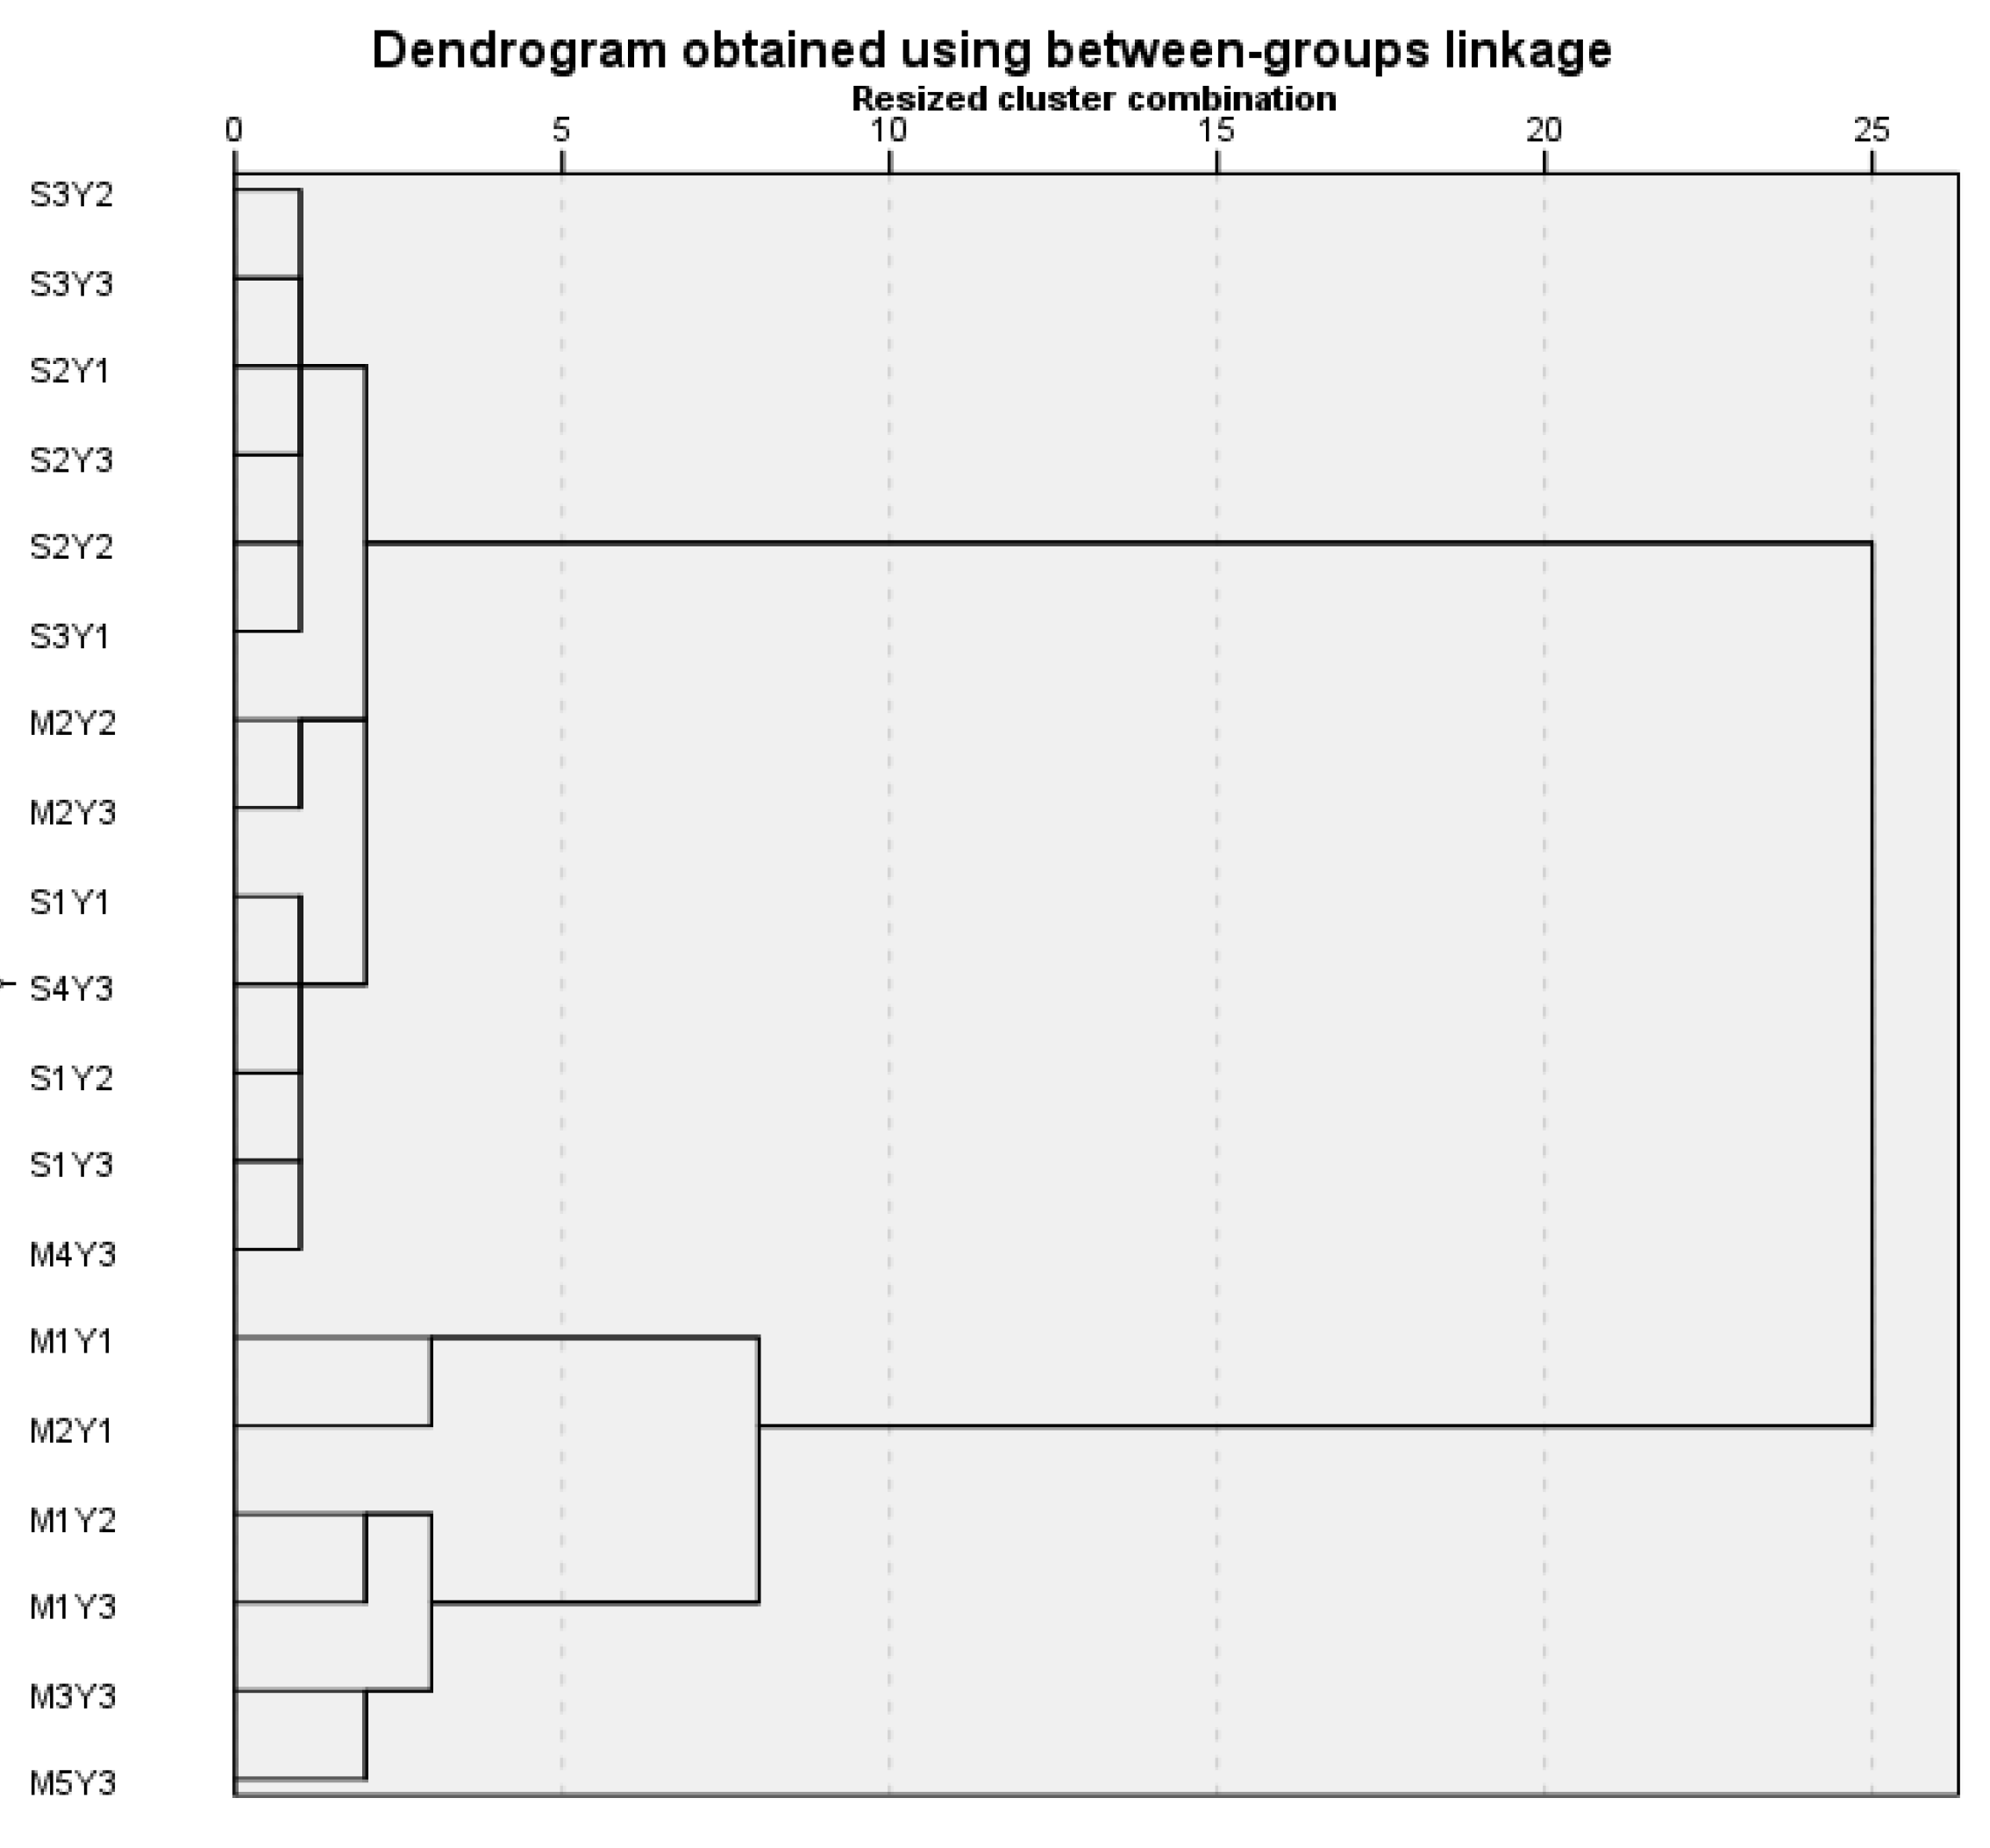
The analysis of the composition of the observed clusters (Table 1) shows that the origin of the soils, Manica or Sussundenga, is the main factor that determines the classification, suggesting that the soils of the two districts are different.
Table 2 shows the average values and corresponding errors for the measured variables in the four detected clusters. The analysis of this Table shows increasing concentration values for those most discriminating as the number of the cluster increases. Also, the comparison of the concentration values in Table 2 and the plots of the samples into the discrimination functions (Figure S1) show that clusters A1 and A2 are more similar than the other two. This indicates that the soils from Sussundenga (Cluster A1 and A2) are more similar among themselves, and the soils from Manica are more dissimilar among themselves (Cluster A3 and A4) and from the soils from Sussundenga.

Table 1.
Clusters detected and their compositions.
| Cluster | Samples in the Clusters | Sub-Cluster | Samples in the sub-clusters | Origin of the soils |
|---|---|---|---|---|
| Cluster A1 | S2Y1. S2Y2. S2Y3. S3Y1. S3Y2. S3Y3 | Sussundenga | ||
| Cluster A2 | M2Y2. M2Y3 M4Y3 S1Y1. S1Y2. S1Y3 S4Y3 |
Cluster A2A | M2Y2. M2Y3 M4Y3 |
Manica |
| Cluster A2B | S1Y1. S1Y2. S1Y3 S4Y3 |
Sussundenga | ||
| Cluster A3 | M1Y1. M2Y1 | Manica | ||
| Cluster A4 | M1Y2. M1Y3 M3Y3 M5Y3 |
Manica |
Table 2.
Average and standard deviation of the agronomic variables in the four clusters of soil samples observed by unsupervised hierarchical clustering.
Table 2.
Average and standard deviation of the agronomic variables in the four clusters of soil samples observed by unsupervised hierarchical clustering.
| Property | Cluster A1 | Cluster A2 | Cluster A3 | Cluster A4 |
|---|---|---|---|---|
| Extractable K (K2O). mg/kg | 59 (26) | 155 40) | 204 (45) | 254 (66) |
| Extractable Mg. mg/kg | 52 (13) | 111 (10) | 327 (41) | 586 (3) |
| Extractable Ca. mg/kg | 404 (95) | 565 81) | 1053 (113) | 1462 194) |
| Extractable Fe. mg/kg | 65 (23) | 121 (69) | 206 (11) | 91 (33) |
| Extractable Mn. mg/kg | 31 (17) | 172 (12) | 285 (80) | 409 (31) |
| Extractable Zn. mg/kg | 2.2 (0.6) | 1.4 (0.6) | 1.9 (0.3) | 2.2 (0) |
| Extractable Cu. mg/kg | 0.45 (0.08) | 2 (1) | 3.6 (0.5) | 5.6 (0.1) |
| Exchangeable Na. cmol(+)/kg | 0.043 (0.008) | 0.07 (0.03) | 0.13 (0.03) | 0.16 (0.04) |
| Exchangeable K. cmol(+)/kg | 0.14 (0.02) | 0.32 (0.04) | 0.38 (0) | 0.50 (0.08) |
| Exchangeable Ca. cmol(+)/kg | 2.0 (0.5) | 2.8 (0.4) | 5.2 (0.6) | 7.3 (0.9) |
| Exchangeable Mg. cmol(+)/kg | 0.4 (0.1) | 0.90 (0.07) | 2.8 (0.4) | 4.8 (0.8) |
| CEC. cmol(+)/kg | 2.7 (0.5) | 4.2 (0.4) | 8.5 (0.9) | 13 (2) |
| pH(KCl) 1:5 | 4.9 (0.3) | 5.0 (0.3) | 5.3 (0.1) | 5.3 (0.1) |
| pH(H2O) 1:5 | 5.6 (0.3) | 5.9 (0.3) | 6.0 (0) | 6.4 (0.1) |
| Extractable P (P2O5). mg/kg | 41 (7) | 89 (87) | 119 (24) | 48 (18) |
| Organic Carbon (%) | 0.68 (0.07) | 0.7 (0.2) | 0.7 (0.2) | 0.9 (01) |
| Organic Matter (%) | 1.2 (0.1) | 1.2 (0.4) | 1.2 (0.4) | 1.5 (0.2) |
| Nitrogen Kjeldahl. g/kg | 0.8 (0.7) | 0.6 (0.2) | 1.10(0.03) | 13.0 (0.2) |
| Nitrate (N-NO3). mg/kg | 12 (7) | 7 (4) | 21 (12) | 9 (3) |
| Conductivity. mS/m | 5.7 (0.9) | 6 (2) | 11 (1) | 6 (1) |
| Sand (%) | 79 (4) | 69 (2) | 59 (4) | 27 (5) |
| Clay (%) | 11 (1) | 16 (2) | 24 (1) | 38 (3) |
| Silt(%) | 10 (4) | 15 (2) | 17 (5) | 35 (2) |
The clusters described in Table 1 and Table 2 result from the different properties of the nine soils under analysis. Indeed, the following agronomical properties are characteristic of the clusters:
Cluster A1: This cluster is constituted by very poor soils from the Sussundenga district that are characterized by a sandy loam and loamy sand textures, with deficiencies in the elements calcium, magnesium, boron, manganese, copper, phosphorous, potassium and zinc.
Cluster A2A: This sub-cluster is constituted by soils from Manica district that have a sandy loam texture, with deficiencies in calcium and boron, and excess of manganese and iron.
Cluster A2B: This sub-cluster is constituted by soils from Sussundenga district that are characterised by sandy loam and sandy clay loam textures, with deficiencies in phosphorus, calcium, boron and zinc, and an excess of manganese, potassium and iron.
Cluster A3: This cluster is constituted by Manica soils from the first year (2021/2022) with a sandy clay loam texture, a deficiency of calcium and boron, and an excess of magnesium, manganese, iron and potassium.
Cluster A4: This cluster is constituted by Manica soils with clay, clay loam and silty clay textures, with a deficiency of phosphorus, boron and zinc, and an excess of magnesium, potassium, manganese and iron.
A Linear Discriminant Analysis (LDA) was done to analyse the discriminatory capacity variables among the detected clusters, and the Wilks Lambda and Fisher’s F statistical parameters were obtained (Table S3). The analysis of Table S3 shows that the main discriminatory variables (lower Wilks Lambda and higher F) are the extractable and exchangeable calcium and magnesium (which correlate with the CEC), the extractable manganese and the clay texture percentage. These elements are almost always present in the particular characteristics of the clusters. The analysis of the linear discriminant plot in Figure S1 shows that the clusters are indeed dissimilar with different specific properties.
All the clusters correspond to agronomically unbalanced soils and require correction to improve production yields and quality. Deficiencies in macronutrients are detected, for example, in calcium in the soils of clusters A1, A2 and A3, phosphorus in clusters A1, A2B and A4 and potassium in the soils of cluster A1. Also, several deficiencies in trace minerals are detected, which may contribute even further to lower crop yields, such as the defects of zinc in the soils of clusters A1, A2B and A4, and the deficiencies of manganese and copper in soils from cluster A1. Besides the impact on agricultural productivity, these micronutrient soil deficiencies may be reflected in the low nutritional values of the food produced in these fields, impacting the local populations’ human health.
The pH and amount of organic matter of all the soils may substantially impact the macro- and micronutrient composition of the soils of Manica and Sussundenga. Indeed, the acidity of the soils and low organic matter contribute to the speciation of the chemical elements distribution, and should be corrected by liming and organic correction to improve the basic soil properties to support subsequent fertilisation.
3.2. Metal Polutants Soil Classification
Table S4 shows the total concentrations of the metals Ba, Cr, Co, Cu, Pb, Ni, V and Zn present in the five mixed soils sampled before and after the rainy season in the 2022/2023 campaign, and in the eighteen soils sampled in the 2023/2024 campaign in nine farms before and after the rainy season. The following elements were not detected: As, Sb, Be, Cd, Hg, Mo, Se and Sn.
The multivariate hierarchical cluster analysis of the metal composition of the soils data in Table S4 resulted in the dendogram shown in Figure 3 – dendograms obtained using other clustering strategies have a similar result. Five clusters of soils are observed (Clusters H1, H2, H3, H4 and H5), whose compositions are described in Table 3. The reference values for agricultural soils accordingly to the Portuguese Environmental Agency [30] are included in Table S4.
The analysis of the composition of the observed clusters (Table 3) shows that no difference in similarity is observed for the samples before and after the rainy season because both samples fall in the same cluster. The metals’ average concentrations of the clusters are shown in Table 4, resulting from the different levels of metallic pollutants. The analysis of this table shows that for some clusters, the concentration of some metals is higher than the recommended levels for agricultural soils (bold values). The composition of the five clusters are:
Figure 3.
Dendogram obtained using Ward’s method with Z-score standardisation.
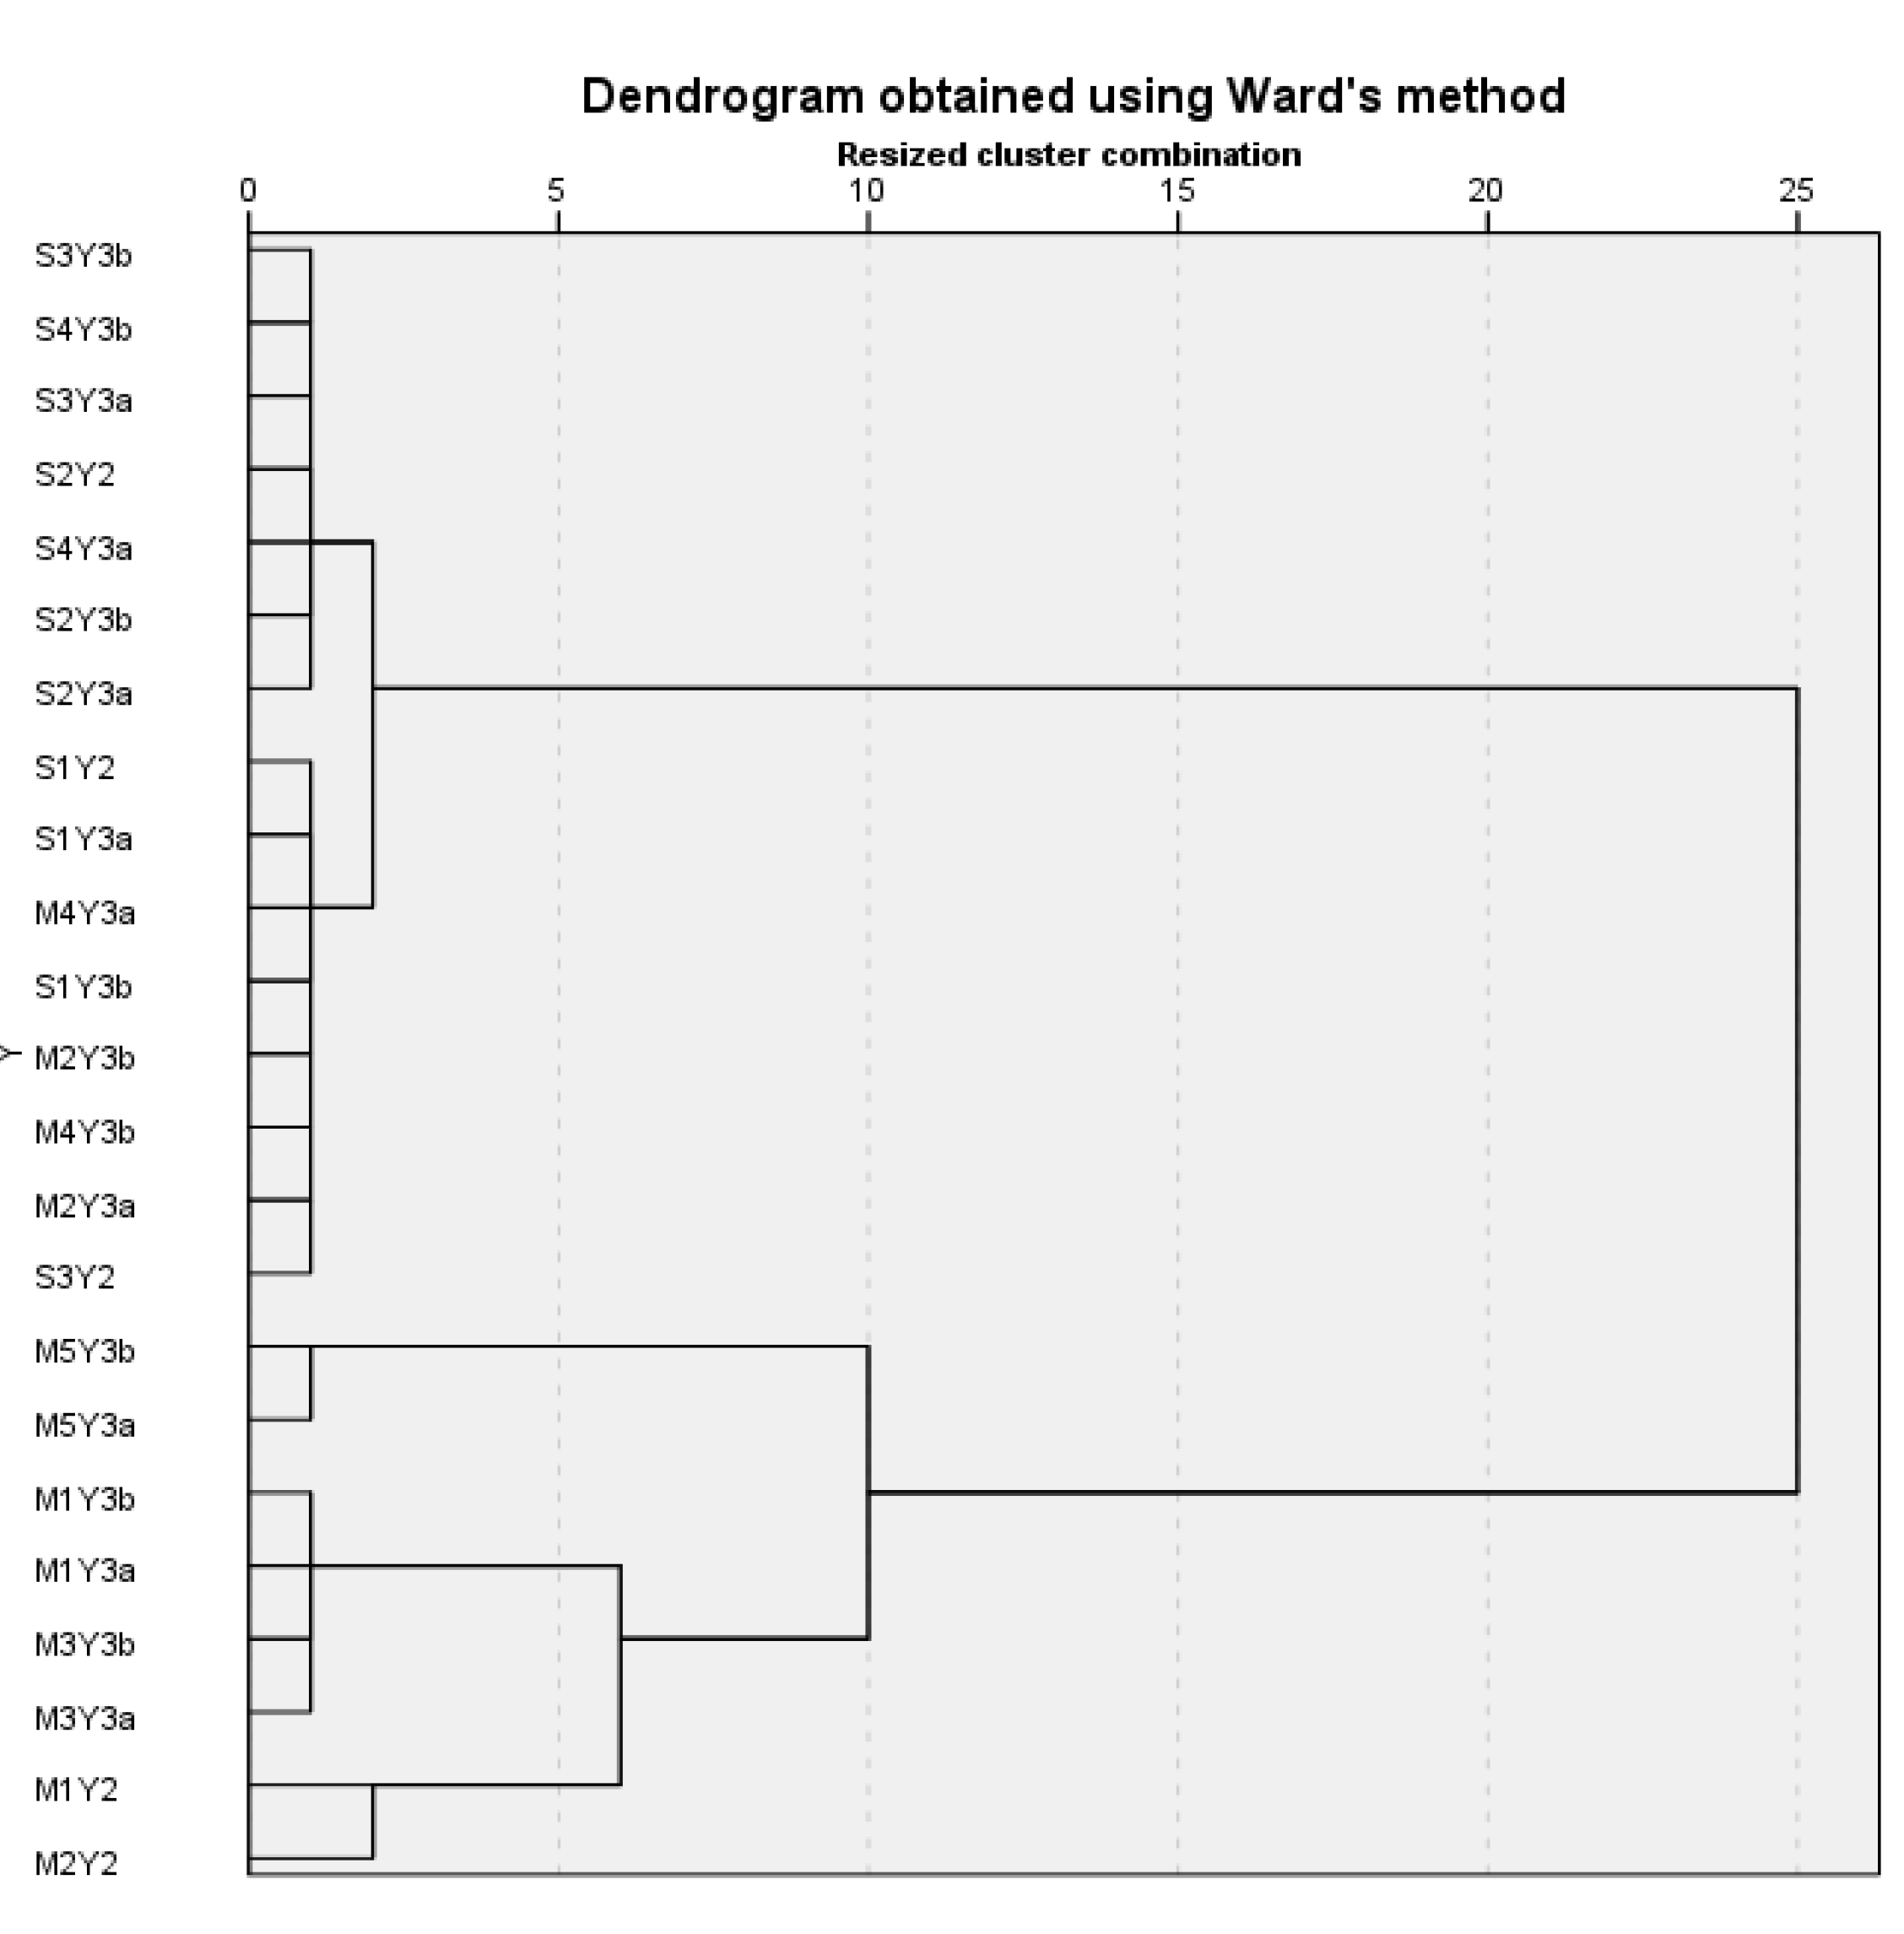
Table 3.
Clusters detected and their compositions.
| Cluster | Samples in the Clusters | Origin of the soils |
|---|---|---|
| Cluster H1 | S2Y2, S2Y3b, S2Y3a S3Y3b, S3Y3a, S4Y3b S4Y3a |
Sussundenga |
| Cluster H2 | M2Y3b, M2Y3a M4Y3b, M4Y3a S1Y2, S1Y3b, S1Y3a S3Y2 |
Manica / Sussundenga |
| Cluster H3 | M5Y3b, M5Y3a | Manica |
| Cluster H4 | M1Y3b, M1Y3a M3Y3b, M3Y3a |
Manica |
| Cluster H5 | M1Y2, M2Y2 | Manica |
Cluster H1 – This cluster corresponds to pristine soils with no metal concentration above the reference value and is mainly constituted by soils from the Sussundenga district.
Cluster H2 – This cluster is characterised by a relatively high average concentration of chromium and a high standard deviation (102±95 mg/kg). This high error results from the relatively high concentration of chromium in the Manica soils M2 and M4 and the relatively low concentration of chromium in the Sussundenga soils S1 and S3Y2. Nevertheless, these Manica soils show the lowest chromium concentration of all the Manica soils under study and the other metal concentrations are below the reference values. This cluster H2 contains soils with higher concentrations of metals than cluster H1, but are below the reference values, except for chromium from the Manica soils.
Cluster H3 – This cluster, constituted by soils from the M5 farm, is characterised by relatively high concentrations, above the reference values, for the metals chromium, cobalt, copper, nickel and vanadium.
Cluster H4 – This cluster, constituted by soils from the third campaign of the M1 and M3 farms, is characterised by relatively high concentrations, above the reference values, for the metals chromium, cobalt, nickel and vanadium.
Cluster H5 - This cluster, constituted by soils from the second campaign of the M1 and M2 farms, is characterised by relatively high concentrations, above the reference values, for the metals chromium, cobalt and nickel. However, the errors in the concentrations of Cr, Co and Ni of this cluster are very high, which results from the relatively lower concentration of metals in the soil of the M2 farm.
This analysis shows that the soils from the Manica district have environmental quality issues that should be studied in more detail, particularly the bioavailability/bioaccumulation of these toxic metals in the food produced in those farms. Indeed, relatively high levels of chromium, cobalt, copper, nickel and vanadium, or parts of these, can be detected in the soils of Manica. In the opposite situation, the soils from the Sussumdenga district are pristine.
The H3 cluster that corresponds to the soil of the Manica farm M5 constitutes an outlier that results from a geological anomaly. Indeed, this farm is expected to be abandoned, and a mining operation will be installed in the area.
Table 4.
Average and standard deviation of the metal concentration (mg/kg) in the five clusters of soil samples observed by unsupervised hierarchical clustering.
Table 4.
Average and standard deviation of the metal concentration (mg/kg) in the five clusters of soil samples observed by unsupervised hierarchical clustering.
| Cluster H1 | Cluster H2 | Cluster H3 | Cluster H4 | Cluster H5 | |
|---|---|---|---|---|---|
| Ba | 18 (3) | 33 (12) | 110 (14) | 63 (2) | 50 (24) |
| Cr | 4 (4) | 102 (95) | 315 (7) | 1700 (355) | 840 (791) |
| Co | 1 (1) | 11 (7) | 59 (4) | 101 (13) | 48 (44) |
| Cu | 1 (2) | 9 (5) | 115 (7) | 34 (4) | 22 (13) |
| Pb | 4 (1) | 8 (4) | 18 (1) | 9 (1) | 76 (16) |
| Ni | 1 (2) | 34 (32) | 120 (14) | 715 (84) | 379 (425) |
| V | 5 (3) | 27 (10) | 280 (0) | 96 (16) | 61 (35) |
| Zn | 0 | 13 (2) | 53 (11) | 30 (2) | 24 (9) |
The analysis of the discriminating capacity of the metal concentration. As presented in Table S5, all the metals have statistically discriminating capacity. However, copper and vanadium have the highest discriminating potential (lower Wilks Lambda and F tests) (Table S5). Also, the linear discriminant plot analysis in Figure S2 shows that, considering their heavy metal composition, the clusters are indeed dissimilar with different specific properties.
5. Conclusions
Agricultural soils must be continuously monitored to allow its agro-environmental management in order to increase the quantity and quality of food production. In developing countries this is particularly important because food production can increase due to the increase of arable land, that results from uncontrolled or illegal deforestation, and not due to an increase of crops yield. This transformation on the use of soil is highly environmental damaging, with strong impact in climate change, and degrades soil health. Indeed, major efforts should be focused on the protection of soils with emphasis on the agronomical and environmental components.
The soils from the Manica and Sussundenga districts in Mozambique constitute a typical case study of the sub-Sahara African soils, where the production yields are low resulting from very unhealthy soils with a dramatic macro and micronutrients shortage. The macroscopic consequence of this situation will reflect in the local economy, characterised by poverty, and in the human health.
This work allowed to define clusters of similar quality soils and to identify their specific deficiencies and problems. This information can guide future corrective measures under a strategic plan to restore and improve the fertility of the local soils. However, technical support must be granted for the soil restoration of the pH, organic matter and fertilizers sustainable utilization. National and local governments should lead this process mainly because, besides the soils health care, other critical basic problems must be solved, like infrastructures for products transportation.
There is already enough information that supports that populations will thrive if agricultural production is of good quality and quantity. Once the diagnosis is made, like it was demonstrated in this paper, it is possible to define priorities so that the populations will work to get rid of the poverty traps where they are imbedded, and ensure environmental, social, and economic sustainability.
Supplementary Materials
The following supporting information can be downloaded at the website of this paper posted on Preprints.org.
Author Contributions
Conceptualization. M.P., J.L. and J.E.S.; writing—original draft preparation. M.P., J.L. and J.E.S.; writing—review and editing. M.P., J.L. and J.E.S.; supervision. J.E.S.; funding acquisition. J.E.S. All authors have read and agreed to the published version of the manuscript.
Funding
We acknowledge FCT for funding the R&D Unit CIQUP (UIDB/000081/2020) and the Associated Laboratory IMS (LA/P/0056/2020).
Data Availability Statement
The data presented in this study are available on request from the corresponding author.
Conflicts of Interest
The authors declare no conflict of interest.
References
- Barrett, C.; Bevis, L. The self-reinforcing feedback between low soil fertility and chronic poverty. Nat. Geosci. 2015, 8, 907–912. [Google Scholar] [CrossRef]
- Kim, K.; Bevis, L. Soil Fertility and Poverty in Developing Countries. Choices 2019. 34. Quarter 2. Available online: http://www.choicesmagazine.org/choices-magazine/theme-articles/soil-health-policy-in-the-united-states-and-abroad/soil-fertility-and-poverty-in-developing-countries.
- Government of Mozambique. Voluntary National Review of Agenda 2030 for Sustainable Development; Government of Mozambique: Maputo, Mozambique, 2020. [Google Scholar]
- Marassiro. M.J.; Romarco de Oliveira. M.L.; Pereira, G.P. Family farming in Mozambique: Characteristics and challenges. Research. Society and Development 2021, 10, e22110615682. [Google Scholar] [CrossRef]
- Panagos, P.; Jones, A.; Lugato, E.; Ballabio, C. A Soil Monitoring Law for Europe. Global Challenges 2025, 9, 2400336. [Google Scholar] [CrossRef] [PubMed]
- Chianu, J.N.; Chianu, J.N.; Mairura, F. Mineral fertilizers in the farming systems of sub-Saharan Africa. A review. Environmental and Resource Economics 2019, 74, 1239–1271. [Google Scholar] [CrossRef]
- Maria, R.M.; Yost, R. A Survey of Soil Fertility Status of Four Agroecological Zones of Mozambique. Soil Science 2006, 171, 902–914. [Google Scholar] [CrossRef]
- Chichongue, O.; van Tol, J.; Ceronio, G.; Preez, C.D. Effects of Tillage Systems and Cropping Patterns on Soil Physical Properties in Mozambique. Agriculture 2020, 10, 448. [Google Scholar] [CrossRef]
- Serrani. D.; Cocco, S.; Cardelli, V.; D’Ottavio, P.; Rafael, R.B.A.; Feniasse, D.; Vilanculos, A.; Fernández-Marcos, M.L.; Giosué, C.; Tittarelli, F.; Corti, G. Soil fertility in slash and burn agricultural systems in central Mozambique. Journal of Environmental Management 2022, 322, 116031. [Google Scholar] [CrossRef]
- Folmer, E.C.R.; Geurts. P.M.H.; Francisco, J.R. Assessment of soil fertility depletion in Mozambique. Agriculture. Ecosystems and Environment 1998, 71, 159–167. [CrossRef]
- Pereira, M.J.S.L.; Esteves da Silva, J. Assessment of the Quality of Agricultural Soils in Manica Province (Mozambique). Environments 2024, 11, 67. [Google Scholar] [CrossRef]
- Tittonella, P.; Gillerb, K.E. When yield gaps are poverty traps: The paradigm of ecological intensification in African smallholder agriculture. Field Crops Research 2013, 143, 76–90. [Google Scholar] [CrossRef]
- Morris, M.; Kelly, V.A.; Kopicki, R.J.; Byerlee, D. Fertilizer use in African agriculture: Lessons learned and good practice guidelines. The World Bank. 2007. Available: https://documents.worldbank.org/pt/publication/documents-reports/ documentdetail/498591468204546593/fertilizer-use-in-african-agriculture-lessons-learned-and-good-practice-guidelines. (accessed on 19 June 2025).
- Denning, G.; Kabambe, P.; Sanchez, P.; Malik, A.; Flor, R.; Harawa, R.; Nkhoma, P.; Zamba, C.; Banda, C.; Magombo, C.; Keating, M.; Wangila, J.; Sachs, J. Input Subsidies to Improve Smallholder Maize Productivity in Malawi: Toward an African Green Revolution. PLoS Biology 2009, 7, e1000023. [Google Scholar] [CrossRef] [PubMed]
- Sanchez, P.A.; Swaminathan, M.S. Hunger in Africa: the link between unhealthy people and unhealthy soils. Lancet 2005, 365, 442–44. [Google Scholar] [CrossRef]
- Bevis, L.; Kim, K.; Guerena, D. Soil zinc deficiency and child stunting: Evidence from Nepal. Journal of Health Economics 2023, 87, 102691. [Google Scholar] [CrossRef]
- Morton, C.M.; Pullabhotla, H.; Bevis, L.; Lobell, D.B. Soil micronutrients linked to human health in India. Scientific Reports 2023, 13, 13591. [Google Scholar] [CrossRef]
- Priya, A.K.; Muruganandam. M.; Ali, S.S.; Kornaros, M. Clean-Up of Heavy Metals from Contaminated Soil by Phytoremediation: A Multidisciplinary and Eco-Friendly Approach. Toxics 2023, 11, 422. [CrossRef]
- Wuana, R.A.; Okieimen, F.E. Heavy Metals in Contaminated Soils: A Review of Sources. Chemistry. Risks and Best Available Strategies for Remediation. ISRN Ecology 2011, 402647. [CrossRef]
- Xin, X.; Shentu, J.; Zhang, T.; Yang, X.; Baligar, V.C.; He, Z. Sources. Indicators and Assessment of Soil Contamination by Potentially Toxic Metals. Sustainability 2022, 14, 15878. [Google Scholar] [CrossRef]
- Zhao, H.; Wu, Y.; Lan, X.; Yang, Y.; Wu, X.; Du, L. Comprehensive assessment of harmful heavy metals in contaminated soil in order to score pollution level page range. Scientific Reports 2022, 12, 3552. [Google Scholar] [CrossRef]
- Rashid, A.; Schutte, B.J.; Ulery, A.; Deyholos, M.K.; Sanogo, S.; Lehnhoff, E.A.; Beck, L. Heavy Metal Contamination in Agricultural Soil: Environmental Pollutants Affecting Crop Health. Agronomy 2023, 13, 1521. [Google Scholar] [CrossRef]
- Mitra, S.; Chakraborty, J.C.; Tareq, A.M.; Emran, T.B.; Nainu, F.; Khusro, A.; Idris, A.M.; Khandaker, M.U.; Osman, H.; Alhumaydhi, F.A.; Simal-Gandara, J. Impact of heavy metals on the environment and human health: Novel therapeutic insights to counter the toxicity. Journal of King Saud University – Science 2022, 34, 101865. [Google Scholar] [CrossRef]
- Yanga, S.; Suna, L.; Suna, Y.; Songa, K.; Qina, Q.; Zhu, Z.; Xue, Y. Towards an integrated health risk assessment framework of soil heavy metals pollution: Theoretical basis, conceptual model, and perspectives. Environmental Pollution 2013, 316, 120596. [Google Scholar] [CrossRef]
- Sarker, A.; Kim, J.E.; Islam, A.; Bilal, M.; Rakib, R.; Nandi, R.; Rahman, M.M.; Islam, T. Heavy metals contamination and associated health risks in food webs—a review focuses on food safety and environmental sustainability in Bangladesh. Environmental Science and Pollution Research 2022, 29, 3230–3245. [Google Scholar] [CrossRef] [PubMed]
- Pereira, M.J.S.L.; Esteves da Silva, J. Environmental Stressors of Mozambique Soil Quality. Environments 2024, 11, 125. [Google Scholar] [CrossRef]
- Seaton, F. Soil health cluster analysis based on national monitoring of soil indicators. European Journal of Soil Science 2021, 72, 2414–2429. [Google Scholar] [CrossRef]
- Webster, R.; Burrough, P.A. Multiple discriminant analysis in soil survey. European Journal of Soil Science 1974, 25, 120–134. [Google Scholar] [CrossRef]
- Rerkasem, B.; Jamjod, S.; Pusadee, T. Productivity limiting impacts of boron deficiency, a review. Plant Soil 2020, 455, 23–40. [Google Scholar] [CrossRef]
- Contaminated Soils - Technical Guide. REFERENCE VALUES. To the ground. Amadora. January 2019. (Review 3 - September 2022). Portuguese Environment Agency (APA). Solos Contaminados – Guia Técnico. VALORES DE REFERÊNCIA. PARA O SOLO. AMADORA. JANEIRO DE 2019. (REVISÃO 3 – SETEMBRO DE 2022). Agencia Portuguesa do Ambiente (APA).
- Raso, E.F.; Savaio, S.S.; Mulima, E.P. Impact of artisanal gold mining on agricultural soils: Case of the district of Manica. Mozambique. Revista Verde 2022, 17, 44–50. [Google Scholar] [CrossRef]
- Leuenberger, A.; Winkler, M.S.; Cambaco, O.; Cossa, H.; Kihwele, F.; Lyatuu, I.; Zabre, H.R.; Farnham, A.; Macete, E.; Munguambe, K. S.; Cambaco, O.; Cossa, H.; Kihwele, F.; Lyatuu, I.; Zabre, H.R.; Farnham, A.; Macete, E.; Munguambe, K. Health impacts of industrial mining on surrounding communities: Local perspectives from three sub-Saharan African countries. PLoS ONE 2021, 16, e0252433. [Google Scholar] [CrossRef]
- Dondeyne, S.; Ndunguru, E.; Rafael, P.; Bannerman, J. Artisanal mining in central Mozambique: Policy and environmental issues of concern. Resources Policy 2009, 34, 45–50. [Google Scholar] [CrossRef]
- Shahbazi, K.; Marzi, M.; Rezaei, H. Heavy metal concentration in the agricultural soils under the different climatic regions: a case study of Iran. Environmental Earth Sciences 2020, 79, 324. [Google Scholar] [CrossRef]
- Daulta, R.; Prakash, M.; Goyal, S. Metal content in soils of Northern India and crop response: a review. International Journal of Environmental Science and Technology 2023, 20, 4521–4548. [Google Scholar] [CrossRef]
- Li, R.; Wang, J.; Zhou, Y.; Zhang, W.; Feng, D.; Su, X. Heavy metal contamination in Shanghai agricultural soil. Heliyon 2023, 9, e22824. [Google Scholar] [CrossRef]
Disclaimer/Publisher’s Note: The statements, opinions and data contained in all publications are solely those of the individual author(s) and contributor(s) and not of MDPI and/or the editor(s). MDPI and/or the editor(s) disclaim responsibility for any injury to people or property resulting from any ideas, methods, instructions or products referred to in the content. |
© 2025 by the authors. Licensee MDPI, Basel, Switzerland. This article is an open access article distributed under the terms and conditions of the Creative Commons Attribution (CC BY) license (https://creativecommons.org/licenses/by/4.0/).
Copyright: This open access article is published under a Creative Commons CC BY 4.0 license, which permit the free download, distribution, and reuse, provided that the author and preprint are cited in any reuse.


