Submitted:
21 June 2025
Posted:
23 June 2025
You are already at the latest version
Abstract
This paper conducts a technical study on a method for determining the occurrence threshold of wind shear based on historical sounding data. After analyzing the impact of low-altitude wind shear on aircraft flight safety, a method for determining the occurrence threshold of wind shear based on historical sounding data is proposed. A statistical analysis of the sounding data from the test area over a period of 15 years from 2010 to 2024has been conducted, which includes the occurrence events and probability statistics of 1000m wind shear for all 12 months of the year. Simulation results validate the feasibility and effectiveness of the method for determining the occurrence threshold of wind shear based on historical sounding data in the test area, forming a method that can be extended to all altitude ranges of aircraft flight and all flight regions globally. This statistical method provides a technical foundation for the efficient detection of wind shear at local airports and enhances flight safety at these airports.
Keywords:
sounding data
; wind shear
; statistical fitting
; threshold
1. Introduction
The international aviation and meteorological community has recognized that windshear is the weather phenomenon that poses the greatest threat to the safety of aircraft during take-off and landing [1,2]. Wind shear is a weather phenomenon caused by sudden changes in wind speed in the horizontal and vertical directions, and strong wind shear is the main factor that causes aircraft flight, take-off and landing accidents. Therefore, countries around the world have always paid considerable attention to the problem of wind shear[3,4]. According to statistics from the Civil Aviation Administration of China, wind shear is the main cause of 4% of near-landing accidents and the ninth leading cause of major aviation casualties. China has a large land area, complex terrain, unpredictable meteorological conditions, and aviation accidents caused by wind shear are not uncommon. Weather is responsible for 70% of irregular flights at some of China’s busy plateau airports, and wind shear is the main weather factor[5]. Efficient monitoring of wind farms and timely identification of windshear is particularly important and urgent in aviation safety.
Due to the strong suddenness, small scale, short lifespan, and highly destructive characteristics of wind shear, traditional detection instruments have difficulty capturing and providing timely early warnings. Therefore, identifying and warning about wind shear is a major issue faced by the international aviation community. As a result, there is an urgent need to solve how to achieve high-resolution real-time effective monitoring of aircraft wind shear.
In the mid-70s of the last century, Japan was the first to start the study of low-level wind shear [6], and then the severe storm test in the United States set some thresholds to distinguish mesoscale cyclone shear from other types of wind shear [7]. In 1985, Harris et al. first proposed an interpolation filtering synthetic shear algorithm [8]. Then, Uyeda and Zrnic proposed a gust front recognition algorithm based on the magnitude of the radial change [9]. Subsequently, Witt (1989) improved the algorithm, and after double verification, the vertical wind field continuity test was more accurate [10]. In 2004, Kopp F (2004) proposed an aircraft wake vortex recognition algorithm based on 2μm pulsed lidar [11]. In 2007, Keohan successfully identified dry windshear [12].
The research on the identification of wind shear has started relatively late in China. In 2000, Hu Mingbao and others successfully detected wet wind shear using the least squares method to calculate synthetic wind shear [13]. In 2002, Hong Kong Airport independently developed a system for automatic early warning of low-altitude wind shear, which was frequently used in the glide path scanning method during aircraft takeoff and approach landing phases [14,15]. In 2007, Wang Nan and Liu Liping proposed an automatic wind shear identification method based on the analysis of radial velocity field information from Doppler weather radar [16]. In 2010, Wei Yao and Zhang Xingkan experimentally demonstrated that the least squares shear recognition algorithm is highly effective and easy to implement [17]. In 2013, Zheng Jiafeng and others successfully identified wind shear caused by gust fronts [18]. Jiang Lihui and others conducted three-dimensional simulation of four types of low-altitude wind shear and proposed a method for recognizing wind shear through multi-feature extraction image texture [19,20]. From 2012 to 2014, Chen Baiwei identified wind shear based on the eddy dissipation rate (EDR) [21], however, since the thresholds for the parameters used in the algorithm have not been explicitly determined internationally, it is still necessary to choose the empirical thresholds through multiple experiments if it is to be applied in practice.
In summary, many studies on the detection and identification of low-altitude wind shear have been carried out at home and abroad, and the methods are diverse and different. However, the method of statistically determining the windshear threshold and then identifying the windcut edges using the historical sounding data of the experimental area is not involved. Based on this, the following research is carried out and summarized.
2. Principles and Implementation Process
The threshold for wind shear mentioned in this article refers to the magnitude of the wind speed achieved by the difference in wind vectors that causes wind shear. That is, when the difference in wind vectors at a specified height reaches the threshold wind speed, it can be determined that wind shear occurs at that height.
After analyzing the influence of low-altitude wind shear on aircraft flight safety, this paper proposes a method for determining the threshold of wind shear based on historical sounding data, which simulates and verifies the feasibility and effectiveness of the method for determining the threshold of wind shear based on historical sounding data, and this statistical method can be extended to all altitude ranges of aircraft flight and all flight areas in the world. It provides a technical basis for the efficient detection of local airport wind shear and the improvement of airport flight safety in the later stage.
2.1. Theoretical Derivation
This paper first briefly outlines the specific theoretical derivation and the process of experimental verification. That is, based on the theory of the tropospheric wind shear index and wind shear intensity, it implements a method for determining the threshold for wind shear occurrence in the sounding meteorological bureau of the experimental area, and subsequently analyzes the patterns of wind shear in the experimental area, in order to prepare for the efficient detection of wind shear at local airports and to enhance flight safety.
Wind shear refers to the changes in wind speed and/or direction in the air layer above an airport, including variations in updrafts and downdrafts. It is widely agreed that the causes of wind shear include thunderstorms, fronts, sea-land breezes, jet streams, low-level temperature inversions, aircraft wake turbulence, and the terrain surrounding the airport. The intensity and spatiotemporal scales of wind shear vary significantly depending on the background, which leads to different hazards for flight. Based on changes in flight trajectory, wind shear can be classified as tailwind, headwind, crosswind, and vertical airflow shear.
The Wind Shear Index is a metric used to measure how wind speed changes with altitude. Near-surface wind speed often exhibits characteristics of uneven airflow distribution with height due to the properties of atmospheric motion and the influence of the underlying surface environment, resulting in complex and varied wind shear characteristics. Because the underlying surface on land is much more complex than that of the ocean, the wind shear index is particularly important for onshore wind energy development, as it can be used to optimize the optimal hub height for wind turbines. Furthermore, for disaster prevention and mitigation, major engineering fields such as tall buildings, bridges, aviation, and communications are susceptible to disasters caused by strong winds, making the study of wind engineering parameters like the wind shear index under severe wind conditions a significant area of focus.
The wind shear occurrence threshold is the minimum wind speed reached by the difference in wind vectors for wind shear to occur. That is, when the difference in wind vectors at a specified height reaches the threshold wind speed, it can be determined that wind shear occurs at that height. The vertical distribution of near-surface wind speed mainly depends on the surface roughness and the stratification state of the lower atmosphere. In neutral atmospheric stratification, the vertical profile of near-surface wind speed can usually be fitted with power law and logarithmic law equations, with the power law formula being:
Where: α denotes the wind shear index; Vy is the wind speed corresponding to the desired height of Zy, in m/s; Vx is the measured known wind speed corresponding to the height Zx, in m/s.
Vy= Vx*(Zy/Zx)α
From Equation (1) we know:
α=lg(V2/V1)/(lg(Z2/Z1))
In the above equation: α represents the wind shear index; Z1 and Z2 denote the height in meters; V1 is the wind speed corresponding to height Z1, in m/s; V2 is the wind speed corresponding to height Z2, in m/s.
The wind shear in this paper refers to the shear of wind speed at the required altitude and the wind vector shear calculated by subtracting the lower wind from the upper wind of two adjacent layers at the required elevation. Based on the historical sounding data of the test area, the wind speed shear is defined as the upper layer wind speed at the required altitude minus the lower layer wind speed; the wind vector shear is defined as the upper wind vector at the required altitude minus the lower wind vector, with the specific formulas as follows:
Where ws1 and wd1 are the wind speed and direction of a certain layer, ws2 and wd2 are the wind speed and wind direction of the previous layer corresponding to WS1, θ is the angle between the two layers of vector wind direction, and PWS is the modulus of the wind vector shear.
Currently, there is no unified standard for the threshold of wind shear in China’s civil aviation. The LLWAS system used at airports in the United States employs six anemometer stations at the airport level, consisting of one central station and five outstations, with a distance of about 3 km between the central station and the outstations. The presence of wind shear is determined by calculating the wind speed vector difference between each outstation and the central station. The FAA stipulates that when the wind speed vector difference between each outstation and the central station exceeds 7.7 m/s per minute, the LLWAS system will issue an alarm.
This paper defines the modulus of the vector difference of wind speed as the value of wind shear intensity. The formula for calculating wind shear intensity is:
Where ws1 and wd1 are the wind speed and direction of a certain layer, ws2 and wd2 are the wind speed and wind direction of the previous layer corresponding to WS1, θ is the angle between the two layers of vector wind direction, and PWS is the value of wind shear intensity..
2.2. Implementation Process
By using historical sounding data from the experimental area, this paper statistically analyzes the occurrence events and probabilities of wind shear in the region. The key issues and challenges in understanding the characteristics of wind shear occurrence involve determining the threshold for wind shear, which is defined as the difference between the upper and lower layer wind vectors at the required altitude. Once this threshold is established, an event of wind shear is deemed to occur if the criteria are exceeded; conversely, if not exceeded, it is classified as a no wind shear event. Therefore, the determination of the wind shear occurrence threshold greatly influences the success probability of the statistical algorithm. This study utilizes historical sounding data from the experimental area to calculate the relationship between the wind shear index at an altitude of 1000m and the wind speeds of the two adjacent layers at that altitude. It derives the fitting relationship between the wind shear index and wind speed from the historical data, identifies the wind speed corresponding to the wind shear occurrence threshold, and subsequently determines this threshold for the experimental region.
Based on the threshold for wind shear occurrence in the experimental area, the number of wind shear events and the occurrence probability from the historical sounding data in that area were determined, and the patterns of wind shear events in the experimental area were analyzed. The specific implementation steps are as follows:
Step 1: Compile the profiles of atmospheric parameters such as temperature and humidity obtained from all historical sounding data in the experimental area, perform pre-processed of all historical data for wind shear simulation, and remove invalid data.
Step 2: Input the pre-processed sounding statistics of the experimental area into the wind shear index calculation model at the specified altitude of the experimental area to obtain the wind shear index, wind shear intensity, and wind speed vector data collection at different height levels for all effective sounding data in the experimental area.
Step 3: Extract the wind shear index set at the required altitude of 1000m and the wind speed vector set of the two adjacent layers at 1000m from the pre-processed sounding statistical data collection of the experimental area to obtain the wind shear index at the required altitude and the statistical fitting curve of the corresponding wind speed for all effective sounding data. The fitting curve here is a set of multiple fitting curves of wind speed relative to the wind shear index at the required altitude.
Step 4: The minimum wind speed for determining the occurrence of wind shear in the experimental area is obtained by using a set of statistical fitting curves of the wind shear index and the corresponding wind speed at altitude, thus deriving the threshold for the occurrence of wind shear at the required altitude in the experimental area..
Step 5: The low-altitude wind shear index, wind shear intensity, and other wind shear parameters corresponding to the demand altitude of all valid sounding data in the experimental area are incorporated into the wind shear occurrence conditions—where the wind shear intensity exceeds the wind shear occurrence threshold—to obtain the number of low-altitude wind shear events and their occurrence probability at the demand altitude of the experimental area.
The following uses the historical sounding data of the Qingdao area from 2010 to 2024 over 15 years as an example to determine the threshold for wind shear occurrence at an altitude of 1000m based on the historical sounding dataset from the Qingdao region.
3. Simulation Validation Experiments and Results
The historical sounding data of the Qingdao area from 2010 to 2024 over 15 years was used to conduct the simulation verification experiments for the wind shear threshold determination method described in this paper.
3.1. Simulation Verification Experiment
Firstly, according to Step 1 of Section 2.2: Analyze the altitude, pressure, wind speed, and wind direction profile data obtained from the historical cumulative sounding data in the Qingdao area, remove invalid values from all historical wind speed and wind direction profile data, and obtain the effective wind speed and wind direction profile data. Next, Interpolate historical sounding data based on the height of characteristic layer data.
Secondly, all valid wind speed and wind direction profile data in the Qingdao area are entered into the following formula:
α=lg(V2/V1)/(lg(Z2/Z1))
The wind shear index, wind shear intensity, and wind speed vector datasets at different altitude levels of all valid historical sounding data in the Qingdao area were obtained.
Next, extract the wind shear index data collection, wind shear intensity data collection, and wind speed vector data collection at 1000m altitude from the pre-processed sounding statistical data in the Qingdao area. Statistically fit the wind shear index at 1000m and the wind speed at the corresponding height for all valid sounding data, obtaining the wind shear index at 1000m and the fitting curve set for wind speed at the corresponding height in the Qingdao area. The fitting curves here represent a set of multiple fitting curves for wind speed relative to the wind shear index at the required elevation.
In this paper, wind speed and wind shear index have been fitted by multiple polynomials several times. The polynomial fitting formula is:
Among them, p(x) is a polynomial fitting function, referring to wind speed here, p1, p2, .......pn, pn+1 is a fitted polynomial coefficient, x here refers to the wind shear index.
Using the above formula, polynomial fitting of wind speed and wind trimming index with different powers is carried out for many times, and the common intersection point of multiple fitting curves is found. This patent holds that the wind speed corresponding to this intersection point is the threshold of wind shear. That is, when the wind speed value is greater than the intersection point, it is determined that the wind shear event will occur, otherwise it will not happen.
The wind speed at the focal point where the fitting curve set intersects with the wind shear index simulation results at 1000 m altitude was determined as the threshold for assessing wind shear occurrence at 1000 m altitude in the Qingdao area.
Integrating the required wind shear indicator data collection, wind shear intensity data collection, and the wind speed vector datasets of the two adjacent layers at 1000m altitude from the pre-processed sounding statistical data in the Qingdao region, along with the wind shear occurrence conditions—where the wind shear intensity exceeds the wind shear occurrence threshold—we obtain low-altitude wind shear events and their occurrence probabilities at 1000m altitude in the Qingdao region.
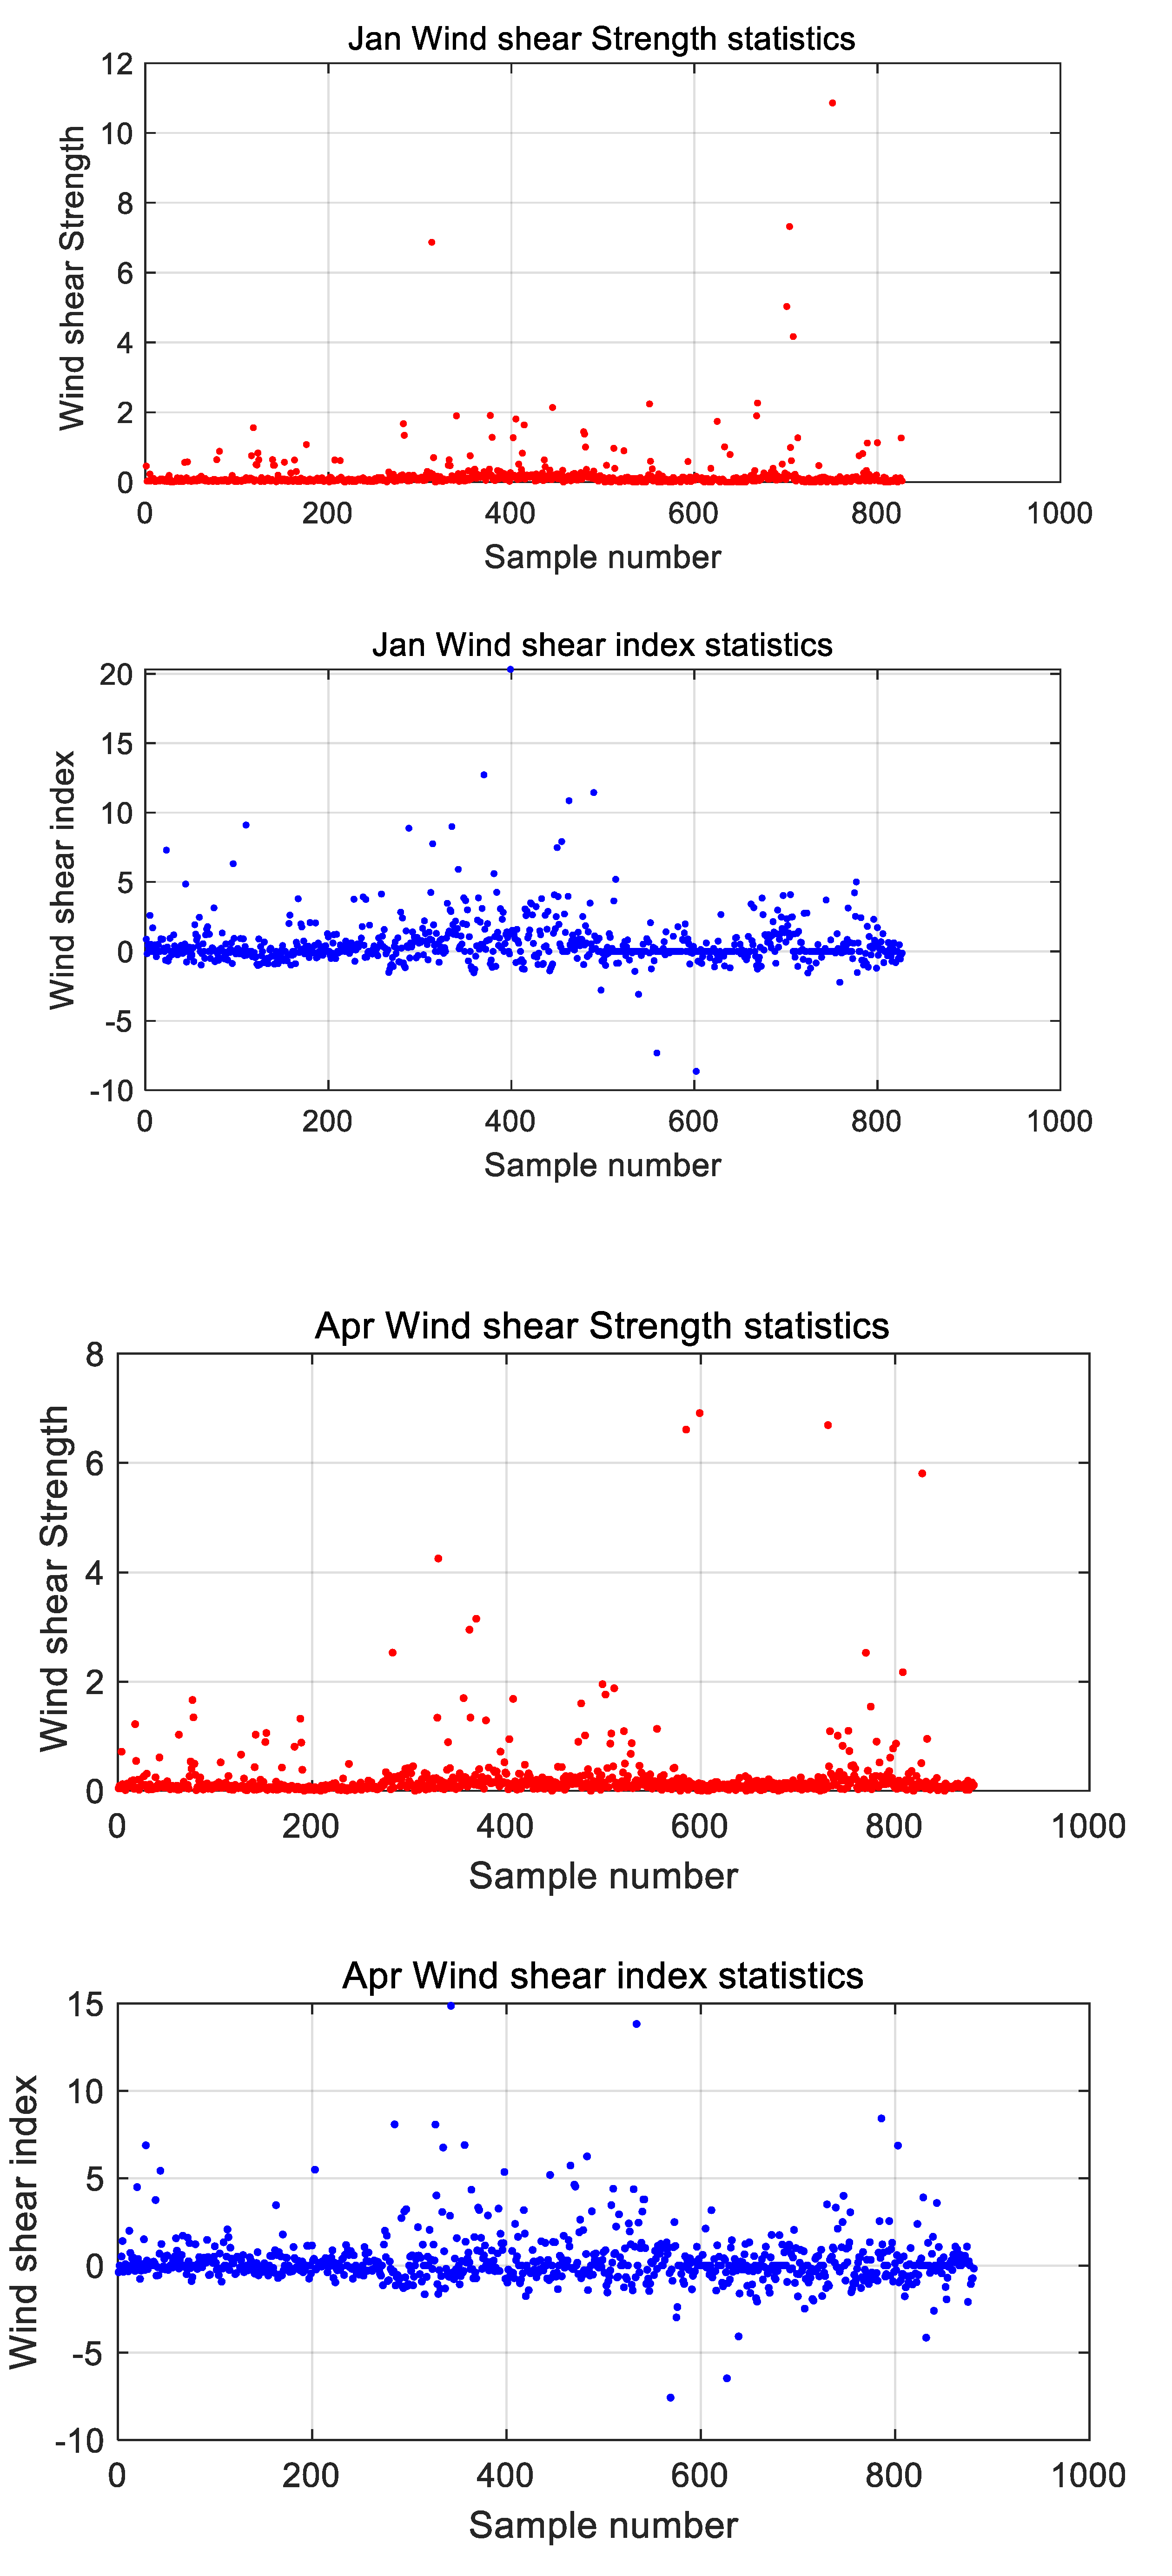
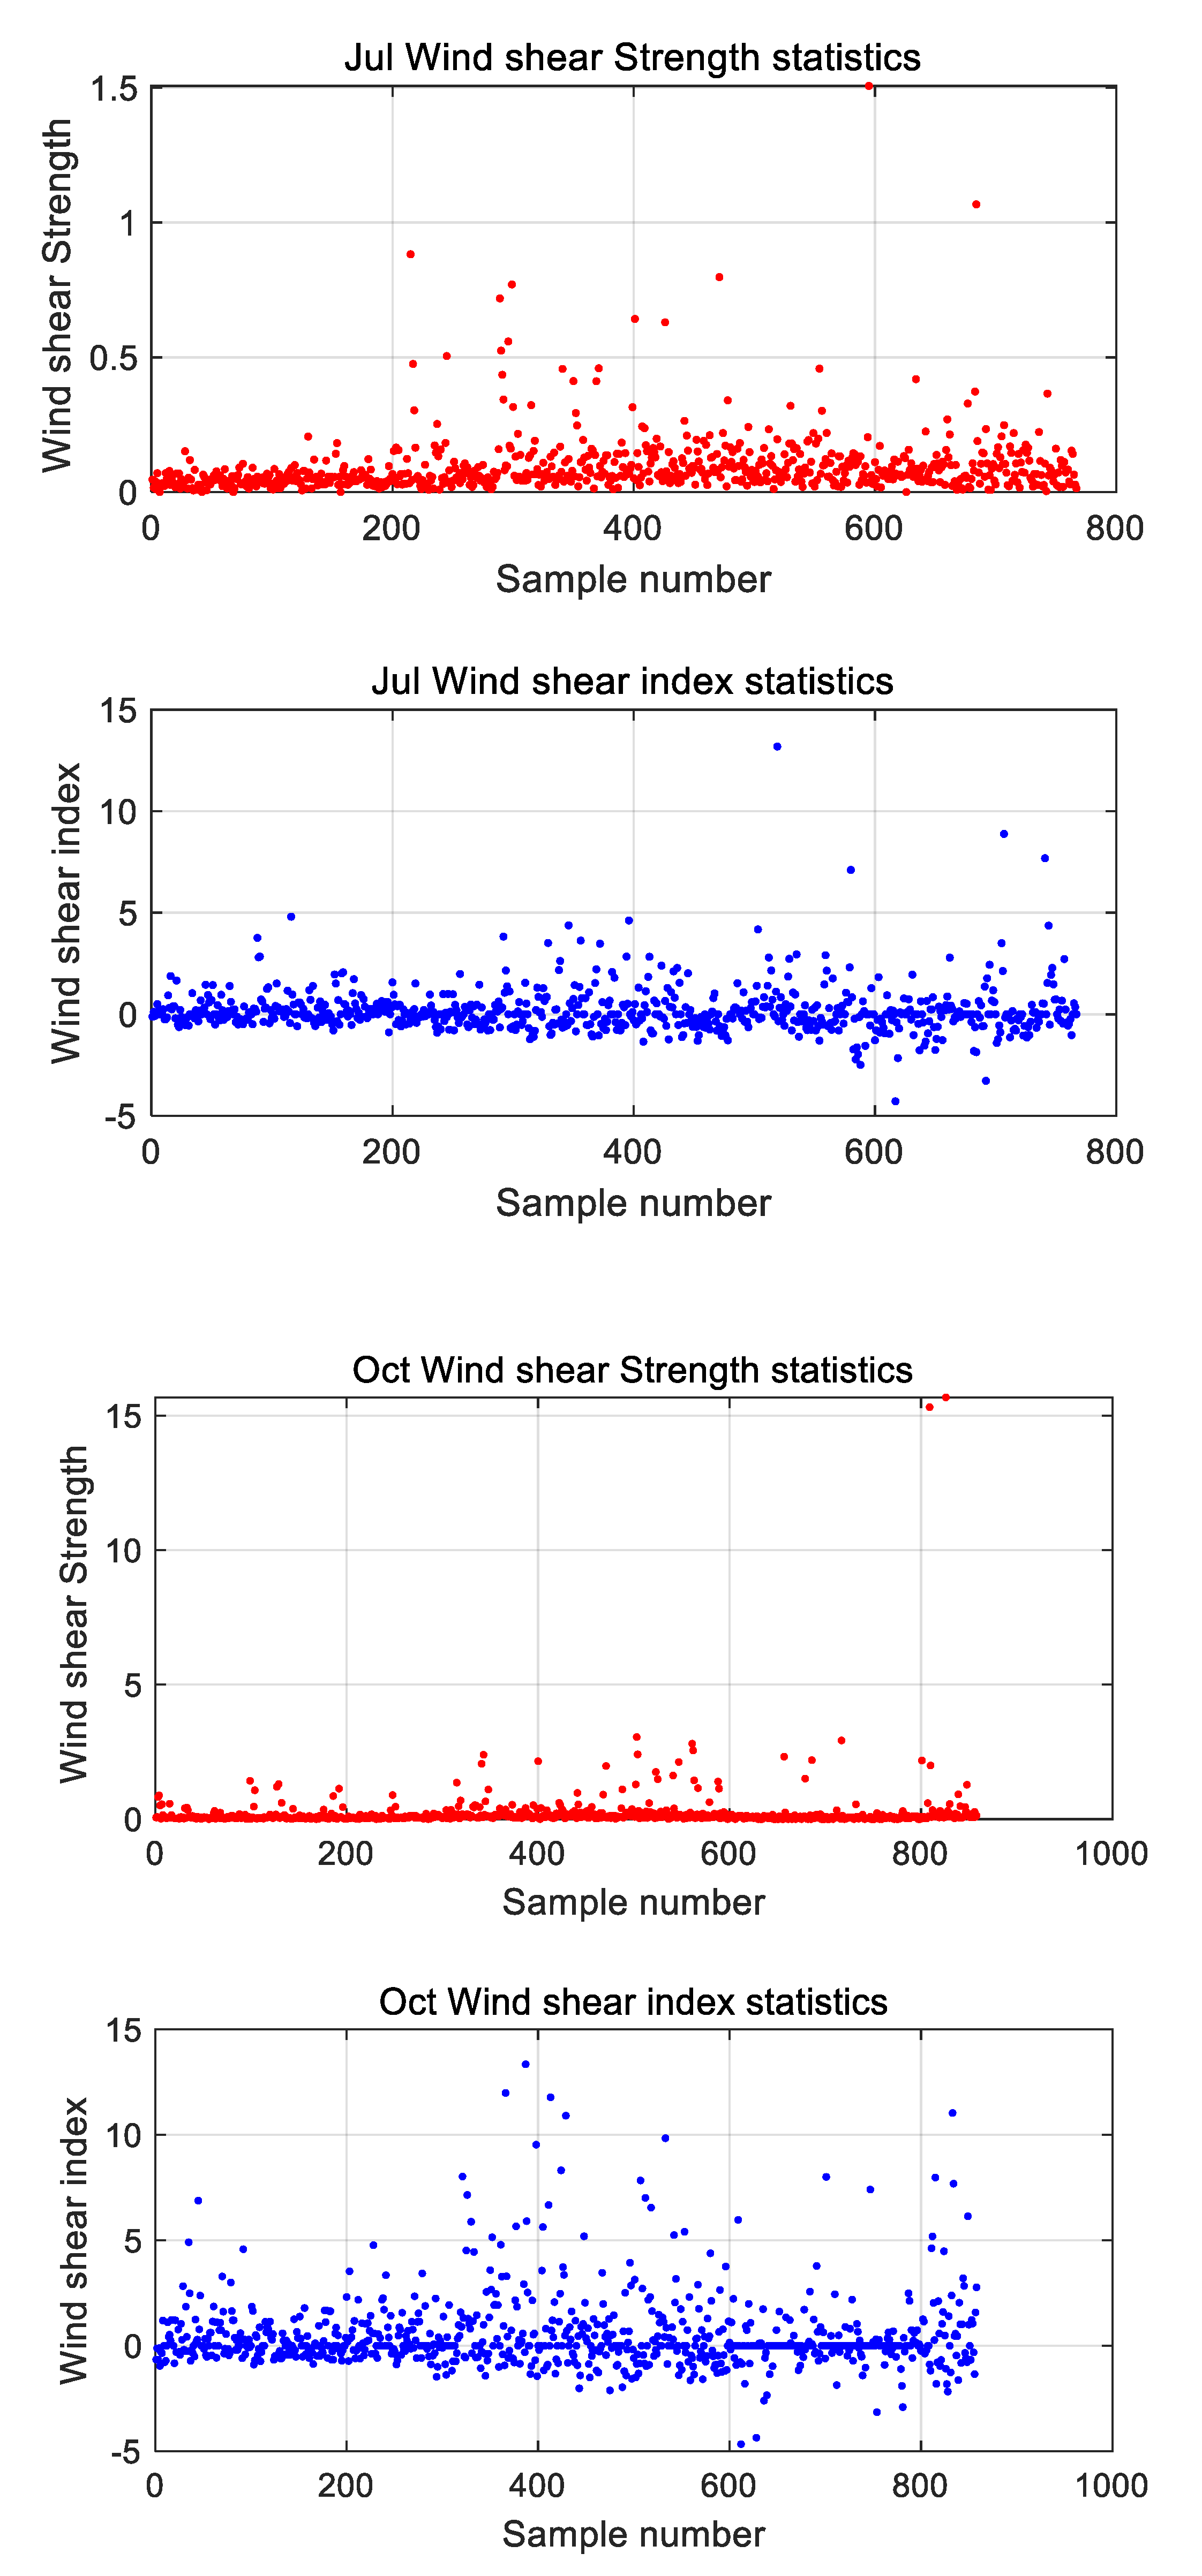
The following statistics of the effective historical sounding data collected in the Qingdao area over 15 years from 2010 to 2024 present the wind shear index and wind shear intensity at an altitude of 1000m for two adjacent layers across all 12 months of the year. The typical months representing each season are January, April, July, and October, which correspond to the data for the entire year; the statistical results are shown in the figure below.
Figure 1.
This chart presents the simulation results of the wind shear index and wind shear intensity at 1000 meters historical sounding data in the Qingdao area throughout the year (the charts of the wind shear index and wind shear intensity are arranged from top to bottom for January, April, July, October).
The following statistics show the relationship between the wind shear index and wind speed of two adjacent layers at an altitude of 1000m over 12 months in the Qingdao area, obtained from the effective historical sounding data. The fitting relationship between the wind shear index and wind speed is calculated from the effective historical data of the Qingdao area, and the wind speed corresponding to the wind shear occurrence threshold is identified. The simulation results are shown below:
As can be seen from Figure 2, the wind speed corresponding to the wind shear threshold varies for different months.
3.2. Experimental Verification Results
From Figure 2, we can obtain the annual threshold for wind shear at an altitude of 1000 m in the Qingdao area, which is the minimum wind speed for wind shear occurrence at an altitude of 1000 m in Qingdao. The statistical results are presented in Table 1.
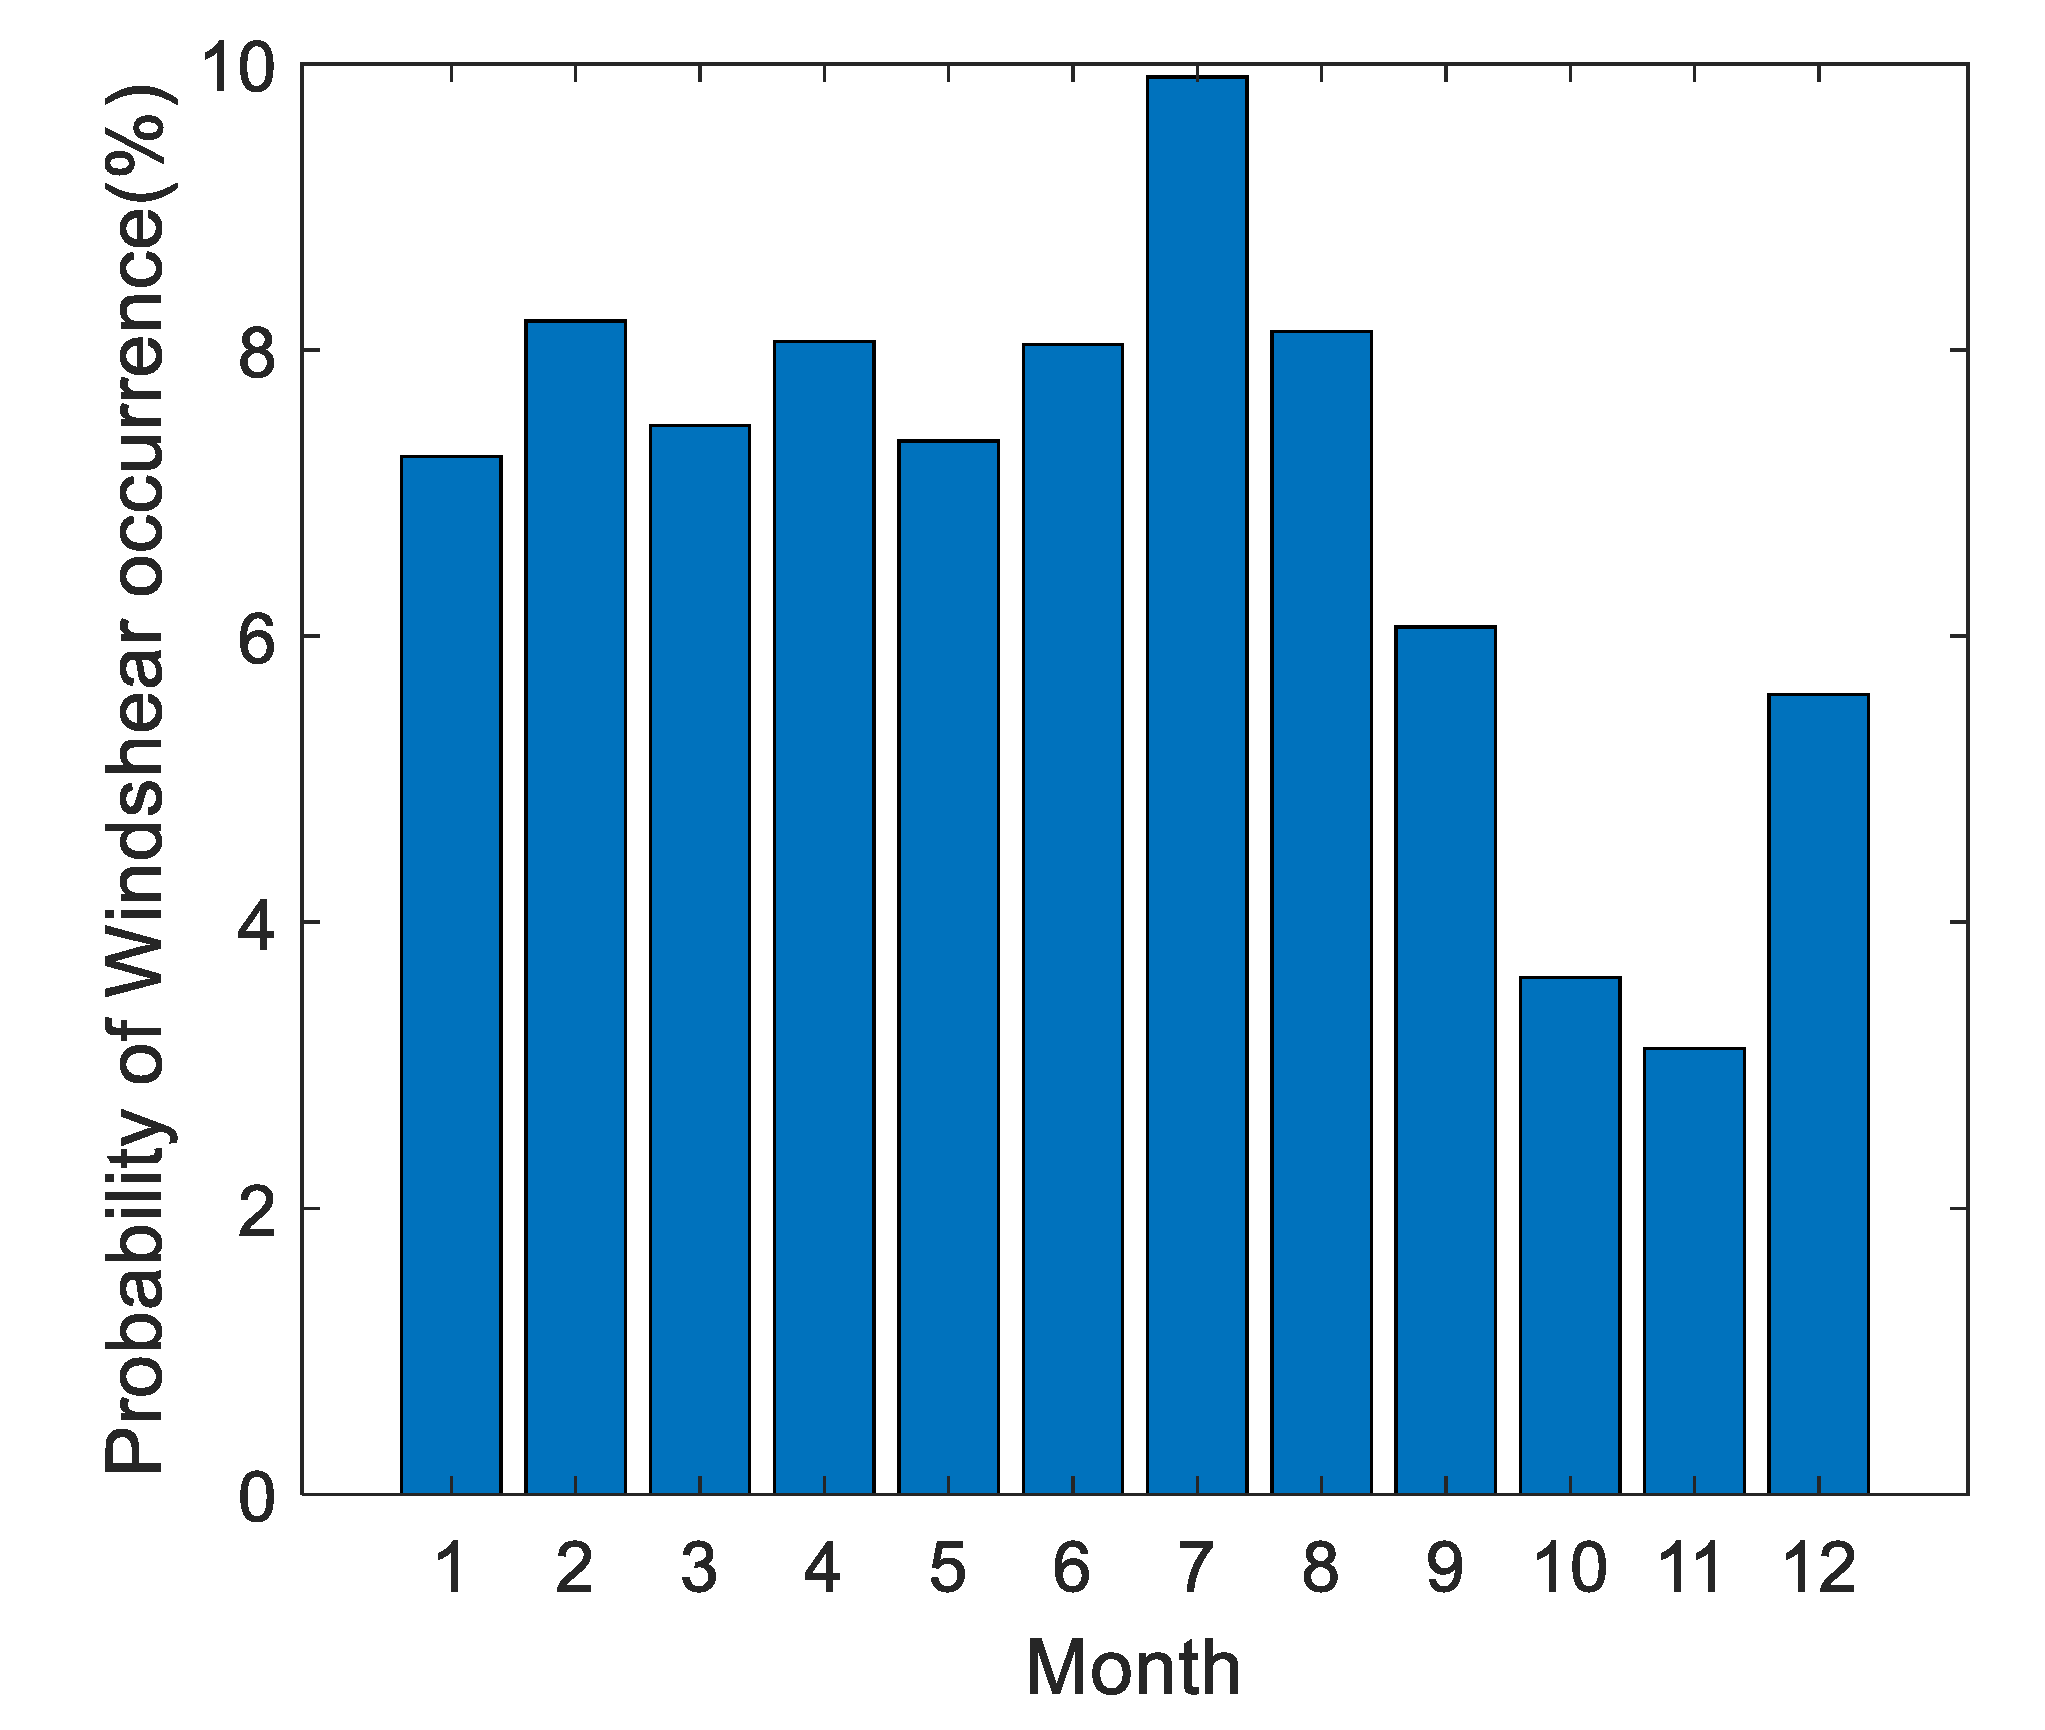
As shown in Table 1, the wind speeds corresponding to the thresholds for the occurrence of wind shear vary across different seasons. The following determines the number of wind shear events and the occurrence probabilities of the historical sounding data in Qingdao based on the wind shear thresholds at an altitude of 1000 m throughout the year in Qingdao, as illustrated in the figure below.
Figure 4.
This figure shows the probability of wind shear occurrence corresponding to the historical sounding data in Qingdao.
Figure 4.
This figure shows the probability of wind shear occurrence corresponding to the historical sounding data in Qingdao.
4. Discussion and Conclusions
This paper analyzes the probability of wind shear occurrence based on historical cumulative sounding data in the Qingdao area, examining the weather background, environmental conditions of wind shear, and its impact on aviation. The simulation validates the feasibility and effectiveness of the method for determining the threshold for wind shear occurrence based on historical sounding data, and this statistical method can be extended to all altitude ranges of aircraft flight and all flight regions worldwide. It provides a technical foundation for the efficient detection of wind shear at local airports and enhances flight safety at airports in the future.
The research findings of this paper provide an analytical method for determining the wind shear threshold significantly contribute to the promotion of passive microwave remote sensing monitoring of wind shear. Additionally, it is important to enhance the airport meteorological center forecasters’ understanding of the weather dynamics associated with wind shear, thereby improving their ability to provide accurate meteorological information for decision-making in operational departments. Furthermore, some research findings from this paper can be applied in various fields such as microwave remote sensing and detection.
Author Contributions
Conceptualization, T.S. and X.L.; methodology, T.S.; software, H.C.; validation, Q.Z., X.D. and L.L.; formal analysis, X.L.; investigation, T.S.; resources, Q.L.; data curation, X.D.; writing—original draft preparation, T.S.; writing—review and editing, H.C.; visualization, T.S.; supervision, L.L.; project administration, H.C.; funding acquisition, X.D. All authors have read and agreed to the published version of the manuscript.
Funding
This research received no external funding.
Data Availability Statement
The data used in this study are available upon request from the corresponding author due to privacy restrictions.
Acknowledgments
The authors have reviewed and edited the output and take full responsibility for the content of this publication.
Conflicts of Interest
The authors declare no conflicts of interest.
Abbreviations
The following abbreviations are used in this manuscript:
| LLWAS | Low Level Wind Shear Alert System |
References
- Shi,J. Z; Yang,C;Yu, L. S; Fei, Z. Identification and Analysis of Wind Shear Within the Transiting Frontal System at Xining International Airport Using Lidar. remote sens, 2025, 17, 732.
- Jie,D; Lei,Z; Yong,H.Z;etc.Study of Low-Level Wind Shear and Its Evolution Based on LIDAR and Aircraft Reports Identification. Plateau Meteorology, 2023, 42, 1338-1348.
- Zhang,Y; Jian,P.G;Yuan,J.Y;Yu, W;Steve H.L.Y. Vertical Wind Shear Modulates Particulate Matter Pollutions: A Perspective from Radar Wind profiler Observations in Beijing, China. remote sensing, 2020, 12, 546.
- Dragos, M; Marcel,I; Razvan, B..Wind Shear Coefficient Estimation Based on LIDAR Measurements to Improve Power Law Extrapolation Performance. remote sens, 2025, 17, 23.
- LongJ.S; Lin,L.X; Xiu,L.H ;etc, A contrast study on vertical wind shear characteristics of different underlying surfaces. Journal of Lanzhou University (Natural Sciences), 2019, 55,340-346.
- Browning,K.A; Now casting. New York Academic Press Inc,1982.
- Mccarthy, J; Wilson, J; Fujita, T. The Joint Airport Weather Studies project . Bulletin of the American Meteorological Society, 2013, 63,15-22.
- Harris,F. I; Glover,K.M; Smythe,G.R. Gust front detection and prediction. Preprints 14th conference on Severe Local Storms, Bulletin of the American Meteorological Society, Boston, 1985,342-345.
- Uyeda,H;Zrnic,D.S. Automatic Detection of Gust Fronts. J.atmos.oceanic Technol, 1985, 3,672-679.
- Hermes,L.G; Witt,A; Smith,S,D; et al. The Gust-Front Detection and Wind-Shift Algorithms for the Terminal Doppler Weather Radar System. Journal of Atmospheric & Oceanic Technology, 1993, 10, 693-709.
- Köpp,F;Rahm,S; Smalikho,I. Characterization of Aircraft Wake Vortices by 2-μm Pulsed Doppler Lidar. Journal of Atmospheric & Oceanic Technology, 2004, 21, 194-206.
- Keohan,C . Ground-based wind shear detection systems have become vital to safe operations. Icao Journal, 2007, 62, 16-34.
- Hu,M.B; ,Tan,Z.Q; Tang,D.Z; et al. Method for detecting low-level wind shear using a Doppler weather radar. Transactions of Atmospheric Sciences, 2000, 23, 113-118.
- Li,S. W. Application of Doppler Laser Radar at Hong Kong International Airport. Meeting on Civil Aviation Meteorological Services and Technical Exchange of the China Meteorological Administration. 2004.
- Chan,P. W; Le,Y.F. Application of Short-Range Lidar in Wind Shear Alerting. Journal of Atmospheric & Oceanic Technology, 2012, 29, 207–220.
- Wang,N; Liu,L.P; Xve,B.X; et al. Research on methods for identifying low-altitude wind shear and convergence lines using Doppler radar data.Annual Conference of the Chinese Meteorological Society. 2007.
- Wei,Y; Zhang,X. G.Research and Improve on a Method of Radial Velocity Azimuth Composite Shear Using Doppler Weather Radar.Journal of Electronics & Information Technology, 2010, 32, 43–47.
- Zheng,J. F; Zhang,J; Zhu,K.Y; et al. Gust Front Statistical Characteristics and Automatic Identification Algorithm for CINRAD. Journal of Meteorological Research, 2014, 28, 607–623.
- 蒋立辉Jiang,L.H; Zhang,C.Q; Xiong,X.L; et al. Study on type recognition of low-level wind shear based on radar image simulation. Laser&Infrared, 2013, 43(3):334-338.
- Hon,K. K; Chan,P.W. Application of LIDAR-derived eddy dissipation rate profiles in low-level wind shear and turbulence alerts at Hong Kong International Airport. Meteorological Applications, 2014, 21, 74–85.
- Chan,P. W. Application of LIDAR-based F-factor in wind shear alerting. Meteorologische Zeitschrift, 2012, 21, 193–204(12).
Figure 2.
The wind shear index at 1000m and the statistical fitting curves of wind speeds corresponding to heights for the 12 months obtained from the effective historical sounding data of Qingdao (the plots from top to bottom represent the fitting for months 1, 4, 7, 10).
Figure 2.
The wind shear index at 1000m and the statistical fitting curves of wind speeds corresponding to heights for the 12 months obtained from the effective historical sounding data of Qingdao (the plots from top to bottom represent the fitting for months 1, 4, 7, 10).
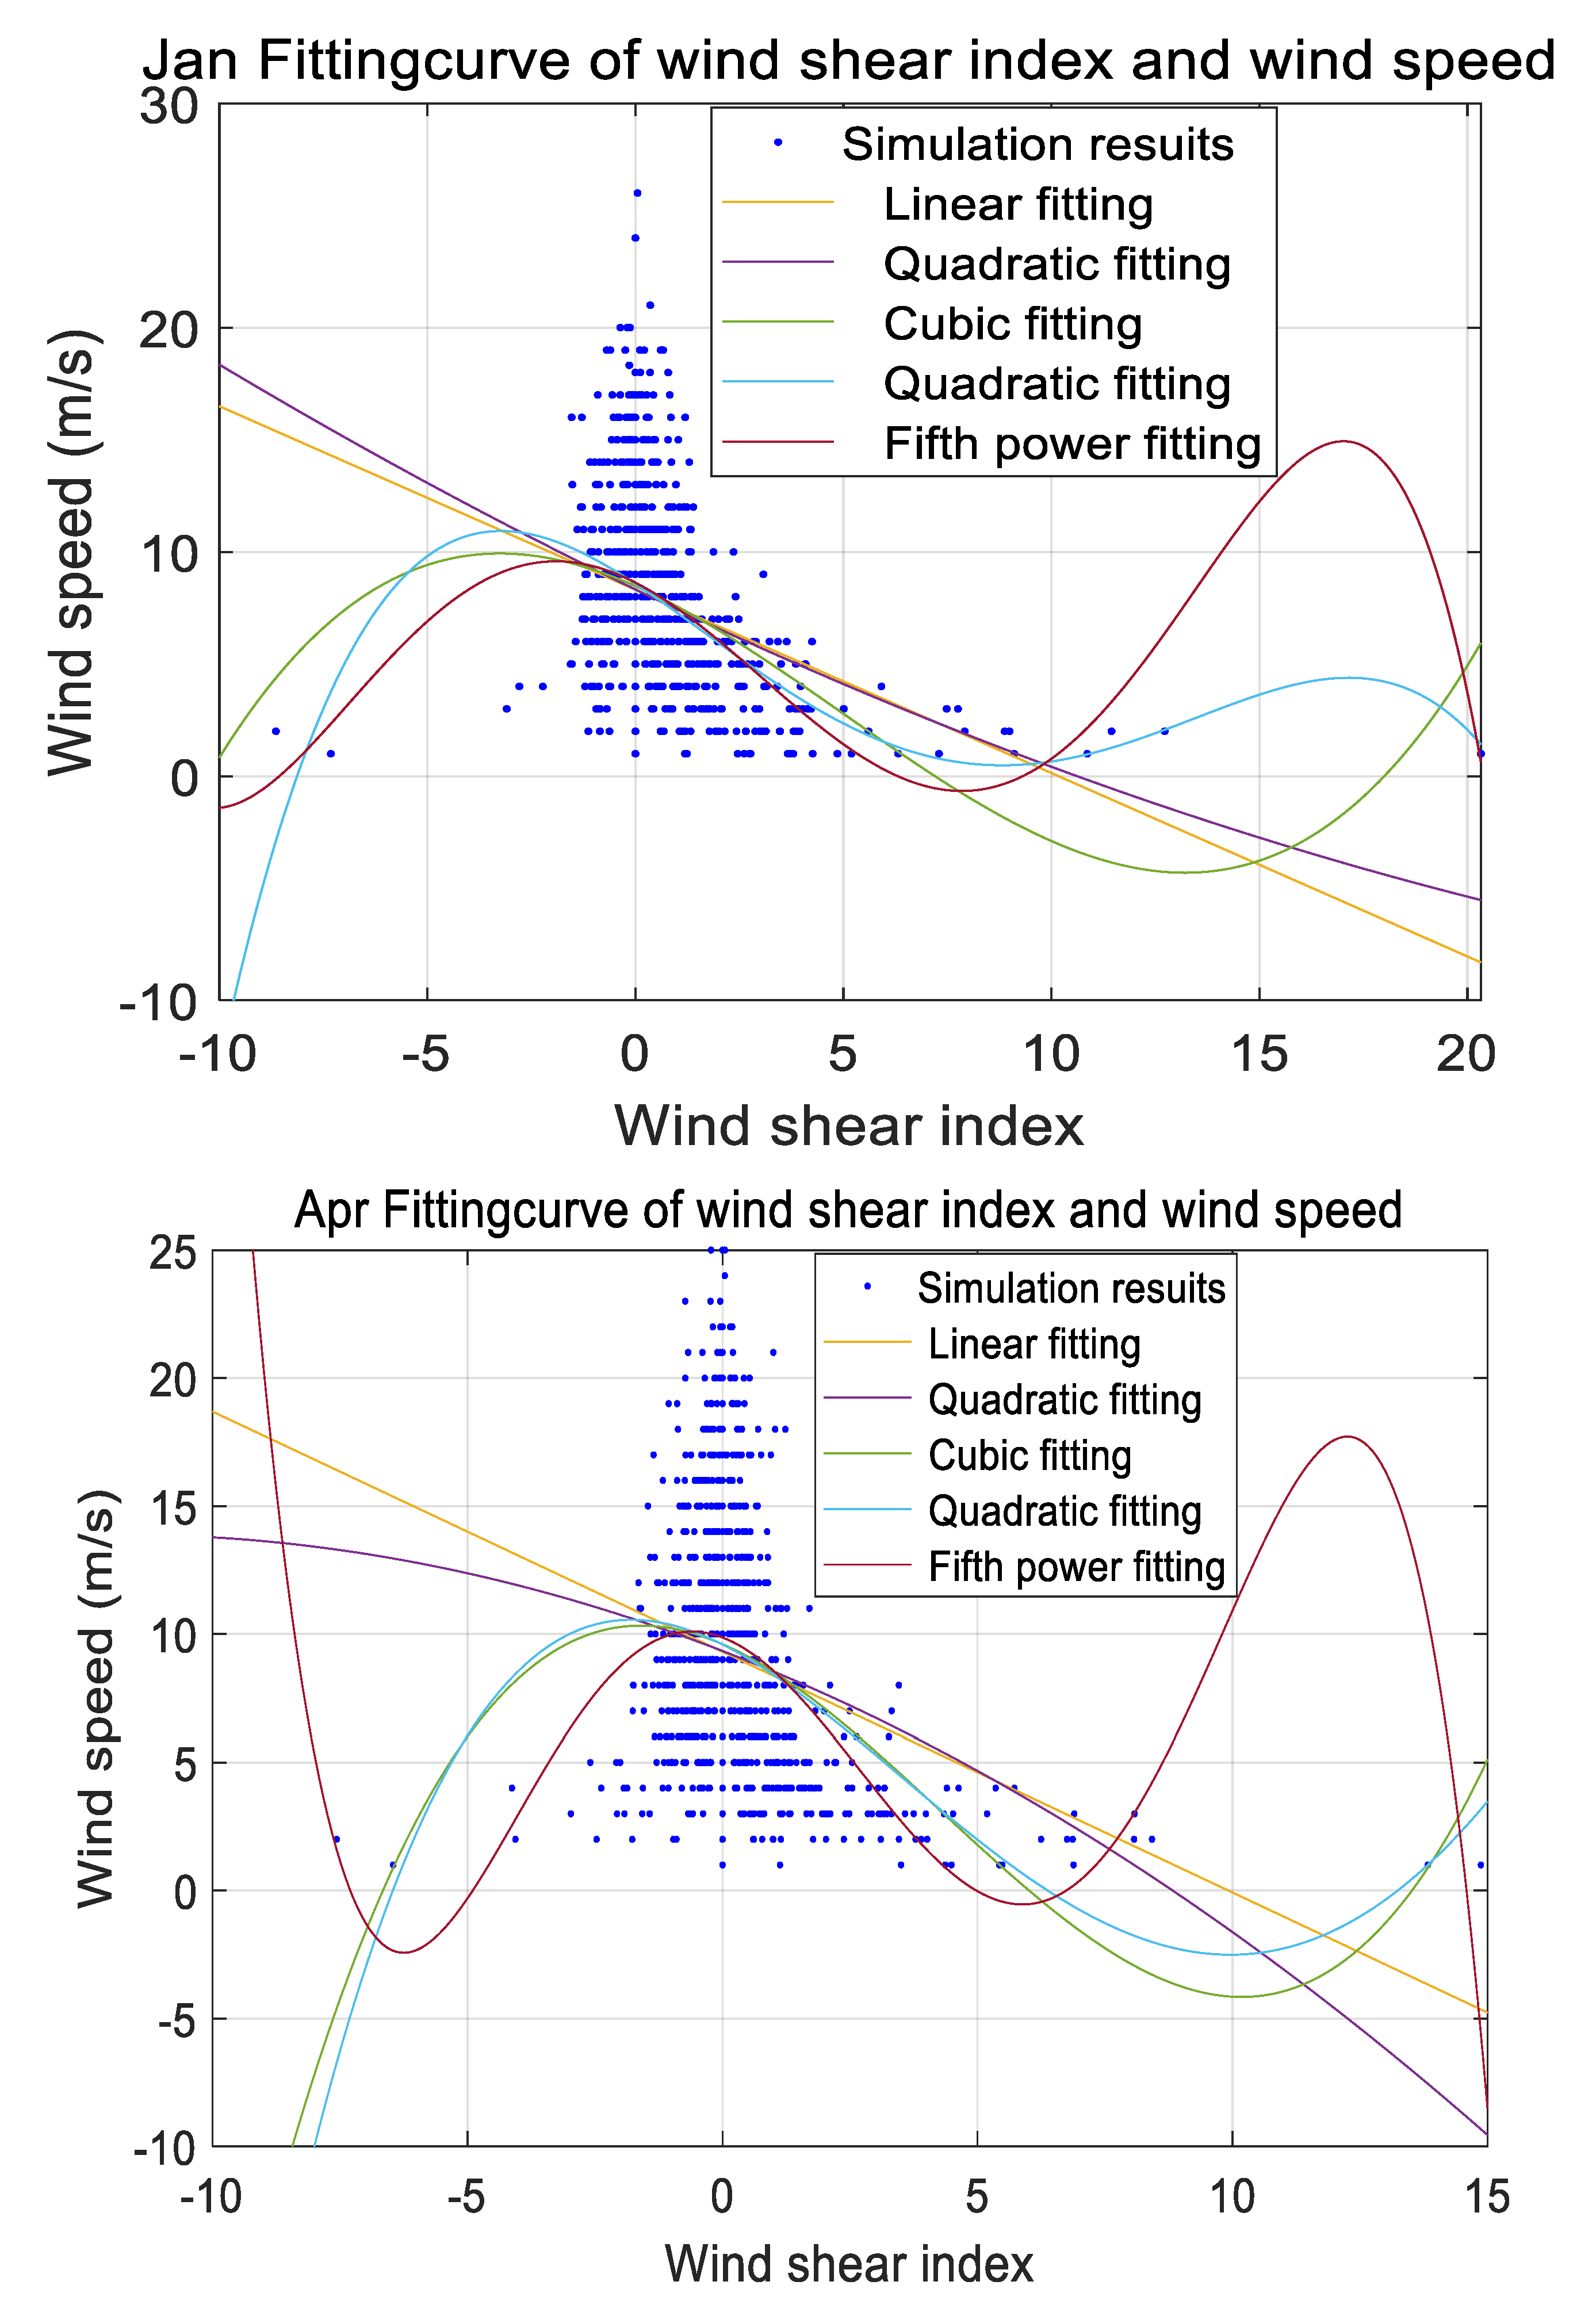
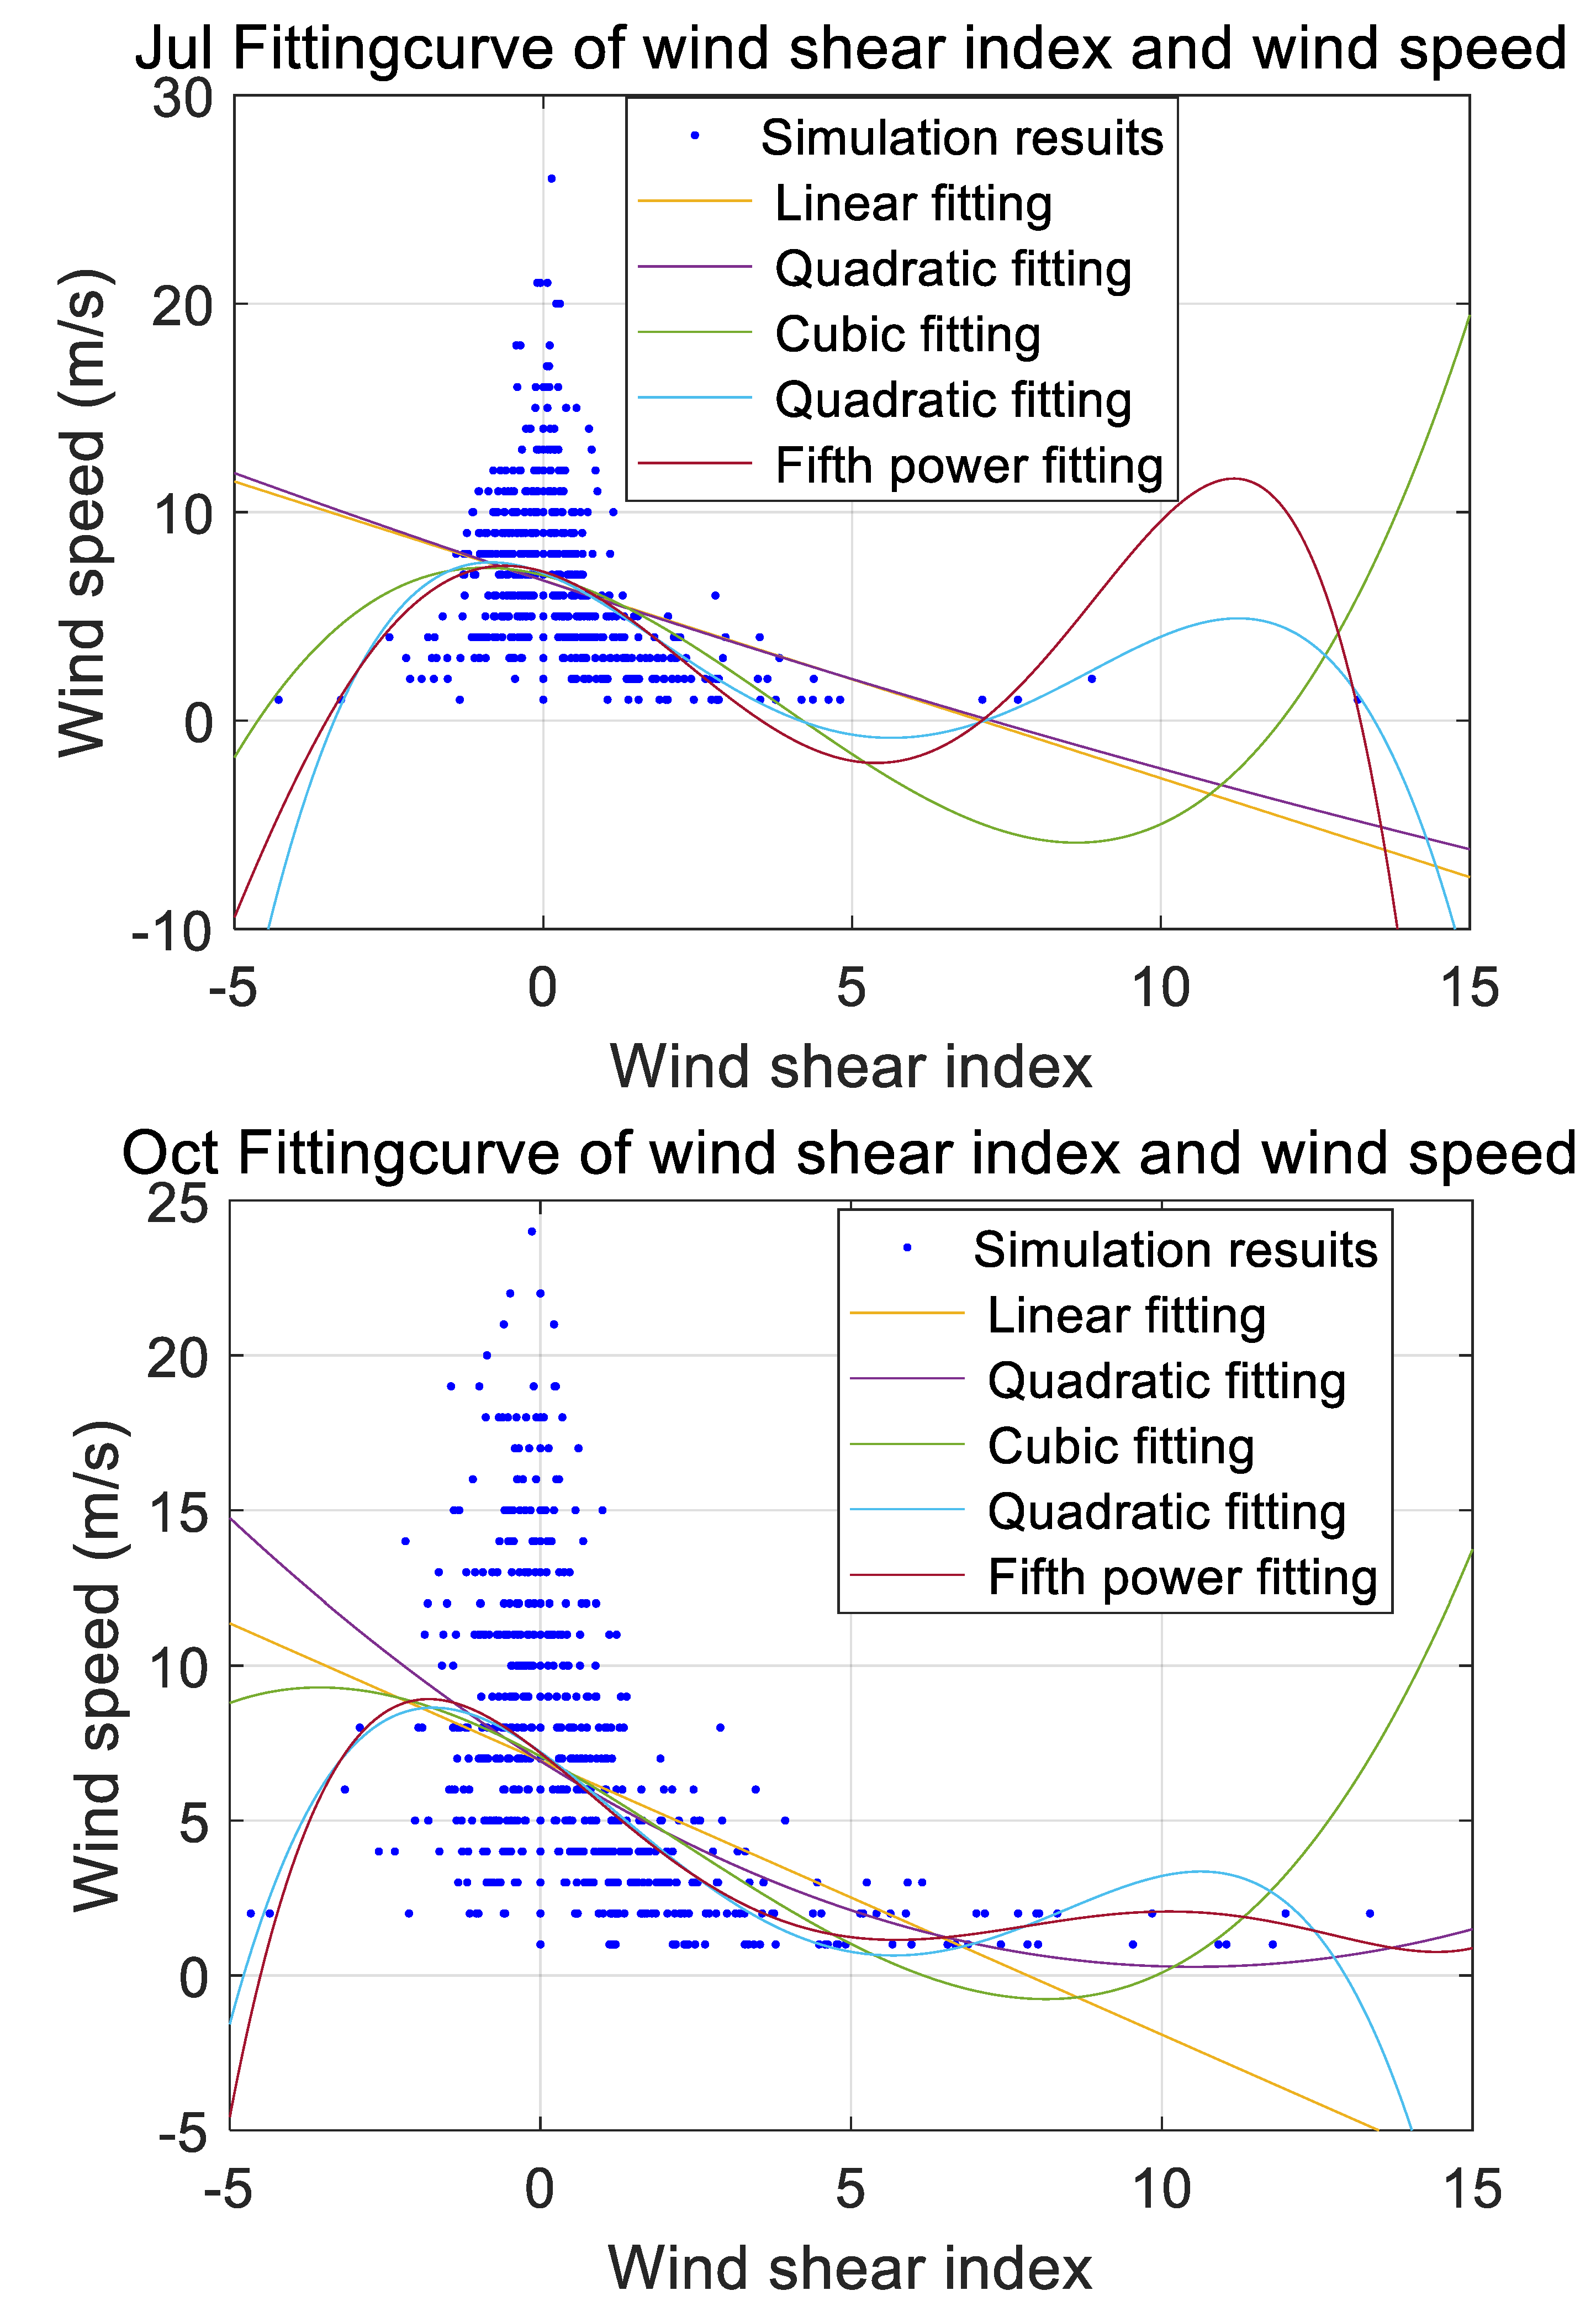
Figure 3.
This figure shows the number of wind shear events corresponding to the historical sounding data in the Qingdao region.
Figure 3.
This figure shows the number of wind shear events corresponding to the historical sounding data in the Qingdao region.
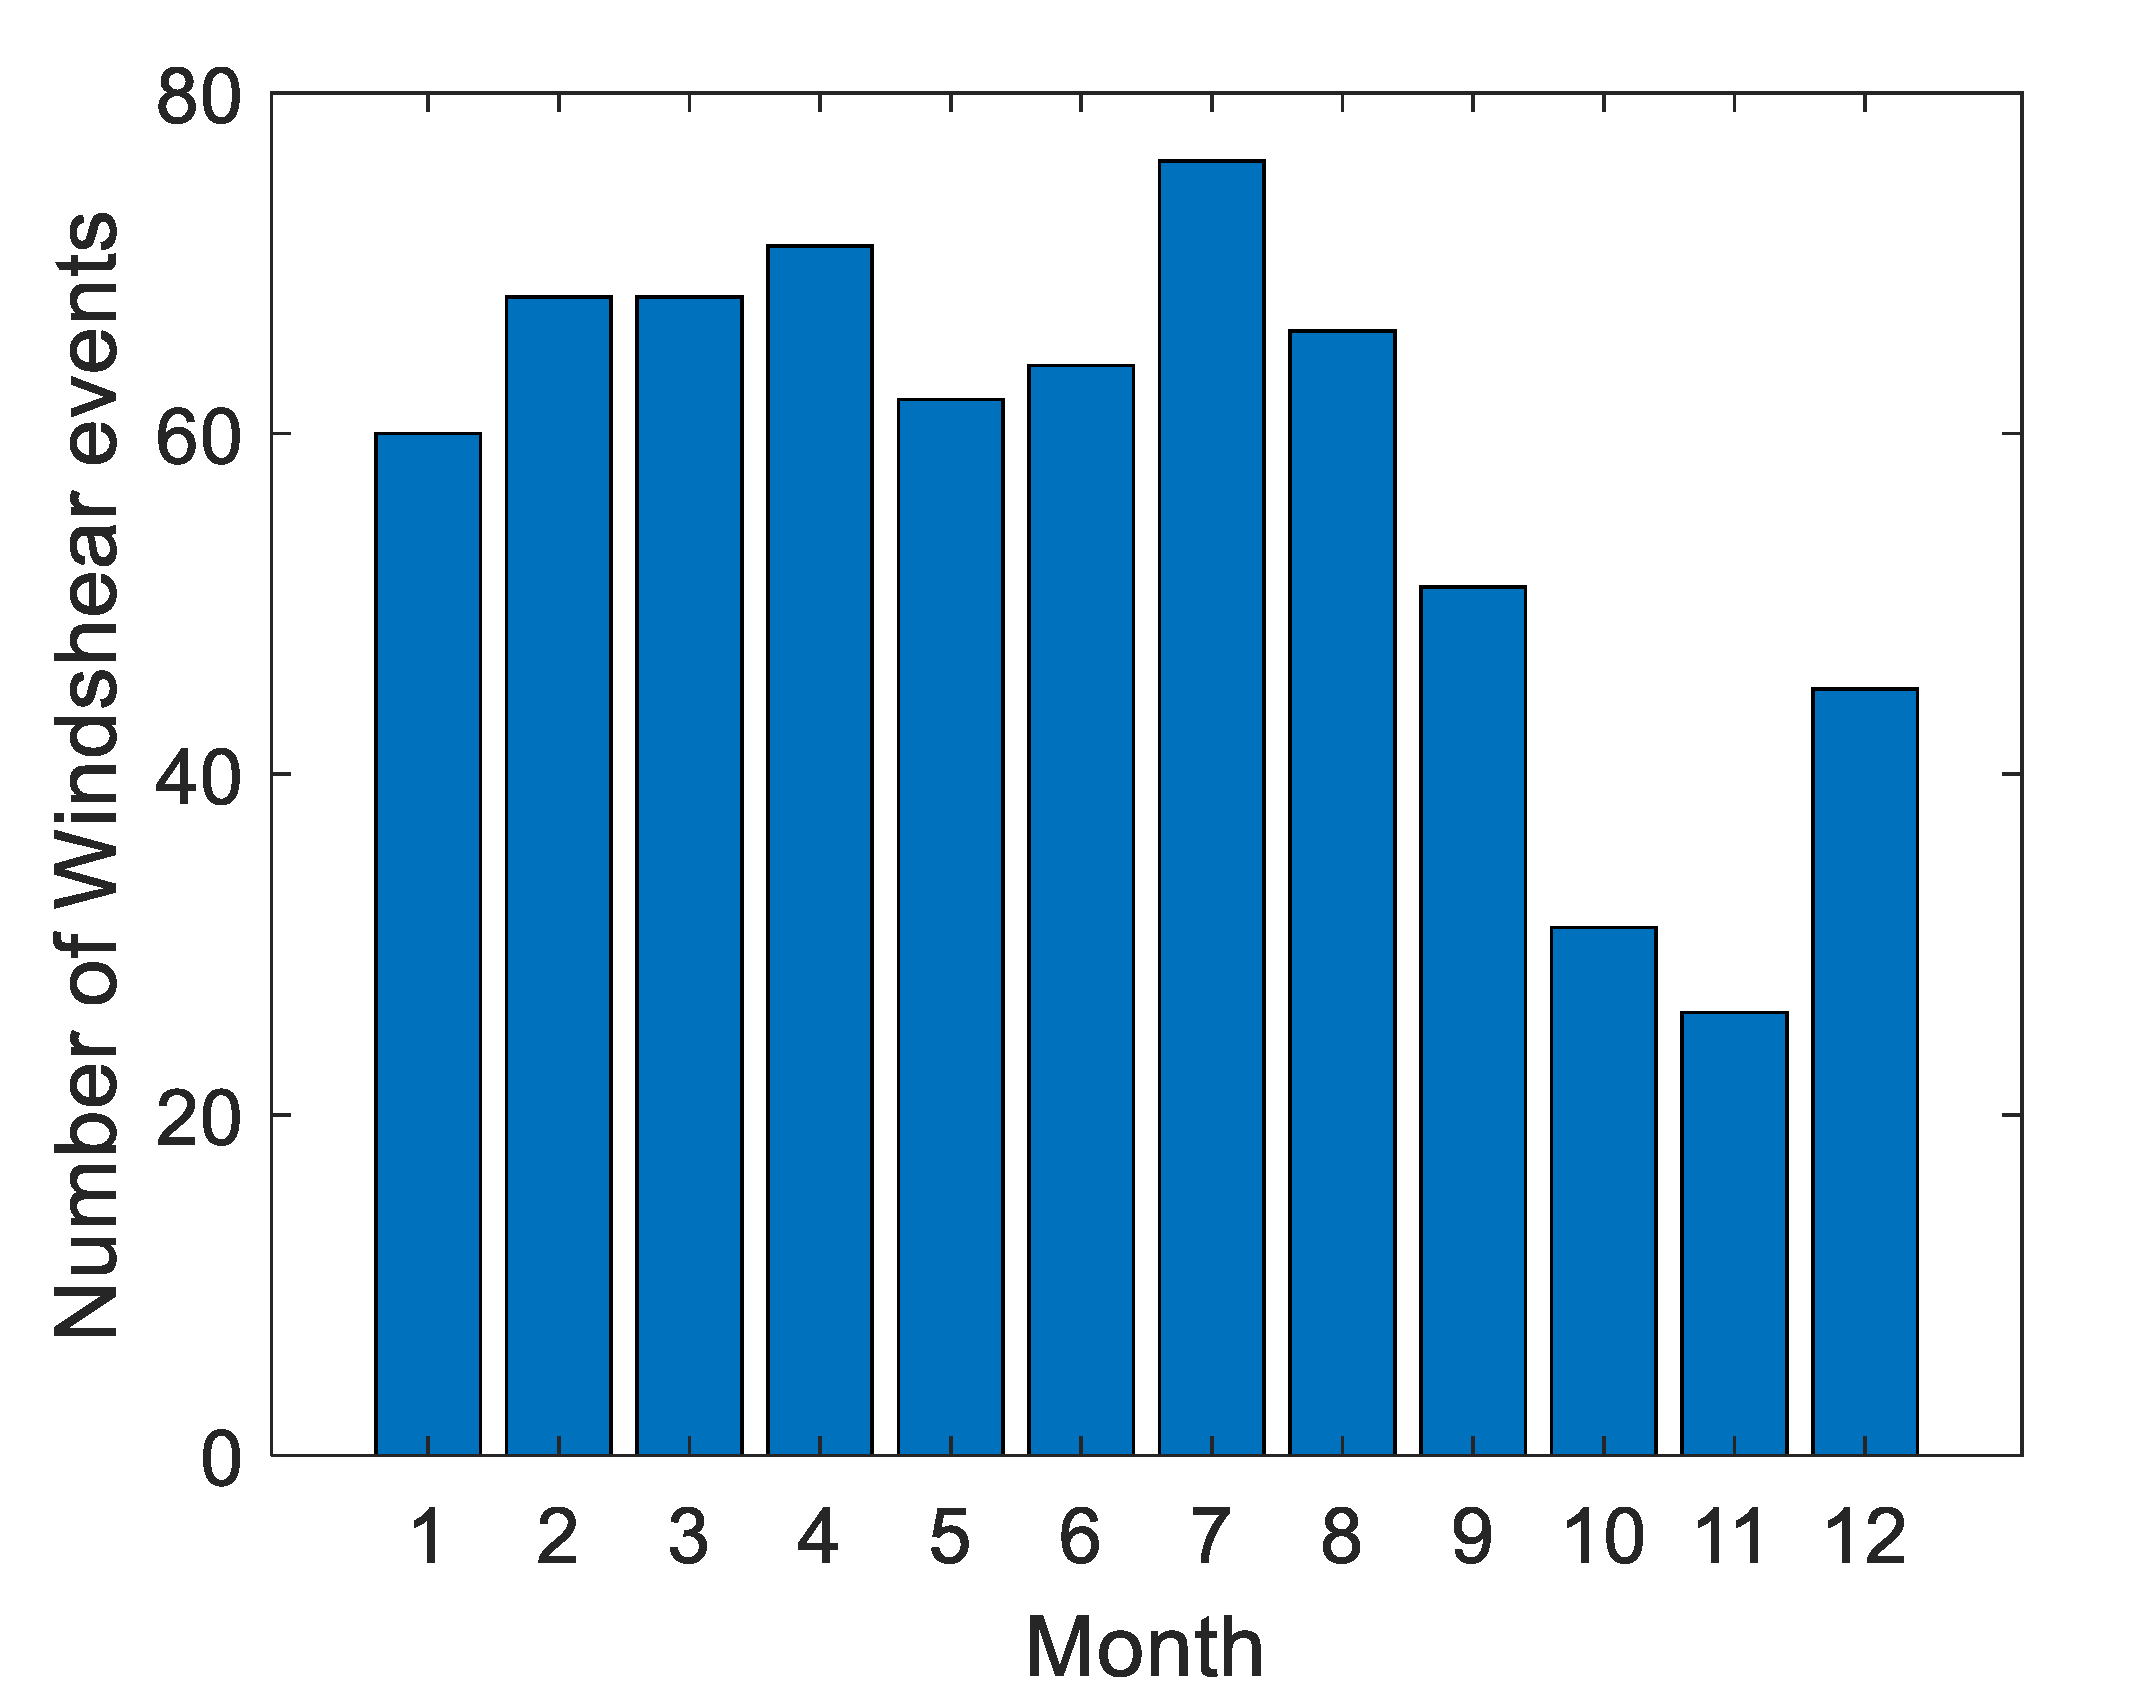

Table 1.
This table shows the minimum wind speed of wind shear at an altitude of 1000 m in Qingdao throughout the year.
Table 1.
This table shows the minimum wind speed of wind shear at an altitude of 1000 m in Qingdao throughout the year.
| Month | Wind speed (m/s) |
|---|---|
| 1. | 7.75 |
| 2. | 7.80 |
| 3. | 8.52 |
| 4. | 8.61 |
| 5. | 8.52 |
| 6. | 6.32 |
| 7. | 6.00 |
| 8. | 6.30 |
| 9. | 5.50 |
| 10. | 6.62 |
| 11. | 7.51 |
| 12. | 8.30 |
Disclaimer/Publisher’s Note: The statements, opinions and data contained in all publications are solely those of the individual author(s) and contributor(s) and not of MDPI and/or the editor(s). MDPI and/or the editor(s) disclaim responsibility for any injury to people or property resulting from any ideas, methods, instructions or products referred to in the content. |
© 2025 by the authors. Licensee MDPI, Basel, Switzerland. This article is an open access article distributed under the terms and conditions of the Creative Commons Attribution (CC BY) license (http://creativecommons.org/licenses/by/4.0/).
Copyright: This open access article is published under a Creative Commons CC BY 4.0 license, which permit the free download, distribution, and reuse, provided that the author and preprint are cited in any reuse.


