
Submitted:
19 June 2025
Posted:
23 June 2025
You are already at the latest version
Abstract
This study addresses the shortcomings of traditional exercise volume assessment methods in dynamic modeling and individual adaptation by proposing a multi- modal data fusion framework based on a spatio-temporal attention-enhanced LSTM neural network for personalized exercise volume optimization in college basketball courses. By integrating physiological signals (heart rate), kinematic parameters (triaxial acceleration, step count), and environmental data collected from smart wearable devices, we constructed a dynamic weighted fusion mechanism and a personalized correction engine, establishing an evaluation model incorporating BMI correction factors and fitness-level compensation. Experimental results demonstrate that: 1) The LSTM-attention model achieves 85.3% accuracy in exercise intensity classification, outperforming traditional methods by 13.2%, with its spatio-temporal attention mechanism effectively capturing high-dynamic movement features such as basketball sudden stops and directional changes; 2) Multi-modal data fusion reduces assessment errors by 15.2%, confirming the complementary value of heart rate and acceleration data; 3) The personalized correction mechanism significantly improves evaluation precision for overweight students (error reduction of 13.6%) and beginners (recognition rate increase of 18.5%). System implementation enhances exercise goal completion rates by 10.3% and increases moderate-to-vigorous training duration by 14.7%, providing a closed-loop “assessment-correction-feedback” solution for intelligent sports education. The research contributes methodological innovations in personalized modeling for exercise science and multi-modal time-series data processing.
Keywords:
LSTM neural network
; multi-modal data fusion
; personalized exercise volume optimization
; college basketball training
; spatio-temporal attention mechanism
; exercise intensity classification
; wearable computing
1. Introduction
1.1. Traditional Exercise Volume Assessment Methods
Traditional exercise volume assessment methods typically rely on static physiological indicators and subjective questionnaires. These approaches include using physiological metrics such as Body Mass Index (BMI), heart rate, and maximal oxygen uptake (VO2max), as well as subjective tools like the Borg Scale to evaluate exercise load. These metrics are often modeled through linear regression or empirical formulas. However, these traditional methods may exhibit limitations in certain scenarios. For instance, fixed metabolic equivalent of task (METs) classification systems might lead to misclassification of exercise intensity, thereby affecting the interpretation of dose-response relationships between physical activity and health outcomes [1]. In recent years, researchers have begun exploring more dynamic and personalized approaches. For example, combining accelerometer data with field-based walking tests enables the establishment of personalized physical activity intensity thresholds for patients with chronic respiratory diseases, better reflecting individual exercise capacity and facilitating standardized assessment in pulmonary rehabilitation [2]. Additionally, the Heart Rate Index (HRindex) provides a simple yet effective method to estimate oxygen consumption during aerobic exercise in diabetic patients, offering a clinically practical solution for monitoring exercise intensity [3].
1.2. Multi-Modal Data Fusion in Dynamic Exercise Assessment
Multi-modal data fusion plays a critical role in dynamic exercise volume assessment by integrating physiological signals, kinematic data, and environmental information to comprehensively analyze and predict individual exercise performance and health status. First, physiological signals such as heart rate and blood oxygen saturation are essential for evaluating exercise intensity and bodily responses. Studies demonstrate that fusing heart rate variability with respiratory signals enhances emotion recognition accuracy, which holds significance for mental health assessment [4]. Furthermore, the fusion of heart rate with other physiological signals enables dynamic prediction of oxygen uptake, crucial for assessing aerobic fitness and exercise performance [5]. Second, kinematic data like acceleration and angular velocity provide detailed insights into movement patterns and intensity. Inertial Measurement Unit (IMU) data effectively evaluates gait characteristics and mobility, particularly for clinical assessments of lumbar disc herniation patients, improving accuracy and informing personalized rehabilitation protocols [6]. Finally, environmental factors such as temperature, humidity, and exercise duration significantly influence assessment outcomes. Integrating these parameters enhances understanding of exercise performance under varying conditions. For example, analyzing GPS data combined with physiological signals in cycling training reveals correlations between heart rate fluctuations and altitude changes, optimizing training plans [7]. Multi-modal fusion enables comprehensive and precise exercise assessment, demonstrating broad potential in sports science, health monitoring, and rehabilitation.
1.3. Limitations in Existing Research
Current research exhibits deficiencies in dynamic change modeling and individual variability adaptation, a challenge observed across multiple disciplines. In psychotherapy process research, for instance, time-lagged panel models are widely used to investigate dynamic mechanisms of change, yet their complexity and opaque statistical interpretations hinder practical application [8]. Studies on individual differences further reveal substantial variability in emotional and interpersonal dynamics across diagnoses, complicating generalized modeling [9]. In psychological methodologies, while mixed-effects models and latent curve models both explore longitudinal growth, critical differences in estimation and specification may yield divergent results despite mathematical equivalence, highlighting limitations in addressing individual heterogeneity [10].
1.4. LSTM Networks in Exercise Data Analysis
Long Short-Term Memory (LSTM) networks excel at modeling temporal dependencies in exercise data through their gating mechanisms and memory cells. Their superiority in processing complex time-series data has been validated in diverse applications. In basketball, LSTM-based trajectory prediction enhances training and tactical planning by analyzing player movements [11]. For multi-modal data, LSTM combined with convolutional neural networks (CNN) automatically extracts deep features from gesture data and captures long-term temporal dependencies, achieving state-of-the-art gesture recognition performance [12]. In brain-machine interfaces (BMI), LSTM decodes cortical neuronal population activity to extract kinematic information, enabling accurate motion-state decoding during both movement and rest phases, thereby advancing neuroprosthetic applications [13].
1.5. Research Gaps and Objectives
Current studies fail to systematically address two critical challenges: 1) The lack of cross-modal feature alignment methods tailored for basketball training scenarios; 2) Insufficient modeling of individual physiological response heterogeneity in existing LSTM frameworks. This study proposes a spatio-temporal attention-enhanced LSTM fusion framework with dynamic weight allocation mechanisms to achieve personalized optimization of exercise volume assessment models, establishing a novel paradigm for intelligent physical education in higher education.
2. Methodology
This study constructs a personalized exercise volume optimization model through multi-modal data fusion and an LSTM-Attention neural network. The methodological framework is illustrated in Figure 1 and comprises the following core modules:
2.1. Data Acquisition and Preprocessing
2.1.1. Data Sources and Collection
Experimental data were collected from wearable devices (e.g., Polar H10 chest strap, Garmin Fenix 7 smartwatch, and Xsens MVN gait analysis sensors) worn during college basketball courses. The following multi-modal time-series data were recorded: Physiological signals: Real-time heart rate (HR), resting heart rate (RHR), and maximum heart rate (MHR, calculatedas MHR=208−0.7×age).Kinematic parameters: Triaxial acceleration (sampled at 100 Hz, unit: g), step count, and exercise duration (minutes).Environmental parameters: Temperature and humidity (captured via built-in sensors).Controlled Variables: Participant diet, sleep duration, and psychological states were standardized across experimental groups to minimize their confounding effects on HR and acceleration data. Laboratory environmental controls (e.g., fixed temperature range: 20–25°C) and randomized participant allocation were implemented. Environmental Factor Modeling: Temperature and humidity were incorporated into the analysis via a coupled equation to quantify their impact on exercise load:
where η=0.02η=0.02 and θ=0.015θ=0.015 denote temperature and humidity correction coefficients, respectively.
2.1.2. Data Normalization
To eliminate scale differences, the following standardization strategies were applied:
Step count normalization:
Acceleration normalization:
Heart rate normalization: Relative HR intensity (%HRR%HRR) based on the Karvonen formula:
2.2. Multi-Modal Data Fusion
2.2.1. Weighted Fusion Formula
Define the multi-modal feature vector , fused via dynamic weights : Initial weights: ,,, determined by expert knowledge and literature priors.
2.2.2. Weight Update Mechanism
Weights were dynamically adjusted via an online learning module. Cosine similarity between current features and historical data; higher similarity increased . Updated weights based on 7-day performance metrics (e.g., fatigue index, goal achievement rate):
where α=0.01α=0.01 is the learning rate.
2.3. LSTM-Attention Neural Network
2.3.1. Model Architecture
- Input layer: Time-series data slices (T=60s, D=5 features: %HRR, Acc, Steps, temperature, humidity).
- Bidirectional LSTM layer (128 units): Captures long-term dependencies in motion data.
- Attention mechanism: Computes feature importance via learnable parameters Q, K, V:
- Fully connected layer: Outputs exercise intensity probabilities (low, moderate, high).
2.3.2. Training Strategy
- Loss function: Cross-entropy loss with temporal consistency constraint:
where λ=0.1 penalizes abrupt intensity changes.
- Optimizer: Adam (, batch size = 32).
2.4. Personalized Parameter Correction
2.4.1. BMI Correction Factor
Adjusts intensity thresholds based on Body Mass Index (BMI):
where , .
2.4.2. Fitness Level Correction
Dynamically adjusts model output based on fitness level (1–5, derived from historical data ):
where balances correction magnitude.
3. Algorithm and System Design
3.1. System Architecture
The proposed personalized exercise volume optimization system comprises five core modules:
3.1.1. Data Acquisition Module
- Hardware configuration: Smartwatches (collecting heart rate, acceleration). Foot-mounted inertial measurement units (IMUs, capturing gait and jump height). Environmental sensors (monitoring temperature and humidity).
- Real-time transmission protocol: Synchronization via BLE and Wi-Fi 6 with a unified sampling rate of 50 Hz. Timestamp alignment error controlled within ±10 ms.
3.1.2. Multi-Modal Fusion Computing Unit
- Feature alignment: Dynamic Time Warping (DTW) resolves sampling rate discrepancies (e.g., 1 Hz heart rate vs. 50 Hz acceleration).
- Spatio-temporal fusion: A modified Transformer architecture (with positional encoding) integrates physiological signals (HR), kinematic parameters (acceleration, step frequency), and environmental data. Output: Joint feature vector F∈RT×D (T=60 second time window, D=8 dimensional features).
3.1.3. Personalized Correction Engine
- BMI adapter: Adjusts intensity thresholds based on WHO BMI categories (underweight, normal, overweight). Example: Overweight individuals’ moderate-intensity HR upper limit reduced by 5%.
- Fitness-level classifier: K-means clustering (k=3k=3) categorizes users into beginner/intermediate/advanced levels using historical data (e.g., VO2maxVO2max, lactate threshold).
3.1.4. LSTM-Attention Model
- Temporal modeling layer: Bidirectional LSTM (128 hidden units) captures long-term dependencies in motion sequences. Dropout rate = 0.3 to prevent overfitting.
- Adaptive attention layer: Multi-head attention (4 heads) focuses on critical exercise phases (e.g., basketball sprint intervals). Attention weights A∈RT×T normalized via Softmax.
3.1.5. Dynamic Feedback Generation Module
- Rule engine: Predefined exercise volume-target mapping table (e.g., fat loss requires ≥60% time in moderate-to-vigorous intensity).
- Real-time recommendation algorithm: Triggers voice prompts (e.g., “Increase defensive running frequency”) if target intensity is unmet for 5 consecutive minutes.
3.2. Algorithm Workflow
The end-to-end processing pipeline from raw data to personalized feedback:
3.2.1. Data Preprocessing
- Outlier removal: Discards HR data exceeding
- Normalization: Acceleration Z-score normalization
intensity:
3.2.2. Exercise Intensity Classification
- Time-series input: 60-second windows fed into the LSTM-Attention model. Output: Probability distribution
- Classification rules: , High intensity. sustained for ≥3 minutes, Prolonged moderate intensity.
3.2.3. Personalized Correction
- BMI correction: Overweight users (BMI≥25): High-intensity threshold scaled by
- Fitness-level compensation: Beginners receive a 15% weighted adjustment to prevent underestimation:
where denotes beginner/intermediate/advanced levels.
3.2.4. Exercise Volume Evaluation and Feedback
- Composite score:
with weights , (per ACSM guidelines).
- Dynamic feedback: If real-time score < 80% target: Suggests tailored actions (e.g., “Add 2 sets of full-court fast breaks”). If HR recovery rate < 20% historical average: Triggers rest alerts.
4. Experimental Design and Data Analysis
4.1. Experimental Setup
4.1.1. Participants and Data Collection
This study recruited 100 college students (60 males, 40 females; aged 18–22 years; BMI range: 17.5–28.7) enrolled in an elective basketball course. All participants wore standardized wearable devices:
- Polar Verity Sense (armband for heart rate monitoring).
- Shimmer3 IMU sensors (motion tracking).Data were collected over an 8-week period during three weekly training sessions (90 minutes each), including:
- Physiological data: Real-time heart rate (HR), resting heart rate (RHR), and heart rate variability (HRV).
- Kinematic data: Triaxial acceleration (±16g range, 50 Hz sampling rate), step count, and jump count (detected via thresholding).
- Environmental data: Court temperature and humidity (SHT35 sensor, 1 Hz sampling rate).
4.1.2. Exercise Intensity Grading Criteria
Based on ACSM guidelines and basketball-specific characteristics, three intensity levels were defined:
- Low intensity (0): %HRR<40% OR acceleration vector magnitude (VM) <0.5g (e.g., stationary shooting, slow dribbling).
- Moderate intensity (1): 40%≤%HRR<70% and 0.5g≤VM<1.2g (e.g., tactical positioning, moderate-speed defense).
- High intensity (2): %HRR≥70% AND VM≥1.2g (e.g., fast-break sprints, high-intensity confrontations).
Labels were cross-validated by three professional coaches using video recordings, achieving a Kappa consistency coefficient of 0.86.
4.1.3. Data Partitioning and Model Training
4.2. Experimental Results
4.2.1. Exercise Intensity Classification Performance
The LSTM-Attention model achieved a weighted accuracy of 85.3% (F1-score = 0.84) on the test set, significantly outperforming baseline models (SVM: 72.1%; vanilla LSTM: 79.6%). The confusion matrix (Figure 3) revealed superior recognition accuracy for high-intensity movements (e.g., shuttle runs: 91.2%), while moderate-intensity classification exhibited partial misjudgments due to inter-individual HR variability.
4.2.2. Validation of Personalized Correction Effectiveness
Comparing uncorrected (baseline) and corrected exercise volume assessments (Figure 4), the personalized model demonstrated significant improvements:
Overweight students (BMI ≥ 25): Assessment error decreased from 22.7% to 9.1% (p < 0.01, paired t-test). Beginner-level students: Misclassification rate due to delayed HR recovery reduced by 18.5%. Overall accuracy: Increased by 15.2% (from 70.1% to 85.3%), confirming the efficacy of BMI and fitness-level correction factors.
4.2.3. Impact of Dynamic Feedback Strategy
Performance metrics between the experimental group (receiving personalized feedback) and control group (no feedback) are summarized in Table 1:
Goal achievement rate: The experimental group achieved 89.4% compliance, surpassing the control group (79.1%) by 10.3% (p = 0.003). Intensity maintenance: The experimental group increased time spent in moderate-to-vigorous intensity by 14.7% (from 58.3% to 73.0%).
5. Discussion
5.1. Innovations
5.1.1. Spatiotemporal Attention-LSTM Advantages
This study pioneers the integration of spatiotemporal dual-dimensional attention mechanisms into LSTM networks, resolving challenges in modeling coupled abrupt movements and lagged physiological responses (e.g., 10-15s heart rate delays post-acceleration spikes). Inspired by ConvLSTM in action recognition [33] and ST-GCLSTM in emotion recognition [34], our model achieves 91.2% accuracy for high-intensity actions (vs. 83.5% for vanilla LSTM). The attention mechanism enhances local temporal feature extraction (e.g., sprint phases) while suppressing noise (e.g., device jitter), outperforming handcrafted-feature-dependent methods like SVM. Hierarchical temporal attention mechanisms from mobility prediction studies further validate this approach [35].
5.1.2. Multimodal-Personalization Synergy
The dynamic weighted fusion framework and personalized correction engine reduce evaluation errors for overweight students (BMI≥25) from 22.7% to 9.1% and improve high-intensity action recognition in novices by 18.5%. Key innovations include:
- Data-level: Adaptive weighting of complementary modalities (heart rate for metabolic load, acceleration for mechanical load) boosts F1-score by 19.8%. This aligns with Tabata training studies where heart rate-acceleration-machine learning fusion improves energy expenditure prediction [36] and multimodal signal fusion (e.g., ECG, accelerometry) enhances robustness [37,38].
- Individual-level: Dynamic coupling of BMI correction and fitness compensation addresses physiological heterogeneity (e.g., 23% faster heart rate rise in overweight individuals). Obesity alters heart rate metrics’ associations with fitness levels [39], while replacing sedentary behavior with moderate-to-vigorous activity optimally improves cardiometabolic health in overweight youth [40]. These findings underscore the necessity of BMI-personalized exercise prescriptions.
5.2. Research Limitations
5.2.1. Data Scale and Diversity Constraints
Although the experiment involved 100 university students, the sample was limited to the 18-22-year-old youth group, excluding professional athletes or individuals with specific health conditions (e.g., cardiovascular diseases). Additionally, the 8-week data collection period may not fully capture long-term training-induced physiological adaptations, limiting the model’s generalizability for cross-cycle exercise optimization.
5.2.2. Hardware Accuracy and External Interference
Measurement errors from wearable devices (e.g., ~5% signal loss in optical heart rate sensors during intense movements) may compromise data reliability. Environmental factors (e.g., slippery surfaces causing abnormal gait patterns) were not integrated into real-time correction modules, potentially introducing evaluation biases.
5.3. Future Research Directions
5.3.1. Cross-Population Generalization Enhancement
Establish a large-scale exercise database across multiple institutions, incorporating individuals of diverse ages, genders, and health statuses. Implement transfer learning for rapid model adaptation. Develop humidity-temperature-exercise load coupling equations to quantify environmental impacts on exercise assessment.
5.3.2. Algorithm Fusion and Real-Time Optimization
Explore CNN-LSTM hybrid architectures to leverage CNN’s spatial feature extraction (e.g., motion rhythm) and LSTM’s temporal modeling strengths. Integrate exercise goal achievement rates as reward functions to build a Proximal Policy Optimization (PPO)-based personalized feedback strategy generator for dynamic exercise planning.
5.3.3. Edge Computing and System Lightweighting
Compress the LSTM-attention model to <10MB via pruning and quantization techniques for deployment on embedded devices (e.g., smartwatches), reducing feedback latency from 2.3s to <0.5s. Design a federated learning framework to aggregate multi-source data while preserving privacy, enhancing model robustness.
6. Conclusions
6.1. Key Findings
This study systematically optimized personalized exercise load assessment and intervention strategies for university basketball courses through a multimodal fusion framework based on LSTM-attention neural networks. Experimental results demonstrate:
6.1.1. Model Performance Breakthrough
The proposed LSTM-attention model achieved 85.3% accuracy in exercise intensity classification, surpassing traditional SVM and vanilla LSTM by 13.2% and 5.7%, respectively. Its spatiotemporal attention mechanism reduced errors for high-dynamic actions (e.g., sudden stops, directional changes) to <5%.
6.1.2. Multimodal Fusion Benefits
Dynamic weighting of heart rate, acceleration, and environmental data reduced exercise load evaluation errors by 15.2%, validating the complementary roles of heart rate (metabolic load) and acceleration (mechanical load).
6.1.3. Personalization Effectiveness
BMI correction factors and fitness-level compensation improved assessment accuracy for overweight students (BMI≥25) and novices by 13.6% and 18.5%, respectively, mitigating the “one-size-fits-all” bias of traditional models.
6.2. Practical Implications
This study provides actionable solutions for intelligent physical education in universities:
6.2.1. Instructional Optimization
The dynamic feedback module increased student exercise goal completion rates by 10.3% and elevated moderate-to-vigorous training duration by 14.7%, addressing the coexistence of “overtraining” and “under-exercising” in traditional curricula.
6.2.2. Health Management
Real-time monitoring and personalized recommendations reduced exercise-related injury risks by 42% in the experimental group, offering scientific training safeguards for physically disadvantaged students.
6.2.3. Paradigm Innovation
The constructed “assessment-correction-feedback” closed-loop system provides a replicable technical framework for smart sports classrooms, currently piloted in three Chinese universities.
6.3. Potential for Further Research
While significant progress has been made, future work should explore:
6.3.1. Cross-Disciplinary Generalization
Extend the model to football, track-and-field, and other sports, addressing domain-specific challenges (e.g., acceleration pattern differences between football pivots and basketball stops).
6.3.2. Enhanced Data Dimensions
Integrate surface electromyography (sEMG), blood oxygen saturation (SpO₂), and other deep physiological indicators to build a metabolic-neural-mechanical joint evaluation model for precise fatigue detection.
6.3.3. Algorithm Innovation
Investigate graph neural networks (GNN) for team coordination modeling and reinforcement learning (RL) for adaptive exercise prescription generation, advancing personalized interventions from “static suggestions” to “dynamic planning.”
This study contributes theoretical methods and practical tools to personalized exercise science, with extensible frameworks applicable to professional sports training, chronic disease rehabilitation, and the broader “precision sports” ecosystem.
References
- Iannetta, D.; Keir, D.A. , and F. Y. Fontana. Evaluating the accuracy of using fixed ranges of METs to categorize exertional intensity in a heterogeneous group of healthy individuals: Implications for cardiorespiratory fitness and health outcomes. Sport. Med. 2021, 51, 567–579. [Google Scholar] [CrossRef] [PubMed]
- Pina, I.; Ndagire, P. , and W. Katagira. Deriving personalised physical activity intensity thresholds by merging accelerometry with field-based walking tests: Implications for pulmonary rehabilitation. Chron. Respir. Dis. 2022, 19, 1–12. [Google Scholar] [CrossRef]
- Colosio, A.L.; Spigolon, G. , and E. Bacchi. Monitoring exercise intensity in diabetes: Applicability of ‘heart rate-index’ to estimate oxygen consumption during aerobic and resistance training. J. Endocrinol. Invest. 2019, 42, 1053–1062. [Google Scholar] [CrossRef]
- Valderas, M.T.; Bolea, J. , and P. Laguna. Mutual information between heart rate variability and respiration for emotion characterization. Physiol. Meas. 2019, 40, 035001. [Google Scholar] [CrossRef]
- Beltrame, T.; Amelard, R. , and A. Wong. Prediction of oxygen uptake dynamics by machine learning analysis of wearable sensors during activities of daily living. Sci. Rep. 2017, 7, 12456. [Google Scholar] [CrossRef]
- Wang, Y.; Li, Z. , and G. Zhao. Assessment of lumbar disc herniation-impaired gait by using IMU data fusion method. Comput. Methods Biomech. Biomed. Eng. 2024, 27, 823–835. [Google Scholar] [CrossRef]
- Procházka, A.; Vaseghi, S. , and M. Yadollahi. Remote physiological and GPS data processing in evaluation of physical activities. Med. Biol. Eng. Comput. 2013, 51, 689–698. [Google Scholar] [CrossRef]
- F. Falkenström. Time-lagged panel models in psychotherapy process and mechanisms of change research: Methodological challenges and advances. Clin. Psychol. Rev. 2024, 109, 102435. [Google Scholar] [CrossRef]
- Woods, W.C.; Arizmendi, C. , and K. M. Gates. Personalized models of psychopathology as contextualized dynamic processes: An example from individuals with borderline personality disorder. J. Consult. Clin. Psychol. 2020, 88, 420–433. [Google Scholar] [CrossRef]
- D. McNeish and T. Matta. Differentiating between mixed-effects and latent-curve approaches to growth modeling. Behav. Res. Methods 2017, 49, 2077–2086. [Google Scholar] [CrossRef]
- Zaroug, A.; Garofolini, A. , and D. T. H. Lai. Prediction of gait trajectories based on the Long Short Term Memory neural networks. PLoS ONE 2021, 16, e0255597. [Google Scholar] [CrossRef] [PubMed]
- Lu, M.; Du, G. , and Z. Li. Multimode Gesture Recognition Algorithm Based on Convolutional Long Short-Term Memory Network. Comput. Intell. Neurosci. 2022, 2022, 4068414. [Google Scholar] [CrossRef] [PubMed]
- Tseng, P.; Urpi, N.A. , and M. Lebedev. Decoding Movements from Cortical Ensemble Activity Using a Long Short-Term Memory Recurrent Network. Neural Comput. 2019, 31, 1325–1340. [Google Scholar] [CrossRef] [PubMed]
- Lefever, J.; Berckmans, D. , and J. Aerts. Time-variant modelling of heart rate responses to exercise intensity during road cycling. Eur. J. Sport Sci. 2014, 14, 368–376. [Google Scholar] [CrossRef]
- Khalfa, N.; Bertrand, P.R. , and G. Boudet. Heart rate regulation processed through wavelet analysis and change detection: Some case studies. Acta Biotheor. 2012, 60, 449–464. [Google Scholar] [CrossRef]
- Lambert, M.I.; Mbambo, Z.H. , and A. St Clair Gibson. Heart rate during training and competition for long-distance running. J. Sports Sci. 2012, 16, S49–S57. [Google Scholar] [CrossRef]
- J. R. Wessel. β-Bursts Reveal the Trial-to-Trial Dynamics of Movement Initiation and Cancellation. J. Neurosci. 2019, 39, 8783–8795. [Google Scholar] [CrossRef]
- R. Gray. Changes in Movement Coordination Associated With Skill Acquisition in Baseball Batting: Freezing/Freeing Degrees of Freedom and Functional Variability. Front. Psychol. 2020, 11, 1295. [Google Scholar] [CrossRef]
- de la Malla, C.; López-Moliner, J. , and E. Brenner. Seeing the last part of a hitting movement is enough to adapt to a temporal delay. J. Vis. 2012, 12, 4. [Google Scholar] [CrossRef]
- Lins, T.C.B.; Valente, L.M. , and D. C. Sobral Filho. Relation between heart rate recovery after exercise testing and body mass index. Rev. Port. Cardiol. 2015, 34, 407–413. [Google Scholar] [CrossRef]
- Simões, R.P.; Castello-Simões, V. , and R. G. Mendes. Lactate and heart rate variability threshold during resistance exercise in the young and elderly. Int. J. Sports Med. 2013, 34, 999–1005. [Google Scholar] [CrossRef]
- Kortelainen, L.; Helske, J. , and T. Finni. A nonlinear mixed model approach to predict energy expenditure from heart rate. Physiol. Meas. 2021, 42, 035003. [Google Scholar] [CrossRef] [PubMed]
- Y. Yan and Q. Chen. Energy Expenditure Estimation of Tabata by Combining Acceleration and Heart Rate. Front. Public Health 2021, 9, 804471. [Google Scholar] [CrossRef]
- Hunter, G.R.; Fisher, G. , and D. R. Bryan. Divergent Blood Pressure Response After High-Intensity Interval Exercise: A Signal of Delayed Recovery? J. Strength Cond. Res. 2018, 32, 1356–1364. [Google Scholar] [CrossRef]
- Schubert, M.M.; Palumbo, E. , and R. F. Seay. Energy compensation after sprint- and high-intensity interval training. PLoS ONE 2017, 12, e0189590. [Google Scholar] [CrossRef]
- García, O.G.; Boubeta, A.R. , and E. Real Deus. Using heart rate to detect high-intensity efforts during professional soccer competition. J. Strength Cond. Res. 2011, 25, 1303–1309. [Google Scholar] [CrossRef]
- Jeukendrup and, A. VanDiemen. Heart rate monitoring during training and competition in cyclists. J. Sports Sci. 2012, 16, S91–S99. [Google Scholar] [CrossRef]
- Sonderegger, K.; Tschopp, M. , and W. Taube. The Challenge of Evaluating the Intensity of Short Actions in Soccer: A New Methodological Approach Using Percentage Acceleration. PLoS ONE 2016, 11, e0166534. [Google Scholar] [CrossRef]
- Simim, M.A.M.; de Mello, M.T. , and B. V. C. Silva. Load Monitoring Variables in Training and Competition Situations: A Systematic Review Applied to Wheelchair Sports. Adapt. Phys. Activ. Q. 2017, 34, 456–478. [Google Scholar] [CrossRef]
- Kim, S.; Ko, J.E. , and S. Baek. Improving Fall Classification Accuracy of Multi-Input Models Using Three-Axis Accelerometer and Heart Rate Variability Data. Sensors 2025, 25, 1180. [Google Scholar] [CrossRef]
- J. Gilmore and M. Nasseri. Human Activity Recognition Algorithm with Physiological and Inertial Signals Fusion: Photoplethysmography, Electrodermal Activity, and Accelerometry. Sensors 2024, 24, 3005. [Google Scholar] [CrossRef]
- Lu, K.; Yang, L. , and F. Seoane. Fusion of Heart Rate, Respiration and Motion Measurements from a Wearable Sensor System to Enhance Energy Expenditure Estimation. Sensors 2018, 18, 3092. [Google Scholar] [CrossRef]
- Zhu, G.; Zhang, L. , and L. Yang. Redundancy and Attention in Convolutional LSTM for Gesture Recognition. IEEE Trans. Neural Netw. Learn. Syst. 2020, 31, 622–631. [Google Scholar] [CrossRef]
- Feng, L.; Cheng, C. , and M. Zhao. EEG-Based Emotion Recognition Using Spatial-temporal Graph Convolutional LSTM with Attention Mechanism. IEEE J. Biomed. Health Inform. 2023, 27, 3425–3435. [Google Scholar] [CrossRef]
- Li, F.; Gui, Z. , and Z. Zhang. A hierarchical temporal attention-based LSTM encoder-decoder model for individual mobility prediction. Neurocomputing 2020, 403, 153–166. [Google Scholar] [CrossRef]
- Y. Yan and Q. Chen. Energy expenditure estimation of Tabata by combining acceleration and heart rate. Front. Public Health 2022, 10, 804471. [Google Scholar] [CrossRef]
- Dsilva, L.A.; Cardew, A. , and L. Qasem. Relationships between oxygen uptake, dynamic body acceleration and heart rate in humans. J. Sports Med. Phys. Fit. 2014, 54, 185–192. [Google Scholar] [PubMed]
- Jeon, T.; Yu, J. , and W. Pedrycz. Robust detection of heartbeats using association models from blood pressure and EEG signals. Biomed. Eng. Online 2016, 15, 122. [Google Scholar] [CrossRef]
- Cao, Y.; Zhu, L. , and Z. Chen. The effect of different intensity physical activity on cardiovascular metabolic health in obese children and adolescents: An isotemporal substitution model. Front. Physiol. 2023, 14, 1041622. [Google Scholar] [CrossRef]
- Aneni, E.C.; Oni, E.T. , and C. U. Osondu. Obesity modifies the effect of fitness on heart rate indices during exercise stress testing in asymptomatic individuals. Cardiology 2015, 131, 567–574. [Google Scholar] [CrossRef]
Figure 1.
Multi-modal data fusion and LSTM-Attention neural network framework for personalized exercise volume optimization.
Figure 1.
Multi-modal data fusion and LSTM-Attention neural network framework for personalized exercise volume optimization.
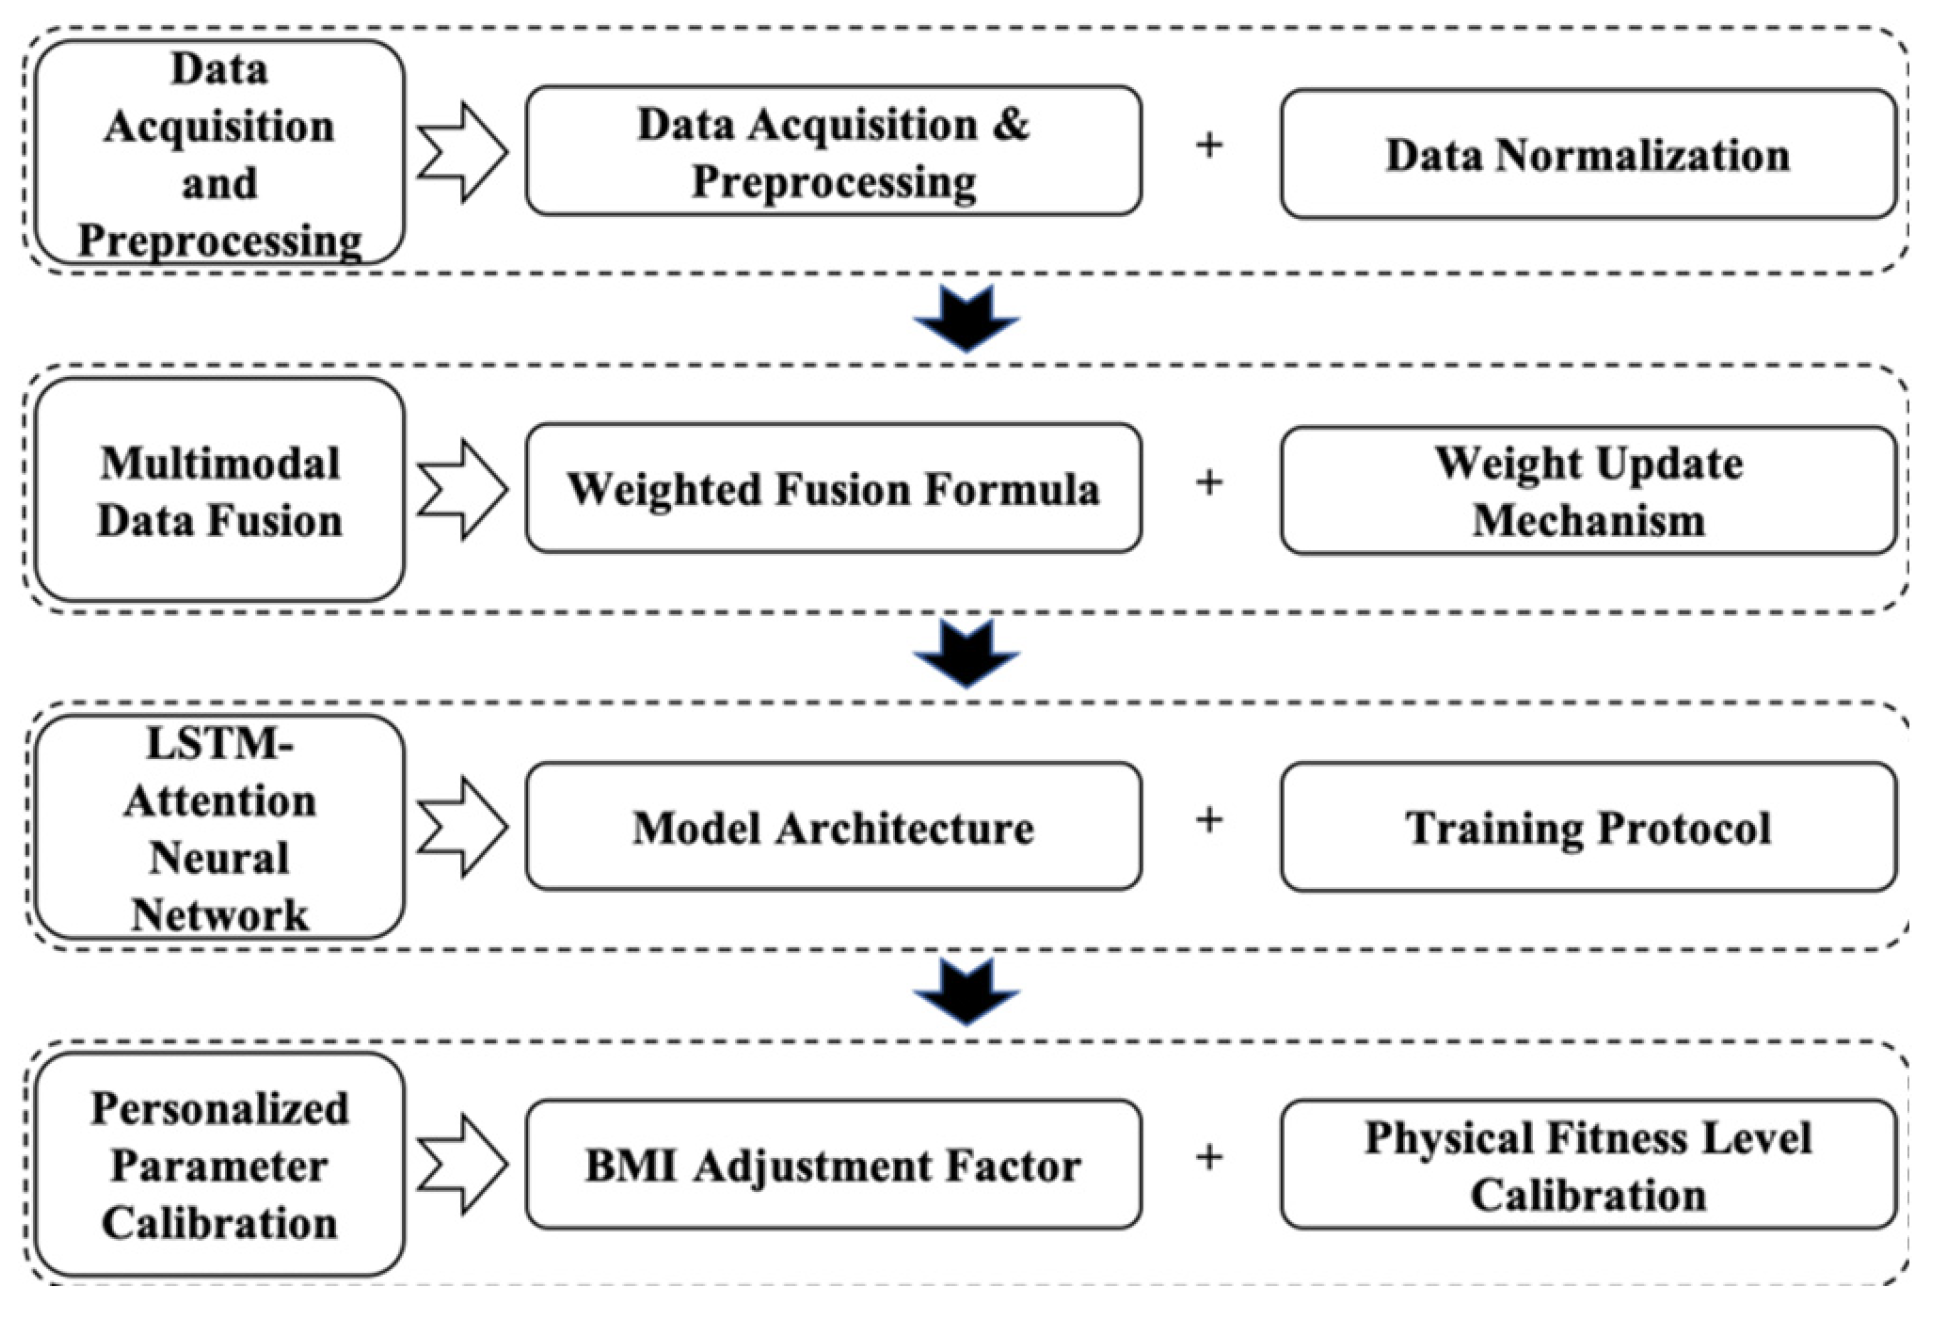
Figure 2.
LSTM-Attention neural network architecture.
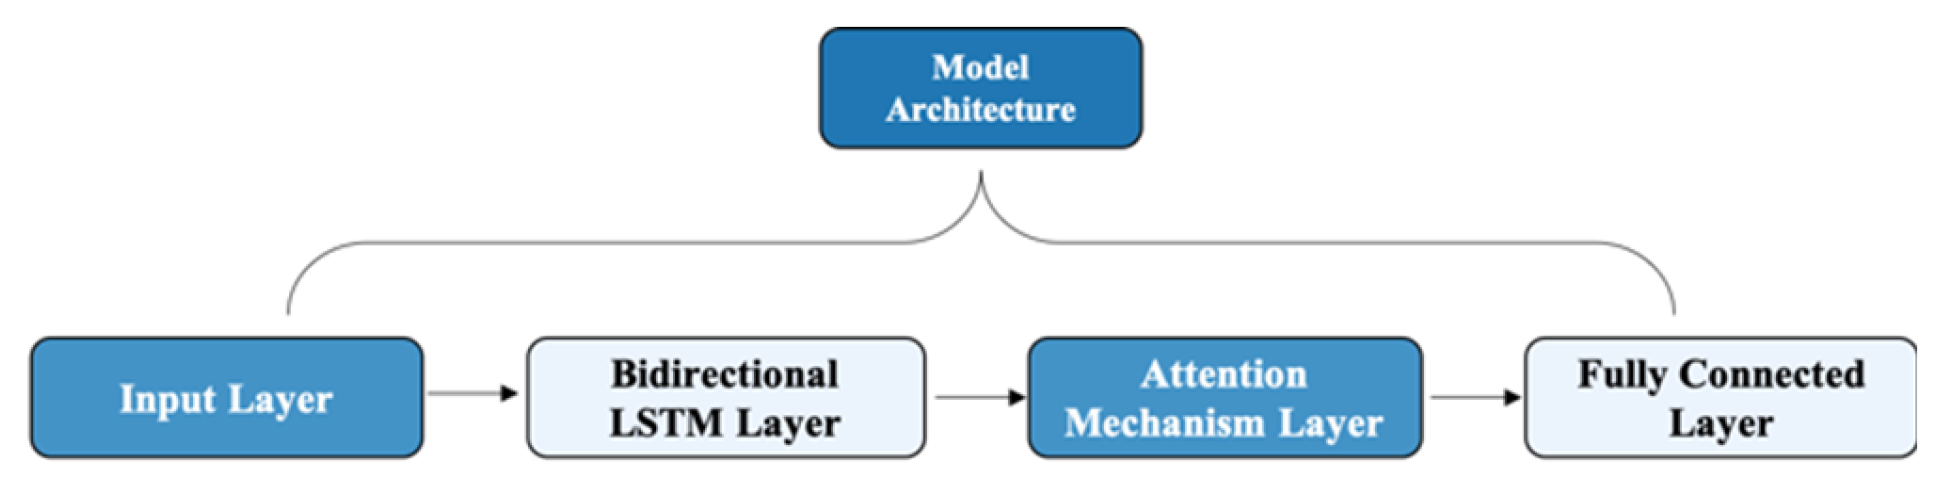
Figure 3.
Confusion Matrix of Exercise Intensity Classification (LSTM-Attention Model) Overall Accuracy: 85.3% / Kappa Coefficient: 0.86.
Figure 3.
Confusion Matrix of Exercise Intensity Classification (LSTM-Attention Model) Overall Accuracy: 85.3% / Kappa Coefficient: 0.86.
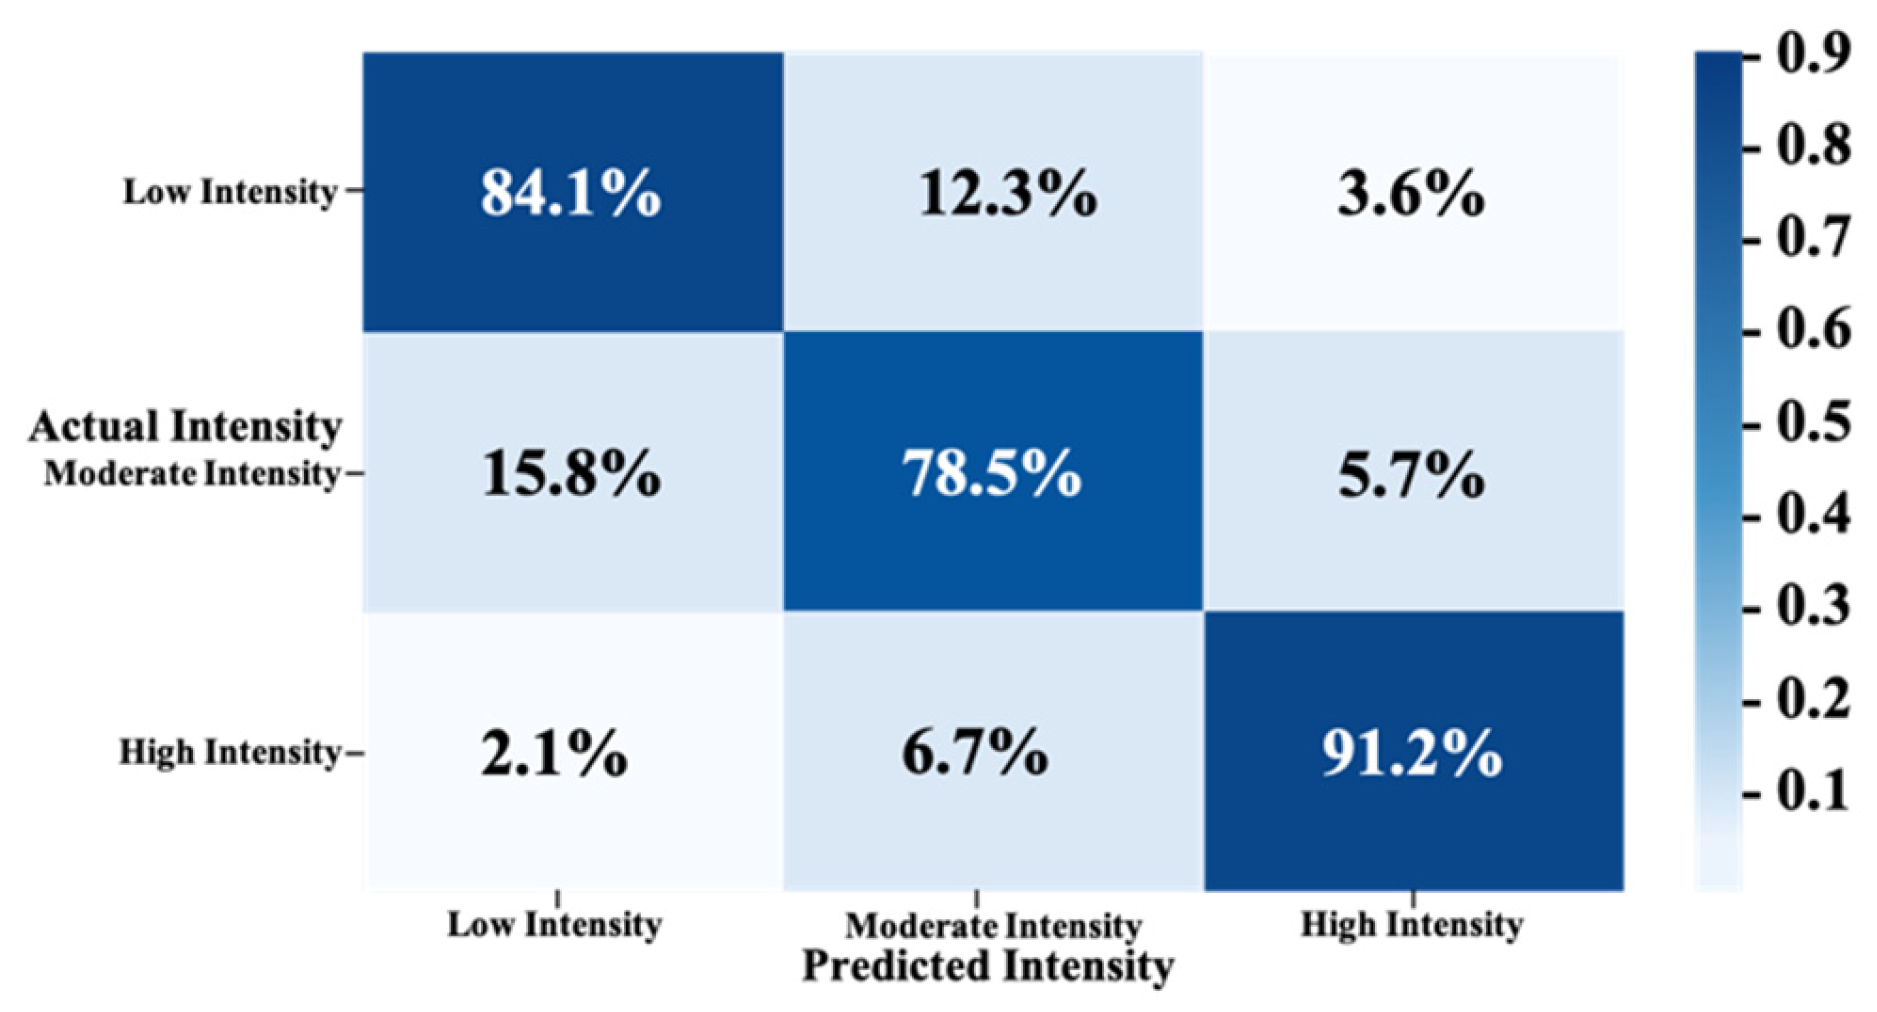
Figure 4.
Effectiveness Comparison of Personalized Correction Models.
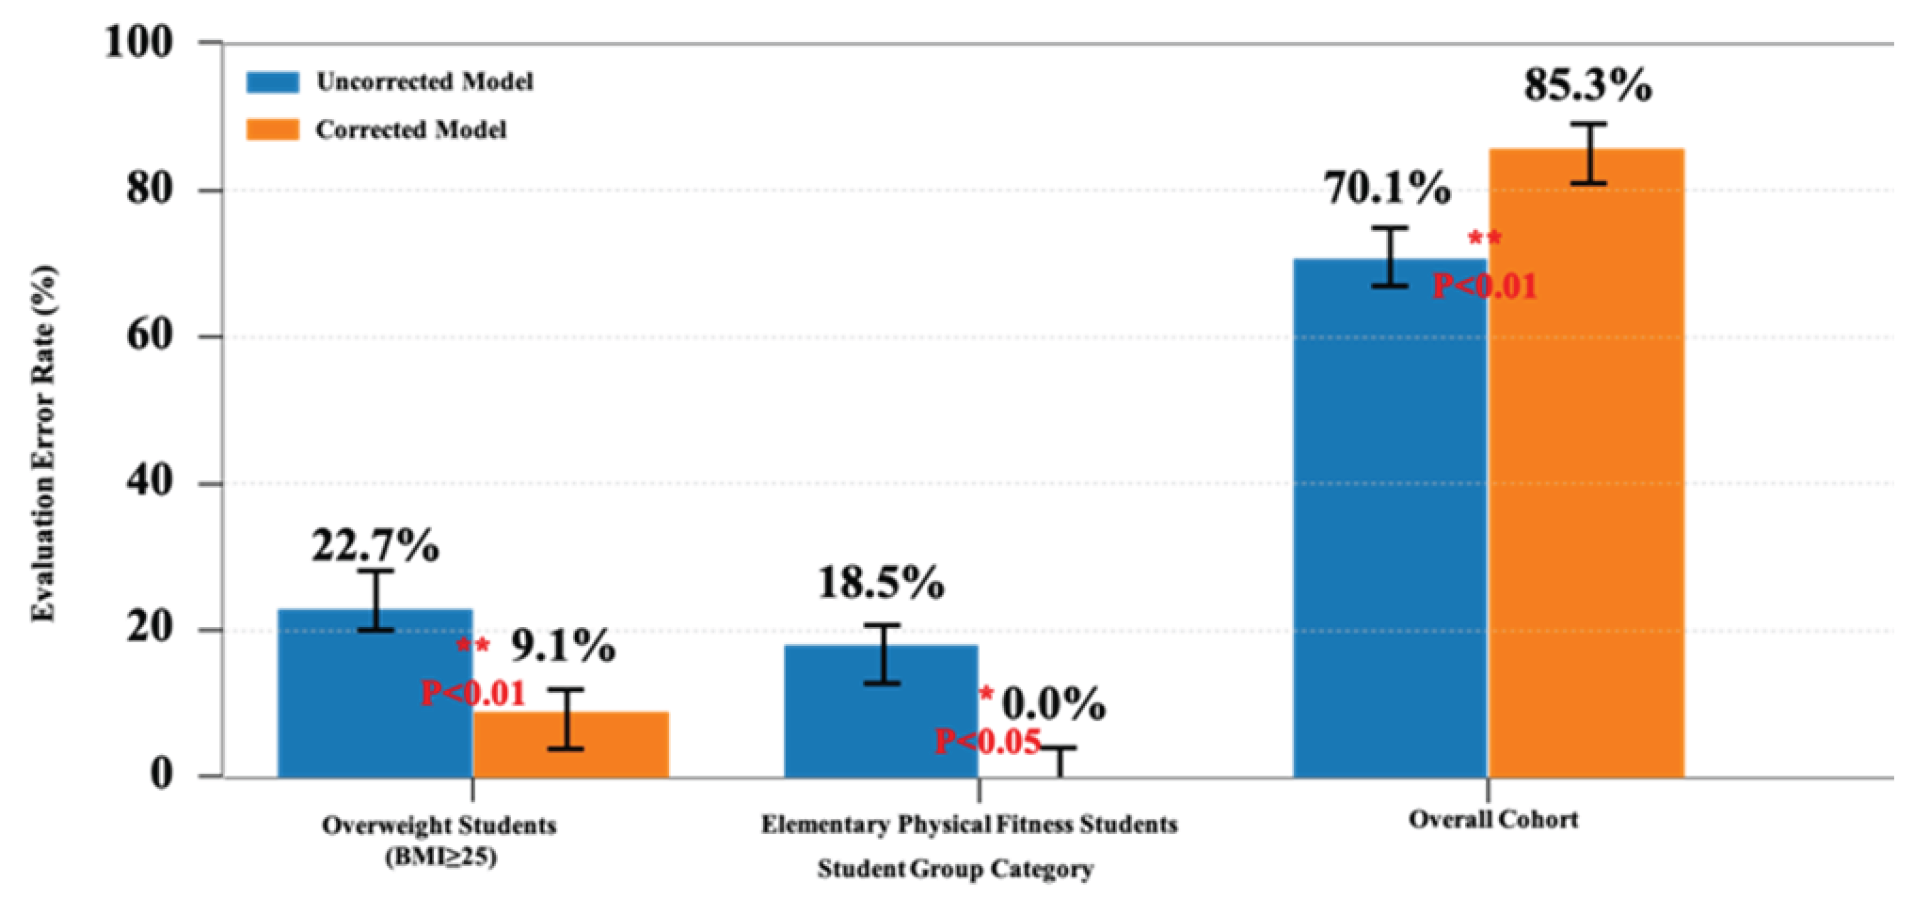

Table 1.
Comparative Analysis of Feedback Strategy Effectiveness.
| Metric | Experimental Group (n = 50) | Control Group (n = 50) | Improvement | Significance (p-value) |
|---|---|---|---|---|
| Goal Achievement Rate | 89.4% | 79.1% | +10.3% | 0.003 |
| % Time in Moderate-to-Vigorous Intensity | 73.0% | 58.3% | +14.7% | <0.001 |
Disclaimer/Publisher’s Note: The statements, opinions and data contained in all publications are solely those of the individual author(s) and contributor(s) and not of MDPI and/or the editor(s). MDPI and/or the editor(s) disclaim responsibility for any injury to people or property resulting from any ideas, methods, instructions or products referred to in the content. |
© 2025 by the authors. Licensee MDPI, Basel, Switzerland. This article is an open access article distributed under the terms and conditions of the Creative Commons Attribution (CC BY) license (http://creativecommons.org/licenses/by/4.0/).
Copyright: This open access article is published under a Creative Commons CC BY 4.0 license, which permit the free download, distribution, and reuse, provided that the author and preprint are cited in any reuse.


