
Submitted:
19 June 2025
Posted:
20 June 2025
You are already at the latest version
Abstract
Grassland ecosystems are fundamentally shaped by the complex behaviours of livestock. While most previous studies have monitored grassland health using vegetation indices such as NDVI and LAI, fewer have investigated livestock behaviours as direct drivers of grassland degradation. In particular, the spatial clustering and temporal concentration patterns of livestock behaviours are critical yet underexplored factors that significantly influence grassland ecosystems. This study investigated the spatiotemporal patterns of livestock behaviours under different grazing management systems and grazing-intensity gradients (GIGs) in Wenchang, China, using high-resolution GPS tracking data and machine learning classification. the K-Nearest Neighbours (KNN) model combined with SMOTE-ENN resampling achieved the highest accuracy, with F1-scores of 0.960 and 0.956 for continuous and rotational grazing datasets. Results showed that continuous grazing system failed to mitigate grazing pressure when reduced grazing intensity, as the spatial clustering of livestock behaviours did not decrease accordingly, and the frequency of temporal peaks in grazing behaviour even showed an increasing trend. Conversely, rotational grazing system responded more effectively, as reduced GIGs led to more evenly distributed temporal activity patterns and lower spatial clustering. These findings highlight the importance of incorporating livestock behavioural patterns into grassland monitoring and offer data-driven insights for sustainable grazing management.
Keywords:
livestock behaviours
; vehicle GPS sensor
; machine learning classification
; spatial clustering
; temporal probability distribution
1. Introduction
Grassland ecosystems are vital for livestock production, biodiversity conservation, and ecosystem regulation, with grazing being a dominant land-use activity (Asner et al., 2004; Akasbi et al., 2012). Different livestock behaviours directly influence grassland ecosystems through various mechanisms (Homburger et al., 2015). For example, grazing behaviour influences pasture structure and composition, which determines plant growth and recovery capacity; lying and standing behaviour affects vegetation and soil physiology and biochemistry, influencing soil stability and nutrient cycling (e.g., concentrated excreta distribution); and walking behaviour impacts soil structure, vegetation utilization rate, and pasture growth (Adler et al., 2001; Kampmann et al., 2008; Laliberté and Tylianakis, 2012; Hiltbrunner et al., 2012).
Variations in grazing-intensity gradients (GIGs) and grazing management systems are key drivers of selective grazing behaviours, which ultimately shape the spatial structure and condition of grassland growth. Changes in GIGs can alter livestock movement patterns and determine the extent of pasture utilisation by affecting the spatiotemporal availability of foraging resources (Millward, 2020). At the behavioural level, GIGs have been shown to significantly influence the intensity and frequency of core livestock activities, such as grazing, resting, and walking (Homburger, 2015). Moreover, different grazing management regimes—namely rotational grazing and continuous grazing—regulate the temporal distribution of these behaviours, thereby modifying defoliation patterns and the degree of disturbance imposed on vegetation (Yu, 2019). Therefore, uncontrolled and excessive grazing can decrease ecosystem stability and productivity, reducing available forage resources, and ultimately lead to severe grassland degradation (Garibaldi et al., 2007; Semmartin et al., 2008).
A fine-scale livestock behaviour tracking and spatiotemporal analysis are essential for sustainable grassland management. In the early stages, grazing management relied heavily on direct visual observation of livestock behaviour and vegetation defoliation levels; however, this approach is both time-consuming and labour-intensive. Moreover, livestock generally exhibit limited movement distances, which are accompanied by complex and dynamic behavioural patterns. In areas with heterogeneous landscapes and complex terrain, conducting long-term, systematic observations using the naked eye becomes increasingly challenging. In recent years, the Global Positioning System (GPS) tracking has become a powerful tool for monitoring livestock movements. Numerous studies have employed GPS techniques to reveal spatial behaviour patterns. For example, Cristescu (2016) examines mining impacts on grizzly bear movement in Alberta, Canada, using 9 years of GPS data comparing movement patterns during active mining and after mine closure, using indicators such as home range overlap, step length, selection ratio, and the ratio of steps within the disturbance boundary to steps crossing the disturbance to analyse grizzly bears’ response patterns to mining activities. Millward (2020) used GPS collars to track cattle location across seven ranches under two adjustment factors: Distance to water and slope. To further understand how livestock activities respond to environment and impact vegetation dynamics, GPS data have increasingly been integrated with Geographic Information Systems (GIS) and remote sensing techniques. Kawamura (2005) used a grid analysis method to examine the correlation between grazing behaviour intensity from GPS tracking of three sheep herds, MODIS/NDVI, and field-observed plant biomass distribution. Wang (2015) utilized GPS collars to track the spatiotemporal distribution of sheep under different grazing-intensity gradients in summer and autumn. By integrating the GPS data with remote sensing information on terrain and vegetation, the study revealed significant seasonal and terrain-related variations in movement distances and foraging preferences. However, due to the growing volume and complexity of GPS-based behavioural datasets, traditional analytical approaches are often insufficient. In response, machine learning (ML) models have been introduced as efficient tools for extracting behavioural patterns and revealing the spatiotemporal mechanisms of selective grazing.
Machine learning (ML) approaches, including feature selection (Kim and Choi, 2012), clustering (Melnykov et al., 2020), and regression/classification (Suykens, 2017), have gained significant attention, particularly in the field of grazing research where classification algorithms are most commonly used. For example, Augustine (2013) collected GPS and activity sensor data from semi-arid rangelands in eastern Colorado between 2008 and 2010 and applied a Classification and Regression Tree (CART) model to distinguish between grazing and non-grazing activities, achieving a relatively low misclassification rate of 12.9%. However, the binary nature of decision trees led to reduced performance when classifying multiple behavioural categories. To overcome such limitations, ensemble learning methods, such as Random Forest and XGBoost, have been increasingly adopted. Williams (2016) evaluated the performance of four machine learning algorithms—naïve Bayes, JRip, J48, and random forest—for dairy cow behaviour recognition, and identified JRip as the most effective under a 32-segment strategy, with an overall classification accuracy of 0.85. Homburger (2015) further explored spatial activity patterns of dairy cows across six summer grazing areas using Random Forest for behaviour classification and regression modelling to assess environmental and management impacts. The study highlighted terrain slope, forage quality, stocking rate, and rotational grazing duration as major determinants of cattle behavioural distribution.
In summary, based on the reviewed literature, several key research gaps can be identified:
Class Imbalance in GPS Data: Previous studies have identified that GPS data for livestock behaviour often suffers from class imbalance, particularly with certain behaviours like grazing dominating the dataset. This imbalance creates prediction bias in machine learning classifiers. However, to date, limited research has systematically examined the effects of different resampling strategies on the performance of various classifiers across different grazing management dataset.
Spatial clustering of behaviours: One key research gap is which behavioural patterns are susceptible to being driven to form hotspots, and, how the spatial clustering of these behaviours varies in response to different grazing-intensity gradients and grazing management strategies.
Probability distribution of grazing time: Limited attention has been given to the temporal dynamics of livestock behaviours. Specifically, how the proportion of time spent on key livestock behaviours and temporal concentration of grazing behaviour vary with changes in grazing-intensity gradient and management systems remains unclear.
To address these gaps, this study conducted grazing experiments using two grazing management strategies: Rotational and continuous grazing each with three grazing-intensity gradients: Heavy, moderate, and light using GPS collars to track cattle movement. To identify the optimal classifier for accurately classifying five key cattle behaviours, four representative machine learning algorithms were tested in combination with five data resampling strategies. This optimal model was then used to efficiently analyse the spatiotemporal patterns of these behaviours in response to varying GIGs and grazing management systems.
2. Material and Methods
2.1. Study Area
The study was conducted in Nanba Village, Wenchang City, Hainan Province, China (approximately 110°E, 19°N) (Figure 1). The study area is characterized by flat terrain and a tropical monsoon island climate, with an average annual temperature ranging from 23.4°C to 24.4°C. The climate is marked by distinct wet and dry seasons, with the rainy season occurring from May to October. In recent years, due to poor management of artificial grassland grazing, an overemphasis on livestock quantity, and a lack of sustainable grassland investment, exploitative grazing practices have led to significant grassland degradation.
For this study, the research area was divided into three sections: A, B, and C. A and B were designated for rotational grazing, while C was assigned to continuous grazing. The respective areas of A, B, and C were 1,100 m2, 1,100 m2, and 1,700 m2.
2.2. Grazing Management and GPS
According to Kilgour (2012), cattle can exhibit up to 40 distinct behaviours, although many of these occur infrequently and for short durations. In this study, five primary behaviours were identified and analysed: Grazing, rumination, standing, lying, and walking (Figure 2). Grazing experiments were conducted daily from 8:30 a.m. to 5:30 p.m. and artificial behavioural observations were made during the pre-grazing phase of each grazing experiment. Meanwhile, GPS tracking was implemented during three grazing intensity gradients: Heavy grazing was conducted from November 10 to 19, 2022, involving 9 animal units (AU; 1 AU = 250 kg adult cattle) in the rotational grazing areas (A and B) and 7 AU in the continuous grazing area C, with an average stocking rate of 41 AU/ha. Moderate grazing occurred from December 9 to 18, 2022, with 5 AU in A and B and 4 AU in C, resulting in an average stocking rate of 23 AU/ha. Light grazing was carried out from December 20 to 29, 2022, with 3 AU in A and B and 2 AU in C, corresponding to an average stocking rate of 13 AU/ha. In the rotational grazing system, A was grazed for 5 days, followed by 5 days in B, whereas the continuous grazing area C was grazed uninterruptedly for 10 days during each grazing intensity phase.
The GPS devices used in this study were Q8 high-frequency vehicle-mounted GPS units with an adjustable sampling interval of 10 seconds. The device dimensions were 58 × 32.5 × 20.8 mm, with a mainboard size of 47.5 × 24 × 4.8 mm and a total weight of 146.94 g. Each device featured three indicator lights: a blue light for GPS signal status, a green light for network signal status, and a red light for charging status. The battery capacity was 5000 mAh, and the positioning accuracy was within 10 meters. To ensure precise tracking of cattle movements, each GPS device was placed inside a waterproof Oxford cloth collar (dimensions: 11.5 × 6.5 × 4 cm). To enhance tracking accuracy, each cow was equipped with two GPS devices throughout the day, enabling differential GPS data processing and achieving an average update interval of approximately 5 seconds. Each grazing period involved equipping approximately half of the total cattle population with GPS collars. The GPS devices remained in standby mode when the cattle were stationary to conserve power and resumed recording upon movement detection. Healthy cattle with medium and similar body sizes were selected for the study, and everyone was continuously monitored using two GPS collars under both rotational and continuous grazing conditions.
2.3. Class Balancing and Classifier Learning
A significant class imbalance was observed in the dataset, with approximately 80% of the data corresponding to grazing behaviour, while the remaining four behaviours accounted for only 20% of the total data. This imbalance led to a high overall classification accuracy but poor generalization performance, with a strong bias toward predicting the majority class while underrepresenting behaviours such as rumination and lying.
To mitigate the issue of class imbalance commonly observed in livestock behaviour datasets, particularly those dominated by grazing records, five resampling strategies were systematically evaluated. These include: (1) combined sampling using the Synthetic Minority Oversampling Technique and Edited Nearest Neighbours (SMOTE-ENN), (2) combined sampling using SMOTE and Tomek Links (SMOTE-Tomek), (3) oversampling using the Synthetic Minority Oversampling Technique (SMOTE), (4) oversampling using Adaptive Synthetic Sampling (ADASYN), and (5) undersampling using Cluster Centroids. Each strategy was applied to enhance the representativeness of minority behaviour classes and reduce classifier bias. This evaluation provides insights into the relative effectiveness of resampling methods under different grazing management systems and supports the development of more robust behaviour classification models.
The four representative classification algorithms tested included Naïve Bayes (Probabilistic Generative Model), k-Nearest Neighbours (KNN) (Instance-Based Learning), Extreme Gradient Boosting (XGBoost) (boosting-based ensemble learning), and Random Forest (bagging-based ensemble learning). GPS-tracked location data and manually observed livestock behaviour data were incorporated as the training dataset input for the model. A stratified 10-fold cross-validation (10-FCV) method was used to evaluate classifier performance. In 10-FCV, the dataset was randomly divided into 10 equal subsets while maintaining the class distribution. Nine subsets were used for training, and the remaining subset was used for validation. This process was repeated until all 10 subsets had been used for both training and validation, allowing for the calculation of the average classification accuracy (CA) and error rate. Additionally, the process was repeated across 10 different randomized runs (10×10 FCV) to enhance the robustness of classifier learning. The best-performing classifier was subsequently applied to an independent test dataset.
2.4. Model Evaluation
A confusion matrix (Table 1) is a widely used tool for assessing classification model performance, particularly in supervised learning (Equation (1)). It provides a tabular representation of the relationship between true and predicted class labels, allowing for a detailed evaluation of model effectiveness. The key elements of the confusion matrix are:
- True Positive (TP): Correctly predicted positive instances.
- True Negative (TN): Correctly predicted negative instances.
- False Positive (FP): Incorrectly predicted positive instances.
- False Negative (FN): Incorrectly predicted negative instances.
Classification accuracy (CA) is commonly used as an evaluation metric, defined as the proportion of correctly classified instances:
However, accuracy alone is not always a reliable indicator of model performance, especially in imbalanced datasets where the classifier may achieve high accuracy by predominantly predicting the majority class. To address this limitation, precision and recall were considered (Equation (2), (3)):
Precision and recall often exhibit a trade-off, as increasing one typically decreases the other. To balance these metrics, the was employed as a harmonic mean of precision and recall (Equation. (4)):
Additionally, the Kappa coefficient (κ) was calculated to measure classification consistency beyond chance, accounting for random agreement between predictions and true labels (Equation. (5), (6)). Kappa values range from -1 to 1, with higher values indicating better agreement: where represents the expected accuracy given the class distribution.
These evaluation metrics are used to determine the classification performance of the model and to select the optimal model.
2.5. Zonal Grid Statistics and Spatial Hotspot Analysis of Livestock Behaviours
To quantitatively evaluate the spatial distribution patterns of cattle behaviours under different grazing intensities, the entire grazing area—comprising three grazing management units (A, B, and C)—was divided into 1 m × 1 m grid cells using a fishnet approach. Within each grid, the number of GPS trajectory points corresponding to five cattle behavioural categories (as classified by a machine learning model) was aggregated to generate zonal statistics. This enabled the visualization and comparison of behaviour-specific spatial concentrations across the different grazing zones.
Subsequently, spatial hotspot analysis was conducted for each grazing-intensity gradient to examine the clustering patterns of the five behavioural types. The Getis-Ord Gi* statistic was used to identify statistically significant hotspots of behavioural intensity across the study area. Additionally, the global Moran’s I statistic was calculated for each behaviour under different GIGs to evaluate overall spatial clustering patterns.
2.6. Behavioural Proportion Analysis and Peak Fitting of Grazing Behaviour
For the temporal analysis, the focus was on foraging behaviour, so a binary behavioural time series (grazing vs. non-grazing) was constructed within each day. By applying Gaussian curve fitting to the temporal distribution of grazing occurrences across the four daily intervals, we identified the central tendency and dispersion of grazing activity. This peak fitting approach allowed for the detection of potential shifts in the timing of grazing peaks across different GIGs.
3. Result
3.1. Optimal Machine Learning Classifier
After balancing, the five behaviours were more evenly distributed, each accounting for approximately 20%. Compared to the original dataset, the Cluster Centroids undersampling strategy significantly reduced the total sample size, while the SMOTE, ADASYN, and SMOTE-Tomek oversampling strategies substantially increased it. The SMOTE-ENN resampling method led to a moderate increase in the overall sample size (Table 2 and Table 3).
The performance of each classifier was evaluated separately on datasets from both continuous grazing and rotational grazing systems. Evaluation metrics included overall classification accuracy (CA), -score, and Kappa coefficient. Among the four models, the KNN classifier consistently achieved the highest performance across all metrics and grazing systems (Table 4), indicating its superior suitability for this study.
To further evaluate the classification performance of the KNN model under different resampling strategies, a range of K values (2–31) and distance metrics (Manhattan, Euclidean, Chebyshev) were tested.
Figure 3 shows that across both grazing systems, the combined resampling strategy SMOTE-ENN consistently yielded the highest accuracy, with peak performance at K = 2. Classification accuracy (CA) reached 0.968 under continuous grazing and 0.953 under rotational grazing. In comparison, SMOTE -Tomek, SMOTE, and ADASYN achieved moderate performance (CA ≈ 0.62–0.75), while Cluster Centroids performed the worst (CA ≈ 0.10–0.40)
Figure 4 shows that under three distance metrics, SMOTE-ENN again showed superior performance, with CA ranging from 0.902 to 0.930 across both datasets. SMOTE-Tomek, SMOTE, and ADASYN yielded CA between 0.639 and 0.765, while Cluster Centroids remained suboptimal (CA = 0.162–0.285). Using Manhattan distance with SMOTEENN produced the best results: CA = 0.930 (continuous grazing) and 0.912 (rotational grazing).
3.2. Spatial Distribution Patterns of Behaviours
Significant differences were observed in the spatial distribution patterns of fine-scale cold and hot spots for grazing, resting, lying, rumination, and walking behaviours under different grazing-intensity gradients and grazing management systems across the grazing zones, as identified by the KNN model (Figure 5 and Figure 6). Under continuous grazing, the hot spots for rumination, lying, and standing behaviours exhibited increased spatial dispersion with decreasing GIGs, while the spatial extent of grazing behaviour hot spots remained relatively stable and exhibited a more extensive distribution. In contrast, under rotational grazing, the hot spot areas for grazing and standing behaviours decreased and became more scattered with decreasing GIGs. The spatial distribution of hot spots for rumination and lying behaviours showed minimal variation with changes in GIGs. Notably, under both grazing systems, walking behaviour exhibited clearly defined cold and hot spots at moderate grazing (MG).
3.2.1. Spatial Clustering Pattern
The spatial clustering of cattle behaviours exhibited notable variations under different GIGs and management systems, as indicated by Moran’s I and Z-scores (Figure 7.). In both grazing systems, behaviours generally showed positive spatial autocorrelation (Moran’s I > 0, p < 0.001), indicating significant clustering across all conditions.
3.2.2. Spatial Clustering of Grazing Behaviour Varies with GIGs
In continuous grazing systems, grazing behaviour showed significantly higher values for the reduction of the GIGs. Spatial clustering increased notably with decreasing GIGs (Moran’s I: 0.195 → 0.383 → 0.301), peaking under moderate grazing (Moran’s I = 0.383, Z = 52.38), indicating the strongest spatial clustering. Clustering weakened under heavy (Moran’s I = 0.195, Z = 26.75) and light grazing (Moran’s I = 0.301, Z = 41.30). In contrast, under rotational grazing, spatial clustering of grazing behaviour remained relatively stable across GIGs (Moran’s I: 0.266 → 0.236 → 0.236), with significantly lower clustering at moderate and light intensities (Z = 36.88 and 36.84, respectively) compared to continuous grazing.
3.2.3. Spatial Clustering of Non-Grazing Behaviours Varies with GIGs
Under both continuous and rotational grazing systems, lying behaviour exhibited the highest spatial clustering under Heavy grazing (HG). In the continuous grazing system, lying and ruminating behaviours showed the strongest spatial clustering, which declined significantly with decreasing GIGs (Moran’s I for lying: 0.378 → 0.271 → 0.187; ruminating: 0.333 → 0.284 → 0.202). In the rotational grazing system, lying and walking behaviours exhibited the highest spatial clustering, both of which also declined as GIGs decreased (Moran’s I for lying: 0.416 → 0.271 → 0.185; walking: 0.372 → 0.347 → 0.254).
3.2.4. Variance Patterns of Moran’s I for Five Behaviours Across GIGs
As shown in Table 5, under HG, the Moran’s I values for different behaviours varied more in both continuous and rotational grazing systems, with lower variability observed in the rotational system (variance of Moran’s I: 0.00689) compared to the continuous system (0.00766). Under Moderate grazing (MG), the variance of Moran’s I between behaviours was similar between systems (continuous: 0.00213; rotational: 0.00293). Under light grazing-intensity, the variance further decreased in both systems (continuous: 0.00202; rotational: 0.00178).
3.3. Temporal Probability Distribution Patterns of Behaviours
Grazing behaviour accounted for the highest proportion among all behaviours across both grazing systems. As shown in the Figure 8a, under the rotational grazing system, the proportions of the five behaviours tended to converge with decreasing GIGs. In contrast, under the continuous grazing system (Figure 8b), grazing behaviour remained dominant at moderate and light grazing (MG: 33.56%; LG: 37.55%).
As GIGs decreased, walking behaviour showed a trend of first increasing and then decreasing in both systems (continuous: 8.47%–19.59%–16.00%; rotational: 7.15%–20.69%–18.91%). Standing behaviour consistently increased with decreasing GIGs (continuous: 9.33%–18.05%–20.25%; rotational: 13.31%–21.75%–24.26%). The proportion of lying behaviour was relatively stable across GIGs, with consistently higher values in the rotational system compared to the continuous system.
3.4. Variation in Grazing Behaviour Peaks
The peak fitting analysis of grazing behaviour revealed distinct temporal patterns across GIGs and grazing management systems (Figure 9). Under the continuous grazing system, grazing peaks were more concentrated in the early stages at heavy grazing stage, with a total of 7 peaks. At moderate grazing stage, the peaks were more evenly distributed over time, totalling 8, while at light grazing stage, the number of peaks decreased to 4. In the rotational grazing system, the distribution of grazing peaks was more uniform across the GIGs. The number of peaks responded to a gradual decrease as the GIG decreased: 9 (heavy), 7 (moderate), and 3 (light).
4. Discussion
Although SMOTE-ENN achieved the highest classification accuracy across both rotational and continuous grazing datasets in this study, its superiority may not be universally applicable (Feng, 2021). This performance can be attributed to the synergistic effect of SMOTE, which generates synthetic instances for minority classes, and Edited Nearest Neighbours (ENN), which filters out noisy or borderline samples from the majority class. Together, these techniques not only improve class balance but also enhance the definition of class boundaries, leading to better generalization of the model. However, it is worth noting that the classification accuracy of SMOTE-Tomek was also comparably high, suggesting that alternative resampling strategies may yield competitive or even superior results under different circumstances. In behaviour monitoring tasks with substantially different data characteristics—such as variations in class distribution, sample size, the effectiveness of a given resampling technique is highly context-dependent (Burnaev, 2015). Additionally, factors such as the choice of classifier, feature representation, and evaluation metrics can further influence the performance of resampling approaches (Kraiem, 2017). Thus, the effectiveness of resampling methods should be re-assessed in similar grazing behaviour studies.
Since the grazing experiment was conducted in a fenced, flat pasture, GPS coordinates inherently correlate with elevation, slope, and aspect. Including many topographic variables risks multicollinearity, reducing model robustness and interpretability (Fotheringham, 2016). However, in free-range or heterogeneous mountainous systems, diverse environmental covariates are necessary to capture spatial complexity. Additionally, behaviour misclassification remains a source of error. False positives in behaviour classification can be interpreted as analogous to Type I errors. For example, mistaking ‘rumination’ for ‘standing’ inflates rumination estimates, impacting precision, recall, and possibly creating false spatial hotspots due to prediction bias.
Spatial hot-spot analysis revealed pronounced spatial heterogeneity in behaviours under both continuous and rotational grazing systems, with varying responses to GIGs. In the continuous grazing system, as GIGs decreased, resting behaviours such as ruminating, lying, and standing exhibited increasingly dispersed hot spots, indicating a reduction in spatial clustering. Grazing behaviour maintained relatively stable and concentrated spatial hot spots regardless of GIGs change. This suggests that, under continuous grazing, high grazing pressure coupled with limited vegetation resources compels cattle to maintain a highly stable spatial distribution of grazing behaviour, concentrated in areas with abundant forage (Utsumi, 2009). In contrast, resting behaviours such as rumination, lying, and standing tend to exhibit greater spatial dispersion and variability. As GIGs decrease, these low-energy resting behaviours become more broadly and evenly distributed spatially, while grazing activity remains highly clustered to sustain energy intake and physiological demands. (Aharoni, 2009) Under rotational grazing, reduced grazing pressure and increased resource availability lead to a more effective spatial dispersion and balance of grazing hotspots with decreasing GIGs (Fuhlendorf & Engle, 2001). This suggests that rotational management promotes more flexible spatial behaviour and potentially mitigates overutilization of localized forage patches.
Moran’s I further quantified these spatial dynamics. Notably, spatial clustering did not respond linearly to changes in GIGs. Under continuous grazing, as GIGs decreased, grazing behaviour under MG and LG exhibited relatively higher Moran’s I values, indicating stronger spatial clustering, whereas high grazing intensity (HG) showed lower Moran’s I. This pattern may be attributed to intensified intraspecific competition under high stocking pressure (Wells, 2022), where limited availability of high-quality forage compels cattle to expand their foraging range in search of resources (Ge, 2022). Although the spatial clustering of grazing behaviour appears reduced under HG, the resulting dispersed yet frequent and intense grazing activity—driven by forage scarcity and interspecific competition—can still exert substantial cumulative pressure on the grassland. Consequently, such conditions may accelerate widespread grassland degradation despite the lower observed spatial clustering. Under rotational grazing, spatial clustering for grazing remained low and stable across intensities (Moran’s I = 0.236–0.266), with lower Z-scores compared to continuous grazing. This suggests more spatially dispersed and balanced cattle activity. Moreover, rotational management moderated the clustering of lying, walking, and standing behaviours, which exhibited a consistent decline in spatial aggregation with reduced grazing pressure. These results suggest that rotational grazing increases behavioural sensitivity to changes in GIGs and more effectively mitigates the spatial concentration of high-impact behaviours such as grazing, allowing better control of grassland degradation through stocking rate adjustments.
Analysis of behavioural variance via Moran’s I showed that spatial heterogeneity among behaviours was highest under heavy grazing, particularly in continuous systems. As GIGs decreased, behavioural differences in spatial clustering diminished in both systems, with rotational grazing exhibiting more uniform and consistent behavioural spatial patterns across all intensity levels. This further illustrates the highly responsive nature of behaviour under rotational grazing systems.
On the temporal scale, grazing behaviour remained predominant across both systems. However, rotational grazing promoted a more balanced temporal distribution of behaviours with decreasing grazing intensity, suggesting enhanced behavioural plasticity in response to improved resource availability (Batista, 2023; Pollock, 2022). In contrast, under continuous grazing, grazing consistently dominated even at medium and light intensities (MG: 33.56%; LG: 37.55%), indicating reduced responsiveness of behavioural allocation to pressure gradients. In both grazing systems, standing behaviour increased with reduced stocking pressure, likely reflecting decreased foraging urgency, while walking behaviour exhibited a unimodal response, potentially driven by trade-offs between search effort and energy conservation (Zhao & Jurdak, 2016). Notably, peak fitting of grazing behaviour revealed more structured temporal rhythms under rotational management: although the number of grazing peaks decreased from 9 to 3 as intensity declined, their distribution became more uniform, reflecting a stable activity rhythm shaped by rotational strategies. In contrast, continuous grazing exhibited a less coherent pattern, with peak number and intensity fluctuating more erratically. These findings highlight the role of rotational grazing in modulating both the intensity and temporal structure of high-impact behaviours (Cheleuitte-Nieves, 2020).
5. Conclusions
This study compared the behaviour classification accuracy of four machine learning models across different grazing datasets, identifying KNN as the optimal classifier. Through the implementation of five resampling strategies and KNN parameter sensitivity analysis, we proposed a robust method for grazing data mining. Based on the KNN classification results across different grazing-intensity gradients (GIGs), followed by zonal clustering analysis (Moran’s I) and behavioural temporal probability distribution analysis, this study systematically investigated the spatiotemporal distribution of cattle behaviour under varying GIGs and management systems. The results demonstrated that in continuous grazing systems, even when grazing intensity was reduced, the progressive decline in food availability continued to intensify the spatial clustering of grazing behaviour, thereby increasing the risk of land degradation. Conversely, rotational grazing systems promoted more spatially dispersed and temporally stable grazing behaviour. Additionally, the spatial clustering of other behaviours showed greater responsiveness to changes in GIGs, while the temporal concentration of grazing behaviour declined in accordance with decreasing GIGs. Taken together, these findings suggest that, when combined with appropriate adjustments to GIGs, rotational grazing can effectively balance the spatial and temporal distribution of behaviours, thereby maintaining the stability of the pasture-livestock system.
Author Contributions
Guo Ye: Writing—review & editing, Writing—original draft, Visualization, Validation, Methodology, Investigation, Formal analysis. Rui Yu: Writing—review & editing, Resources, Project administration, Methodology, Funding acquisition, Conceptualization, Supervision. All authors have read and agreed to the published version of the manuscript.
Institutional Review Board Statement
Not applicable.
Informed Consent Statement
Not applicable.
Data Availability Statement
The data presented in this study are available on request from the corresponding author through appropriate channels.
Acknowledgments
The authors gratefully acknowledge the support of local farmers and herders during data collection. This work was supported by the National Natural Science Foundation of China (Project No. 72104065), Hainan New Star Projects (Project No. NHXXRCXM202303), Natural Resources Comprehensive Survey Command Centre Science and Technology Innovation Fund (Project No. KC20230018), and Sanya Science and Technology Special Fund (Project No. 2022KJCX04).
Conflicts of Interest
The authors declare no conflict of interest. The funders had no role in the design of the study; in the collection, analyses, or interpretation of data; in the writing of the manuscript, or in the decision to publish the results.
References
- Adler, P. , Raff, D., & Lauenroth, W. The effect of grazing on the spatial heterogeneity of vegetation. Oecologia 2001, 128, 465–479. [Google Scholar] [CrossRef]
- Aharoni, Y. , Henkin, Z., Ezra, A., Dolev, A., Shabtay, A., Orlov, A.,... & Brosh, A. Grazing behavior and energy costs of activity: A comparison between two types of cattle. Journal of Animal Science 2009, 87, 2719–2731. [Google Scholar] [CrossRef]
- Akasbi, Z. , Oldeland, J., Dengler, J., & Finckh, M. Analysis of GPS trajectories to assess goat grazing pattern and intensity in Southern Morocco. The Rangeland Journal 2012, 34, 415–427. [Google Scholar] [CrossRef]
- Asner, G. P. , Elmore, A. J., Olander, L. P., Martin, R. E., & Harris, A. T. Grazing systems, ecosystem responses, and global change. Annu. Rev. Environ. Resour. 2004, 29, 261–299. [Google Scholar] [CrossRef]
- Augustine, D. J. , & Derner, J. D. Assessing herbivore foraging behavior with GPS collars in a semiarid grassland. Sensors 2013, 13, 3711–3723. [Google Scholar] [CrossRef]
- Bailey, D. W. , & Brown, J. R. Rotational grazing systems and livestock grazing behavior in shrub-dominated semi-arid and arid rangelands. Rangeland Ecology & Management 2011, 64, 1–9. [Google Scholar] [CrossRef]
- Batista, P. H. D. , De Almeida, G. L. P., Pandorfi, H., De Medeiros, V. W. C., Moraes, A. S., De Melo, A. A. S.,... & Silva, M. A. Phenotypic plasticity and behavioral responses of dairy cattle on rotational grazing. Tropical Animal Health and Production 2023, 55, 158. [Google Scholar] [CrossRef] [PubMed]
- Burnaev, E. , Erofeev, P., & Papanov, A. (2015, December). Influence of resampling on accuracy of imbalanced classification. In Eighth international conference on machine vision (ICMV 2015) (Vol. 9875, pp. 423–427). SPIE. [CrossRef]
- Cheleuitte-Nieves, C. , Perotto-Baldivieso, H. L., Wu, X. B., & Cooper, S. M. Environmental and landscape influences on the spatial and temporal distribution of a cattle herd in a South Texas rangeland. Ecological Processes 2020, 9, 1–18. [Google Scholar] [CrossRef]
- Creamer, M. L. , Roche, L. M., Horback, K. M., & Saitone, T. L. Optimising cattle grazing distribution on rangeland: a systematic review and network analysis. The Rangeland Journal 2019, 41, 441–455. [Google Scholar] [CrossRef]
- Cristescu, B. , Stenhouse, G. B., & Boyce, M. S. Large omnivore movements in response to surface mining and mine reclamation. Scientific Reports 2016, 6, 19177. [Google Scholar] [CrossRef]
- Feng, Y. , Zhou, M., & Tong, X. Imbalanced classification: A paradigm-based review. Statistical Analysis and Data Mining: The ASA Data Science Journal 2021, 14, 383–406. [Google Scholar] [CrossRef]
- Fotheringham, A. S. , & Oshan, T. M. Geographically weighted regression and multicollinearity: dispelling the myth. Journal of geographical systems 2016, 18, 303–329. [Google Scholar] [CrossRef]
- Fuhlendorf, S. D. , & Engle, D. M. Restoring heterogeneity on rangelands: ecosystem management based on evolutionary grazing patterns: we propose a paradigm that enhances heterogeneity instead of homogeneity to promote biological diversity and wildlife habitat on rangelands grazed by livestock. BioScience 2001, 51, 625–632. [Google Scholar] [CrossRef]
- Garibaldi, L. A. , Semmartin, M., & Chaneton, E. J. Grazing-induced changes in plant composition affect litter quality and nutrient cycling in flooding Pampa grasslands. Oecologia 2007, 151, 650–662. [Google Scholar] [CrossRef]
- Ge, Z. , & Liu, Q. X. Foraging behaviours lead to spatiotemporal self-similar dynamics in grazing ecosystems. Ecology Letters 2022, 25, 378–390. [Google Scholar] [CrossRef]
- Hiltbrunner, D. , Schulze, S., Hagedorn, F., Schmidt, M. W., & Zimmmermann, S. Cattle trampling alters soil properties and changes soil microbial communities in a Swiss sub-alpine pasture. Geoderma 2012, 170, 369–377. [Google Scholar] [CrossRef]
- Homburger, H. , Lüscher, A., Scherer-Lorenzen, M., & Schneider, M. K. Patterns of livestock activity on heterogeneous subalpine pastures reveal distinct responses to spatial autocorrelation, environment and management. Movement Ecology 2015, 3, 1–15. [Google Scholar] [CrossRef]
- John, G. H. , & Langley, P. (2013). Estimating continuous distributions in Bayesian classifiers. arXiv preprint arXiv:1302.4964, arXiv:1302.4964.
- Kampmann, D. , Herzog, F., Jeanneret, P., Konold, W., Peter, M., Walter, T.,... & Lüscher, A. Mountain grassland biodiversity: Impact of site conditions versus management type. Journal for Nature Conservation 2008, 16, 12–25. [Google Scholar] [CrossRef]
- Kawamura, K. , Akiyama, T., Yokota, H. O., Tsutsumi, M., Yasuda, T., Watanabe, O., & Wang, S. Quantifying grazing intensities using geographic information systems and satellite remote sensing in the Xilingol steppe region, Inner Mongolia, China. Agriculture, ecosystems & environment 2005, 107, 83–93. [Google Scholar] [CrossRef]
- Kilgour, R. J. In pursuit of “normal”: A review of the behaviour of cattle at pasture. Applied Animal Behaviour Science. [CrossRef]
- Kim, Y. , Kwon, S., & Choi, H. Consistent model selection criteria on high dimensions. The Journal of Machine Learning Research 2012, 13, 1037–1057. [Google Scholar] [CrossRef]
- Kraiem, M. S. , & Moreno, M. N. (2017). Effectiveness of basic and advanced sampling strategies on the classification of imbalanced data. A comparative study using classical and novel metrics. In Hybrid Artificial Intelligent Systems: 12th International Conference, HAIS 2017, La Rioja, Spain, -23, 2017, Proceedings 12 (pp. 233–245). Springer International Publishing. 21 June. [CrossRef]
- Laliberté, E. , & Tylianakis, J. M. Cascading effects of long-term land-use changes on plant traits and ecosystem functioning. Ecology 2012, 93, 145–155. [Google Scholar] [CrossRef]
- Melnykov, V. , & Michael, S. Clustering large datasets by merging K-means solutions. Journal of Classification 2020, 37, 97–123. [Google Scholar] [CrossRef]
- Millward, M. F. , Bailey, D. W., Cibils, A. F., & Holechek, J. L. A GPS-based evaluation of factors commonly used to adjust cattle stocking rates on both extensive and mountainous rangelands. Rangelands 2020, 42, 63–71. [Google Scholar] [CrossRef]
- Pollock, J. G. , Gordon, A. W., Huson, K. M., & McConnell, D. A. The effect of frequency of fresh pasture allocation on the feeding behaviour of high production dairy cows. Animals 2022, 12, 243. [Google Scholar] [CrossRef]
- Semmartin, M. , Garibaldi, L. A., & Chaneton, E. J. Grazing history effects on above-and below-ground litter decomposition and nutrient cycling in two co-occurring grasses. Plant and Soil 2008, 303, 177–189. [Google Scholar] [CrossRef]
- Suykens, J. A. Deep restricted kernel machines using conjugate feature duality. Neural computation 2017, 29, 2123–2163. [Google Scholar] [CrossRef]
- Utsumi, S. A. , Cangiano, C. A., Galli, J. R., McEachern, M. B., Demment, M. W., & Laca, E. A. Resource heterogeneity and foraging behaviour of cattle across spatial scales. BMC ecology 2009, 9, 1–10. [Google Scholar] [CrossRef]
- WANG, S. , HAN, G., ZHANG, S., BAO, Y., WANG, Z., & WU, C. Analysis of sheep grazing behavior and interaction with grassland environment in desert steppes using 3S. Chinese Journal of Eco-Agriculture 2015, 23, 860–867. [Google Scholar]
- Wells, H. B. , Crego, R. D., Ekadeli, J., Namoni, M., Kimuyu, D. M., Odadi, W. O.,... & Young, T. P. Less is more: Lowering cattle stocking rates enhances wild herbivore habitat use and cattle foraging efficiency. Frontiers in Ecology and Evolution 2022, 10, 825689. [Google Scholar] [CrossRef]
- Williams, M. L. , Mac Parthaláin, N., Brewer, P., James, W. P. J., & Rose, M. T. A novel behavioral model of the pasture-based dairy cow from GPS data using data mining and machine learning techniques. Journal of dairy science 2016, 99, 2063–2075. [Google Scholar] [CrossRef]
- Yu, R. , Evans, A. J., & Malleson, N. An agent-based model for assessing grazing strategies and institutional arrangements in Zeku, China. Agricultural Systems 2019, 171, 135–142. [Google Scholar] [CrossRef]
- Zhao, K. , & Jurdak, R. Understanding the spatiotemporal pattern of grazing cattle movement. Scientific reports 2016, 6, 31967. [Google Scholar] [CrossRef]
Figure 1.
Study area: A, B: Rotational grazing plot; C: Continuous grazing plot.
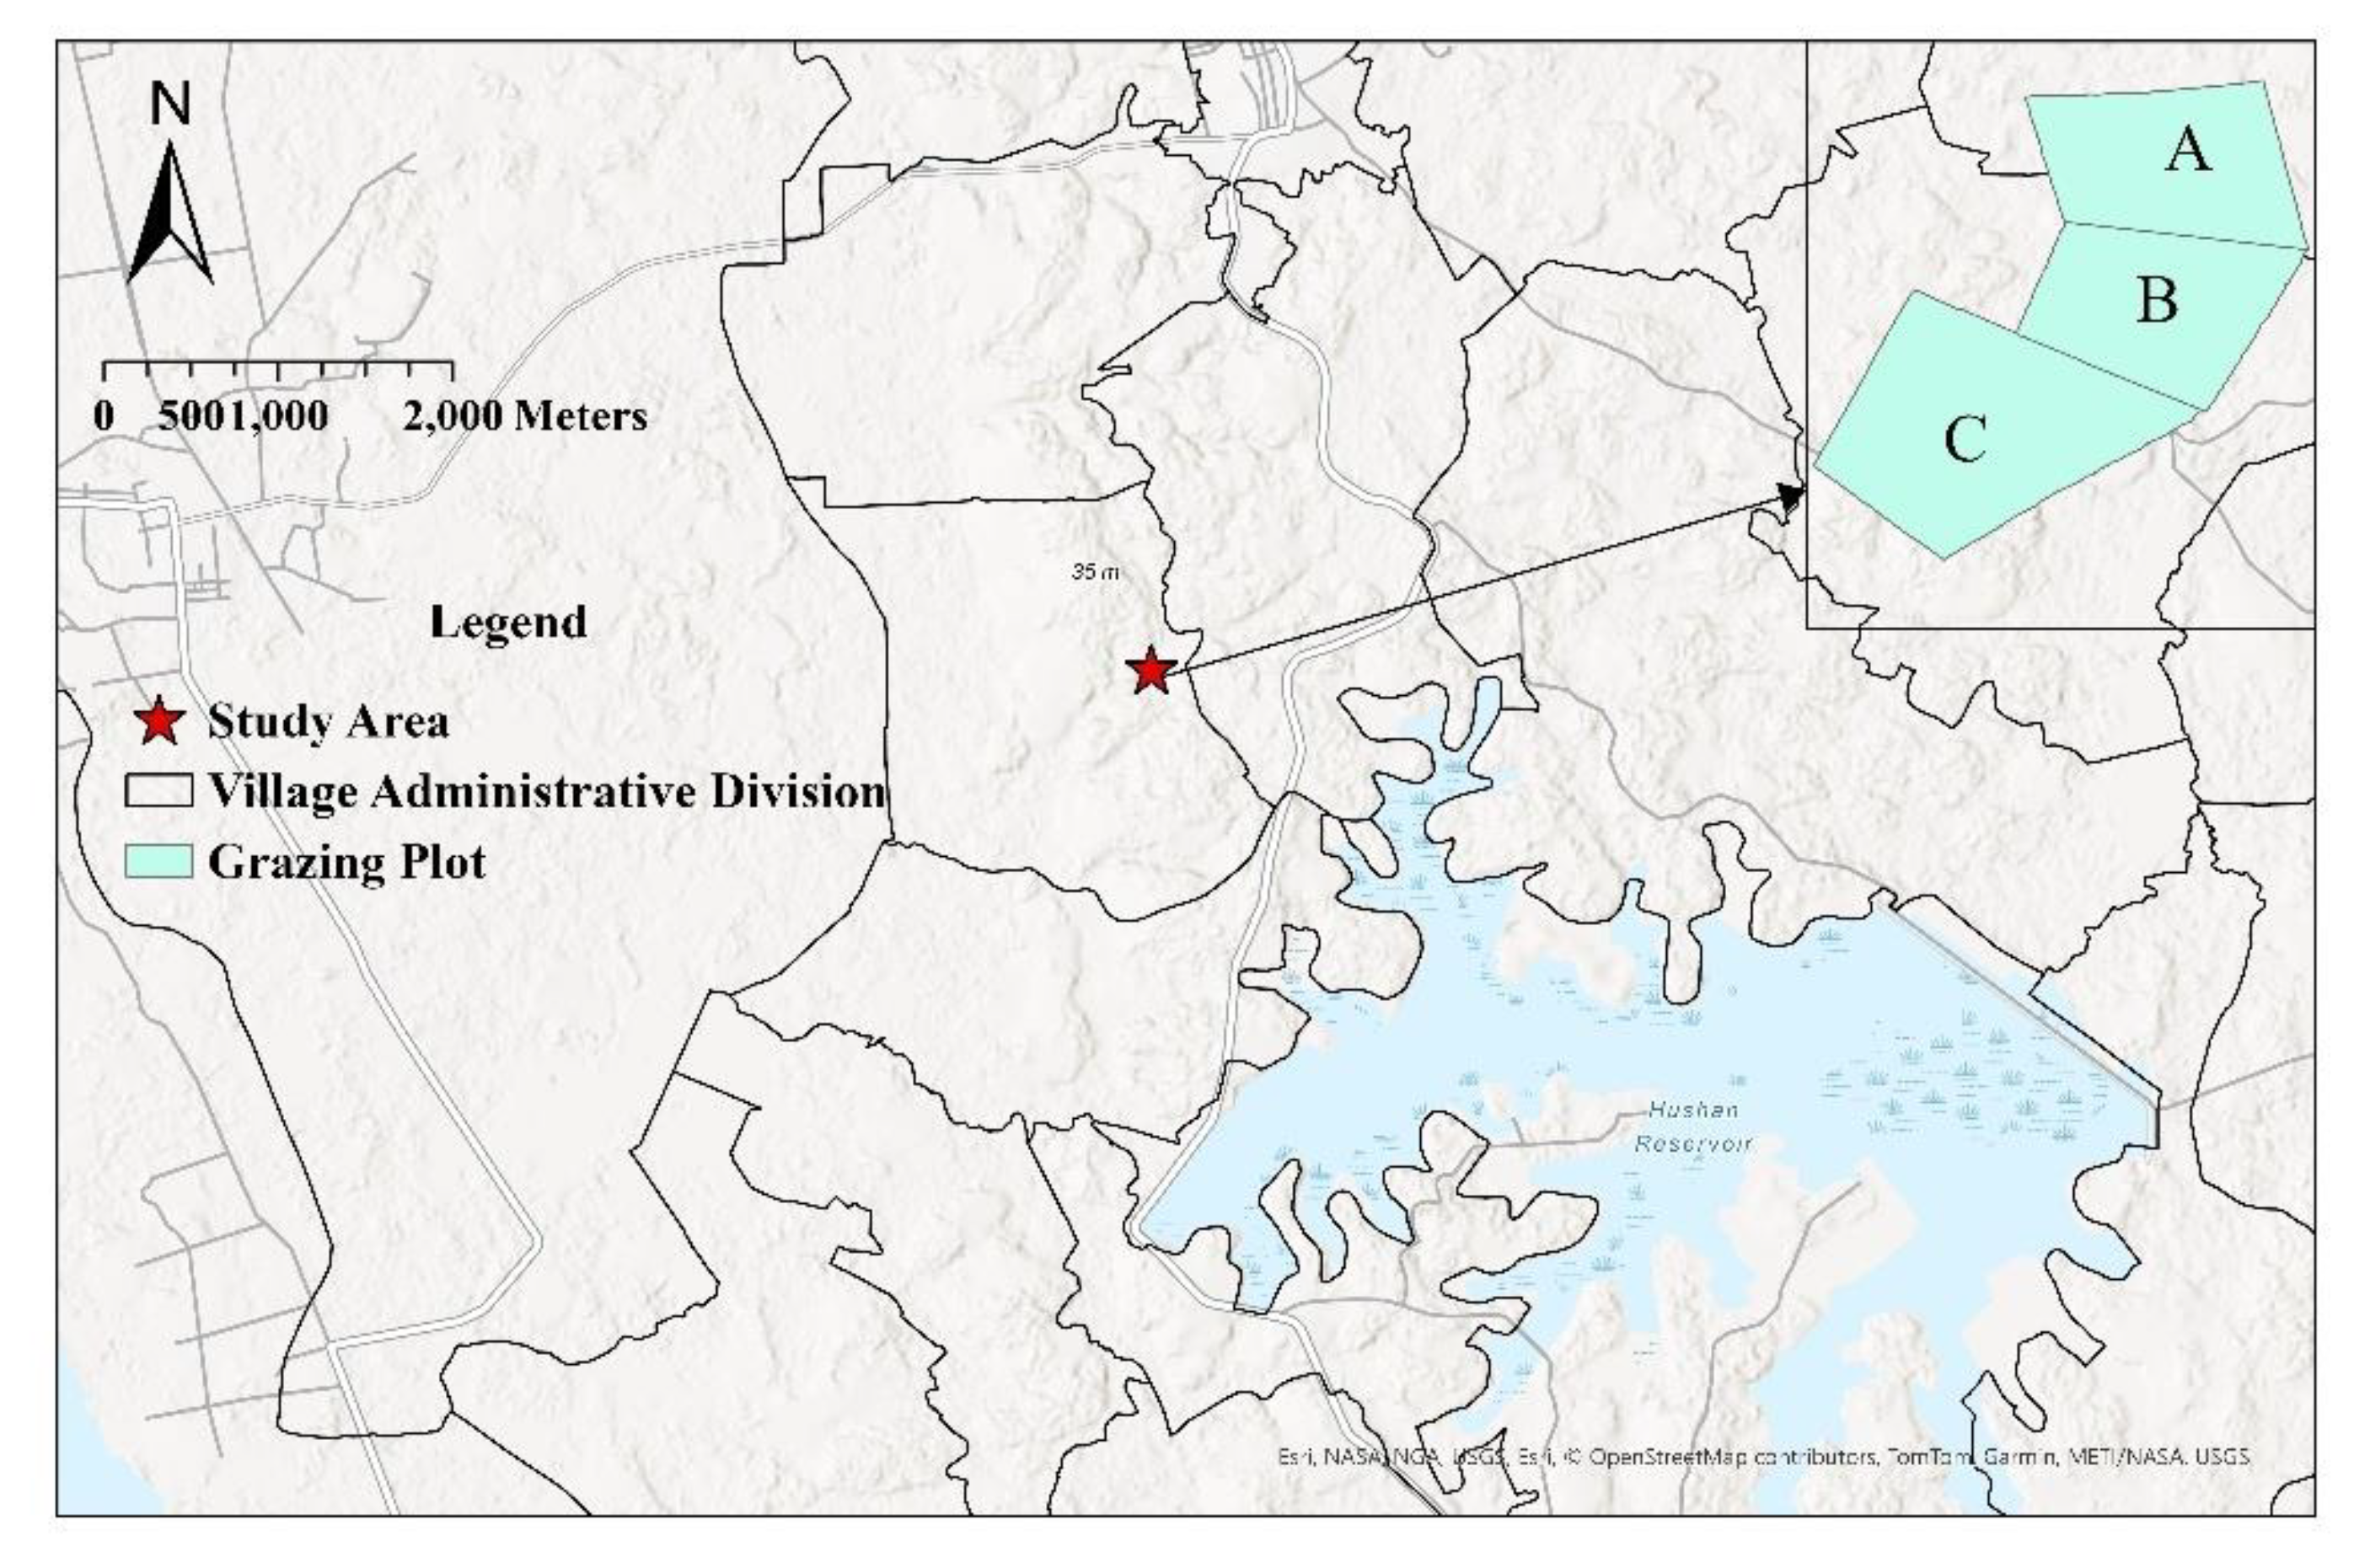
Figure 2.
The five main behaviours of cattle: (a) Grazing, (b) Standing, (c) Walking, (d) Lying, (e) Rumination.
Figure 2.
The five main behaviours of cattle: (a) Grazing, (b) Standing, (c) Walking, (d) Lying, (e) Rumination.
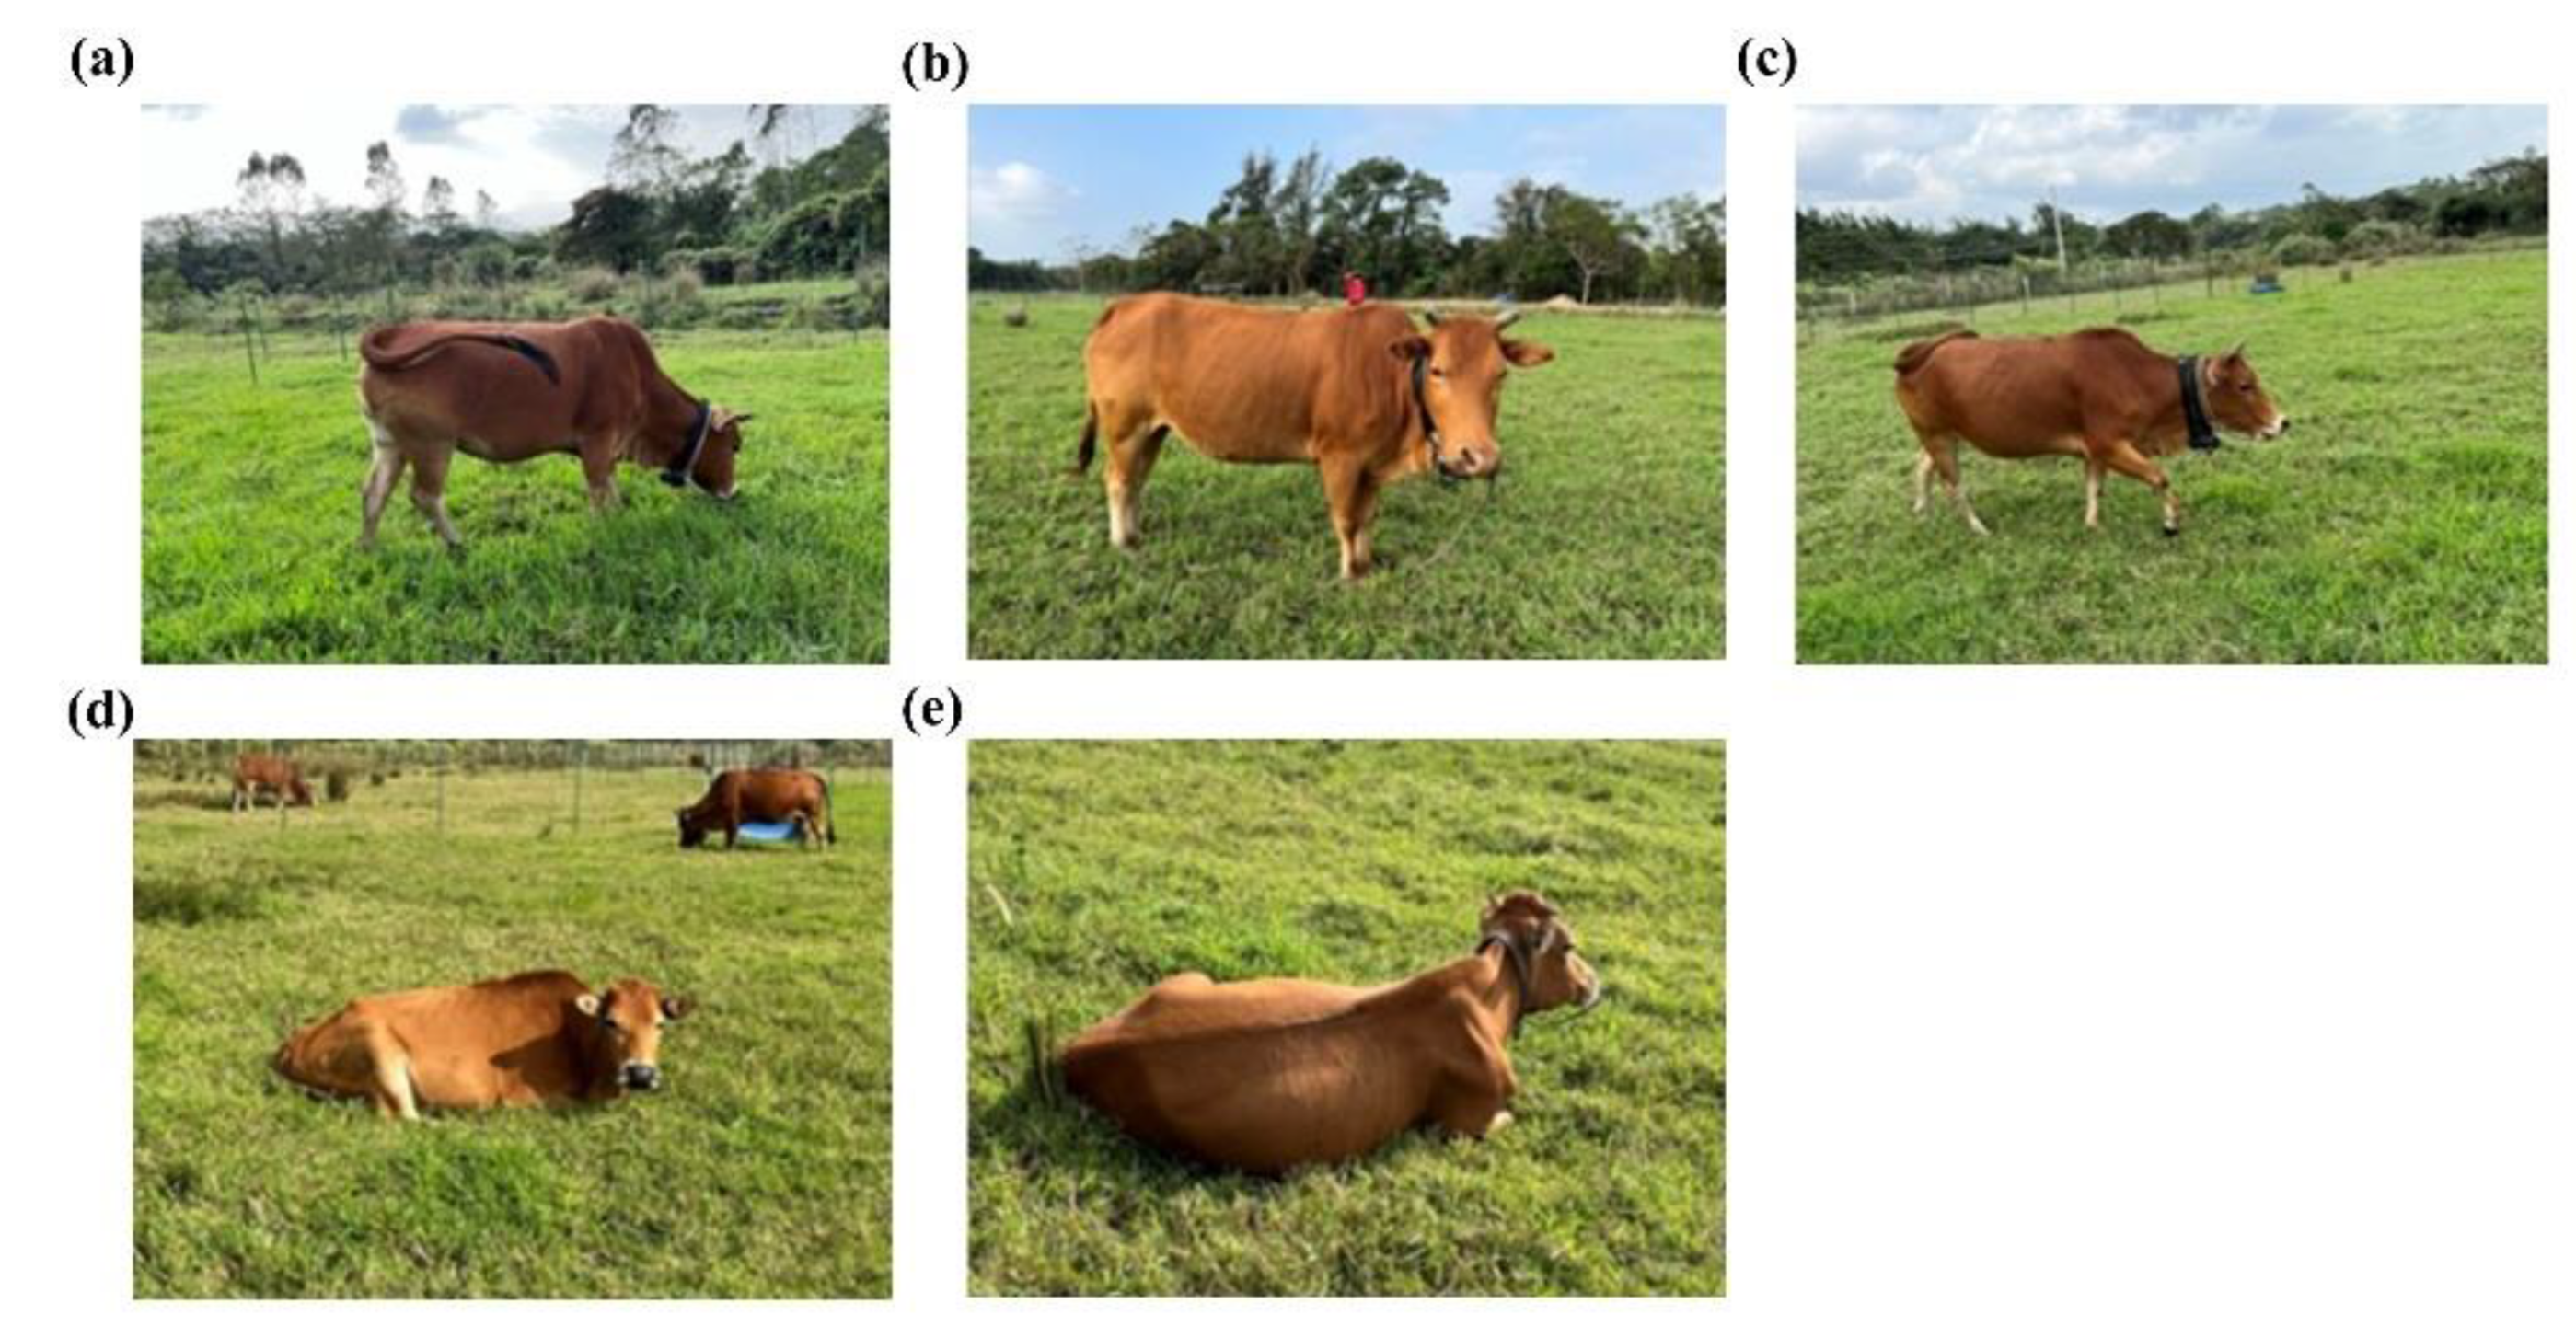
Figure 3.
Evaluation of Resampling Strategies with K value: (a) continuous grazing dataset, (b) rotational grazing dataset.
Figure 3.
Evaluation of Resampling Strategies with K value: (a) continuous grazing dataset, (b) rotational grazing dataset.
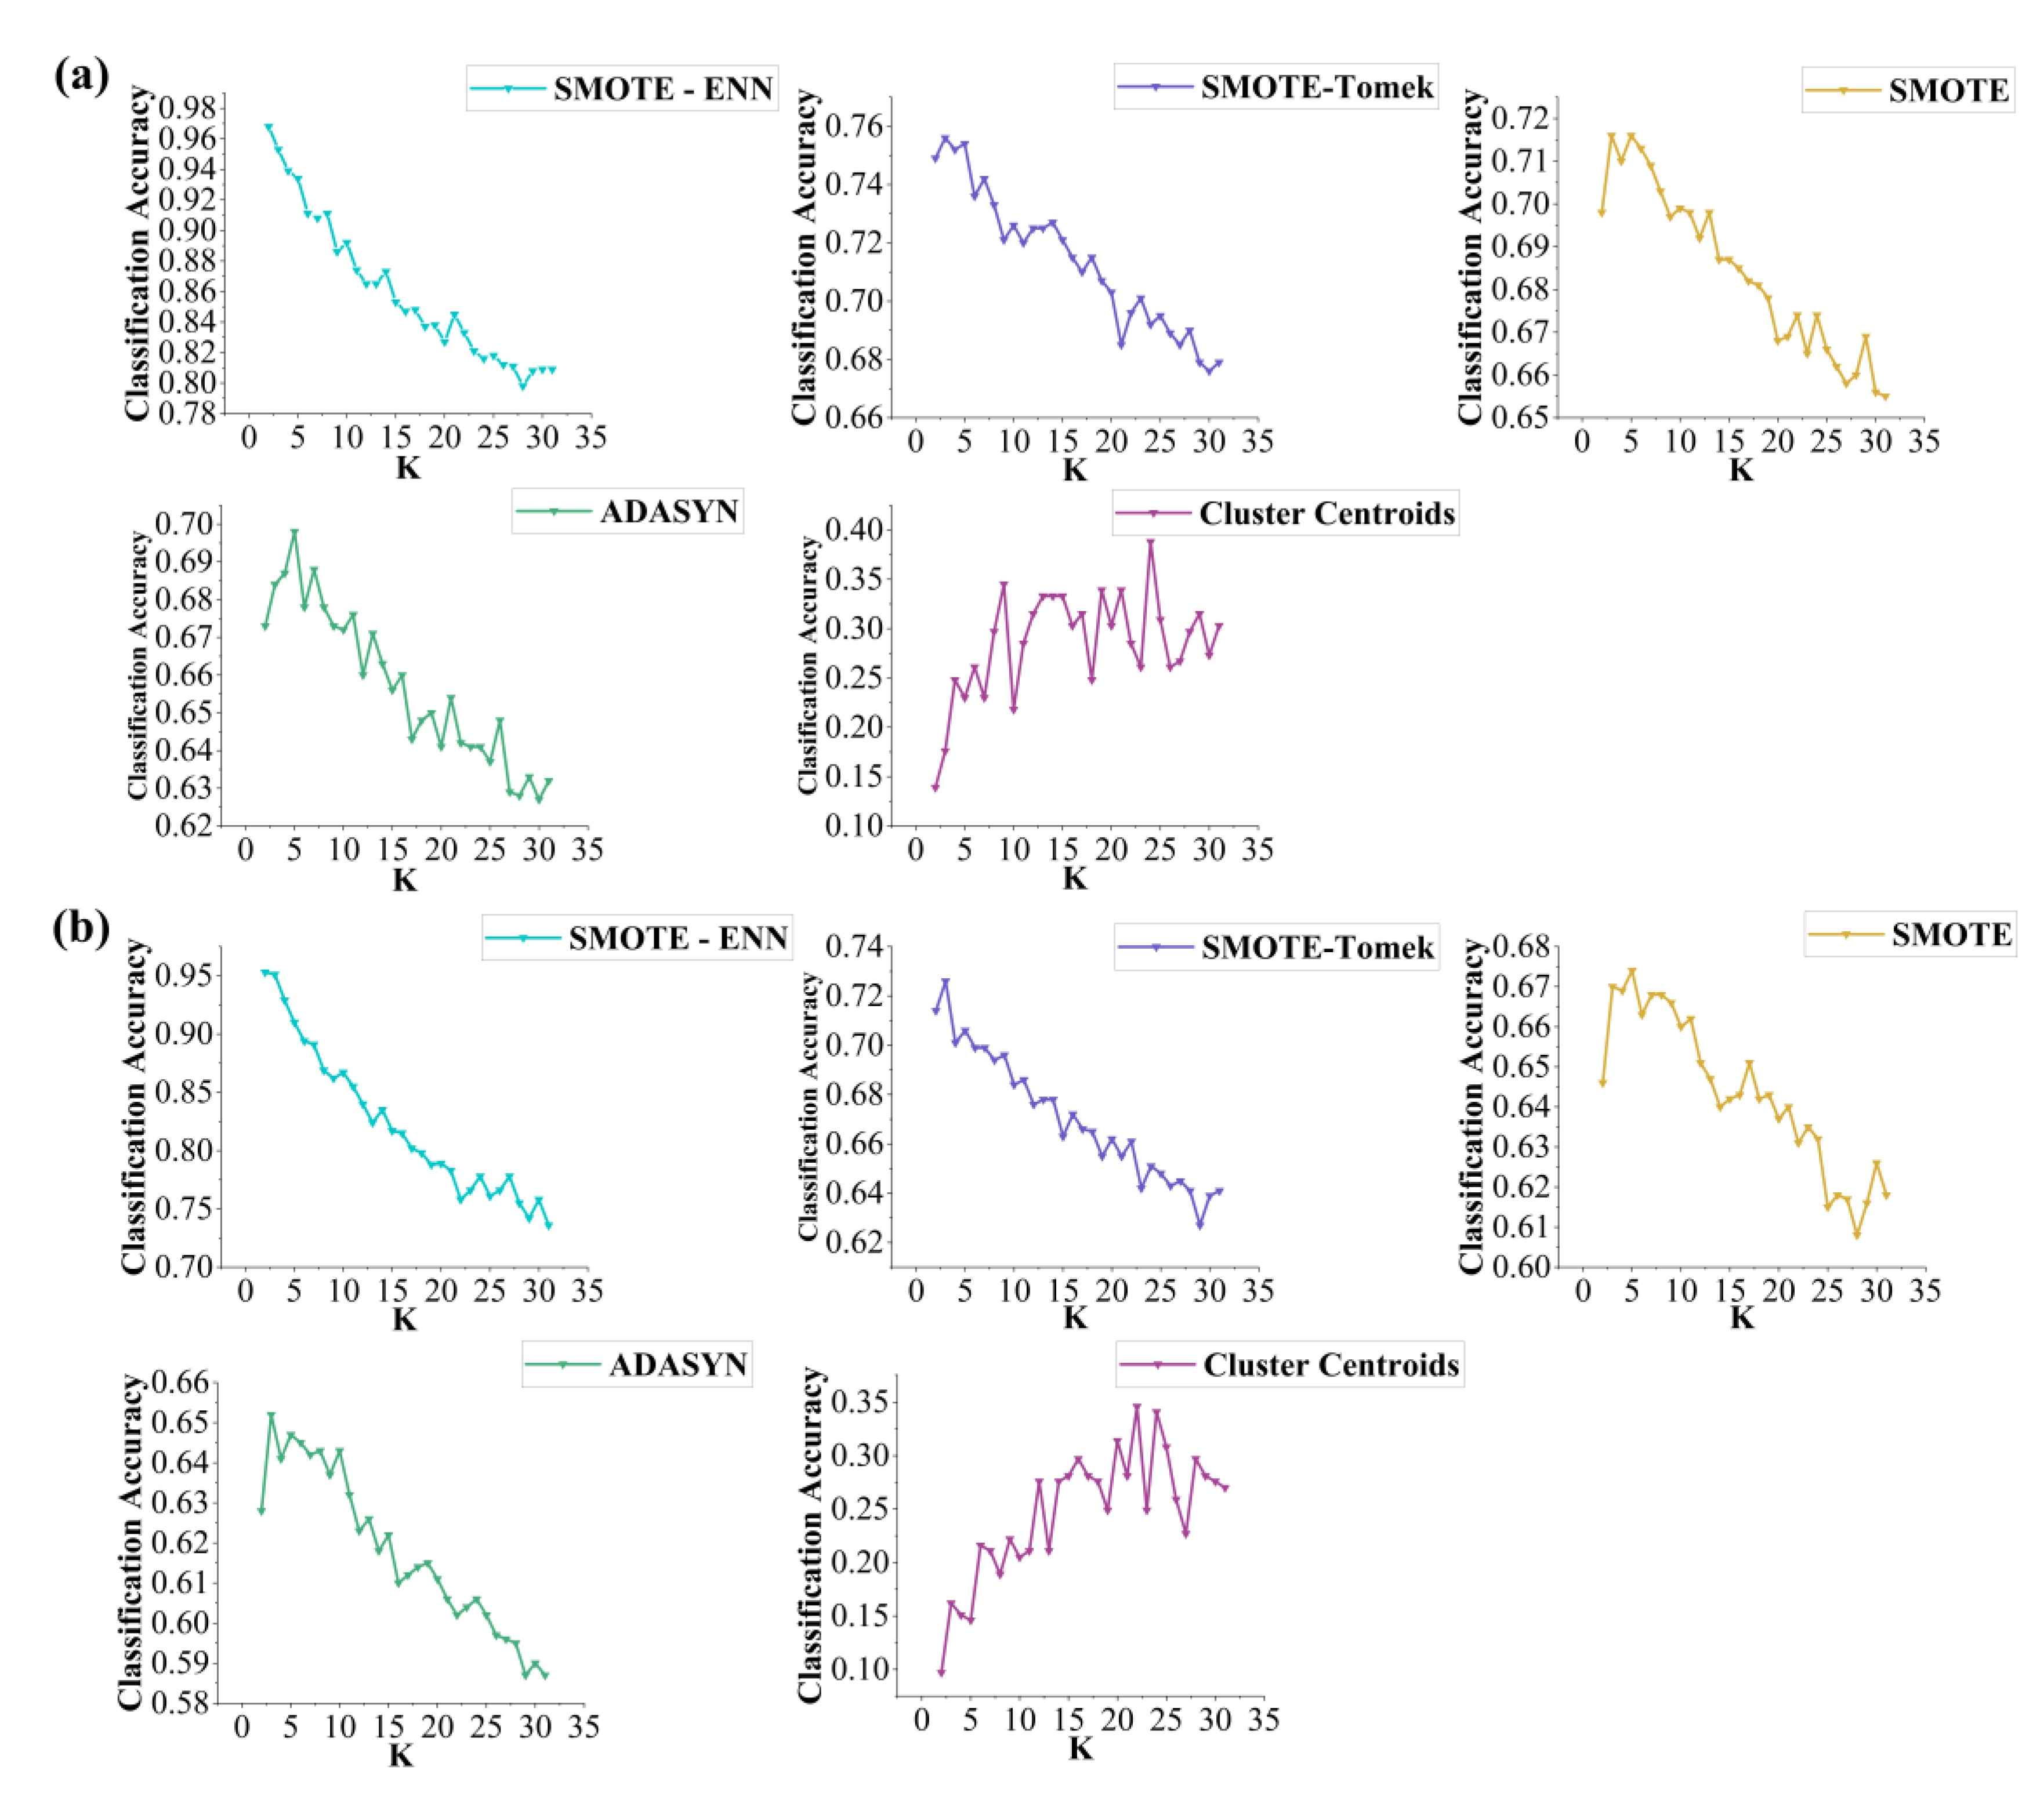
Figure 4.
Evaluation of Resampling Strategies with Distance metrics: (a) continuous grazing dataset, (b) rotational grazing dataset.
Figure 4.
Evaluation of Resampling Strategies with Distance metrics: (a) continuous grazing dataset, (b) rotational grazing dataset.
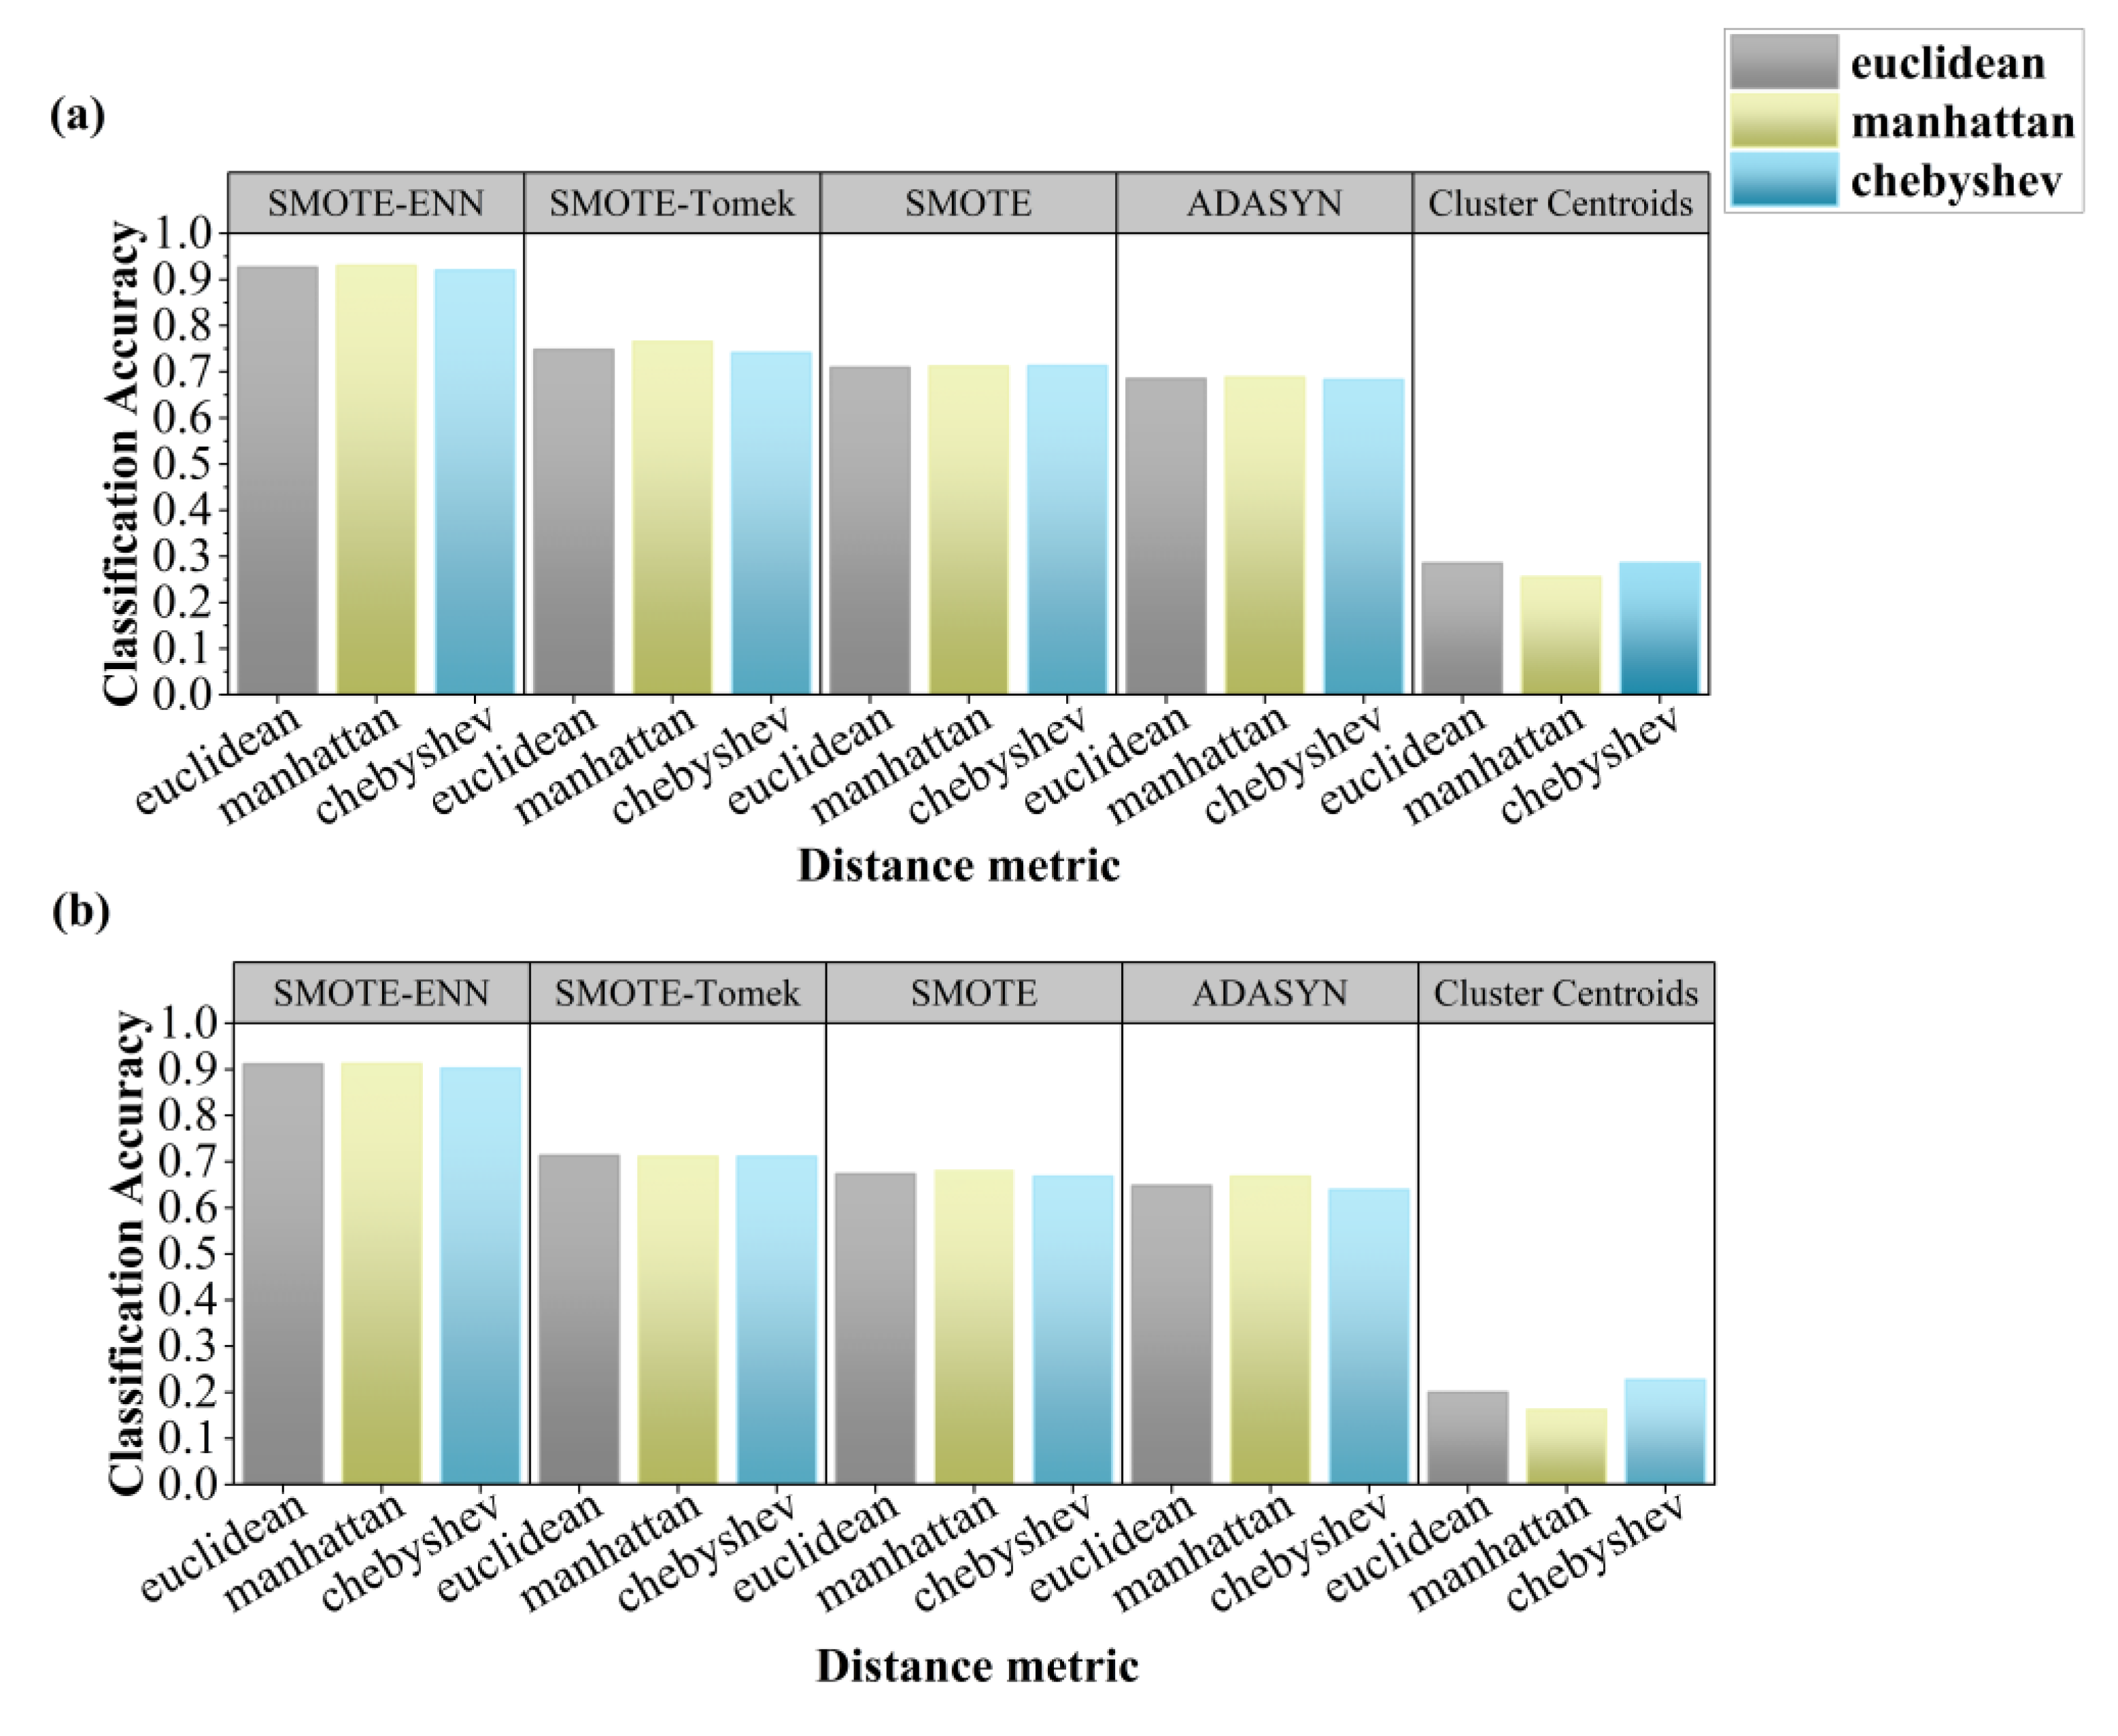
Figure 5.
Hot-cold spot maps of five behaviours under continuous grazing (G: Grazing, R: Ruminating, W: Walking, L: Lying, S: Standing; HG: Heavy grazing, MG: Moderate grazing, LG: Light grazing).
Figure 5.
Hot-cold spot maps of five behaviours under continuous grazing (G: Grazing, R: Ruminating, W: Walking, L: Lying, S: Standing; HG: Heavy grazing, MG: Moderate grazing, LG: Light grazing).
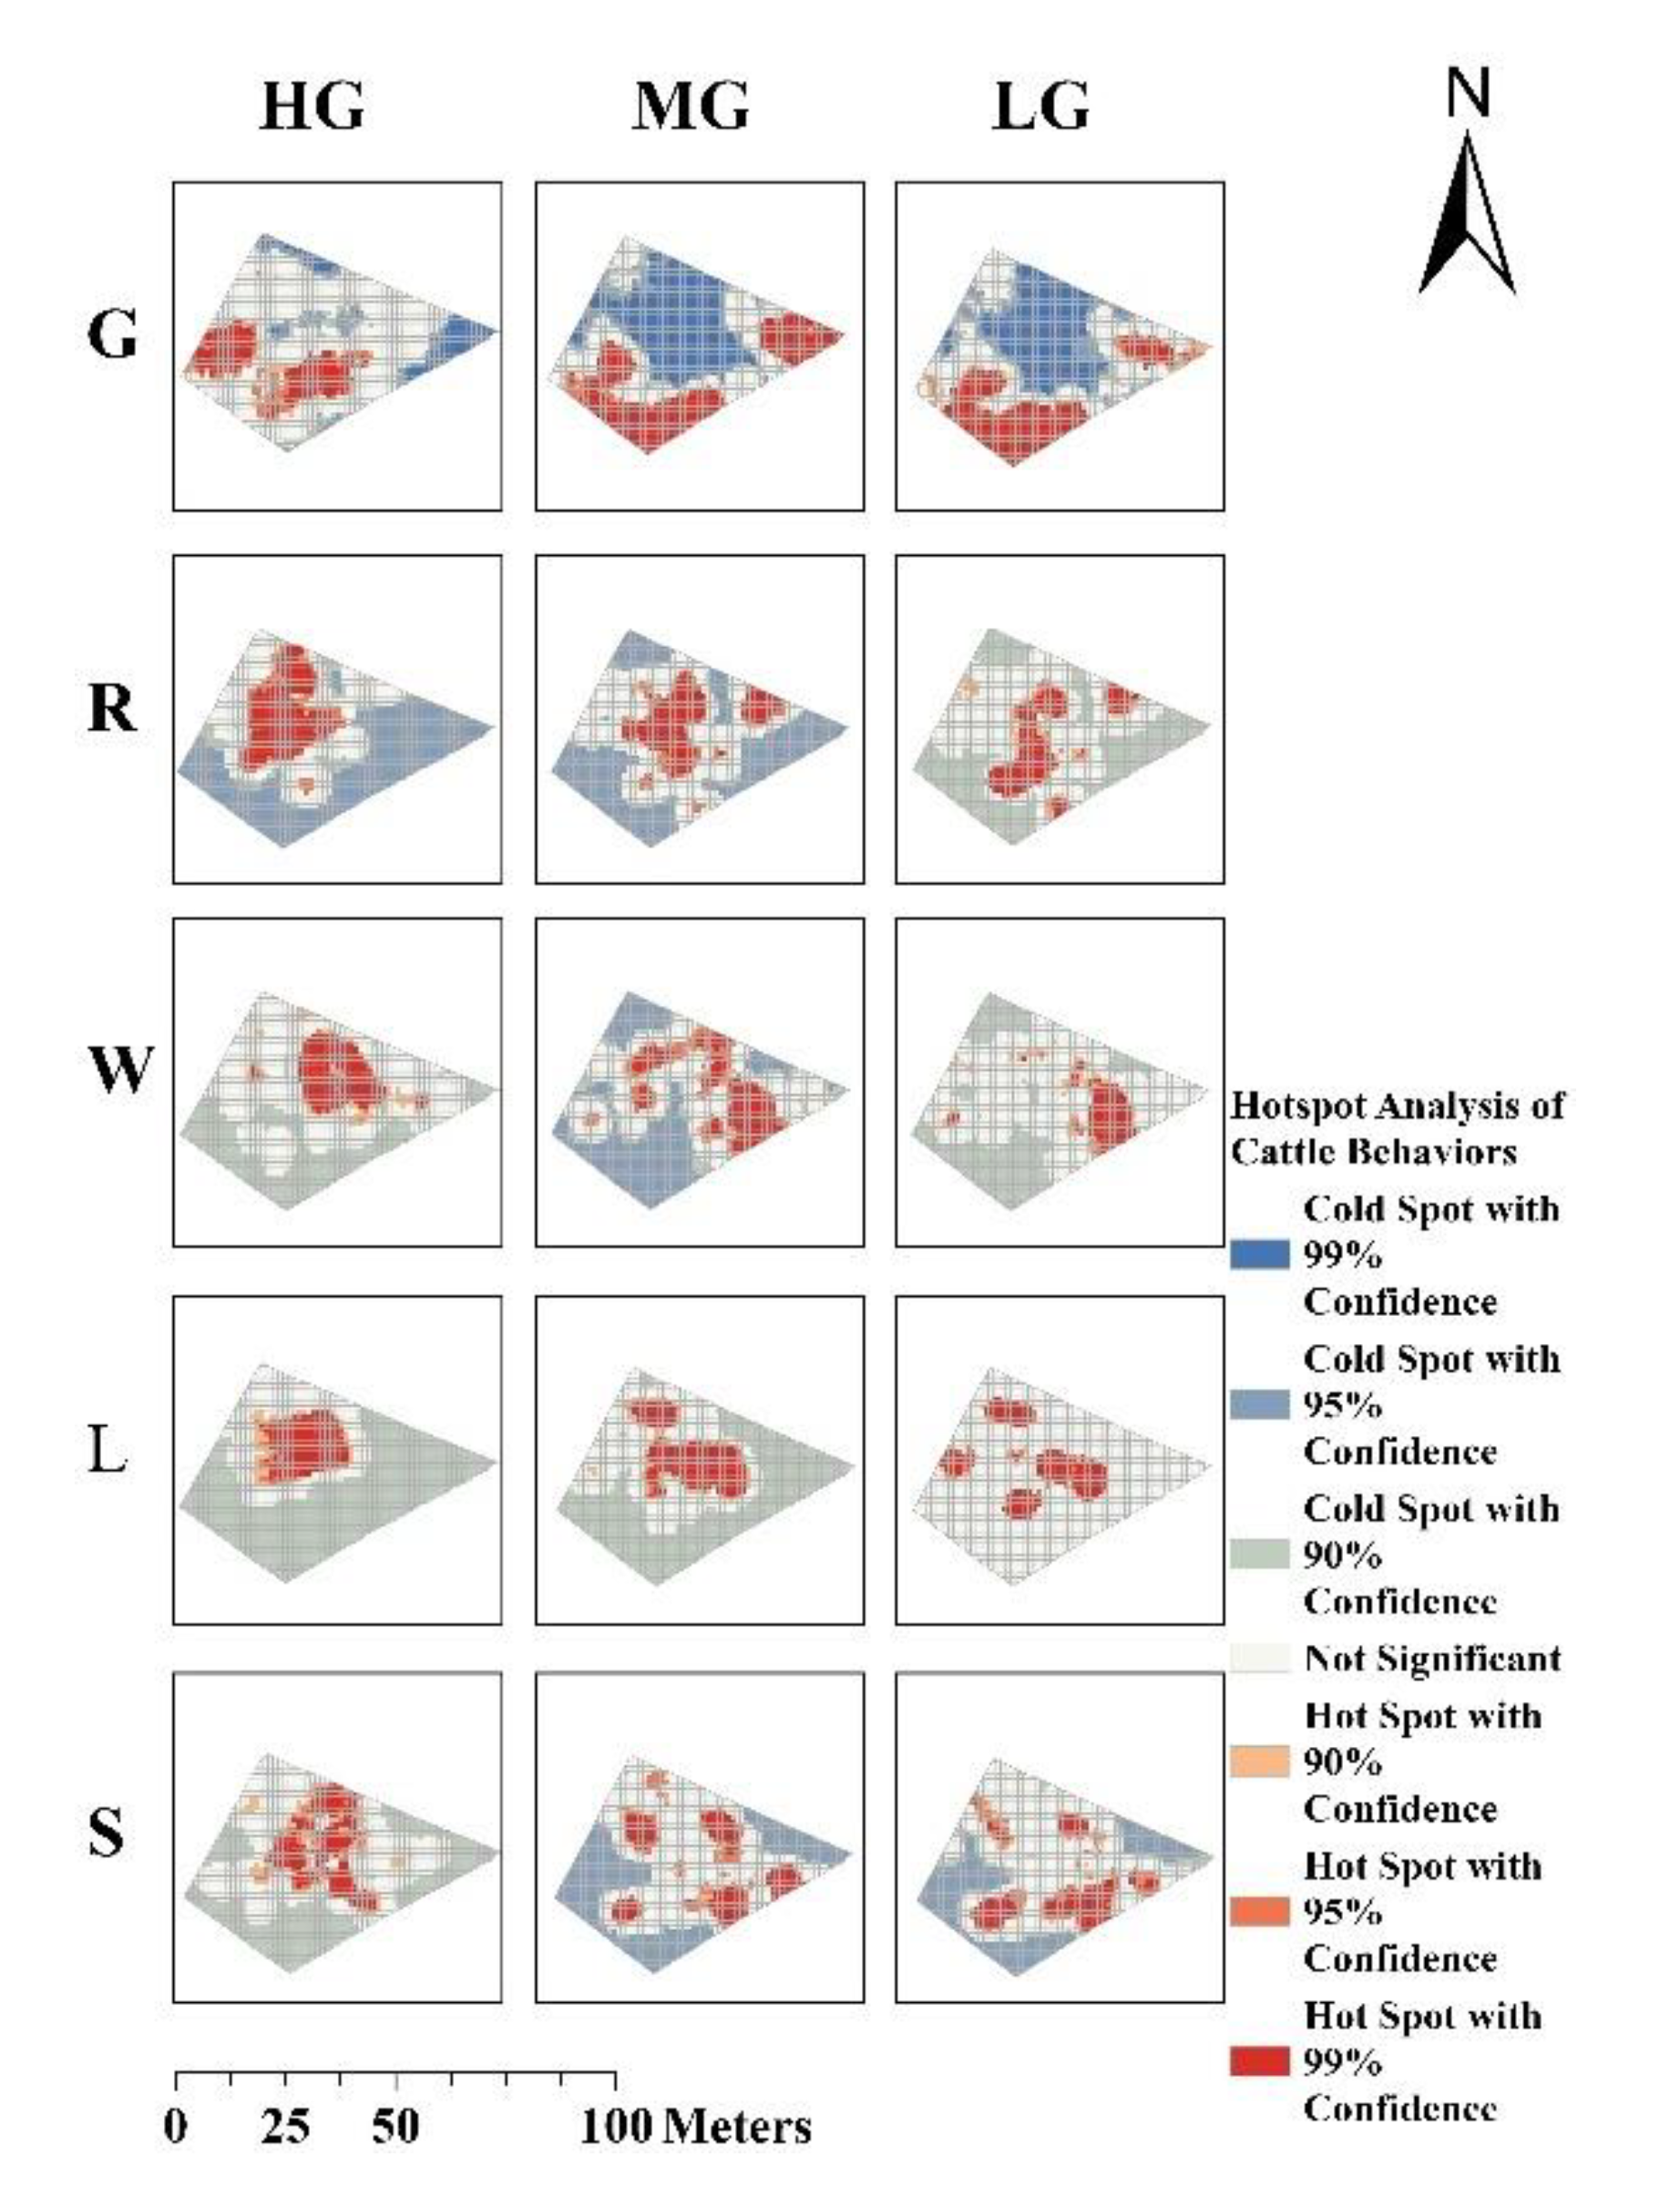
Figure 6.
Hot-cold spot maps of five behaviours under rotational grazing (G: Grazing, R: Ruminating, W: Walking, L: Lying, S: Standing; HG: Heavy grazing, MG: Moderate grazing, LG: Light grazing).
Figure 6.
Hot-cold spot maps of five behaviours under rotational grazing (G: Grazing, R: Ruminating, W: Walking, L: Lying, S: Standing; HG: Heavy grazing, MG: Moderate grazing, LG: Light grazing).
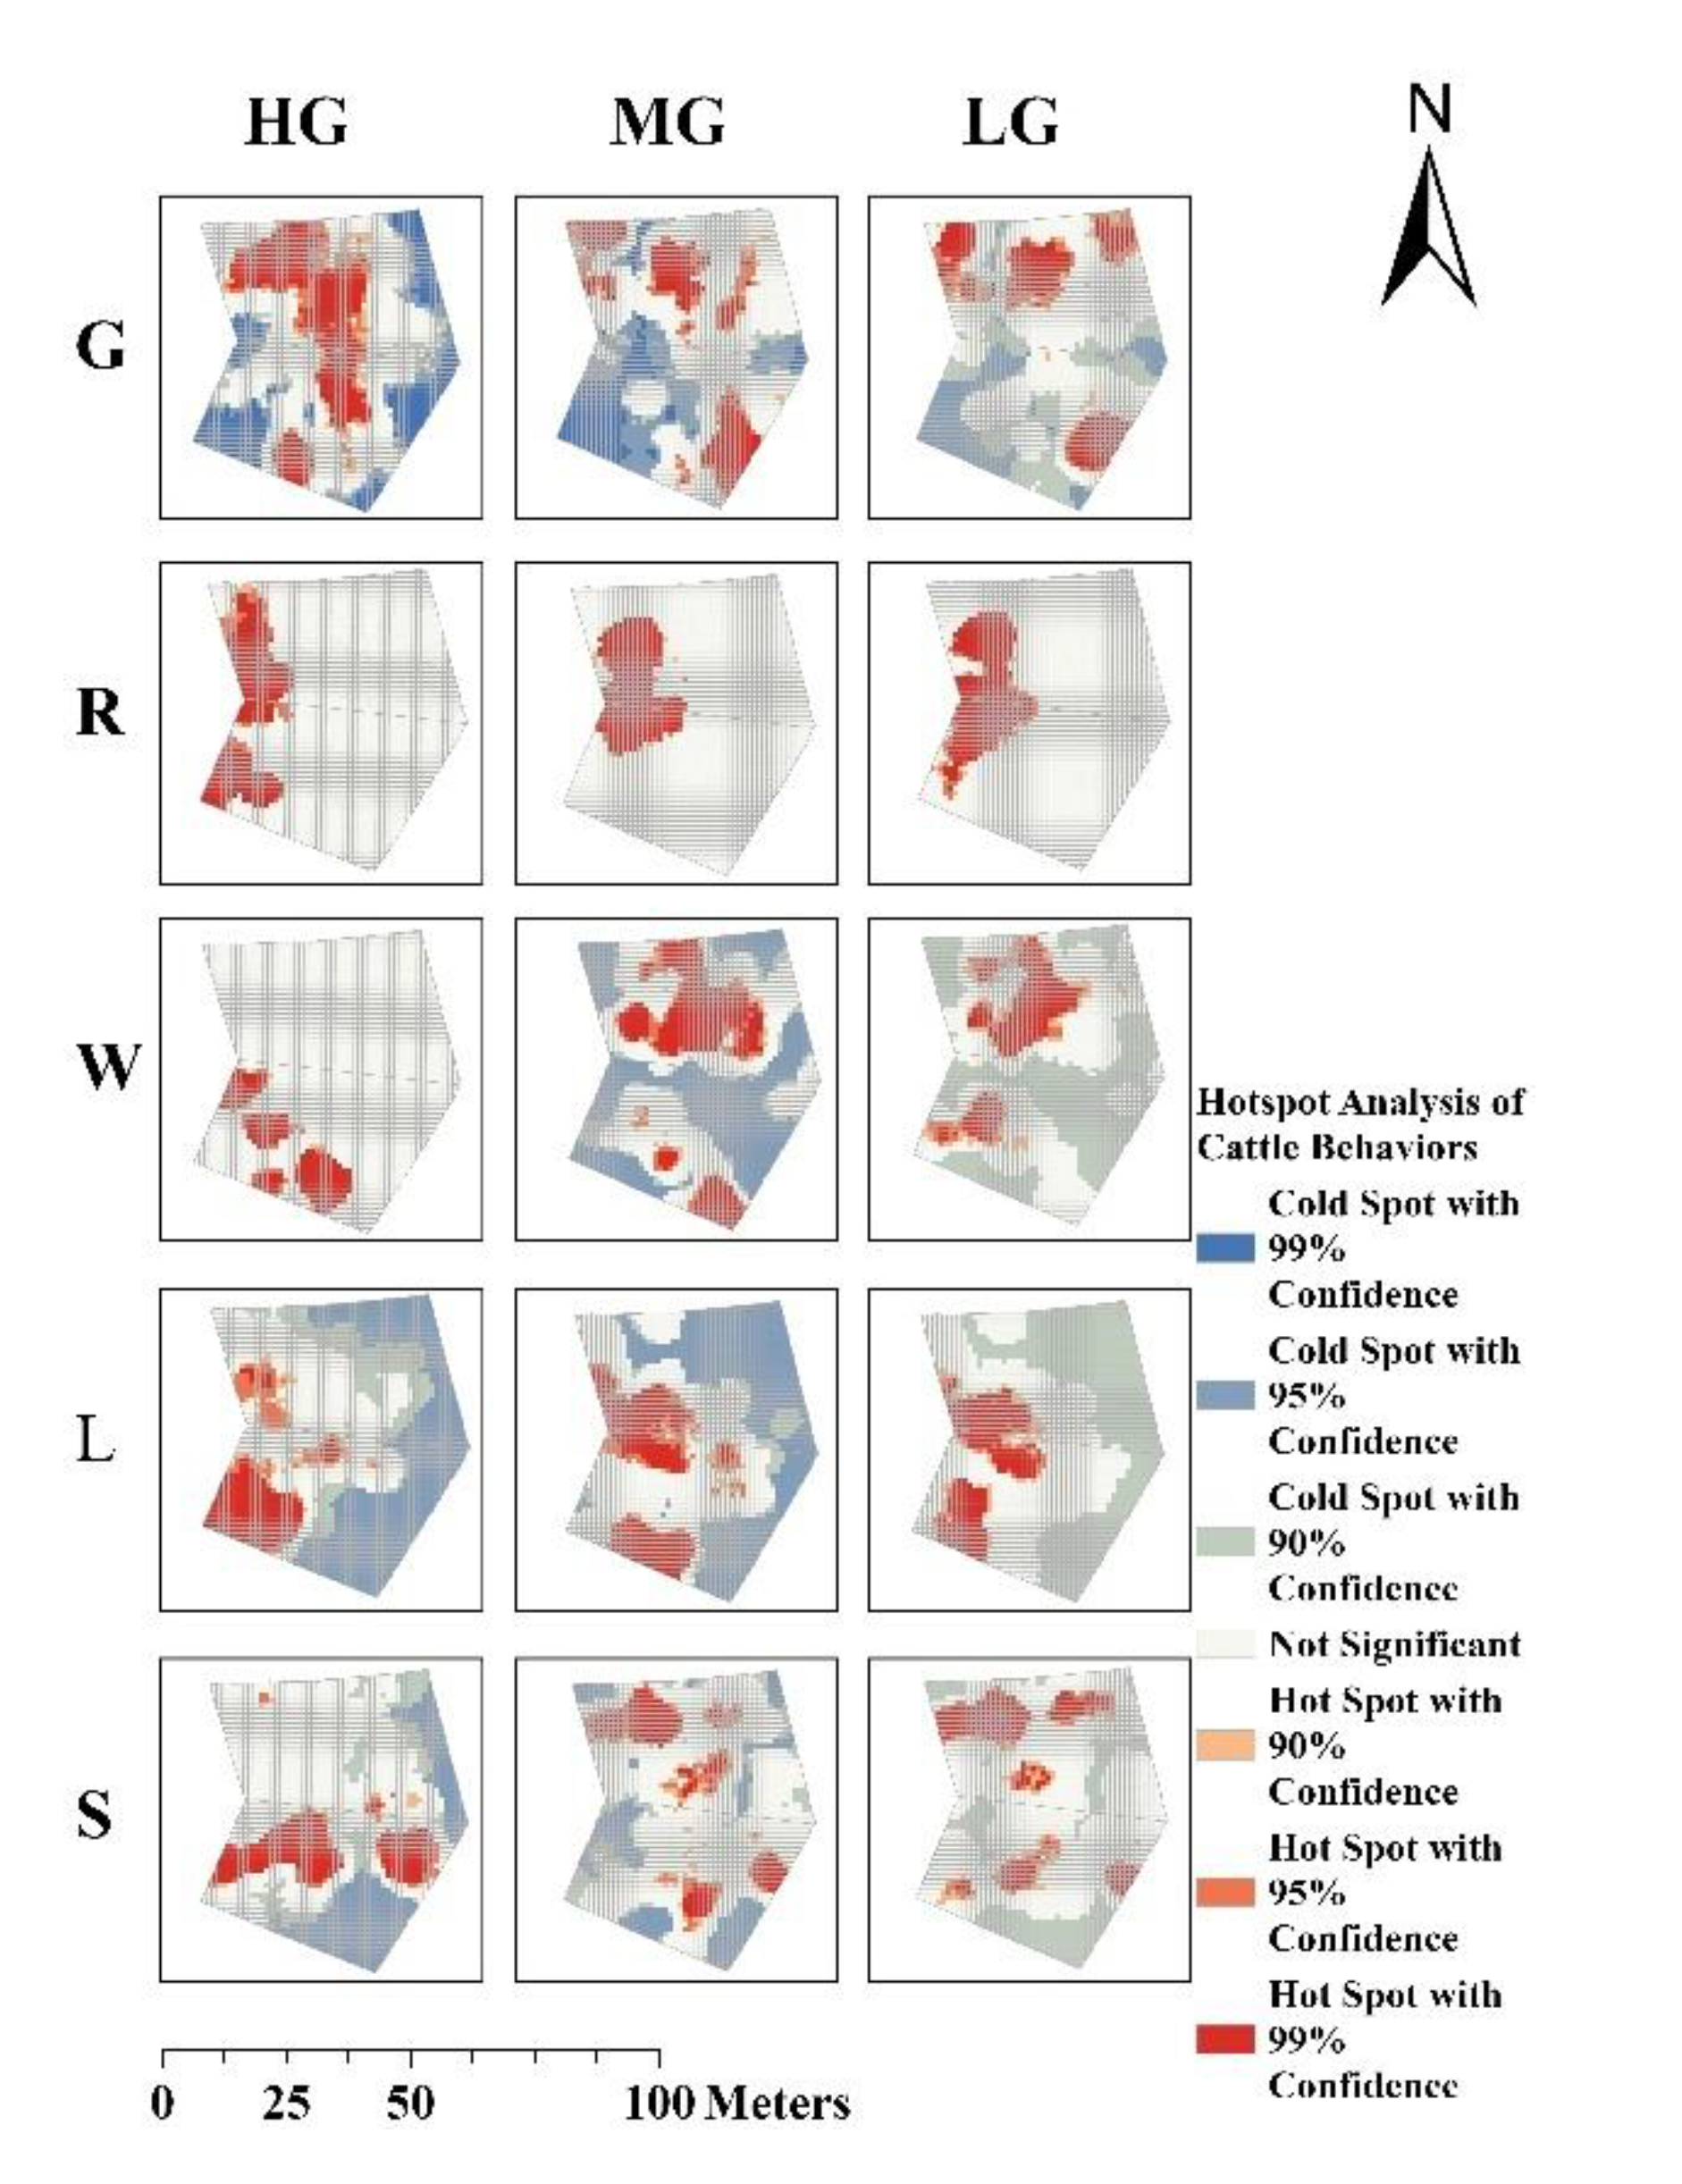
Figure 7.
Spatial clustering patterns of cattle behaviours under HG, MG, and LG: (a) continuous grazing system, (b) rotational grazing system.
Figure 7.
Spatial clustering patterns of cattle behaviours under HG, MG, and LG: (a) continuous grazing system, (b) rotational grazing system.
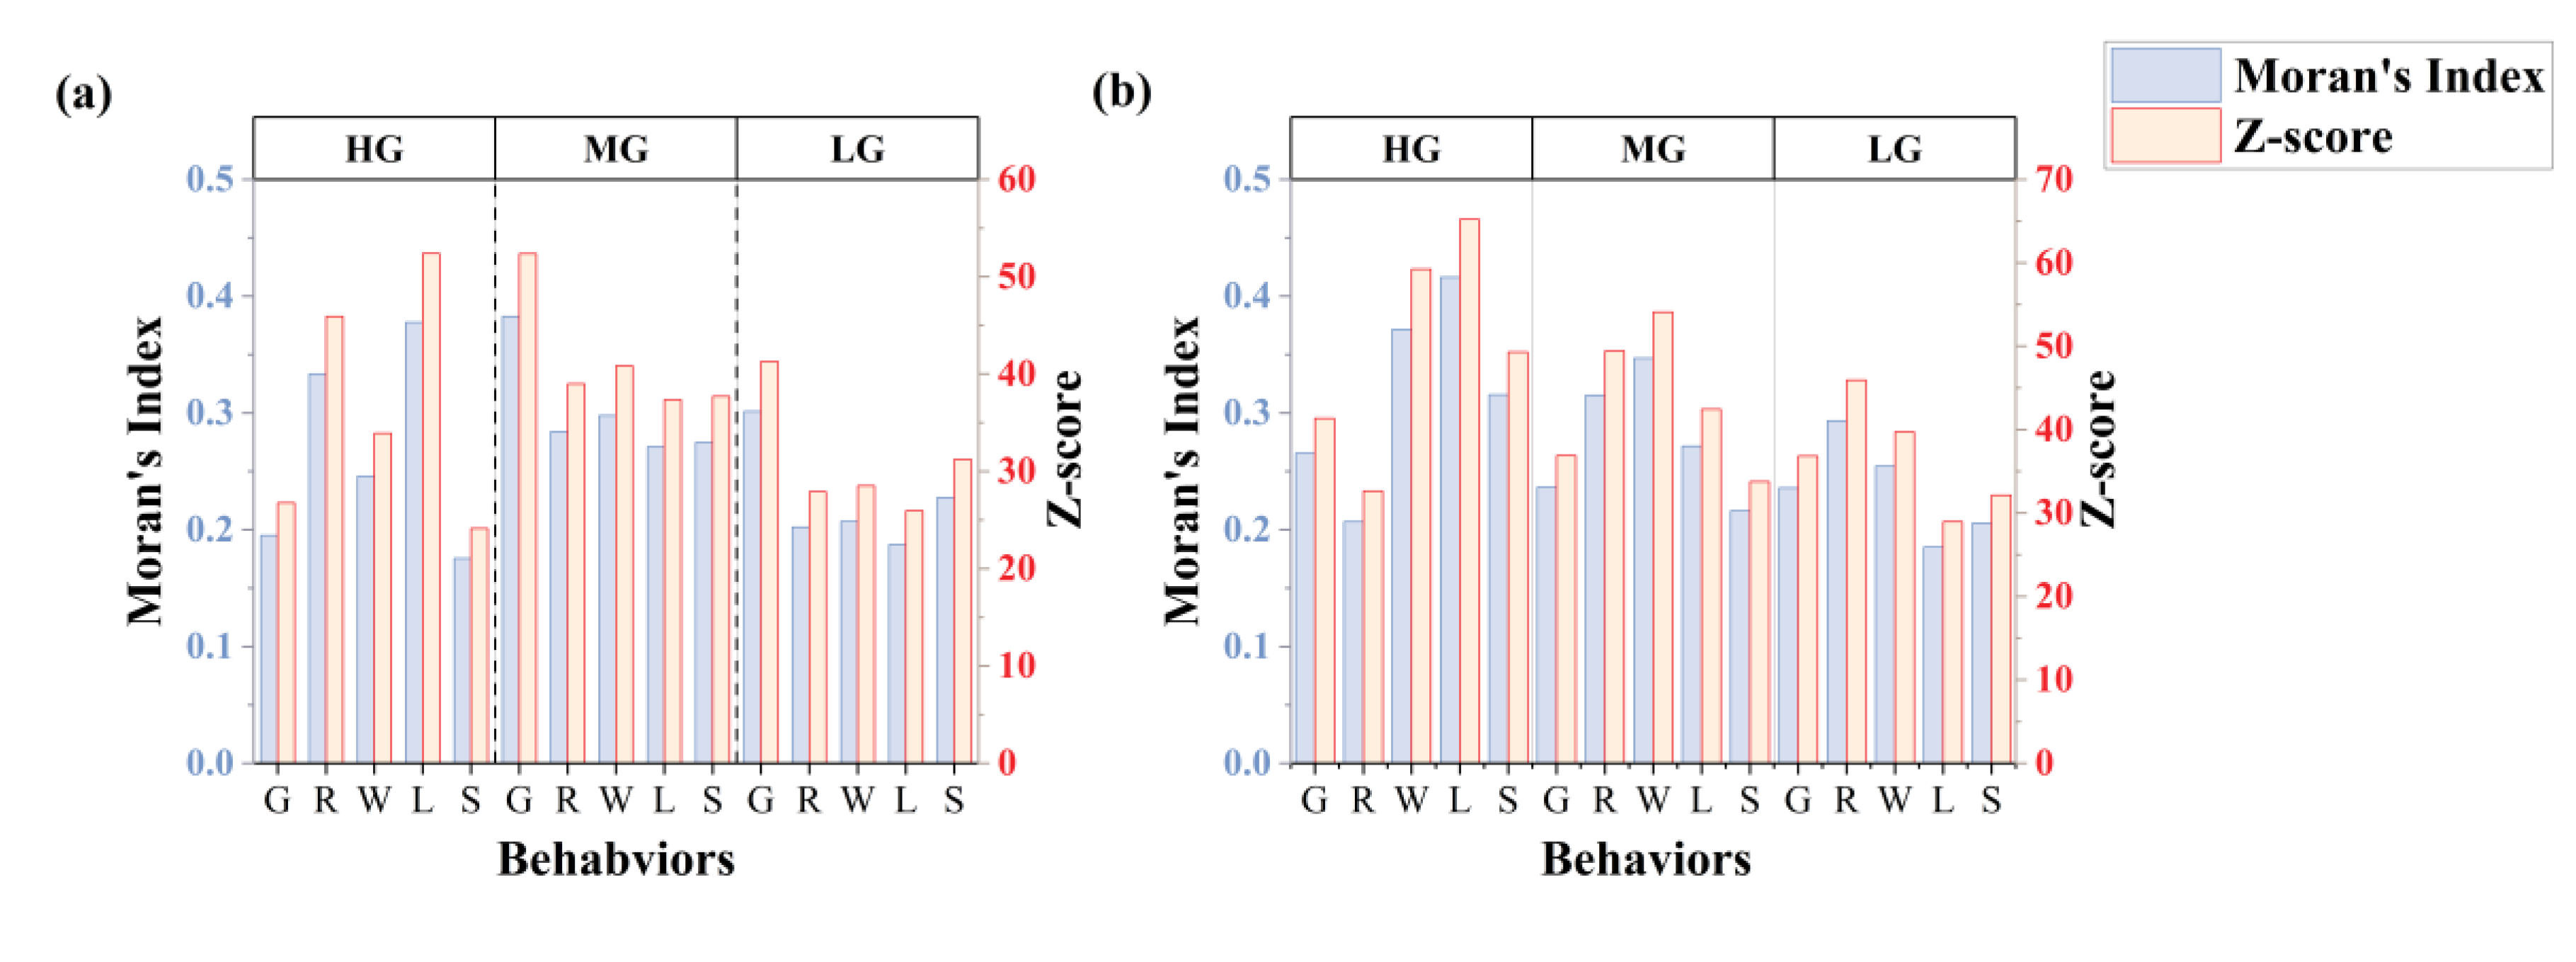
Figure 8.
Proportion of time spent on five livestock behaviours vary across HG, MG, LG: (a) continuous grazing system, (b) rotational grazing system.
Figure 8.
Proportion of time spent on five livestock behaviours vary across HG, MG, LG: (a) continuous grazing system, (b) rotational grazing system.
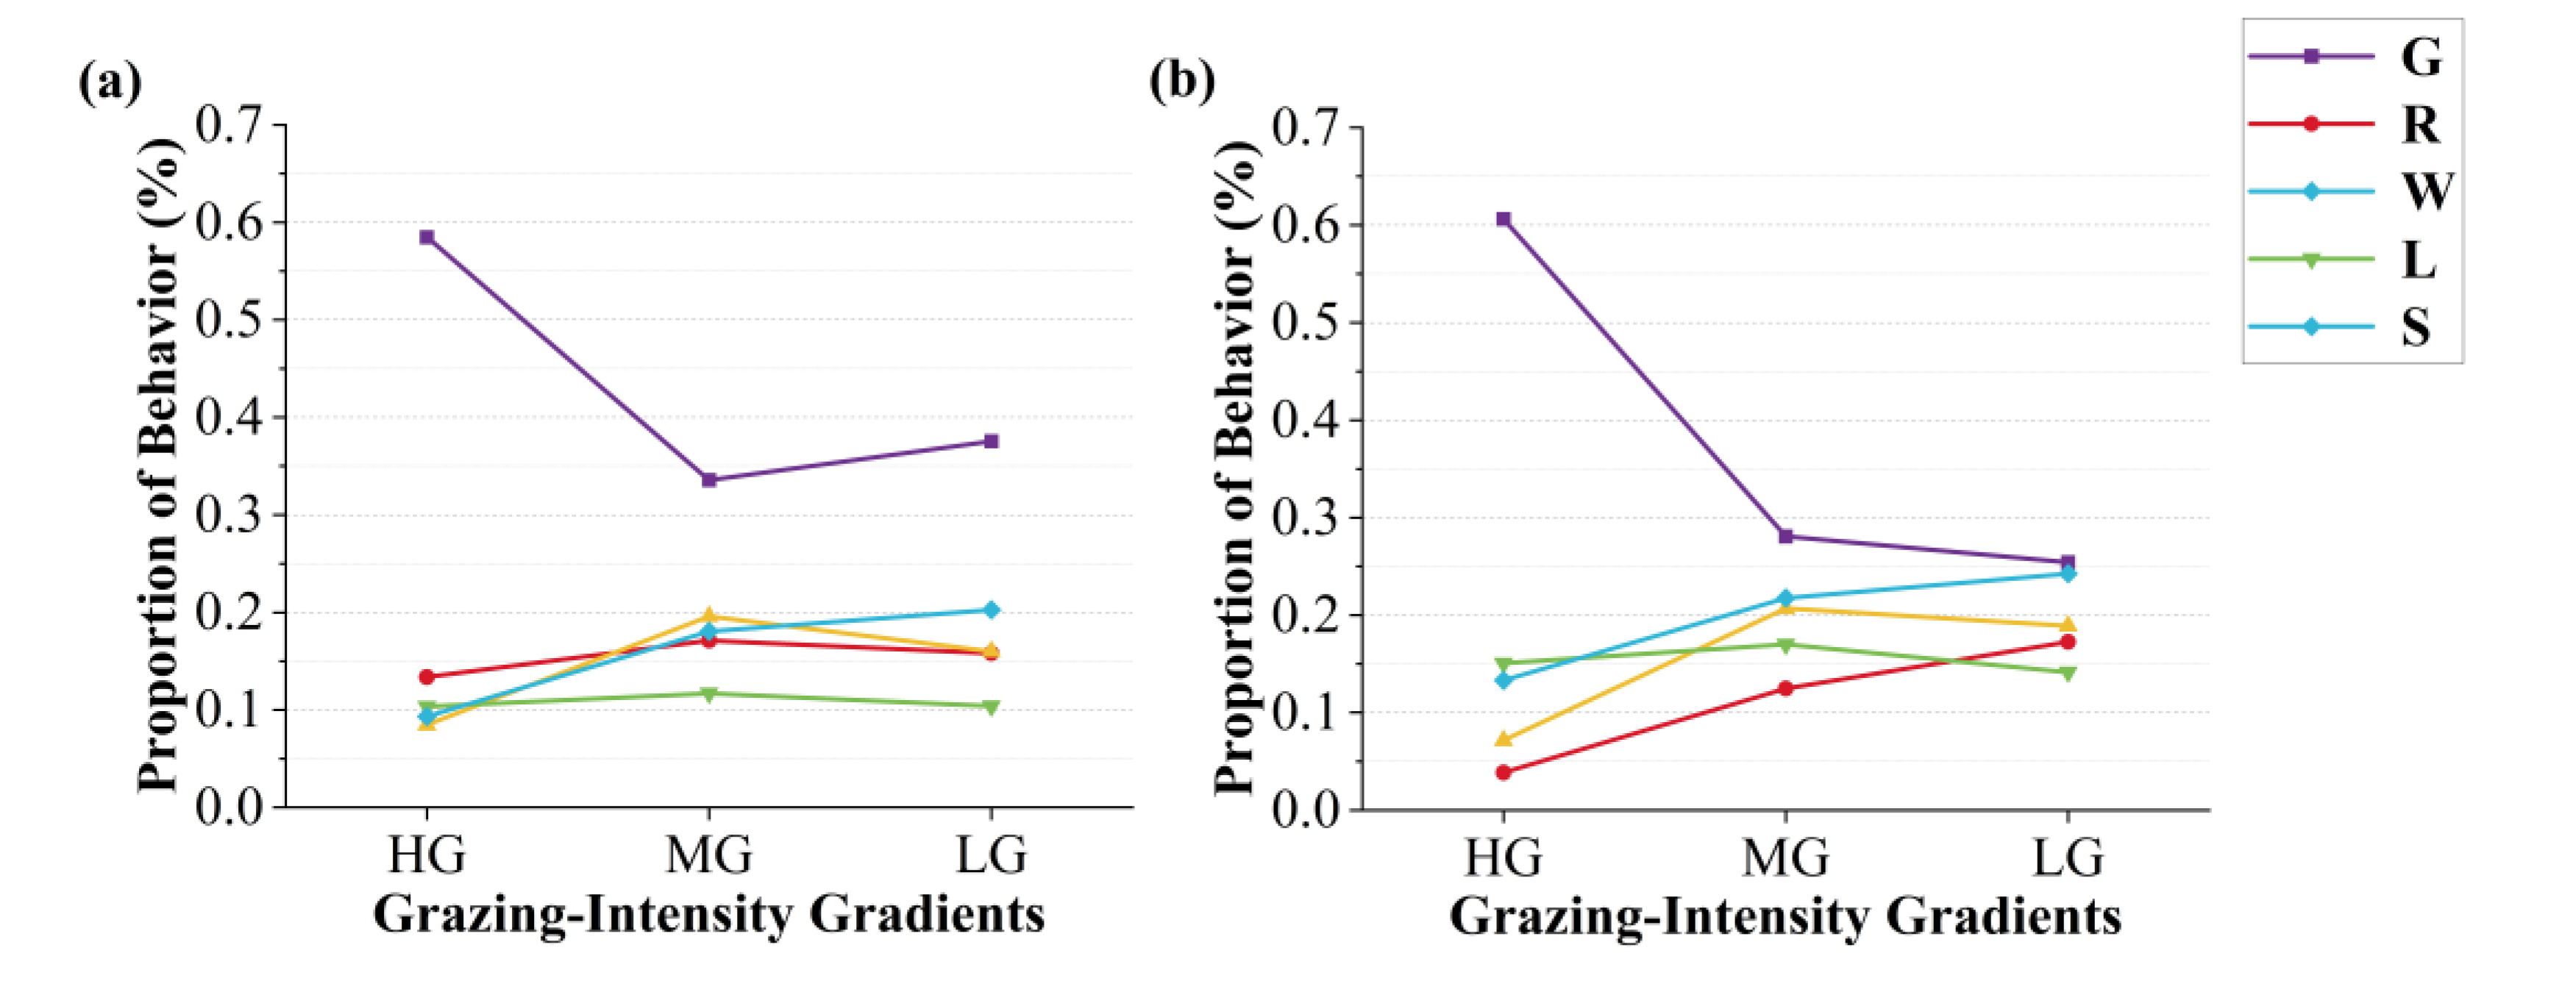
Figure 9.
Temporal concentration of grazing behaviour varies across GIGs: (a) continuous grazing system, (b) rotational grazing system.
Figure 9.
Temporal concentration of grazing behaviour varies across GIGs: (a) continuous grazing system, (b) rotational grazing system.
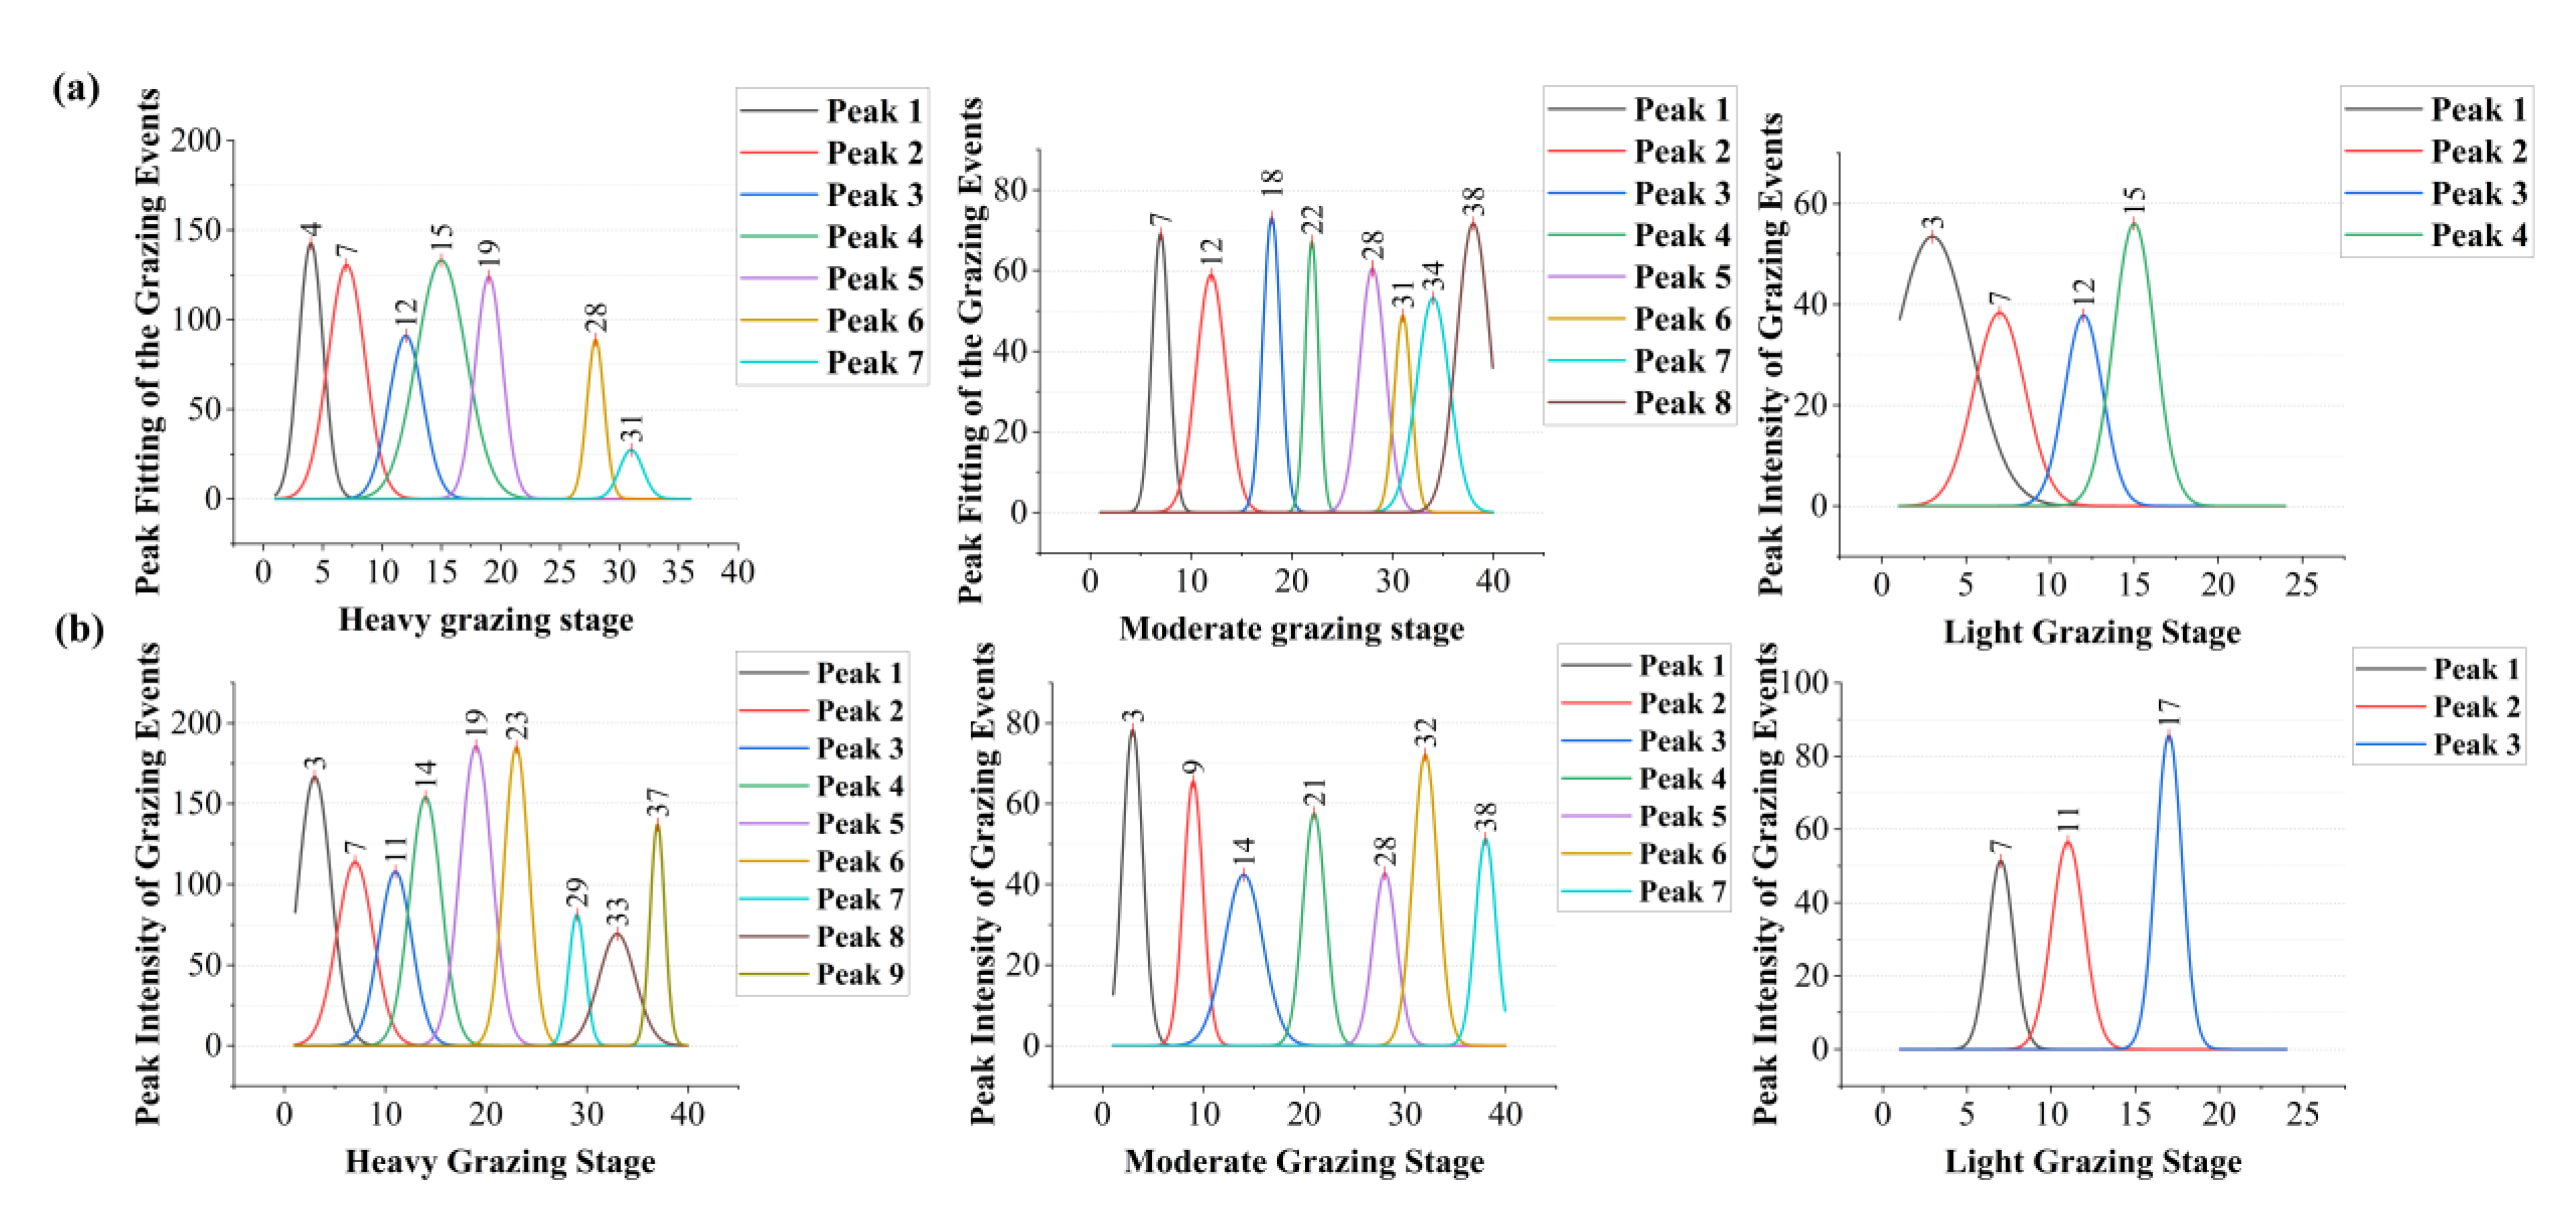

Table 1.
Confusion matrix showing the classification performance across predicted and actual labels.
Table 1.
Confusion matrix showing the classification performance across predicted and actual labels.
| Actual/Predicted | Positive(P’) | Negative(N’) | Total |
| Positive (P) | True Positive(TP) | False Negative (FN) | P |
| Negative(N) | False Positive (FN) | True Negative (TN) | N |
| Total | P’ | N’ | P+N |
Table 2.
Data balancing of cattle behaviours under continuous grazing.
| Sample Size Distribution Before and After Resampling | ||||||
|---|---|---|---|---|---|---|
| Resampling Strategy | Grazing | Rumination | Lying | Standing | Walking | Total |
| Unbalanced | 4361 | 566 | 394 | 195 | 110 | 5626 |
| Cluster Centroids | 110 | 110 | 110 | 110 | 110 | 550 |
| SMOTE | 4361 | 4361 | 4361 | 4361 | 4361 | 21805 |
| ADASYN | 4361 | 4422 | 4304 | 4415 | 4347 | 21849 |
| SMOTE-ENN | 1970 | 2061 | 2132 | 2217 | 2375 | 10755 |
| SMOTE-Tomek | 4361 | 566 | 394 | 195 | 110 | 5626 |
Table 3.
Data balancing of cattle behaviours under rotational grazing.
| Sample Size Distribution Before and After Resampling | ||||||
|---|---|---|---|---|---|---|
| Resampling Strategy | Grazing | Rumination | Lying | Standing | Walking | Total |
| Unbalanced | 5271 | 458 | 1022 | 658 | 123 | 7532 |
| Cluster Centroids | 123 | 123 | 123 | 123 | 5269 | 615 |
| SMOTE | 5269 | 5269 | 5269 | 5269 | 5269 | 26345 |
| ADASYN | 5269 | 5356 | 5398 | 5269 | 5253 | 26572 |
| SMOTE-ENN | 1579 | 2923 | 2142 | 2215 | 2741 | 11600 |
| SMOTE-Tomek | 4580 | 4759 | 4669 | 4613 | 4758 | 23379 |
Table 4.
Classification performance metrics across different models under continuous and rotational grazing systems.
Table 4.
Classification performance metrics across different models under continuous and rotational grazing systems.
| Naive Bayes | Random Forest | KNN | XGBoost | |||||
|---|---|---|---|---|---|---|---|---|
| Continuous | Rotational | Continuous | Rotational | Continuous | Rotational | Continuous | Rotational | |
| CA | 0.402 | 0.402 | 0.769 | 0.690 | 0.965 | 0.953 | 0.917 | 0.923 |
| F1-score | 0.367 | 0.344 | 0.770 | 0.678 | 0.965 | 0.953 | 0.917 | 0.923 |
| Kappa | 0.251 | 0.223 | 0.711 | 0.604 | 0.956 | 0.940 | 0.896 | 0.903 |
Table 5.
Variance of Moran’s I values among cattle behaviours.
| HG | MG | LG | |
| continuous | 0.00766 | 0.00213 | 0.00202 |
| rotational | 0.00689 | 0.00293 | 0.00178 |
Disclaimer/Publisher’s Note: The statements, opinions and data contained in all publications are solely those of the individual author(s) and contributor(s) and not of MDPI and/or the editor(s). MDPI and/or the editor(s) disclaim responsibility for any injury to people or property resulting from any ideas, methods, instructions or products referred to in the content. |
© 2025 by the authors. Licensee MDPI, Basel, Switzerland. This article is an open access article distributed under the terms and conditions of the Creative Commons Attribution (CC BY) license (http://creativecommons.org/licenses/by/4.0/).
Copyright: This open access article is published under a Creative Commons CC BY 4.0 license, which permit the free download, distribution, and reuse, provided that the author and preprint are cited in any reuse.


