
Submitted:
04 August 2025
Posted:
05 August 2025
You are already at the latest version
Abstract
Both adaptive and non-adaptive theories of evolution have been proposed to explain the process of speciation: how natural selection operates on individuals and populations. Non-adaptive theories emphasize the force of genetic drift in driving speciation while adaptive theories emphasize the force of ecological selection. Both types of theory focus on genetic variation in the organism’s genotype, the set of all genes in the genome. The repeatedly observed correlation between amino acid substitution (non-synonymous nucleotide substitutions in codons, dN) and mutation rates (synonymous nucleotide substitutions in genes, dS) has remained something of a mystery since it was first observed and subsequently confirmed in multiple organisms. The following will examine the interaction between the forces of genetic drift and ecological selection in the context of two separate but interacting molecular clocks: the well established gene specific molecular clock and the largely overlooked karyotype specific or “junk” DNA clock.
Keywords:
genome stability
; DNA repair
; DNA replication timing program
; species richness
; karyotype
; mutation rate
; transposable elements
; non-adaptive radiation
Significance
The eukaryote DNA replication timing program (RT) organizes the DNA synthetic phase (S phase) of the cell cycle and coordinates genome duplication with mitosis and cell division. A complex system of DNA damage detection and repair (DDR) reinforces this organization in order to sustain and constrain mutation/substitution balance. The RT therefore has important implications for the evolution of genome architecture, karyotype diversity and species richness. To date, few studies have directly examined the role RT plays in speciation and adaptive radiations. That question will be addressed in the following.
1. Introduction
1.1.
Karyotypes evolve faster than genes, an observation
frequently made since the 1970s. Maxon and Wilson, among others, reported that
amphibian karyotypes evolve at several times the rate of the genes residing in
the corresponding genomes; a similar observation had also been made in plants [1–3]. Karyotypes are therefore presumably under
relaxed selection and evolve more randomly according to genetic drift, while
genes are more subject to purifying and positive selection. Consequently,
orthologous genes in different species are less divergent than the karyotypes
of the respective genomes.
Additionally, the numbers of genes in vertebrates
and invertebrates are very similar among different species in the respective
groups [4], and evolve on average at the same
constant rate. In contrast, karyotypes vary widely from species to species and
across clades and lineages. Rates of karyotype evolution also vary widely
across the mammalian phylogenetic clades and across the Tree of Life [5]. This observation is somewhat puzzling given
that gene order, or synteny, is highly conserved in Mammalia, Aves and Amphibia
[6], indicating that synteny is under strong
purifying selection [7].
The conserved average rate of mutations in protein
coding exons led to the proposal of a relatively constant molecular clock that
governs the rate of gene and genotype evolution [8–10],
and therefore the rate at which species diverge (speciation rate) [11,12], a hypothesis that remains to be fully
confirmed [13,14]. A paradox emerges from the
assumption that genes and genotypes diverge at a constant rate: assuming that
macroevolution (species diversification) is linked to microevolution (genetic
divergence), how can a relatively constant rate of genotype change explain the
extreme differences in species richness (SR) and species evenness (SE) observed
across phylogenetic clades and lineages?
1.2.
Ecological selection/speciation, it is commonly
assumed, acting differentially and non-randomly on invariant rates of genetic
change (standing allelic diversity) can result in environmentally determined
differences in selection pressure, and therefore can explain phylogenetic
differences in SR and SE [15–20]. A clear
latitudinal—and therefore climatic—biodiversity gradient exists, for example,
with species richness and biodiversity in biomes increasing from the poles to
the equator [21–25]. Other factors including
clade age also play determining roles [26–28].
The Tri-cellular model of atmospheric convection
currents likewise explains differences in biome biodiversity and geographic
location in climatic terms: low levels of precipitation, temperature and
insolation are consistently associated with low levels of biodiversity and
infertile edaphic conditions, for example, in tundra (permafrost), and in polar
and desert biomes. The latitudinal location of biomes can explain SR, but SR
nevertheless appears to be unlinked to diversification rates: speciation minus
extinction rates [29]. Furthermore, niche rate
depends on climatic factors (temperature and humidity) and correlates strongly
with SR [30,31].
Other ecological features such as geographic range
size (a proxy variable for effective population size, Ne) [32] and life history traits also correlate with SR,
for example r-strategists versus K-strategists and their corresponding
phenotypes including body size, metabolic rate, generation time, developmental
rate, fecundity and maximum lifespan. Consequently karyotype diversity (KD) and
evolution, while contributing to speciation, have long been considered
generally lacking in explanatory power regarding species richness and
speciation rates [33–35].
1.3.
This assumption has been attributed to the apparent
neutral evolution of karyotype diversity KD and related expansions and
contractions in neutral, non-coding DNA, resulting in a wide range of genome
size in any given phylogenetic lineage (Figure 1).
The random expansion and contraction in a lineage’s genome size [36,37], such as the salamander lineage [38], led to the proposal of a second “junk” DNA
clock, or the linear increase in nuclear DNA with phylogenetic age in
salamander families [39]. It should be noted,
however, that the rate junk DNA changes in the genome is comparable to the
respective mutation rate [40]. Why this should
be so—such a widely varying species richness yet a relatively constant
molecular clock rate of gene diversification—nevertheless remains an open
question and an issue of continuing debate and controversy.
Because ecological selection acts on physical
phenotype and physiology independently of karyotype in any given clade or
lineage, it seems unlikely a priori that ecological selection could determine
or shape any given species karyotype, or that karyotype diversification could
be inherently adaptive [5,41,42]. It remains
certainly plausible, however, that changes in karyotype and genome architecture
result in the zygotic isolation that ensues from geographic and reproductive
isolation (either sympatric or allopatric) [43];
and hence ecological selection would eventually act on genetic drift-driven
karyotype diversity over geological time, thus promoting the processes of
speciation and adaptive radiation.
The following sequence of events might properly
frame the process of ecological succession that characterizes macroevolution
(44; Figure 2):
1) geographic isolation following a population
split.
2) neutral (non-genic) karyotype diversification
driven by genetic drift, eventually involving genes in species with small
effective population sizes (microevolution).
3) reproductive (pre and post-zygotic) isolation
separating diverged populations (for example, ring species).
4) ecological selection driving speciation and
adaptive radiation into newly evolved niches (macroevolution).
1.4.
Confounding the predominant role of ES in
explaining most speciation events and the highly varying adaptive radiations
across clades and lineages is the observation that amino acid substitution
rates in proteins are proportional to nucleotide substitution rates in genes:
non-synonymous (amino acid changing) substitutions in codons correlate with
synonymous (silent) substitutions in genes in all eukaryotes examined [45–47] The ratio between these two is therefore
relatively constant (dN/dS proportional to 1). Any detectable deviations from
neutrality (dS = dN) are interpreted either as signatures of purifying
selection (dN/dS << 1) or positive selection (dN/dS > 1).
The correlation between dN and dS, though lacking a
comprehensive molecular explanation, is nonetheless expected if, as commonly
assumed, most amino acid substitutions in proteins are either deleterious or
functionally neutral (dN and dS both reflect the mutation rate). The
correlation, however, is much stronger than would be expected assuming that
dN/dS simply reflects the proportion of neutral non-synonymous substitutions,
and therefore the underlying mutation rate [48,49].
Moreover, the effect is uniform across all genes in a genome and
phylogenetically independent of species relatedness [49–51].
Several hypotheses have been advanced to explain
the correlation (see for example: 49, 52). One hypothesis proposes that the
correlation is due to a positional, or genomic context effect: because the
mutation rate varies across the genome from yeast to plants and animals, any
positional, or regional, change in the mutation rate will impact both dN and dS
indifferently and simultaneously [53]. Both
categories of mutation will be affected in equal proportion: region-wide dN and
dS rates will increase or decrease together regardless of the fact that
different genes in the same genome experience significantly differing mutation
rates [51].
The effect, the hypothesis predicts, will also
apply to non-genic, non-coding DNA residing in the same region as coding DNA.
Mutation rates, for example, in ultra-conserved elements (UCE), which are
involved in vertebrate development and reside within introns or outside genes [54], correlate with dN and dS inside the exons of
the adjacent genes [45]. The two categories of
mutation, dN and dS, therefore remain correlated with polymorphisms in
non-coding inter-genic regions, and perhaps intra-genic introns [55,56].
The eukaryotic genome is broadly partitioned into
two spatial and temporal compartments: early replicating (open) euchromatin
(EC) and late replicating (compact) heterochromatin (HC). EC is enriched in GC
nucleotides while HC (and facultative HC) is enriched in AT nucleotides. In all
species so far examined, mutation rates are significantly higher in genome
regions containing HC compared to regions containing EC [57–62]. Consequently, the DNA replication timing
(RT) program during DNA synthetic, or S phase, of the cell cycle will
simultaneously modulate dN and dS either positively or negatively according to
the genome wide variation in mutation rates: relatively low mutation rates in
early replicating genes; relatively high mutation rates in late replicating
genes. The following will examine the role of RT on mutation rates, genome
stability, karyotype diversification and species richness.
2.1. RT and Replication Origins
The eukaryotic DNA replication timing program has
been intensively studied over the last several years in yeast and metazoa [63]. Briefly, the RT program corresponds to the
timing of the activation of replication origins (start sites of DNA synthesis)
during the S phase of the cell cycle [64,65].
In most species, the genetic locations of replication origins are not specified
by a conserved DNA sequence. Instead, origin locations depend primarily on
chromatin context. Although all origins are “licensed” by an origin recognition
complex (ORC and MCM helicases) in late mitotic M phase and post divisional G1
phase, only about 10% of licensed origins are activated during S phase [66]. Activation, or initiation, occurs
asynchronously and with increasing density (initiations per kilobase) into
mid-S phase (Figure 3), and then
decreases as the cells progress toward the G2 phase prior to mitosis [67].
The timing of origin activation depends on many
factors that are associated with two fundamental features: 1) the efficiency,
or probability, of origin activation, which is determined by the number of MCM
helicases loaded at the origin and, in budding yeast, the levels of a nuclear
complex of six positively acting initiation factors [68];
and 2) the strength of the intra-S phase checkpoint, which is a complex of
factors that negatively regulates origin activation. Other factors, such as
Rif1 in higher eukaryotes and Sir2 and Rpd3 in yeast [69,70],
also play a role in establishing a late replication regime. While the
biochemistry of these processes is beyond the scope of this paper, it is, in
part, the opposing interplay between origin efficiency and the strength of
origin inhibition that coordinates origin activation with gene transcription
and establishes a late replication-timing program. It might be interesting to
note that origins located near or in highly expressed genes, which are early
replicating, are more prone to DNA damage [71],
while at the same time early replicating regions have substantially lower rates
of substitution (72; see below).
3.2. RT and the Regulation of Gene Transcription
Genome size in different species is an important
modulator of the replication-timing program. The RT program partitions genome
duplication into successive time zones and regions (replication domains) that
vary in duration (45 to 60 min.) and size (1.3 to 3.6 Mbp), in addition to
varying in proportion to C-value (haploid genome size measured in picograms,
where one picogram = 978 Mbp) [73–76].
Consequently, the RT program regulates the duration of S phase and the cell
division cycle according to C-value, which therefore has an important influence
on generation time and related mutation rates [45].
As mentioned above, a clear relationship has been
found between origin firing and gene transcription activity. Transcription
start sites (TSS) correlate strongly with origin location, and introns in
higher eukaryotes harbor between 40 to 60 % of replication origins depending on
the species (77; Figure 4): the earlier
an origin fires in the S phase, the higher the level of transcriptional
activity and gene expression [78]. Highly
expressed genes are for that reason early replicating. In mammals, for example,
transcriptional activity is associated with origin efficiency [79–82]. In yeast, experimentally overproducing the
six limiting initiation factors causes origins to fire earlier in S phase, and
concomitantly increases transcriptional activity of the adjacently located
genes [83].
Importantly, the size of introns in genes is also
frequently proportional to C-value: genes in larger genomes tend to have larger
introns, but not always [84,85]. Intron size,
however, can have direct consequences on transcription rates and regulation,
with larger genes being transcribed more slowly and expressed generally at
lower levels (intron delay) [86,87]. The
global result is a longer cell cycle and correspondingly slower developmental
rates, and in paedomorphs such as salamanders even fully arrested developmental
programs (neoteny) [88,89].
Introns are also generally longer in later
replicating genes that have tissue type specific or developmental functions,
and consequently late replicating genes tend to have lower expression levels [90]. Many proteins of late replicating genes
interface with the environment such as immune system genes and the olfactory
gene cluster—so called “adaptive” or “speciation genes”. Later replicating
adaptive genes are often essential to organism and phenotype integrity (sensory
factors) [53]. Earlier replicating genes that
are highly expressed, in contrast, correspond generally to genes essential for
cellular function and survival, for example, the house keeping genes that
maintain cellular and genetic integrity [91,92].
Interestingly, a negative correlation between protein evolutionary rate (dN)
and intron size has been observed in Drosophila [93],
consistent with lower mutation/substitution rates in exons (see below).
It should also be noted that older origins in
yeast, independently of efficiency, tend to be more frequently lost during the
course of speciation and adaptation [94]. More
efficient origins, however, are under greater selection pressure, and are
conserved in preference to origins of weaker efficiency. Consequently, the
distances between origins, rather than their specific genome locations outside
of genes, are also under selection pressure to minimize S-phase [95].
The study on replication origin evolution in yeast,
however, did not directly address the question of whether or not origin loss
(or, conversely, gain) altered levels of transcription in adjacent genes, as is
the case when experimentally increasing origin efficiency alters transcription
factor promoter binding and stimulates gene expression levels [83]. Importantly, the same study on the evolution
of the yeast replication-timing program revealed that the organization of the
program evolves in a manner coordinated with protein divergence and chromosomal
divergence, but without an apparent causal relationship. In humans, a causal
relationship between replication timing and transcription also appears to be
more subtle [96].
3.3. RT and Protein Folding Versus Protein Function
Why do essential house keeping genes and other
genes that replicate early evolve more slowly? Although still controversial,
one compelling explanation is that they have substantially higher expression
levels, which places evolutionary constraints on the set of viable amino acid
sequences and non-neutral substitutions [72,97].
It has long been assumed that the lower amino acid substitution rates were due
to selection acting on the protein’s essential functions. That turns out to be
the case; but it is selection acting on protein folding rather than on protein
function alone that appears to explain, at least in yeast, the high levels of
expression in these genes—and hence their biased location in euchromatin.
Selection pressure against protein misfolding is an
appealing hypothesis because it could provide another plausible explanation for
the correlation between dN and dS. The correlation between gene expression
level and dN in these genes is two times stronger than the correlation with dS,
indicating selection for translational accuracy (slowing dS) coupled with
selection for translational robustness (slowing dN) [72,98].
Selection on protein folding might therefore distinguish early replicating
genes from later replicating genes, which are primarily subject to selection on
function and adaptive phenotype. Biased selection on the functionality of
adaptive and speciation genes thus might explain their enrichment in
mutation/substitution prone late replicating DNA, with the fortuitous
consequence of higher allelic diversity and polymorphism among more weakly
expressed, late replicating developmental genes.
4.1. RT and Genome Stability
Based on these and other findings, it has been
suggested that selection pressures have acted on origin-to-origin distances in
order to minimize S-phase duration and to regulate transcriptome expression
during development. Minimal origin spacing, however, must be limited in order
to obviate the highly mutagenic and lethal effects of synchronous origin firing
and a surfeit of multiple, simultaneously elongating DNA replication forks [99–101]. Ablating the checkpoint, for example,
causes origins to fire earlier and results in massive DNA damage. Conversely,
over-expressing initiation-specific proteins causes all origins to fire earlier
in budding yeast and is lethal unless ribonucleotide reductase is
simultaneously over-produced to supply the forks with sufficient levels of
dNTPs [83].
Another related explanation for the evolution of
replication timing therefore concerns the intra-S checkpoint and the associated
DNA damage detection and repair system (DDR). This feature relates to dNTP
supply and to the fact that replication forks are sensitive to dNTP levels,
which, when imbalanced or perturbed, are highly mutagenic and a major cause of
genome instability (rearrangements, amplifications and deletions, etc.). Hence,
replication fork rates determine origin usage under replication stress in all
organisms including bacteria. In eukaryotes, so-called “dormant”, or auxiliary,
origins are activated in response to perturbed or stalled replication forks. [102,103]
Origin usage and replication fork rates are
therefore universally correlated [104]. This
is likely to be the case even under non-stressed conditions [105,106], and hence arguably replication fork
rates, widely varying across the genome, coordinate the RT program [107]: larger replicons (origin to origin distances)
correlate with faster replication fork rates while smaller replicons correlate
with slower fork rates. In this manner, the replication-timing program
maintains a constant overall rate of replication in domains of differing size,
an essential feature of genome stability. At the same time, coordination of
fork rates and origin efficiencies serves to limit the rate of DNA damage and
maintain mutation/substitution balance across the genome.
4.2. RT and Introns as Adaptations to DNA Damage
The origin of introns, which have multiple effects
on gene transcription and protein diversification, has been of longstanding
interest in molecular and evolutionary biology. What is their role or effect,
however, on DNA replication and genome stability? Introns accumulate in
evolutionary conserved genes [108], suggesting
that introns might play a role in maintaining gene sequence and structural
integrity. Intron gain rates, for example, correlate negatively with sequence
evolution rates, while intron loss rates correlate positively [108]. At the same time, changes in C-value during
evolution appear to be driving the evolution of intron size toward either
longer introns (genome expansion) or shorter introns (genome contraction) [36,109–111].
Under unperturbed conditions most constitutive
origins—evolutionary conserved origins—are located in inter-genic regions or
are associated with transcription start sites (TSS). When S-phase is advanced
experimentally by over expressing certain oncogenes, origins that normally
don’t fire during S-phase are induced to fire in intra-genic regions—presumably
inside introns, where DNA damage is most likely to occur [112] (see Figure 4).
At the same time, introns are believed to protect genes against DNA damage [113]. It therefore seems reasonable to assume that
introns are enriched in anomalous intra-genic replication origins—normally
inactive origins that fire only in the presence of blocked replication forks [77]. If so, longer introns will be expected to
harbor proportionally more potential origins. Dormant origins, for example, are
closely and regularly spaced (about 15 kb; 114). The dormant origins, as
mentioned above, are believed to have evolved to ensure genome stability during
replication stress [103,115].
Consequently, stress induced activation of origins
within introns might serve to protect genes against DNA damage and lethal DSBs.
This could explain why genes in the giant salamander genomes contain introns
that are up to 5X the sizes of introns in species with smaller genomes [83], a phenomenon perhaps explained by transposon
proliferation [116]: the extra, intra-genic
origins are required for both gene and genome stability. Additionally,
checkpoint inhibition of these supplementary origins is expected to be
correspondingly stronger and mutation rates correspondingly lower. This
explanation of the origin of intron size variation, however, remains to be
verified.
4.3. RT and DNA Repair
The DDR employs two principal systems that respond
to and repair lethal DNA double strand breaks (DSBs): “error free” homologous
recombination (HR) and “error prone” non-homologous end joining (NHEJ). HR has
a significantly lower mutation rate and primarily (but not exclusively) uses a
homologous sister chromatid to repair DSBs. HR therefore is most active during
S and G2 phases [117]. NHEJ, which has a
comparatively higher mutation rate, operates throughout the cell cycle and
progressively replaces HR in the last half of S-G2 phase [118,119]. This might explain why late replicating
DNA has relatively higher mutation rates than early replicating DNA (Figure 5), although other factors such as error
prone DNA damage polymerases play important roles [57,120].
The relative ratios of these two repair systems
thus directly impact mutation rates across the genome, and not surprisingly in
a genome size-dependent manner: the more mutagenic NHEJ being faster and three
times more efficient than homologous recombination repair [117,121]. Eukaryotes with small genomes such as
yeast rely predominantly on homologous recombination repair, while species with
larger genomes such as vertebrates primarily rely on NHEJ DNA repair [85,122]. Mutation rates are, therefore, expected to
be anti-correlated between early and late replicating DNA in a genome size
dependent manner: a weaker anti-correlation in small genome species; a stronger
anti-correlation in large genome species. This remains to be directly shown,
however.
If intron densities increase in more NHEJ-dependent
genomes [85], then the strength of the
replication-timing program might be expected to increase in parallel [123]. In yeast, for example, origins initiate
throughout S-phase (early to late). The vast majority initiates in the first
third of S-phase [68,124]. The pattern of
origin activation during S-phase, however, varies considerably from cell to
cell [125]. Species with larger genomes in
contrast have a significantly less flexible and more deterministic
replication-timing program [75,123]. In
vertebrates, for example, origins that usually fire late rarely if ever fire
early in S-phase.
5.1. RT and Genome Evolution
Although in higher eukaryotes the
replication-timing program varies little in terms of the sequence of domain
activation, the program itself is subject to species and tissue dependent
differences in replication timing. A significant proportion in the variation
occurs in facultative heterochromatin (fHC) during tissue differentiation and
development [126]. The majority of the
replication-timing variants are associated with weak, later firing origins,
which have a greater probability of loss during evolution [94,96,127]. Despite the variation between tissue
types, DNA replication timing is largely conserved between related species [96,128,129].
Because evolution of replication-timing programs
aligns with phylogeny, evolutionary changes in replication timing represent a
third class, or source, of molecular evolution and speciation that
recapitulates the phylogenetic tree in primates and yeast [94,95,127,130]. Loci that are prone to mutation
(sites of higher sequence divergence) such as the human accelerated region
(HAR) are biased toward late replication, while sites of highly conserved
sequences such as ultra-conserved elements and loss of function intolerant
genes replicate early. Divergent loci and HARs are enriched in RT variant
regions, which are genomic regions that have experienced an evolutionary change
in the replication-timing program [96].
The evolution of the replication-timing program and
the related organization of the genome into differential compartments of
euchromatin, facultative heterochromatin and constitutive heterochromatin
represent adaptations that have the potential to generate and maintain gene
polymorphisms and allelic diversity in faster evolving late replicating genes.
If so, the RT program might provide a solution of sorts to the puzzling
question of why the eukaryote genome has retained rather than eliminated so
much and such a variety of non-coding, largely repetitive, “junk” DNA.
The commonly held view of relaxed selection in
species with low effective population size, such as salamanders, is
increasingly in doubt [131–134]. This came as
something of a surprise since genetic drift can play a significant role in
karyotype diversity, for example among salamander phylogenetic clades [135]. Genetic drift, however, does not fully
explain genetic diversity in salamander genes [136],
which varies little among clades and is more subject to selection compared to
other vertebrates (dN/dS > 1).
The hypothesis that small effective population
sizes and genetic drift underlie changes in genome architecture is nonetheless
supported by the observation that speciation events have been found to be
associated with higher substitution rates [10,136,137].
Relaxed selection in small effective and census population sizes, accordingly,
results in respectively higher levels of mutation accumulation and subsequently
higher levels of standing genetic diversity on which positive selection can act
[98,138,139] This scenario suggests that
repeated cycles of drift during population bottlenecks followed by ecological
selection act synergistically to drive speciation and rates of species
accumulation in phylogenetic clades [44, 140, 141; Figure 2]
5.2. RT and the Correlation between dN and dS
Analogous to the clonal selection theory in
immunology, balancing selection on DNA polymorphisms and allelic diversity has
acted to multiply the adaptive opportunities and evolutionary trajectories that
have led to the emergence of increasingly complex organisms. This has been
shown to be the case for certain genes in the immune system-related major
histo-compatibility complex (MHC). The MHC replicates in the first half of S
phase. The class II elements (AT rich), compared to classes I and III (GC rich),
replicate later toward the middle of S phase, when replication fork densities
(and hence mutation probabilities) are highest during the cell cycle [67]. Later replication of class II genes might
therefore explain the higher genetic diversity in class II genes compared to
the genes in classes I and III [51].
A study on salamanders again revealed a correlation
between dN and dS but instead with dN > dS, indicating selection for
diversity [131]. In salamanders, levels of
dN/dS are significantly higher than in other vertebrates while levels of dS
are, paradoxically, substantially lower, reflecting stronger selection pressure
or weaker genetic drift. Ecological selection might therefore “overwhelm”
genetic drift in salamander species with low effective population sizes,
contrary to expectations. Higher rates of selection on dN might compensate for
the lower rates of mutation/substitution (dS), a plausible explanation for the
relatively low species richness in most salamander family level clades:
ecological selection preserves slowly evolving salamander families against
extinction by genetic drift.
In agreement with the proposal of selection for
diversity, the MHC replication timing study also revealed a related correlation
between dN and the amount of allelic variation. The authors concluded:
“increased nucleotide substitution rate can promote allelic variation within
lineages” [51]. That conclusion supports the
proposal that a position or regional effect on mutation rates can explain the
correlation between dN and dS in terms of mutation/substitution balance,
because positive selection is not expected to act on dS unless it is acting on
locus specific mutation rates regardless of either of the forces of genetic
drift or selection on amino acid composition—or both (dN/dS = 1; dN/dS <<
1 or dN/dS > 1). A locus specific, regional explanation for the correlation
is consistent with the finding that dN and dS in genes are correlated with
polymorphisms in proximal UCEs, the vast majority of which (77 %) are located
in intergenic or intronic sequences [54].
6.1. RT and Transposable Elements
Most heterochromatin associated DNA is comprised of
repetitive AT-rich transposable elements [142–144].
Since larger genomes are more prone to DNA damage, they must rely on correspondingly
stronger checkpoints and more effective DDRs to maintain genome integrity and
cell viability. Indeed, it has been shown that the strength of the DDR does in
fact increase with genome size, as had been theoretically predicted [145,146].
Moreover, it is believed that the checkpoint
evolved initially to combat and suppress the spread of DNA damaging
transposable elements in the genome [142],
thus fortuitously enhancing, during the course of checkpoint evolution, DNA
repair and genome stability. Accordingly, the evolution of metazoa and higher
eukaryotes became possible with the evolution of the strength of the intra-S
checkpoint and, hence, the effectiveness of the DDR systems [147–149]. Interestingly, transposable element
activation induces the checkpoint as a necessary condition for tissue and limb
regeneration [150].
What effects have transposable elements had on a
potential relationship between genome size evolution (and hence karyotype
evolution) and clade diversification (species richness)? Darwin’s “abominable
mystery” addressed the geologically recent angiosperm radiation, considered the
largest radiation in the terrestrial Tree of Life [151].
The topology of the angiosperm phylogenetic tree resembles that of other
lineages with highly imbalanced taxonomic clades—similar to salamanders—in
terms of karyotype diversity, species richness, species evenness, and,
additionally, range of C-value [152, 153; see Figure
1].
The observation of a correlation between dN and
dS—whether or not a species (or region of the genome) is undergoing either
genetic drift or ecological selection—provides striking evidence for a
positional effect influencing mutation rates associated with the
replication-timing program: highly expressed, early replicating genes are
selected for correct protein folding under a regime of purifying selection,
while later replicating and tissue specific/developmental genes are selected
for allelic diversity and phenotypic diversification (differentiation and
speciation) under a regime of balancing selection. Not surprisingly then most
transposable elements are associated with heterochromatin and are therefore
generally replicated late.
As mentioned above, mutation/substitution rates
vary between folding-selected genes (house keeping) and function-selected genes
(adaptation). The relative strength of the checkpoint and effectiveness of the
DDR in the respective genomic regions, or replication domains, is therefore
expected to vary correspondingly according to the replication-timing program.
It has been proposed here that the strength of the intra-S checkpoint can be
measured in terms of genome size (C-value), because more origins necessitate
stronger checkpoint inhibition of more numerous late activated origins in order
to prevent them from competing for dNTPs with earlier firing origins [145,154]. Transposable element driven genome
expansion, for example, would lead to a greater probability of fork stalling
and DNA damage, and therefore would become maladaptive beyond a threshold
C-value and whole body DNA content [148].
Maximum lifespan (MLS), in contrast, can plausibly
serve as a proxy variable to measure the relative effectiveness of the DDR. Two
observations support that proposal:
1) Peto’s paradox addresses the observation that
maximum lifespan strongly correlates with body mass (mammal family level
clades: adjusted R2 = 0.73; *p = 2 x 10-16; Table 1); yet, unexpectedly, long-lived large
body mammals, having more cells and therefore cell division cycles, are
significantly less prone to cancer and other mutation-associated disease [155,
156,157, 158; Figure 6],
an observation that might be more related to cell cycle/cell size homeostasis
rather than body size [158–163].
2) Long-lived small body species, such as the Naked Mole Rat, have enhanced NHEJ and other DDR systems, but a normal mammalian C-value/cell size of about 3 pg [164,165]. The proposal made here (MLS is a plausible proxy for the DDR—see: 164, 165—and C-value is a plausible proxy for the strength of the intra-S checkpoint) is at best tentative given that maximum lifespan and C-value are not themselves correlated (adjusted R2 = 0,007, *p = 0.5; Table 1).
6.3. Genome Stability and Life History Traits
Although there is no a priori reason to expect a relationship between C-value and maximum lifespan, a yet to be fully investigated direct correlation might exist between the DDR and maximum lifespan, as well as a correlation between the intra-S checkpoint strength and C-value. The question of interest here concerns what specific molecular components of either system are potentially implicated (and how might they be implicated) in the established positive correlation between body mass and maximum lifespan (mammal order level: adjusted R2 = 8.0; *p = 0.0006), and the negative correlation between body mass and species richness (mammal order level: adjusted R2 = 0.56; *p = 0.01); and how might the relationships scale with each other, eg. linearly or as a power law?
Moreover, gestation time has a significant negative relationship with neoplasia and malignancy prevalence, while at the same time neoplasia prevalence and somatic mutation rates are closely associated: species with fewer somatic mutations exhibit lower levels of neoplasia [161]. It is well known, for example, that gestation time (which is related to body size) scales with embryonic growth rate (Table 2), suggesting slower rates of cell growth and division [166,167,168]. It seems reasonable then to assume that a longer S phase and slower cell cycle would allow more time to repair DNA lesions, and hence serve to enhance genetic integrity and genome stability.
Of equal interest is the positive correlation in mammals between maximum lifespan and gene synteny conservation (adjusted R2 = 0.48; *p = 0.03). The conservation of synteny blocks over 180 million years of karyotype evolution in mammals [169], for example, is a clear indicator of selection acting on genome stability via physiological and adaptive functions (ecological selection, or macro-evolution impacting micro-evolution). The significant correlation with maximum lifespan, however, suggests that conservation of synteny blocks is also a feature of increased genome stability and a more effective DDR: a stable genotype imbedded in a stable karyotype that is, nevertheless, evolving much faster than the corresponding genotype.
Notably, synteny conservation does not associate significantly with species richness (R2 = 0.18; *p = 0.1), whereas maximum lifespan, in contrast, is significantly associated (negatively) with species richness (order level mammals: adjusted R2 = 0.59; *p = 0.016). Taken together, these observations suggest a role for the DDR—if maximum lifespan does in fact serve as a proxy for the DDR—in enhancing genome stability and in constraining rates of speciation and therefore levels of species richness. It would appear then that evolutionary changes at the sub-cellular level (DDR) promote evolutionary changes at the level of the organism (body mass) and at the level of phylogenetic clades (species richness). This hypothesis, however, warrants further investigation.
7. Conclusions
Bengtsson first proposed in 1980 that unknown “sub-microscopic factors” might account for the correlation between karyotype diversity and species richness in mammals [186]. This observed correlation, however, was phylogenetically unsupported, but has since been confirmed using phylogenetic generalized least squares (PGLS) analysis: at the taxonomic family level in mammals, species richness strongly correlates with rates of karyotype rearrangements (genome scale changes: adjusted R2 = 0.42; *p = 3.3 x 10⁻¹⁰). The correlation, however, is not observed between rates of sub-chromosomal changes and species richness (adjusted R2 = 0.07; *p = 0.06), and breaks down at lower taxonomic levels. Bengtsson’s hypothesis that the imbalance in the Mammalian phylogenetic tree is due to the association between species richness and karyotype diversity—and therefore can be attributed to submicroscopic factors, presumably cellular and nuclear in origin—might also apply to angiosperms and all other metazoans [170,171,172].
In accordance with Bengtsson’s hypothesis, it has been argued here that the “submicroscopic factors” that account for the karyotype diversity-species richness correlation correspond to the close coordination between the replication-timing program, the transcription program, mutation rates and the DDR, with the related interplay between genome stability and instability (mutation/substitution balance) accounting, at least in part, for the dN-dS correlation, karyotype diversity, speciation rates, species richness and species evenness across the Tree of Life. Although ecologically and molecularly independent, micro-evolutionary and macro-evolutionary processes likely interact, albeit indirectly, in mutually establishing speciation rates and species richness [173,174].
Simply stated, hyperactive checkpoints and/or DDRs are expected to result in a long term elevated lineage specific extinction risk (in contrast to a short term species specific risk; see: 175) due to a correspondingly low mutation/substitution supply within the lineage, and consequently a low standing level of genetic and allelic diversity and smaller effective population sizes. If so, an extremely low mutation/substitution rate (approaching zero), with correspondingly low adaptive potential and therefore elevated extinction risk, would likewise impose a ceiling on the evolution of genome sizes, body sizes and their related life history traits (Figure 6). That proposal, however, remains to be established.
A causal relationship between genome/karyotype stability, maximum lifespan and cancer prevalence has yet to be fully demonstrated, but the accumulating evidence is increasingly convincing [176,177,178]. While substantial evidence supports a role for DNA repair systems in determining maximum lifespan and other life history traits (K-strategists versus r-strategists), the roles DNA damage and repair potentially play in speciation rates can be summarized as follows:
- 1)
- genome (in)stability drives genome evolution by either increasing or decreasing rates of karyotype evolution and rates of change in genome size and chromatin organization.
- 2)
- genome evolution significantly influences rates of speciation and therefore species richness; for example, by serving as a source of the standing genomic and allelic diversity on which ecological speciation can act.
References
- Bush, G. L. , Case, S. M., Wilson, A. C., & Patton, J. L. Rapid speciation and chromosomal evolution in mammals. Proceedings of the National Academy of Sciences 1977, 74, 3942–3946. [Google Scholar]
- Maxson, L. E. , & Wilson, A. C. Rates of molecular and chromosomal evolution in salamanders. C. Rates of molecular and chromosomal evolution in salamanders. Evolution 1979, 734–740. [Google Scholar]
- Levin, D. A. , & Wilson, A. C. Rates of evolution in seed plants: net increase in diversity of chromosome numbers and species numbers through time. Proceedings of the National Academy of sciences 1976, 73, 2086–2090. [Google Scholar] [CrossRef]
- Prachumwat, A. , & Li, W. H. Gene number expansion and contraction in vertebrate genomes with respect to invertebrate genomes. Genome research 2008, 18, 221–232. [Google Scholar] [CrossRef]
- Martinez, P. A. , Jacobina, U. P., Fernandes, R. V., Brito, C., Penone, C., Amado, T. F.,... & Bidau, C. J. A comparative study on karyotypic diversification rate in mammals. Heredity 2017, 118, 366–373. [Google Scholar]
- Griffin, D. K. , Kretschmer, R., Srikulnath, K., Singchat, W., O’Connor, R. E., & Romanov, M. N. Insights into avian molecular cytogenetics—with reptilian comparisons. Molecular cytogenetics 2024, 17, 24. [Google Scholar]
- Simakov, O. , Marlétaz, F., Yue, J. X., O’Connell, B., Jenkins, J., Brandt, A.,... & Rokhsar, D. S. Deeply conserved synteny resolves early events in vertebrate evolution. Nature ecology & evolution 2020, 4, 820–830. [Google Scholar]
- Martin, A. P. , & Palumbi, S. R. Body size, metabolic rate, generation time, and the molecular clock. Proceedings of the National Academy of Sciences 1993, 90, 4087–4091. [Google Scholar] [CrossRef]
- Sarich, V. M. , & Wilson, A. C. Immunological time scale for hominid evolution. Science 1967, 158, 1200–1203. [Google Scholar] [CrossRef]
- Bininda-Emonds, O. R. Fast genes and slow clades: comparative rates of molecular evolution in mammals. Evolutionary Bioinformatics 2007, 3, 117693430700300008. [Google Scholar] [CrossRef]
- Hedges, S. B. , Marin, J., Suleski, M., Paymer, M., & Kumar, S. Tree of life reveals clock-like speciation and diversification. Molecular biology and evolution 2015, 32, 835–845. [Google Scholar]
- Lancaster, L. T. Molecular evolutionary rates predict both extinction and speciation in temperate angiosperm lineages. BMC evolutionary biology 2010, 10, 1. [Google Scholar] [CrossRef]
- Goldie, X. , Lanfear, R., & Bromham, L. Diversification and the rate of molecular evolution: no evidence of a link in mammals. BMC evolutionary biology 2011, 11, 1–12. [Google Scholar]
- McPeek, M. A. , & Brown, J. M. Clade age and not diversification rate explains species richness among animal taxa. The American Naturalist 2007, 169, E97–E106. [Google Scholar] [CrossRef] [PubMed]
- Rundle, H. D. , & Nosil, P. Ecological speciation. Ecology letters 2005, 8, 336–352. [Google Scholar]
- Futuyma, D. The origin of species by means of ecological selection. Current Biology 2013, 23, R217–R219. [Google Scholar] [CrossRef]
- Jablonski, D. , & Edie, S. M. Mass extinctions and their rebounds: a macroevolutionary framework. Paleobiology 2025, 1–14. [Google Scholar]
- Scholl, J. P. , & Wiens, J. J. Diversification rates and species richness across the Tree of Life. Proceedings of the Royal Society B: Biological Sciences 2016, 283, 20161334. [Google Scholar] [CrossRef]
- DeMalach, N. , Ke, P. J., & Fukami, T. The effects of ecological selection on species diversity and trait distribution: predictions and an empirical test. Ecology 2022, 103, e03567. [Google Scholar] [CrossRef]
- Wellborn, G. A. , & Langerhans, R. B. Ecological opportunity and the adaptive diversification of lineages. Ecology and evolution 2015, 5, 176–195. [Google Scholar] [CrossRef]
- Hillebrand, H. On the generality of the latitudinal diversity gradient. The American Naturalist 2004, 163, 192–211. [Google Scholar] [CrossRef]
- Willig, M. R. , Kaufman, D. M., & Stevens, R. D. Latitudinal gradients of biodiversity: pattern, process, scale, and synthesis. Annual review of ecology, evolution, and systematics 2003, 34, 273–309. [Google Scholar]
- Schemske, D. W. , & Mittelbach, G. G. “Latitudinal gradients in species diversity”: reflections on Pianka’s 1966 article and a look forward. The American Naturalist 2017, 189, 599–603. [Google Scholar] [CrossRef]
- Bureš, P. , Elliott, T. L., Veselý, P., Šmarda, P., Forest, F., Leitch, I. J.,... & Zedek, F. The global distribution of angiosperm genome size is shaped by climate. New Phytologist 2024, 242, 744–759. [Google Scholar] [CrossRef] [PubMed]
- Pianka, E. R. Latitudinal gradients in species diversity: a review of concepts. The American Naturalist 1966, 100, 33–46. [Google Scholar] [CrossRef]
- Yu, D. , & Wiens, J. J. The causes of species richness patterns among clades. Proceedings of the Royal Society B 2024, 291, 20232436. [Google Scholar] [CrossRef]
- Wiens, J. J. Trait-based species richness: Ecology and macroevolution. Biological Reviews 2023, 98, 1365–1387. [Google Scholar] [CrossRef] [PubMed]
- Eiserhardt, W. L. , Hansen, L. E. S., Couvreur, T. L., Dransfield, J., Ferreira, P. D. L., Rakotoarinivo, M.,... & Baker, W. J. Explaining extreme differences in species richness among co-occurring palm clades in Madagascar. Evolutionary Journal of the Linnean Society 2024, 3, kzae026. [Google Scholar]
- Tietje, M. , Antonelli, A., Baker, W. J., Govaerts, R., Smith, S. A., & Eiserhardt, W. L. Global variation in diversification rate and species richness are unlinked in plants. Proceedings of the National Academy of Sciences 2022, 119, e2120662119. [Google Scholar]
- Castro-Insua, Adrián, Carola Gómez-Rodríguez, John J. Wiens, and Andrés Baselga. “Climatic niche divergence drives patterns of diversification and richness among mammal families.” Scientific Reports 8, no. 1 (2018): 8781.
- Title, P. O. , & Burns, K. J. Rates of climatic niche evolution are correlated with species richness in a large and ecologically diverse radiation of songbirds. Ecology Letters 2015, 18, 433–440. [Google Scholar]
- Smyčka, J. , Toszogyova, A., & Storch, D. The relationship between geographic range size and rates of species diversification. Nature Communications 2023, 14, 5559. [Google Scholar]
- Kozak, K. H. , & Wiens, J. J. Accelerated rates of climatic-niche evolution underlie rapid species diversification. Ecology letters 2010, 13, 1378–1389. [Google Scholar] [CrossRef] [PubMed]
- Qiao, H. , Peterson, A. T., Myers, C. E., Yang, Q., & Saupe, E. E. Ecological niche conservatism spurs diversification in response to climate change. Nature Ecology & Evolution 2024, 8, 729–738. [Google Scholar]
- Kozak, K. H. , & Wiens, J. J. Climatic zonation drives latitudinal variation in speciation mechanisms. Proceedings of the Royal Society B: Biological Sciences 2007, 274, 2995–3003. [Google Scholar] [CrossRef]
- Kapusta, A. , Suh, A., & Feschotte, C. Dynamics of genome size evolution in birds and mammals. Proceedings of the National Academy of Sciences 2017, 114, E1460–E1469. [Google Scholar] [CrossRef]
- Elliott, T. A. , & Gregory, T. R. What’s in a genome? The C-value enigma and the evolution of eukaryotic genome content. Philosophical Transactions of the Royal Society B: Biological Sciences 2015, 370, 20140331. [Google Scholar] [CrossRef]
- Decena-Segarra, L. P. , Bizjak-Mali, L., Kladnik, A., Sessions, S. K., & Rovito, S. M. Miniaturization, genome size, and biological size in a diverse clade of salamanders. The American Naturalist 2020, 196, 634–648. [Google Scholar] [CrossRef]
- Martin, C. C. , & Gordon, R. Differentiation trees, a junk DNA molecular clock, and the evolution of neoteny in salamanders. Journal of Evolutionary Biology 1995, 8, 339–354. [Google Scholar]
- Nuzhdin, S. V. , & Mackay, T. The genomic rate of transposable element movement in Drosophila melanogaster. Molecular Biology and Evolution 1995, 12, 180–181. [Google Scholar] [CrossRef]
- Oliveira, T. D. D. , & Freitas, T. R. D. Investigating the evolutionary dynamics of diploid number variation in Ctenomys (Ctenomyidae, Rodentia). Genetics and Molecular Biology 2023, 46 Suppl 1, e20230180. [Google Scholar] [CrossRef]
- Ferguson-Smith, M. A. , & Trifonov, V. Mammalian karyotype evolution. Nature Reviews Genetics 2007, 8, 950–962. [Google Scholar] [CrossRef] [PubMed]
- Escudero, M. , Arroyo, J. M., Sánchez-Ramírez, S., & Jordano, P. Founder events and subsequent genetic bottlenecks underlie karyotype evolution in the Ibero-North African endemic Carex helodes. Annals of Botany 2024, 133, 871–882. [Google Scholar] [CrossRef] [PubMed]
- Kimura, M. The neutral theory of molecular evolution: a review of recent evidence. The Japanese Journal of Genetics 1991, 66, 367–386. [Google Scholar] [CrossRef]
- Saini, A. , Usmanova, D. R., & Vitkup, D. Integrated model of the protein molecular clock across mammalian species. bioRxiv 2025. [Google Scholar] [CrossRef]
- Wu, C. S. , & Chaw, S. M. Large-scale comparative analysis reveals the mechanisms driving plastomic compaction, reduction, and inversions in conifers II (Cupressophytes). Genome biology and evolution 2016, 8, 3740–3750. [Google Scholar] [CrossRef]
- Marais, G. , Domazet-Lošo, T., Tautz, D., & Charlesworth, B. Correlated evolution of synonymous and nonsynonymous sites in Drosophila. Journal of molecular evolution 2004, 59, 771–779. [Google Scholar] [CrossRef]
- Wyckoff, G. J. , Malcom, C. M., Vallender, E. J., & Lahn, B. T. A highly unexpected strong correlation between fixation probability of nonsynonymous mutations and mutation rate. Trends in Genetics 2005, 21, 381–385. [Google Scholar] [CrossRef]
- Stoletzki, N. , & Eyre-Walker, A. The positive correlation between d N/d S and d S in mammals is due to runs of adjacent substitutions. Molecular biology and evolution 2011, 28, 1371–1380. [Google Scholar] [CrossRef]
- Guisinger, M. M. , Kuehl, J. V., Boore, J. L., & Jansen, R. K. Genome-wide analyses of Geraniaceae plastid DNA reveal unprecedented patterns of increased nucleotide substitutions. Proceedings of the National Academy of Sciences 2008, 105, 18424–18429. [Google Scholar] [CrossRef]
- Garamszegi, L. Z. , de Groot, N. G., & Bontrop, R. E. Correlated evolution of nucleotide substitution rates and allelic variation in Mhc-DRB lineages of primates. BMC Evolutionary Biology 2009, 9, 1–18. [Google Scholar] [CrossRef]
- Comeron, J. M. , & Kreitman, M. The correlation between synonymous and nonsynonymous substitutions in Drosophila: mutation, selection or relaxed constraints? Genetics 1998, 150, 767–775. [Google Scholar] [CrossRef] [PubMed]
- Chuang, J. H. , & Li, H. Functional bias and spatial organization of genes in mutational hot and cold regions in the human genome. PLoS biology 2004, 2, e29. [Google Scholar] [CrossRef]
- Cummins, M. , Watson, C., Edwards, R. J., & Mattick, J. S. The evolution of ultraconserved elements in vertebrates. Molecular biology and evolution 2024, 41, msae146. [Google Scholar]
- Makałowski, W. , & Boguski, M. S. Evolutionary parameters of the transcribed mammalian genome: an analysis of 2,820 orthologous rodent and human sequences. Proceedings of the National Academy of Sciences 1998, 95, 9407–9412. [Google Scholar] [CrossRef]
- Hodgkinson, A. , & Eyre-Walker, A. Variation in the mutation rate across mammalian genomes. Nature reviews genetics 2011, 12, 756–766. [Google Scholar]
- Agier, N. , & Fischer, G. The mutational profile of the yeast genome is shaped by replication. Molecular biology and evolution 2012, 29, 905–913. [Google Scholar] [CrossRef]
- Chen, C. L. , Rappailles, A., Duquenne, L., Huvet, M., Guilbaud, G., Farinelli, L.,... & Thermes, C. Impact of replication timing on non-CpG and CpG substitution rates in mammalian genomes. Genome research 2010, 20, 447–457. [Google Scholar] [CrossRef]
- Weber, C. C. , Pink, C. J., & Hurst, L. D. Late-replicating domains have higher divergence and diversity in Drosophila melanogaster. Molecular biology and evolution 2012, 29, 873–882. [Google Scholar] [CrossRef]
- Staunton, P. M. , Peters, A. J., & Seoighe, C. Somatic mutations inferred from RNA-seq data highlight the contribution of replication timing to mutation rate variation in a model plant. Genetics 2023, 225, iyad128. [Google Scholar] [CrossRef]
- Stamatoyannopoulos, J. A. , Adzhubei, I., Thurman, R. E., Kryukov, G. V., Mirkin, S. M., & Sunyaev, S. R. Human mutation rate associated with DNA replication timing. Nature genetics 2009, 41, 393–395. [Google Scholar]
- Gaboriaud, J. , & Wu, P. Y. J. Insights into the link between the organization of DNA replication and the mutational landscape. Genes 2019, 10, 252. [Google Scholar]
- Rhind, N. DNA replication timing: Biochemical mechanisms and biological significance. BioEssays 2022, 44, 2200097. [Google Scholar] [CrossRef] [PubMed]
- Boos, D. , & Ferreira, P. Origin firing regulations to control genome replication timing. Genes 2019, 10, 199. [Google Scholar] [PubMed]
- Bechhoefer, J. , & Rhind, N. Replication timing and its emergence from stochastic processes. Trends in Genetics 2012, 28, 374–381. [Google Scholar] [CrossRef] [PubMed]
- Ge, X. Q. , & Blow, J. J. Chk1 inhibits replication factory activation but allows dormant origin firing in existing factories. Journal of Cell biology 2010, 191, 1285–1297. [Google Scholar]
- Goldar, A. , Marsolier-Kergoat, M. C., & Hyrien, O. Universal temporal profile of replication origin activation in eukaryotes. PLoS One 2009, 4, e5899. [Google Scholar]
- Yang, S. C. H. , Rhind, N. , & Bechhoefer, J. Modeling genome-wide replication kinetics reveals a mechanism for regulation of replication timing. Molecular systems biology 2010, 6, 404. [Google Scholar] [CrossRef]
- Yoshida, K. , Bacal, J., Desmarais, D., Padioleau, I., Tsaponina, O., Chabes, A.,... & Pasero, P. The histone deacetylases sir2 and rpd3 act on ribosomal DNA to control the replication program in budding yeast. Molecular cell 2014, 54, 691–697. [Google Scholar] [CrossRef]
- Richards, L. , Das, S., & Nordman, J. T. Rif1-dependent control of replication timing. Genes 2022, 13, 550. [Google Scholar] [CrossRef]
- Murat, P. , Perez, C., Crisp, A., van Eijk, P., Reed, S. H., Guilbaud, G., & Sale, J. E. DNA replication initiation shapes the mutational landscape and expression of the human genome. Science Advances 2022, 8, eadd3686. [Google Scholar] [CrossRef]
- Drummond, D. A. , Bloom, J. D., Adami, C., Wilke, C. O., & Arnold, F. H. Why highly expressed proteins evolve slowly. Proceedings of the National Academy of Sciences 2005, 102, 14338–14343. [Google Scholar] [CrossRef]
- Rhind, N. DNA replication timing: random thoughts about origin firing. Nature cell biology 2006, 8, 1313–1316. [Google Scholar] [CrossRef] [PubMed]
- Dimitrova, D. S. , & Gilbert, D. M. The spatial position and replication timing of chromosomal domains are both established in early G1 phase. Molecular cell 1999, 4, 983–993. [Google Scholar] [CrossRef] [PubMed]
- Sima, J. , & Gilbert, D. M. Complex correlations: replication timing and mutational landscapes during cancer and genome evolution. Current opinion in genetics & development 2014, 25, 93–100. [Google Scholar] [CrossRef]
- Rhind, N. , & Gilbert, D. M. DNA replication timing. Cold Spring Harbor perspectives in biology 2013, 5, a010132. [Google Scholar] [CrossRef]
- Tian, M. , Wang, Z., Su, Z., Shibata, E., Shibata, Y., Dutta, A., & Zang, C. Integrative analysis of DNA replication origins and ORC-/MCM-binding sites in human cells reveals a lack of overlap. Elife 2024, 12, RP89548. [Google Scholar] [CrossRef]
- Gilbert, D. M. Replication timing and transcriptional control: beyond cause and effect. Current opinion in cell biology 2002, 14, 377–383. [Google Scholar] [CrossRef]
- Sequeira-Mendes, J. , Díaz-Uriarte, R., Apedaile, A., Huntley, D., Brockdorff, N., & Gómez, M. Transcription initiation activity sets replication origin efficiency in mammalian cells. PLoS genetics 2009, 5, e1000446. [Google Scholar] [CrossRef]
- Müller, C. A. , & Nieduszynski, C. A. DNA replication timing influences gene expression level. Journal of Cell Biology 2017, 216, 1907–1914. [Google Scholar] [CrossRef]
- Das, S. P. , Borrman, T., Liu, V. W., Yang, S. C. H., Bechhoefer, J., & Rhind, N. Replication timing is regulated by the number of MCMs loaded at origins. Genome Research 2015, 25, 1886–1892. [Google Scholar] [CrossRef]
- Liu, Y. , Ai, C., Gan, T., Wu, J., Jiang, Y., Liu, X.,... & Hu, J. Transcription shapes DNA replication initiation to preserve genome integrity. Genome biology 2021, 22, 176. [Google Scholar] [CrossRef]
- Santos, M. M. , Johnson, M. C., Fiedler, L., & Zegerman, P. Global early replication disrupts gene expression and chromatin conformation in a single cell cycle. Genome Biology 2022, 23, 217. [Google Scholar]
- Smith, J. J. , Putta, S., Zhu, W., Pao, G. M., Verma, I. M., Hunter, T.,... & Voss, S. R. Genic regions of a large salamander genome contain long introns and novel genes. BMC genomics 2009, 10, 1–11. [Google Scholar]
- Farlow, A. , Meduri, E., & Schlötterer, C. DNA double-strand break repair and the evolution of intron density. Trends in Genetics 2011, 27, 1–6. [Google Scholar] [CrossRef]
- Swinburne, I. A. , & Silver, P. A. Intron delays and transcriptional timing during development. Developmental cell 2008, 14, 324–330. [Google Scholar] [CrossRef] [PubMed]
- Heyn, P. , Kalinka, A. T., Tomancak, P., & Neugebauer, K. M. Introns and gene expression: cellular constraints, transcriptional regulation, and evolutionary consequences. Bioessays 2015, 37, 148–154. [Google Scholar] [CrossRef]
- Buffenstein R, Lewis KN, Gibney PA, Narayan V, Grimes KM, Smith M, Lin TD, Brown-Borg HM. Probing pedomorphy and prolonged lifespan in naked mole-rats and dwarf mice. Physiology 2020, 35:96-111. [CrossRef]
- De Groef, B. , Grommen, S. V., & Darras, V. M. Forever young: endocrinology of paedomorphosis in the Mexican axolotl (Ambystoma mexicanum). General and comparative endocrinology 2018, 266, 194–201. [Google Scholar] [CrossRef]
- Versteeg, R. , van Schaik, B. D., van Batenburg, M. F., Roos, M., Monajemi, R., Caron, H.,... & van Kampen, A. H. The human transcriptome map reveals extremes in gene density, intron length, GC content, and repeat pattern for domains of highly and weakly expressed genes. Genome research 2003, 13, 1998–2004. [Google Scholar] [CrossRef]
- Castillo-Davis, C. I. , Mekhedov, S. L., Hartl, D. L., Koonin, E. V., & Kondrashov, F. A. Selection for short introns in highly expressed genes. Nature genetics 2002, 31, 415–418. [Google Scholar] [CrossRef]
- Francis, W. R. , & Wörheide, G. Similar ratios of introns to intergenic sequence across animal genomes. Genome biology and evolution 2017, 9, 1582–1598. [Google Scholar] [CrossRef]
- Haddrill, P. R. , Charlesworth, B., Halligan, D. L., & Andolfatto, P. Patterns of intron sequence evolution in Drosophila are dependent upon length and GC content. Genome biology 2005, 6, 1–8. [Google Scholar] [CrossRef]
- Agier, N. , Delmas, S., Zhang, Q., Fleiss, A., Jaszczyszyn, Y., Van Dijk, E.,... & Fischer, G. The evolution of the temporal program of genome replication. Nature communications 2018, 9, 2199. [Google Scholar] [PubMed]
- de Moura, A. , & Karschau, J. Mathematical model for the distribution of DNA replication origins. Physical Review E 2024, 110, 034408. [Google Scholar] [CrossRef]
- Bracci, Alexa N., Anissa Dallmann, Qiliang Ding, Melissa J. Hubisz, Madison Caballero, and Amnon Koren. “The evolution of the human DNA replication timing program.” Proceedings of the National Academy of Sciences 120, no. 10 (2023): e2213896120. [CrossRef]
- Yang, J. R. , Liao, B. Y., Zhuang, S. M., & Zhang, J. Protein misinteraction avoidance causes highly expressed proteins to evolve slowly. Proceedings of the National Academy of Sciences 2012, 109, E831–E840. [Google Scholar] [CrossRef]
- Drummond, D. A. , & Wilke, C. O. Mistranslation-induced protein misfolding as a dominant constraint on coding-sequence evolution. Cell 2008, 134, 341–352. [Google Scholar] [CrossRef]
- Syljuåsen, R. G. , Sørensen, C. S., Hansen, L. T., Fugger, K., Lundin, C., Johansson, F.,... & Bartek, J. Inhibition of human Chk1 causes increased initiation of DNA replication, phosphorylation of ATR targets, and DNA breakage. Molecular and cellular biology 2005. [Google Scholar] [CrossRef]
- Petermann, E. , Woodcock, M., & Helleday, T. Chk1 promotes replication fork progression by controlling replication initiation. Proceedings of the National Academy of Sciences 2010, 107, 16090–16095. [Google Scholar] [CrossRef]
- Maya-Mendoza, A. , Petermann, E., Gillespie, D. A., Caldecott, K. W., & Jackson, D. A. Chk1 regulates the density of active replication origins during the vertebrate S phase. The EMBO journal 2007, 26, 2719–2731. [Google Scholar] [CrossRef]
- Ge, X. Q. , Jackson, D. A., & Blow, J. J. Dormant origins licensed by excess Mcm2–7 are required for human cells to survive replicative stress. Genes & development 2007, 21, 3331–3341. [Google Scholar] [CrossRef]
- Alver, R. C. , Chadha, G. S., & Blow, J. J. The contribution of dormant origins to genome stability: from cell biology to human genetics. DNA repair 2014, 19, 182–189. [Google Scholar] [CrossRef]
- Poli, J. , Tsaponina, O., Crabbé, L., Keszthelyi, A., Pantesco, V., Chabes, A.,... & Pasero, P. dNTP pools determine fork progression and origin usage under replication stress. The EMBO journal 2012, 31, 883–894. [Google Scholar] [CrossRef] [PubMed]
- Hand, R. Regulation of DNA replication on subchromosomal units of mammalian cells. The Journal of cell biology 1975, 64, 89–97. [Google Scholar] [CrossRef] [PubMed]
- Conti, C. , Sacca, B., Herrick, J., Lalou, C., Pommier, Y., & Bensimon, A. Replication fork velocities at adjacent replication origins are coordinately modified during DNA replication in human cells. Molecular biology of the cell 2007, 18, 3059–3067. [Google Scholar] [CrossRef]
- Ma, E. , Hyrien, O., & Goldar, A. Do replication forks control late origin firing in Saccharomyces cerevisiae? Nucleic acids research 2012, 40, 2010–2019. [Google Scholar] [CrossRef]
- Carmel, L. , Rogozin, I. B., Wolf, Y. I., & Koonin, E. V. Evolutionarily conserved genes preferentially accumulate introns. Genome Research 2007, 17, 1045–1050. [Google Scholar] [CrossRef]
- Keane, P. A. , & Seoighe, C. Intron length coevolution across mammalian genomes. Molecular Biology and Evolution 2016, 33, 2682–2691. [Google Scholar] [CrossRef]
- Blommaert, J. Genome size evolution: towards new model systems for old questions. Proceedings of the Royal Society B 2020, 287, 20201441. [Google Scholar] [CrossRef]
- Sun, C. , López Arriaza, J. R., & Mueller, R. L. Slow DNA loss in the gigantic genomes of salamanders. Genome biology and evolution 2012, 4, 1340–1348. [Google Scholar] [CrossRef]
- Macheret, M. , & Halazonetis, T. D. Intragenic origins due to short G1 phases underlie oncogene-induced DNA replication stress. Nature 2018, 555, 112–116. [Google Scholar]
- Bonnet, A. , Grosso, A. R., Elkaoutari, A., Coleno, E., Presle, A., Sridhara, S. C.,... & Palancade, B. Introns protect eukaryotic genomes from transcription-associated genetic instability. Molecular cell 2017, 67, 608–621. [Google Scholar] [CrossRef]
- Ge, X. Q. , Han, J., Cheng, E. C., Yamaguchi, S., Shima, N., Thomas, J. L., & Lin, H. Embryonic stem cells license a high level of dormant origins to protect the genome against replication stress. Stem Cell Reports 2015, 5, 185–194. [Google Scholar] [CrossRef] [PubMed]
- Woodward, A. M. , Göhler, T., Luciani, M. G., Oehlmann, M., Ge, X., Gartner, A.,... & Blow, J. J. Excess Mcm2–7 license dormant origins of replication that can be used under conditions of replicative stress. The Journal of cell biology 2006, 173, 673–683. [Google Scholar] [CrossRef] [PubMed]
- Sun, C. , Shepard, D. B., Chong, R. A., López Arriaza, J., Hall, K., Castoe, T. A.,... & Mueller, R. L. LTR retrotransposons contribute to genomic gigantism in plethodontid salamanders. Genome biology and evolution 2012, 4, 168–183. [Google Scholar] [CrossRef] [PubMed]
- Mao, Z. , Bozzella, M., Seluanov, A., & Gorbunova, V. Comparison of nonhomologous end joining and homologous recombination in human cells. DNA repair 2008, 7, 1765–1771. [Google Scholar] [CrossRef] [PubMed]
- Shrivastav, M. , De Haro, L. P., & Nickoloff, J. A. Regulation of DNA double-strand break repair pathway choice. Cell research 2008, 18, 134–147. [Google Scholar]
- Brandsma, I. , & van Gent, D. C. Pathway choice in DNA double strand break repair: observations of a balancing act. Genome integrity 2012, 3, 1–10. [Google Scholar] [CrossRef]
- Ben Yamin, B. , Ahmed-Seghir, S., Tomida, J., Despras, E., Pouvelle, C., Yurchenko, A.,... & Kannouche, P. L. DNA polymerase zeta contributes to heterochromatin replication to prevent genome instability. The EMBO journal 2021, 40, e104543. [Google Scholar] [CrossRef]
- Guirouilh-Barbat, J. , Huck, S., Bertrand, P., Pirzio, L., Desmaze, C., Sabatier, L., & Lopez, B. S. Impact of the KU80 pathway on NHEJ-induced genome rearrangements in mammalian cells. Molecular cell 2004, 14, 611–623. [Google Scholar] [CrossRef]
- Scully, R. , Panday, A., Elango, R., & Willis, N. A. DNA double-strand break repair-pathway choice in somatic mammalian cells. Nature reviews Molecular cell biology 2019, 20, 698–714. [Google Scholar] [CrossRef]
- Takahashi, S. , Miura, H., Shibata, T., Nagao, K., Okumura, K., Ogata, M.,... & Hiratani, I. Genome-wide stability of the DNA replication program in single mammalian cells. Nature genetics 2019, 51, 529–540. [Google Scholar]
- Kelly, T. , & Callegari, A. J. Dynamics of DNA replication in a eukaryotic cell. Proceedings of the National Academy of Sciences 2019, 116, 4973–4982. [Google Scholar] [CrossRef]
- Zhang, Q. , Bassetti, F., Gherardi, M., & Lagomarsino, M. C. Cell-to-cell variability and robustness in S-phase duration from genome replication kinetics. Nucleic acids research 2017, 45, 8190–8198. [Google Scholar] [CrossRef] [PubMed]
- Nakatani, T. , Schauer, T., Altamirano-Pacheco, L., Klein, K. N., Ettinger, A., Pal, M.,... & Torres-Padilla, M. E. Emergence of replication timing during early mammalian development. Nature 2024, 625, 401–409. [Google Scholar] [PubMed]
- Massip, F. , Laurent, M., Brossas, C., Fernández-Justel, J. M., Gómez, M., Prioleau, M. N.,... & Picard, F. Evolution of replication origins in vertebrate genomes: rapid turnover despite selective constraints. Nucleic acids research 2019, 47, 5114–5125.doi. [Google Scholar] [PubMed]
- Ryba, T. , Hiratani, I., Lu, J., Itoh, M., Kulik, M., Zhang, J.,... & Gilbert, D. M. Evolutionarily conserved replication timing profiles predict long-range chromatin interactions and distinguish closely related cell types. Genome research 2010, 20, 761–770. [Google Scholar] [CrossRef]
- Yaffe, E. , Farkash-Amar, S., Polten, A., Yakhini, Z., Tanay, A., & Simon, I. Comparative analysis of DNA replication timing reveals conserved large-scale chromosomal architecture. PLoS genetics 2010, 6, e1001011. [Google Scholar] [CrossRef]
- Goldberg, M. E. , & Harris, K. Mutational signatures of replication timing and epigenetic modification persist through the global divergence of mutation spectra across the great ape phylogeny. Genome Biology and Evolution 2022, 14, evab104. [Google Scholar] [CrossRef]
- Lu, B. Evolutionary insights into the relationship of frogs, salamanders, and caecilians ad their adaptive traits, with an emphasis on salamander regeneration and longevity. Animals 2023, 13, 3449. [Google Scholar] [CrossRef]
- Rios-Carlos, H. , Segovia-Ramírez, M. G., Fujita, M. K., & Rovito, S. M. Genomic gigantism is not associated with reduced selection efficiency in neotropical salamanders. Journal of Molecular Evolution 2024, 92, 371–380. [Google Scholar] [CrossRef]
- Roddy, A. B. , Alvarez-Ponce, D., & Roy, S. W. Mammals with small populations do not exhibit larger genomes. Molecular Biology and Evolution 2021, 38, 3737–3741. [Google Scholar] [CrossRef]
- Mohlhenrich, E. R. , & Mueller, R. L. Genetic drift and mutational hazard in the evolution of salamander genomic gigantism. Evolution 2016, 70, 2865–2878. [Google Scholar]
- Sessions, S. K. Evolutionary cytogenetics in salamanders. Chromosome Research 2008, 16, 183–201. [Google Scholar] [CrossRef] [PubMed]
- Liedtke, H. C. , Gower, D. J., Wilkinson, M., & Gomez-Mestre, I. Macroevolutionary shift in the size of amphibian genomes and the role of life history and climate. Nature Ecology & Evolution 2018, 2, 1792–1799. [Google Scholar]
- Venditti, C. , & Pagel, M. Speciation as an active force in promoting genetic evolution. Trends in Ecology & Evolution 2010, 25, 14–20. [Google Scholar] [CrossRef]
- Lefébure, Tristan, Claire Morvan, Florian Malard, Clémentine François, Lara Konecny-Dupré, Laurent Guéguen, Michèle Weiss-Gayet et al. “Less effective selection leads to larger genomes.” Genome Research 27, no. 6 (2017): 1016-1028. [CrossRef]
- Fuselli, S. , Greco, S., Biello, R., Palmitessa, S., Lago, M., Meneghetti, C.,... & Bertorelle, G. Relaxation of natural selection in the evolution of the giant lungfish genomes. Molecular biology and evolution 2023, 40, msad193. [Google Scholar]
- Lynch, M. Evolution of the mutation rate. TRENDS in Genetics 2010, 26, 345–352. [Google Scholar] [CrossRef]
- Lam, D. K. , Frantz, A. C., Burke, T., Geffen, E., & Sin, S. Y. W. Both selection and drift drive the spatial pattern of adaptive genetic variation in a wild mammal. Evolution 2023, 77, 221–238. [Google Scholar] [CrossRef]
- Kabi, M. , & Filion, G. J. Heterochromatin: did H3K9 methylation evolve to tame transposons? Genome Biology 2021, 22, 1–3. [Google Scholar] [CrossRef]
- Janssen, A. , Colmenares, S. U., & Karpen, G. H. Heterochromatin: guardian of the genome. Annual review of cell and developmental biology 2018, 34, 265–288. [Google Scholar] [CrossRef]
- Wintersberger, E. Why is there late replication? Chromosoma 2000, 109, 300–307. [Google Scholar] [CrossRef]
- Herrick, J. Genetic variation and DNA replication timing, or why is there late replicating DNA? Evolution 2011, 65, 3031–3047. [Google Scholar] [CrossRef]
- Al Mamun, M. , Albergante, L., Moreno, A., Carrington, J. T., Blow, J. J., & Newman, T. J. Inevitability and containment of replication errors for eukaryotic genome lengths spanning megabase to gigabase. Proceedings of the National Academy of Sciences 2016, 113, E5765–E5774. [Google Scholar] [CrossRef]
- Fortuny, A. , & Polo, S. E. The response to DNA damage in heterochromatin domains. Chromosoma 2018, 127, 291–300. [Google Scholar] [CrossRef] [PubMed]
- Al Mamun, M. , Albergante, L., Blow, J. J., & Newman, T. J. 3 tera-basepairs as a fundamental limit for robust DNA replication. Physical Biology 2020, 17, 046002. [Google Scholar] [CrossRef]
- Moreno, A. , Carrington, J. T., Albergante, L., Al Mamun, M., Haagensen, E. J., Komseli, E. S.,... & Blow, J. J. Unreplicated DNA remaining from unperturbed S phases passes through mitosis for resolution in daughter cells. Proceedings of the National Academy of Sciences 2016, 113, E5757–E5764. [Google Scholar] [CrossRef]
- Angileri, K. M. , Bagia, N. A., & Feschotte, C. Transposon control as a checkpoint for tissue regeneration. Development 2022, 149, dev191957. [Google Scholar] [CrossRef]
- Zuntini, A. R. , Carruthers, T., Maurin, O., Bailey, P. C., Leempoel, K., Brewer, G. E.,... & Knapp, S. Phylogenomics and the rise of the angiosperms. Nature 2024, 629, 843–850. [Google Scholar]
- Borowska-Zuchowska, N. , Senderowicz, M., Trunova, D., & Kolano, B. Tracing the evolution of the angiosperm genome from the cytogenetic point of view. Plants 2022, 11, 784. [Google Scholar]
- Schubert, I. , & Vu, G. T. Genome stability and evolution: attempting a holistic view. Trends in plant science 2016, 21, 749–757. [Google Scholar] [CrossRef]
- Giannattasio, M. , & Branzei, D. S-phase checkpoint regulations that preserve replication and chromosome integrity upon dNTP depletion. Cellular and Molecular Life Sciences 2017, 74, 2361–2380. [Google Scholar] [CrossRef]
- Voskarides, K. , & Giannopoulou, N. The role of TP53 in adaptation and evolution. Cells 2023, 12, 512. [Google Scholar] [CrossRef]
- Roche, B. , Hochberg, M. E., Caulin, A. F., Maley, C. C., Gatenby, R. A., Misse, D., & Thomas, F. Natural resistance to cancers: a Darwinian hypothesis to explain Peto’s paradox. BMC cancer 2012, 12, 1–4. [Google Scholar] [CrossRef]
- Vincze, O. , Colchero, F., Lemaître, J. F., Conde, D. A., Pavard, S., Bieuville, M.,... & Giraudeau, M. Cancer risk across mammals. Nature 2022, 601, 263–267. [Google Scholar] [CrossRef] [PubMed]
- Dart, A. Peto’s paradox put to the test. Nature Reviews Cancer 2022, 22, 129–129. [Google Scholar] [CrossRef]
- Bowman, J. , & Lynch, V. J. Rapid evolution of genes with anti-cancer functions during the origins of large bodies and cancer resistance in elephants. bioRxiv 2024. [Google Scholar] [CrossRef]
- Maciak, S. Cell size, body size and Peto’s paradox. BMC ecology and evolution 2022, 22, 142. [Google Scholar] [CrossRef]
- Compton, Z. T. , Mellon, W., Harris, V. K., Rupp, S., Mallo, D., Kapsetaki, S. E.,... & Boddy, A. M. Cancer prevalence across vertebrates. Cancer discovery 2025, 15, 227–244. [Google Scholar] [CrossRef]
- Sulak, M. , Fong, L., Mika, K., Chigurupati, S., Yon, L., Mongan, N. P.,... & Lynch, V. J. TP53 copy number expansion is associated with the evolution of increased body size and an enhanced DNA damage response in elephants. elife 2016, 5, e11994. [Google Scholar] [CrossRef]
- Butler, G. , Baker, J., Amend, S. R., Pienta, K. J., & Venditti, C. No evidence for Peto’s paradox in terrestrial vertebrates. Proceedings of the National Academy of Sciences 2025, 122, e2422861122. [Google Scholar] [CrossRef]
- Tian, X. , Firsanov, D., Zhang, Z., Cheng, Y., Luo, L., Tombline, G.,... & Gorbunova, V. SIRT6 is responsible for more efficient DNA double-strand break repair in long-lived species. Cell 2019, 177, 622–638. [Google Scholar] [CrossRef]
- Popov, A. A. , Petruseva, I. O., & Lavrik, O. I. Activity of DNA Repair Systems in the Cells of Long-Lived Rodents and Bats. Biochemistry (Moscow) 2024, 89, 1014–1023. [Google Scholar] [CrossRef]
- Cagan, A. , Baez-Ortega, A., Brzozowska, N., Abascal, F., Coorens, T. H., Sanders, M. A.,... & Martincorena, I. Somatic mutation rates scale with lifespan across mammals. Nature 2022, 604, 517–524. [Google Scholar] [CrossRef] [PubMed]
- Johannes, F. Allometric scaling of somatic mutation and epimutation rates in trees. Evolution 2025, 79, 1–5. [Google Scholar] [CrossRef] [PubMed]
- Singh, V. P. , & Singh, P. Linking DNA damage and senescence to gestation period and lifespan in placental mammals. Frontiers in Cell and Developmental Biology 2024, 12, 1480695. [Google Scholar] [CrossRef]
- Damas, J. , Corbo, M., Kim, J., Turner-Maier, J., Farré, M., Larkin, D. M.,... & Lewin, H. A. Evolution of the ancestral mammalian karyotype and syntenic regions. Proceedings of the National Academy of Sciences 2022, 119, e2209139119. [Google Scholar] [CrossRef]
- Carta, A. , & Escudero, M. Karyotypic diversity: a neglected trait to explain angiosperm diversification? Evolution 2023, 77, 1158–1164. [Google Scholar] [CrossRef]
- Zhan, S. H. , Otto, S. P., & Barker, M. S. Broad variation in rates of polyploidy and dysploidy across flowering plants is correlated with lineage diversification. S. Broad variation in rates of polyploidy and dysploidy across flowering plants is correlated with lineage diversification. bioRxiv 2021, 2021–03. [Google Scholar] [CrossRef]
- Zhang, R. G. , Liu, H., Shang, H. Y., Shu, H., Liu, D. T., Yang, H.,... & Ma, Y. Convergent patterns of karyotype evolution underlying karyotype uniformity in conifers. Advanced Science 2025, 12, 2411098. [Google Scholar] [CrossRef]
- Afonso Silva, A. C. , Maliet, O., Aristide, L., Nogués-Bravo, D., Upham, N., Jetz, W., & Morlon, H. Negative global-scale association between genetic diversity and speciation rates in mammals. Nature communications 2025, 16, 1796. [Google Scholar] [CrossRef]
- Bergeron, L. A. , Besenbacher, S., Zheng, J., Li, P., Bertelsen, M. F., Quintard, B.,... & Zhang, G. Evolution of the germline mutation rate across vertebrates. Nature 2023, 615, 285–291. [Google Scholar] [CrossRef]
- Futuyma, D. J. Evolutionary constraint and ecological consequences. Evolution 2010, 64, 1865–1884. [Google Scholar] [CrossRef] [PubMed]
- Schumacher, B. , Pothof, J., Vijg, J., & Hoeijmakers, J. H. The central role of DNA damage in the ageing process. Nature 2021, 592, 695–703. [Google Scholar] [CrossRef]
- Sahm, A. , Cherkasov, A., Liu, H., Voronov, D., Siniuk, K., Schwarz, R.,... & Hoffmann, S. The Greenland shark (Somniosus microcephalus) genome provides insights into extreme longevity. bioRxiv 2024. [Google Scholar] [CrossRef]
- Yang, K. , Nishiwaki, K., Mizobata, H., Asakawa, S., Yoshitake, K., Watanabe, Y. Y.,... & Kinoshita, S. The Greenland shark genome: insights into deep-sea ecology and lifespan extremes. bioRxiv 2025. [Google Scholar] [CrossRef]
- Kilili, H. , Padilla-Morales, B., Castillo-Morales, A., Monzón-Sandoval, J., Díaz-Barba, K., Cornejo-Paramo, P.,... & Urrutia, A. O. Maximum lifespan and brain size in mammals are associated with gene family size expansion related to immune system functions. Scientific Reports 2025, 15, 15087. [Google Scholar] [CrossRef]
- Rolland, J. , Henao-Diaz, L. F., Doebeli, M., Germain, R., Harmon, L. J., Knowles, L. L.,... & Schluter, D. Conceptual and empirical bridges between micro-and macroevolution. Nature Ecology & Evolution 2023, 7, 1181–1193. [Google Scholar]
- Bertucci-Richter, E. M. , & Parrott, B. B. The rate of epigenetic drift scales with maximum lifespan across mammals. Nature Communications 2023, 14, 7731. [Google Scholar]
- Zhou, W. , Liang, G., Molloy, P. L., & Jones, P. A. DNA methylation enables transposable element-driven genome expansion. Proceedings of the National Academy of Sciences 2020, 117, 19359–19366. [Google Scholar]
- Lynch, M. , & Conery, J. S. The origins of genome complexity. science 2003, 302, 1401–1404. [Google Scholar]
- Marino Alba, Debaecker Gautier, Fiston-Lavier Anna-Sophie, Haudry Annabelle, Nabholz Benoit (2024) Effective population size does not explain long-term variation in genome size and transposable element content in animals eLife 13:RP100574. [CrossRef]
- Lynch, M. , Ackerman, M. S., Gout, J. F., Long, H., Sung, W., Thomas, W. K., & Foster, P. L. Genetic drift, selection and the evolution of the mutation rate. Nature Reviews Genetics 2016, 17, 704–714. [Google Scholar]
- Bengtsson, B. O. Rates of karyotype evolution in placental mammals. Hereditas 1980, 92, 37–47. [Google Scholar] [CrossRef]
Figure 1.
Schematic illustration (not to scale) depicting approximate ranges in genome size in different taxa. Amphibia and angiosperms exhibit a broad range in genome size compared to birds and mammals, resulting from large-scale DNA deletions and amplifications. Under genetic drift, genome size expansion is considered selectively neutral [183], and therefore more variable (larger range). The impact of effective population size (genetic drift) on genome size, however, has recently been called into question. [184].
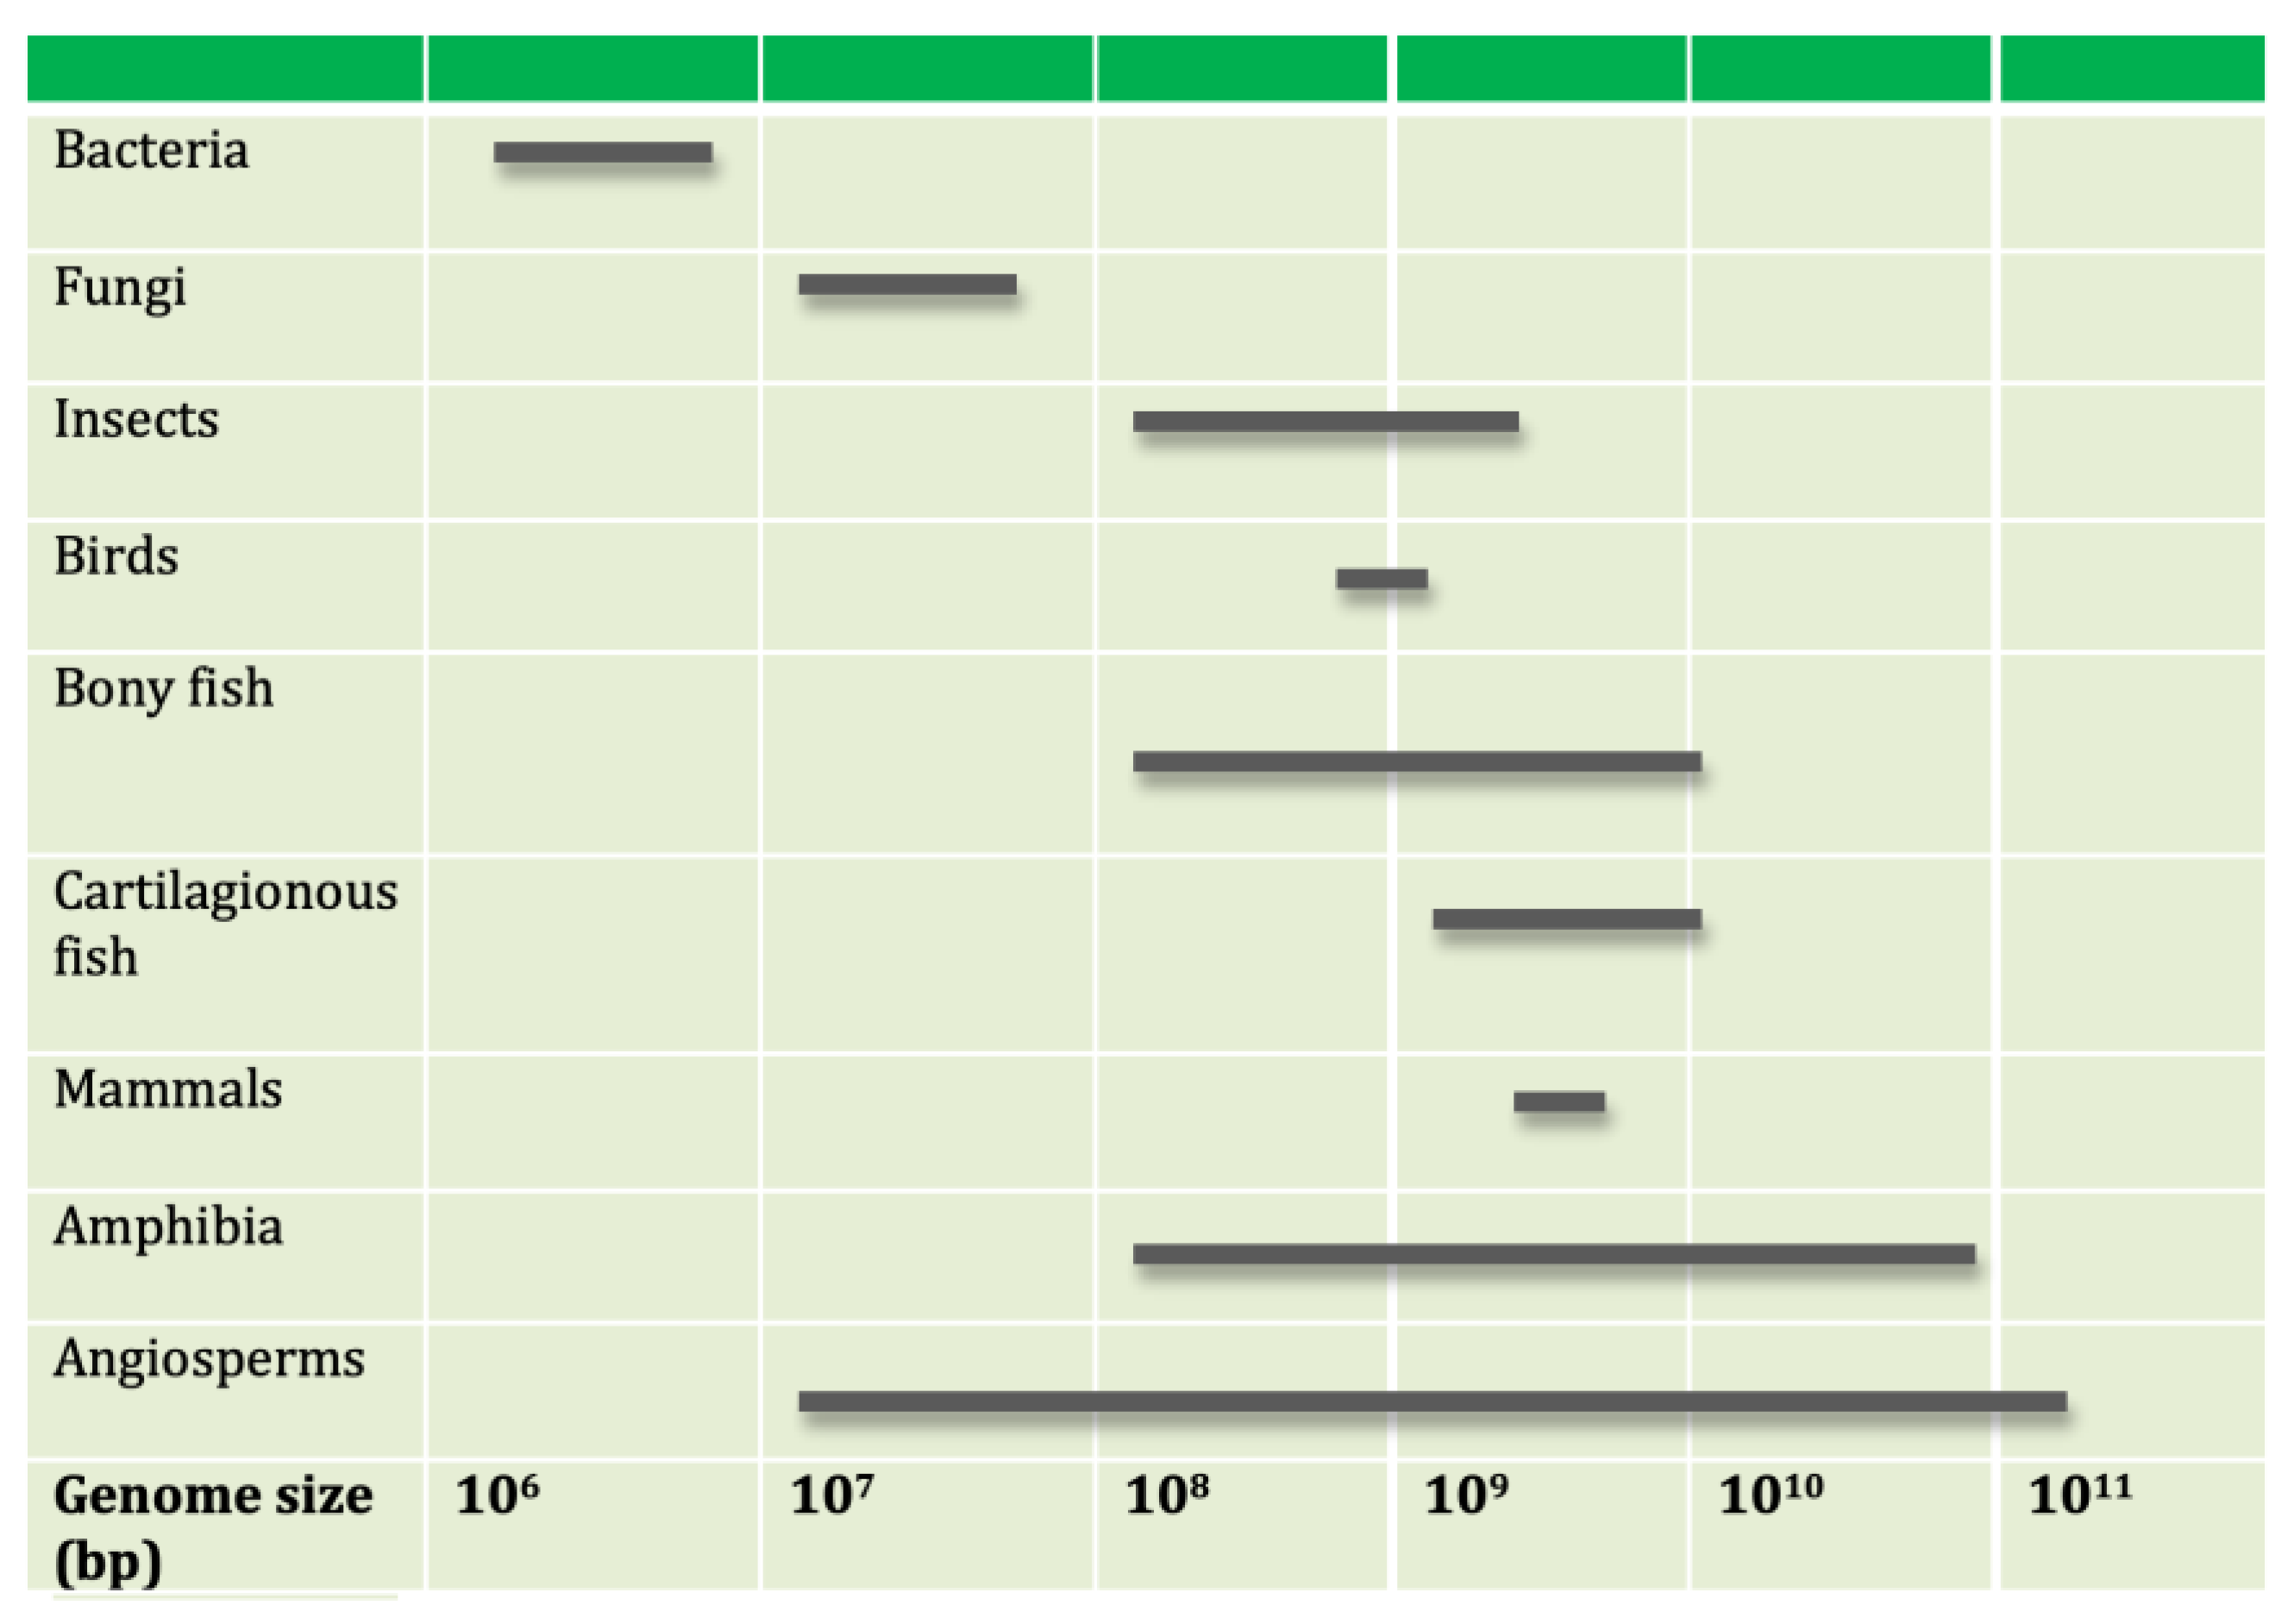
Figure 2.
Generalized model of speciation (from Kimura 1991). Ecological selection/speciation (ES) is believed to depend on the standing level of allelic diversity in a population (adaptation/diversification). Smaller effective population sizes are expected to have higher levels of mutation accumulation (“Drift Barrier Hypothesis”; see 185) The figure proposes that genetic drift (GD) can promote an elevated mutation levels that can likewise result in increased levels of allelic diversity (population bottle neck). The interplay between these two forces, genetic drift and ecological selection, determines the extent to which a phenotype or population primarily experiences an adaptive radiation or a non-adaptive radiation. In the absence of strong purifying selection, lineages with high karyotype diversity have a greater probability of being relatively species rich, while species with low karyotype diversity experiencing strong selection can have either low or high levels of species richness. Birds and frogs, for example, have conserved karyotypes but are species rich, whereas salamanders have low karyotype diversity and relatively low levels of species richness. In mammals, karyotype diversity explains about 42 % of species richness (see Table 1).
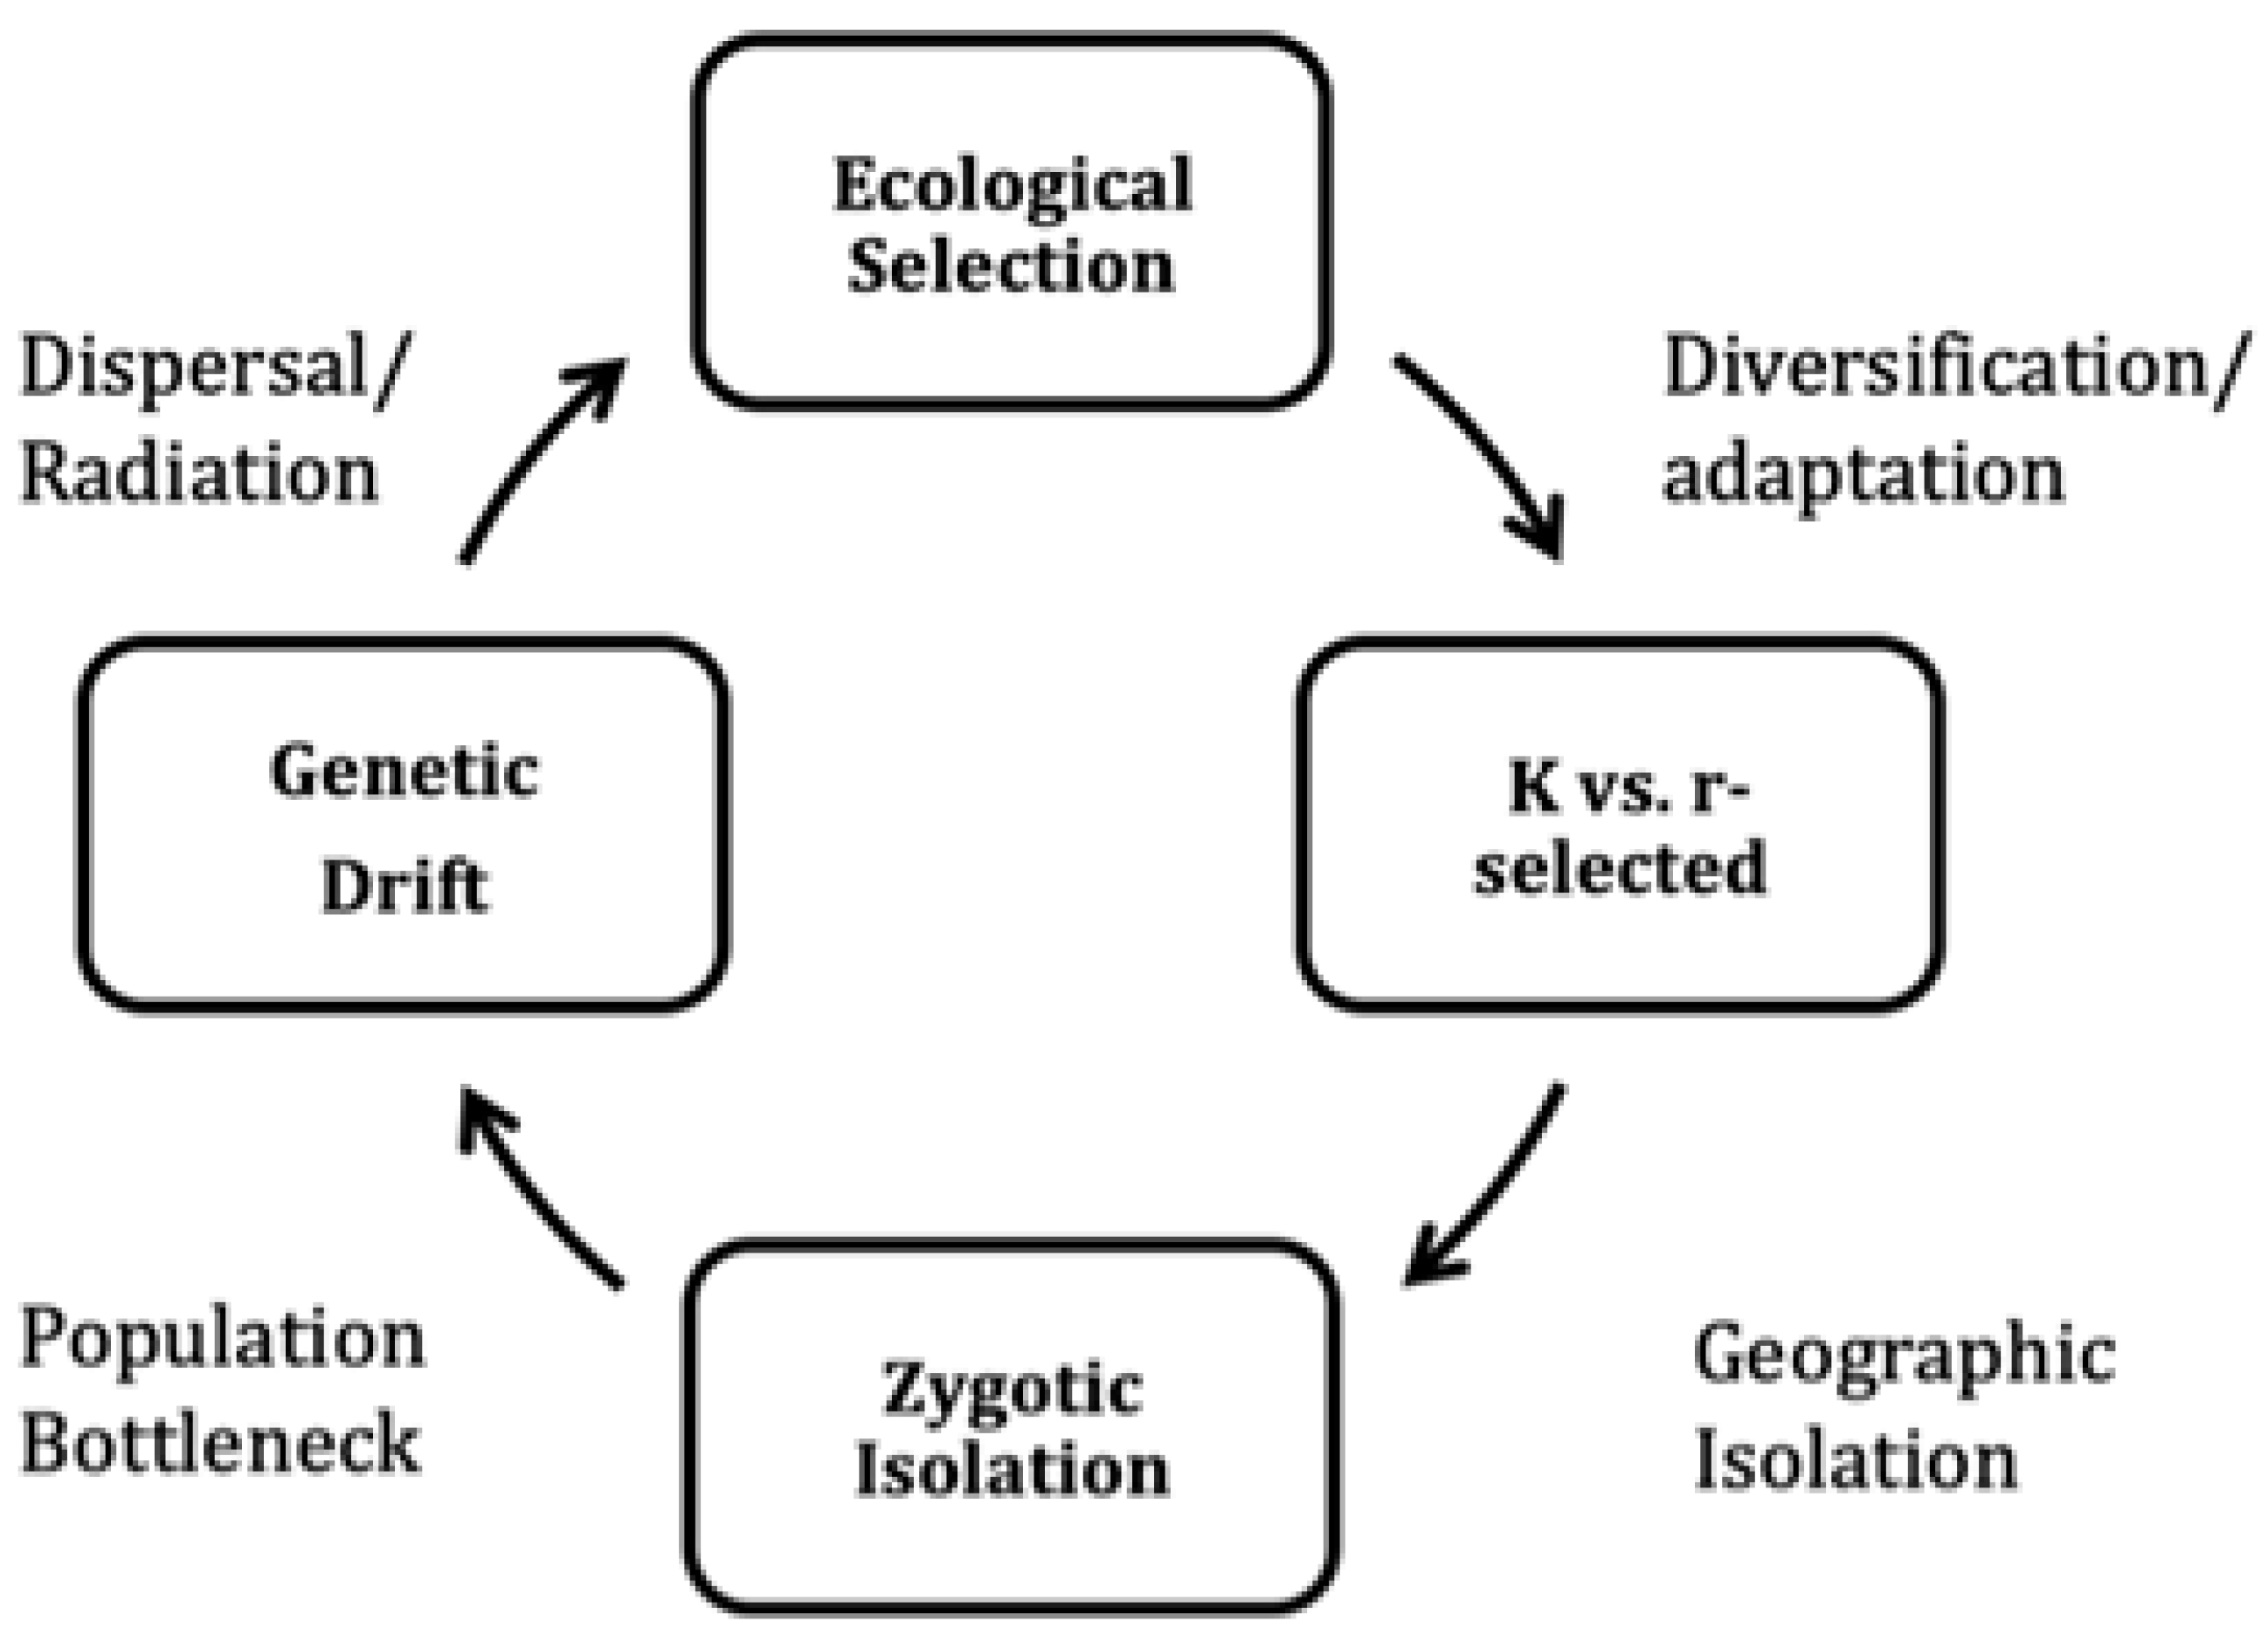
Figure 3.
Schematic representation of the replication-timing program. Black boxes: origin recognition complex (ORC). Gray serrated ovals: MCM helicases. Each stage of the cell cycle is represented (G1, S, G2/M). Note that replication fork density increases to mid S-phase (S2 – S3) before decreasing in late S-phase (S4). The figure depicts the binding of ORC during the G2/M phases of the cell cycle. The chromatin bound ORC recruits the MCM helicase complex in G1 of the following cell division cycle. The fully licensed origins in G1 then recruit a complex of initiation factors that assemble the active replication forks that define S-phase.
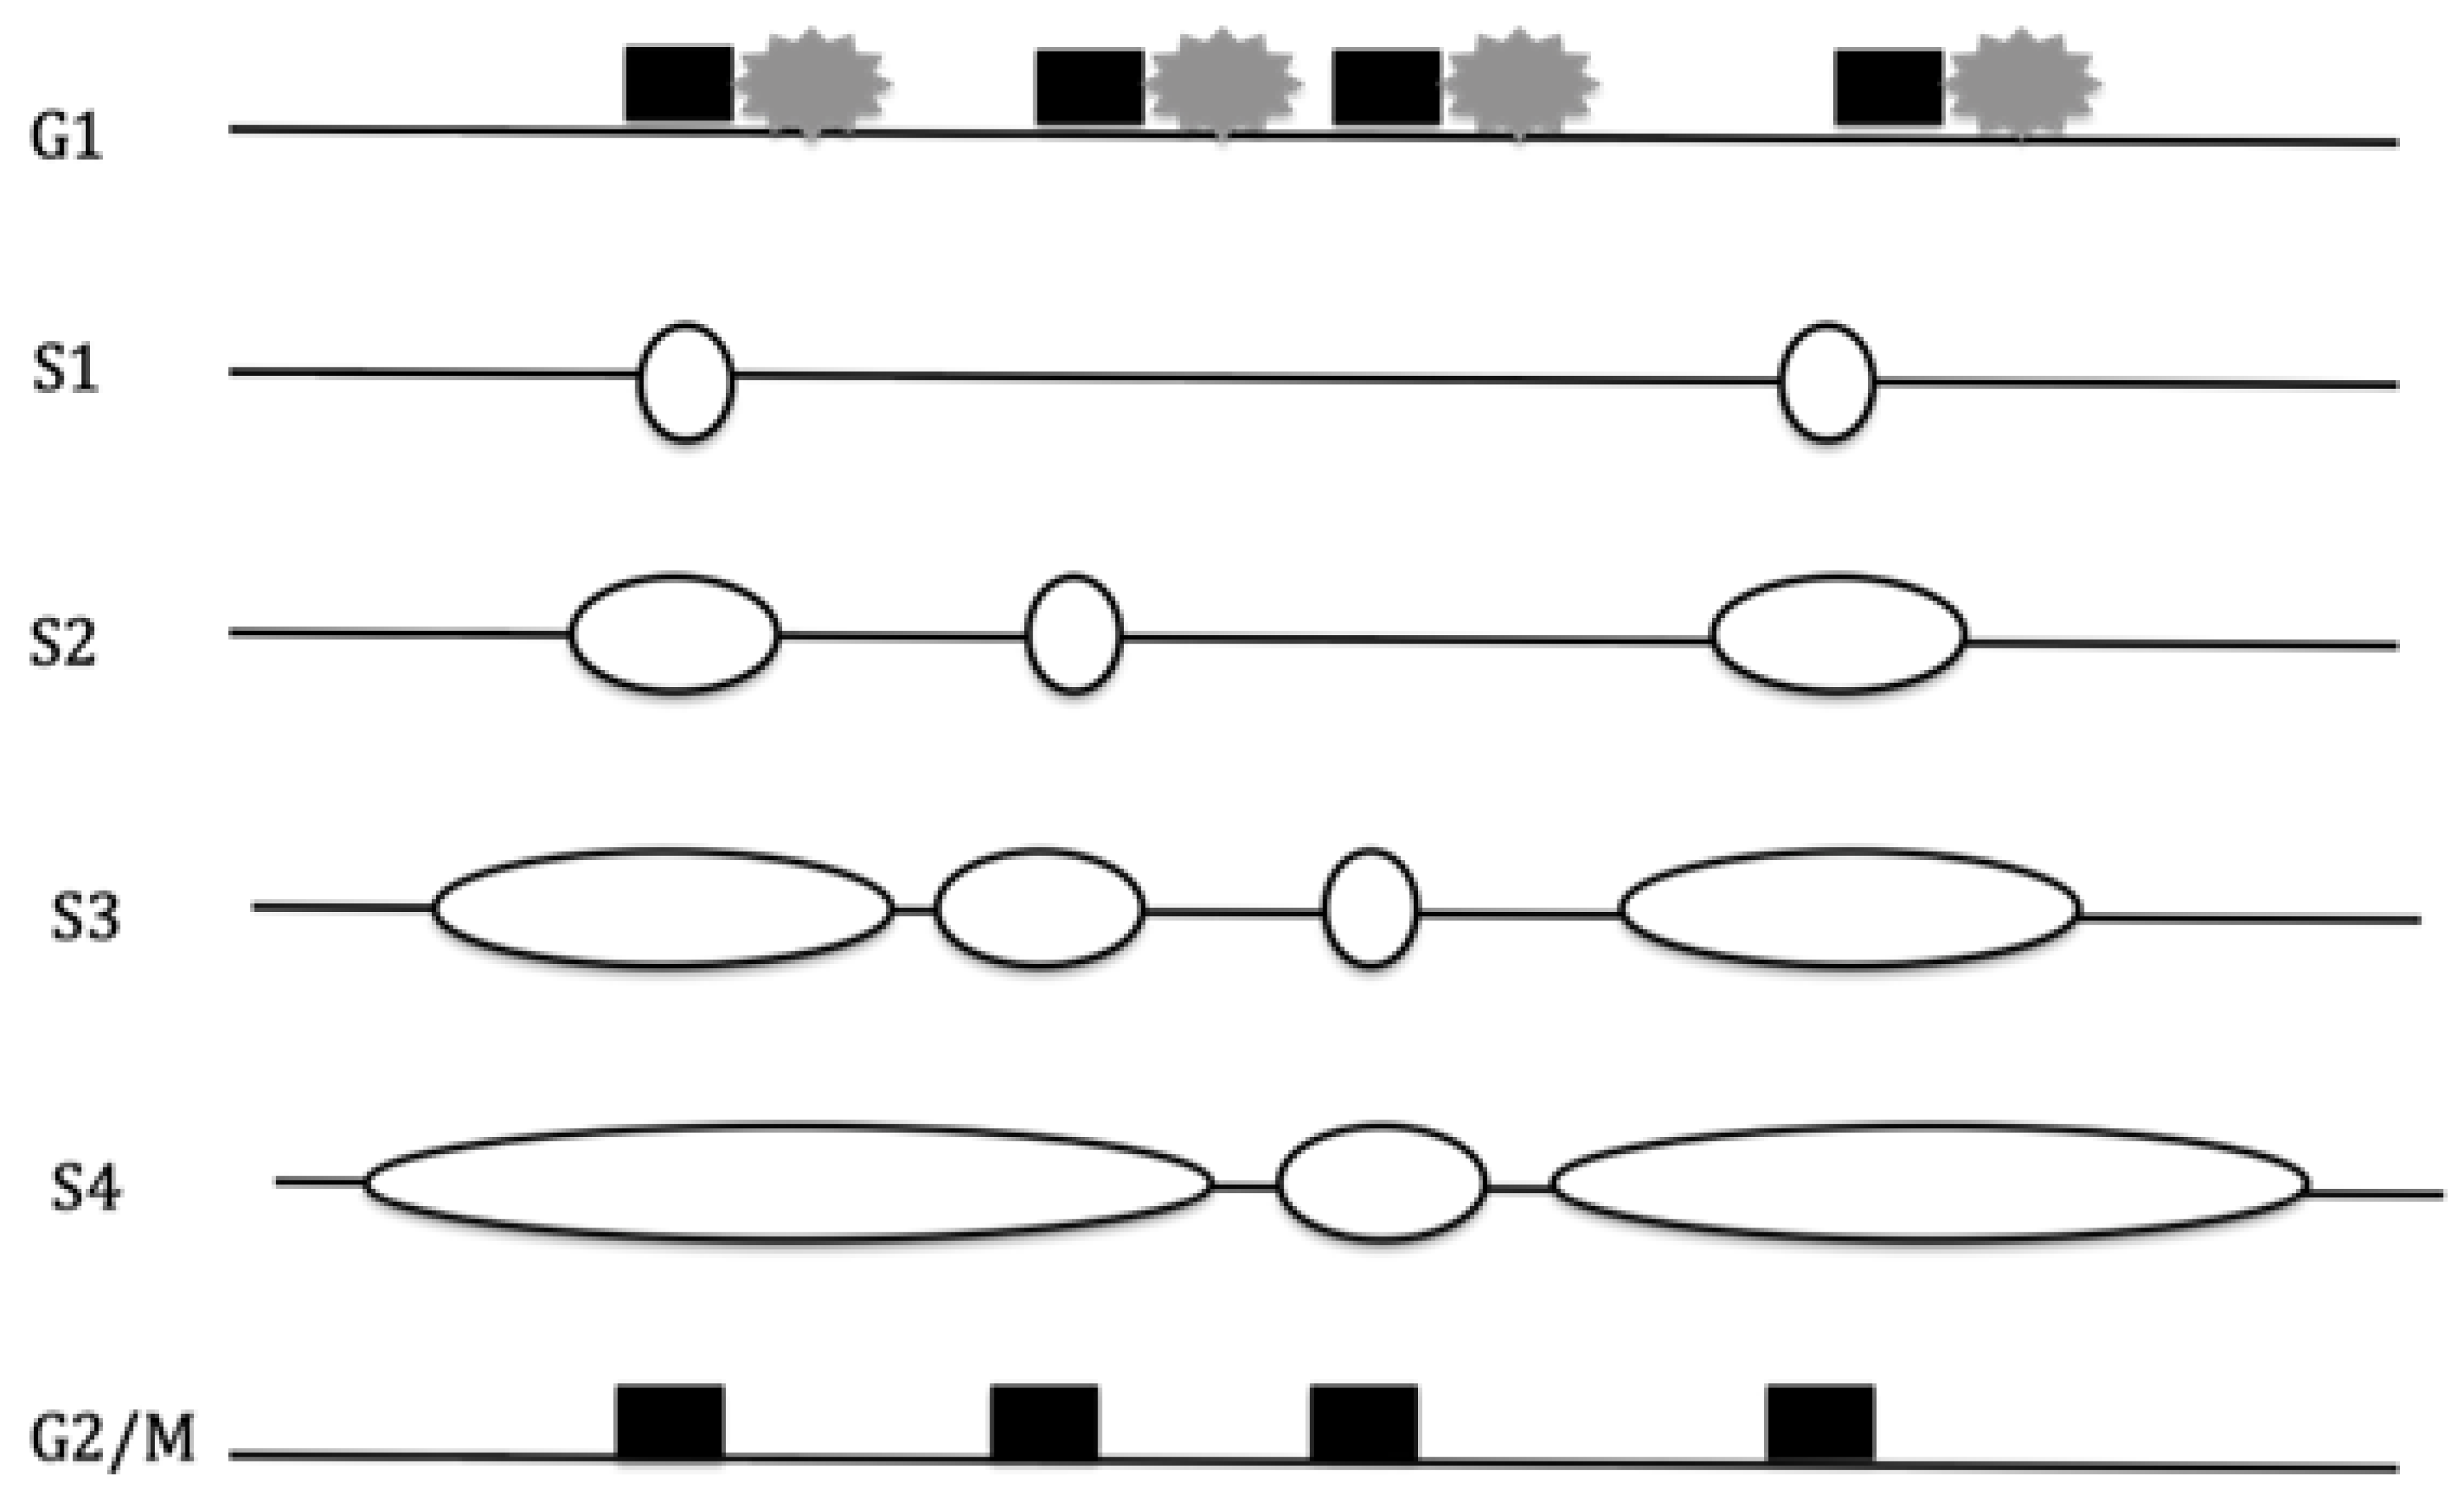
Figure 4.
Schematic representation of intron/exon gene structure. A. Chromosome level organization. Gray boxes: licensed replication origins. TSS: transcription start site. B. Gene level organization. Gray triangles: origins that do not fire during an unperturbed S-phase and are clustered in introns. Figure 4A and B depict the nested structure and coordinated timing of the DNA replication program and gene transcription program (transcriptome): potential DNA replication origins, whether dormant origins or inactive origins, are irregularly spaced along the genome at approximately 15 Kb intervals. Notably, this is approximately the same interval between active origins observed in non-transcribing early stage embryos (prior to the mid-blasula transition). Origins are preferentially located externally to and between genes in part to obviate DNA polymerase-RNA polymerase collisions.
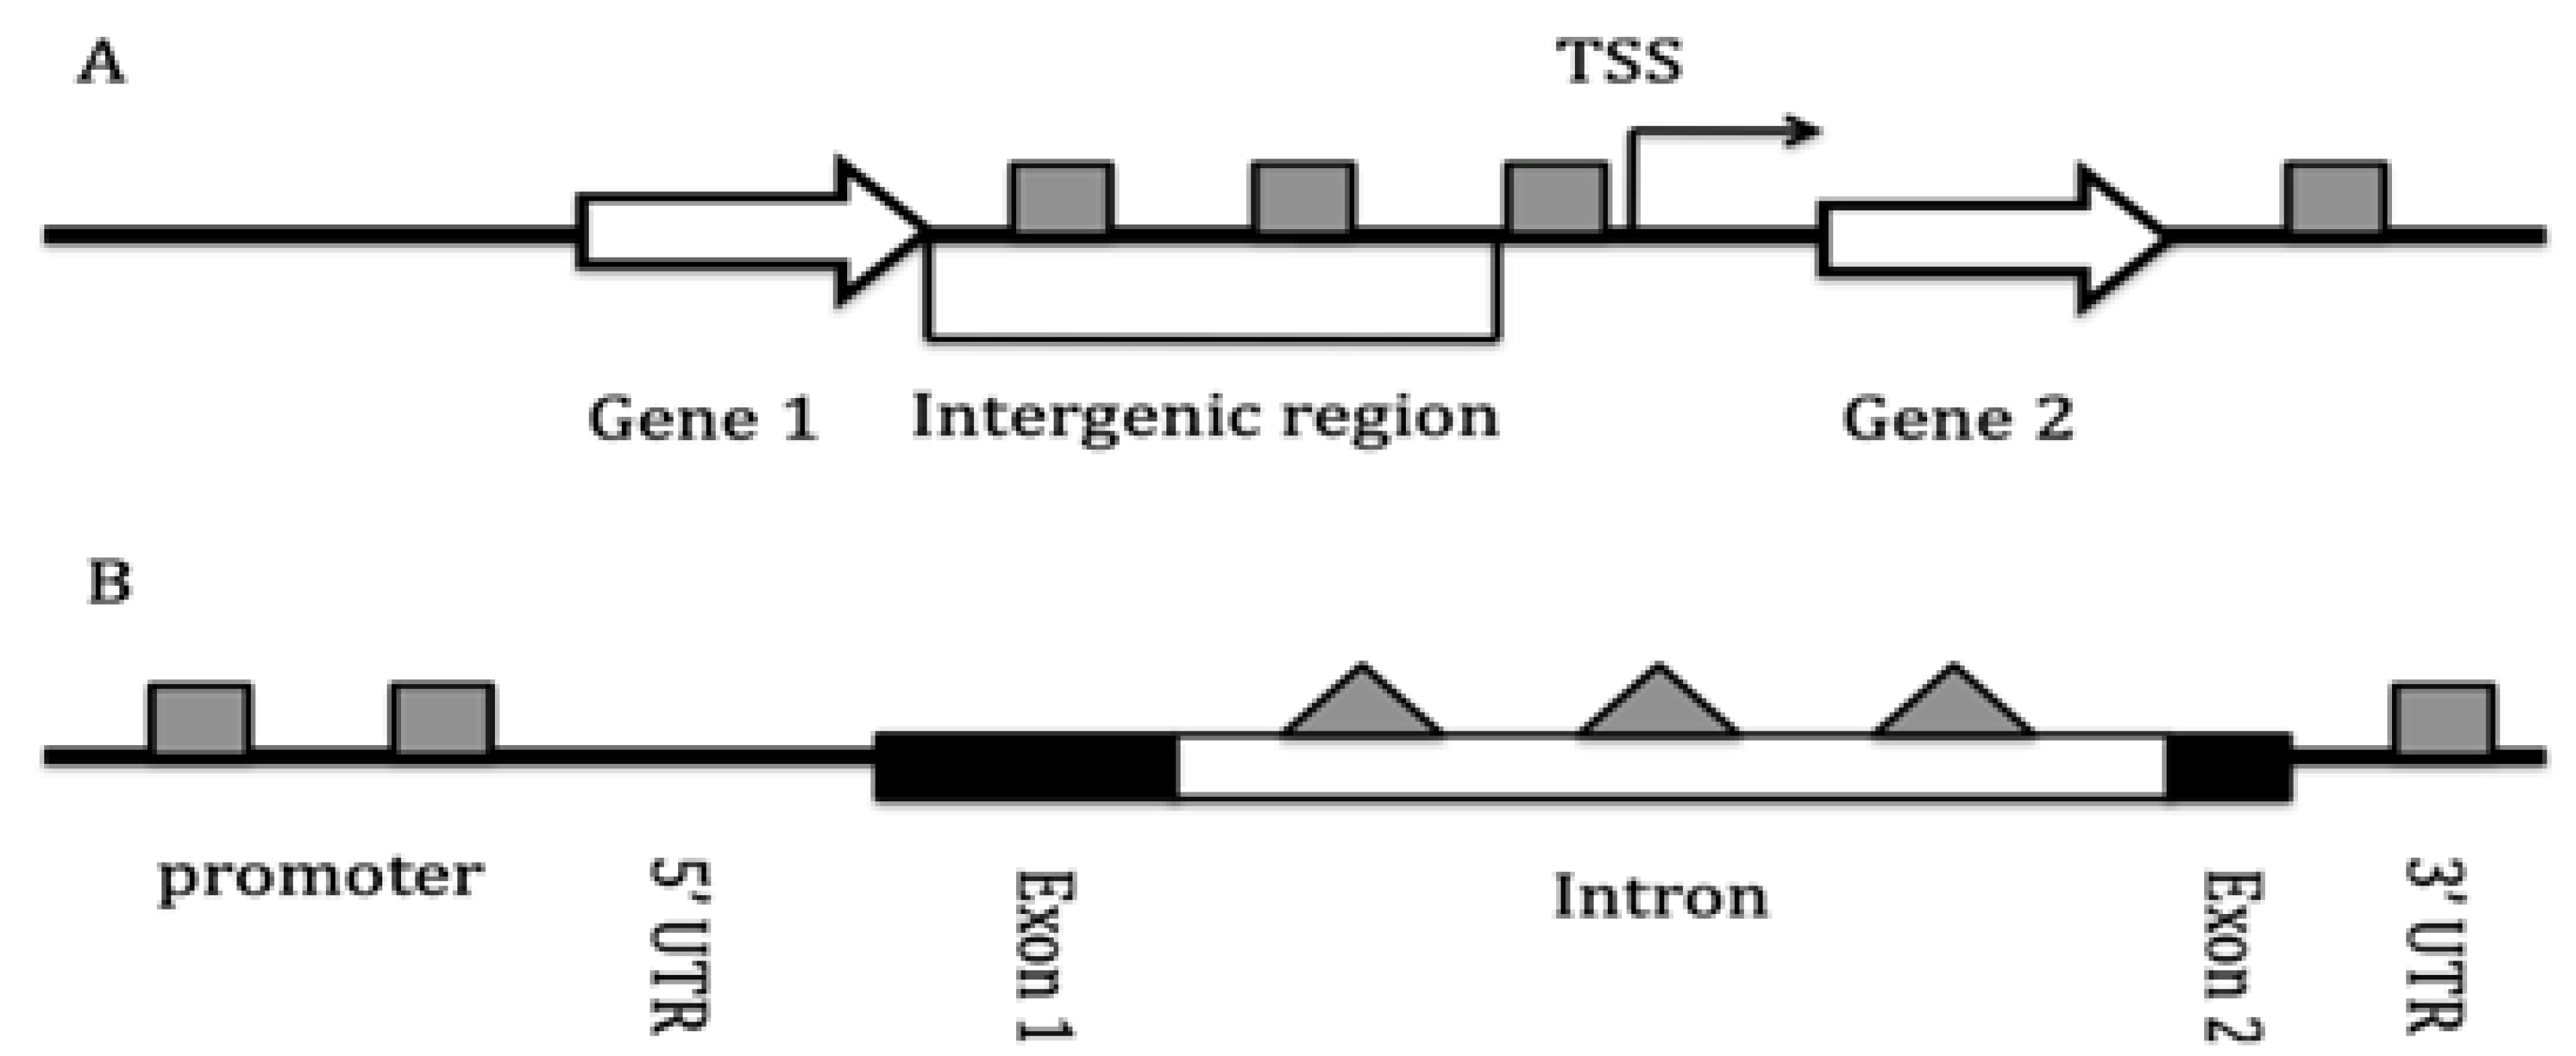
Figure 5.
Chromatin organization, DNA replication timing and the DNA damage detection and repair systems (DDR). HR: homologous recombination DNA repair. NHEJ: non-homologous end-joining DNA repair. Circles: active replication origins. Arrows: origin clusters and spacing in a replication domain. Origin activation induces a cascade/domino effect associated with nearby origins firing stochastically. Crosses: inactivated origins. T-bars: checkpoint mediated origin inactivation. Lightning bolts: DNA damage at replication forks. Efficient, frequently firing origins associate with open euchromatin and fire earlier in S-phase; inefficient, infrequently firing origins tend to associate with compact heterochromatin and fire later in S-phase. Origins firing in early S-phase activate the intra-S checkpoint response (via single strand DNA), which in turn stimulates checkpoint factors (eg. Chk1), inhibiting replication initiation at the weaker, late S-phase origins. Once an origin fires and the DNA duplicated, ORC and MCM helicases are inhibited from re-licensing the replicated origins, such that any given origin fires once and only once each cell division cycle. At mid-S phase the checkpoint is attenuated, thus promoting weaker, late origins to fire. This complex system of chromatin organization, DNA replication timing and DNA repair carefully choreographs S-phase and gene expression, and limits mutation and substitution rates before the cell enters mitosis, which would have potentially lethal effects (mitotic catastrophe).
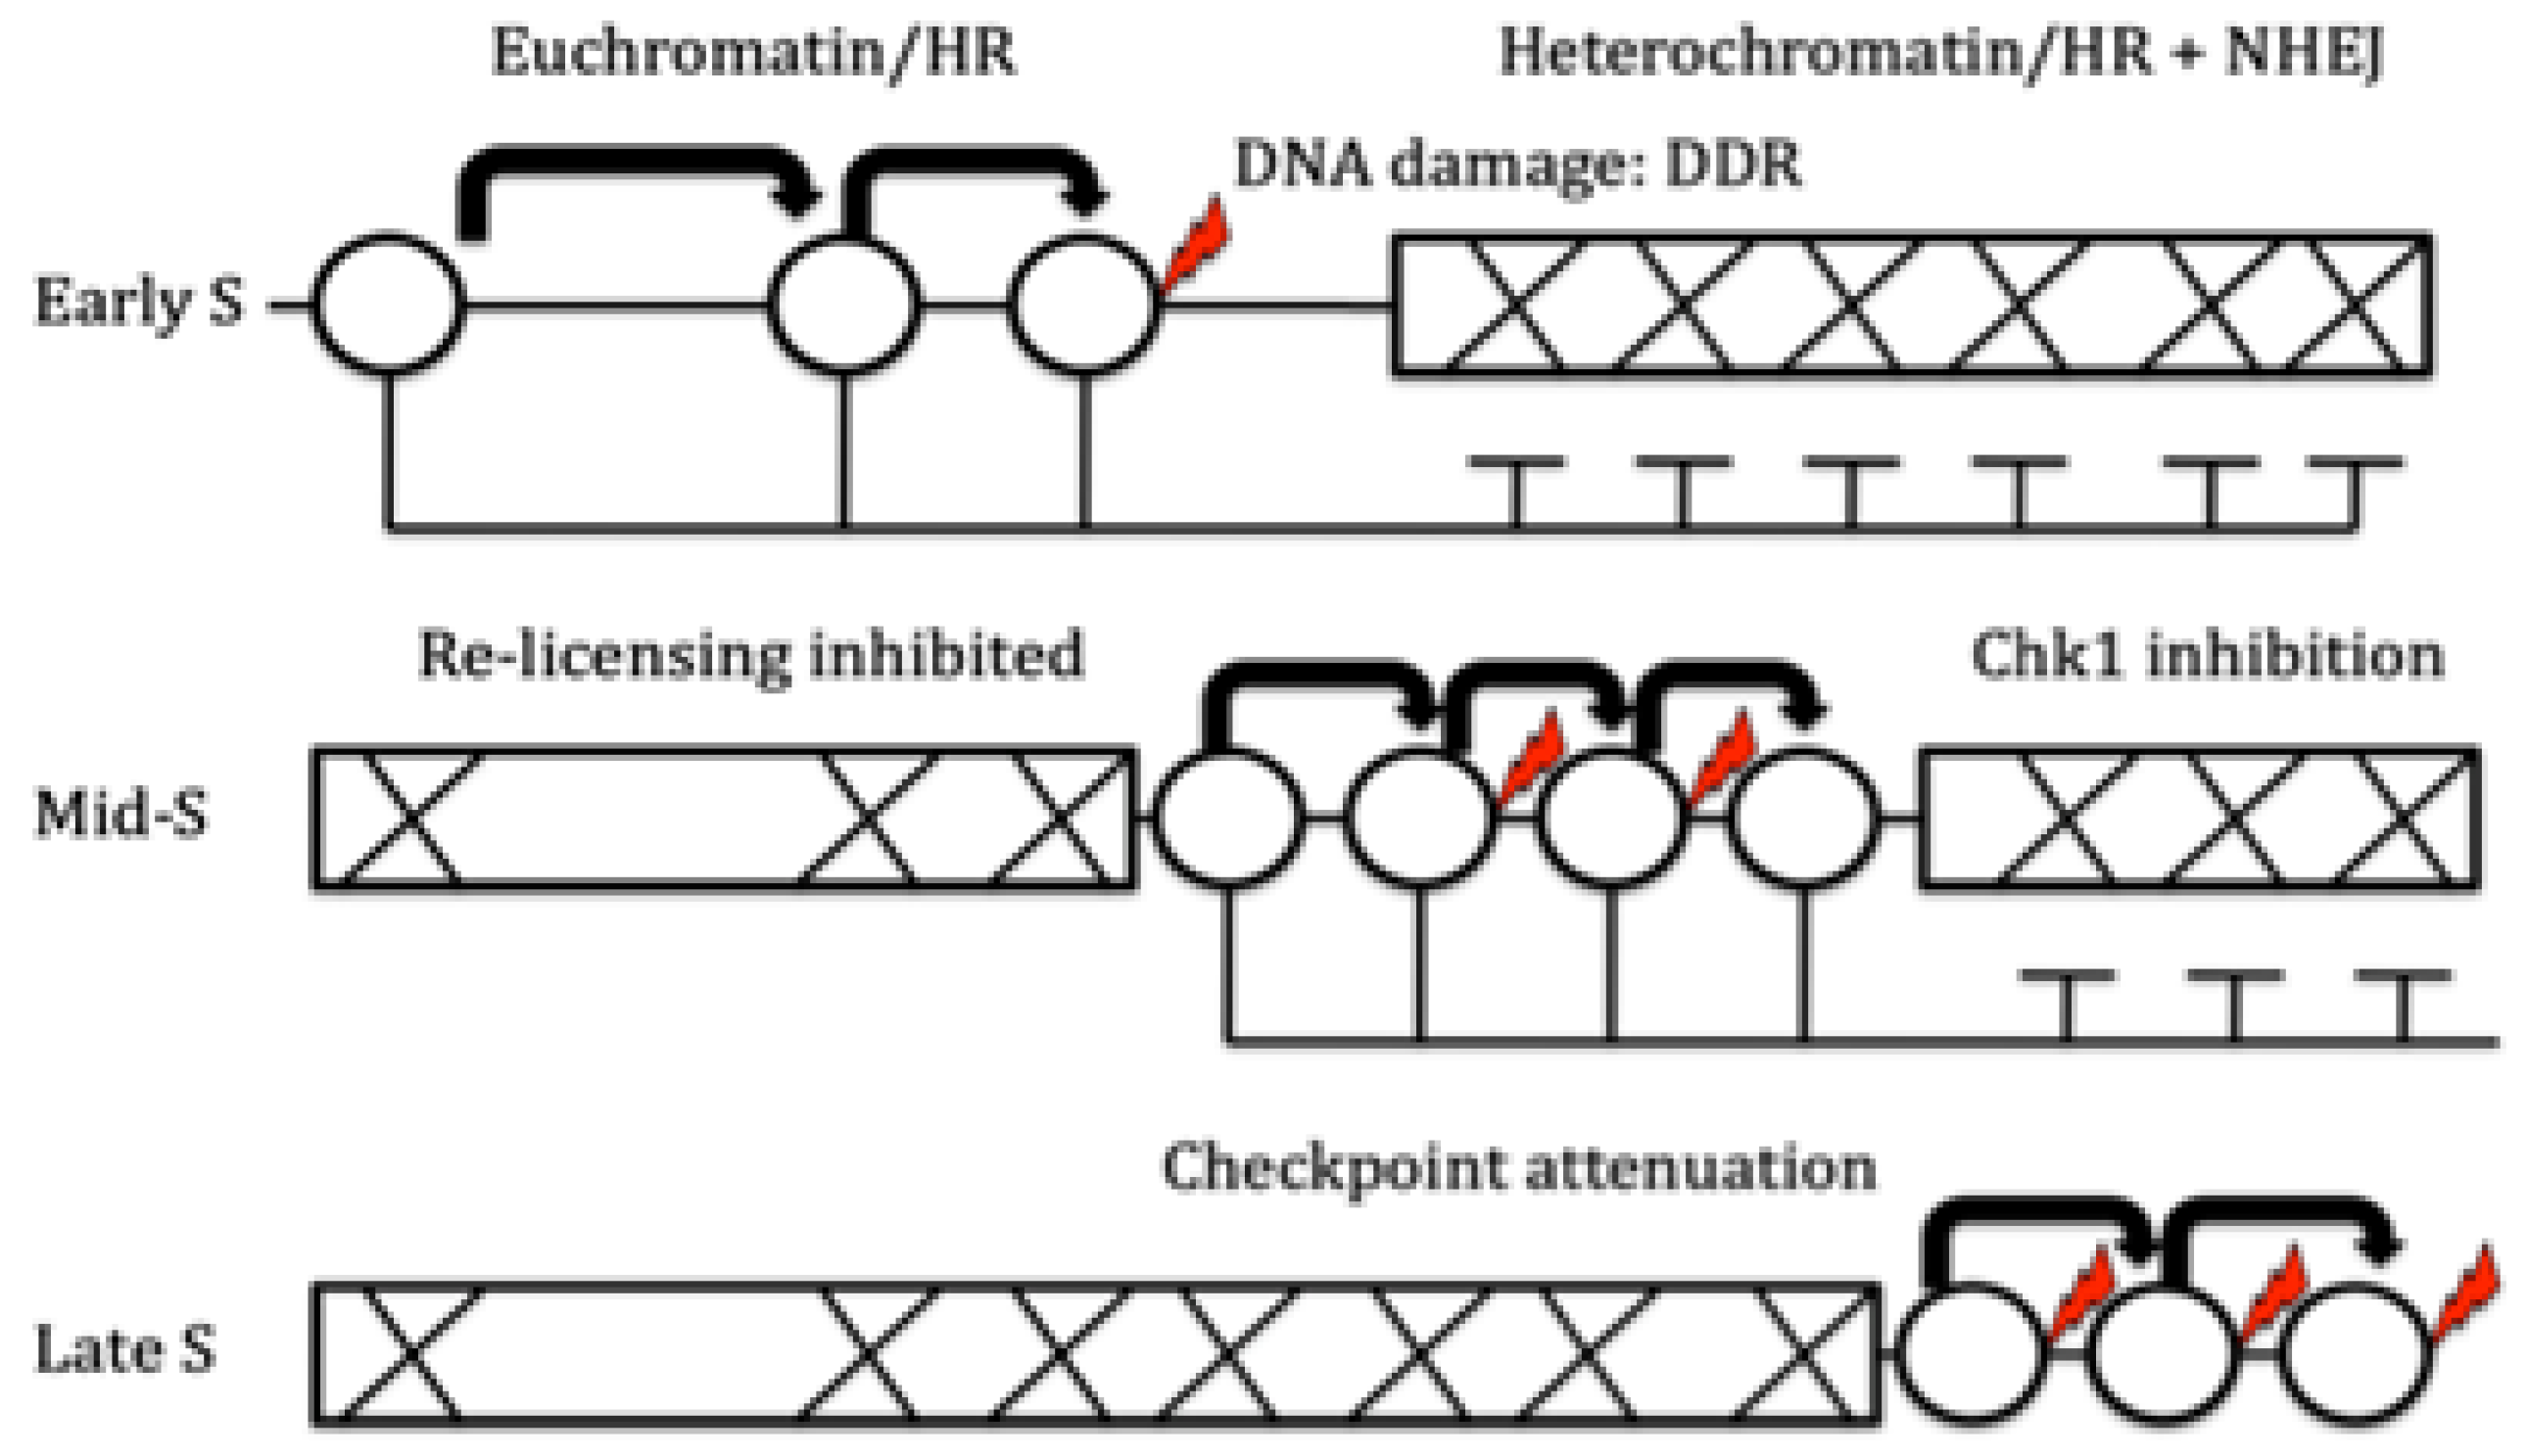
Figure 6.
Illustration of Peto’s paradox (adapted from 156). Y-axis: cancer risk. X-axis: body mass. Red line: observed cancer risk. Black curve: theoretically expected cancer risk. Gray arrows reflect different strengths of the DDR, from weak DDRs that are maladaptive (small observed body size; higher than expected cancer risk) to strong DDRs that are likewise maladaptive (large observed body size and lower than expected cancer risk, but elevated extinction risk). The intersection of the black and red curves indicates the threshold at which DDR efficiency switches from favoring an unstable karyotype (r-strategist) to favoring an increasingly stable karyotype (K-strategist). The ecological selection pressure in this regime therefore favors larger rather than smaller genome sizes: large genomes (higher TE density, CpG density and HC content; see references 181, 182) are fortuitous TE-driven adaptations that enhance the DDRs and, consequently, promote increases in body mass (see references 173 and 174). Transposable elements, rather than purely selfish parasites, act instead as genome commensals and mutualists benefiting from—and proliferating as a result of—the new niches and ecological adaptations TEs made possible for their respective hosts (Cope’s rule: selection for K-strategists with larger genome size, body mass and longer maximum lifespan).
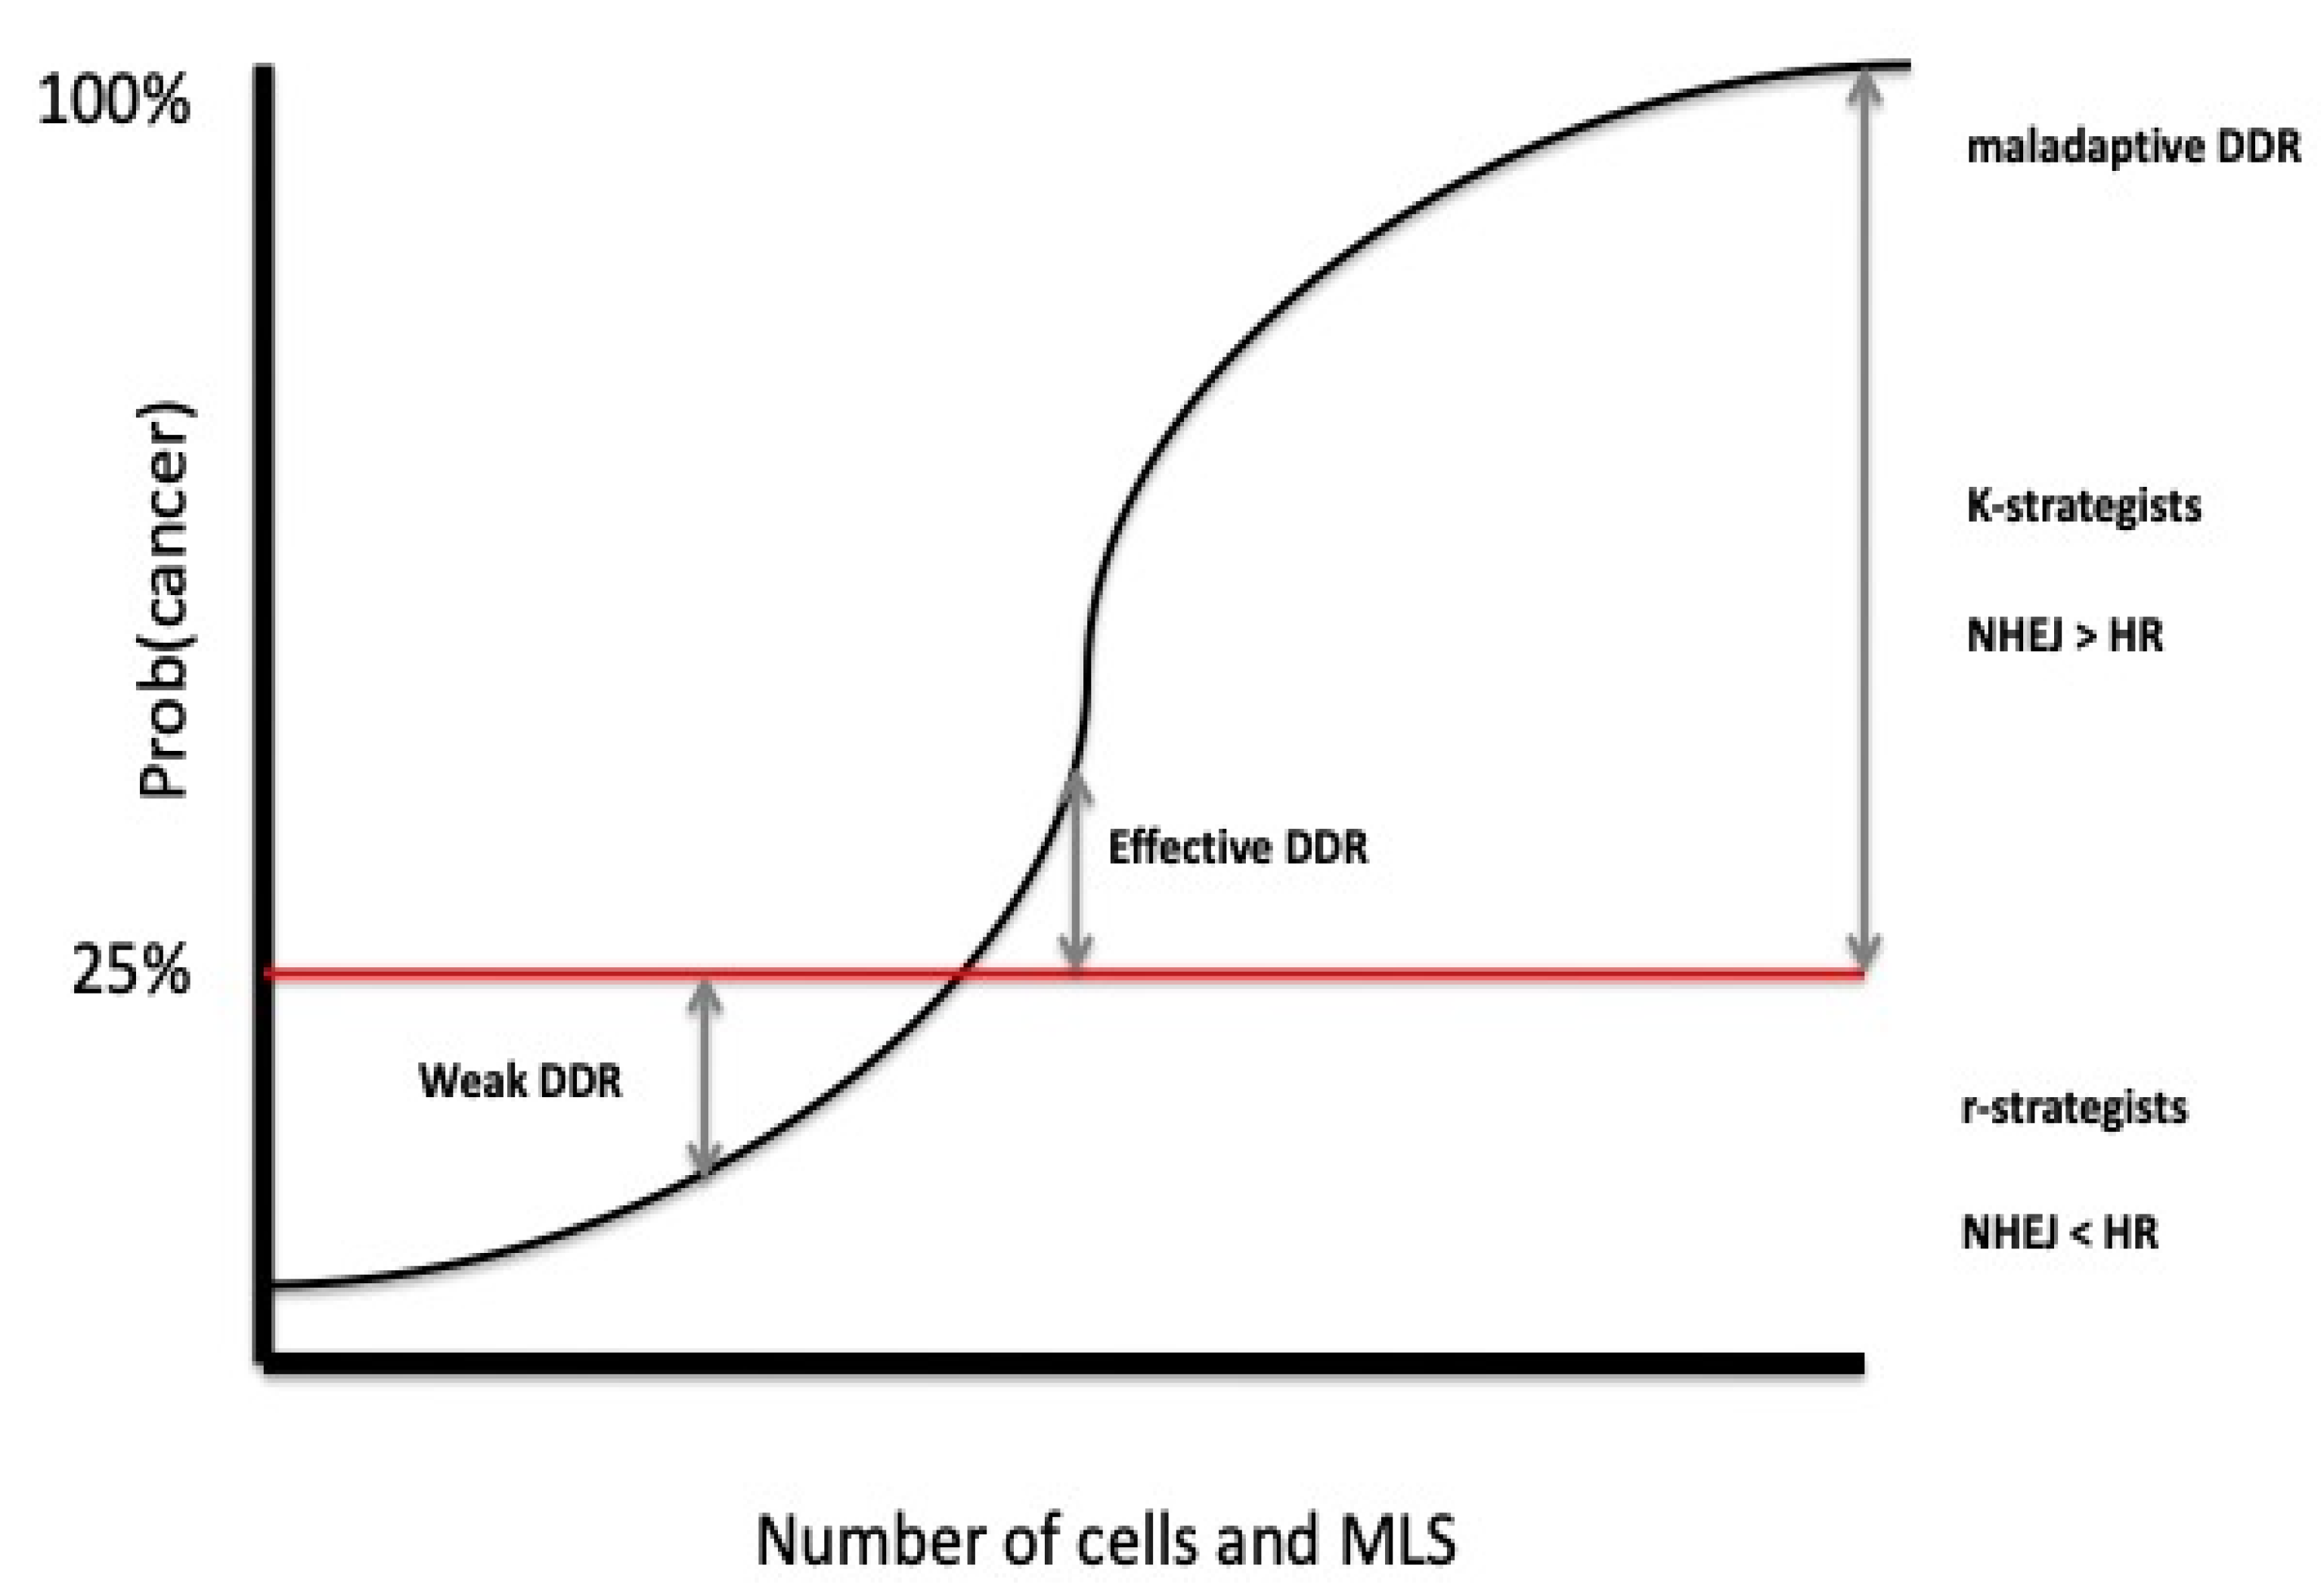

Table 1.
Correlations between mammalian life history traits established using Phylogenetic Generalized Least Squares (PGLS) analysis. MLS: maximum lifespan. SR: species richness. rKD Macro: rate of karyotype evolution (genome wide structural changes: number of chromosomes and number of chromosome arms). rKD Macro reflects the level of karyotype diversity. rKD Micro: rate of sub-chromosomal changes that do not alter the number of chromosomes or the number of chromosome arms. The rKD Macro and rKD Micro data are from Martinez et al [5].
| Adj R2 | P | |
| MLS vs Body Mass (+) | 0.73 | 2 x 10-16 |
| MLS vs C-value (+) | 0,007 | 0,5 |
| SR vs Body Mass (-) | 0.56 | 0.01 |
| MLS vs Synteny (+) | 0.48 | 0.03 |
| Synteny vs SR (-) | 0.18 | 0.1 |
| MLS vs SR (+) | 0.59 | 0.016 |
| rKD Macro vs SR (+) | 0.42 | 3 x 10⁻¹⁰ |
| rKD Micro vs SR (+) | 0.07 | 0.06 |
Table 2.
Association between gestation time and early embryo cell cycle duration. The parentheses indicate
oviparous reproduction.
Table 2.
Association between gestation time and early embryo cell cycle duration. The parentheses indicate
oviparous reproduction.
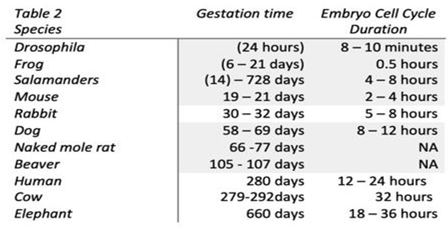 0,5 0,5 |
Disclaimer/Publisher’s Note: The statements, opinions and data contained in all publications are solely those of the individual author(s) and contributor(s) and not of MDPI and/or the editor(s). MDPI and/or the editor(s) disclaim responsibility for any injury to people or property resulting from any ideas, methods, instructions or products referred to in the content. |
© 2025 by the authors. Licensee MDPI, Basel, Switzerland. This article is an open access article distributed under the terms and conditions of the Creative Commons Attribution (CC BY) license (http://creativecommons.org/licenses/by/4.0/).
Copyright: This open access article is published under a Creative Commons CC BY 4.0 license, which permit the free download, distribution, and reuse, provided that the author and preprint are cited in any reuse.


