Submitted:
17 June 2025
Posted:
19 June 2025
You are already at the latest version
Abstract
Fast-charged particles have been used in diagnosis and treatment since the 19th century. Positrons are widely used in medical imaging through positron emission tomography, but their therapeutic potential remains underexplored due to technology limitations associated with the lack of research on their effectiveness against cancer. One way to understand their behavior is by calculating absorbed dose distributions in tissue, which can be safely and realistically done using computational simulations such as the Monte Carlo Method. This study investigates the interaction of a positron beam with brain tissue and also with a tumor within it, through simulations using the TOPAS software. Depth dose profiles and absolute absorbed dose values were obtained in the range of 6-24 MeV. Validation was performed using data from the water phantom with electron beams. The results showed that, at certain depths in brain tissue, the absorbed dose by positrons was higher than that of electrons under the same conditions—ranging from 57% to 463% more. These findings suggest that positrons may offer advantages over conventional electron therapy and contribute to the development of novel therapeutic approaches.
Keywords:
Positron therapy
; Brain tissue
; Tumor
; TOPAS
; Monte Carlo simulation
1. Introduction
The use of ionizing radiation for the treatment of diseases such as cancer dates back to the 1950s [1]. As technological development advanced, improvements in cancer treatment followed as well. Within ionizing radiation, a particular group of particles stands out, known as fast light-charged particles, characterized as "fast" because they approach the speed of light and "light" because they have a mass smaller than that of a proton [2]. These particles include electrons and positrons, and due to their ability to directly ionize the medium, they have many technological applications. One of these is in medicine, particularly in cancer diagnosis and treatment [3].
Electrons and positrons have been used since the 19th century in cancer treatment. Electrons are primarily employed in radiotherapy through the use of beams [1], and in brachytherapy, which involves the use of a source [4]. Both applications are well studied and firmly established, both theoretically and in clinical practice [5]. In turn, Positrons, are used only in diagnostics, being applied in imaging exams such as positron emission tomography computed tomography (PET-CT), where their use involves radioactive sources [6,7]. Although positrons and electrons behave similarly when interacting with matter—with the exception occurring at the end of the positron’s trajectory, where it undergoes annihilation upon encountering an almost stationary electron [2]—positrons are not considered for cancer therapy, neither in beam form nor as a source [8].
Although there are currently several types of particle-based therapies, due to the difficulty and resistance in treatment [9], as well as the high mortality rate of the disease—about 10 million deaths and approximately 20 million new cases annually, according to the World Health Organization—developing new technologies or improving existing therapies remains necessary [10].
Some authors have investigated the effects of positrons and their effectiveness in cancer treatment [8,11,12]. Moadel reported, in both in vitro and in vivo studies conducted in 2003 and 2005, the potential for tumor and metastasis cure through positron-based treatment [11,12]. More recent studies by Hioki and collaborators demonstrated the effectiveness of positrons in causing single, and double, strand DNA breaks [8]. The underutilization of positrons is largely due to the lack of studies regarding their potential in cancer therapy and the safety concerns related to their use. For this reason, dosimetric calculations are essential to support the development of new technologies for their application.
One way to understand how positrons interact with matter is through dose calculation, which aims to observe and determine how the dose is distributed within the medium. This can be done using absolute values or, more commonly, through the calculation of the percentage depth dose (PDD) curve.
Monte Carlo method-based computer simulations are a safe and effective way to obtain reliable estimates of how particles interact within a given medium. This method allows for highly realistic simulations due to its stochastic and probabilistic nature, relying on cross-section calculations derived from experimental data and reference tables used within the scientific community. Currently, there are several simulation codes that offer robust and highly accurate results [13,14,15], providing reference values for theoretical model development and supporting experimental validation. Many works in the literature have employed this method and validated their results [15,16,17,18].
Motivated by this, the present work provides, for the first time, data on absolute dose distribution and PDD for a positron beam incident on a biological target, specifically, material representing brain tissue and a tumor, types of soft tissue, in an energy range between 6 and 24 MeV. The results are obtained through Monte Carlo simulation using the TOPAS software and are compared with simulations performed using electrons, highlighting the dose differences between the two particles.
2. Materials and Methods
In this study, the TOPAS software (Tool for Particle Simulation) (version 3.7.0) was chosen to perform the simulations, taking advantage of its advanced capabilities in radiation physics. TOPAS, in turn, uses version 10.06.p03 of Geant4 (Geometry and Tracking 4), a toolkit for simulating the passage of particles or radiation, which bases its simulations on physical data tables and intrinsic interaction models. These tables and models provide crucial information about material properties and particle interactions with matter and are regularly updated and validated by the toolkit’s developers and organizations responsible for supplying reliable data accepted by the scientific community. Examples include the International Commission on Radiation Units and Measurements (ICRU), the National Institute of Standards and Technology (NIST), and the International Commission on Radiological Protection (ICRP).
For such applications, the use of processors with a higher number of threads is necessary and recommended, as it significantly reduces the time required for each simulation. In this study, the following computer specifications were used:
Intel(R) Xeon(R) Silver 4310T CPU @ 2.30GHz
Thread(s) per core: 1
Core(s) per socket: 10
Socket(s): 2
11th Gen Intel(R) Core(TM) i7-11700 @ 2.50GHz
Thread(s) per core: 2
Core(s) per socket: 8
Socket(s): 1
The simulations included the transport of all secondary particles produced by the interactions of positrons and electrons. A total of 109 particles were simulated in order to ensure high precision, thereby minimizing statistical uncertainties as much as possible.
To calculate the absorbed dose distribution of positrons and electrons, it is necessary to define a well-structured geometry for the phantom. In this study, the phantom was modeled with a cubic geometry, with dimensions of 30 × 30 × 30 cm3, placed inside a parallelepiped filled with vacuum. The cube was positioned so that the beam was directed toward the center of one of its faces. The phantom was divided into 100 bins, each with dimensions of 0.3 × 30 × 30 cm3, to record the amount of absorbed dose from positrons and electrons in each bin using the DoseToMedium scorer. The DoseToMedium scorer provides the absorbed dose in the medium after each simulation.
In the TOPAS model, monoenergetic electron and positron beams were emitted along the Z-direction. To evaluate the behavior of the particles, the distance between the beam and the phantom was set to 100 cm, which is a commonly recommended and used value in the literature, experiments, and simulation studies [19,20,21]. The irradiation field was set to 10 × 10 cm2. The beam configurations used in the simulations are presented in Table (1):
The BeamAngularDistribution parameter defines the angular distribution of the particles in the beam. In this study, it was configured to distribute particles uniformly within a specific geometric area. This area is determined by the BeamAngularCutoffX parameter, which defines the irradiation field size.
2.1. Positrons and Electrons Beams Simulation on Water
For the validation of the methodology, the simulation settings were carefully defined to replicate the parameters used in the experiment, such as source-to-phantom distance, irradiation field size, and phantom material, thus ensuring comparability between the results obtained by both methods. These same parameters were also adjusted for comparison with simulation data available in the literature, including not only the experimental parameters but also the beam configurations.
The need to validate the methodology using electron beams in water arises from the lack of literature data on positron beams incident on any material within the energy range used in this work. In the absence of such data, validation must be performed using particles and media that are well-documented in the literature. This scarcity is partly due to the technological difficulty in producing positron beams at energies used in radiotherapy, and partly due to the limited number of studies exploring their potential in cancer treatment [8].
Thus, for comparison with experimental data from the literature (EL), three beams with different energies were used: 6, 9, and 12 MeV. For comparison with simulation data from the literature (SL), five beams with different energy values were used: 6, 9, 12, 20, and 24 MeV. The phantom composition used was the predefined material G4_WATER, which represents water. The choice of the energy range for both procedures was based on the typical energy levels used in radiotherapy [22], as well as the availability of data in the literature.
2.2. Positrons and Electrons Beams Simulation on Brain
After the validation of the methodology, positron beams with energies of 6, 9, 12, 20, and 24 MeV were simulated, and both the PDD and the absolute absorbed dose in each bin were obtained in order to generate data on the behavior of positrons in biological tissue. This is particularly important given the lack of literature data on positrons in this type of tissue and within this energy range. The phantom content used was brain tissue, representing the brain, with material composition data taken from ICRU Report 44, as shown in Table (2). Subsequently, electron beams with the same energies were simulated and the same quantities were calculated to enable a comparison of the behavior of both particles.
2.3. Positrons and Electrons Beams Simulation on Tumor
A simulation of a tumor within the brain was also performed, using two geometries. For the brain, the configuration of a cube with dimensions 30 × 30 × 30 cm3 was maintained, containing the same material described in the previous subsections. Inside the brain phantom, a cube with dimensions of 3 × 3 × 3 cm3 was inserted, located 2 cm from the front face of the brain and centered along the x and y axes. The material chosen for its composition was adipose tissue, which is predefined in the software as ADIPOSE_TISSUE. The distance between the brain phantom and the beam was kept constant, and the irradiation field used was 5 × 5 cm2, which implies a configuration of the parameter BeamAngularCutoffX and Y = 1.4320 deg. A representation of the described geometry can be seen in Figure (1):
The tumor was divided into 200 bins to account for the dose distribution along the depth, and the total absorbed dose within the tumor volume was also obtained for both positrons and electrons, in order to compare the behavior of both particles.
3. Results
3.1. PDD Positrons and Electrons Beams Simulation on Water
In the simulation performed with the electron beam in water, the resulting curve is shown in Figure (2). When comparing the results of this work (SW) with the experimental PDD data obtained from the literature (EL), very similar behavior and well-fitted curves can be observed. It is noticeable that for the 6 MeV energy, the absorbed dose distribution reaches its maximum near the surface, while for the 9 and 12 MeV energies, the distribution is more gradual. These behaviors are expected and confirm that the methodology used is appropriate and valid for reproduction in other media, and can also be used to study the behavior of positrons.
In the simulation performed to compare the results obtained in this work (SW) with the electron simulation data available in the literature (SL) for electrons incident on water, it is possible to observe, through Figure (3), the similarity in behavior and excellent fit across all simulated energies.
The similarity in behavior with the results from Figure (2) for energies of 6, 9, and 12 MeV is also evident, with the maximum values of normalized dose remaining consistent, as well as the depths corresponding to the minimum PDD. For the energies of 20 and 24 MeV, the maximum PDD remains approximately at the initial 6 cm, indicating that the highest amount of absorbed dose is concentrated within this depth range, while the minimum PDD occurs at approximately 10 and 12 cm, respectively. When observing the behavior across all energies, it is noticeable that at higher energies, the maximum PDD is sustained over a broader range of depths, in addition to presenting less steep declines beyond this region.
Next, in order to compare the behavior between positrons and electrons in the same material, the simulation was carried out using a positron beam, for the same medium used previously, composed of water, and the results obtained can be seen in Figures (4):
It can be seen from the PDD that the dose distribution of both particles in the same medium shows similar behavior for equal energies, and presents a shape that follows the same pattern as the results reported in the literature. The absorbed dose distribution is concentrated at the same depth for both particles with corresponding energies. It is also noticeable that for energies of 20 and 24 MeV, the PDD of both particles exhibits an extended region of maximum dose, rather than a single point, and in the case of positrons, it decreases slightly more in the 6 to 8cm interval compared to electrons, indicating that the percentage of absorbed dose in that region is reduced.
Individual dose curves for each energy are presented in Figure (5), where the differences in the positron and electron dose distributions can be visualized.
3.2. PDD Positrons and Electrons Beams Simulation on Brain Tissue
The results obtained in this work for positron and electron beams incident on brain tissue can be seen in Figure (6):
As observed in the results and reports obtained in the literature for behavior in water, both particles incident on brain tissue show similar patterns, although similar, some small differences in the dose distribution along the depths between positrons and electrons, as can be seen at 20 MeV, indicating that a more detailed investigation may be warranted. For this purpose, the PDD comparison was performed at individual energies and is presented in Figure (7):
From the PDD evaluation, although the curves are largely similar, it is observed that, along the depth, the percentage of absorbed dose is sometimes lower at the beginning of the path and grows slightly less compared to electrons. For instance, at 6 MeV, the positron’s maximum percentage dose occurs a few centimeters earlier than that of the electron. In the cases of 20 and 24 MeV, the absorbed dose percentage in the first 5 cm is higher for electrons than for positrons.
Although such trends can be inferred from the graph, this analysis alone is not sufficient to determine whether the total absorbed dose is greater for one particle than the other, since the PDD represents a quantity normalized by the maximum absorbed dose value for each particle in the studied medium. Therefore, it was necessary to examine the absorbed dose in absolute values throughout each bin. These values can be found in Appendix A.1 of this article.
Upon analyzing the results, a relevant difference in the absorbed dose between the two particles was observed, and this analysis is presented in Table (3):
From the calculation of the average percentage difference, it is possible to observe that, for the energy of 6 MeV, the absorbed dose of positrons in absolute values is approximately 460% higher than that of electrons in the range from 3 to 21.3 cm, considering point-by-point comparisons at the same depth, and about 300% higher between 21.6 and 29.7 cm. At 9 MeV, this difference ranges from approximately 285% to 160%, depending on the depth. For energies of 12, 20, and 24 MeV, the difference gradually decreases, yet remains from 164% to 56% higher than electrons, respectively, throughout the phantom. This demonstrates a significant difference between the two particles at specific depths within the same energy range, indicating a greater efficiency of positrons in depositing energy compared to electrons, depending on the material and its depth.
It is important to note that the results presented in this work have statistical uncertainties of less than 1%.
3.3. PDD Positrons e Electrons Beams Simulation on Tumor
A PPD obtida para pósitrons e elétrons foi obtida e pode ser vista na Figura (8):
It can be observed from Figure (8) that, for an energy of 6 MeV, in the PDD curve, the maximum absorbed dose (100%) occurs at the beginning of the tumor at 0.015 cm, and 90% of the maximum dose is reached at a depth of approximately 0.1 cm for positrons, while for electrons the same percentage is found at 0.12 cm. For an energy of 9 MeV, 90% of the maximum dose occurs at 0.4 cm for positrons and at 0.645 cm for electrons. At 12 MeV, the same percentage is reached at 1.035 cm for positrons and at 1.32 cm for electrons. For 20 MeV, it is found at 2.4 cm for positrons and at 2.835 cm for electrons. At 24 MeV, 90% of the maximum dose reaches 3 cm, and for electrons, this same distance receives 95% of the maximum dose. The absolute values of absorbed dose representing the PDD between 90% and 100%—which correspond to the maximum dose values—are presented in Table (4) for positrons and in Table (5) for electrons.
Figure (9) shows the PDD curves for positrons and electrons at energies of 6, 9, 12, 20, and 24 MeV separately.
The results indicate that, according to the configurations selected in this study for the tumor, with the aim of avoiding exposure to healthy tissues, the recommended energies among those evaluated—both for positrons and electrons—would be 6 and 9 MeV. This is because, at 12 MeV, approximately 40% of the maximum dose reaches the end of the tumor depth, while at 20 and 24 MeV, about 90% of the maximum dose is still present at that same depth.
3.4. Absorbed Dose in the Tumor Volume
The total absorbed dose for the energies of 6, 9, 12, 20, and 24 MeV was calculated and is presented in Table (6):
Based on these values, it is possible to compare the total absorbed doses in the irradiated volume for both particles at different energies. It can be observed that, for the calculated energies, the absorbed doses for positrons and electrons do not differ by orders of magnitude, and the differences between electrons and positrons for the energies of 6, 9, 12, 20, and 24 MeV are, respectively, 14.63%, 13.86%, 10.23%, 7.60%, and 6.28%.
4. Discussion
This study aimed to calculate the PDD of positrons in biological tissue targets, specifically brain tissue and a tumor region within the brain, through Monte Carlo simulation using TOPAS software. Due to the absence of data on positron beams in radiotherapy energy ranges for various tissues, the methodology used in this work was necessary to validate it. For that purpose, a water phantom with electron beams was used, because this is a well-documented medium and particle in the literature. The simulated data were validated against experimental results reported in the literature and also compared with published simulation results. The outcomes from this validation demonstrated that the data obtained in this study show good agreement with those reported in the literature, confirming that the methodology is appropriate and can be reproduced for positron studies.
The PDD of both particles was compared in the same medium to verify their behavior, and it was possible to observe similarities, such as the shape and dose distribution, which were concentrated at the same depths for both particles.
To assess the behavior of positrons incident on brain tissue, both the PDD and the absolute absorbed dose values along each bin were calculated. An electron beam was also simulated in the same medium and compared with positrons. This assessment made it possible to observe some similarities, such as the shape of the curve and the location of the PDD minimum occurring at the same depth for equivalent energies. However, some discrepancies were also observed in the normalized PDD. This led to a more detailed investigation of the dose profile, and for that, the absolute dose distribution along each bin was studied. When calculating the average percentage error of these values, it was observed that positrons have approximately 460% higher absorbed dose than electrons at certain depths and, although this difference decreases with increasing simulated energy, it still remains approximately 56% higher than that of electrons.
For the simulation of a tumor located within the brain, the PDD, absolute absorbed dose values, and total absorbed dose within the tumor volume were obtained for both positrons and electrons. From the PDD, it can be observed that for the tumor simulated in this study, the recommended beam treatment energies would be 6 and 9 MeV, since at higher energies, approximately 90% of the dose is still being delivered within 3 cm, the full length of the tumor, thus reaching brain tissue. When analyzing the total absorbed dose within the tumor volume, it was observed that electrons deliver a slightly higher absorbed dose than positrons, with values in the same order of magnitude and a difference not exceeding 15%. This indicates that although within the tumor volume electrons provide a slightly higher absorbed dose than positrons, when considering the absorbed dose in the brain, the value is significantly higher for electrons. This suggests that depending on the tumor location, the use of positrons may be more advantageous.
The result showing that the absorbed dose of positrons is greater than electrons in brain tissue can be attributed to the exchange effect. This is because positrons can lose all their energy in a single collision, while electrons can only lose up to half [2,24].
The exchange effect means that incident electrons can only transfer up to half of their energy when colliding with electrons in the medium. For positrons, however, since this effect does not occur, they can lose all of their energy in a single collision. Another consequence is the extra term from the exchange effect in the cross-section for electrons, which leads to a greater angular deviation in the particle’s path, resulting in more dispersed trajectories. Positrons, on the other hand, have a less scattered path because their cross-section is smaller due to the absence of this term. This effect was observed in the simulations of this work, which included the StepCount scorer. It was seen that there were many more interactions for bins where the absorbed dose of positrons was greater than that of incident electrons, whose interactions in the same bins were much lower.
Another property worth noting is the annihilation process, where positrons generate two 0.511 MeV photons that may interact in the desired irradiation region. This property requires further investigation, and better strategies to control this radiation can be implemented, such as the insertion of magnetic fields to verify their effects on the dose distribution as well as on the particle behavior. Although there are current technological limitations in the development of high-energy positron beams, the results obtained in this work indicate that positrons deserve more attention, and further exploratory studies are needed to evaluate their use, whether by beam or source, especially considering that depending on the depth, they present higher absorbed dose than electrons.
This observation is of great importance because, for the same energy, positrons are capable of delivering a higher absorbed dose than electrons. To achieve the same dose using electrons, it would be necessary to change their energy, which would consequently alter other behavioral conditions, such as the depth of the maximum dose. The main advantage of this finding is to reach, as much as possible, only the target region, thereby avoiding unnecessary exposure to healthy tissues, a situation that arises when using higher energies, as can be seen through the PDD.
Author Contributions
A.O.A: Conceptualization, Data curation, Formal analysis, Investigation, Methodology, Software, Validation, Visualization, Writing - original draft. M.Y.B: Conceptualization, Funding acquisition, Methodology, Resources, Supervision, Writing - review & editing. All authors have read and agreed to the published version of the manuscript.
Funding
Financial support from Conselho Nacional de Desenvolvimento Científico e Tecnolgico ´ (CNPq) and FAPEMIG (Ref: BPD-00115- 22) is acknowledged.
Data Availability Statement
Main data are reported in the article and its appendix, while extra information can be supplied upon reasonable request.
Conflicts of Interest
The authors declare no conflicts of interest. The funders had no role in the design of the study; in the collection, analyses, or interpretation of data; in the writing of the manuscript; or in the decision to publish the results.
Appendix A
Appendix A.1
This appendix contains data regarding the absolute absorbed dose values for positron and electron beams incident on the brain and their respective depths.

Table A1.
Absorbed dose data in the brain along 100 bins for positrons and electrons at 6, 9, and 12 MeV.
Table A1.
Absorbed dose data in the brain along 100 bins for positrons and electrons at 6, 9, and 12 MeV.
| Bin [cm] | 6 MeV | 9 MeV | 12 MeV | |||
|---|---|---|---|---|---|---|
| Positron | Electron | Positron | Electron | Positron | Electron | |
| 0.3 | 3.63E-04 | 3.61E-04 | 3.45E-04 | 3.48E-04 | 3.41E-04 | 3.46E-04 |
| 0.6 | 4.02E-04 | 3.93E-04 | 3.59E-04 | 3.63E-04 | 3.49E-04 | 3.56E-04 |
| 0.9 | 4.48E-04 | 4.32E-04 | 3.75E-04 | 3.77E-04 | 3.57E-04 | 3.65E-04 |
| 1.2 | 4.79E-04 | 4.67E-04 | 3.95E-04 | 3.93E-04 | 3.66E-04 | 3.73E-04 |
| 1.5 | 4.63E-04 | 4.71E-04 | 4.18E-04 | 4.12E-04 | 3.75E-04 | 3.82E-04 |
| 1.8 | 3.88E-04 | 4.15E-04 | 4.39E-04 | 4.32E-04 | 3.87E-04 | 3.92E-04 |
| 2.1 | 2.62E-04 | 2.96E-04 | 4.50E-04 | 4.46E-04 | 4.00E-04 | 4.02E-04 |
| 2.4 | 1.24E-04 | 1.46E-04 | 4.42E-04 | 4.47E-04 | 4.14E-04 | 4.13E-04 |
| 2.7 | 3.41E-05 | 3.61E-05 | 4.09E-04 | 4.26E-04 | 4.24E-04 | 4.23E-04 |
| 3 | 1.06E-05 | 2.98E-06 | 3.48E-04 | 3.75E-04 | 4.29E-04 | 4.30E-04 |
| 3.3 | 8.69E-06 | 9.63E-07 | 2.64E-04 | 2.94E-04 | 4.24E-04 | 4.29E-04 |
| 3.6 | 8.04E-06 | 9.26E-07 | 1.68E-04 | 1.93E-04 | 4.06E-04 | 4.18E-04 |
| 3.9 | 7.51E-06 | 8.98E-07 | 8.30E-05 | 9.65E-05 | 3.73E-04 | 3.92E-04 |
| 4.2 | 7.06E-06 | 8.71E-07 | 3.09E-05 | 3.11E-05 | 3.25E-04 | 3.49E-04 |
| 4.5 | 6.67E-06 | 8.47E-07 | 1.27E-05 | 5.97E-06 | 2.62E-04 | 2.88E-04 |
| 4.8 | 6.32E-06 | 8.25E-07 | 9.76E-06 | 2.03E-06 | 1.91E-04 | 2.15E-04 |
| 5.1 | 6.01E-06 | 8.04E-07 | 9.11E-06 | 1.84E-06 | 1.21E-04 | 1.38E-04 |
| 5.4 | 5.72E-06 | 7.83E-07 | 8.61E-06 | 1.79E-06 | 6.41E-05 | 7.19E-05 |
| 5.7 | 5.46E-06 | 7.65E-07 | 8.19E-06 | 1.75E-06 | 2.92E-05 | 2.80E-05 |
| 6 | 5.22E-06 | 7.46E-07 | 7.81E-06 | 1.72E-06 | 1.48E-05 | 8.41E-06 |
| 6.3 | 5.00E-06 | 7.29E-07 | 7.47E-06 | 1.68E-06 | 1.11E-05 | 3.51E-06 |
| 6.6 | 4.79E-06 | 7.11E-07 | 7.16E-06 | 1.65E-06 | 1.03E-05 | 2.95E-06 |
| 6.9 | 4.60E-06 | 6.95E-07 | 6.87E-06 | 1.61E-06 | 9.86E-06 | 2.88E-06 |
| 7.2 | 4.42E-06 | 6.78E-07 | 6.61E-06 | 1.58E-06 | 9.45E-06 | 2.83E-06 |
| 7.5 | 4.25E-06 | 6.63E-07 | 6.36E-06 | 1.55E-06 | 9.09E-06 | 2.78E-06 |
| 7.8 | 4.09E-06 | 6.48E-07 | 6.14E-06 | 1.52E-06 | 8.75E-06 | 2.73E-06 |
| 8.1 | 3.94E-06 | 6.33E-07 | 5.92E-06 | 1.49E-06 | 8.44E-06 | 2.68E-06 |
| 8.4 | 3.79E-06 | 6.19E-07 | 5.72E-06 | 1.46E-06 | 8.16E-06 | 2.63E-06 |
| 8.7 | 3.65E-06 | 6.04E-07 | 5.53E-06 | 1.43E-06 | 7.89E-06 | 2.58E-06 |
| 9 | 3.53E-06 | 5.91E-07 | 5.34E-06 | 1.40E-06 | 7.64E-06 | 2.54E-06 |
| 9.3 | 3.40E-06 | 5.78E-07 | 5.17E-06 | 1.38E-06 | 7.40E-06 | 2.50E-06 |
| 9.6 | 3.29E-06 | 5.65E-07 | 5.01E-06 | 1.35E-06 | 7.18E-06 | 2.45E-06 |
| 9.9 | 3.18E-06 | 5.52E-07 | 4.86E-06 | 1.33E-06 | 6.97E-06 | 2.41E-06 |
| 10.2 | 3.07E-06 | 5.39E-07 | 4.71E-06 | 1.30E-06 | 6.77E-06 | 2.37E-06 |
| 10.5 | 2.97E-06 | 5.28E-07 | 4.57E-06 | 1.28E-06 | 6.57E-06 | 2.33E-06 |
| 10.8 | 2.87E-06 | 5.16E-07 | 4.43E-06 | 1.25E-06 | 6.39E-06 | 2.29E-06 |
| 11.1 | 2.77E-06 | 5.04E-07 | 4.30E-06 | 1.23E-06 | 6.22E-06 | 2.25E-06 |
| 11.4 | 2.68E-06 | 4.93E-07 | 4.17E-06 | 1.20E-06 | 6.05E-06 | 2.22E-06 |
| 11.7 | 2.60E-06 | 4.82E-07 | 4.06E-06 | 1.18E-06 | 5.89E-06 | 2.18E-06 |
| 12 | 2.52E-06 | 4.71E-07 | 3.94E-06 | 1.16E-06 | 5.74E-06 | 2.14E-06 |
| 12.3 | 2.44E-06 | 4.60E-07 | 3.83E-06 | 1.14E-06 | 5.59E-06 | 2.10E-06 |
| 12.6 | 2.36E-06 | 4.51E-07 | 3.72E-06 | 1.12E-06 | 5.45E-06 | 2.07E-06 |
| 12.9 | 2.29E-06 | 4.41E-07 | 3.62E-06 | 1.09E-06 | 5.31E-06 | 2.03E-06 |
| 13.2 | 2.22E-06 | 4.31E-07 | 3.52E-06 | 1.07E-06 | 5.18E-06 | 2.00E-06 |
| 13.5 | 2.15E-06 | 4.21E-07 | 3.43E-06 | 1.05E-06 | 5.05E-06 | 1.96E-06 |
| 13.8 | 2.08E-06 | 4.12E-07 | 3.34E-06 | 1.03E-06 | 4.93E-06 | 1.93E-06 |
| 14.1 | 2.02E-06 | 4.03E-07 | 3.25E-06 | 1.01E-06 | 4.81E-06 | 1.90E-06 |
| 14.4 | 1.96E-06 | 3.94E-07 | 3.16E-06 | 9.95E-07 | 4.70E-06 | 1.87E-06 |
| 14.7 | 1.90E-06 | 3.85E-07 | 3.08E-06 | 9.75E-07 | 4.59E-06 | 1.83E-06 |
| 15 | 1.85E-06 | 3.77E-07 | 3.00E-06 | 9.57E-07 | 4.48E-06 | 1.81E-06 |
| 15.3 | 1.80E-06 | 3.68E-07 | 2.93E-06 | 9.39E-07 | 4.38E-06 | 1.78E-06 |
| 15.6 | 1.74E-06 | 3.60E-07 | 2.85E-06 | 9.21E-07 | 4.27E-06 | 1.74E-06 |
| 15.9 | 1.69E-06 | 3.52E-07 | 2.78E-06 | 9.03E-07 | 4.18E-06 | 1.72E-06 |
| 16.2 | 1.64E-06 | 3.44E-07 | 2.71E-06 | 8.86E-07 | 4.08E-06 | 1.69E-06 |
| 16.5 | 1.60E-06 | 3.37E-07 | 2.64E-06 | 8.69E-07 | 3.99E-06 | 1.66E-06 |
| 16.8 | 1.55E-06 | 3.29E-07 | 2.57E-06 | 8.53E-07 | 3.91E-06 | 1.63E-06 |
| 17.1 | 1.51E-06 | 3.22E-07 | 2.51E-06 | 8.37E-07 | 3.82E-06 | 1.60E-06 |
| 17.4 | 1.47E-06 | 3.14E-07 | 2.45E-06 | 8.21E-07 | 3.73E-06 | 1.58E-06 |
| 17.7 | 1.42E-06 | 3.07E-07 | 2.39E-06 | 8.06E-07 | 3.65E-06 | 1.55E-06 |
| 18 | 1.39E-06 | 3.01E-07 | 2.33E-06 | 7.91E-07 | 3.57E-06 | 1.52E-06 |
| 18.3 | 1.35E-06 | 2.94E-07 | 2.28E-06 | 7.75E-07 | 3.50E-06 | 1.50E-06 |
| 18.6 | 1.31E-06 | 2.87E-07 | 2.22E-06 | 7.60E-07 | 3.42E-06 | 1.47E-06 |
| 18.9 | 1.27E-06 | 2.81E-07 | 2.17E-06 | 7.46E-07 | 3.35E-06 | 1.45E-06 |
| 19.2 | 1.24E-06 | 2.75E-07 | 2.12E-06 | 7.31E-07 | 3.28E-06 | 1.42E-06 |
| 19.5 | 1.21E-06 | 2.68E-07 | 2.07E-06 | 7.18E-07 | 3.21E-06 | 1.40E-06 |
| 19.8 | 1.17E-06 | 2.62E-07 | 2.02E-06 | 7.03E-07 | 3.14E-06 | 1.37E-06 |
| 20.1 | 1.14E-06 | 2.57E-07 | 1.97E-06 | 6.91E-07 | 3.07E-06 | 1.35E-06 |
| 20.4 | 1.11E-06 | 2.51E-07 | 1.93E-06 | 6.77E-07 | 3.01E-06 | 1.33E-06 |
| 20.7 | 1.08E-06 | 2.46E-07 | 1.88E-06 | 6.65E-07 | 2.95E-06 | 1.31E-06 |
| 21 | 1.05E-06 | 2.40E-07 | 1.84E-06 | 6.53E-07 | 2.89E-06 | 1.28E-06 |
| 21.3 | 1.02E-06 | 2.34E-07 | 1.80E-06 | 6.40E-07 | 2.83E-06 | 1.26E-06 |
| 21.6 | 9.98E-07 | 2.29E-07 | 1.76E-06 | 6.28E-07 | 2.77E-06 | 1.24E-06 |
| 21.9 | 9.71E-07 | 2.24E-07 | 1.72E-06 | 6.16E-07 | 2.71E-06 | 1.22E-06 |
| 22.2 | 9.45E-07 | 2.19E-07 | 1.68E-06 | 6.05E-07 | 2.66E-06 | 1.20E-06 |
| 22.5 | 9.21E-07 | 2.15E-07 | 1.64E-06 | 5.93E-07 | 2.61E-06 | 1.18E-06 |
| 22.8 | 8.97E-07 | 2.10E-07 | 1.60E-06 | 5.81E-07 | 2.55E-06 | 1.16E-06 |
| 23.1 | 8.75E-07 | 2.05E-07 | 1.57E-06 | 5.70E-07 | 2.50E-06 | 1.14E-06 |
| 23.4 | 8.51E-07 | 2.00E-07 | 1.53E-06 | 5.59E-07 | 2.45E-06 | 1.12E-06 |
| 23.7 | 8.29E-07 | 1.95E-07 | 1.50E-06 | 5.48E-07 | 2.40E-06 | 1.10E-06 |
| 24 | 8.08E-07 | 1.92E-07 | 1.46E-06 | 5.37E-07 | 2.35E-06 | 1.08E-06 |
| 24.3 | 7.86E-07 | 1.87E-07 | 1.43E-06 | 5.27E-07 | 2.31E-06 | 1.06E-06 |
| 24.6 | 7.66E-07 | 1.83E-07 | 1.40E-06 | 5.17E-07 | 2.26E-06 | 1.04E-06 |
| 24.9 | 7.47E-07 | 1.79E-07 | 1.37E-06 | 5.07E-07 | 2.22E-06 | 1.03E-06 |
| 25.2 | 7.27E-07 | 1.75E-07 | 1.34E-06 | 4.97E-07 | 2.17E-06 | 1.01E-06 |
| 25.5 | 7.09E-07 | 1.70E-07 | 1.31E-06 | 4.87E-07 | 2.13E-06 | 9.90E-07 |
| 25.8 | 6.90E-07 | 1.66E-07 | 1.28E-06 | 4.78E-07 | 2.09E-06 | 9.74E-07 |
| 26.1 | 6.72E-07 | 1.63E-07 | 1.25E-06 | 4.69E-07 | 2.05E-06 | 9.56E-07 |
| 26.4 | 6.55E-07 | 1.59E-07 | 1.22E-06 | 4.59E-07 | 2.01E-06 | 9.39E-07 |
| 26.7 | 6.38E-07 | 1.55E-07 | 1.20E-06 | 4.51E-07 | 1.97E-06 | 9.23E-07 |
| 27 | 6.21E-07 | 1.51E-07 | 1.17E-06 | 4.41E-07 | 1.93E-06 | 9.07E-07 |
| 27.3 | 6.05E-07 | 1.48E-07 | 1.15E-06 | 4.32E-07 | 1.89E-06 | 8.89E-07 |
| 27.6 | 5.89E-07 | 1.44E-07 | 1.12E-06 | 4.23E-07 | 1.85E-06 | 8.74E-07 |
| 27.9 | 5.73E-07 | 1.40E-07 | 1.09E-06 | 4.15E-07 | 1.81E-06 | 8.58E-07 |
| 28.2 | 5.57E-07 | 1.37E-07 | 1.07E-06 | 4.06E-07 | 1.78E-06 | 8.42E-07 |
| 28.5 | 5.42E-07 | 1.34E-07 | 1.04E-06 | 3.97E-07 | 1.74E-06 | 8.26E-07 |
| 28.8 | 5.26E-07 | 1.30E-07 | 1.02E-06 | 3.88E-07 | 1.70E-06 | 8.10E-07 |
| 29.1 | 5.12E-07 | 1.27E-07 | 9.93E-07 | 3.79E-07 | 1.67E-06 | 7.95E-07 |
| 29.4 | 4.96E-07 | 1.23E-07 | 9.68E-07 | 3.70E-07 | 1.63E-06 | 7.76E-07 |
| 29.7 | 4.68E-07 | 1.17E-07 | 9.17E-07 | 3.52E-07 | 1.55E-06 | 7.39E-07 |
Table A2.
Absorbed dose data in the brain along 100 bins for positrons and electrons at 20 and 24 MeV.
Table A2.
Absorbed dose data in the brain along 100 bins for positrons and electrons at 20 and 24 MeV.
| Bin [cm] | 20 MeV | 24 MeV | ||
|---|---|---|---|---|
| Positron | Electron | Positron | Electron | |
| 0 | 3.26E-04 | 3.29E-04 | 3.26E-04 | 3.29E-04 |
| 0.3 | 3.39E-04 | 3.45E-04 | 3.39E-04 | 3.45E-04 |
| 0.6 | 3.45E-04 | 3.53E-04 | 3.45E-04 | 3.53E-04 |
| 0.9 | 3.49E-04 | 3.59E-04 | 3.49E-04 | 3.59E-04 |
| 1.2 | 3.52E-04 | 3.64E-04 | 3.52E-04 | 3.63E-04 |
| 1.5 | 3.55E-04 | 3.69E-04 | 3.54E-04 | 3.67E-04 |
| 1.8 | 3.58E-04 | 3.72E-04 | 3.56E-04 | 3.70E-04 |
| 2.1 | 3.61E-04 | 3.76E-04 | 3.58E-04 | 3.74E-04 |
| 2.4 | 3.64E-04 | 3.79E-04 | 3.60E-04 | 3.76E-04 |
| 2.7 | 3.67E-04 | 3.82E-04 | 3.62E-04 | 3.79E-04 |
| 3 | 3.70E-04 | 3.85E-04 | 3.64E-04 | 3.81E-04 |
| 3.3 | 3.74E-04 | 3.88E-04 | 3.66E-04 | 3.84E-04 |
| 3.6 | 3.77E-04 | 3.91E-04 | 3.68E-04 | 3.86E-04 |
| 3.9 | 3.81E-04 | 3.94E-04 | 3.70E-04 | 3.88E-04 |
| 4.2 | 3.85E-04 | 3.96E-04 | 3.72E-04 | 3.89E-04 |
| 4.5 | 3.88E-04 | 3.98E-04 | 3.74E-04 | 3.91E-04 |
| 4.8 | 3.91E-04 | 4.00E-04 | 3.76E-04 | 3.92E-04 |
| 5.1 | 3.93E-04 | 4.00E-04 | 3.78E-04 | 3.93E-04 |
| 5.4 | 3.92E-04 | 3.99E-04 | 3.79E-04 | 3.93E-04 |
| 5.7 | 3.89E-04 | 3.96E-04 | 3.81E-04 | 3.93E-04 |
| 6 | 3.82E-04 | 3.90E-04 | 3.81E-04 | 3.93E-04 |
| 6.3 | 3.70E-04 | 3.80E-04 | 3.81E-04 | 3.91E-04 |
| 6.6 | 3.54E-04 | 3.66E-04 | 3.79E-04 | 3.89E-04 |
| 6.9 | 3.32E-04 | 3.46E-04 | 3.75E-04 | 3.85E-04 |
| 7.2 | 3.04E-04 | 3.20E-04 | 3.70E-04 | 3.79E-04 |
| 7.5 | 2.71E-04 | 2.88E-04 | 3.61E-04 | 3.71E-04 |
| 7.8 | 2.33E-04 | 2.50E-04 | 3.49E-04 | 3.60E-04 |
| 8.1 | 1.93E-04 | 2.09E-04 | 3.34E-04 | 3.45E-04 |
| 8.4 | 1.51E-04 | 1.64E-04 | 3.15E-04 | 3.27E-04 |
| 8.7 | 1.11E-04 | 1.21E-04 | 2.92E-04 | 3.06E-04 |
| 9 | 7.66E-05 | 8.20E-05 | 2.66E-04 | 2.80E-04 |
| 9.3 | 4.95E-05 | 5.03E-05 | 2.36E-04 | 2.50E-04 |
| 9.6 | 3.12E-05 | 2.80E-05 | 2.04E-04 | 2.17E-04 |
| 9.9 | 2.09E-05 | 1.50E-05 | 1.70E-04 | 1.82E-04 |
| 10.2 | 1.62E-05 | 9.01E-06 | 1.37E-04 | 1.46E-04 |
| 10.5 | 1.45E-05 | 6.98E-06 | 1.05E-04 | 1.12E-04 |
| 10.8 | 1.38E-05 | 6.47E-06 | 7.72E-05 | 8.08E-05 |
| 11.1 | 1.34E-05 | 6.33E-06 | 5.44E-05 | 5.46E-05 |
| 11.4 | 1.30E-05 | 6.24E-06 | 3.76E-05 | 3.47E-05 |
| 11.7 | 1.27E-05 | 6.15E-06 | 2.67E-05 | 2.14E-05 |
| 12 | 1.24E-05 | 6.07E-06 | 2.05E-05 | 1.38E-05 |
| 12.3 | 1.21E-05 | 5.99E-06 | 1.76E-05 | 1.02E-05 |
| 12.6 | 1.18E-05 | 5.90E-06 | 1.64E-05 | 8.85E-06 |
| 12.9 | 1.16E-05 | 5.82E-06 | 1.58E-05 | 8.43E-06 |
| 13.2 | 1.13E-05 | 5.74E-06 | 1.54E-05 | 8.27E-06 |
| 13.2 | 1.13E-05 | 5.74E-06 | 1.54E-05 | 8.27E-06 |
| 13.5 | 1.10E-05 | 5.66E-06 | 1.51E-05 | 8.17E-06 |
| 13.8 | 1.08E-05 | 5.58E-06 | 1.47E-05 | 8.06E-06 |
| 14.1 | 1.06E-05 | 5.51E-06 | 1.44E-05 | 7.96E-06 |
| 14.4 | 1.04E-05 | 5.43E-06 | 1.41E-05 | 7.85E-06 |
| 14.7 | 1.02E-05 | 5.36E-06 | 1.39E-05 | 7.76E-06 |
| 15 | 9.96E-06 | 5.29E-06 | 1.36E-05 | 7.66E-06 |
| 15.3 | 9.76E-06 | 5.22E-06 | 1.33E-05 | 7.56E-06 |
| 15.6 | 9.57E-06 | 5.15E-06 | 1.31E-05 | 7.47E-06 |
| 15.9 | 9.38E-06 | 5.08E-06 | 1.28E-05 | 7.37E-06 |
| 16.2 | 9.20E-06 | 5.01E-06 | 1.26E-05 | 7.28E-06 |
| 16.5 | 9.03E-06 | 4.94E-06 | 1.24E-05 | 7.19E-06 |
| 16.8 | 8.86E-06 | 4.87E-06 | 1.21E-05 | 7.10E-06 |
| 17.1 | 8.70E-06 | 4.81E-06 | 1.19E-05 | 7.01E-06 |
| 17.4 | 8.54E-06 | 4.74E-06 | 1.17E-05 | 6.92E-06 |
| 17.7 | 8.38E-06 | 4.68E-06 | 1.15E-05 | 6.83E-06 |
| 18 | 8.23E-06 | 4.62E-06 | 1.13E-05 | 6.75E-06 |
| 18.3 | 8.08E-06 | 4.55E-06 | 1.11E-05 | 6.66E-06 |
| 18.6 | 7.94E-06 | 4.49E-06 | 1.09E-05 | 6.58E-06 |
| 18.9 | 7.80E-06 | 4.43E-06 | 1.08E-05 | 6.50E-06 |
| 19.2 | 7.66E-06 | 4.37E-06 | 1.06E-05 | 6.41E-06 |
| 19.5 | 7.53E-06 | 4.31E-06 | 1.04E-05 | 6.33E-06 |
| 19.8 | 7.40E-06 | 4.25E-06 | 1.02E-05 | 6.25E-06 |
| 20.1 | 7.27E-06 | 4.19E-06 | 1.01E-05 | 6.17E-06 |
| 20.4 | 7.15E-06 | 4.13E-06 | 9.91E-06 | 6.09E-06 |
| 20.7 | 7.03E-06 | 4.07E-06 | 9.76E-06 | 6.02E-06 |
| 21 | 6.91E-06 | 4.02E-06 | 9.60E-06 | 5.94E-06 |
| 21.3 | 6.79E-06 | 3.96E-06 | 9.45E-06 | 5.86E-06 |
| 21.6 | 6.67E-06 | 3.91E-06 | 9.30E-06 | 5.79E-06 |
| 21.9 | 6.56E-06 | 3.86E-06 | 9.16E-06 | 5.71E-06 |
| 22.2 | 6.45E-06 | 3.80E-06 | 9.01E-06 | 5.64E-06 |
| 22.5 | 6.35E-06 | 3.75E-06 | 8.87E-06 | 5.57E-06 |
| 22.8 | 6.24E-06 | 3.70E-06 | 8.74E-06 | 5.50E-06 |
| 23.1 | 6.14E-06 | 3.65E-06 | 8.60E-06 | 5.43E-06 |
| 23.4 | 6.04E-06 | 3.60E-06 | 8.47E-06 | 5.36E-06 |
| 23.7 | 5.94E-06 | 3.55E-06 | 8.34E-06 | 5.29E-06 |
| 24 | 5.84E-06 | 3.50E-06 | 8.22E-06 | 5.22E-06 |
| 24.3 | 5.75E-06 | 3.45E-06 | 8.09E-06 | 5.15E-06 |
| 24.6 | 5.66E-06 | 3.40E-06 | 7.97E-06 | 5.08E-06 |
| 24.9 | 5.56E-06 | 3.35E-06 | 7.85E-06 | 5.02E-06 |
| 25.2 | 5.47E-06 | 3.30E-06 | 7.73E-06 | 4.96E-06 |
| 25.5 | 5.39E-06 | 3.26E-06 | 7.61E-06 | 4.89E-06 |
| 25.8 | 5.30E-06 | 3.21E-06 | 7.50E-06 | 4.82E-06 |
| 26.1 | 5.21E-06 | 3.16E-06 | 7.38E-06 | 4.76E-06 |
| 26.4 | 5.13E-06 | 3.12E-06 | 7.27E-06 | 4.69E-06 |
| 26.7 | 5.04E-06 | 3.07E-06 | 7.16E-06 | 4.63E-06 |
| 27 | 4.96E-06 | 3.03E-06 | 7.05E-06 | 4.57E-06 |
| 27.3 | 4.88E-06 | 2.98E-06 | 6.94E-06 | 4.51E-06 |
| 27.6 | 4.80E-06 | 2.94E-06 | 6.84E-06 | 4.45E-06 |
| 27.9 | 4.72E-06 | 2.90E-06 | 6.73E-06 | 4.38E-06 |
| 28.2 | 4.64E-06 | 2.86E-06 | 6.63E-06 | 4.32E-06 |
| 28.5 | 4.56E-06 | 2.81E-06 | 6.52E-06 | 4.26E-06 |
| 28.8 | 4.48E-06 | 2.76E-06 | 6.42E-06 | 4.20E-06 |
| 29.1 | 4.40E-06 | 2.72E-06 | 6.31E-06 | 4.13E-06 |
| 29.4 | 4.31E-06 | 2.67E-06 | 6.18E-06 | 4.06E-06 |
References
- Keevil, S.F. Physics and medicine: a historical perspective. The Lancet 2012, 379, 1517–1524. [CrossRef]
- Yoshimura, E. Física das Radiações: interação da radiação com a matéria 2009.
- Hogstrom, K.; Almond, P. Review of electron beam therapy physics. Physics in medicine and biology 2006, 51, R455–89. [CrossRef]
- Chargari, C.; Deutsch, E.; Blanchard, P.; Gouy, S.; Martelli, H.; Guérin, F.; Dumas, I.; Bossi, A.; Morice, P.; Viswanathan, A.; et al. Brachytherapy: An overview for clinicians. CA: A Cancer Journal for Clinicians 2019, 69. [CrossRef]
- Chang, D.; Lasley, F.; Das, I.; Mendonca, M.; Dynlacht, J. Basic Radiotherapy Physics and Biology; Springer International Publishing, 2014.
- Nutt, R. The History of Positron Emission Tomography. Molecular Imaging & Biology 2002, 4, 11–26. [CrossRef]
- Wagner, H.N. A brief history of positron emission tomography (PET). Seminars in Nuclear Medicine 1998, 28, 213–220. The Coming Age of Pet (Part 1). [CrossRef]
- Hioki, T.; Gholami, Y.; Mckelvey, K.; Aslani, A.; Marquis, H.; Eslick, E.; Willowson, K.; Bailey, D. Overlooked potential of positrons in cancer therapy. Scientific Reports 2021, 11, 2475. [CrossRef]
- Mario.; Migowski, A.; Ribeiro, C.; Franco, E.; Carvalho, F.; Claro, I.; Santos, M.; Mello, M.; Melo, M.; Rebelo, M.; et al. ABC do câncer: abordagens básicas para o controle do câncer [ Basic Approaches to the Cancer Control – revised 4th edition and updated ]; Instituto Nacional de Câncer José Alencar Gomes da Silva, 2018.
- Moadel, R.M.; Nguyen, A.V.; Lin, E.Y.; Lu, P.; Mani, J.; Blaufox, M.D.; Pollard, J.W.; Dadachova, E. Positron emission tomography agent 2-deoxy-2-[18F]fluoro-D-glucose has a therapeutic potential in breast cancer. Breast Cancer Research 2003, 5, R199 – R205.
- Moadel, R.; Weldon, R.; Katz, E.; Lu, P.; Mani, J.; Stahl, M.; Blaufox, M.; Pestell, R.; Charron, M.; Dadachova, E. Positherapy: Targeted nuclear therapy of breast cancer with 18F-2-deoxy-2-fluoro-D-glucose. Cancer Research 2005, 65, 698–702.
- Agostinelli, S.; Allison, J.; Amako, K.; Apostolakis, J.; Araujo, H.; Arce, P.; Asai, M.; Axen, D.; Banerjee, S.; Barrand, G.; et al. Geant4—a simulation toolkit. Nuclear Instruments and Methods in Physics Research Section A: Accelerators, Spectrometers, Detectors and Associated Equipment 2003, 506, 250–303. [CrossRef]
- Baró, J.; Sempau, J.; Fernández-Varea, J.; Salvat, F. PENELOPE: An algorithm for Monte Carlo simulation of the penetration and energy loss of electrons and positrons in matter. Nuclear Instruments and Methods in Physics Research Section B: Beam Interactions with Materials and Atoms 1995, 100, 31–46. [CrossRef]
- Faddegon, B.; Ramos-Méndez, J.; Schuemann, J.; McNamara, A.; Shin, J.; Perl, J.; Paganetti, H. The TOPAS tool for particle simulation, a Monte Carlo simulation tool for physics, biology and clinical research. Physica Medica 2020, 72, 114–121. [CrossRef]
- Kaluarachchi, M.M.; Saleh, Z.H.; Schwer, M.L.; Klein, E.E. Validation of a Monte Carlo model for multi leaf collimator based electron delivery. MEDICAL PHYSICS 2020, 47, 3586–3599. [CrossRef]
- Rimchi, F.Z.; Moussa, A.; El Hamli, A.; Tayalati, Y. Monte Carlo Simulation of a Modified Elekta Precise Linear Accelerator Used for Flash Radiotherapy Using TOPAS (TOol for PArticle Simulation). In Proceedings of the Advances in Smart Medical, IoT & Artificial Intelligence; Serrhini, M.; Ghoumid, K., Eds., Cham, 2024; pp. 215–223.
- Bedri, N.K.; Smetana, M.; Janousek, L. Impact of Metallic Implants on Dose Distribution in Radiotherapy with Electrons, Photons, Protons, and Very-High-Energy Beams. APPLIED SCIENCES-BASEL 2025, 15. [CrossRef]
- Attix, F. Introduction to Radiological Physics and Radiation Dosimetry; A Wiley-Interscience publication, Wiley, 1986.
- Contreras, E.H.A. Estudo das distribuições de dose em meios não homogêneos usando feixes clínicos de elétrons através do método de Monte Carlo. Dissertação (mestrado profissional em física médica), Universidade do Estado do Rio de Janeiro, Instituto de Biologia Roberto Alcântara Gomes, Rio de Janeiro, 2018.
- Neto, R.; Souza, F.; Fidelis, A.; Rocha, A.; Santana, L.; Rosa, L.; Cardoso, S. Simulações de experimentos didáticos em física médica com TOPAS MC. Revista Brasileira de Ensino de Física 2023, 45. [CrossRef]
- Cunha, J.S. Cálculo da dose na irradiação de corpo inteiro utilizando simuladores antropomórficos híbridos UF e o código MCNPX. Dissertação de mestrado, Universidade Federal de Sergipe, São Cristóvão, SE, 2016.
- International Commission on Radiation Units and Measurements. Tissue Substitutes in Radiation Dosimetry and Measurement; Vol. 44, ICRU Report, International Commission on Radiation Units and Measurements: Bethesda, MD, 1989.
- Davydov, A. Quantum Mechanics; Addison-Wesley series in advanced physics, Pergamon Press, 1965.
Figure 1.
Geometric configuration used for simulating a tumor inside the brain.
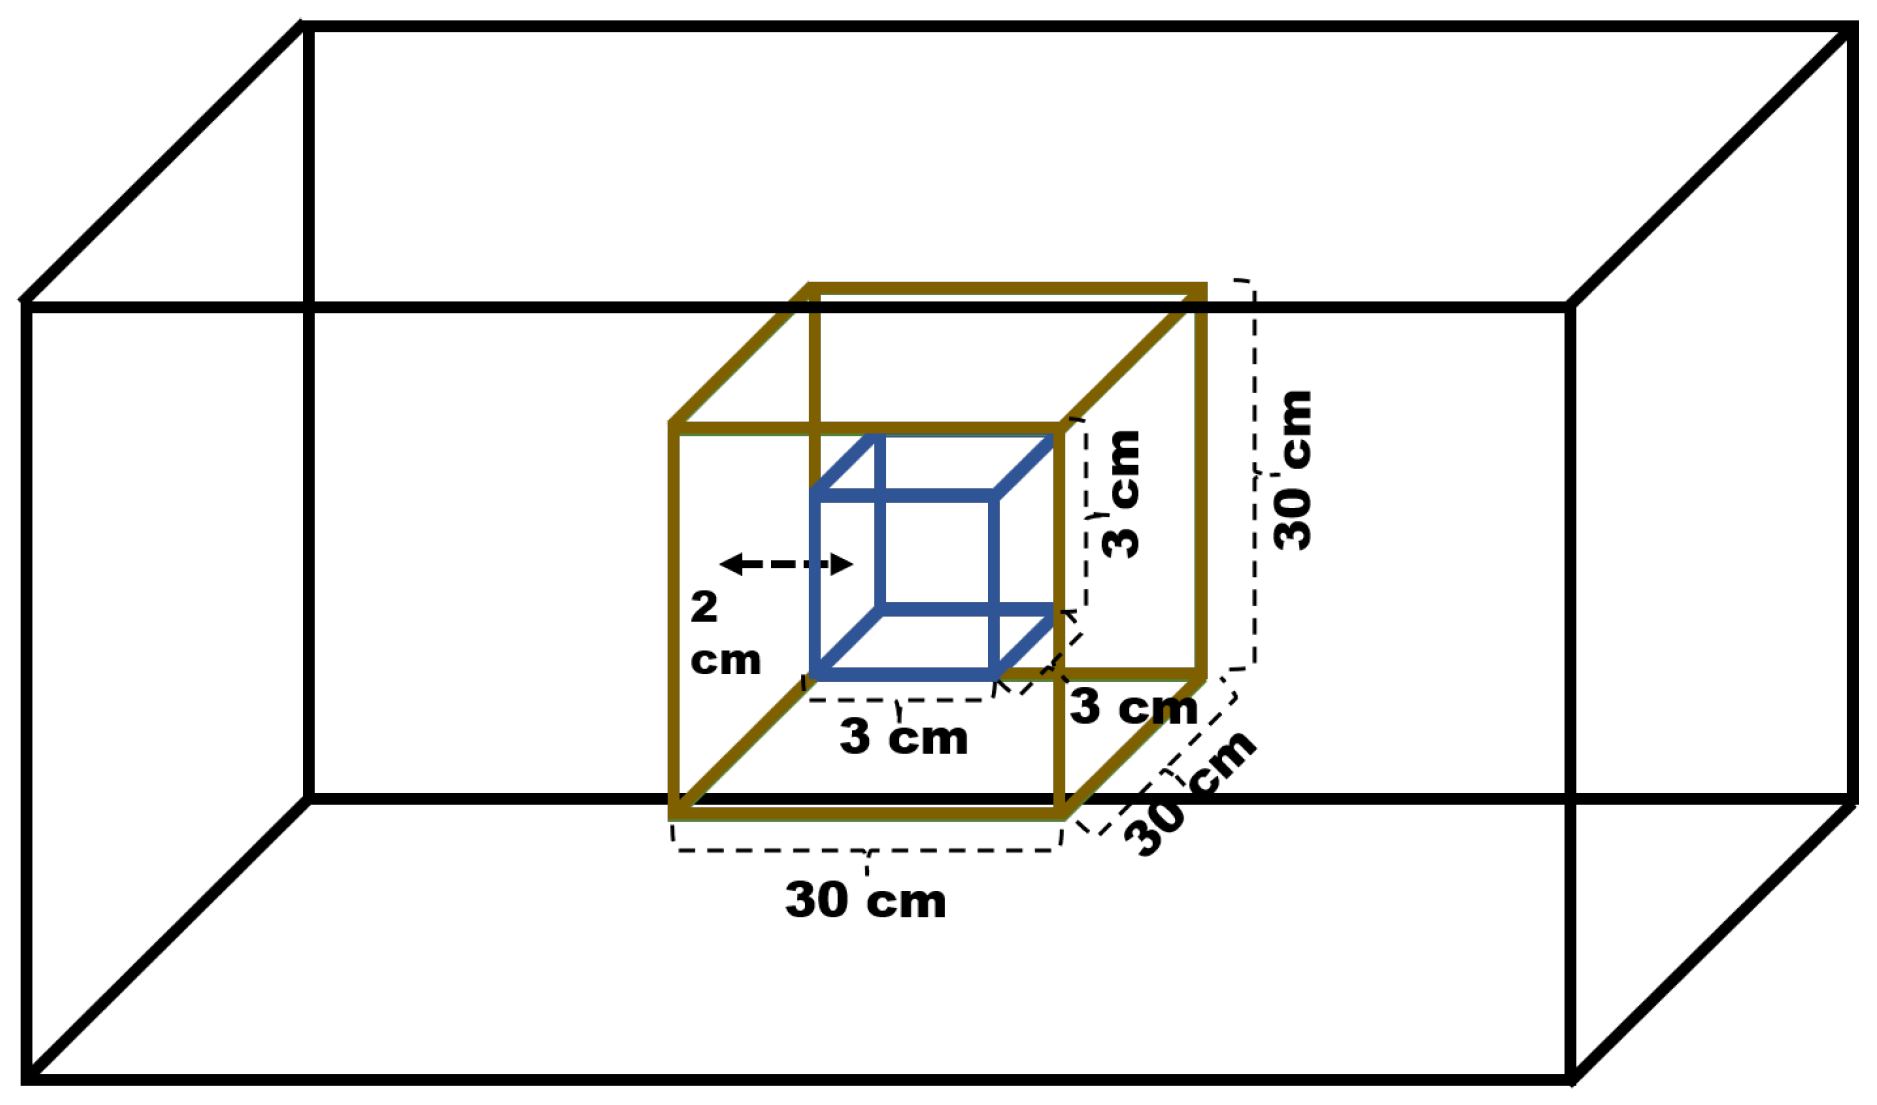
Figure 2.
PDD Comparison graph of results from this study (SW) and experimental from literature data (EL) [20] for 6, 9, and 12 MeV energies.
Figure 2.
PDD Comparison graph of results from this study (SW) and experimental from literature data (EL) [20] for 6, 9, and 12 MeV energies.
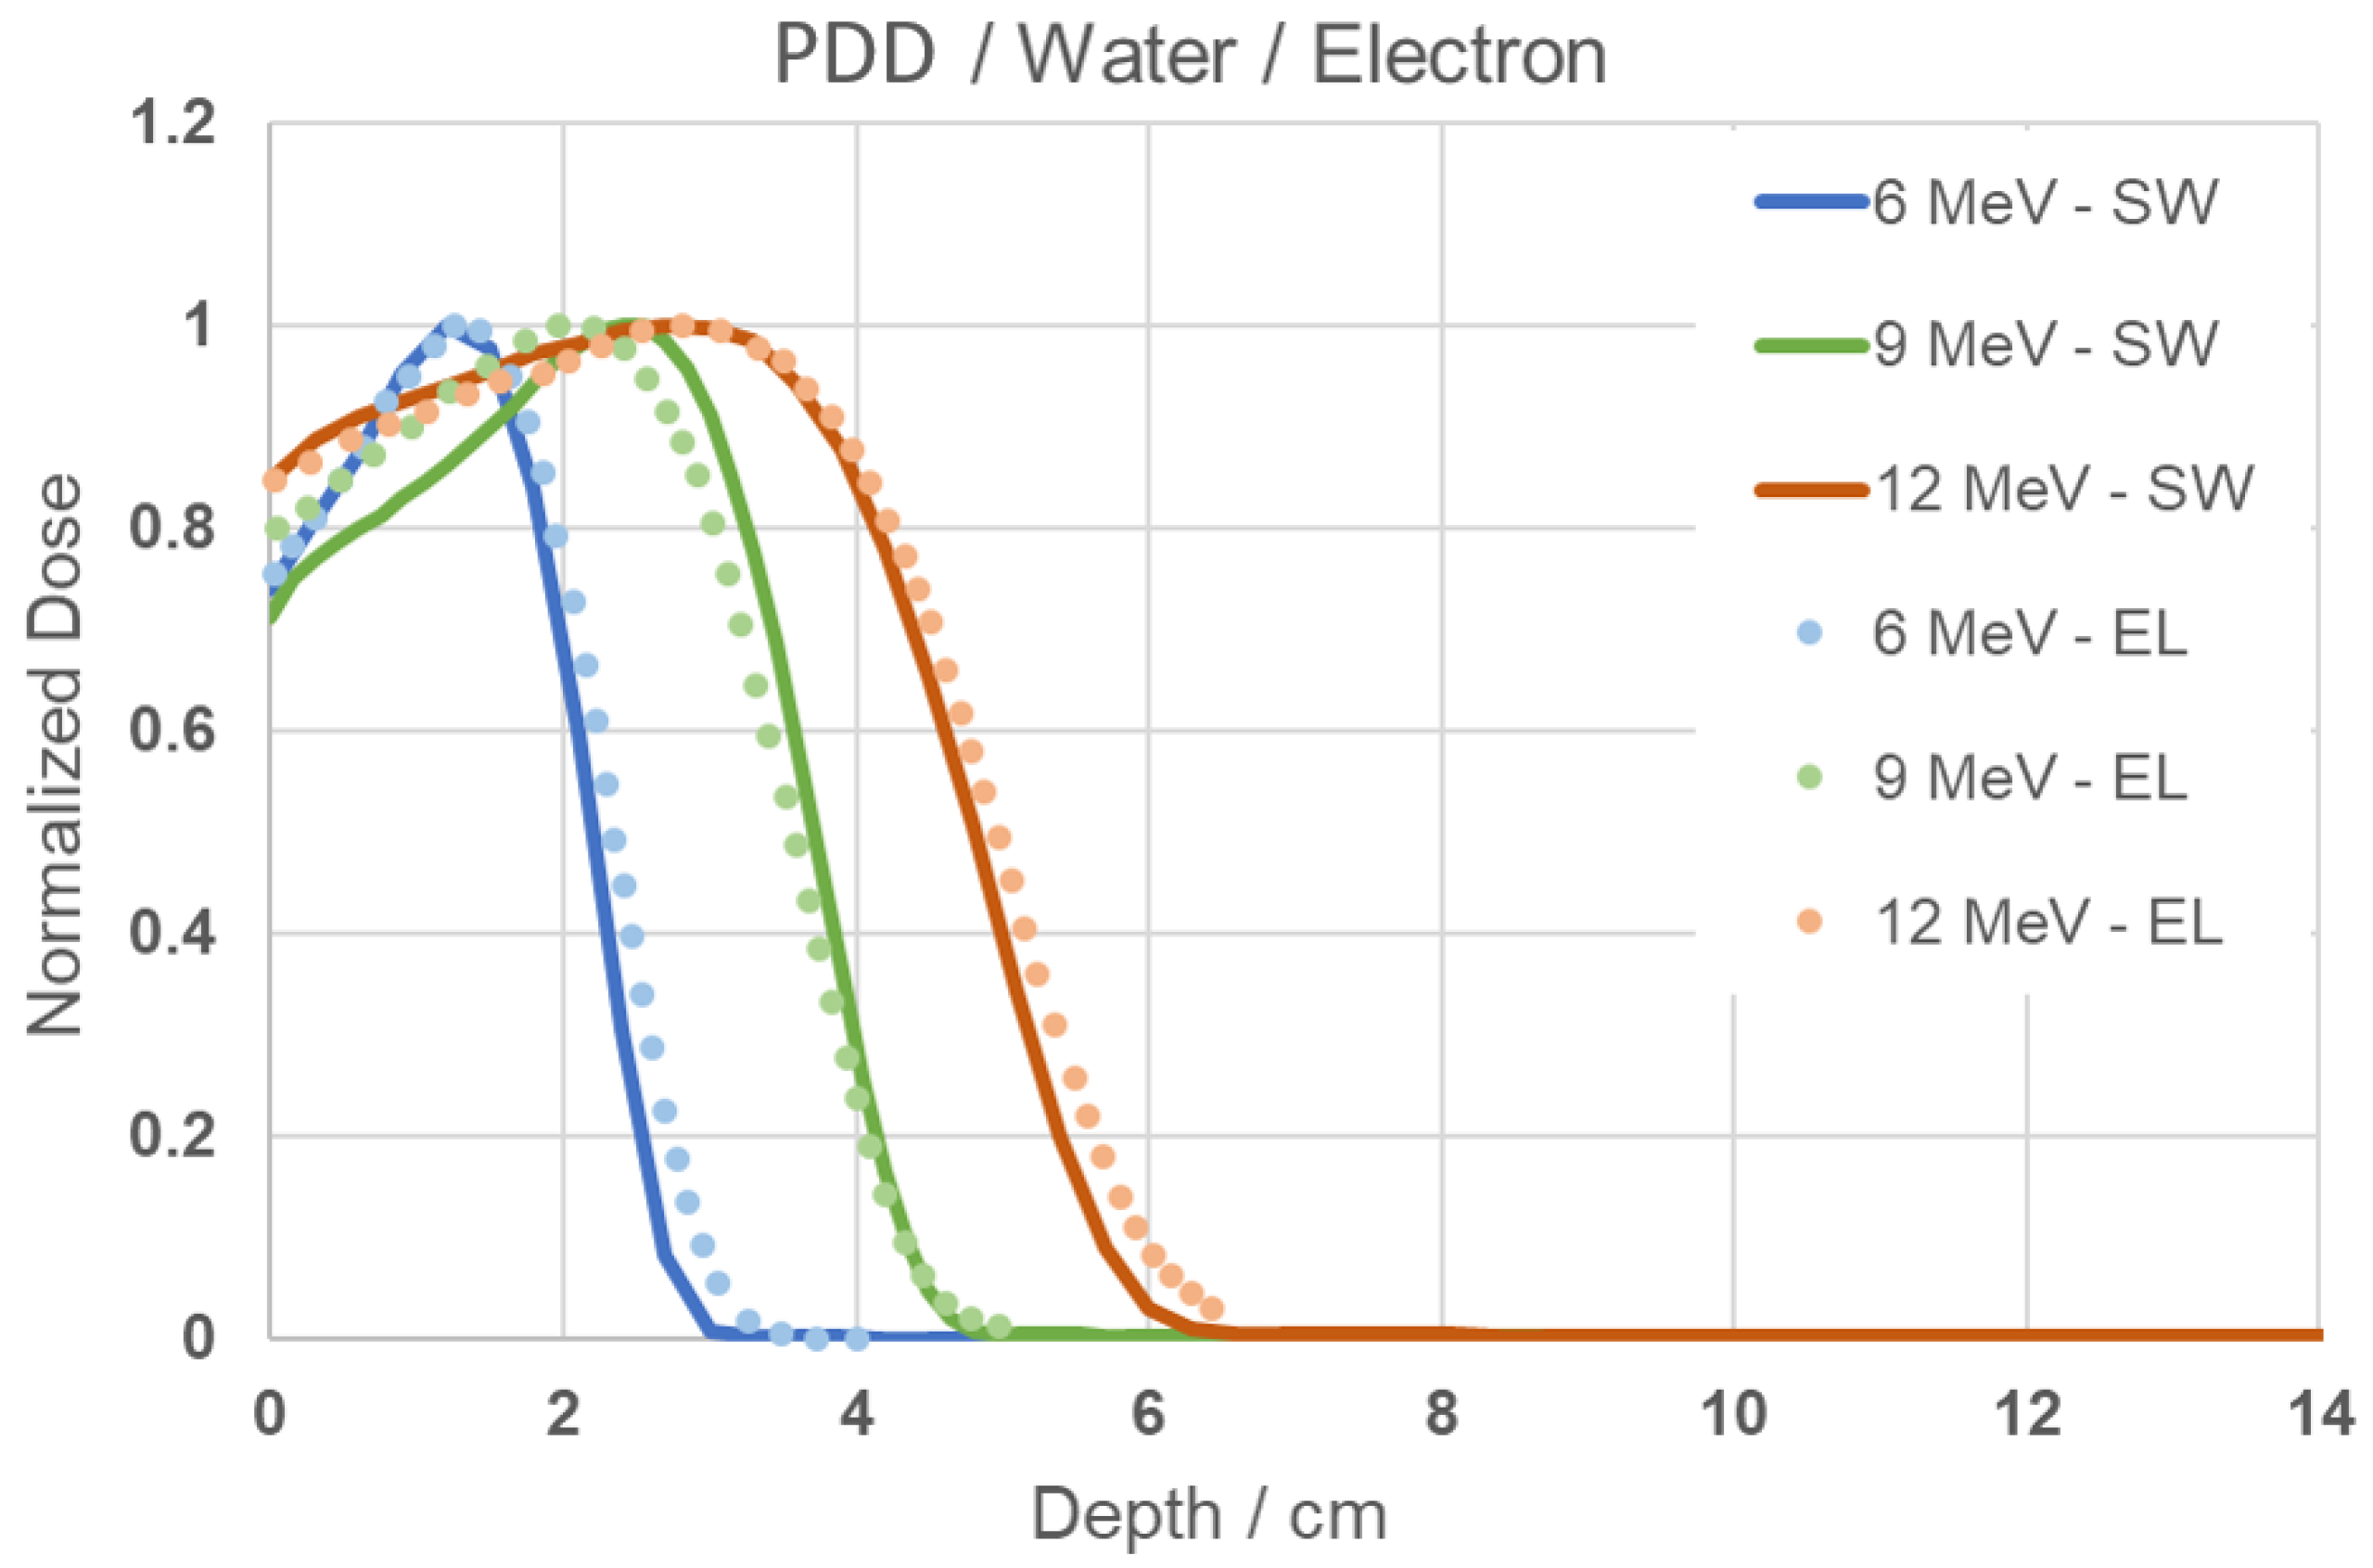
Figure 3.
PDD Comparison graph of results from this study (SW) and simulation from literature data (SL) [20] for 6, 9, 12, 20 and 24 MeV energies.
Figure 3.
PDD Comparison graph of results from this study (SW) and simulation from literature data (SL) [20] for 6, 9, 12, 20 and 24 MeV energies.
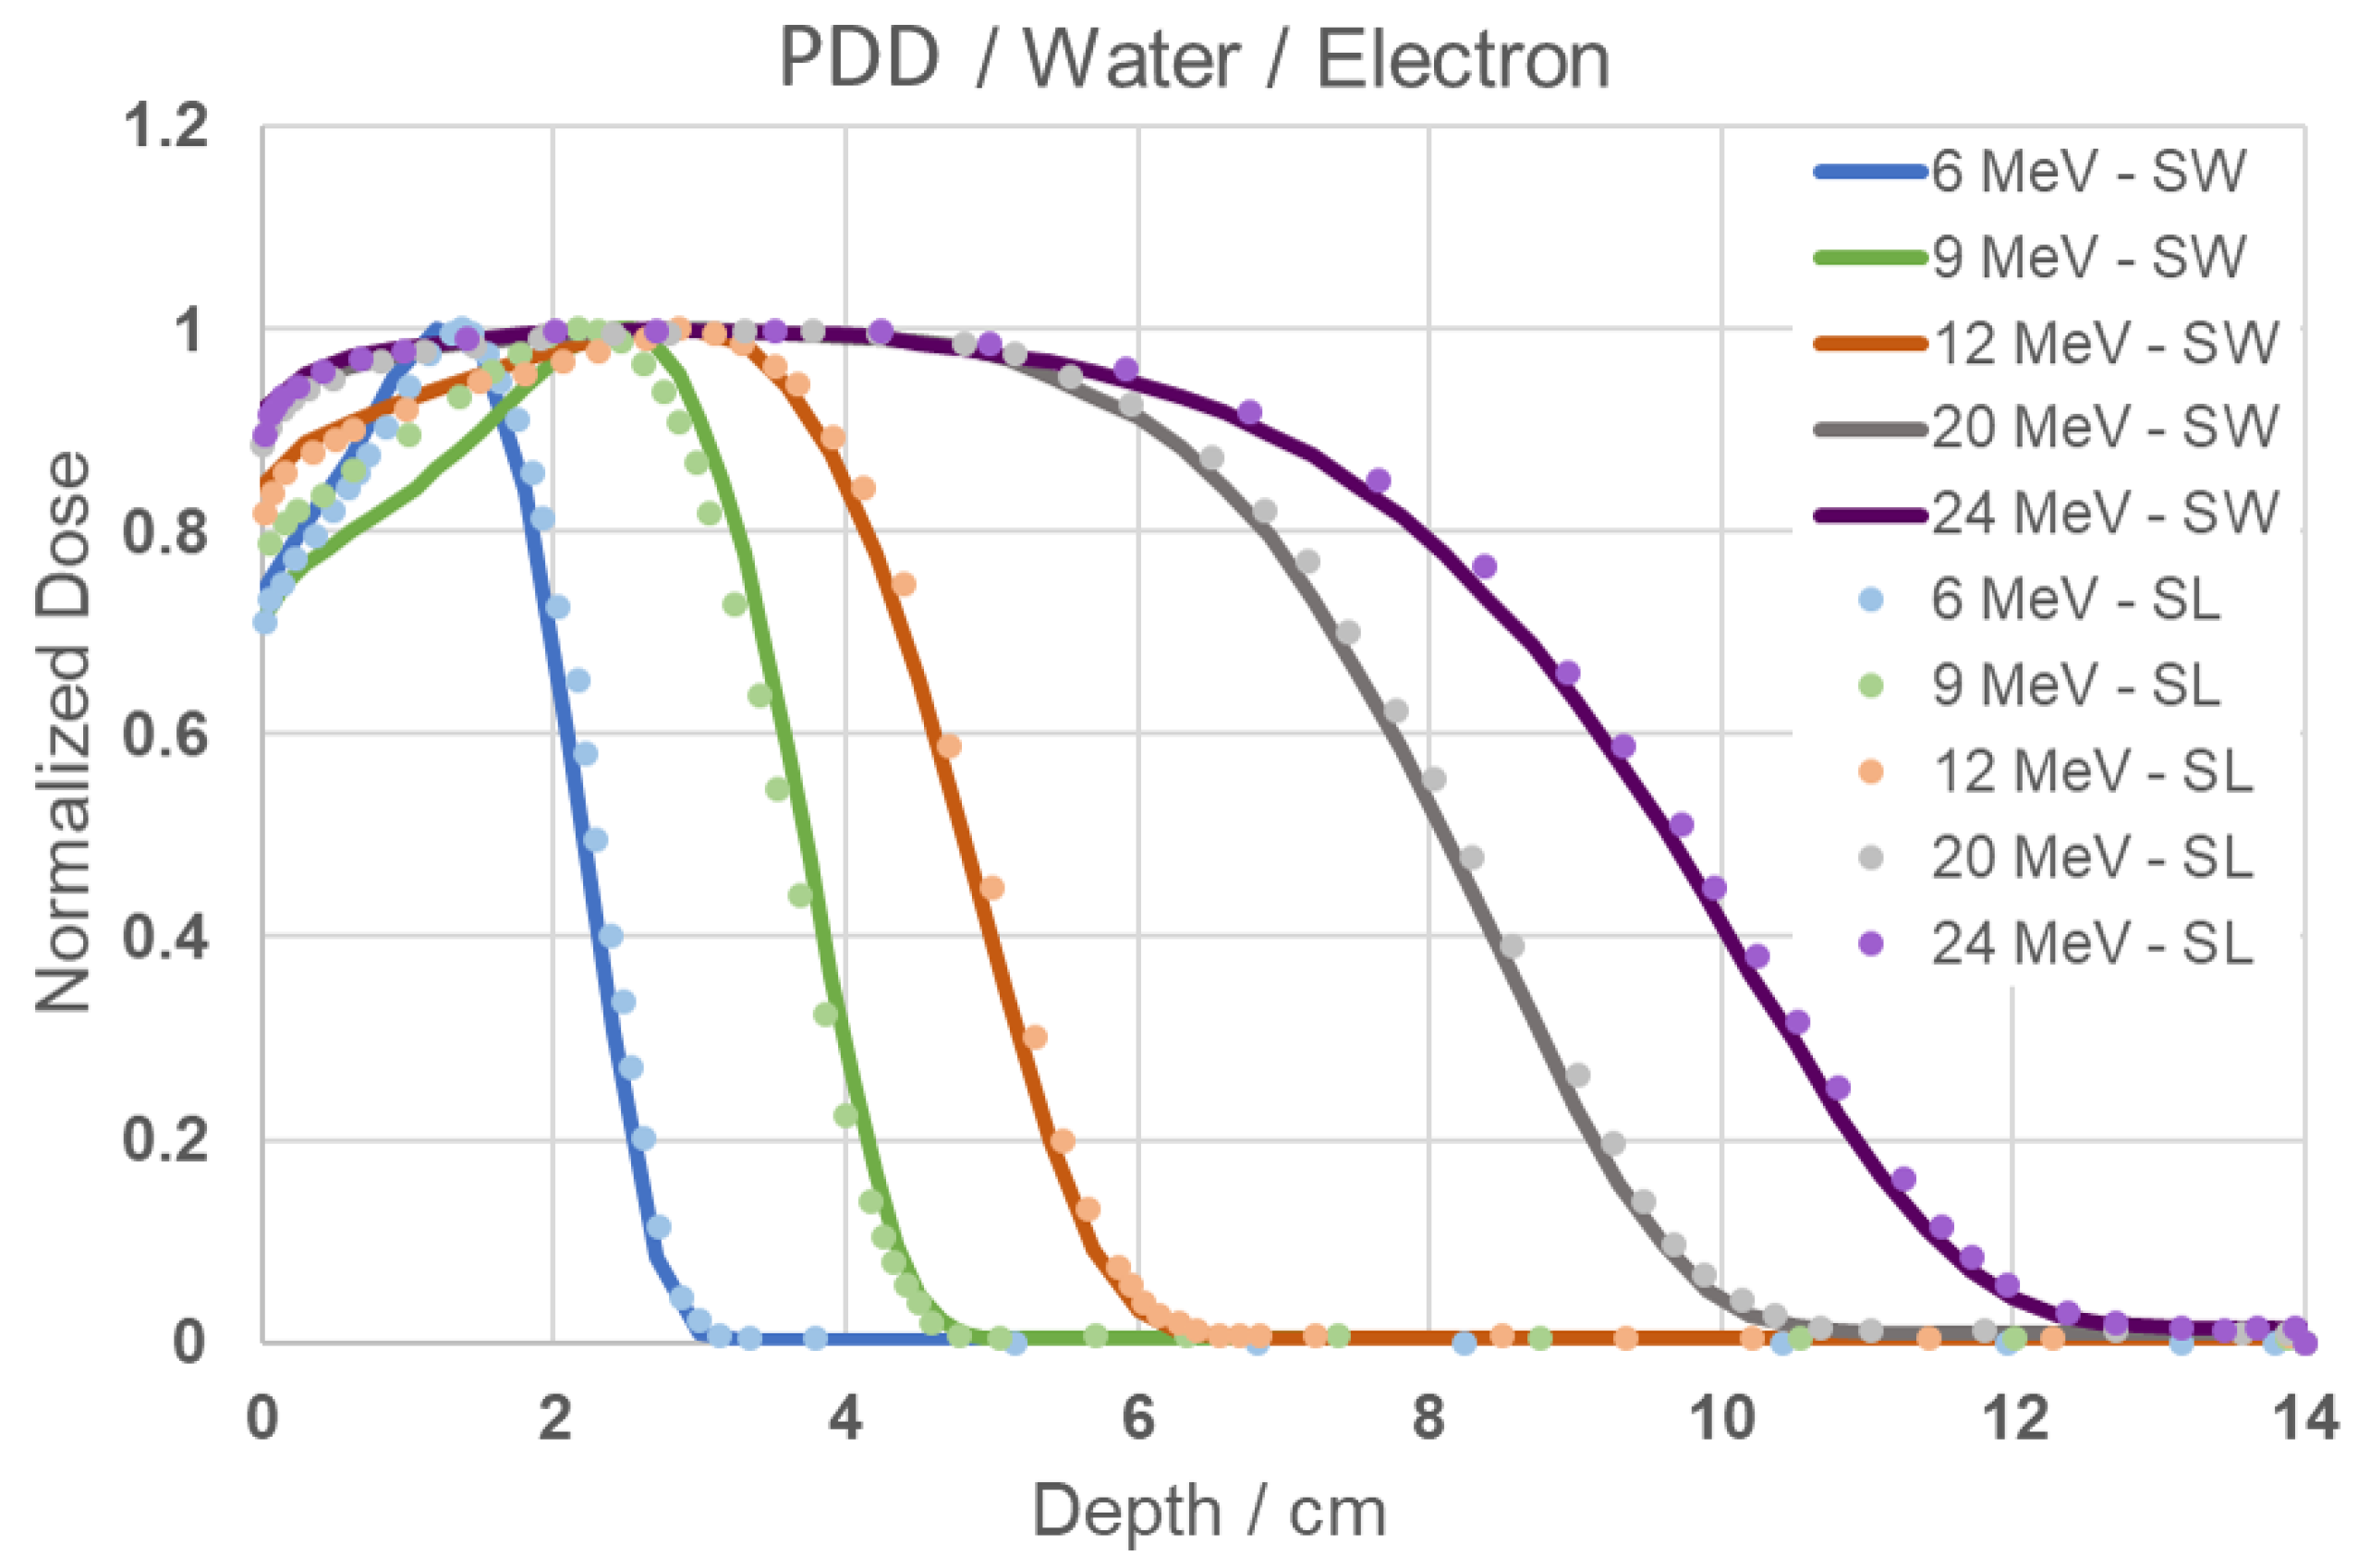
Figure 4.
PDD Comparison graph of results from positron e electron beams inciding on water for 6, 9, 12, 20 and 24 MeV energies.
Figure 4.
PDD Comparison graph of results from positron e electron beams inciding on water for 6, 9, 12, 20 and 24 MeV energies.
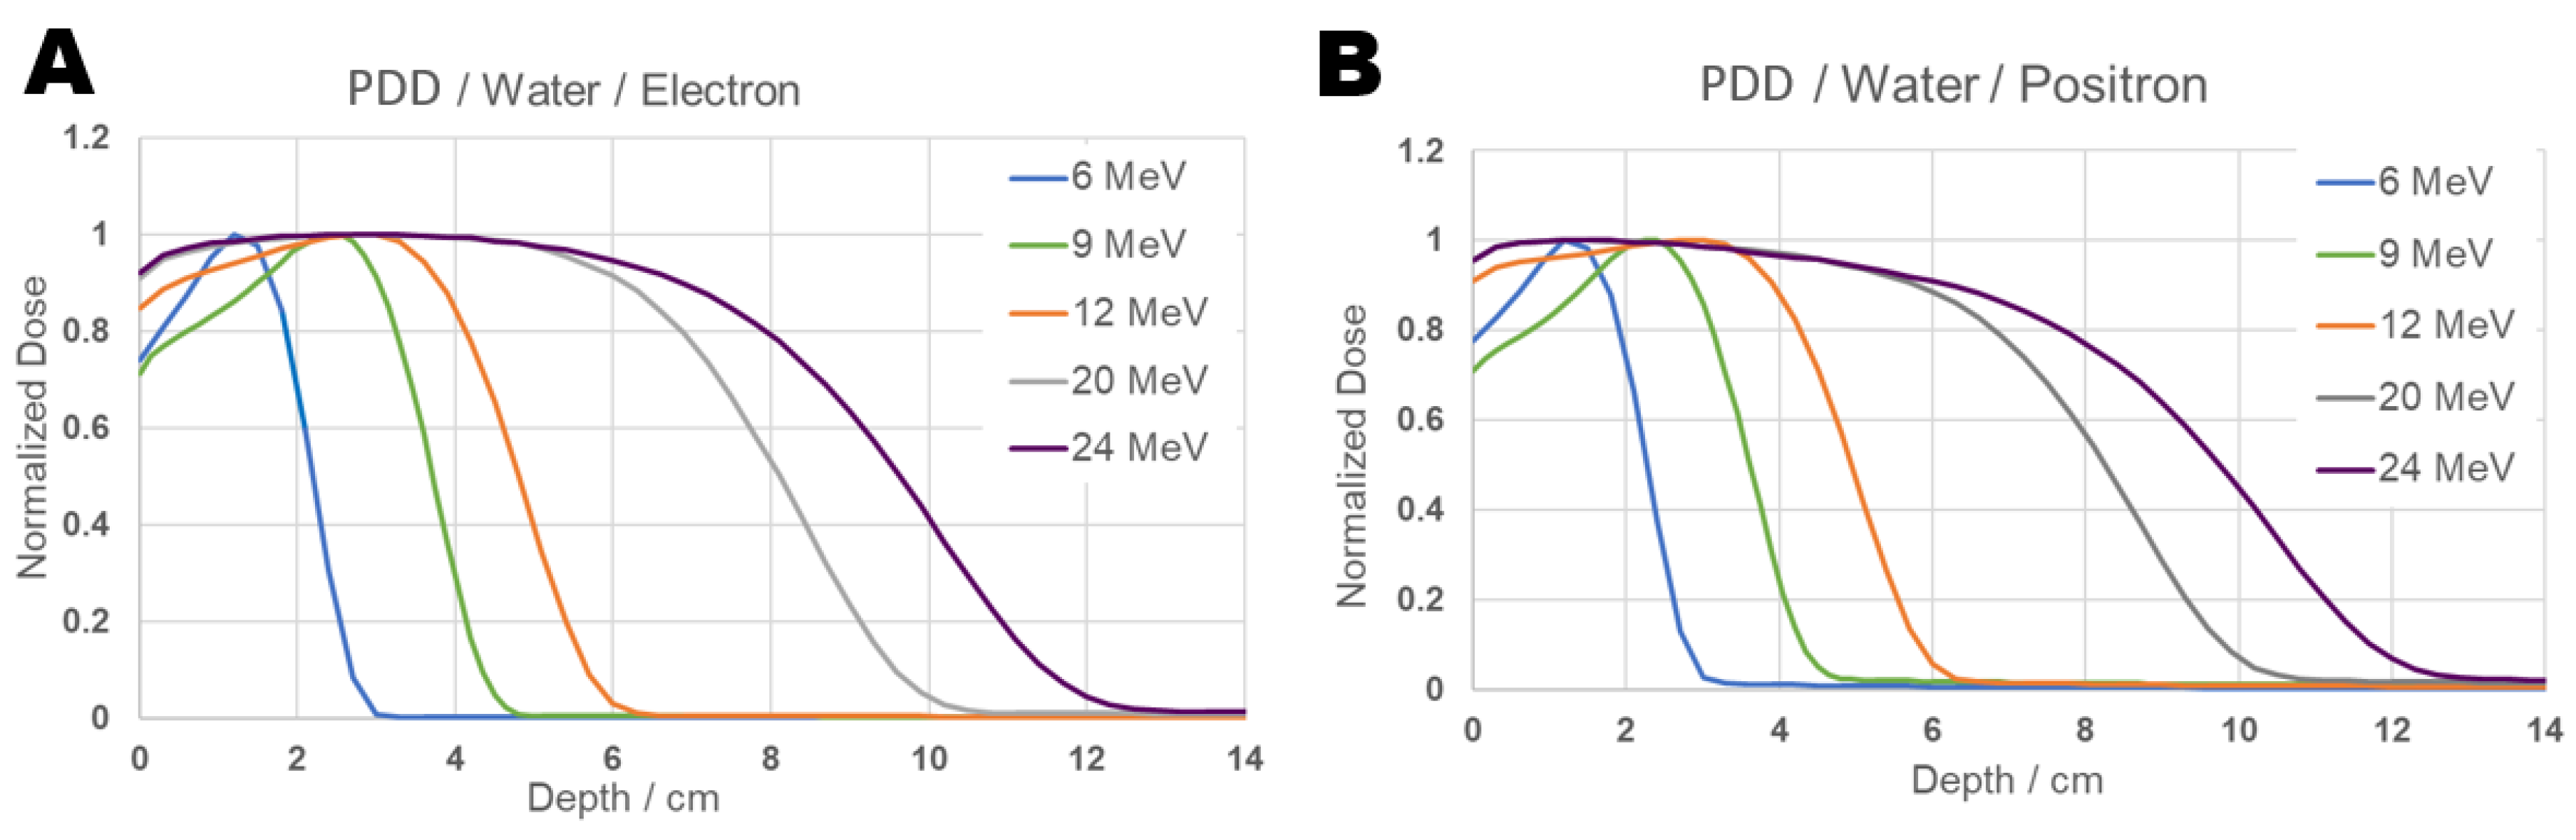
Figure 5.
PDD comparison graph: Individual results from positron and electron beams inciding on water for energies 6, 9, 12, 20, and 24 MeV.
Figure 5.
PDD comparison graph: Individual results from positron and electron beams inciding on water for energies 6, 9, 12, 20, and 24 MeV.
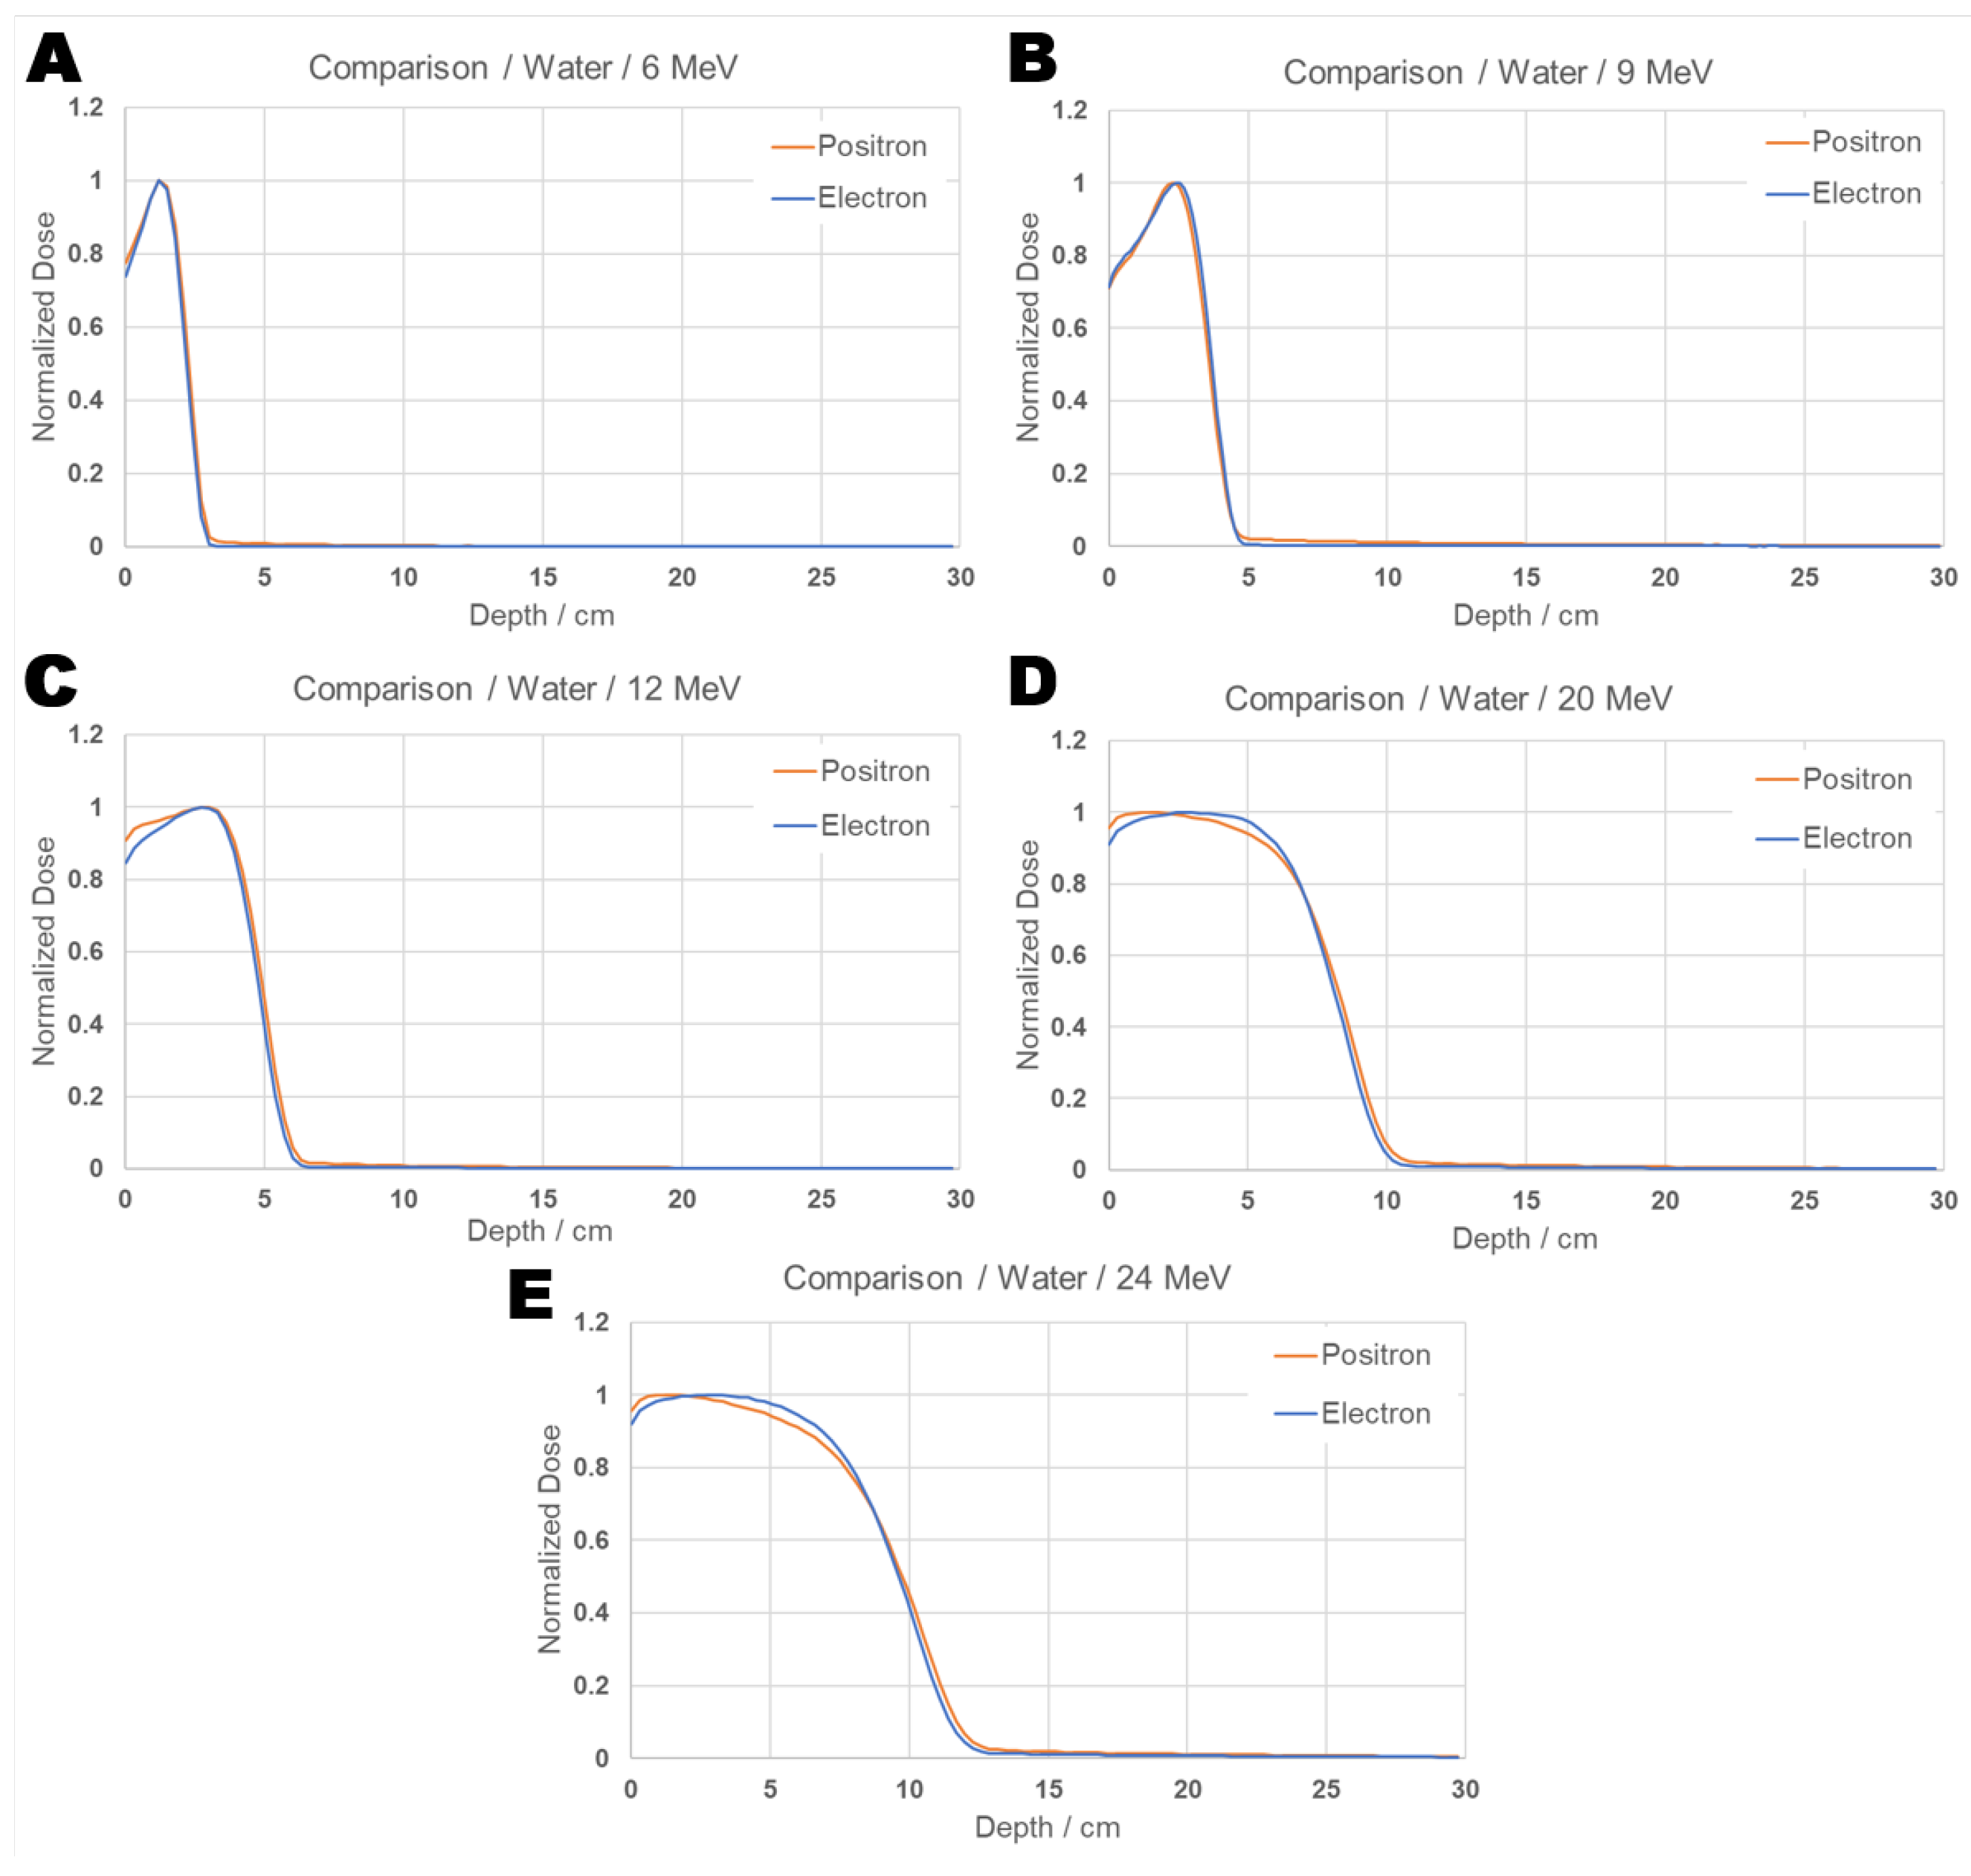
Figure 6.
PDD Comparison graph of results from positron e electron beams incident on tissue brain for 6, 9, 12, 20, and 24 MeV energies.
Figure 6.
PDD Comparison graph of results from positron e electron beams incident on tissue brain for 6, 9, 12, 20, and 24 MeV energies.
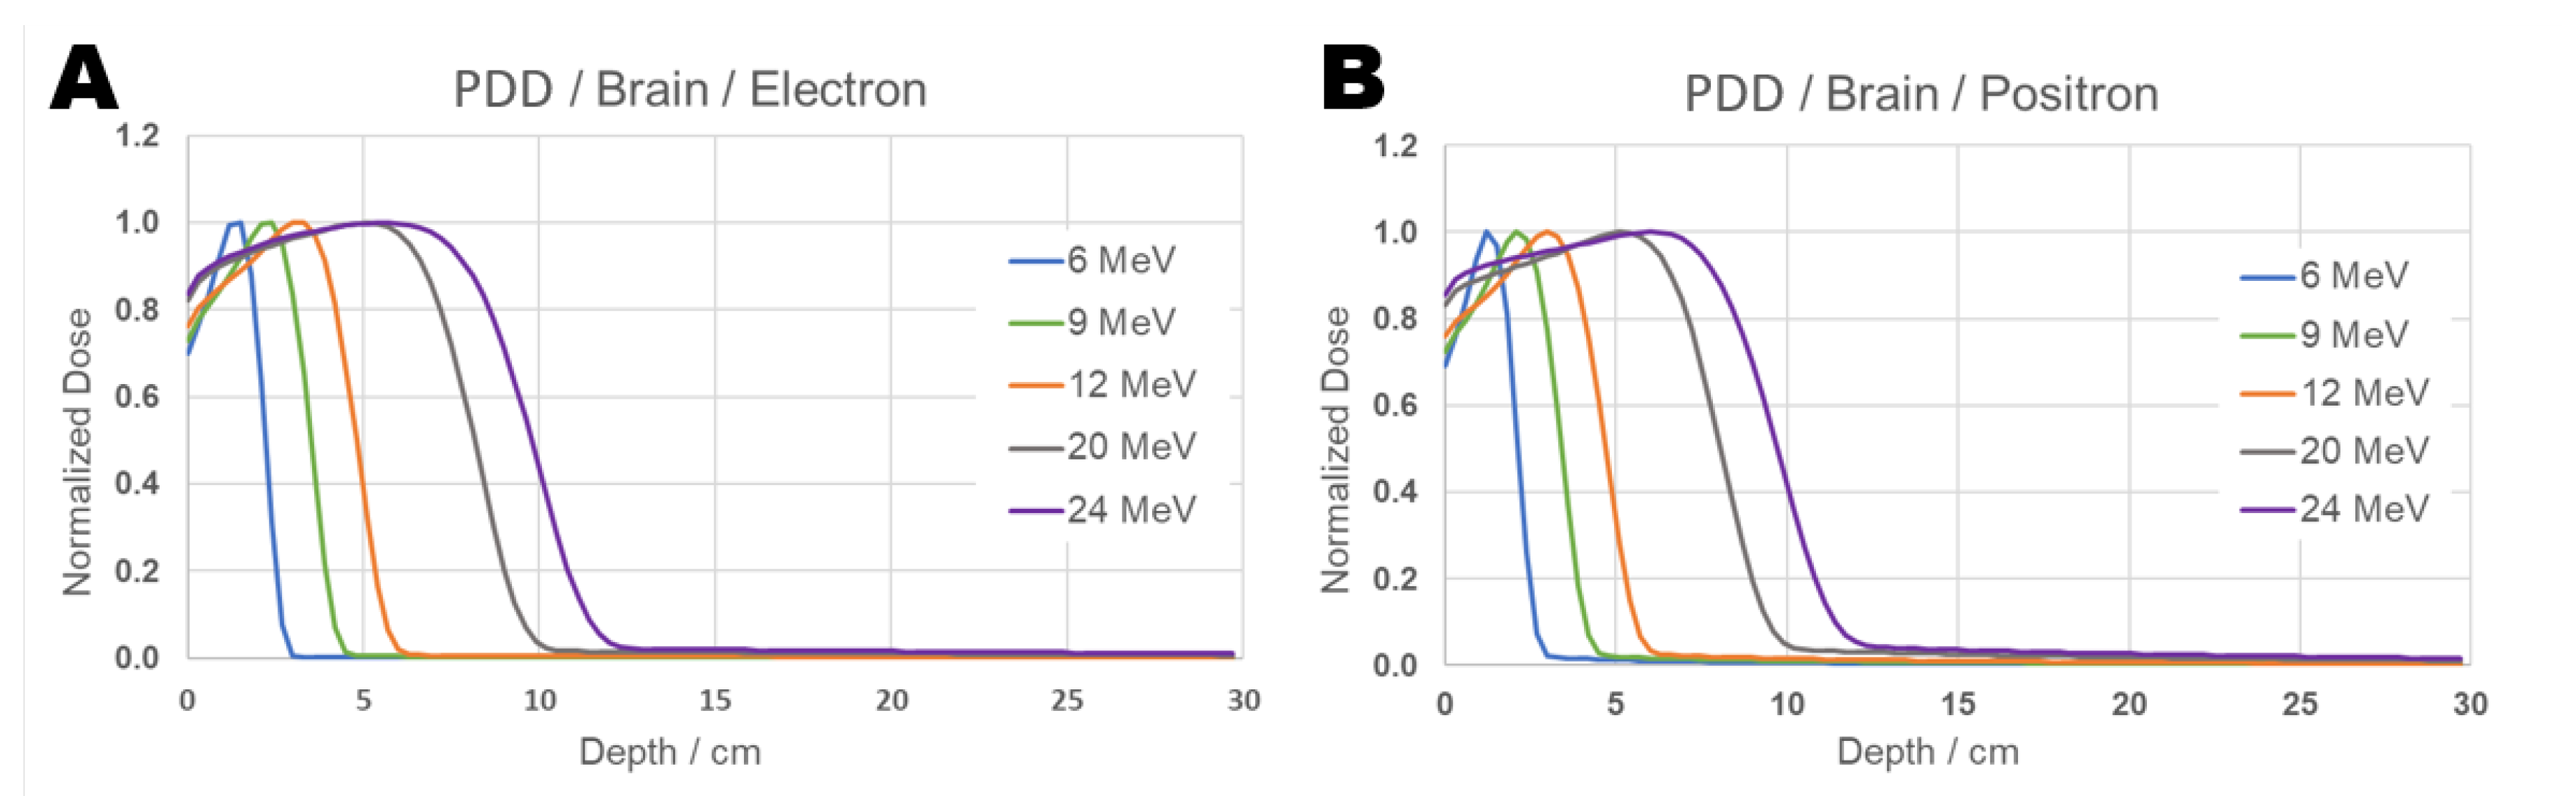
Figure 7.
PDD comparison graph: Individual results from positron and electron beams incident on tissue brain for energies 6, 9, 12, 20, and 24 MeV.
Figure 7.
PDD comparison graph: Individual results from positron and electron beams incident on tissue brain for energies 6, 9, 12, 20, and 24 MeV.
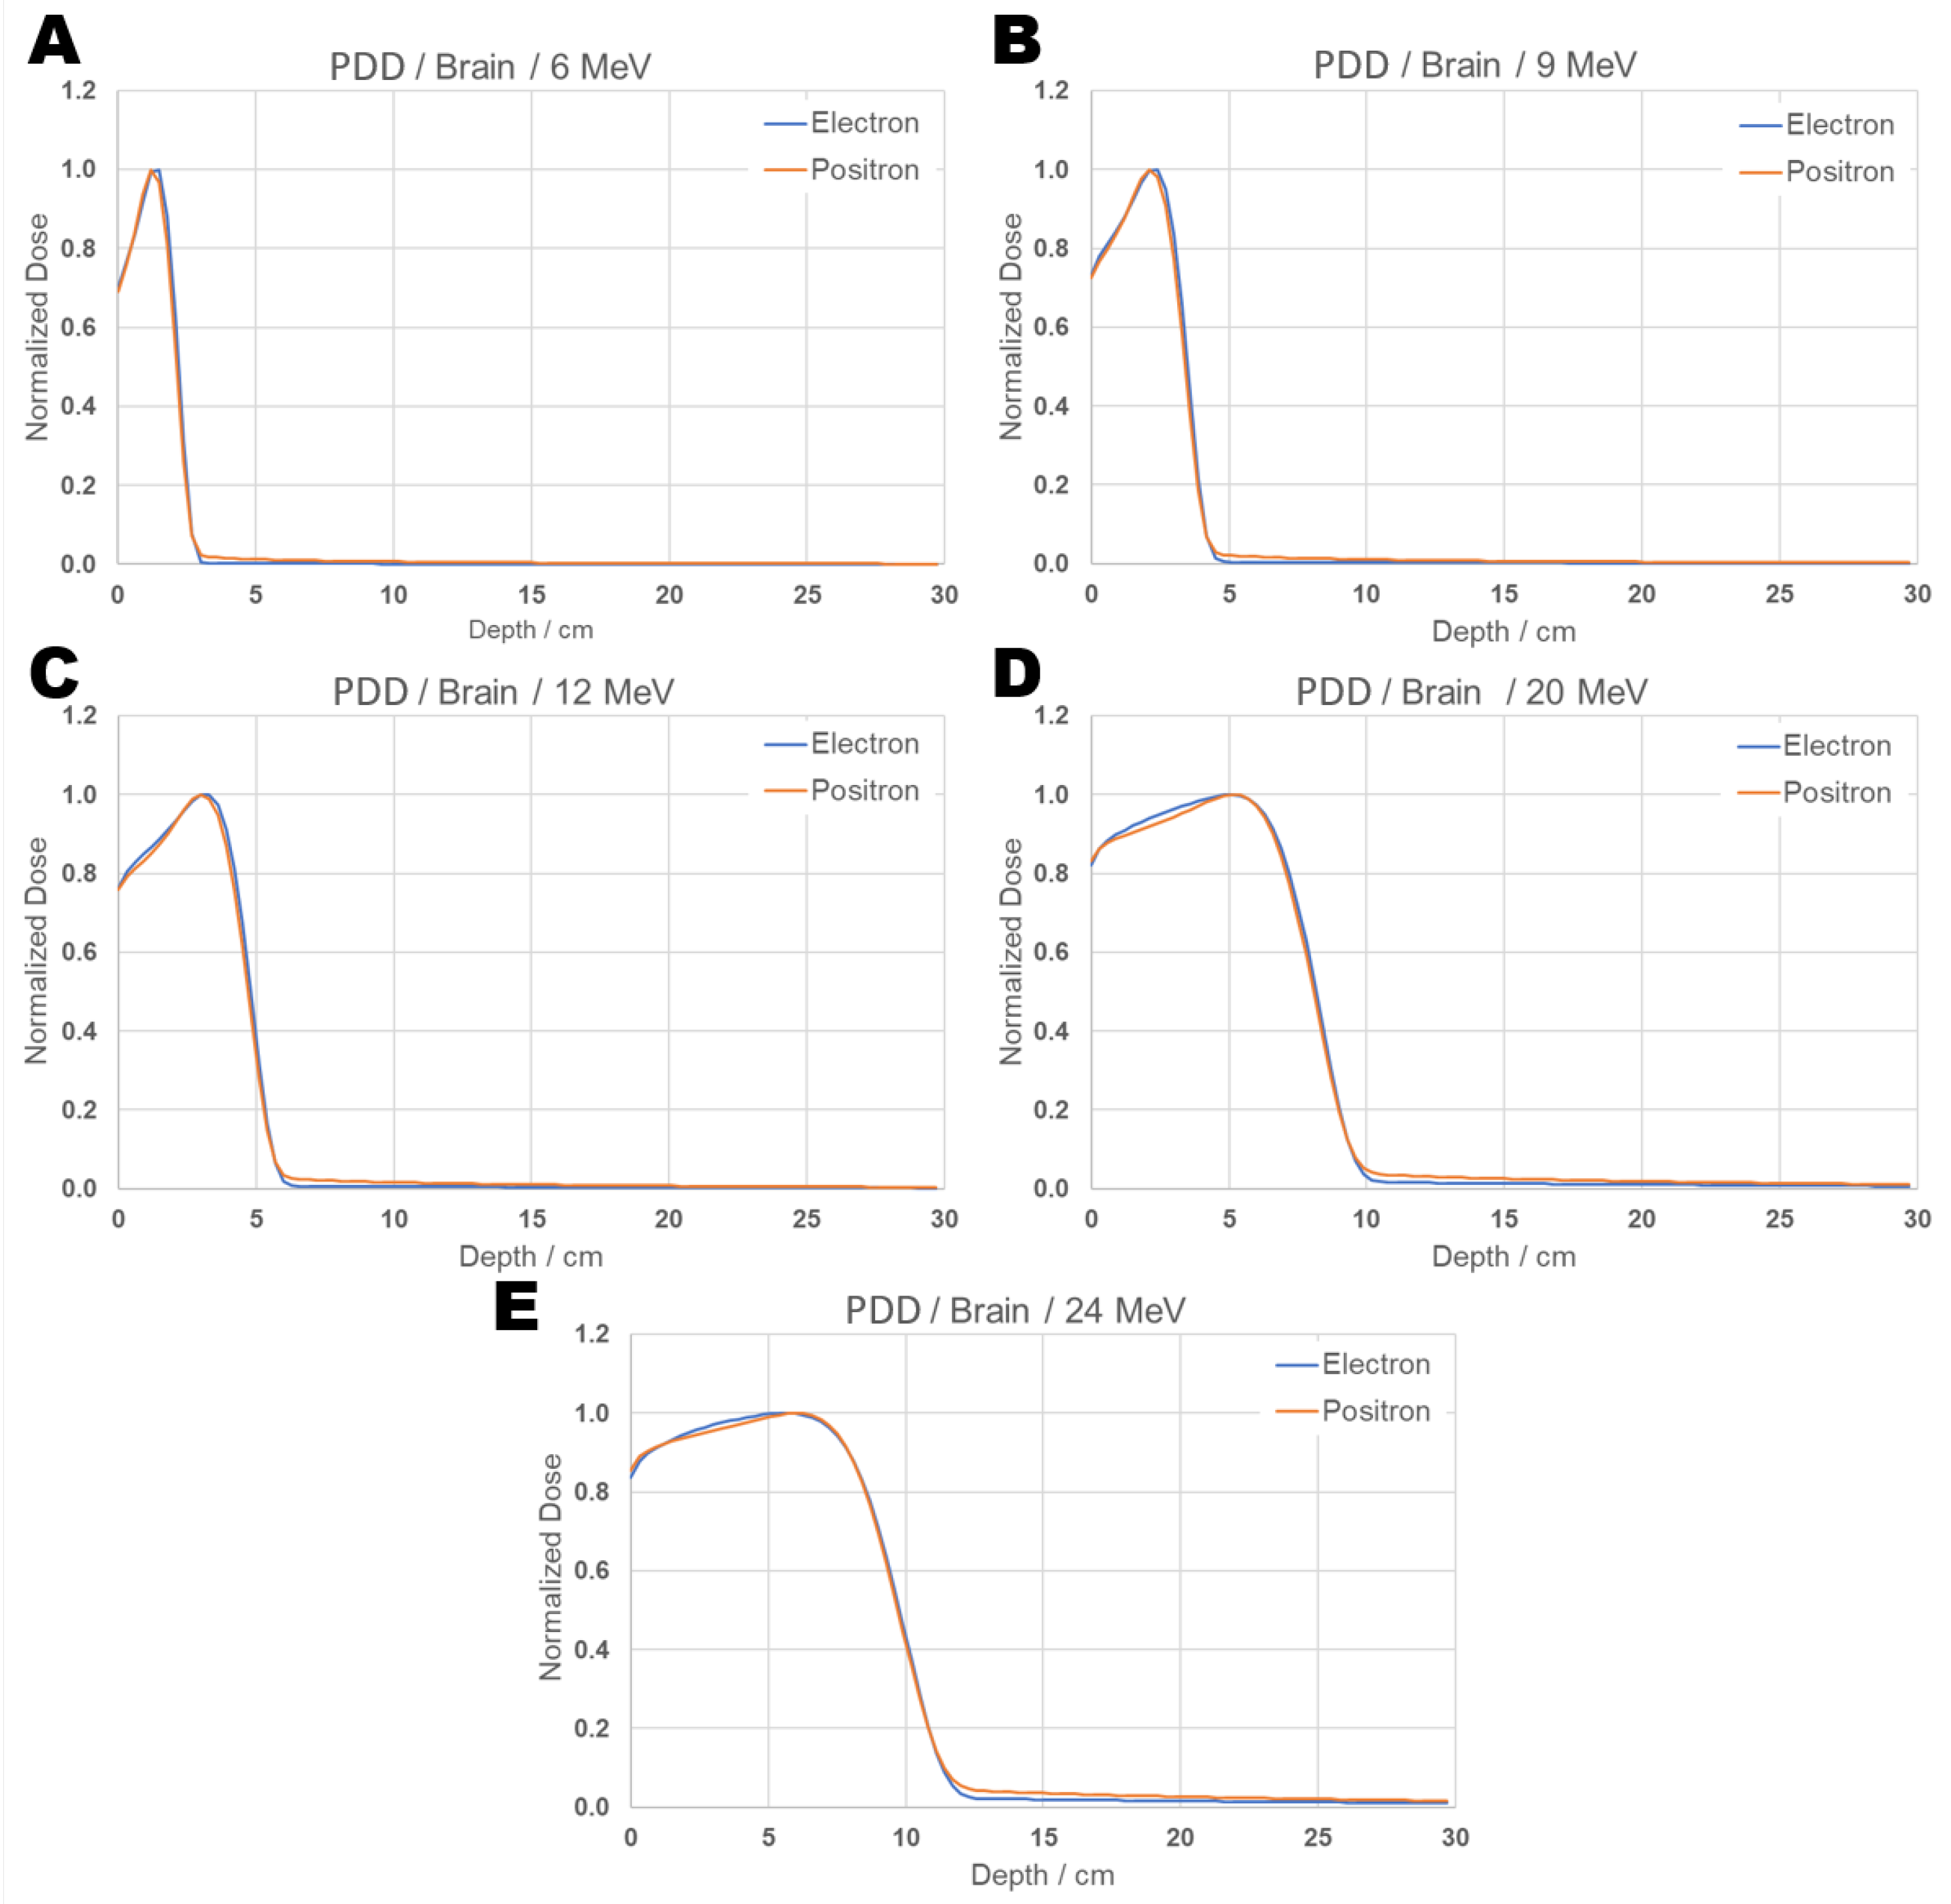
Figure 8.
PDD comparison graph: Individual results from positron and electron beams incident on tissue brain for energies 6, 9, 12, 20, and 24 MeV.
Figure 8.
PDD comparison graph: Individual results from positron and electron beams incident on tissue brain for energies 6, 9, 12, 20, and 24 MeV.
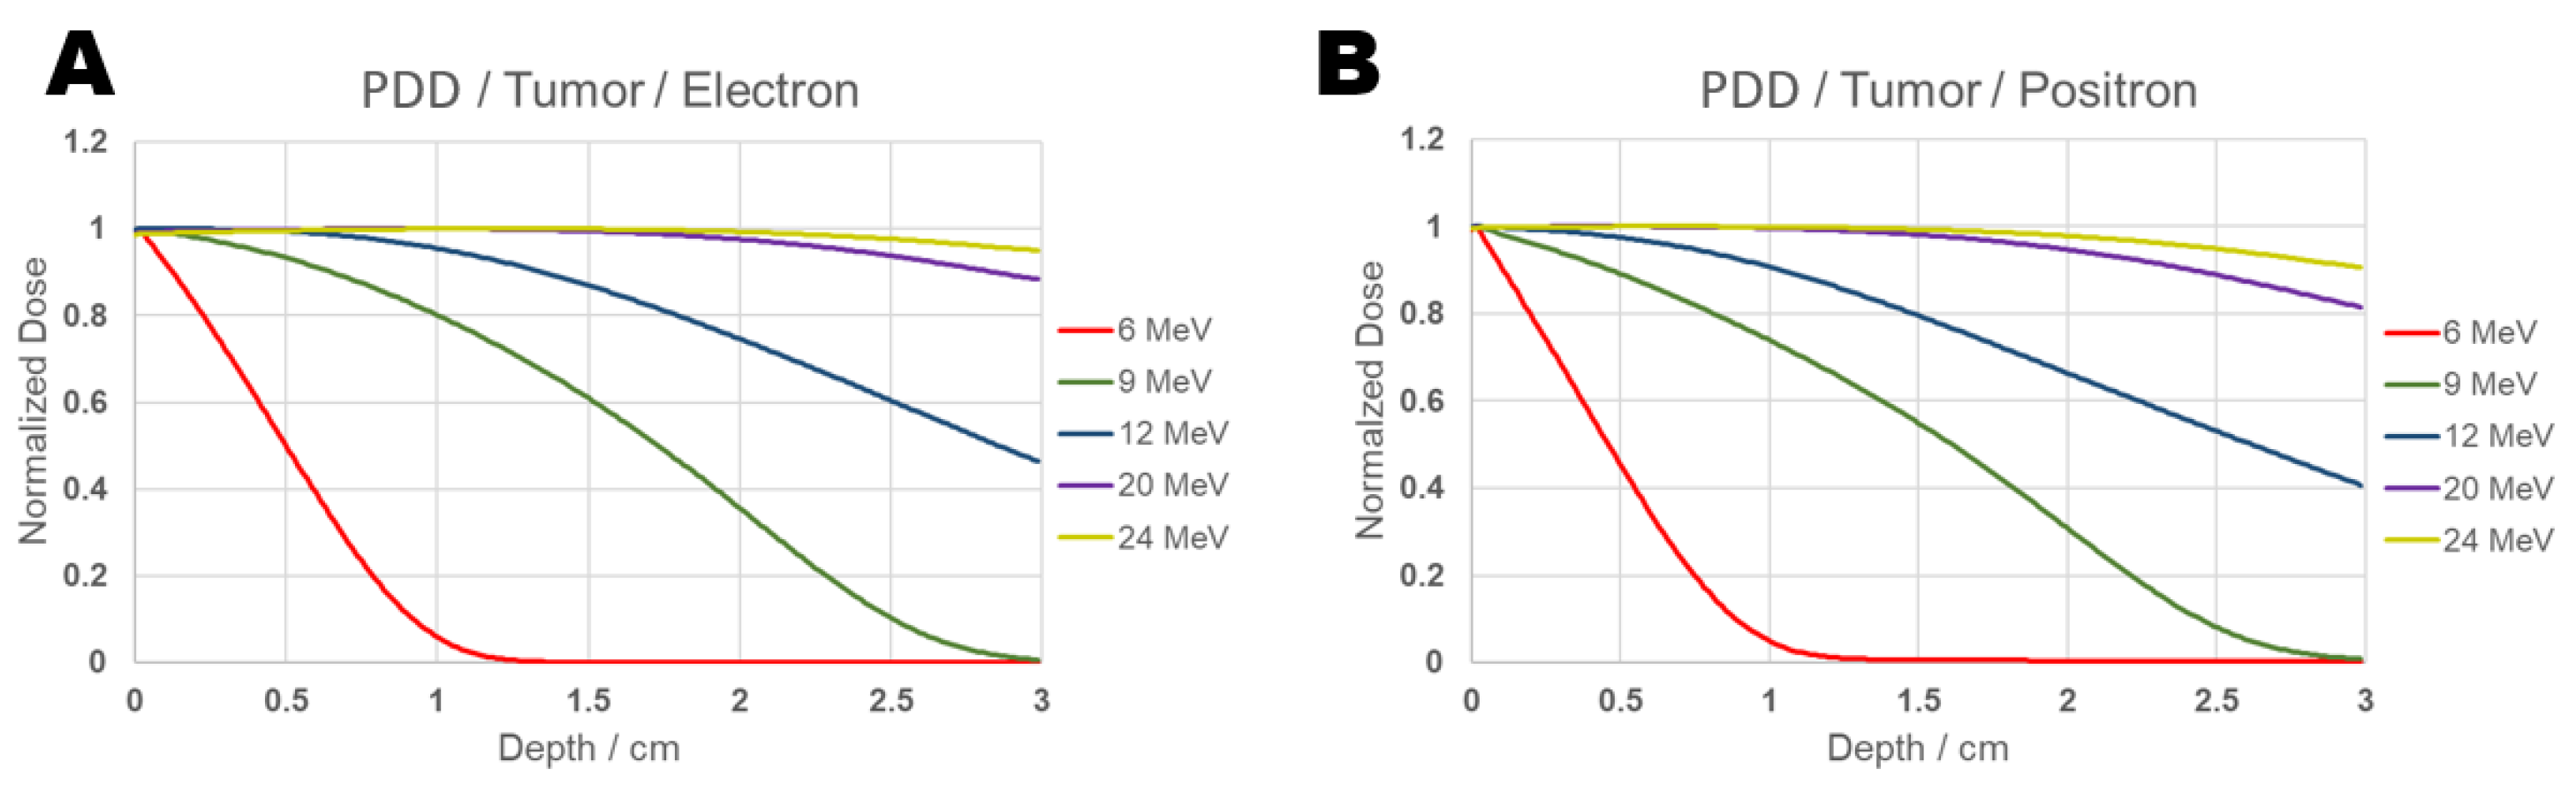
Figure 9.
PDD comparison graph: Individual results from positron and electron beams incident on tumor for energies 6, 9, 12, 20, and 24 MeV.
Figure 9.
PDD comparison graph: Individual results from positron and electron beams incident on tumor for energies 6, 9, 12, 20, and 24 MeV.
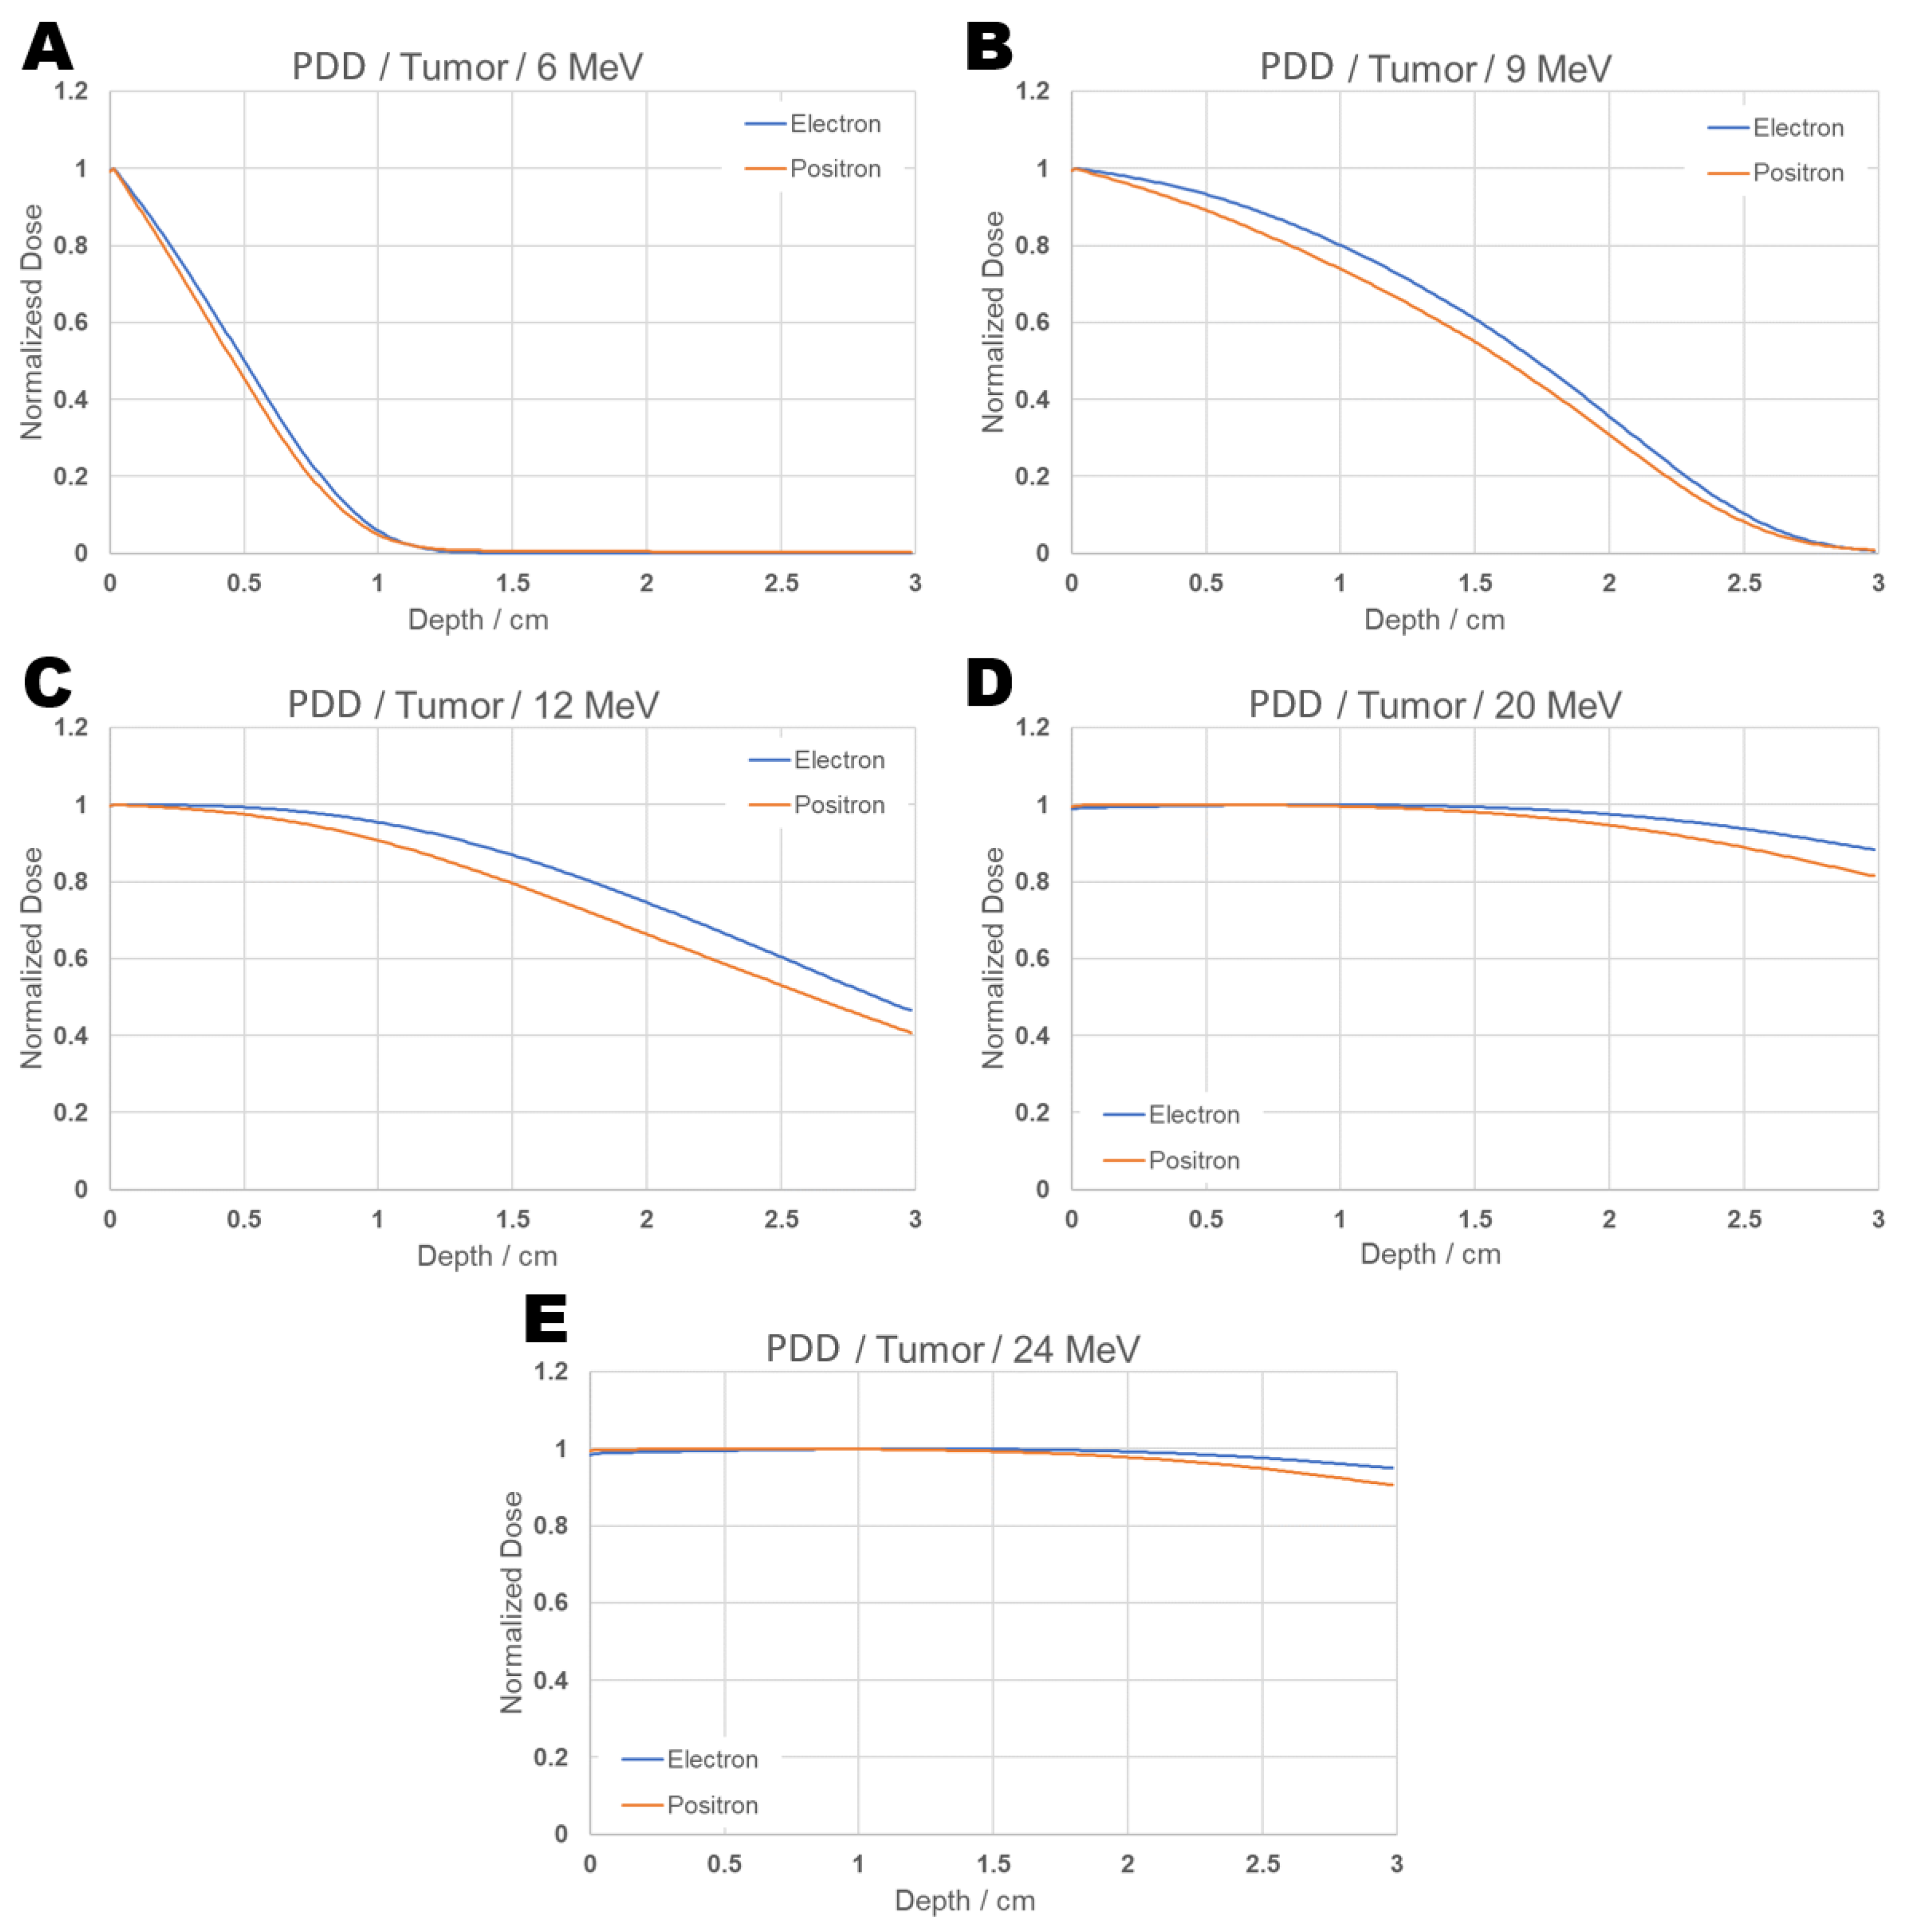
Table 1.
Beam parameters and scorer configuration used in the simulation.
| Parameter | Configuration |
|---|---|
| BeamAngularDistribution | Flat |
| BeamAngularCutoffX and Y | 2.8624 deg |
Table 2.
Brain components used in the simulation were taken from an ICRU 44 [23] data table.
Table 2.
Brain components used in the simulation were taken from an ICRU 44 [23] data table.
| Element | Fraction by weight |
|---|---|
| H | 0.107000 |
| C | 0.145000 |
| N | 0.022000 |
| O | 0.712000 |
| Na | 0.002000 |
| P | 0.004000 |
| S | 0.002000 |
| Cl | 0.003000 |
| K | 0.003000 |
Table 3.
Average percentage difference of the dose absorbed by positrons compared to electrons as a function of depth.
Table 3.
Average percentage difference of the dose absorbed by positrons compared to electrons as a function of depth.
| Energy range [MeV] | depth range [cm] | Mean percentage difference in absorbed dose |
|---|---|---|
| 6 MeV | ||
| 3 – 21.3 | 463.56 % | |
| 21.6 – 29.7 | 316.26% | |
| 9 MeV | ||
| 4.8 – 14.1 | 285.68% | |
| 14.4 – 28.8 | 183.34 % | |
| 29.1 – 29.7 | 161.38 % | |
| 12 MeV | ||
| 6.9 – 20.4 | 164.68% | |
| 25.5 – 29.7 | 112.10% | |
| 20 MeV | ||
| 12.6 – 20.1 | 99.49% | |
| 20.4 – 29.7 | 71.23 % | |
| 24 MeV | ||
| 10.2 – 14.7 | 73.61% | |
| 15 – 29.7 | 56.63 % |
Table 4.
Absorbed dose with respective percentage and depth for positrons incident on the tumor.
| Energy [MeV] | Absorbed Dose [Gy] | Percentage | Depth [cm] |
|---|---|---|---|
| 6 | 3.39E-02 | 100% | 0.015 |
| 6 | 3.08E-02 | 90% | 0.10 |
| 9 | 3.97E-02 | 100% | 0.015 |
| 9 | 3.58E-02 | 90% | 0.465 |
| 12 | 3.72E-02 | 100% | 0.015 |
| 12 | 3.36E-02 | 90% | 1.035 |
| 20 | 3.57E-02 | 100% | 0.45 |
| 20 | 3.22E-02 | 90% | 2.415 |
| 24 | 3.57E-02 | 100% | 0.615 |
| 24 | 3.23E-02 | 90.6% | 2.985 |
Table 5.
Absorbed dose with respective percentage and depth for electrons incident on the tumor.
| Energy [MeV] | Absorbed Dose [Gy] | Percentage | Depth [cm] |
|---|---|---|---|
| 6 | 3.72E-02 | 100% | 0.015 |
| 6 | 3.37E-02 | 90% | 0.12 |
| 9 | 4.14E-02 | 100% | 0.015 |
| 9 | 3.73E-02 | 90% | 0.645 |
| 12 | 3.91E-02 | 100% | 0.09 |
| 12 | 3.52E-02 | 90% | 1.335 |
| 20 | 3.76E-02 | 100% | 0.87 |
| 20 | 3.39E-02 | 90% | 2.835 |
| 24 | 3.75E-02 | 100% | 1.26 |
| 24 | 3.57E-02 | 95.12% | 2.985 |
Table 6.
Total absorbed dose in the tumor volume.
| Energy [MeV] | Total dose positron [Gy] | Total absorbed dose electron [Gy] |
|---|---|---|
| 6 | 5.67E-03 | 6.50E-03 |
| 9 | 2.02E-02 | 2.30E-02 |
| 12 | 2.88E-02 | 3.23E-02 |
| 20 | 3.42E-02 | 3.68E-02 |
| 24 | 3.50E-02 | 3.72E-02 |
Disclaimer/Publisher’s Note: The statements, opinions and data contained in all publications are solely those of the individual author(s) and contributor(s) and not of MDPI and/or the editor(s). MDPI and/or the editor(s) disclaim responsibility for any injury to people or property resulting from any ideas, methods, instructions or products referred to in the content. |
© 2025 by the authors. Licensee MDPI, Basel, Switzerland. This article is an open access article distributed under the terms and conditions of the Creative Commons Attribution (CC BY) license (http://creativecommons.org/licenses/by/4.0/).
Copyright: This open access article is published under a Creative Commons CC BY 4.0 license, which permit the free download, distribution, and reuse, provided that the author and preprint are cited in any reuse.


