Submitted:
18 June 2025
Posted:
19 June 2025
You are already at the latest version
Abstract
Elevated extracellular potassium (K⁺) in the tumor microenvironment (TME) is increasingly recognized as a critical factor influencing tumor progression and immune suppression. Current methods for noninvasively mapping of potassium distribution in tumors are limited. Here, we employed photoacoustic chemical imaging (PACI) with a solvatochromic dye-based, potassium-sensitive nanoprobe (SDKNP) to quantitatively visualize extracellular potassium levels in orthotopic breast tumor mouse models. Tumors of three distinct sizes (5 mm, 10 mm, and 20 mm) were imaged using multi-wavelength photoacoustic imaging at five laser wavelengths (560, 576, 584, 605, and 625 nm). Potassium concentration maps derived from spectral unmixing of the photoacoustic images at the five laser wavelengths revealed significantly increased potassium levels in larger tumors, confirmed independently by inductively coupled plasma mass spectrometry (ICP-MS). The PACI results matched ICP-MS measurements, validating PACI as a robust, noninvasive imaging modality for potassium mapping in tumors in vivo. This work establishes PACI as a promising tool for studying the chemical properties of TME and provides a foundation for future studies evaluating immunotherapy response through ionic biomarker imaging.
Keywords:
photoacoustic
; chemical imaging
; breast cancer
; CCN6
; nanoparticle
; potassium
1. Introduction
The tumor microenvironment (TME) plays a central role in cancer progression, resistance to therapy, and immune system evasion. A defining feature of the TME is its abnormal chemical composition, including hypoxia (reduced oxygen concentration), acidosis (decreased pH), and hyperkalemia (elevated extracellular potassium, K⁺) [1,2,3]. These conditions frequently co-exist in solid tumors and contribute to treatment failure by creating a physiologically hostile and therapy-resistant environment. Among them, hyperkalemia, i.e., increased K⁺ concentration, has recently gained attention as a potentially important but relatively under-investigated factor in tumor biology.
K⁺ is the most abundant intracellular cation. Under normal physiological conditions, the intracellular K⁺ concentration exceeds 100 mM [4,5], whereas the extracellular level is maintained around 5 mM. In solid tumors, especially within necrotic regions that develop under hypoxic and nutrient-deprived conditions, cellular lysis results in the release of intracellular K⁺ into the extracellular space. This process can increase the local extracellular K⁺ concentration by 5- to 10-fold [5,6]. Such elevated K⁺ levels have been shown to suppress T cell effector functions and impair immune surveillance [6,7], indicating that K⁺ accumulation in the TME may serve as a mechanism by which tumors evade the host immune response.
Although the significance of extracellular K⁺ in regulating the TME is increasingly recognized, current imaging techniques are not well-suited for measuring K⁺ levels in vivo with sufficient spatial and temporal resolution. ³⁹K magnetic resonance imaging (MRI) [8] has been used for K⁺ mapping but is limited by low sensitivity, poor spatial resolution, and high operational cost. Fluorescence-based sensors offer high sensitivity in vitro but are unsuitable for deep-tissue imaging due to strong optical scattering in biological tissues [9]. Ion-selective microelectrodes provide accurate measurements but are invasive and lack the capability to generate spatial maps of K⁺ distribution in intact tissues. These limitations highlight the need for a new imaging approach that can noninvasively quantify extracellular K⁺ in vivo with high resolution.
To overcome this gap, we developed a photoacoustic chemical imaging (PACI) technique [9,10,11,12,13,14,15] using an ionophore-based, potassium-sensitive nanoprobe. This solvatochromic dye-based K⁺-sensing nanoparticle (SDKNP) undergoes a change in optical absorption in response to K⁺ binding, which can be detected through PACI [16]. PACI combines the molecular contrast of optical techniques with the high spatial resolution and deep tissue penetration of ultrasound, enabling real-time, non-invasive imaging of tissue chemical composition in vivo.
We have previously demonstrated the application of PACI for quantitative in vivo imaging of extracellular K⁺ concentrations in tumor tissue using a subcutaneous glioma mouse model [16]. By injecting SDKNP into subcutaneous tumor models in mice, we capture high-resolution K⁺ maps and validate them through inductively coupled plasma mass spectrometry (ICP-MS) [6]. We further examine how K⁺ levels vary with tumor size, uncovering insights into the evolution of hyperkalemia in tumor progression.
This work establishes PACI as a powerful tool for mapping functional biomarkers in the TME and opens new approaches for investigating the chemical underpinnings of cancer therapy resistance. In the long term, K⁺ imaging may provide critical guidance for personalized treatment strategies and deepen our understanding of the biochemical landscape of solid tumors.
2. Materials and Methods
2.1. Chemicals
Millipore water was used for all syntheses and buffer preparations. Chemicals purchased from Sigma-Aldrich (St. Louis, Mississippi, USA) include Pluronic F-127, valinomycin, dioctyl sebacate, sodium tetrakis[3,5-bis(trifluoromethyl)phenyl]borate, potassium chloride, acetonitrile, acetic anhydride, 1-iodooctadecane, 2-methylbenzothiazole, (dimethylamino)cinnamaldehyde, sodium iodide, diethyl ether, and methanol.
2.2. Synthesis of SDKNP
Synthesis of SDKNP was first reported by Eric Bakker’s group, and few changes were made to the original protocol [17].
2.2.1. 2-methyl-3-octadecylbenzo[d]thiazol-3-ium (SD2a)
2-methylbenzothiazole (1.5 g, 10 mmol) and 1-iodooctadecane (3.8 g, 10 mmol) were dissolved and refluxed in acetonitrile for 24 hours. The solution was removed from heat and allowed to solidify. The crude product was further precipitated in diethyl ether, collected, and washed several times in diethyl ether. Once dried, the product was used without any further purification.
2.2.2. 2-((1E,3E)-4-(4-(dimethylamino)phenyl)buta-1,3-dien-1-yl)-3-octadecylbenzo[d]thiazol-3-ium iodide (SD2)
SD2a (265 mg, 0.7 mmol) along with (dimethylamino)cinnamaldehyde (122 mg, 0.7 mmol) was dissolved in acetic anhydride and refluxed for 20 minutes. The reaction solution was then poured into a warm solution of 10mM sodium iodide (in Millipore water). The dark purple precipitate was washed several times with water, dried, collected, and used without any further purification.
2.2.3. SDKNP
SD2 (0.2 mg, 0.3μmol), sodium tetrakis[3,5-bis(trifluoromethyl)phenyl]borate (0.9 mg, 1 μmol), valinomycin (1.2 mg, 1 μmol), Pluronic F-127 (5 mg, 0.4 μmol), and dioctyl sebacate (8 mg, 19 μmol, 8.75 μL) were dissolved in 3mL of methanol. The methanol cocktail was then injected into 30 mL of Millipore water under vigorous stirring. The surface of the methanol-water mixture was blasted with argon gas for 1 hour to remove the methanol. The nanoparticle solution was concentrated to the desired concentration using an Amicon Ultra-15 centrifuge filter (100k Da).
2.3. Animal Models
All animal procedures were approved by the University Committee on the Use and Care of Animals (UCUCA) at the University of Michigan (Protocol #PRO00011264; PI: Janggun Jo). Mice were housed in the Unit for Laboratory Animal Medicine (ULAM) at the University of Michigan Medical School. Orthotopic xenograft mouse models of breast cancer were used in this study. Eight-week-old female FVB/NJ mice (The Jackson Laboratory, stock #001800) were orthotopically injected with 5 × 10⁵ breast cancer cells (Ccn6-KO-CCN6-OV) suspended in 50 μL of Matrigel into the right inguinal mammary fat pad [18,19,20,21,22,23,24,25]. Tumor growth was monitored daily using caliper measurements. Mice were selected for imaging when tumors reached target sizes of 0.5 cm, 1.0 cm, or 2.0 cm in diameter. At these defined tumor sizes, animals were used for both photoacoustic K⁺ imaging and quantitative analysis of tumor K⁺ concentration by inductively coupled plasma mass spectrometry (ICP-MS) [26], which served as the reference standard.
2.4. Multi-Wavelength Photoacoustic Ratiometric Imaging of K⁺
To image extracellular K⁺ levels in vivo using SDKNP, we employed a multi-wavelength photoacoustic ratiometric imaging technique previously developed by our group [9,16]. Photoacoustic imaging was conducted at five laser excitation wavelengths: 560, 576, 584, 605, and 625 nm. These wavelengths were selected based on isosbestic points and regions of maximal spectral separation between different concentrations of SDKNP and, oxy-hemoglobin, and deoxy-hemoglobin (Hb/HbO₂), to optimize the spectral unmixing process (Figure 1). A tunable optical parametric oscillator (OPO) laser system, pumped by the third harmonic (355 nm) of a Nd:YAG laser (Continuum, Santa Clara, CA, USA), was used for excitation, delivering 5 ns pulses at a repetition rate of 10 Hz. [9,16]. The photoacoustic and ultrasound dual-modality imaging system consisted of a programmable research ultrasound platform (Vantage 256, Verasonics, Kirkland, WA, USA) integrated with a 128-element linear-array transducer (CL15-7, Philips, Andover, MA, USA) with a center frequency range of 7–15 MHz. For photoacoustic imaging, mice bearing orthotopic CCN6 tumors of different sizes (0.5, 1.0, and 2.0 cm) were locally injected with 50 µL of 10 mg/mL SDKNP into the tumor. Photoacoustic signals were acquired at each of the five wavelengths, with 50-frame signal averaging performed per wavelength to enhance the signal-to-noise ratio. Spectral unmixing and ratiometric analysis were performed on a pixel-by-pixel basis using custom MATLAB scripts (R2022b, MathWorks, Natick, MA). From the five-wavelength image sets, the photoacoustic intensities of each pixels were introduced to separate the contributions to spectroscopic photoacoustic measurement from the two forms of hemoglobin and the SDKNP. For the multi-wavelength photoacoustic radiometric imaging of potassium, we used the optical absorption changes of SDKNP depending on the K⁺ concentration (Figure 2A) and the ratios relative to the photoacoustic intensity at 560 nm (Figure 2B). As the previous studies for PACI technique [9,16], K⁺ concentration maps were generated from the breast tumor models, enabling quantitative evaluation of extracellular K⁺ distribution in tumors of varying sizes.
2.5. Collection of Tumor Interstitial Fluid
Tumor interstitial fluid samples were collected using previously established protocols [26]. Briefly, surgically resected tumors had their surfaces rinsed with 0.9% saline solution before being gently blotted dry to remove surface moisture and blood. Tumors were then placed in Eppendorf tubes and centrifuged at 106 g for 10 min. Obtained tumor interstitial fluid volumes were typically between 1-5 μL.
2.6. Inductively Coupled Plasma Mass Spectrometry.
Tumor interstitial fluid samples were diluted by a factor 100,000 in Millipore water before being filtered using a 0.2 μm syringe filter. Samples were analyzed using a Perkin Elmer Nexion 2000 ICP-MS instrument.
3. Results
To investigate the relationship between tumor size and extracellular K⁺ levels, we employed PACI using a K⁺-sensitive nanoprobe, SDKNP, in orthotopic CCN6 breast tumor-bearing mice. Mice were divided into three groups based on tumor size, as measured along the longest dimension: Group 1 (5 mm, n = 4), Group 2 (10 mm, n = 3), and Group 3 (20 mm, n = 4). After the intratumor injection of SDKNP, multi-wavelength photoacoustic imaging was performed at five selected wavelengths (560, 576, 584, 605, and 625 nm). K⁺ distribution maps were generated using spectral unmixing and ratiometric analysis (Figure 3A).
As shown in Figure 3A, representative K⁺ maps from each group show the spatial distribution of K⁺ in the tumors. Visual inspection suggests an increase in K⁺ signal intensity with tumor size. Quantitative analysis of mean K⁺ levels across all animals within each group is presented in Figure 3B. Group-wise comparisons using two-sample t-tests revealed a statistically significant difference between Group 1 and Group 3 (p = 0.0059), indicating the presence of elevated K⁺ levels in larger tumors (Figure 3B). Comparisons between Group 1 and Group 2 (p = 0.1413) and between Group 2 and Group 3 (p = 0.0535) did not reach statistical significance, although the latter showed a trend toward significance.
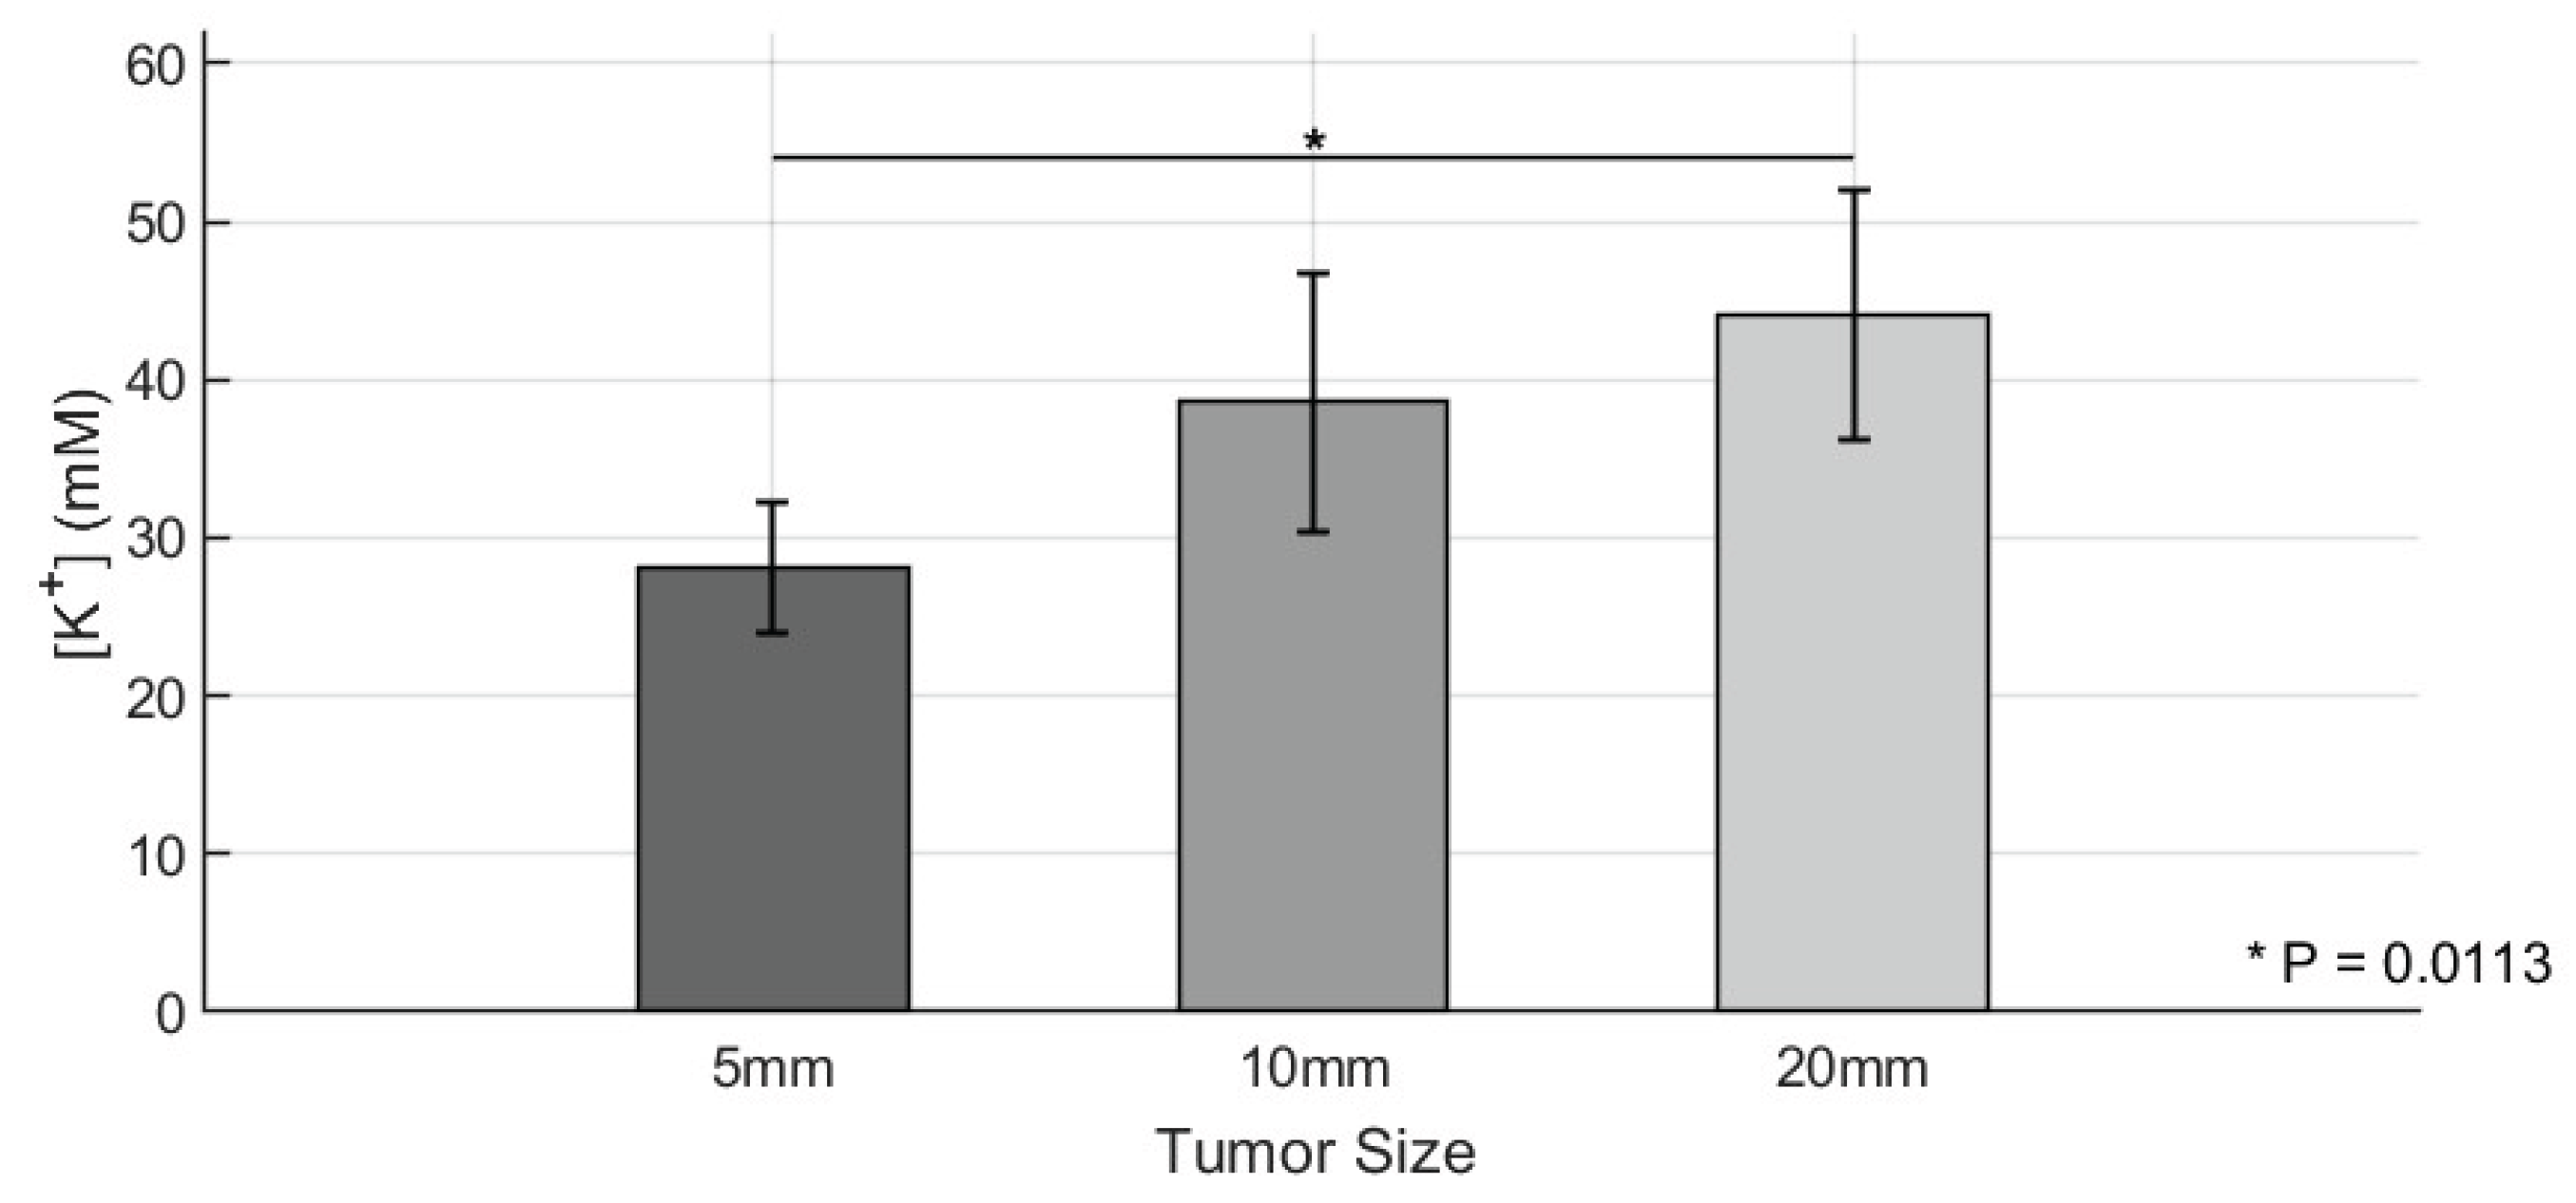
Following photoacoustic K⁺ imaging, tumors were collected, and extracellular K⁺ content was quantified using ICP-MS. The results are shown in Figure 4, which presents the group-wise averages and standard deviations for K⁺ levels. The ICP-MS results were in strong agreement with the PACI-derived K⁺ levels derived from background-subtracted signals. Similar trends were observed, with Group 3 exhibiting the highest K⁺ levels among the three groups. Two-sample t-tests confirmed statistically significant differences between Group 1 and Group 3 (p = 0.0113), while no significant differences were observed between Group 1 and Group 2 or Group 2 and Group 3. These results collectively demonstrate that tumor size is positively correlated with extracellular K⁺ accumulation and validate the PACI-based K⁺ imaging approach as a reliable noninvasive method for assessing TME ionic composition in vivo.
4. Discussion
In this study, we successfully applied PACI with a K⁺-sensitive nanoprobe (SDKNP) to noninvasively visualize extracellular K⁺ levels in orthotopic breast tumor models in vivo of varying sizes. Our results demonstrate that K⁺ concentration in the TME increases with tumor size, as shown both by PACI and independent validation using ICP-MS. Elevated extracellular K⁺ has been previously implicated in immune suppression within the TME, acting as a byproduct of necrotic cell death and contributing to tumor resistance against immunotherapy. Our data support the hypothesis that larger, more advanced tumors contain higher levels of extracellular K⁺, potentially reflecting increased necrotic burden and metabolic stress. This aligns with prior work suggesting that tumor progression is associated with disrupted ion homeostasis and biochemical gradients.
A statistically significant difference in K⁺ levels was observed between the smallest (5 mm) and largest (20 mm) tumors, with both PACI and ICP-MS showing consistent results. This validates the effectiveness of PACI as a reliable tool for in vivo, noninvasive K⁺ mapping, offering a promising alternative to invasive techniques such as tumor fluid extraction and electrode-based measurements. However, in this study, the sample size for each group was relatively small, which may have limited our ability to detect statistically significant differences between adjacent and smaller tumor sizes (e.g., 10 mm vs. 20 mm). While a trend toward increased K⁺ was observed, the p-value between Group 2 and Group 3 was very close to 5%, but did not reach significance, possibly due to insufficient statistical power. Future studies with larger animal cohorts could be warranted to confirm these findings and to better characterize the dynamic relationship between tumor growth and ionic changes in the TME.
Additionally, this work represents a significant step toward functional molecular imaging of tumor biochemistry. PACI-based K⁺ imaging has potential applications not only in monitoring tumor progression but also in predicting response to therapy and evaluating the efficacy of immuno-oncological interventions. The findings presented in this study lay an important foundation for our ongoing research on immunotherapy efficacy.
5. Conclusions
This study demonstrates that photoacoustic chemical imaging using a potassium-sensitive nanoprobe can effectively map extracellular potassium levels in breast tumors of varying sizes. Photoacoustic imaging results showed good agreement with inductively coupled plasma mass spectrometry validation, confirming the method’s accuracy and reliability. Importantly, tumor size was positively correlated with potassium levels, supporting the hypothesis that potassium accumulation reflects tumor progression and may influence therapeutic outcomes. Future work should explore longitudinal imaging, correlation with histopathology and immune markers, and integration with multi-parametric photoacoustic chemical imaging (e.g., simultaneous pH and oxygen imaging) to provide a comprehensive view of the tumor microenvironment. With further development, photoacoustic chemical imaging has the potential to become a valuable tool in personalized oncology by enabling noninvasive monitoring of chemical tumor biomarkers in vivo.
Author Contributions
All authors discussed the results, and the manuscript was written and reviewed with the contributions from all authors. Conceptualization, J.F., J.J., X.W., and C.G.K.; Methodology, J.F., A.E., M.G., and J.J.; Software, J.J.; Formal Analysis, J.F., and J.J.; Resources, J.F., A.E., and M.G.; Manuscript, J.F., and J.J.; Review & Editing, A.E., M.G., R.C., X.W., and C.G.K.
Funding
This work was supported by National institutes of Health (NIH) under grants R01CA250499 (XW, CGK), R01AR060350 (XW), R01CA278833 (XW), R01CA125577 (CGK), R01CA107469 (CGK), and R01CA292946 (JJ), and University of Michigan Rogel Cancer Center support grant P30CA046592 (CGK).
Institutional Review Board Statement
All the procedures on live animals were approved by the University Committee on the Use and Care of Animals (UCUCA) of the University of Michigan (Protocol # PRO00011264; PI: Janggun Jo).
Informed Consent Statement
Not applicable.
Data Availability Statement
The data that support the finding of this study are available from the corresponding authors on reasonable request.
Conflicts of Interest
The authors declare no conflicts of interest.
Abbreviations
The following abbreviations are used in this manuscript:
| ICP-MS | Inductively coupled plasma mass spectrometry |
| K+ | Potassium |
| PACI | Photoacoustic chemical imaging |
| SDKNP | Solvatochromic dye-based, potassium-sensitive nanoprobe |
| TME | Tumor microenvironment |
| UCUCA | University committee on the use and care of animals |
References
- Rockwell, S.; Dobrucki, I.T.; Kim, E.Y.; Marrison, S.T.; Vu, V.T. Hypoxia and radiation therapy: past history, ongoing research, and future promise. Curr Mol Med 2009, 9, 442-458. [CrossRef]
- Harrison, L.B.; Chadha, M.; Hill, R.J.; Hu, K.; Shasha, D. Impact of tumor hypoxia and anemia on radiation therapy outcomes. Oncologist 2002, 7, 492-508. [CrossRef]
- Horsman, M.R.; Mortensen, L.S.; Petersen, J.B.; Busk, M.; Overgaard, J. Imaging hypoxia to improve radiotherapy outcome. Nat Rev Clin Oncol 2012, 9, 674-687. [CrossRef]
- Bortner, C.D.; Hughes, F.M., Jr.; Cidlowski, J.A. A primary role for K+ and Na+ efflux in the activation of apoptosis. J Biol Chem 1997, 272, 32436-32442.
- Sigel, A., Sigel, H., & Sigel R. K. Interrelations between essential metal ions and human diseases, 1 ed.; Springer.
- Eil, R.; Vodnala, S.K.; Clever, D.; Klebanoff, C.A.; Sukumar, M.; Pan, J.H.; Palmer, D.C.; Gros, A.; Yamamoto, T.N.; Patel, S.J.; et al. Ionic immune suppression within the tumour microenvironment limits T cell effector function. Nature 2016, 537, 539-543. [CrossRef]
- Vodnala, S.K.; Eil, R.; Kishton, R.J.; Sukumar, M.; Yamamoto, T.N.; Ha, N.H.; Lee, P.H.; Shin, M.; Patel, S.J.; Yu, Z.; et al. T cell stemness and dysfunction in tumors are triggered by a common mechanism. Science 2019, 363. [CrossRef]
- Elabyad, I.A.; Kalayciyan, R.; Shanbhag, N.C.; Schad, L.R. First Potassium-39 (K) MRI at 9.4 T Using Conventional Copper Radio Frequency Surface Coil Cooled to 77 K. Ieee T Bio-Med Eng 2014, 61, 334-345. [CrossRef]
- Jo, J.; Lee, C.H.; Kopelman, R.; Wang, X. In vivo quantitative imaging of tumor pH by nanosonophore assisted multispectral photoacoustic imaging. Nat Commun 2017, 8, 471. [CrossRef]
- Song, J.; Zhai, T.; Hahm, H.S.; Li, Y.; Mao, H.; Wang, X.; Jo, J.; Chang, J.W. Development of a Dual Factor Activatable Covalent Targeted Photoacoustic Imaging Probe for Tumor Imaging. Angew Chem Int Ed Engl 2024, e202410645. [CrossRef]
- Folz, J.; Jo, J.; Gonzalez, M.E.; Eido, A.; Zhai, T.; Caruso, R.; Kleer, C.G.; Wang, X.; Kopelman, R. Photoacoustic lifetime oxygen imaging of radiotherapy-induced tumor reoxygenation In Vivo. J Photochem Photobiol 2024, 21. [CrossRef]
- Jo, J.; Folz, J.; Gonzalez, M.E.; Paoli, A.; Eido, A.; Salfi, E.; Tekula, S.; Ando, S.; Caruso, R.; Kleer, C.G.; et al. Personalized Oncology by In Vivo Chemical Imaging: Photoacoustic Mapping of Tumor Oxygen Predicts Radiotherapy Efficacy. ACS Nano 2023, 17, 4396-4403. [CrossRef]
- Folz, J.; Wasserman, J.H.; Jo, J.; Wang, X.; Kopelman, R. Photoacoustic Chemical Imaging Sodium Nano-Sensor Utilizing a Solvatochromic Dye Transducer for In Vivo Application. Biosensors (Basel) 2023, 13. [CrossRef]
- Lee, C.H.; Folz, J.; Tan, J.W.Y.; Jo, J.; Wang, X.; Kopelman, R. Chemical Imaging in Vivo: Photoacoustic-Based 4-Dimensional Chemical Analysis. Anal Chem 2019, 91, 2561-2569. [CrossRef]
- Jo, J.; Lee, C.H.; Folz, J.; Tan, J.W.Y.; Wang, X.; Kopelman, R. In Vivo Photoacoustic Lifetime Based Oxygen Imaging with Tumor Targeted G2 Polyacrylamide Nanosonophores. ACS Nano 2019, 13, 14024-14032. [CrossRef]
- Tan, J.W.Y.; Folz, J.; Kopelman, R.; Wang, X. In vivo photoacoustic potassium imaging of the tumor microenvironment. Biomed Opt Express 2020, 11, 3507-3522. [CrossRef]
- Xie, X.; Szilagyi, I.; Zhai, J.; Wang, L.; Bakker, E. Ion-Selective Optical Nanosensors Based on Solvatochromic Dyes of Different Lipophilicity: From Bulk Partitioning to Interfacial Accumulation. ACS Sens 2016, 1, 516-520. [CrossRef]
- Tran, M.N.; Kleer, C.G. Matricellular CCN6 (WISP3) protein: a tumor suppressor for mammary metaplastic carcinomas. J Cell Commun Signal 2018, 12, 13-19. [CrossRef]
- Huang, W.; Martin, E.E.; Burman, B.; Gonzalez, M.E.; Kleer, C.G. The matricellular protein CCN6 (WISP3) decreases Notch1 and suppresses breast cancer initiating cells. Oncotarget 2016, 7, 25180-25193. [CrossRef]
- Pal, A.; Huang, W.; Toy, K.A.; Kleer, C.G. CCN6 knockdown disrupts acinar organization of breast cells in three-dimensional cultures through up-regulation of type III TGF-beta receptor. Neoplasia 2012, 14, 1067-1074. [CrossRef]
- Huang, W.; Pal, A.; Kleer, C.G. On how CCN6 suppresses breast cancer growth and invasion. J Cell Commun Signal 2012, 6, 5-10. [CrossRef]
- Lorenzatti, G.; Huang, W.; Kleer, C.G. The emerging role of CCN6 in breast cancer invasion. Cellscience 2009, 6, 146-157.
- Kleer, C.G.; Zhang, Y.; Merajver, S.D. CCN6 (WISP3) as a new regulator of the epithelial phenotype in breast cancer. Cells Tissues Organs 2007, 185, 95-99. [CrossRef]
- Zhang, Y.; Pan, Q.; Zhong, H.; Merajver, S.D.; Kleer, C.G. Inhibition of CCN6 (WISP3) expression promotes neoplastic progression and enhances the effects of insulin-like growth factor-1 on breast epithelial cells. Breast Cancer Res 2005, 7, R1080-1089. [CrossRef]
- Gonzalez, M.E.; Brophy, B.; Eido, A.; Leonetti, A.E.; Djomehri, S.I.; Augimeri, G.; Carruthers, N.J.; Cavalcante, R.G.; Giordano, F.; Ando, S.; et al. CCN6 Suppresses Metaplastic Breast Carcinoma by Antagonizing Wnt/beta-Catenin Signaling to Inhibit EZH2-Driven EMT. Cancer Res 2024, 84, 3235-3249. [CrossRef]
- Haslene-Hox, H.; Oveland, E.; Berg, K.C.; Kolmannskog, O.; Woie, K.; Salvesen, H.B.; Tenstad, O.; Wiig, H. A new method for isolation of interstitial fluid from human solid tumors applied to proteomic analysis of ovarian carcinoma tissue. PLoS One 2011, 6, e19217. [CrossRef]
Figure 1.
Illustration of photoacoustic K⁺ imaging with solvatochromic dye-based K⁺-sensing nanoparticles (SDKNP). The SDKNP potassium probe has a characteristic absorption change depending on the K⁺ levels. The K⁺ image was obtained using a multi-wavelength ratiometric photoacoustic imaging method.
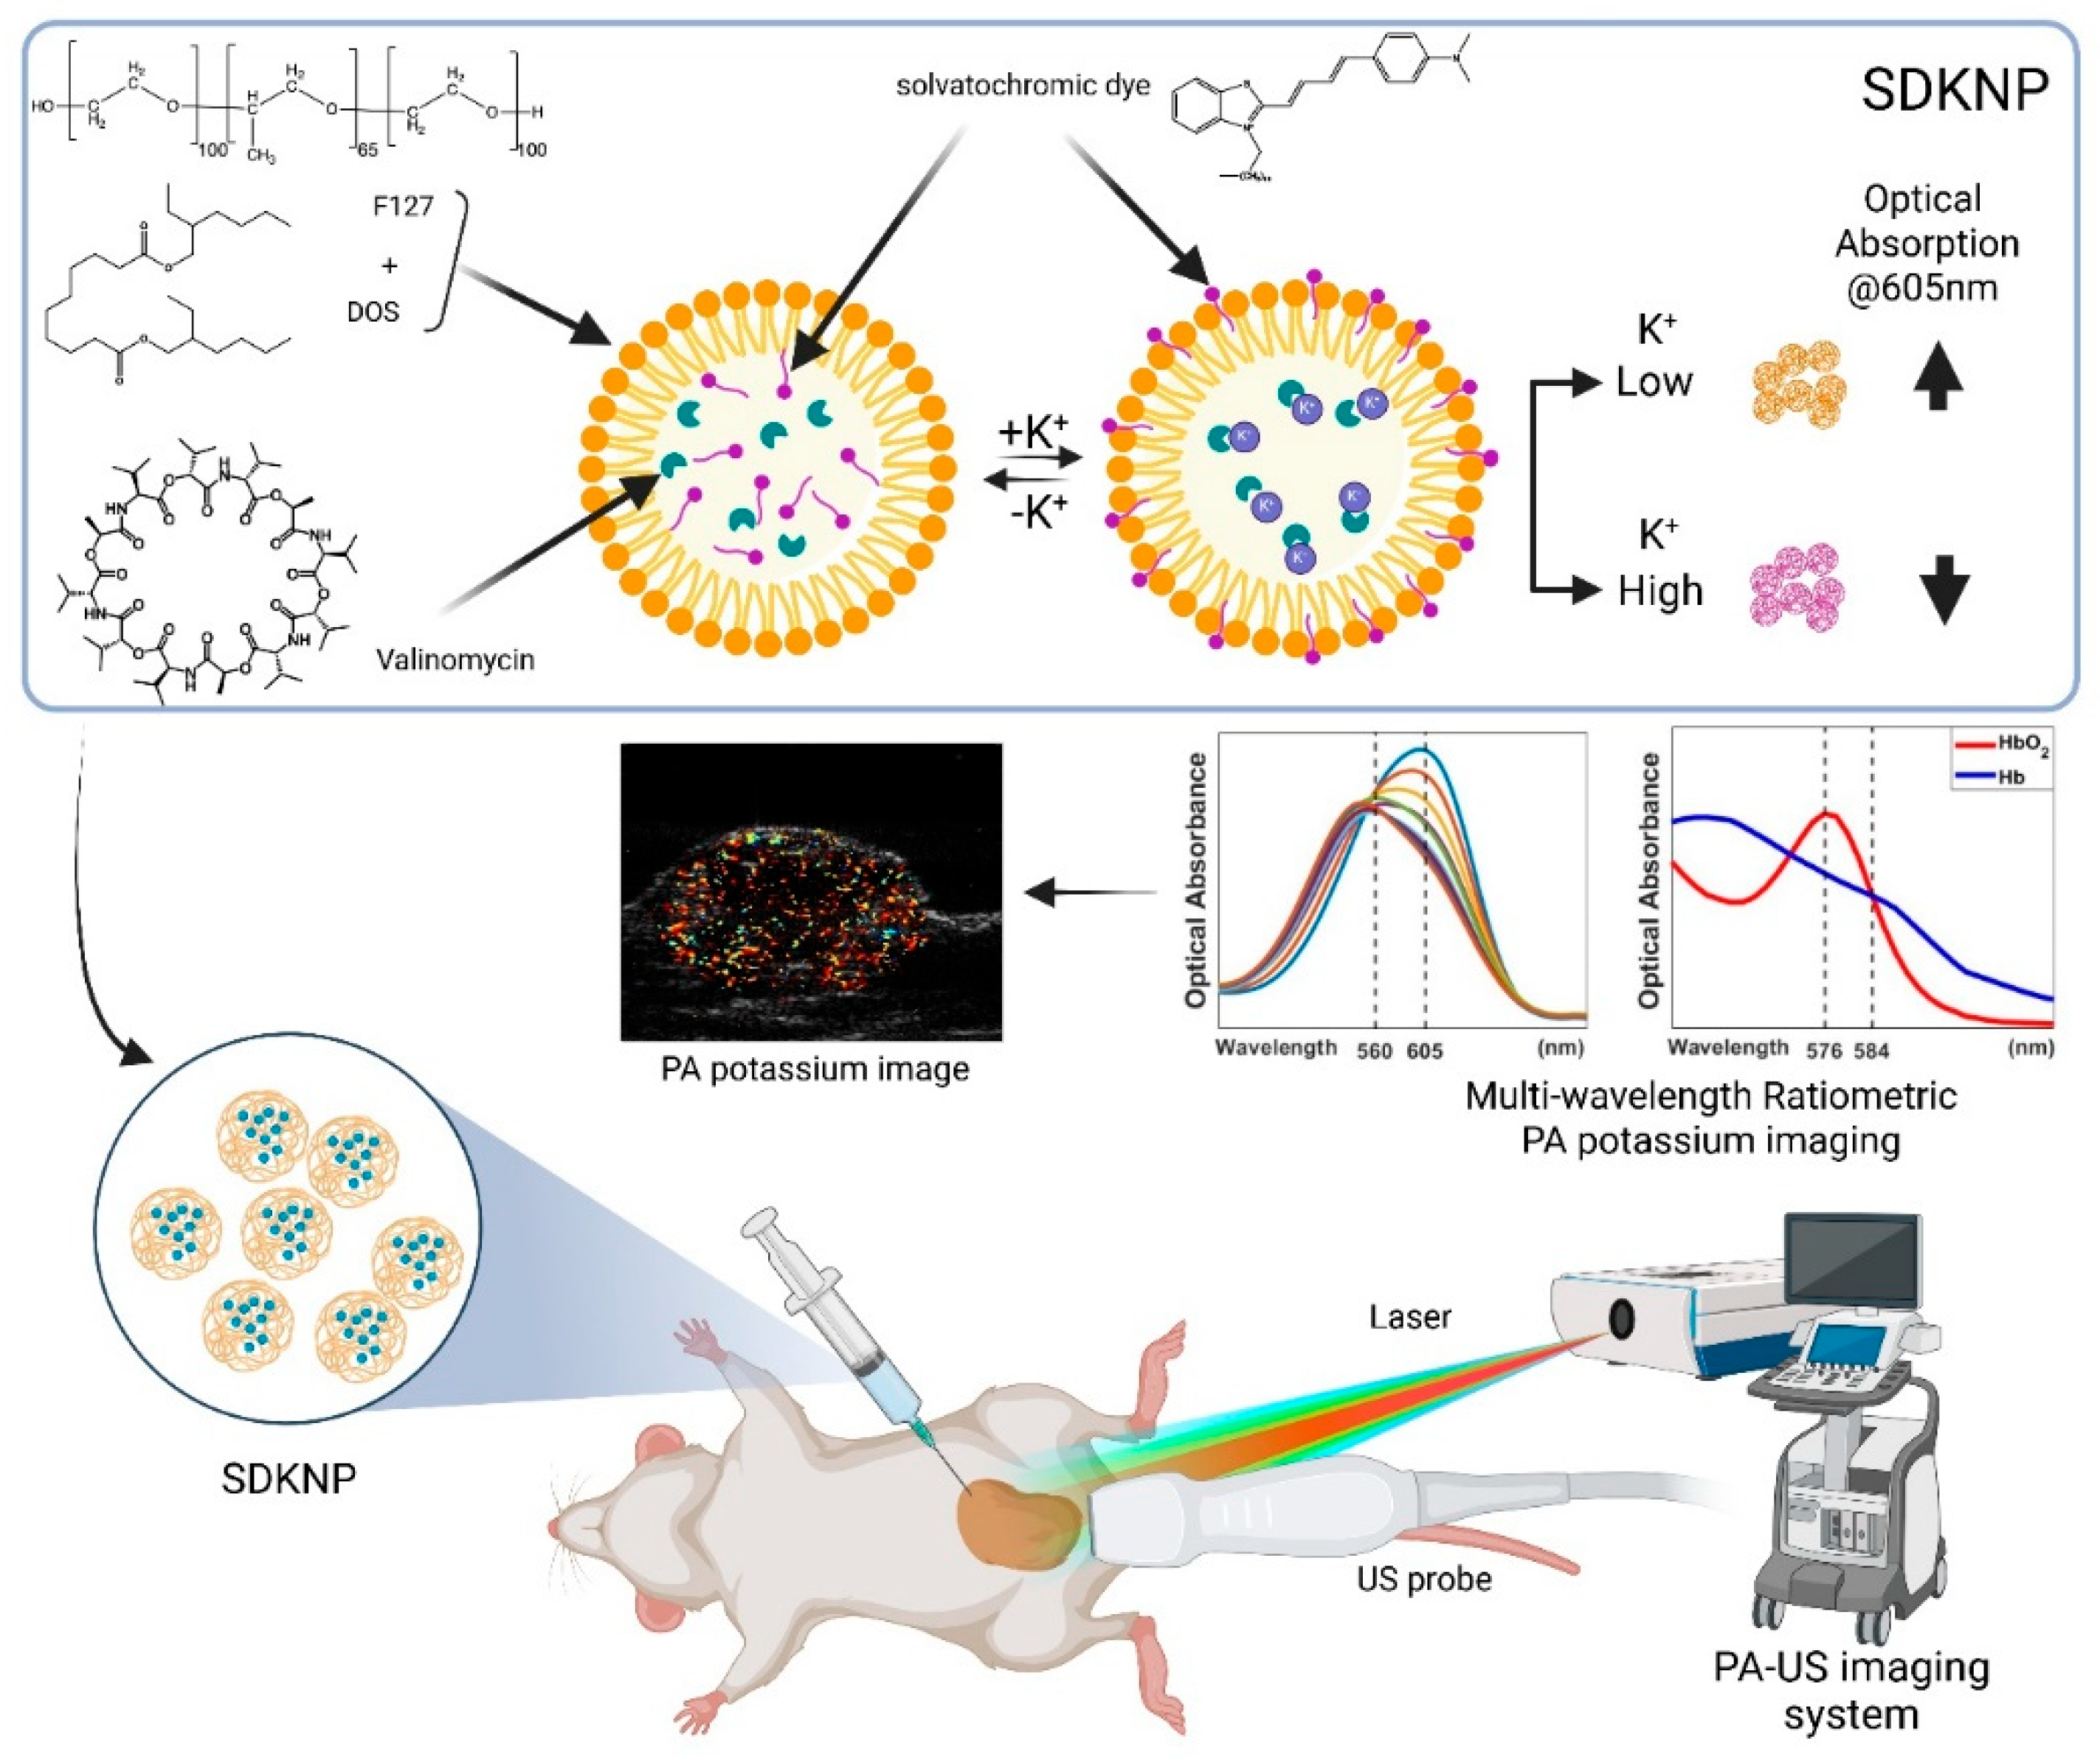
Figure 2.
Optical properties of SDKNP. (A) Spectroscopic optical absorption of SDKNP at different K+ levels. (B) Absorption ratios between each wavelength relative to the 560 nm that is the isosbestic point of the absorption changes.
Figure 2.
Optical properties of SDKNP. (A) Spectroscopic optical absorption of SDKNP at different K+ levels. (B) Absorption ratios between each wavelength relative to the 560 nm that is the isosbestic point of the absorption changes.
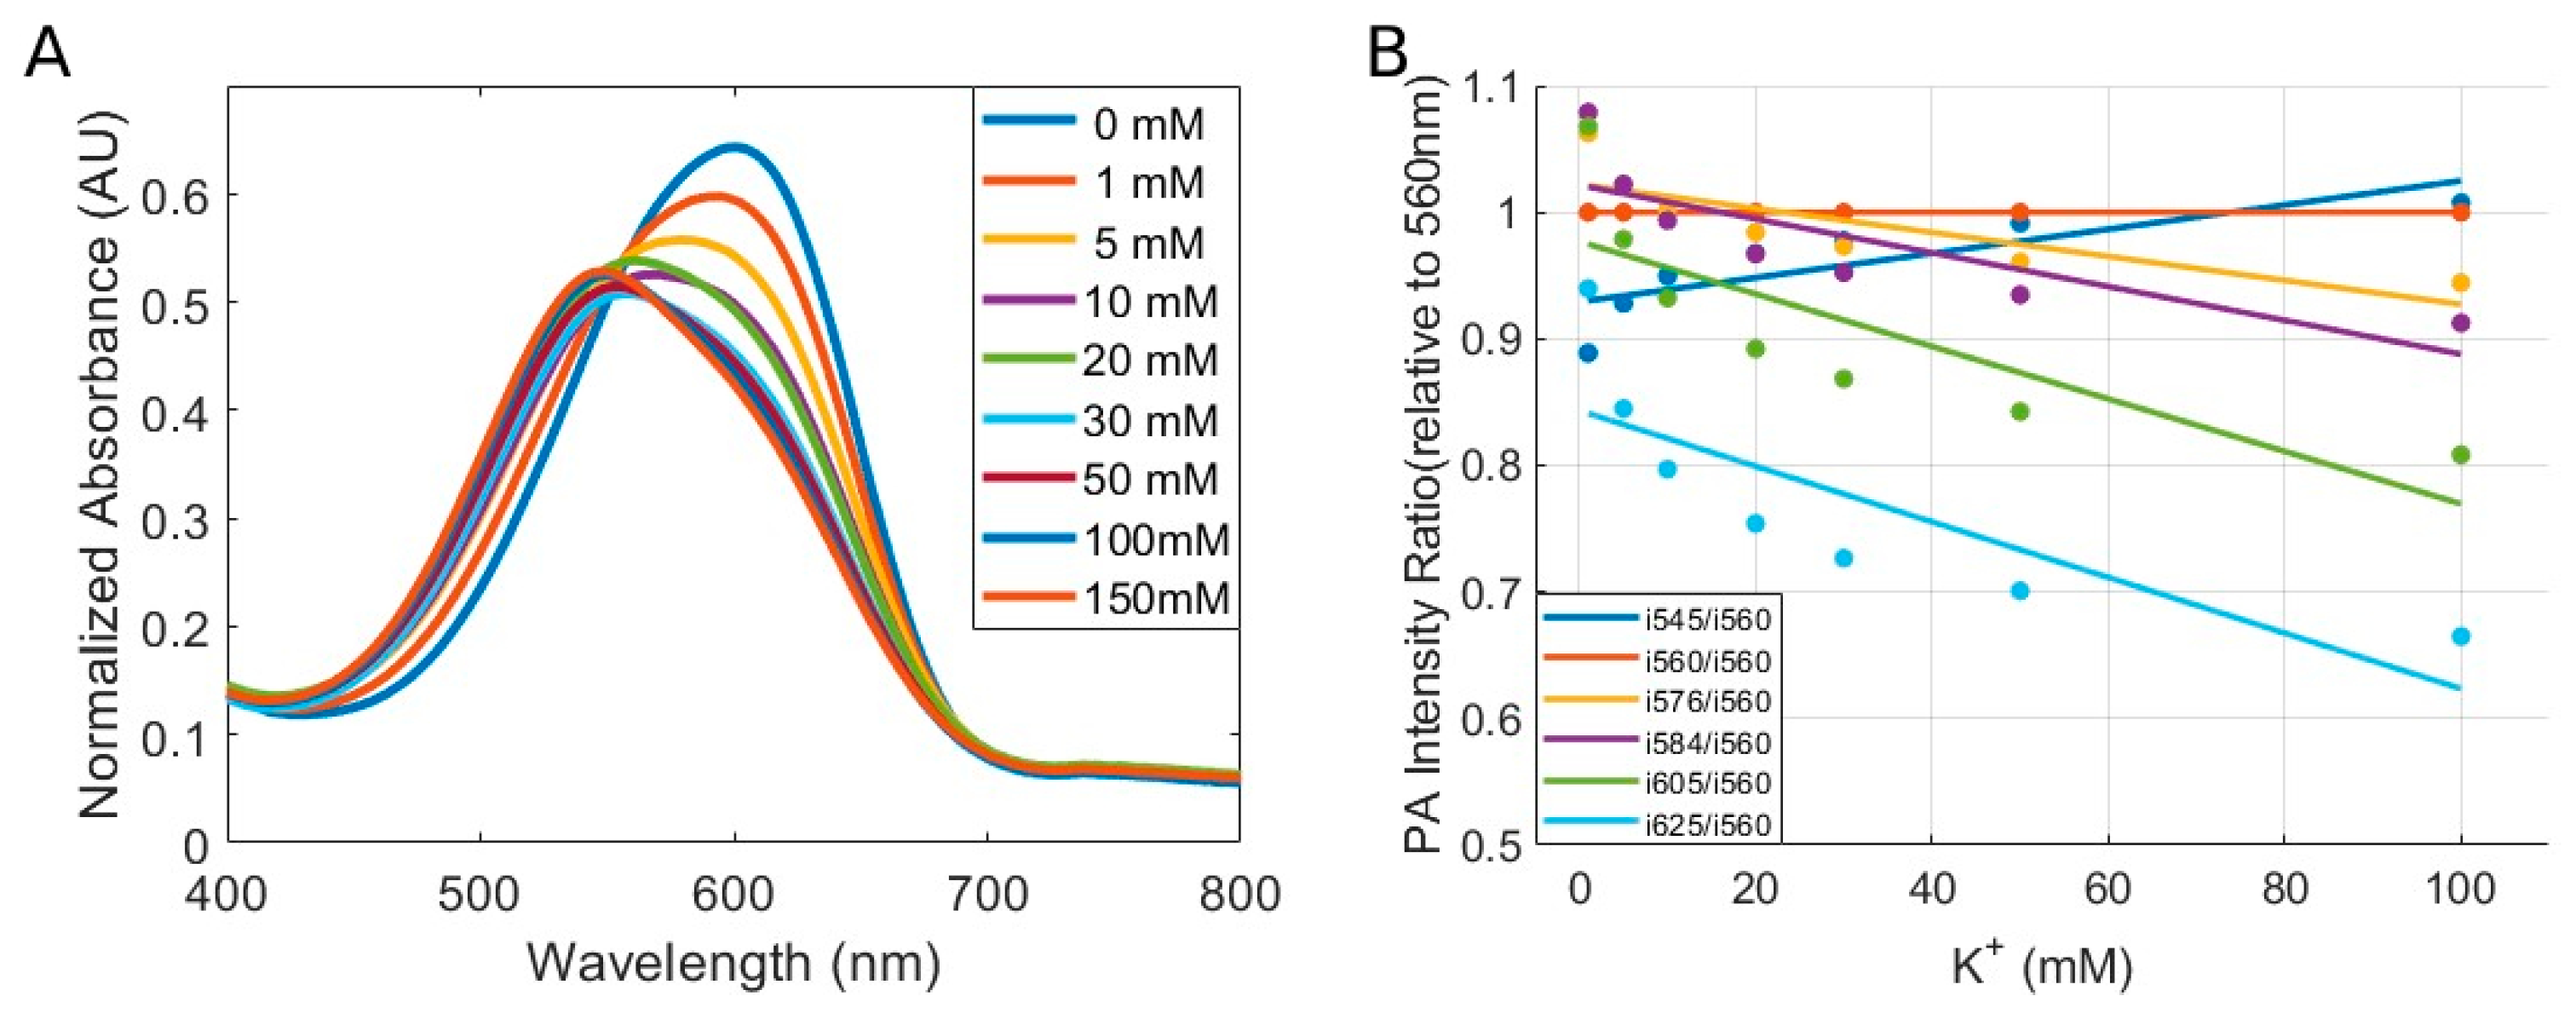
Figure 3.
Results of photoacoustic K⁺ imaging with SDKNP. (A) Representative K⁺ maps acquired by the photoacoustic and ultrasound dual-modality imaging system. Color-coded K⁺ concentration maps were superimposed on grayscale ultrasound images for anatomical localization. (B) K⁺ levels in tumors of three different size groups (Group 1 [5 mm]: n = 4; Group 2 [10 mm]: n = 3; Group 3 [20 mm]: n = 4) Group-wise mean potassium levels ± standard deviations are shown. Statistical comparisons were performed using two-sample t-tests. * p < 0.01. Scale bar = 5mm.
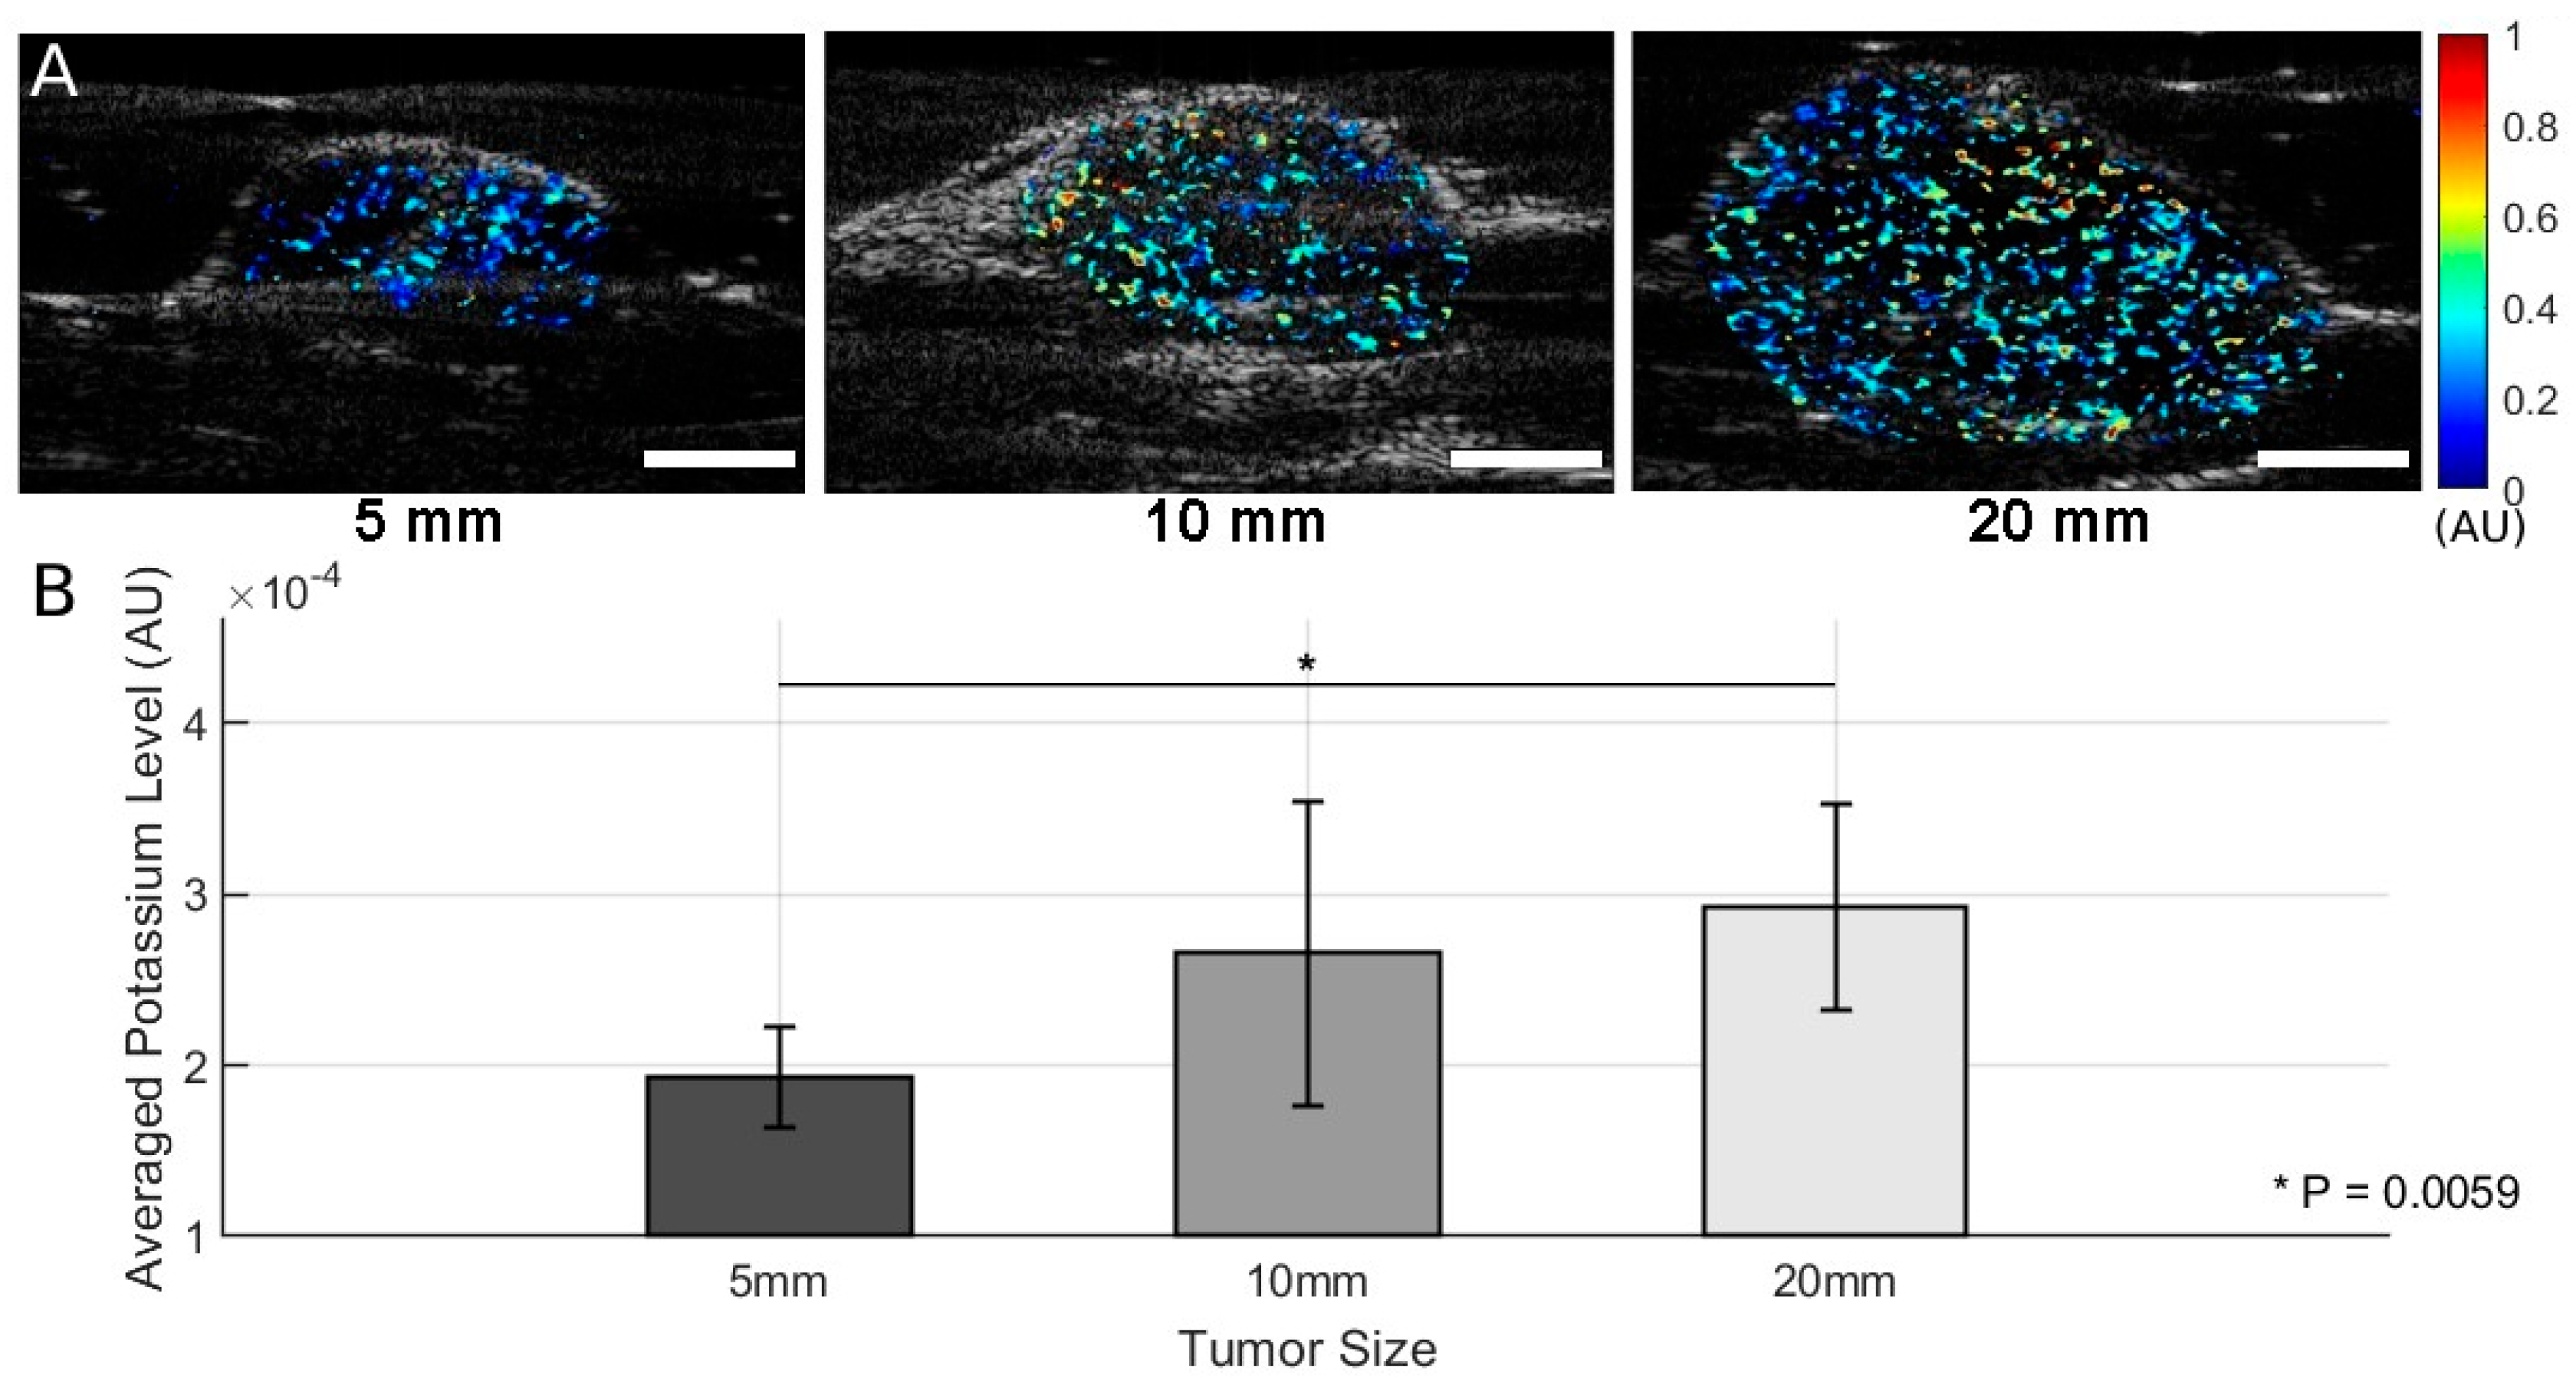
Figure 4.
Quantitative analysis of tumor K⁺ levels using ICP-MS. K⁺ levels in tumors of three different size groups (Group 1 [5 mm]: n = 4; Group 2 [10 mm]: n = 3; Group 3 [20 mm]: n = 4) were quantified using inductively coupled plasma mass spectrometry (ICP-MS). Bar graphs show mean values ± standard deviations for potassium levels calculated by background-subtracted signals in the three groups. Statistical comparisons were conducted using two-sample t-tests. * p < 0.05.
Disclaimer/Publisher’s Note: The statements, opinions and data contained in all publications are solely those of the individual author(s) and contributor(s) and not of MDPI and/or the editor(s). MDPI and/or the editor(s) disclaim responsibility for any injury to people or property resulting from any ideas, methods, instructions or products referred to in the content. |
© 2025 by the authors. Licensee MDPI, Basel, Switzerland. This article is an open access article distributed under the terms and conditions of the Creative Commons Attribution (CC BY) license (https://creativecommons.org/licenses/by/4.0/).
Copyright: This open access article is published under a Creative Commons CC BY 4.0 license, which permit the free download, distribution, and reuse, provided that the author and preprint are cited in any reuse.


