Submitted:
17 June 2025
Posted:
19 June 2025
You are already at the latest version
Abstract
Long-term storage may induce lipid oxidation in brown rice and impact its utilization in animal diet. Broiler chickens were randomly assigned to 3 groups and fed with corn (Corn), fresh (BR1) and stored brown rice (BR6) diet for 42 days, respectively. The results showed that lipid oxidation indexes increased and fatty acid composition changed significantly in stored brown rice. Replacement of corn with fresh or stored brown rice had no effects on growth performance of broilers, however, palmitic acid and oleic acid were increased, stearic acid, linoleic acid and docosadienoic acid were decreased in broiler breast muscle. Ileum antioxidant enzyme activities were increased in BR1 and BR6 groups compared to Corn group, and activities of α-amylase, trypsion, chymotrypsin and lipase were decreased in BR6 group compared to BR1 and Corn groups. Also, compared to BR1 group, the overall expression of different metabolites involved in drug metabolism-cytochrome P450, GnRH secretion and estrogen signaling pathway in broiler ileum were down-regulated in BR6 group. In conclusion, the lipid oxidation of stored brown rice decreased the activity of digestive enzymes and changed metabolic characteristics in ileum of broilers. While replacing corn with brown rice does not affect broiler growth performance, it reduced breast muscle unsaturated and essential fatty acid content and enhanced ileal antioxidant function of broilers.
Keywords:
stored brown rice
; lipid oxidation
; fatty acid composition
; ileum metabolic characteristics
; broiler chickens
1. Introduction
According to the latest forecasts from FAO, global rice stocks are expected to reach a historical high of 204 million tons by the end of the 2024/25 marketing year. As the largest holder of rice reserves globally, Chinese government has been conducting annual auctions of old crop rice for feed use in recent years, which move aims to rotate out older stocks, provide grain alternatives, and temper rising feed grain prices. Brown rice is the product of husked rice which retains its bran and germ, and are high in dietary fiber, vitamins, and minerals. The nutrient value of brown rice is higher or equal to that of corn, and could achieve a similar feeding effect when used as alternative ingredients in animal feed [1]. However, during storage, the inherent respiration, oxidation, and microbial activity could alter the composition and structure of key nutrients, thereby degrading the quality and palatability of brown rice [2].
Although the content of lipid is only 1%-3% in brown rice, it undergoes significant changes during the longtime storage, primarily through hydrolysis and oxidation pathways. Lipids are firstly hydrolyzed by lipases and phospholipases, generating free fatty acids and glycerol, mainly including linoleic acid, palmitic acid, linolenic acid, stearic acid, oleic acid and tetradecanoic acid [3]. Meanwhile, the unsaturated fatty acids are further oxidized, leading to the formation of carbonyl compounds such as aldehydes and ketones, which will lead to the decrease of edible quality and nutritional value of rice [4]. The lipid oxidation process of rice is regulated by both lipid oxidase and antioxidant oxidase systems. Lipid oxidase in rice can catalyze unsaturated fatty acids (mainly linoleic acid and linolenic acid) to produce lipid hydroperoxide, which is then automatically oxidized or degraded by lipid hydroperoxide lyase and lipid hydroperoxide isomerase to produce aldehydes, hydrocarbons, alcohols and other volatile substances [5]. The antioxidant enzymes, including catalase, peroxidase, superoxide dismutase, ascorbate peroxidase, glutathione peroxidase and so on, play an important role in clearing reactive oxygen species in plant cells [6].
Lipid oxidation has been shown to have several effects that are detrimental to poultry production. It is well recognized that oxidation reduces the palatability of feed, consequently reducing feed intake and overall performance [7]. Furthermore, the oxidation process has been shown to reduce the nutritional value of the diet due to reactions with lipids, proteins, and/or fat-soluble vitamins within the diet [8]. Some oxidation products, such as unsaturated aldehydes are considered toxic to the animal, causing damage to intestinal enterocytes and the liver [9]. Even when oxidation occurs at low levels, it may be responsible for the unexplained performance variability that is often observed.
Research on the impact of feed oxidation on animals mainly focuses on oil, protein feed ingredients, vitamin and minerals, as well as feed additives that are prone to oxidation [10,11]. However, as the largest addition amount in feed, most studies focus only on changes in energy value, nutrient digestibility and the effects on animal growth performance for long term stored grains, few pay attention to the changes in animal physiological metabolism caused by lipid oxidation of grains. As long-term storage of brown rice can serve as a potential alternative energy source to maize, but lipids changes during storage may lead to quality deterioration in brown rice, which could have significant adverse effects on animal production. Therefore, the objective of this study was to investigate the changes in lipid composition and metabolism of stored brown rice and its effects on the growth performance, meat quality, and intestinal metabolic characteristics of broilers.
2. Results
2.1. Lipid Metabolism Indexes And Fatty Acid Composition Of Stored Brown Rice
Table 1 presents a comparison of various lipid metabolism indexes between fresh and stored brown rice. The brown rice stored for 6 years (BR6) generally shows higher levels of lipid peroxidation markers, which include fatty acid value, malonaldehyde (MDA) and carbonylated protein, compared to that of fresh brown rice stored for 1 year (BR1) (P < 0.05). In the mean time, brown rice stored for 6 years has significantly lower levels of antioxidant enzymes which including glutathione peroxidase (GSH-PX) and glutathione (GSH) compared to fresh brown rice (P < 0.05). There are no significant differences in superoxide dismutase (SOD), catalase (CAT), lipase (LPS), and ascorbate peroxidase (APX) between fresh and stored brown rice (P > 0.05). This suggests that fresh brown rice may exhibit superior oxidative stability and enhanced antioxidant capacity compared to brown rice stored for 6 years. These characteristics are crucial for preserving the quality and nutritional value of brown rice.
Fatty acid composition of brown rice was shown in Table 2. Compared to fresh brown rice, stored brown rice had significantly less linoleic acid (C18:2n-6c), alpha-linolenic acid (C18:3n-3), tricosanoic acid (C23:0), but higher stearic acid (C18:0), oleic acid (C18:1n-9c), icosanoic acid (C20:0), eicosenoic acid (C20:1), docosanoic acid (C22:0), and tetracosanoic acid (C24:0) (P < 0.05). The total fatty acid content and the sum of saturated fatty acids (SFA) did not differ significantly between fresh and stored brown rice. However, the content of monounsaturated fatty acids (MUFA) was significantly higher in fresh brown rice compared to stored brown rice (P < 0.01), while the content of polyunsaturated fatty acids (PUFA) was significantly higher in fresh brown rice (P < 0.01). The ratio of PUFA to SFA was also significantly higher in fresh brown rice, suggesting that fresh brown rice has a more favorable fatty acid profile potentially associated with health benefits.
2.2. Effects of Stored Brown Rice on Growth Performance and Meat Quality of Broilers
The growth performance and meat quality of broilers fed corn or brown rice diet was shown in Table 3. There were no significant differences in average daily feed intake (ADFI) and average daily gain (ADG) from 0 to 3 wk, 4 to 6 wk, or 0 to 6 wk among broilers fed corn or brown rice diet (P > 0.05). Similarly, feed conversion ratio (FCR) did not exhibit significant differences across the diets at any of the evaluated time points (P > 0.05), except broilers fed corn diet showed a slightly lower FCR in the first three weeks compared to the brown rice groups. In terms of meat quality, the pH values were not significantly different among the diets (P > 0.05). However, there was a significant difference in drop loss, with the BR6 diet resulting in a higher percentage of drop loss compared to the corn diet (P < 0.01). The cooking percentage also varied, with the corn diet showing a higher percentage than the BR6 diet (P = 0.06). Overall, while there were some trends observed, most parameters did not show statistically significant differences, suggesting that the diets had comparable effects on broiler growth performance and meat quality.
Fatty acid composition of breast muscle in broilers fed corn or brown rice diet were shown in Table 4. Significant differences were observed among the groups in various fatty acids. Compared with corn group, broilers fed two brown rice diets had higher level of palmitic acid (C16: 0), palmitoleic acid (C16: 1), oleic acid (C18: 1n-9c), total fatty acid (P < 0.05), but lower level of stearic acid (C18: 0), linoleic acid (C18: 2n-6c), eicosandienoic acid (C20: 2), docosadienoic acid (C20: 4n-6), docosahexaenoic acid (C22: 6n-3) (P < 0.05). Also, the PUFA, PUFA/SFA, and essential fatty acid (EFA) were lower (P < 0.05), while MUFA and MUFA/PUFA was higher (P < 0.05) in brown rice group compared with corn group. The level of myristic acid (C14: 0), nervonic acid (C24: 1) was significantly higher (P < 0.01) in broilers fed BR6 diet compared to those fed BR1 diet.
2.3. Antioxidant Properties and Digestive Enzyme Analyses
Table 5 presents the antioxidant and digestive enzyme indices of ileum in broilers fed with corn or brown rice diet. MDA levels, an indicator of lipid peroxidation, was highest in the corn group at 0.94 μmol/g, followed by the BR6 group with 0.62 μmol/g, and was lowest in the BR1 group at 0.51 μmol/g. The decreasing trend in MDA levels from Corn to BR1 suggests that brown rice might have a protective effect against lipid peroxidation in the intestinal tissue of broilers. Conversely, ileum antioxidant enzymes such as SOD, TAOC, GSH-PX, CAT showed higher activities in the BR1 and BR6 group compared to the Corn group (P < 0.01). Digestive enzymes α-AMY, trypsin, chymotrypsin also exhibited significant differences, with the BR6 group showing the lowest activity compared with Corn and BR1 groups. LPS levels were significantly higher in the BR1 group compared to both the Corn and BR6 groups (P < 0.01).
2.4. Metabolomics Analysis of Broilers Ileum
Metabolomics biochemical indexes of ileum in broilers fed corn or brown rice were tested. Partial least squares discriminant analysis (PLS-DA) analysis of metabolome data showed significant clustering of metabolites between Corn, BR1 and BR6 groups (Figure 1A). Affected possible metabolites were found after filtering by the t-test (P < 0.05) and orthogonal least partial squares discriminant analysis (OPLS-DA) model (variable importance in the projection (VIP) > 1.0). The volcano plot showed that 91 metabolites were decreased (green) and 38 metabolites were increased (red) in BR1 group compared to Corn group, while 73 metabolites were decreased and 24 metabolites were increased in BR6 group compared to BR1 group (Figure 1B). The individual metabolites in each group were analyzed using MetaboAnalyst 4.0 software, and VIP value of the top 20 differential metabolites were shown in Fig. 2C and 2D. Between Corn and BR1 groups, 1-aminocyclohexanoic acid, D-proline betaine, stachydrine, cis-EODA, 12-hydroxyoctadecanoic acid, Val-Ala, azelaic Acid, (S)-leucic acid, sphingosyl-phosphocholine, 5-hydroxyhexanoic acid, 2-hydroxyhexanoic acid, LPC (20:2/0:0), LPC (0:0/20:2), nicotinic acid, guanidineacetic acid were down regulated in BR1 groups, while folic acid, methyl nicotinic acid, 1-methylxanthine, 7-methylxanthine, γ-aminobutyric acid were up regulated in BR1 groups (Figure 1C). Between BR1 and BR6 groups, ritalinic acid, γ-aminobutyric Acid, N'-formylkynurenine, 7-ketodeoxycholic acid, oxaceprol, 4-hydroxybenzaldehyde, L-dihydroorotic acid, N-acetylcadaverine, PC (8:0/8:0), thymidine were down regulated in BR6 groups, while FFA (20:1), cis-EODA, 1-methylguanosine, 2'-O-methylguanosine, heparin, 1-methylinosine, quinoline-4-carboxylic acid, 2-methylguanosine, arachidyl glycine, 2-(dimethylamino) guanosine were up regulated in BR6 groups (Figure 1D).
The Venn diagram in Figure 2A shows the number of shared and unique differential metabolites among the three groups. The number of differential metabolites unique to Corn vs BR1 and BR1 vs BR6 was 50 and 29, respectively, with 6 differential metabolites common both in Corn vs BR1 and BR1 vs BR6 metabolic set, which including 7-ketodeoxycholic acid, cis-EODA, heparin, γ-aminobutyric acid, 2-methylguanosine, and 1-methylinosine. To investigate the trends in the relative content of metabolites across different samples, we standardized the relative content of differential metabolites and subsequently performed K-means clustering analysis (Figure 2B). The differential metabolites was divided mainly into four subclasses. In subclass 1, 13 metabolites had the highest abundance in BR1 group, followed by BR6, and the lowest abundance in Corn group. In subclass 2, 25 metabolites had the highest abundance in BR6 group, followed by BR1, and the lowest abundance in Corn group. On the contrary, In subclass 3 and 4, 31 and 37 metabolites had the highest abundance in Corn group, followed by BR1, and the lowest abundance in BR6 group.
The differential abundance score (DA Score) is a metabolic change analysis method based on pathways. It can capture the average and overall changes of all metabolites in a particular pathway. The formula for calculating the DA score is: DA score = (number of up-regulated differential metabolites in the pathway - number of down-regulated differential metabolites in the pathway) / total number of metabolites annotated to the pathway. Figure 2C showed the metabolic pathways significantly enriched between Corn and BR1 group, among them, the overall expression of metabolites involved in one carbon pool by folate, GnRH secretion, and estrogen signaling pathway tends to be up-regulated, while metabolites involved in linoleic acid metabolism and RRAP signaling pathway tends to be down-regulated in BR1 group. Figure 2D showed the metabolic pathways significantly enriched between BR1 and BR6 group, as the overall expression of metabolites involved in drug metabolism-cytochrome P450, GnRH secretion, and estrogen signaling pathway tends to be down-regulated in BR6 group. These results suggest that there are significant differences in metabolic pathways between different treatment groups, which may be related to the physiological status and metabolic functions of the broiler chickens.
3. Discussion
The conventional nutrients of brown rice obtained after husking are higher than or equal to corn, and partial or total replacement of corn in the diet has no significant effect on the growth performance of livestock and poultry. In the present study, fresh or stored brown rice were added to replaced the corn in the broiler diet to study the effect of lipid oxidation in stored brown rice on meat quality and intestinal metabolism characteristics in broilers. The results showed that compared with corn, brown rice had no significant effects on growth performance of broilers, but changed fatty acid composition of breast muscle, anti-oxidant and digestive enzymes indices, as well as metabolism characteristics in ileum of broilers. Compared to fresh brown rice, fatty acid composition and lipid metabolism characteristics were significantly changed in brown rice stored for 6 years, which might induce a change in fatty acid composition of breast muscle, anti-oxidant and digestive enzymes indices of ileum, as well as metabolism characteristics in ileum of broilers.
The lipid content in brown rice typically ranges from 1% to 3%, and lipid deterioration is one of the primary factors leading to the aging of rice during storage. The fatty acid value is an early indicator of lipid oxidation and reflects the initial stages of this process, it can provide valuable insights into the stability and quality of the rice stored for prolonged periods [12]. MDA, a byproduct of lipid peroxidation, is a reliable marker of oxidative stress and can be used to assess the extent of lipid damage. Elevated MDA levels suggest increased lipid peroxidation, which can lead to off-flavors and reduced palatability [13]. Carbonylated proteins, resulting from the reaction between lipid peroxidation products and proteins, serve as another important biomarker of oxidative stress [14]. Monitoring these indicators is essential for evaluating the oxidative stability of rice and for developing strategies to mitigate lipid oxidation during storage. The data presented in Table 1 indicate significant alterations in the lipid metabolism indices between fresh and stored brown rice. Notably, the fatty acid value, MDA, and carbonylated protein levels were higher in stored brown rice compared to fresh brown rice, suggesting increased lipid peroxidation oxidation in the longtime stored brown rice. Conversely, the activities of GSH-PX and GSH were significantly lower in stored brown rice, indicating a compromised antioxidant capacity, which may contribute to the observed oxidative stress [15].
The data in Table 2 illustrate significant variations in the fatty acid composition between fresh and stored brown rice. Linoleic acid, oleic acid and palmitic acid accounted for almost 34.95%, 32.86% and 25.49% in the total fatty acid of brown rice, while other fatty acids accounted for only 7%. Specifically, stored brown rice had reduced contents of linoleic acid and α-linolenic acid, and a increased content of oleic acid, which could be explained by the fact that lipoxygenase primarily acts on linoleic acid as its main substrate, and the increased activity of lipoxygenase resulting in the decrease of linoleic acid and increase in the relative content of oleic acid [16,17]. There are other 9 trace fatty acids with different changes, and the content of MUFA was increased and PUFA was decreased in stored brown rice, which is consistent with the results reported in other studies [18,19].
As brown rice could be effectively used as an alternative energy ingredient to the corn [1], we replaced 100% of the corn with fresh and stored brown rice. The results showed that both of the two brown rice had no significant effect on growth performance of broilers, except for a increase in FCR from 0 to 3 wk of BR6 group (Tables 3). The alterations in composition and structural of major nutrients during longtime storage may lead to a decrement in the nutritional values of grains, particularly in terms of available energy value and amino acid digestibility especially when subjected to inadequate storage conditions [11]. Nonetheless, several investigative studies conducted on pigs and poultry have corroborated our findings, indicating that the growth performance of animals may exhibit a weak correlation with the alterations in nutritional values of grains that have been stored for prolonged durations [20,21]. Drip loss can indicate quality deviations associated with the rate and extent of postmortem glycolysis in muscle tissue. The volume of drip loss is related to the lipid peroxide content in muscle [22]. Previous study showed that the decreased activity of catalase and peroxidase, as well as the increased acidity of fatty acids in stored corn may result in a lower pH and higher drip loss in broiler breast muscles [23], which was consistent with our results that the increased contents of lipid oxidation indicators in stored brown rice induced a increase in drop loss of broiler (Table 3).
Dietary fatty acid composition can affect muscle fatty acid profile and meat quality of broiler [24]. According to this study, broilers fed two brown rice diets had higher level of palmitic acid (C16: 0), oleic acid (C18: 1n-9c), but lower level of stearic acid (C18: 0), linoleic acid (C18: 2n-6c), eicosandienoic acid (C20: 2), compared to those of Corn group. Also, the PUFA and EFA were lower, while MUFA and MUFA/PUFA was higher in broiler muscle of two brown rice groups compared with corn group (Table 4). Although the fatty acid composition of corn was not determined in this study, and there are no directly relevant studies comparing the fatty acid composition of broiler muscle between corn and rice-based diet, it has been demonstrated that the PUFA in corn making up more than 50% of fat, with 17% SFA and 32% MUFA [25]. In contrast, brown rice has a more balanced distribution of MUFAs and PUFAs, with oleic acid (C18:1) and linoleic acid (C18:2) each accounting for about 35% to 40% of its total fatty acids, and 32% SFA [26]. One study shows that as the content of PUFA in feed increases from 15 g/kg to 61 g/kg, the content of PUFA in chicken meat significantly increases, while the contents of SFA and MUFA decrease accordingly [27]. The increase in PUFA content in broiler muscle, especially omega-3, may help meet consumers' demands for healthier food. However, on the other hand, a higher content of PUFA can lead to a decrease in the oxidative stability of broiler muscle, which in turn may result in a decline in meat flavor and a shortened shelf life [28]. And a balanced fatty acid composition in feed, especially a higher content of MUFA, can enhance the oxidative stability of broiler muscle and reduce the impact of oxidation reactions on meat quality [29]. However, although a lower PUFA ratio may lead to better oxidative stability of the muscle, the deficiency of essential fatty acids may affect the growth performance and immunomodulatory function of broilers. For example, under heat stress conditions, the PUFA content of broilers decreased significantly, while the SFA content increased. Although this improved the oxidative stability of the muscle, it also led to the decline in the growth performance and impaired immune function of broilers at the same time [30].
Lipid-oxidized feed significantly alters the fatty acid composition of broiler muscle, reduces the PUFA ratio, increases the accumulation of SFA and oxidation products, and ultimately leads to meat quality deterioration and a decline in nutritional value by destroying unsaturated fatty acids, generating harmful oxidation products, and consuming antioxidant substances [31]. A study use aging corn to feed laying hens and found that the content of the oleic acid, docosahexaenoic acid and MUFA was lower and stearic acid and SFA was higher in egg yolks fed aging corn diet [32]. This may be because ageing grain inhibited the Δ-9 desaturase activity, resulting in a decreased transformation of saturated fatty acids such as C16:0 and C18:0 into the corresponding monounsaturated fatty acids [33]. When broilers were fed with rice bran that had been stored for a longer time, the content of saturated fatty acids such as C14:0 in the chicken meat was significantly higher than that in the fresh rice bran group, while the content of MUFA such as C18:1 was significantly decreased. Moreover, the chicken meat in the randy rice bran group showed a higher MDA value during storage [34]. In the present study, brown rice stored for 6 years had reduced contents of linoleic acid and α-linolenic acid, and increased content of oleic acid, and the content of MUFA was increased and PUFA was decreased, compared to fresh brown rice. Also, the level of myristic acid (C14:0), nervonic acid (C24:1) was significantly higher in broilers fed BR6 diet compared to those fed BR1 diet, which can be explained that oxidized feed promotes the synthesis of C14:0 and inhibits the β -oxidation of C24:1 in the liver of broilers by activating the SREBP-1c pathway, resulting in an increase in the contents of these two fatty acids in the muscle [35].
The levels of MDA in broiler ileum were significantly higher in Corn group compared to two brown rice diet groups, and the activities of several key antioxidant enzymes, including SOD, TAOC, GSH-PX, and CAT were significantly lower in the broilers fed corn diet group. Lipid oxidation is a complex process that generates reactive oxygen species (ROS) and other harmful by-products, which can damage cellular components such as lipids, proteins, and DNA [36]. As the content of PUFA in corn is much higher than that in brown rice, it may not only lead to a decrease in the oxidative stability of broiler chicken muscle, but also cause oxidative stress in the intestines of broiler chickens [35]. The up-regulation of antioxidant enzymes suggests that the broilers were able to mount a compensatory response to counteract the increased oxidative stress. This adaptive mechanism is essential for maintaining cellular homeostasis and minimizing the detrimental effects of oxidative damage on growth and health. However, it is important to note that while the enhanced antioxidant defense mechanisms may help mitigate some of the oxidative stress, prolonged exposure to oxidized feed could still have negative implications for broiler health and performance. The results of the present study provide valuable insights into the effects of feeding stored brown rice on lipid oxidation and antioxidant status in broilers. Specifically, the levels of MDA were found to be significantly higher in broilers fed stored brown rice diet compared to those fed fresh brown rice diet. Although the activities of antioxidant enzymes were not different between stored and fresh brown rice, however, the elevated MDA levels in the BR6 group indicate that the lipid oxidation of prolonged storage brown rice may in turn induces higher oxidative stress in broilers.
The activities of digestive enzymes like α-amylase, trypsin, and chymotrypsin were also affected, as lower in BR6 group compared to BR1 group (Table 5), which suggesting that longtime stored brown rice might support lower starch and protein digestion. Studies have shown that the oxidation products produced by lipid oxidation (such as MDA) can inhibit the activity of intestinal digestive enzymes, leading to a decrease in the digestibility of nutrients [37]. Although we did not measure the nutrient digestibility of brown rice in broiler stock, however, our previous research on weaned piglets found that although brown rice stored for a longer time reduced the activity of lactase in the small intestine of pigs, it had no significant effects on nutrient-apparent total tract digestibility, as well as growth performance of piglets [38].
The metabolomics data presented in the figures provide valuable insights into the effects of feeding broilers with fresh versus stored brown rice on the ileum metabolite profiles. Figure 1C and 1D present the VIP scores for metabolites that are significantly altered in the Corn versus BR1 and BR1 versus BR6 comparisons, respectively. Between Corn and BR1 groups, folic acid, methyl nicotinic acid, 1-methylxanthine, 7-methylxanthine, and γ-aminobutyric acid were up regulated in BR1 group compared to Corn group (Figure 1C). As we known that brown rice has more folic acid than corn, and the increased levels of folic acid in the ileum of brown rice-fed broilers may plays a crucial role in various biological processes, including DNA synthesis, methylation reactions, and amino acid metabolism [39]. Brown rice also has a relatively high niacin content compared to corn, and mainly in the free form, which is more easily absorbed and utilized by the body. Although corn also contains niacin, its niacin mainly exists in a combined form [40]. And the higher content of methyl nicotinic acid in the ileum of brown rice-fed broilers, a derivative of niacin, highlight the potential for enhanced niacin metabolism, which is essential for energy production and cellular respiration, contributing to the maintenance of healthy gastrointestinal function [41]. 1-Methylxanthine and 7-Methylxanthine are derivatives of xanthine, a purine base involved in nucleic acid metabolism. Their up-regulation in the ileum of brown rice-fed broilers indicates a potential increase in purine metabolism. Purines are essential for DNA and RNA synthesis, and their enhanced metabolism may reflect improved cellular function and overall metabolic activity in the gastrointestinal tract [42]. The elevated levels of γ-aminobutyric acid (GABA) in the ileum of brown rice-fed broilers are noteworthy. GABA is an important inhibitory neurotransmitter in the central nervous system, but it also has significant roles in the gastrointestinal tract. GABA can modulate gut motility, reduce inflammation, and enhance gut barrier function. The up-regulation of GABA in the ileum suggests that brown rice may exert beneficial effects on gut health by promoting a more favorable gastrointestinal environment [43]. This could contribute to improved nutrient absorption and overall digestive efficiency in broilers. Other metabolites, which including 1-aminocyclohexanoic acid, D-proline betaine, stachydrine, cis-EODA, 12-hydroxyoctadecanoic acid, Val-Ala, azelaic Acid, (S)-leucic acid, sphingosyl-phosphocholine, 5-hydroxyhexanoic acid, 2-hydroxyhexanoic acid, LPC (20:2/0:0), LPC (0:0/20:2), nicotinic acid, guanidineacetic acid were down regulated in BR1 groups (Figures 1C).
Between BR1 and BR6 groups, ritalinic acid, γ-aminobutyric Acid, N'-formylkynurenine, 7-ketodeoxycholic acid, oxaceprol, 4-hydroxybenzaldehyde, L-dihydroorotic acid, N-acetylcadaverine, PC (8:0/8:0), thymidine were down regulated in BR6 groups, while FFA (20:1), cis-EODA, 1-methylguanosine, 2'-O-methylguanosine, heparin, 1-methylinosine, quinoline-4-carboxylic acid, 2-methylguanosine, arachidyl glycine, 2-(dimethylamino) guanosine were up regulated in BR6 groups (Figures 1D). The down-regulation of metabolites such as GABA, bile acids, and nucleosides in broilers fed stored brown rice suggests potential disruptions in gut health, including reduced anti-inflammatory capacity, compromised gut barrier function, and altered lipid metabolism [44,45]. Conversely, the up-regulation of fatty acids, modified nucleosides, and compounds involved in immune modulation indicates possible adaptive responses to maintain gut homeostasis [46,47]. These findings highlight the importance of lipid oxidation of stored brown rice in influencing gut health and overall metabolic function in broilers. Future research should focus on elucidating the specific mechanisms underlying these metabolic changes and exploring strategies to optimize feed quality and gut health in poultry production.
The K-means clustering in Figure 2B further categorizes the differential metabolites into subclasses, highlighting the complexity of metabolic alterations due to rice storage. Figures 2C and 2D present the differentially abundant metabolites and their associated metabolic pathways. Notably, the Corn versus BR1 comparison shows significant enrichment in pathways such as linoleic acid metabolism, one carbon pool by folate, and nicotine and nicotinamide metabolism. These pathways are crucial for lipid metabolism and energy production, suggesting that fresh rice might promote more active metabolic processes in the ileum [48]. In contrast, the BR1 versus BR6 comparison reveals significant changes in pathways like drug metabolism-cytochrome P450, GnRH secretion, and α-linolenic acid metabolism. The upregulation of cytochrome P450 pathways in BR1 might indicate enhanced detoxification capabilities, while changes in GnRH secretion could affect hormonal balance and growth performance [49]. These findings underscore the potential metabolic impact of lipid oxidation of stored brown rice on broiler ileum, which could influence digestive efficiency, nutrient absorption, and overall health. Further research is needed to explore the functional implications of these metabolic changes and to understand how they might impact the health benefits and quality attributes of broiler products derived from diets containing stored grains.
4. Materials and Methods
4.1. Animal Ethics Statement
All experiments were conducted in accordance with the Chinese Guidelines for Animal Welfare and Experimental Protocol, and prior approval was obtained from the Animal Care and Use Committee of Academy of National Food and Strategic Reserves Administration (ethical approval code: 20241221002).
4.2. Experimental Materials
The paddy rice stored for 1 or 6 years was collected from the National Grain Reserve Barn of Heilongjiang Province. The storage temperature in the grain barn was maintained at 20 °C year-round. Prior to the experiment, the paddy rice was processed to obtain brown rice, which was then used for the subsequent experimental procedures.
4.3. Lipid Metabolism Indexes and Fatty Acid Composition of Stored Brown Rice
The fatty acid value was analyzed according to the procedures of GB/T 20569-2006 (Guidelines for evaluation of paddy storage character). MDA is typically measured using the thiobarbituric acid (TBA) reaction method, which involves the formation of a pink-colored complex that can be quantified spectrophotometrically. The detection of carbonylated proteins rely on the reaction of carbonyl groups with 2,4-dinitrophenylhydrazine (DNPH), followed by immunoblotting with anti-DNP antibodies. CAT, T-AOC, GSH, GSH-PX, SOD were measured using assay kits purchased from Nanjing Jiancheng Bioengineering Institute (Nanjing, China).
The fatty acid composition of brown rice was determined using the internal standard method according to GB 5009.168-2016. Briefly, 0.2 g rice flour was placed into a 50 mL centrifuge tube containing 6 mL of extraction solvent (2 mL 95% ethanol and 4 mL water), 100 mg of pyrogallic acid to prevent oxidation, along with 2 mL of tridecanoin (internal standard solution). Then 10 mL of hydrochloric acid solution was added and the mixture was hydrolyzed at 70 - 80 °C for 40 min with intermittent shaking every 10 min. After cooling to room temperature, 2 mL of hexane is added, and the mixture is centrifuged at 4 °C and 1000 rpm for 5 minutes. Finally, 600 µL of the supernatant is injected into the gas chromatograph, which is equipped with a high-polarity capillary column (e.g., Agilent HP-5, 30 m × 0.32 mm inner diameter, 0.25 µm film thickness). The initial column temperature is set to 150 °C, and the temperature and flow rate are adjusted to separate and detect different fatty acids.
4.3. Animals and Dietary Treatments
A total of 240 one-day-old Ross 308 male chicks were weighed upon arrival and then allocated to their respective pens based on a completely randomized design, ensuring that each pen had a similar initial body weight (± 20 g/pen) across treatments. Each of the treatments had 8 replicate pens of 10 birds during the study. The birds were housed in floor pens measuring 0.725 m × 1.175 m (0.85 m²), with softwood shavings as litter to a depth of 8 cm. The housing environment was controlled, and feed and water were provided ad libitum throughout the study.
The experiment utilized a completely randomized design, comprising one control diet (Corn) and two experimental diets. The experimental diets were formulated by completely replacing corn with brown rice stored for either 1 year (BR1) or 6 years (BR6). The diets were formulated in accordance with the Feeding Standard for Chickens (NY/T 33-2004). The experiment was divided into two stages: the early stage (1-21 days of age) and the late stage (22-42 days of age) (Table 6).
4.4. Performance Measurement and Sampling
The initial body weight of the chicks was recorded on the first day of the experiment. At 21 and 42 days of age, the body weights of the broilers were measured again at 07:00 the following day after a 12-hour fasting. Throughout the experiment, feed intake was monitored and recorded for each replicate. Based on these measurements, the ADG, ADFI and FCR were calculated for each stage of the experiment.
The meat quality of broilers was assessed according to the guidelines of NY/T 1333-2007. After slaughter at 42 days of age, the pH levels of the left pectoral muscle were measured at three different points for 24 hours. The left pectoral muscle were then cut into blocks measuring 5 cm × 3 cm × 2 cm and weighed (marked as m1). These samples were hung in a closed plastic bag at 4 °C for 24 hours and then weighed again after using filter paper to absorb surface moisture (marked as m2). The cooking percentage was determined by taking approximately 30 g samples from the left breast muscle (recorded as m3), boiled in boiling water for 30 minutes, hang in a cool place for 30 minutes, and then weighed after absorbing surface moisture with filter paper (recorded as m4). Additionally, about 20 g of meat sample was lyophilized to determine the fatty acid profile using internal standard method according to GB 5009.168-2016, as mentioned before. Drip loss and cooking percentage are calculated using the following formula:
Drip loss (%) = [(m1-m2)/m1] ×100;
Cooking percentage (%) = (m4/m3) ×100.
4.5. Antioxidant Properties Analyses
Ileum samples were homogenized in cold maleic acid buffer (0.1 mol/L, pH 6.8) at a ratio of 1:10 (w/v) and subsequently centrifuged at 3000 × g for 10 minutes. The supernatants were collected for analysis. The content of MDA and the activities of SOD, T-AOC, GSH-Px and CAT were evaluated using ELISA kits purchased from Nanjing Jiancheng Bioengineering Institute (Nanjing, China). Additionally, the activities of several digestive enzymes, including α-amylase, trypsin, chymotrypsin, and lipase, were determined following the protocols provided in assay kits from Nanjing Jiancheng Bioengineering Institute (Nanjing, China).
4.6. Untargeted Metabolome Analysis of Broiler Ileum
4.6.1. Extraction of Metabolites
50 mg of sample was weighed and transferred to a 2 mL centrifuge tube, followed by the addition of grinding bead and 400 µL of extraction solution (methanol: water = 4:1, v/v) containing 0.02 mg/mL of internal standard (L-2-chlorophenylalanine). The samples were then subjected to grinding using a frozen tissue grinder for 6 minutes at -10 °C and 50 Hz. After grinding, the samples underwent low-temperature ultrasonic extraction for 30 minutes at 5 °C and 40 kHz. The samples were then left at -20 °C for 30 minutes and centrifuged at 13,000 g and 4 °C for 15 minutes. Finally, the supernatant was carefully transferred to an injection vial for LC-MS/MS analysis. As part of the system conditioning and quality control process, quality control (QC) sample was prepared by mixing equal volumes of all samples, and was injected at regular intervals (every 5-15 samples) to monitor the stability of the analysis throughout the experiment.
4.6.2. Liquid Chromatography and Mass Spectrum Parameters
The analysis of the sample extracts was conducted using an UPLC-MS/MS system (UPLC, ExionLC AD; MS, TripleTOF 6600, AB SCIEX). Chromatographic separation was achieved using a HSS T3 C18 column (100 mm × 2.1 mm i.d., 1.8 µm; Waters, Milford, USA). The mobile phase consisted of a binary solvent system with water (containing 0.1% formic acid) and acetonitrile (also containing 0.1% formic acid). The gradient elution program was as follows: 0-10, 95:5 (v/v) at 0 min, 10:90 (v/v) at 10.0 min, 10:90 (v/v) at 11.0 min, 95:5 (v/v) at 11.1 min, 95:5 (v/v) at 14 min. and holding this condition until the end of the run at 14.0 minutes. maintained at a temperature of 40 °C. The flow rate was 0.4 mL/min, the injection volume was 2 μL, and the column temperature was maintained at 40 °C.
The TripleTOF mass spectrometer was employed for its capacity to perform MS/MS scans in an information-dependent acquisition (IDA) mode during LC/MS analyses. In this mode, the acquisition software (TripleTOF 6600, AB SCIEX) dynamically assesses the full-scan MS data in real-time and triggers MS/MS spectra acquisition based on predefined criteria. During each acquisition cycle, up to 12 precursor ions with an intensity exceeding 100 were selected for fragmentation at a collision energy of 30 V. Each MS/MS event had a product ion accumulation time of 50 milliseconds. The ESI source conditions were configured as follows: Ion source gas 1 at 50 Psi, ion source gas 2 at 50 Psi, curtain gas at 25 Psi, source temperature at 500 °C, and ion spray voltage floating (ISVF) set to 5500 V in positive mode or -4500 V in negative mode.
4.6.3. Data Extraction and Processing
Raw data preprocessing was executed using Progenesis QI (Waters Corporation, Milford, USA), resulting in the export of a three-dimensional CSV data matrix encompassing sample details, metabolite names, and their corresponding mass spectral response intensities. Metabolite identification was facilitated based on the self-built target compound database MWDB (which includes secondary spectra and retention time RT) and the integrated public database MHK (comprising Metlin, HMDB, KEGG databases, secondary spectra, RT), as well as MetDNA, and analyzed on the Metware cloud platform. Metabolic features consistently detected in at least 80% of samples were retained. Post-filtering, metabolite values below the quantitation limit were imputed, and features were normalized by summation to mitigate errors from sample preparation and instrument variability. The response intensities of mass spectral peaks were normalized using the sum normalization method, yielding a refined data matrix. Variables with a relative standard deviation (RSD) exceeding 30% in QC samples were removed, and log10 transformation was applied to prepare the final data matrix for further analysis.
Variance analysis was conducted on the preprocessed data matrix, followed by the application of the R package "ropls" (Version 1.6.2) for principal component analysis (PCA) and OPLS-DA. Metabolites with a VIP score > 1 and P value < 0.05, as determined by the OPLS-DA model and student's t-test, were identified as significantly different. Differential metabolites were then mapped to their respective biochemical pathways using metabolic enrichment and pathway analysis based on the KEGG database. Enrichment analysis, which evolved from single metabolite annotation to group annotation, was conducted using the Python package "scipy.stats" to discern the most pertinent biological pathways influenced by the experimental treatments.
4.7. Data Analysis
Values are expressed as the mean ± SEM. PROC UNIVERSATE program (SAS Inst. Inc., Carry, NC, USA) of SAS 9.2 was used to check the normal and abnormal values of lipid metabolism indexes and fatty acid composition of stored brown rice, as well as growth performance, meat quality, fatty acid composition, anti-oxidant and digestive enzymes indices of broilers. Data on lipid metabolism indexes and fatty acid composition of brown rice were performed by independent sample, while data on growth performance, meat quality, fatty acid composition, anti-oxidant and digestive enzymes indices of broilers were determined using one-way ANOVA, followed by the Student-Newman-Keuls comparison test of SAS. Values of P < 0.05 were considered statistically significant.
5. Conclusions
The present study found that long-term storage may increase lipid oxidation and alter fatty acid composition of brown rice, thereby impacting ileum digestive enzyme activities and metabolism characteristics of broilers.
Author Contributions
B.H., methodology, validation, investigation, data curation, writing – original draft. X.Z., methodology, validation, investigation, data curation. W.W., investigation, data curation. L.W., and J.S., resources, investigation. K.Li., and J.C., resources, investigation. Y.W., and A.L., conceptualization, resources, supervision, project administration, funding acquisition, writing– original draft, writing – review & editing. All the authors have read and approved the final version of the manuscript.
Funding
This research was funded by National Key Research and Development Program of China, grant number 2024YFD1300401-4.
Informed Consent Statement
We grant International Journal of Molecular Science the right to publish the manuscript above in all media formats, and confirm that the content of this manuscript is original and has not been previously published.
Data Availability Statement
Raw metabolomics data were uploaded to the MetaboLights database (Accession number: MTBLS12604; https://www.ebi.ac.uk/metabolights/MTBLS12604).3eed; European Bioinformatics Institute, Cambridge, UK).
Conflicts of Interest
The authors declare that there are no competing interests.
References
- Sittiya, J.; Yamauchi, K.; Takata, K. Effect of replacing corn with whole-grain paddy rice and brown rice in broiler diets on growth performance and intestinal morphology. J. Anim. Physiol. Anim. Nutr. 2015, 100, 381–390. [Google Scholar] [CrossRef] [PubMed]
- Saikrishna A, Dutta S, Subramanian V, Moses JA, Anandharamakrishnan C. Ageing of rice: A review. Journal of Cereal Science. 2018;81:161–70.
- Zhang, M.; Liu, K. Lipid and Protein Oxidation of Brown Rice and Selenium-Rich Brown Rice during Storage. Foods 2022, 11, 3878. [Google Scholar] [CrossRef]
- Zhang, D.; Huang, S.; Wang, Q.; Shang, B.; Liu, J.; Xing, X.; Hong, Y.; Liu, H.; Duan, X.; Sun, H. Lipidomics and volatilomics reveal the changes in lipids and their volatile oxidative degradation products of brown rice during accelerated aging. Food Chem. 2023, 421, 136157. [Google Scholar] [CrossRef]
- Zhou K, Luo Z, Huang W, Liu Z, Miao X, Tao S, et al. Biological Roles of Lipids in Rice. International Journal of Molecular Sciences [Internet]. 2024;25. Available from: https://www.mdpi. 1422.
- Mittler, R.; Zandalinas, S.I.; Fichman, Y.; Van Breusegem, F. Reactive oxygen species signalling in plant stress responses. Nat. Rev. Mol. Cell Biol. 2022, 23, 663–679. [Google Scholar] [CrossRef]
- Kerr, B.J.; Kellner, T.A.; Shurson, G.C. Characteristics of lipids and their feeding value in swine diets. J. Anim. Sci. Biotechnol. 2015, 7, 30. [Google Scholar] [CrossRef]
- Li, F.; Wu, X.; Liang, Y.; Wu, W. Potential implications of oxidative modification on dietary protein nutritional value: A review. Compr. Rev. Food Sci. Food Saf. 2022, 22, 714–751. [Google Scholar] [CrossRef] [PubMed]
- Yuan, J.; Kerr, B.J.; Curry, S.M.; Chen, C. Identification of C9-C11 unsaturated aldehydes as prediction markers of growth and feed intake for non-ruminant animals fed oxidized soybean oil. J. Anim. Sci. Biotechnol. 2020, 11, 1–14. [Google Scholar] [CrossRef] [PubMed]
- Kerr, B.J.; Lindblom, S.C.; Zhao, J.; Faris, R.J. Influence of feeding thermally peroxidized lipids on growth performance, lipid digestibility, and oxidative status in nursery pigs. J. Anim. Sci. 2020, 98. [Google Scholar] [CrossRef]
- A Frame, C.; Johnson, E.; Kilburn, L.; Huff-Lonergan, E.; Kerr, B.J.; Serao, M.R. Impact of dietary oxidized protein on oxidative status and performance in growing pigs. J. Anim. Sci. 2020, 98. [Google Scholar] [CrossRef]
- Zhang, M.; Liu, K. Lipid and Protein Oxidation of Brown Rice and Selenium-Rich Brown Rice during Storage. Foods 2022, 11, 3878. [Google Scholar] [CrossRef]
- Rashid, M.T.; Liu, K.; Han, S.; Jatoi, M.A. The Effects of Thermal Treatment on Lipid Oxidation, Protein Changes, and Storage Stabilization of Rice Bran. Foods 2022, 11, 4001. [Google Scholar] [CrossRef]
- Dietrich, R.B.; Lincoln, L.; Momen, S.; Minkoff, B.B.; Sussman, M.R.; Girard, A.L. Role of protein and lipid oxidation in hardening of high-protein bars during storage. J. Food Sci. 2025, 90, e17657. [Google Scholar] [CrossRef] [PubMed]
- Hasanuzzaman, M.; Bhuyan, M.B.; Zulfiqar, F.; Raza, A.; Mohsin, S.M.; Al Mahmud, J.; Fujita, M.; Fotopoulos, V. Reactive Oxygen Species and Antioxidant Defense in Plants under Abiotic Stress: Revisiting the Crucial Role of a Universal Defense Regulator. Antioxidants 2020, 9, 681. [Google Scholar] [CrossRef] [PubMed]
- Zhu, D.; Wang, T.; Liu, X.; Bi, J.; Zhang, W.; Zeng, X.; Wang, P.; Shu, Z. Quality changes in Chinese high-quality indica rice under different storage temperatures with varying initial moisture contents. Front. Nutr. 2024, 11, 1334809. [Google Scholar] [CrossRef]
- Singh, P.; Arif, Y.; Miszczuk, E.; Bajguz, A.; Hayat, S. Specific Roles of Lipoxygenases in Development and Responses to Stress in Plants. Plants 2022, 11, 979. [Google Scholar] [CrossRef]
- Du, J.; Lin, Y.; Gao, Y.; Tian, Y.; Zhang, J.; Fang, G. Nutritional Changes and Early Warning of Moldy Rice under Different Relative Humidity and Storage Temperature. Foods 2022, 11, 185. [Google Scholar] [CrossRef]
- Zhang, D.; Duan, X.; Shang, B.; Hong, Y.; Sun, H. Analysis of lipidomics profile of rice and changes during storage by UPLC-Q-extractive orbitrap mass spectrometry. Food Res. Int. 2021, 142, 110214. [Google Scholar] [CrossRef]
- Pirgozliev VR, Birch,C.L., Rose,S.P., Kettlewell,P.S., and Bedford MR. Chemical composition and the nutritive quality of different wheat cultivars for broiler chickens. British Poultry Science. 2003;44:464–75.
- Pirgozliev, V.; Rose, S.; Kettlewell, P. Effect of ambient storage of wheat samples on their nutritive value for chickens. Br. Poult. Sci. 2006, 47, 342–349. [Google Scholar] [CrossRef]
- Tavárez, M.; Boler, D.; Bess, K.; Zhao, J.; Yan, F.; Dilger, A.; McKeith, F.; Killefer, J. Effect of antioxidant inclusion and oil quality on broiler performance, meat quality, and lipid oxidation. Poult. Sci. 2011, 90, 922–930. [Google Scholar] [CrossRef]
- Yin, D.; Yuan, J.; Guo, Y.; Chiba, L.I. Effect of storage time on the characteristics of corn and efficiency of its utilization in broiler chickens. 3. [CrossRef]
- Ghasemi, H.A.; Shivazad, M.; Mirzapour Rezaei, S.S.; Karimi orshizi, M.A. Effect of synbiotic supplementation and dietary fat sources on broiler performance, serum lipids, muscle fatty acid profile and meat quality. Br. Poult. Sci. 2016, 57, 71–83. [Google Scholar] [CrossRef]
- Li, Z.; Hong, T.; Zhao, Z.; Gu, Y.; Guo, Y.; Han, J. Fatty Acid Profiles and Nutritional Evaluation of Fresh Sweet-Waxy Corn from Three Regions of China. Foods 2022, 11, 2636. [Google Scholar] [CrossRef]
- Munarko, H.; Sitanggang, A.B.; Kusnandar, F.; Budijanto, S. Phytochemical, fatty acid and proximal composition of six selected Indonesian brown rice varieties. CyTA - J. Food 2020, 18, 336–343. [Google Scholar] [CrossRef]
- Cortinas, L.; Villaverde, C.; Galobart, J.; Baucells, M.D.; Codony, R.; Barroeta, A.C.; Baucells, M.D. Fatty Acid Content in Chicken Thigh and Breast as Affected by Dietary Polyunsaturation Level. Poult. Sci. 2004, 83, 1155–1164. [Google Scholar] [CrossRef]
- Pal, M.P.; Leskovec, J.; Levart, A.; Pirman, T.; Salobir, J.; Rezar, V. Comparison of High n-3 PUFA Levels and Cyclic Heat Stress Effects on Carcass Characteristics, Meat Quality, and Oxidative Stability of Breast Meat of Broilers Fed Low- and High-Antioxidant Diets. Animals 2024, 14, 3314. [Google Scholar] [CrossRef] [PubMed]
- NR, Abdulla, TC, Loh, H, Akit, et al. Fatty Acid Profile, Cholesterol and Oxidative Status in Broiler Chicken Breast Muscle Fed Different Dietary Oil Sources and Calcium Levels. South African Journal of Animal Science. 2015.
- Prates, J.A.M. Nutritional Value and Health Implications of Meat from Monogastric Animals Exposed to Heat Stress. Nutrients 2025, 17, 1390. [Google Scholar] [CrossRef]
- Desbruslais, A.; Wealleans, A.L. Oxidation in Poultry Feed: Impact on the Bird and the Efficacy of Dietary Antioxidant Mitigation Strategies. Poultry 2022, 1, 246–277. [Google Scholar] [CrossRef]
- Mu Y, Zhang K, Bai S, Wang JP, Zeng Q, Ding X. Effects of vitamin E supplementation on performance, serum biochemical parameters and fatty acid composition of egg yolk in laying hens fed a diet containing ageing corn. J Anim Physiol Anim Nutr (Berl). 2019;103:135–45.
- Raes, K.; De Smet, S.; Demeyer, D.; Huyghebaert, G.; Nollet, L.; Arnouts, S. The Deposition of Conjugated Linoleic Acids in Eggs of Laying Hens Fed Diets Varying in Fat Level and Fatty Acid Profile. J. Nutr. 2002, 132, 182–189. [Google Scholar] [CrossRef]
- Chae, B.J.; Lee, K.H.; Lee, S.K. Effects of Feeding Rancid Rice Bran on Growth Performance and Chicken Meat Quality in Broiler Chicks. Asian-Australasian J. Anim. Sci. 2002, 15, 266–273. [Google Scholar] [CrossRef]
- Bao, Y.; Osowiecka, M.; Ott, C.; Tziraki, V.; Meusburger, L.; Blaßnig, C.; Krivda, D.; Pjevac, P.; Séneca, J.; Strauss, M.; et al. Dietary oxidized lipids in redox biology: Oxidized olive oil disrupts lipid metabolism and induces intestinal and hepatic inflammation in C57BL/6J mice. Redox Biol. 2025, 81, 103575. [Google Scholar] [CrossRef] [PubMed]
- Chandimali, N.; Bak, S.G.; Park, E.H.; Lim, H.-J.; Won, Y.-S.; Kim, E.-K.; Park, S.-I.; Lee, S.J. Free radicals and their impact on health and antioxidant defenses: a review. Cell Death Discov. 2025, 11, 1–17. [Google Scholar] [CrossRef]
- Elbaz, A.M.; Zaki, E.F.; Salama, A.A.; Badri, F.B.; Thabet, H.A. Assessing different oil sources efficacy in reducing environmental heat-stress effects via improving performance, digestive enzymes, antioxidant status, and meat quality. Sci. Rep. 2023, 13, 1–13. [Google Scholar] [CrossRef] [PubMed]
- He, B.; Shi, J.; Liu, K.; Cheng, J.; Wang, W.; Wang, Y.; Li, A. Evaluation of the Available Energy Value and Amino Acid Digestibility of Brown Rice Stored for 6 Years and Its Application in Pig Diets. Animals 2023, 13, 3381. [Google Scholar] [CrossRef] [PubMed]
- Liu, Y.; Yang, J.; Liu, X.; Liu, R.; Wang, Y.; Huang, X.; Li, Y.; Liu, R.; Yang, X. Dietary folic acid addition reduces abdominal fat deposition mediated by alterations in gut microbiota and SCFA production in broilers. Anim. Nutr. 2022, 12, 54–62. [Google Scholar] [CrossRef] [PubMed]
- Winarti C, Widaningrum, Widayanti SM, Setyawan N, Qanytah, Juniawati, et al. Nutrient Composition of Indonesian Specialty Cereals: Rice, Corn, and Sorghum as Alternatives to Combat Malnutrition. Prev Nutr Food Sci. 2023;28:471–82.
- Boronovskiy, S.E.; Kopylova, V.S.; Nartsissov, Y.R. Metabolism and Receptor Mechanisms of Niacin Action. Cell Tissue Biol. 2024, 18, 128–147. [Google Scholar] [CrossRef]
- Jäger, R.; Sawan, S.A.; Orrú, M.; Tinlsey, G.M.; Purpura, M.; Wells, S.D.; Liao, K.; Godavarthi, A.; Abreu-Villaça, Y. 1-Methylxanthine enhances memory and neurotransmitter levels. PLOS ONE 2025, 20, e0313486. [Google Scholar] [CrossRef]
- Braun, H.-S.; Sponder, G.; Pieper, R.; Aschenbach, J.R.; Deiner, C. GABA selectively increases mucin-1 expression in isolated pig jejunum. Genes Nutr. 2015, 10, 1–8. [Google Scholar] [CrossRef]
- Cai J, Rimal B, Jiang C, Chiang JYL, Patterson AD. Bile acid metabolism and signaling, the microbiota, and metabolic disease. Pharmacology & Therapeutics. 2022;237:108238.
- Wang, W.; Zhao, J.; Gui, W.; Sun, D.; Dai, H.; Xiao, L.; Chu, H.; Du, F.; Zhu, Q.; Schnabl, B.; et al. Tauroursodeoxycholic acid inhibits intestinal inflammation and barrier disruption in mice with non-alcoholic fatty liver disease. Br. J. Pharmacol. 2017, 175, 469–484. [Google Scholar] [CrossRef]
- Gu, B.-H.; Kim, M.; Yun, C.-H. Regulation of Gastrointestinal Immunity by Metabolites. Nutrients 2021, 13, 167. [Google Scholar] [CrossRef]
- Radzikowska, U.; Rinaldi, A.O.; Çelebi, Z.C.; Karaguzel, D.; Wojcik, M.; Cypryk, K.; Akdis, M.; Akdis, C.A.; Sokolowska, M. The Influence of Dietary Fatty Acids on Immune Responses. Nutrients 2019, 11, 2990. [Google Scholar] [CrossRef]
- Zhang, Z.; Mei, X.; He, Z.; Xie, X.; Yang, Y.; Mei, C.; Xue, D.; Hu, T.; Shu, M.; Zhong, W. Nicotine metabolism pathway in bacteria: mechanism, modification, and application. Appl. Microbiol. Biotechnol. 2022, 106, 889–904. [Google Scholar] [CrossRef]
- Wang, X.; Chen, X.; Zhou, T.; Dai, W.; Zhang, C. NADPH-cytochrome P450 reductase mediates resistance to neonicotinoid insecticides in Bradysia odoriphaga. . 2025, 211, 106406. [Google Scholar] [CrossRef] [PubMed]
Figure 1.
PLS-DA score plots and significantly changed metabolites in ileum of broilers fed corn and brown rice diet. (A) PLS-DA score plots; (B) volcano map; (C) significantly changed metabolites between Corn and BR1 group; (D) significantly changed metabolites between BR1 and BR6 group. Note: n = 6. The same as below.
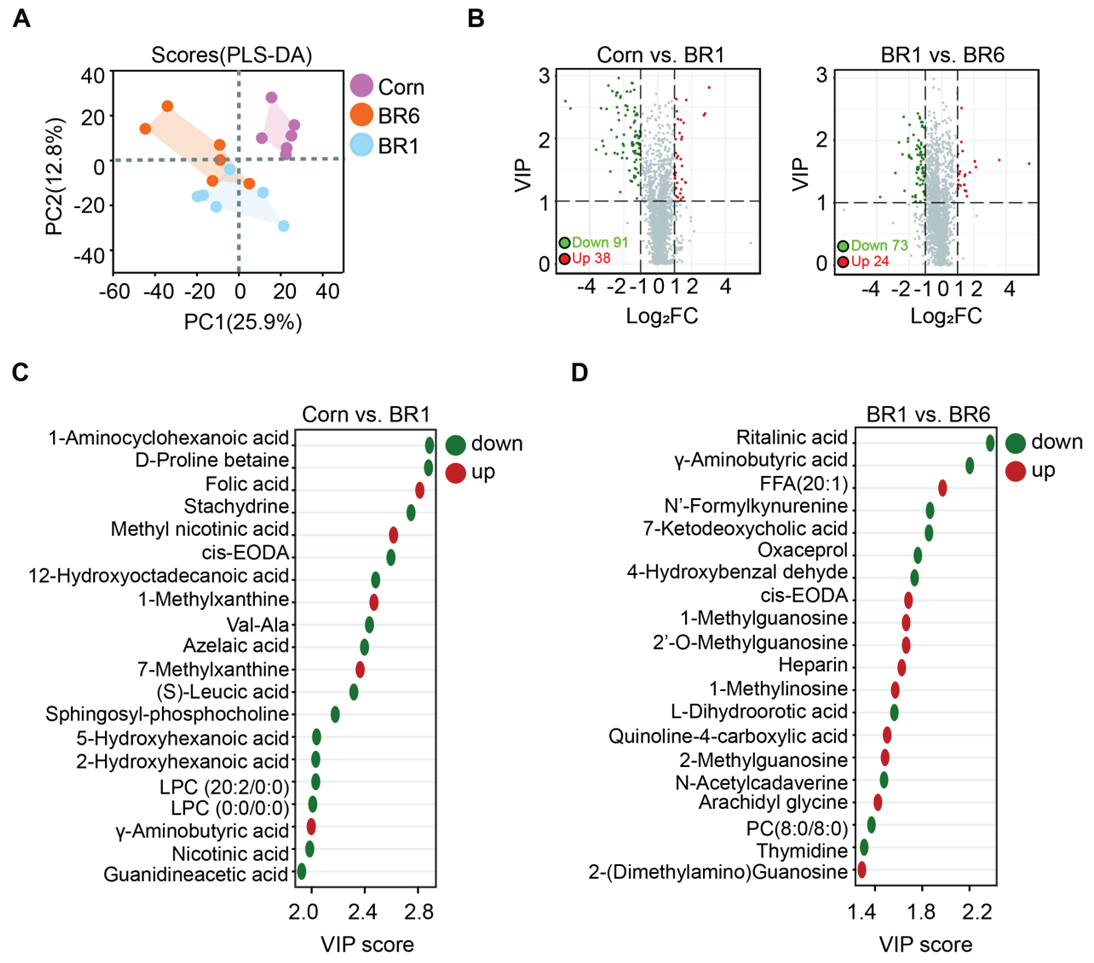
Figure 2.
Significantly changed metabolic pathways in ileum of broilers fed corn and brown rice diet. (A) Venn Diagram; (B) K-means clustering analysis; (C) significantly changed metabolic pathway between Corn and BR1 group; (D) significantly changed metabolic pathway between BR1 and BR6 group.
Figure 2.
Significantly changed metabolic pathways in ileum of broilers fed corn and brown rice diet. (A) Venn Diagram; (B) K-means clustering analysis; (C) significantly changed metabolic pathway between Corn and BR1 group; (D) significantly changed metabolic pathway between BR1 and BR6 group.
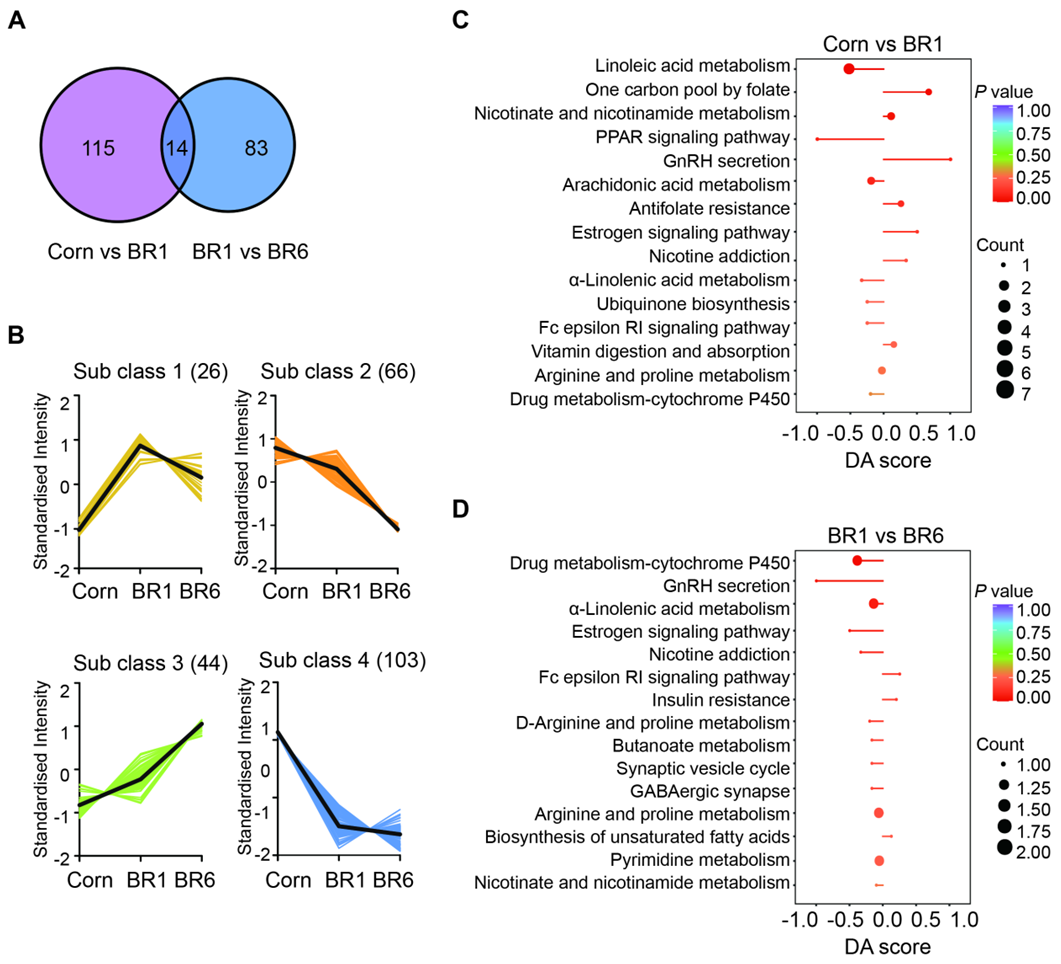

Table 1.
Lipid metabolism indexes of brown rice.
| Items | BR6 | BR1 | P-value |
| Fatty acid value (mg KOH/100 g) | 27.83 ± 2.11a | 17.44 ± 1.05b | < 0.01 |
| MDA (nmol/mg) | 6.24 ± 0.54a | 3.67 ± 0.30b | < 0.01 |
| Carbonylated protein (nmol/mg) | 3.25 ± 0.32a | 1.60 ± 0.05b | < 0.01 |
| SOD (U/mg) | 6.48 ± 0.93 | 6.52 ± 0.52 | 0.97 |
| GSH-PX (U/mg) | 41.80 ± 5.45b | 68.13 ± 5.87a | < 0.01 |
| GSH (μmol/mg) | 1.52 ± 0.06b | 2.18 ± 0.18a | <0.01 |
| CAT (U/mg) | 7.44 ± 0.86 | 8.40 ± 0.67 | 0.40 |
| LPS (U/mg) | 2.66 ± 0.33 | 1.86 ± 0.36 | 0.13 |
| APX (U/mg) | 0.94 ± 0.10 | 1.25 ± 0.15 | 0.11 |
Note: Results are expressed as mean ± standard error of the mean (SEM), n = 6. a - b Peer data with different shoulder labels (lowercase English letters) indicate significant differences (P < 0.05). The same as below.
Table 2.
Fatty acid composition of brown rice (%).
| Items | BR6 | BR1 | P-value |
| Myristic acid (C14: 0) | 0.55 ± 0.02 | 0.54 ± 0.01 | 0.75 |
| Palmitic acid (C16: 0) | 25.40 ± 0.07 | 25.58 ± 0.17 | 0.27 |
| Stearic acid (C18: 0) | 2.13 ± 0.06a | 1.86 ± 0.02b | < 0.01 |
| Oleic acid (C18: 1n-9c) | 33.98 ± 0.18a | 31.74 ± 0.44b | < 0.01 |
| Linoleic acid (C18: 2n-6c) | 33.88 ± 0.27b | 36.01 ± 0.25a | < 0.01 |
| Alpha-linolenic acid (C18: 3n-3) | 1.07 ± 0.02b | 1.46 ± 0.03a | < 0.01 |
| Icosanoic acid (C20: 0) | 0.64 ± 0.02a | 0.56 ± 0.00b | < 0.01 |
| Eicosenoic acid (C20: 1) | 0.55 ± 0.01a | 0.50 ± 0.01b | < 0.01 |
| Docosanoic acid (C22: 0) | 0.33 ± 0.01a | 0.30 ± 0.00b | 0.03 |
| Docosahexaenoic acid (C22: 6n-3) | 0.33 ± 0.02 | 0.37 ± 0.01 | 0.79 |
| Tricosanoic acid (C23: 0) | 0.30 ± 0.01b | 0.36 ± 0.01a | 0.04 |
| Tetracosanoic acid acid (C24: 0) | 0.84 ± 0.04a | 0.72 ± 0.01b | 0.03 |
| Total (g/100g) | 2.91± 0.16 | 2.69± 0.03 | 0.23 |
| SFA | 30.16 ± 0.18 | 29.91 ± 0.19 | 0.38 |
| MUFA | 34.53 ± 0.19a | 32.24 ± 0.45b | < 0.01 |
| PUFA | 35.32 ± 0.28b | 37.85 ± 0.29a | < 0.01 |
| UFA | 69.84 ± 0.18 | 70.09 ± 0.19 | 0.38 |
| SFA/UFA | 0.43 ± 0.00 | 0.43 ± 0.00 | 0.38 |
| PUFA/SFA | 1.17 ± 0.02b | 1.27 ± 0.01a | < 0.01 |
Table 3.
Growth performance and meat quality of broilers.
| Items | BR6 | BR1 | P-value | |
| Growth performance | ||||
| Feed intake, kg | ||||
| Wk 0 to 3 | 36.24 ± 0.42 | 36.32 ± 0.85 | 35.22 ± 0.66 | 0.44 |
| Wk 4 to 6 | 98.45 ± 3.33 | 93.70 ± 4.64 | 94.77 ± 3.97 | 0.69 |
| Wk 0 to 6 | 67.36 ± 1.78 | 64.95 ± 2.08 | 64.95 ± 2.26 | 0.64 |
| Body weight gain, kg | ||||
| Wk 0 to 3 | 27.60 ± 0.29 | 26.65 ± 0.57 | 26.72 ± 0.47 | 0.29 |
| Wk 4 to 6 | 63.65 ± 1.31 | 62.51 ± 0.92 | 64.85 ± 0.65 | 0.28 |
| Wk 0 to 6 | 45.64 ± 0.74 | 44.58 ± 0.42 | 45.79 ± 0.54 | 0.30 |
| FCR | ||||
| Wk 0 to 3 | 1.31 ± 0.01b | 1.36 ± 0.01a | 1.32 ± 0.01b | 0.03 |
| Wk 4 to 6 | 1.55 ± 0.05 | 1.50 ± 0.06 | 1.46 ± 0.06 | 0.56 |
| Wk 0 to 6 | 1.48 ± 0.03 | 1.47 ± 0.04 | 1.42 ± 0.04 | 0.58 |
| Meat quality | ||||
| pH | 5.63 ± 0.02 | 5.58 ± 0.02 | 5.62 ± 0.01 | 0.13 |
| Drop loss, % | 5.56 ± 0.28b | 7.00 ± 0.25a | 5.93 ± 0.36b | < 0.01 |
| Cooking percentage, % | 63.48 ± 0.96 | 60.53 ± 0.92 | 61.58 ± 0.55 | 0.06 |
Note: n = 8. The same as below.
Table 4.
Fatty acid composition in broiler breast muscle (%).
| Items | Corn | BR6 | BR1 | P-value |
| Myristic acid (C14: 0) | 0.55 ± 0.02ab | 0.61 ± 0.06a | 0.49 ± 0.02b | 0.09 |
| Palmitic acid (C16: 0) | 22.91 ± 0.39b | 24.48 ± 0.23a | 24.39 ± 0.18a | < 0.01 |
| Palmitoleic acid (C16: 1) | 1.29 ± 0.09b | 2.54 ± 0.14a | 2.79 ± 0.08a | < 0.01 |
| Stearic acid (C18: 0) | 14.37 ± 0.37a | 12.75 ± 0.36b | 11.90 ± 0.19b | < 0.01 |
| Oleic acid (C18: 1n-9c) | 20.59 ± 0.54b | 26.98 ± 1.13a | 28.49 ± 0.31a | < 0.01 |
| Linoleic acid (C18: 2n-6c) | 23.87 ± 0.60a | 19.56 ± 0.37b | 20.03 ± 0.34b | < 0.01 |
| Alpha-linolenic acid (C18: 3n-3) | 1.05 ± 0.07 | 0.96 ± 0.06 | 1.15 ± 0.04 | 0.09 |
| Eicosenoic acid (C20: 1) | 0.54 ± 0.03 | 0.47 ± 0.04 | 0.34 ± 0.05 | 0.13 |
| Eicosandienoic acid (C20: 2) | 1.32 ± 0.10a | 0.79 ± 0.06b | 0.71 ± 0.04b | < 0.01 |
| Sciadonic acid (C20: 3n-6) | 1.28 ± 0.09 | 1.34 ± 0.13 | 1.0 ± 0.06 | 0.17 |
| Docosadienoic acid (C20: 4n-6) | 8.52 ± 0.51a | 6.02 ± 0.48b | 5.36 ± 0.16b | < 0.01 |
| Erucic Acid (C22: 1n-9) | 2.51 ± 0.28 | 2.48 ± 0.32 | 0.33 ± 0.21 | 0.89 |
| Nervonic acid (C24: 1) | 0.55 ± 0.02a | 0.54 ± 0.05a | 0.43 ± 0.02b | 0.04 |
| Docosahexaenoic acid (C22: 6n-3) | 0.67 ± 0.05a | 0.47 ± 0.04b | 0.48 ± 0.02b | < 0.01 |
| Total (mg/g) | 0.61± 0.02b | 0.84 ± 0.07a | 0.92 ± 0.05a | < 0.01 |
| SFA | 37.82 ± 0.63 | 37.5 ± 0.36 | 36.78 ± 0.27 | 0.18 |
| MUFA | 25.48 ± 0.62b | 33.01 ± 0.92a | 34.33 ± 0.33a | < 0.01 |
| PUFA | 36.70 ± 0.27a | 29.1 ± 0.68b | 28.83 ± 0.50b | < 0.01 |
| UFA | 62.18 ± 0.63 | 62.15 ± 0.36 | 63.22 ± 0.7 | 0.18 |
| SFA/UFA | 0.61 ± 0.02 | 0.61 ± 0.01 | 0.58 ± 0.01 | 0.18 |
| PUFA/SFA | 0.97 ± 0.02a | 0.77 ± 0.02b | 0.78 ± 0.02b | < 0.01 |
| MUFA/PUFA | 0.69 ± 0.02b | 1.14 ± 0.06a | 1.20 ± 0.03a | < 0.01 |
| EFA | 24.92 ± 0.66a | 20.52 ± 0.38b | 21.19 ± 0.37b | < 0.01 |
Table 5.
Ileum anti-oxidant and digestive enzymes indices of broilers.
| Items | Corn | BR6 | BR1 | P-value |
| MDA | 0.91 ± 0.02a | 0.62 ± 0.01b | 0.51 ± 0.01c | < 0.01 |
| SOD (U/mg) | 10.52 ± 0.35b | 11.73 ± 0.42a | 12.42 ± 0.27a | < 0.01 |
| TAOC (U/mg) | 1.99 ± 0.02b | 2.72 ± 0.08a | 2.89 ± 0.10a | < 0.01 |
| GSH-PX (U/mg) | 266.12 ± 8.32b | 305.07 ± 13.29a | 308.06 ± 9.73a | 0.02 |
| CAT (U/mg) | 9.64 ± 0.47b | 13.04 ± 0.29a | 13.81 ± 0.29a | < 0.01 |
| α-AMY (U/mg) | 1.11 ± 0.03a | 0.84 ± 0.02b | 1.12 ± 0.04a | < 0.01 |
| Trypsin (U/mg) | 39.01 ± 1.80a | 27.40 ± 1.54b | 42.96 ± 1.21a | < 0.01 |
| Chymotrypsin (U/mg) | 70.00 ± 2.71a | 55.37 ± 0.94b | 74.65 ± 4.16a | < 0.01 |
| LPS (U/mg) | 50.94 ± 0.94b | 42.69 ± 1.57c | 56.30 ± 2.34a | < 0.01 |
Table 6.
Composition and nutrient levels of experimental diets (%, as-fed basis).
| Items | 1 to 21 days of age | 22 to 42 days of age | ||||
| Corn | BR6 | BR1 | Corn | BR6 | BR1 | |
| Ingredients | ||||||
| Corn | 55.88 | / | / | 60.74 | / | / |
| Soybean meal | 34.76 | 35.04 | 35.90 | 27.48 | 27.90 | 27.90 |
| BR6 | 0.00 | 56.97 | / | 0.00 | 62.51 | / |
| BR1 | 0.00 | / | 56.68 | 0.00 | / | 62.76 |
| Corn gluten meal | 3.00 | 2.22 | 1.50 | 4.42 | 4.12 | 3.83 |
| Soybean oil | 3.28 | 1.90 | 2.10 | 3.68 | 1.98 | 2.00 |
| CaHPO4 | 1.78 | 1.68 | 1.68 | 1.48 | 1.38 | 1.38 |
| Limestone | 1.26 | 1.32 | 1.32 | 1.24 | 1.30 | 1.32 |
| NaCl | 0.30 | 0.30 | 0.30 | 0.30 | 0.30 | 0.30 |
| Vitamin premixa | 0.03 | 0.03 | 0.03 | 0.03 | 0.03 | 0.03 |
| Mineral premixb | 0.20 | 0.20 | 0.20 | 0.20 | 0.20 | 0.20 |
| Choline chloride (50%) | 0.10 | 0.10 | 0.10 | 0.10 | 0.10 | 0.10 |
| Met | 0.21 | 0.17 | 0.17 | 0.14 | 0.10 | 0.10 |
| Lys-HCl (98%) | 0.16 | 0.05 | 0.02 | 0.17 | 0.07 | 0.07 |
| Thr | 0.04 | 0.02 | 0.00 | 0.02 | 0.01 | 0.01 |
| Total | 100 | 100 | 100 | 100 | 100 | 100 |
| Nutrients levels4 | ||||||
| Dry matter | 89.05 | 88.91 | 89.67 | 88.70 | 89.10 | 88.63 |
| Crude protein | 21.59 | 21.40 | 21.46 | 20.16 | 20.07 | 19.92 |
| Calcium | 1.03 | 1.02 | 1.05 | 0.90 | 0.92 | 0.89 |
| Total phosphorus | 0.69 | 0.70 | 0.68 | 0.67 | 0.66 | 0.66 |
| Metabolizable energy, MJ/kgc | 12.48 | 12.48 | 12.48 | 12.89 | 12.89 | 12.89 |
a Vitamin premix provided the following per kg of diet: vitamin A, 8,000 IU; vitamin D3, 1000 IU; vitamin E, 20 IU; vitamin K3, 0.5 mg; vitamin B12, 10 µg; vitamin B2, 9.6 mg; vitamin B1, 2 mg; vitamin B5, 20 mg; vitamin B6, 3.5 mg; niacin acid, 35 mg; calcium pantothenate, 10 mg; folic acid, 0.55 mg; biotin, 0.18 mg;.b Mineral premix provided the following per kg of diet: Mn, 100 mg (as manganese oxide); Fe, 80 mg (as ferrous sulfate); Zn, 80 mg (as zinc oxide); Cu, 8 mg (as copper sulfate); I, 0.7 mg (as ethylenediamine dihydroiodide) and Se, 0.3 mg (as sodium selenite).c Metabolizable energy were calculated.
Disclaimer/Publisher’s Note: The statements, opinions and data contained in all publications are solely those of the individual author(s) and contributor(s) and not of MDPI and/or the editor(s). MDPI and/or the editor(s) disclaim responsibility for any injury to people or property resulting from any ideas, methods, instructions or products referred to in the content. |
© 2025 by the authors. Licensee MDPI, Basel, Switzerland. This article is an open access article distributed under the terms and conditions of the Creative Commons Attribution (CC BY) license (http://creativecommons.org/licenses/by/4.0/).
Copyright: This open access article is published under a Creative Commons CC BY 4.0 license, which permit the free download, distribution, and reuse, provided that the author and preprint are cited in any reuse.


