
Submitted:
17 June 2025
Posted:
19 June 2025
You are already at the latest version
Abstract
Urban expansion intensifies population exposures to fine particulate matter (PM2.5). Trees mitigate pollution by dry deposition, in which particles settle on plants. However, city-scale models frequently overlook differences in tree species and structure. This study assesses PM2.5 removal by individual city-owned street trees in Mississauga, Canada, throughout the 2019 leaf-growing season (May to September). 27.8 tons of PM2.5 were removed from 200,560 city-owned trees (245 species). Coniferous species (14.37% of trees) removed 25.62 tons (92% of total), much higher than deciduous species (85.63%, 2.18 tons). Picea pungens (18.33 tons, 66%), Pinus nigra (3.29 tons, 12%), and Picea abies (1.50 tons, 5%) are three key species. Conifers' removal efficiency originates from the faster deposition velocities, larger tree size, and dense foliage, all of which enhance particle deposition. The findings indicate interspecies differences in PM2.5 mitigation, emphasizing the importance of smart urban forestry. This study emphasizes species-specific approaches for improving urban air quality through targeted tree planting. Prioritizing coniferous species such as spruce and pine can improve pollution mitigation, providing actionable strategies for Mississauga and other cities worldwide to develop green infrastructure planning for air pollution.
Keywords:
dry deposition
; PM2.5
; city-owned street trees
; nature-based solutions
1. Introduction
The urban landscape of the 21st century is marked by rapid changes, among which urban sprawl is particularly impactful [1,2]. Urban sprawl, defined as low-density and dispersed development, frequently results in segregated zoning that divides residential, commercial, and industrial districts. Consequently, public transportation alternatives are limited because of the low potential of passengers in such dispersed localities [1,3]. As a result, urban sprawl disrupts the ecosystem and exacerbates air pollution by increasing reliance on automobiles, a major contributor to traffic-related air pollution (TRAP), resulting in urban air quality degradation [4,5,6]. The degradation of air quality has drawn scientific attention to its health implications, particularly concerning fine particulate matter, particles 2.5 micrometres or smaller in aerodynamic diameter. Several studies have indicated an association between PM2.5 exposure and an increased risk of asthma attacks, cardiovascular illnesses, and premature death [7,8,9,10,11].
Although urgent efforts are required to reduce PM2.5 from emission sources [12,13,14,15], emission source reductions are usually prolonged due to the complexity of controlling PM2.5. Urban Green Infrastructure (UGI), particularly urban trees, is increasingly recognized as a cost-effective solution for improving urban environmental quality [16,17,18,19]. Among its many benefits, UGI has been widely recommended for mitigating air pollution, as trees can intercept PM2.5 and absorb gaseous pollutants through their leaves and bark [20,21,22,23,24]. Understanding the specific mechanisms, such as the capture of PM2.5, is crucial for optimizing UGI's air pollution mitigation potential. A growing body of research has investigated the capacity of different plant species to capture PM2.5 on leaf surfaces [25,26,27,28]. PM2.5 near the leaf surface can be pulled into the stomatal chamber and embedded in leaf hairs and wax layers over time [24,25,29,30,31,32]. Species with rougher leaf textures, such as conifers, and those with dense trichomes (hair-like structures) or thicker wax layers on their leaves, are particularly effective at intercepting PM2.5 [24,26,27,30].
Dry deposition modelling is an ecosystem-based process that quantifies the gravitational sedimentation of atmospheric particles on urban surfaces without precipitation [33,34]. Among the various methods used to implement dry deposition modelling, the i-Tree Eco model stands out because of its comprehensive assessment capabilities for urban canopies at the city level [35,36,37,38,39,40,41]. To model dry deposition at the city level, the downward hourly pollution flux (g m−2 hr−1) was estimated using dry deposition velocity (Vd) and the concentration of air pollutants (C) [33].
Dry deposition studies of PM2.5 demonstrate reductions on the scale of 4.7 tons to 64.5 tons in ten cities in the U.S., using i–Tree Eco, which used a uniform PM2.5 deposition velocity (Vd) for all tree species within the city [42]. However, research identifies rate changes across species depending on leaf morphology, local meteorological conditions, and pollutant concentrations surrounding trees [5,20,21,22,43]. Furthermore, modelling studies on a regional scale using i-Tree [42,44] often aggregate total PM2.5 mitigation by trees across the entire region, potentially overlooking the variability in PM2.5 reduction potential among different tree species within cities [31,42].
Given the highlighted variability in deposition rates and the aggregation method in regional studies, a more detailed modelling approach is necessary to quantify the species-specific contributions to PM2.5 removal accurately. Quantifying PM2.5 removal through dry deposition modelling involves factors such as dry deposition velocity, a critical factor determining how quickly PM2.5 particles settle on surfaces, which varies greatly among tree species due to differences in leaf morphology and local wind conditions [4,20,21,25,32]. To date, comprehensive modelling of PM2.5 dry deposition at the individual tree level within urban areas is lacking, leaving uncertainties regarding the species-specific contributions of PM2.5 mitigation through dry deposition. By focusing on the specific traits of individual tree species, our proposed modelling approach aims to fill the current gap in understanding how different tree species contribute to PM2.5 removal, overcoming the limitations of broad, regional aggregates.
This study aims to develop a scalable method for estimating the dry deposition of PM2.5 using city-owned street trees at the individual tree level in a suburban-dominated landscape (Mississauga, Canada). We seek to quantify PM2.5 removal through dry deposition by coniferous and deciduous trees and all city-owned street trees during the in-leaf season (May 1 to September 30, 2019). The results will model the potential PM2.5 reductions by tree species, providing insights into targeted urban forestry strategies to improve air quality. This research contributes to urban ecology and air quality management by assessing PM2.5 deposition at the individual tree level and evaluating the performance of different tree species in reducing air pollution. Our work supports broader sustainability objectives by mitigating the health impacts of air pollution and enhancing ecosystem health, ultimately promoting healthier urban environments in cities worldwide.
2. Methods
2.1. City-Owned Street Trees in Mississauga
Mississauga, Canada, the sixth-largest metropolitan area in Canada, has a population of 717,961 (Statistics Canada, 2021). The city is on the southern shore of Lake Ontario, experiencing a continental climate with the highest monthly temperature in July (22.5°C) and the lowest monthly temperature in January (-4.5°C) based on the 1991-2021 normal [45]. The city's tree inventory catalogued all city-owned trees, detailing common names, geographic locations, and diameter at breast height (DBH) (cm) [46]. Using ArcMap 10.8, we excluded trees in parks and natural areas because we would only like to consider the city-owned street trees. The study period, May 1 to September 30, 2019, was selected to coincide with active photosynthesis in coniferous and deciduous trees throughout the city [34,47]. Biological taxonomy classifications [48] of city-owned street trees were summarized for analysis.
The City of Mississauga’s tree inventory included 305,759 trees on street boulevards and parks in 2019. We removed the private trees from the inventory and trees located in the parks and natural areas using ArcMap 10.8 and retained street trees in the city. We removed dead trees, stumps, shrubs, and trees with missing species names from the tree inventory. Street trees with DBH equal to zero cm and trees with DBH equal to or greater than 400 cm are removed from the analysis. A tree with a diameter of 400 cm would be considered too large to be a valid street tree in this study.
2.2. Dry Deposition Velocity by Tree
Plant foliage serves as a sink to immobilize particulates [49]; however, the rate of the deposition velocity depends on the tree species, type of air pollutant, concentration of ambient air pollutant, and local wind speed [33,50]. In dry deposition modelling, dry deposition velocity (Vd) is interpreted as the rate of PM2.5 deposition during non-precipitation conditions [20,21,22,23,34]. We first obtained deposition velocities of PM2.5 (Vd,PM2.5, g m-2 h-1) of ten tree species from existing literature that included Quercus petraea, Fraxinus excelsior, Pseudotsuga menziesii, Scandosorbus intermedia, Acer pseudo-platanus, and Phyllostachys nigra, which we used as reference species to characterize dry deposition of PM2.5 at various wind speed as seen in Table A1.
Estimation at unreported wind speeds used a linear regression model of Vd PM2.5 (g m-2h-1) against the wind speed given by the literature, which was bounded to the range of reported wind speeds in the literature from 1 to 10 m/s [20,21,22,23]. Following that, we calculated the average wind speed (m/s) for the City of Mississauga from May 1 to September 30, 2019, using hourly measurements reported from the Toronto Pearson International Airport (43°40'36"N, 79°37'50" W), which is located within Mississauga. We applied the average wind speed during the study period (m/s) in the city during the study period to the known values of dry deposition velocities from the literature. We estimated the Vd of the ten tree species at the local wind speed for the city during the study period.
Empirical estimates for deposition velocity are limited to a few species in the scientific literature [20,21,22,24,26,49]. We identified the taxonomic order of street tree species using a scientific taxonomy classification [48]. We matched city-owned street trees in Mississauga with the ten reference tree species from the literature if both species shared the same taxonomic order [20,21,22,23]. For the city's tree species that belong to the same taxonomic order as the reference species, we used the Vd PM2.5 of the reference tree species to calculate the deposition velocity of each city tree species. We estimated their deposition velocity using leaf shape similarities for street tree species that did not belong to an evaluated taxonomic order as the reference species (Table A3).
The dry deposition of PM₂.₅ onto tree canopies depends on meteorological conditions (e.g., wind speed) and the available leaf surface area for particle interception. LAI—the one-sided leaf area per unit ground area (m²/m²)—quantifies canopy density and directly influences deposition efficiency. To account for this, the i-Tree Eco model computes tree-specific deposition velocity (Vd) by scaling a leaf-area-normalized deposition velocity (Vd PM2.5) by the tree’s LAI.
The species-specific Vd PM2.5 were derived from empirical studies [20,21,22,23,33] represent deposition rates per unit LAI under varying wind speeds (Table A3). LAI linearly adjusts these values to estimate total deposition per tree, assuming uniform particle capture across leaves (Nowak et al. 2013). The tree-level Vd is calculated as
where
Vd = Vd PM2.5 ∙ LAI
Vd = deposition velocity (m/s)
Vd PM2.5 = deposition velocities of PM2.5 (m/s) at the individual species level
LAI = Leaf Area Index (m2/m2)
2.3. Satellite Estimates and Field Validation of Leaf Area Index
The Leaf Area Index (LAI) measures the amount of green leaf area on one side for each unit of ground area (m²/m²) and is important for understanding how dense a plant canopy is and how it affects PM₂.₅ dry deposition [33,51]. Since LAI is closely related to vegetation reflectance characteristics, it can be assessed remotely through the Normalized Difference Vegetation Index (NDVI). As LAI increases, greater chlorophyll absorption in the red band (620–670 nm) and higher reflectance in the near-infrared (NIR, 845–885 nm) enhance NDVI values [52,53]. We used 3-meter-resolution PlanetScope imagery (Dove satellites) [54] from July 14, 2019, a cloud-free in-leaf date, to map LAI across Mississauga.
To validate the satellite-derived LAI, we conducted field measurements on July 3, 2022, for 88 street trees representing 28 common species and seven taxonomic orders in Mississauga. LAI was measured using hemispherical photography (Nikon Coolpix 8400 with a fisheye lens), following standardized protocols to ensure consistency with satellite resolution [55]. The camera was positioned 1.2 m above ground and 1.5 m from the trunk center, matching the 3-meter pixel scale of PlanetScope imagery. Photos were taken under overcast skies to minimize shadows and processed using TRACWin software. [55,56]. A linear regression was used to compare field and satellite LAI values from 2022 to update the 2019 estimates, considering small changes in the tree canopy while taking advantage of the stability of mature urban trees. This calibration strengthened the accuracy of LAI for PM₂.₅ deposition modelling, bridging remote sensing with ground-truth data.
2.4. Ambient PM2.5 Surrounding Individual Trees
Ambient PM₂.₅ concentrations were obtained from the Version 5.GL.05.02 dataset [57], which provides high-resolution (1 km²) monthly and annual average surface-level PM₂.₅ estimates for 1998–2023. These estimates combine satellite data on aerosol optical depth (AOD) from NASA instruments like MODIS, MISR, SeaWiFS, and VIIRS with GEOS-Chem chemical transport model simulations. A Geographically Weighted Regression (GWR) calibrated these hybrid estimates against global ground-based PM₂.₅ measurements to ensure local accuracy. For our study, we extracted warm–season (May–September 2019) PM₂.₅ values, matching our investigation period. Using geographic coordinates from municipal tree inventories, we spatially joined gridded PM₂.₅ data to individual tree locations in RStudio 4.0.5, assigning each tree its ambient concentration.
2.5. Area of Deposition
The dry deposition area (A), representing the crown projection area (CPA) available for PM₂.₅ capture, was estimated using a simplified quadratic model based on [58]. The original power-sigmoid model relates CPA to tree diameter at breast height (DBH), capturing how CPA increases with DBH but gradually levels off as trees mature. To enable large-scale applications using available inventory data, we adopt the following simplified form:
where:
A = a × (DBH)²
A = estimated deposition area (m²)
DBH = diameter at breast height (cm), obtained from the city's street tree inventory
a = 0.02422 for deciduous trees; 0.0205828 for coniferous trees
This relationship bridges basal area–based and crown area–based formulations in Shimano’s power–sigmoid model [58]. Given each tree's DBH from the inventory, this equation enables direct calculation of its dry deposition area, facilitating city-wide assessments of PM₂.₅ capture potential.
2.6. Quantifying Dry Deposition of PM2.5
Dry deposition for each street tree was calculated for each hour (t) by multiplying deposition velocity (Vd), the concentration of ambient air pollutants (Ct), deposition time (t), with total crown projection area as the surface area of deposition (A), using equation 5 [33,49]:
where
d = Vd ∙ Ct ∙ t ∙ A
d = Amount of PM2.5 deposited at time t (g)
Vd = Deposition velocity at time t (cm s-1)
Ct = PM2.5 concentration at time t (µg m-3)
t = deposition duration (s
A = deposited area (m2)
The total amount of PM2.5 removed by city-owned street trees as
where
D =Σ d
D = total amount of PM2.5 deposited for all street trees across the city (g)
d = total amount of PM2.5 deposited at the individual tree level (g)
3. Results
3.1. Descriptive Statistics
Our study investigated the dry deposition of PM2.5 by 200,560 city-owned street trees across 245 unique tree species. The average DBH is 17.31 cm (95% CI: [17.22, 17.39]), and the median DBH is 26.65 cm. Coniferous trees constitute 38.4 % of the total trees (77,014 trees), while deciduous trees constitute 61.6% of all city-owned tree species (123,546 trees). Acer platanoides is the most common species, representing 17.8 % of trees, followed by Gleditsia triacanthos var. inermis (8.4 %), Picea pungens (6.1 %), Malus spp (5.1 %). Syringa reticulata 'Ivory Silk' (4.1 %), Acer platanoides 'Schwedleri' (3.8 %), Acer saccharinum (3.4 %), Gleditsia triacanthos 'Skyline' (2.8 %), and Acer platanoides 'Columnare' (2.6 %). The following tree species are each represented by a single tree in the dataset: Corylus americana, Fraxinus americana 'Autumn Purple', Fraxinus quadrangulate, Euonymus alatus, Taxus canadensis, Catalpa ovata, Syringa × chinensis, Crataegus laevigata, Prunus glandulosa, Abies fraseri, Spiraea × bumalda 'Gold Flame', Laburnum anagyroides, Prunus cerasifera 'Newport', Fraxinus pennsylvanica 'Patmore', Morus rubra, Cornus sericea, Ulmus glabra, Magnolia stellata, Liquidambar styraciflua, Fraxinus americana 'Kleinburg', Ulmus glabra.
We obtained daily wind data from local weather stations throughout the study period. During this time, the minimum recorded wind speed was 0 m/s, the maximum was 13.33 m/s, and the average wind speed was 5 m/s. By integrating wind speed data with the tree inventory, this study assessed its impact on deposition velocity across various city-owned tree species.
3.2. Characteristics of Species with the Lowest Deposition
City-owned Street trees captured 27.8 tons of PM2.5 through dry deposition during the in-leaf season (May 1 to September 30) of 2019, as seen in Table 1. Coniferous trees, constituting 38.4 % of the total trees (77,014 trees), captured 25.62 tons of PM2.5, accounting for 92 % of the total PM2.5 captured by street trees. In contrast, deciduous trees, comprising 61.6 % of all city-owned tree species (123,546 trees), captured 2.18 tons of PM2.5, representing eight % of the total PM2.5 removal. The list of PM2.5 deposition by city-owned street trees is presented in Table A2.
Picea pungens was the top-performing species in PM₂.₅ reduction, intercepting 18.33 tons, accounting for 65.94% of the total dry deposition by all city-owned street trees during the study period (Table 1 and full list in Table A1). On average, each Picea pungens captured 1.79 kg of PM2.5 during the in-leaf season of 2019. Pinus nigra follows with 5,004 trees, removing 3.28 tons (11.82 % of total PM2.5 captured) through dry deposition, averaging 0.66 kg per tree. With 1,535 trees, Picea abies captured 1.48 tons (5.39 % of total PM2.5 captured) at an average rate of 0.98 kg per tree. Pinus sylvestris, totalling 1,378 trees, captured 0.60 tons (2.15% of total PM2.5 captured) with an average of 0.43 kg per tree. Picea glauca, totaling 2,322, collectively captured 0.54 tons of PM2.5, representing 1.93% of the total amount of PM2.5 captured. With 702 trees, Pinus strobus captured 0.50 tons (1.83 % of the total), averaging 0.72 kg per tree. Picea pungens, with 2,632 trees, captured 0.42 tons (1.51 % of the total) with an average of 159.70 grams per tree. Tilia cordata, totaling 12,324 trees, captured 0.34 tons (1.21 % of the total) with an average of 27.36 grams per tree. With 3,285 trees, Quercus rubra captured 0.25 tons (0.89 % of the total), averaging 75.22 grams per tree. Acer platanoides, the most numerous with 35,690 trees, captured 0.24 tons (0.85 % of the total) with an average of 6.63 grams per tree.
3.3. Species-Specific Deposition Rates
The top ten tree species noted for their PM2.5 removal capabilities include Picea pungens, Pinus nigra, Picea abies, Pinus sylvestris, Picea glauca, Pinus strobus, Picea pungens, Tilia cordata, Quercus rubra, and Acer platanoides (Figure 1, Table 1 and Table A1 for the complete list of tree species). These ten species collectively account for 93.52 % of the total PM2.5 captured through dry deposition despite constituting only 37.46 % of the city-owned street tree population. Among the top ten tree species that are most capable of mitigating PM2.5 at the species level and individual tree level, Picea pungens, Pinus nigra, Picea abies, Pinus sylvestris, Picea glauca, Pinus strobus, Picea pungens are coniferous trees capable of removing 25.18 tons or 90.56 %of the total PM2.5 removal by all city-owned street trees. Alternatively, Tilia cordata, Quercus rubra and Acer platanoides are deciduous trees capable of removing 1.26 tons or 2.95 % of the total PM2.5 removal.
The top ten tree species identified for the PM2.5 removal capabilities are characterized by high efficiency in PM2.5 mitigation and exhibit a range of notable traits (Figure 1). Coniferous species such as Picea pungens (9.944 cm/s), Pinus nigra (9.944 cm/s), and Picea abies (9.944 cm/s) demonstrated the highest deposition rates among the ten species, indicating high effectiveness in capturing PM2.5 from the atmosphere. LAI values are relatively high for the ten tree species that are most effective at removing PM2.5, ranging from 2.197 to 2.465, which enhances the species’ ability to intercept airborne pollutants. DBH measurements for tree species indicate robust growth, with Picea pungens leading with an average DBH of 32.29 cm, followed by Pinus nigra at 27.44 cm and Picea abies at 34.14 cm. The total area for PM2.5 deposition per species in this group ranges greatly, with Picea pungens leading at 90.21 cm², reflecting the species' substantial contribution to air quality improvement in urban settings. The rest of the tree species showed an average deposited area per species ranging from approximately 10.43 cm² to 45.52 cm², highlighting their effective capability in capturing and retaining PM2.5.
The species with the lowest PM2.5 reduction potential included Cornus sericea, Viburnum trilobum, Liquidambar styraciflua, Magnolia stellata, Ulmus glabra, Acer griseum, Acer rubrum ‘Karpick’, Catalpa bungei, Syringa x chinensis, and Laburnum anagyroides, which are the ten species that mitigate the least amount of PM2.5 through dry deposition (Figure 1). Despite varying in number from one to three trees per species, each contributes only a small portion of the total deposition, totaling 10.13 grams across all ten species. Cornus sericea has the highest deposition rate, averaging 1.55 grams per tree, followed by Viburnum trilobum (1.36 grams) and Liquidambar styraciflua (1.00 grams). The next seven tree species that can mitigate PM2.5 are Magnolia stellata, Ulmus glabra, Acer griseum, Acer rubrum ‘Karpick’, Catalpa ovata, Syringa x chinensis, and Laburnum anagyroides, all of which have a total PM2.5 deposited of less than one gram per species.
Trees with lower PM2.5 removal efficiency have lower PM2.5 deposition velocities (Figure 1). The ten species have lower deposition velocities (Vd), averaging around 0.97 cm/s for Cornus sericea, 0.25 cm/s for Liquidambar styraciflua, and 0.25 cm/s for Magnolia stellata, indicating reduced capability in PM2.5 capture compared to the first group, with the species most capable of removing PM2.5 through dry deposition. Ten tree species that are least capable of removing PM2.5 have LAI values ranging from 2.00 to 2.68, indicating comparatively less foliage density for pollutant interception. DBH measurements for the species are notably smaller, with averages such as approximately 0.39 cm for Cornus sericea and Magnolia stellata and 1.55 cm for Liquidambar styraciflua. The average total area for PM2.5 deposition per species in this group ranges from approximately 1.98 cm² to 2.68 cm², limiting the impact on PM2.5 reduction in urban environments
4. Discussions
4.1. Advancing Approaches to Quantify PM2.5 Deposition by City-Owned Street Trees
Our study reveals that Mississauga’s 200,560 city-owned street trees (245 species) mitigate 27.8 tons of PM₂.5 during the in-leaf season (May–September 2019). This finding indicates how PM₂.5 removal varies greatly with urban tree composition and management scope compared to prior research. For example, Nowak et al. [42] estimated annual removals of 4.7–64.5 tons across entire urban forests (all tree types) in Syracuse and Atlanta, while Selmi et al. [59] reported 0.9 tons/km²/year for Strasbourg’s urban canopy. Critically, these studies did not isolate city-owned street trees—a key distinction, as our work demonstrates their outsized role in urban PM₂.5 mitigation due to targeted placement and management.
Further, while Janhäll [50] identified leaf microstructure as a driver of deposition, such traits are rarely incorporated into city-scale models. Unlike past studies that homogenized tree function, our species-level analysis highlights how conifers (e.g., Picea pungens) dominate PM₂.5 capture due to traits like high leaf-area index and deposition velocity. Focusing on street trees—a manageable municipal asset—we provide actionable insights for optimizing urban forests to improve air quality.
In contrast to previous models that assumed homogeneity in canopy structure and leaf area (e.g., [39,60], our species-specific approach reveals dramatic variability in PM₂.5 deposition rates, with the most efficient species (Picea pungens) capturing 77 times more PM₂.5 than the least efficient (e.g., Acer platanoides; see Table 1). This variability suggests the limitations of past studies: Escobedo and Nowak [61] reported PM₂.5 removal rates of 0.2–1.0 tons/year/ha in Santiago, Chile, using generalized canopy traits, while Tallis et al. [62] applied similar simplifications for London’s urban forest. Such approaches mask critical differences; for example, our data show conifers (e.g., Picea abies; see Table 1) achieve 54 times higher deposition rates per tree than broadleaf species (e.g., Tilia; See Table 1) due to leaf-area density and surface roughness.
Critically, our model advances prior work in three ways: (1) individual-tree resolution (vs. city-scale estimates), (2) integration of species-specific traits (e.g., LAI and DBH) to reduce homogeneous canopy models (see Methods). This precision enables targeted urban forestry—e.g., prioritizing high-LAI conifers in pollution hotspots—to maximize PM₂.5 removal.
4.2. Species-Specific Contribution to PM2.5 Mitigation
Our findings align with and expand upon prior research on urban trees' role in PM₂.₅ mitigation, highlighting key variations due to climate, urban structure, and species composition. Nowak et al. (2013) estimated an average removal of 4.7-64.5 tons/year (0.13–0.32 tons/km²/year) across ten U.S. cities, whereas our study found 27.8 tons during the in-leaf season (0.10 tons/km²) in Mississauga. PM2.5 deposition by city-owned street trees during the in-leaf season (May 1 to September 30, 2019) exceeds the annual PM2.5 mitigation by canopies in Syracuse, San Francisco, Philadelphia, Minneapolis, Boston, and Baltimore, US. This difference in PM2.5 deposition between Toronto and U.S. studies listed above likely stems from Mississauga’s suburban layout, where dense roadside tree plantings target high-emission zones, unlike the fragmented canopies in Nowak’s study. Baro et al. (2016) [63] reported even lower removal (0.13 tons/km²/year) in Barcelona, reinforcing the role of urban form, as compact cities with limited roadside vegetation may constrain PM₂.₅ capture despite comparable canopy cover.
Species composition and growing season duration further explain disparities in deposition rates. Our data show that conifer-dominated areas in Mississauga achieved 0.28 tons/km²/season, compared to 0.17 tons/km²/season in deciduous species—a pattern consistent with Beckett et al. [20,21] who noted evergreens' superior PM removal but lacked landscape-scale quantification. Selmi et al. [59] reported 0.9 tons/km²/year in Strasbourg, a deciduous-dominated city, where seasonal foliage loss reduces annual efficiency. This aligns with our finding that conifers sustain higher deposition, particularly in winter when deciduous trees are leafless. These comparisons suggest the need for species-specific planning to maximize PM₂.₅ removal.
Earlier models often oversimplified species differences, leading to less precise estimates, using uniform leaf area metrics across Barcelona’s urban forest, yielding a generalized 0.13 tons/km²/year [63]. In contrast, our species-specific approach reveals stark variations: Pinus strobus mitigated 1.15 tons/km²/year (seasonally adjusted), while Acer saccharinum mitigated only 0.46 tons/km²/year—differences attributable to leaf area and canopy structure. This refinement addresses limitations in past studies [42,59] that treated urban canopies as homogeneous, offering actionable insights for tree selection and air quality planning.
4.3. Refining the Theoretical Framework for Ecosystem Services by City-Owned Street Trees
Previous frameworks, such as those used in i-Tree Eco, have often treated trees as a homogeneous group, relying on generalized parameters to estimate PM2.5 removal. For example, i-Tree Eco provided city-wide averages of PM2.5 deposition without accounting for variability in species-specific traits, such as leaf area, surface roughness, or canopy structure. While useful for broad-scale assessments, this approach limits the development of targeted strategies for optimizing PM2.5 removal through urban tree planting. Similarly, Nowak et al. [42] and Selmi et al. [59] used simplified frameworks that focused on aggregate urban forest function, overlooking the important role of species-specific differences in deposition processes.
In contrast, our study challenges these assumptions by emphasizing the importance of species-specific traits in dry deposition. We demonstrate that coniferous trees, particularly Picea pungens, are highly effective at capturing PM2.5 due to traits such as high surface roughness, year-round dense canopies, and needle-like leaves. This finding aligns with Freer-Smith et al. [22], who found that conifers’ waxy surfaces and fine structures enhance particulate capture in controlled environments. However, unlike Freer-Smith et al. [22], whose work was limited to laboratory settings, our study provides real-world, species-specific data from this extensive urban tree inventory, offering a more practical and scalable framework for urban forestry management.
Our framework also advances beyond previous models by incorporating local environmental factors, such as wind speed and pollution concentration, which considerably influence PM2.5 deposition. This contrasts with earlier studies, such as Baró et al. [63] and Escobedo et al. [61], which assumed homogeneity in canopy structure and leaf area, leading to generalized estimates. For instance, Baró et al. [63] and Nowak et al. [42] reported PM2.5 removal rates in Barcelona and U.S. cities using a simplified model that did not account for species-specific traits. While these studies provided valuable insights, their reliance on simplified parameters limited their accuracy and applicability to specific urban contexts. By integrating species-specific traits and environmental variables, our framework offers a more precise and actionable approach to quantifying PM2.5 removal.
In addition to methodological advancements and species-specific insights, our study refines theoretical frameworks for understanding how urban trees mitigate air pollution. Rather than trees from parks or natural areas in the city [64,65], our study demonstrated that city-owned street trees are an integral component of urban green infrastructure that necessitates strategic planning and management [66,67]. Research aids cities in optimizing tree placement, species selection, and maintenance to maximize the cost-effectiveness and benefits of tree planting [68,69,70]. Street trees are often unevenly distributed across neighbourhoods, with higher-income groups typically residing in areas with greater urban canopy cover [71,72]. Research in this area highlights the need to promote equitable access to tree canopy and enhance the ecosystem services provided by street trees, such as mitigating urban heat islands, managing stormwater runoff, and enhancing biodiversity [73,74,75]. These efforts are crucial for maximizing human health and well-being, particularly in densely populated urban centers.
4.4. Practical Implications Through a Data-Driven Framework for Species Selection to Maximize PM2.5 Removal
The study enhances our comprehension of street trees as natural solutions for improving urban air quality. This study's findings contribute to our analysis of PM2.5 deposition at the individual tree level and elucidate how species-specific traits influence PM2.5 capture. Picea pungens, Pinus nigra, and Picea abies exhibit an estimated deposition velocity (Vd PM2.5) of around 9.944 cm/s, indicating these species' efficient PM2.5 capture. Picea pungens and Picea abies, with substantial DBH values (32.29 cm and 34.14 cm, respectively), as seen in Figure 1, leading to substantial deposited areas per species, ranging from approximately 10.43 cm² to 90.21 cm², emphasizing that coniferous species with larger tree sizes can effectively capture and retain PM2.5 [76]. The study provides empirical data for prioritizing coniferous species and planting locations in urban areas, ensuring that resources are allocated efficiently to maximize environmental benefits [26,35]. Future research could build on this framework to investigate additional environmental pollutants and explore their interactions with dynamic urban climatic variables. Such work would refine urban forestry strategies for air quality management and enhance their applicability in diverse urban contexts [77]. Urban planners and environmental managers in global cities can make informed decisions to enhance the ecological services provided by urban forests through air pollution mitigation, public health improvement and biodiversity.
4.5. Limitations and Suggestions for Future Work
This study has several limitations that must be acknowledged. Temporally, the study focuses on the in-leaf season, which may underestimate the annual contribution of coniferous trees to PM2.5 removal. Coniferous trees retain their foliage and continue to capture PM2.5 throughout the winter in Mississauga [20,21,22,24]. This seasonal focus may not fully capture the year-round benefits of urban forests, particularly in regions with considerable winter pollution. Spatially, the study relies on PM2.5 concentration data at a 1 km resolution and Leaf Area Index (LAI) data at a 3 m resolution. This discrepancy in spatial resolution could impact the accuracy of PM2.5 dry deposition estimates, particularly in areas with high spatial heterogeneity in pollution levels [78]. The coarser resolution data may not effectively capture fine-scale variations in PM2.5 concentrations, which are influenced by localized sources such as traffic and industrial emissions.
Methodologically, the study uses DBH as a proxy for estimating the total surface area available for PM2.5 deposition. While DBH provides a standardized metric for tree size, it fails to account for species-specific traits and tree characteristics such as branch length, density, and leaf area, which directly influence the total surface area available for deposition [35]. Additionally, the study employs a taxonomic order-based approach to generalize deposition velocities (Vd) for PM2.5. Variabilities in dry deposition rates have been observed within the same plant order. For example, within the Pinales order [22,23] found that Pseudotsuga menziesii has a dry deposition rate of 2.1760 cm/s at a wind speed of 5 m/s, whereas Pinus nigra has a much higher rate of 9.9440 cm/s. Similarly, within the Fagales order, Beckett, Freer-Smith, and Taylor (2000) and Beckett, Freer-Smith reported that Quercus petraea has a dry deposition rate of 1.5233 cm/s at a wind speed of 5 m/s, compared to only 0.2233 cm/s for Alnus glutinosa. These examples demonstrate that species-specific traits such as leaf morphology, canopy structure, and stomatal conductance can greatly influence dry deposition rates, even among closely related species. This variability suggests the importance of considering species-level traits rather than broader taxonomic classifications.
Future research should expand the temporal scope to include year-round data to capture the full seasonal variation in PM2.5 removal by urban trees. Longitudinal studies could assess how PM2.5 deposition varies across seasons and climatic conditions. Additionally, higher-resolution spatial data for PM2.5 concentrations and other relevant variables would improve the precision of dry deposition estimates, particularly in areas with heterogeneous pollution levels. Incorporating species-specific traits, such as leaf morphology and canopy structure, into models could enhance the accuracy of deposition velocity estimates. Furthermore, integrating real-time environmental data, such as wind patterns and humidity, would provide a more comprehensive understanding of the factors influencing PM2.5 deposition. Finally, expanding the study scope to include all urban trees, not just city-owned street trees, would offer a more complete picture of the role of urban forests in air quality improvement.
5. Conclusions
We quantified PM2.5 deposition by city-owned tree species in Mississauga, Canada, during the in-leaf season of 2019, highlighting the important role of urban street trees in mitigating air pollution. This study's key contribution is using individual tree-based PM2.5 deposition estimates. Our findings reveal that city-owned street trees mitigated 27.8 tons of PM2.5 via dry deposition, with coniferous species contributing disproportionately to this removal despite their lower representation in the tree population. In particular, coniferous trees, which comprise only 14.37% of the total tree population, accounted for 25.63 tons (85.63% of total deposition) of PM2.5 deposition, compared to 2.18 tons by deciduous trees. Among the 245 studied species, Picea pungens accounted for the largest regional PM₂.₅ removal, contributing 18.33 tons (65.94%) of the total deposition across the study area. Pinus nigra ranked second (3.29 tons, 11.82%), followed by Picea abies (1.50 tons, 5.39%), Pinus sylvestris (0.60 tons, 2.15%), and Picea glauca (0.54 tons, 1.93%). The dominance of these conifers reflects their abundance in the urban canopy, combined with high deposition velocity, large LAI and DBH, and broad crown areas—factors that collectively enhance PM₂.₅ capture at the landscape scale.
These findings emphasized the critical role of coniferous trees in urban air quality improvement and suggested that urban forestry strategies should consider species-specific traits to optimize pollution mitigation. Future studies should explore year-round deposition rates, refine model assumptions, and evaluate the ecological and social implications of prioritizing high-deposition species in urban planning. By integrating these considerations, urban forestry can contribute more effectively to sustainable, healthier urban environments.
Author Contributions
Conceptualization, S.C. and M.A.; methodology, S.C. and M.A.; software, S.C. and M.A.; validation, S.C. and M.A.; formal analysis, S.C. and M.A; investigation, S.C. and M.A.; resources, M.A.; data curation, M.A.; writing—original draft preparation, S.C.; writing—review and editing, M.A.; visualization, S.C. and M.A.; supervision, M.A.; project administration, M.A.; funding acquisition, M.A. All authors have read and agreed to the published version of the manuscript.”
Funding
This project was funded by The Centre for Urban Environments and the Department of Geography Graduate Expansion Funds at the University of Toronto Mississauga.
Acknowledgments
We thank the city of Mississauga for providing the Tree Inventory. We also thank the Department of Energy, Environmental, and Chemical Engineering, Washington University in St. Louis, for providing the PM2.5 data.
Conflicts of Interest
The authors declare no conflicts of interest.
Abbreviations
The following abbreviations are used in this manuscript:
| PM2.5 | fine particulate matter |
Appendix A

Table A1.
Dry deposition velocity (Vd) of trees species by Freeman et al. (2004) and Bckett et al. (2002b) for (a) deciduous species and (b) coniferous species.
Table A1.
Dry deposition velocity (Vd) of trees species by Freeman et al. (2004) and Bckett et al. (2002b) for (a) deciduous species and (b) coniferous species.
| (a) Deciduous species | |||||||||||
| Wind Speed (m/s) | Q. petraea | A.glutinosa | F.excelsior | A.pseudo-platanus | E.globulus | F.nitida | A. campestre | S. intermedia | P. trichocarpa*deltoide | ||
| 1 | 0.03 | 0.04 | 0.03 | ||||||||
| 2 | |||||||||||
| 3 | 0.831 | 0.125 | 0.178 | 0.042 | 0.018 | 0.041 | 0.08 | 0.39 | 0.12 | ||
| 4 | |||||||||||
| 5 | |||||||||||
| 6 | 1.757 | 0.173 | 0.383 | 0.197 | 0.029 | 0.098 | |||||
| 7 | |||||||||||
| 8 | 0.46 | 1.82 | 1.05 | ||||||||
| 9 | 3.134 | 0.798 | 0.725 | 0.344 | 0.082 | 0.234 | |||||
| 10 | 0.57 | 2.11 | 1.18 | ||||||||
| Local Wind Speed - 5 (m/s) | 1.5233 | 0.2233 | 0.3377 | 0.1438 | 0.0325 | 0.0923 | 0.2532 | 0.9684 | 0.5242 | ||
| Taxonomy Order | Fagales | Fagales | Lamiales | Sapindales | Myrtales | Fagales | Sapindales | Rosales | Malpighiales | ||
| (b) Coniferous species | |||||||||||
| Wind Speed (m/s) | P.menziesii | C. leylandii | P.nigra var. maritima | ||||||||
| 1 | 0.08 | 0.13 | |||||||||
| 3 | 1.269 | 0.76 | 1.15 | ||||||||
| 6 | 1.604 | ||||||||||
| 8 | 8.24 | 19.24 | |||||||||
| 9 | 6.04 | ||||||||||
| 10 | 12.2 | 28.05 | |||||||||
| Local Wind Speed - 5 (m/s) | 2.176 | 4.408 | 9.944 | ||||||||
| Taxonomy Order | Pinales | Pinales | Pinales | ||||||||
Figure A1.
Ambint PM2.5 concentration during the in-leaf season of 2019 (May 1 – September 30, 2019).
Figure A1.
Ambint PM2.5 concentration during the in-leaf season of 2019 (May 1 – September 30, 2019).
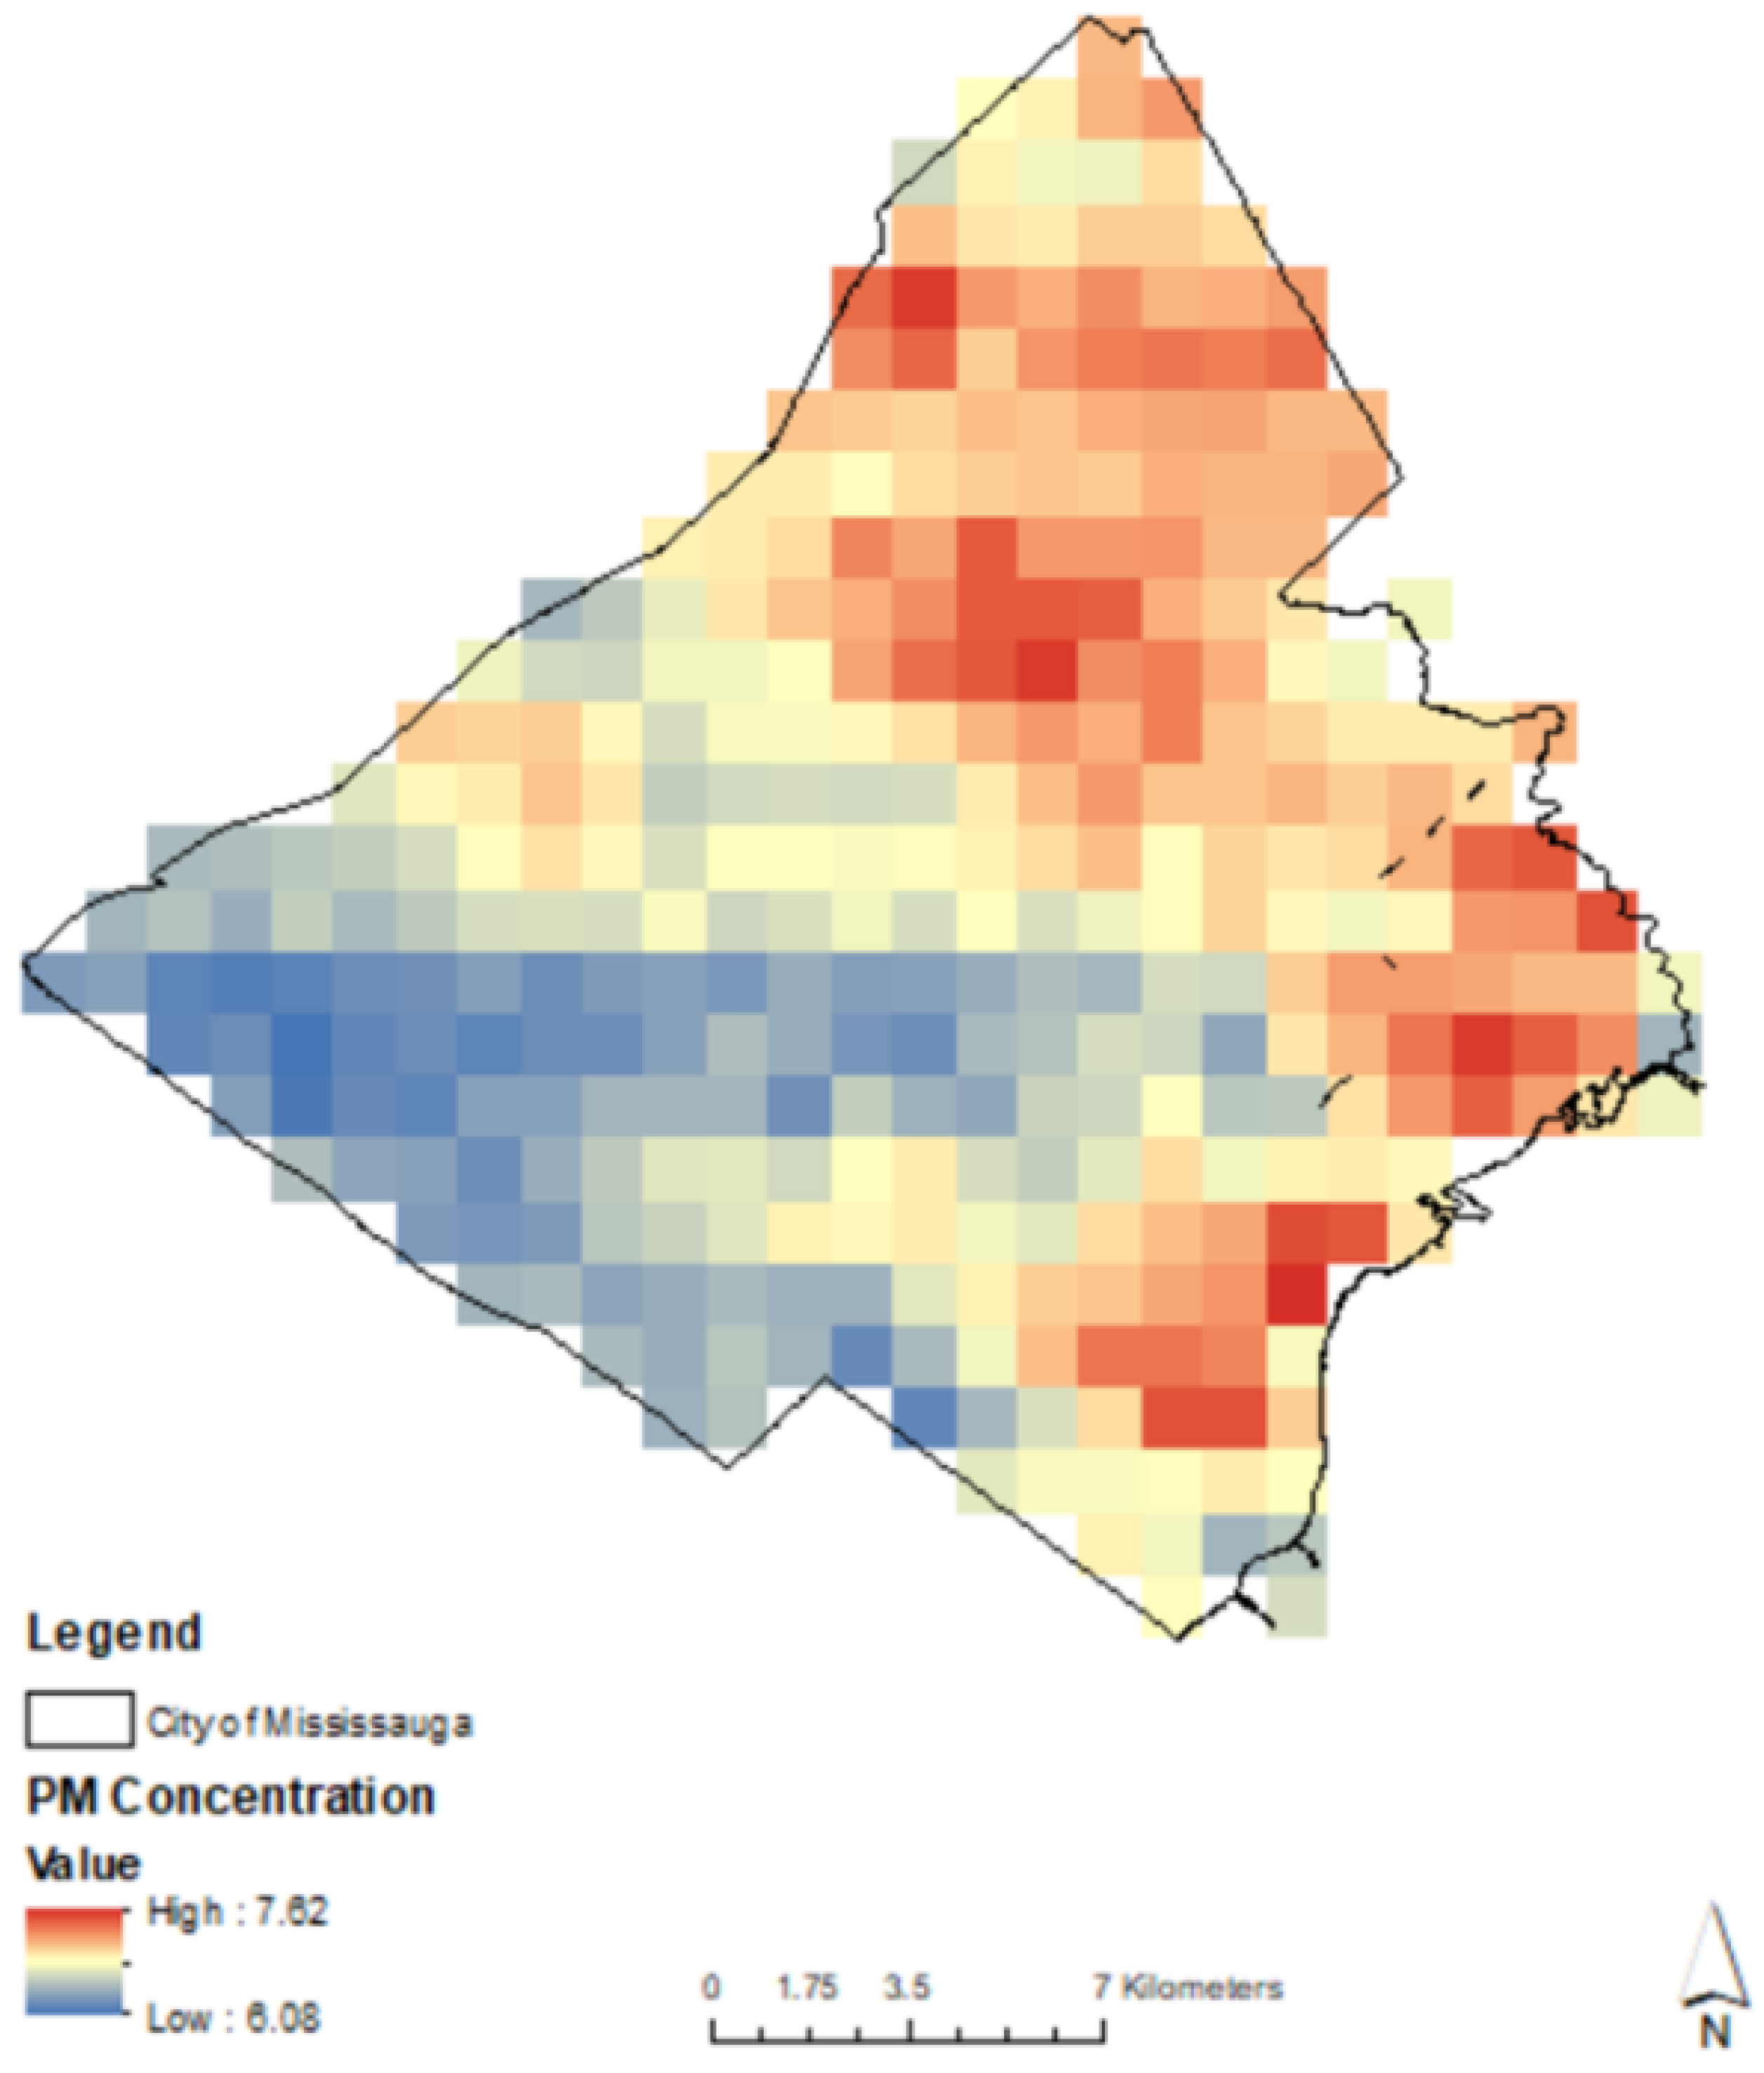
Figure A2.
Satellite estimates of NDVI and LAI with a resolution of 3 m x 3 m on July 3, 2022, for the City of Mississauga, Canada.
Figure A2.
Satellite estimates of NDVI and LAI with a resolution of 3 m x 3 m on July 3, 2022, for the City of Mississauga, Canada.
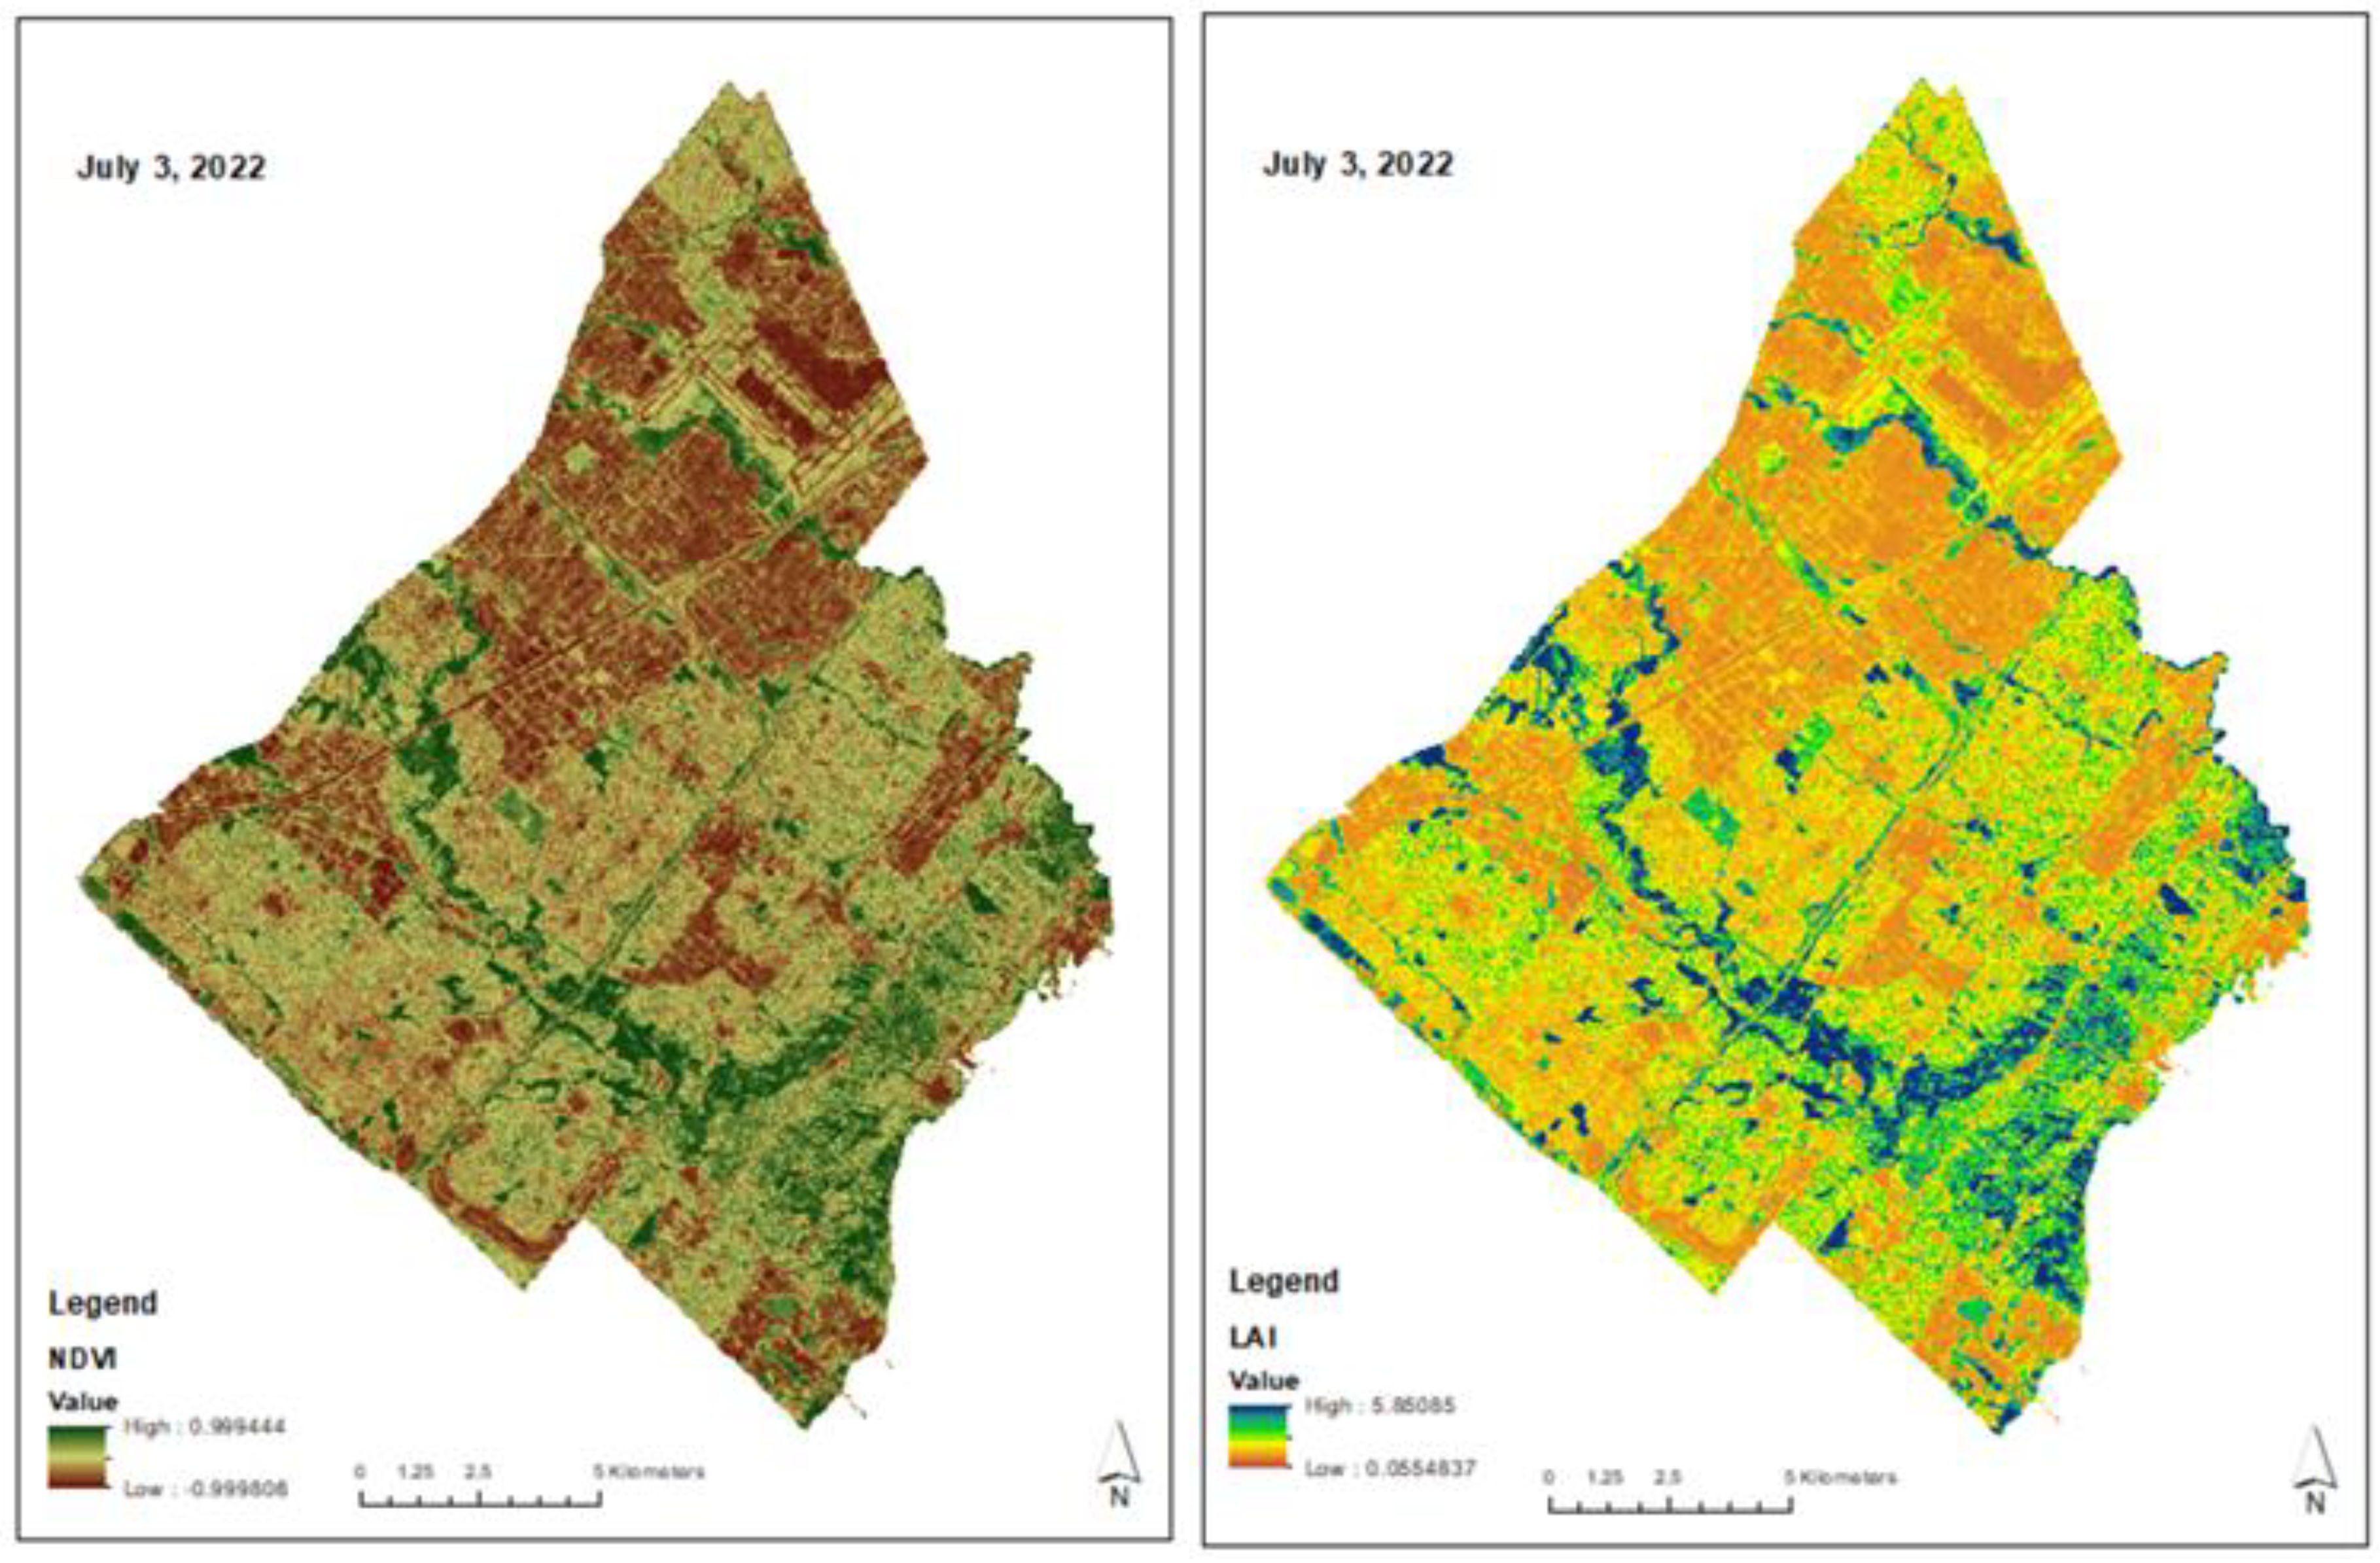
Figure A3.
Satellite estimates of NDVI and LAI with a resolution of 3m x 3m on July 14, 2019, for the City of Mississauga, Canada.
Figure A3.
Satellite estimates of NDVI and LAI with a resolution of 3m x 3m on July 14, 2019, for the City of Mississauga, Canada.
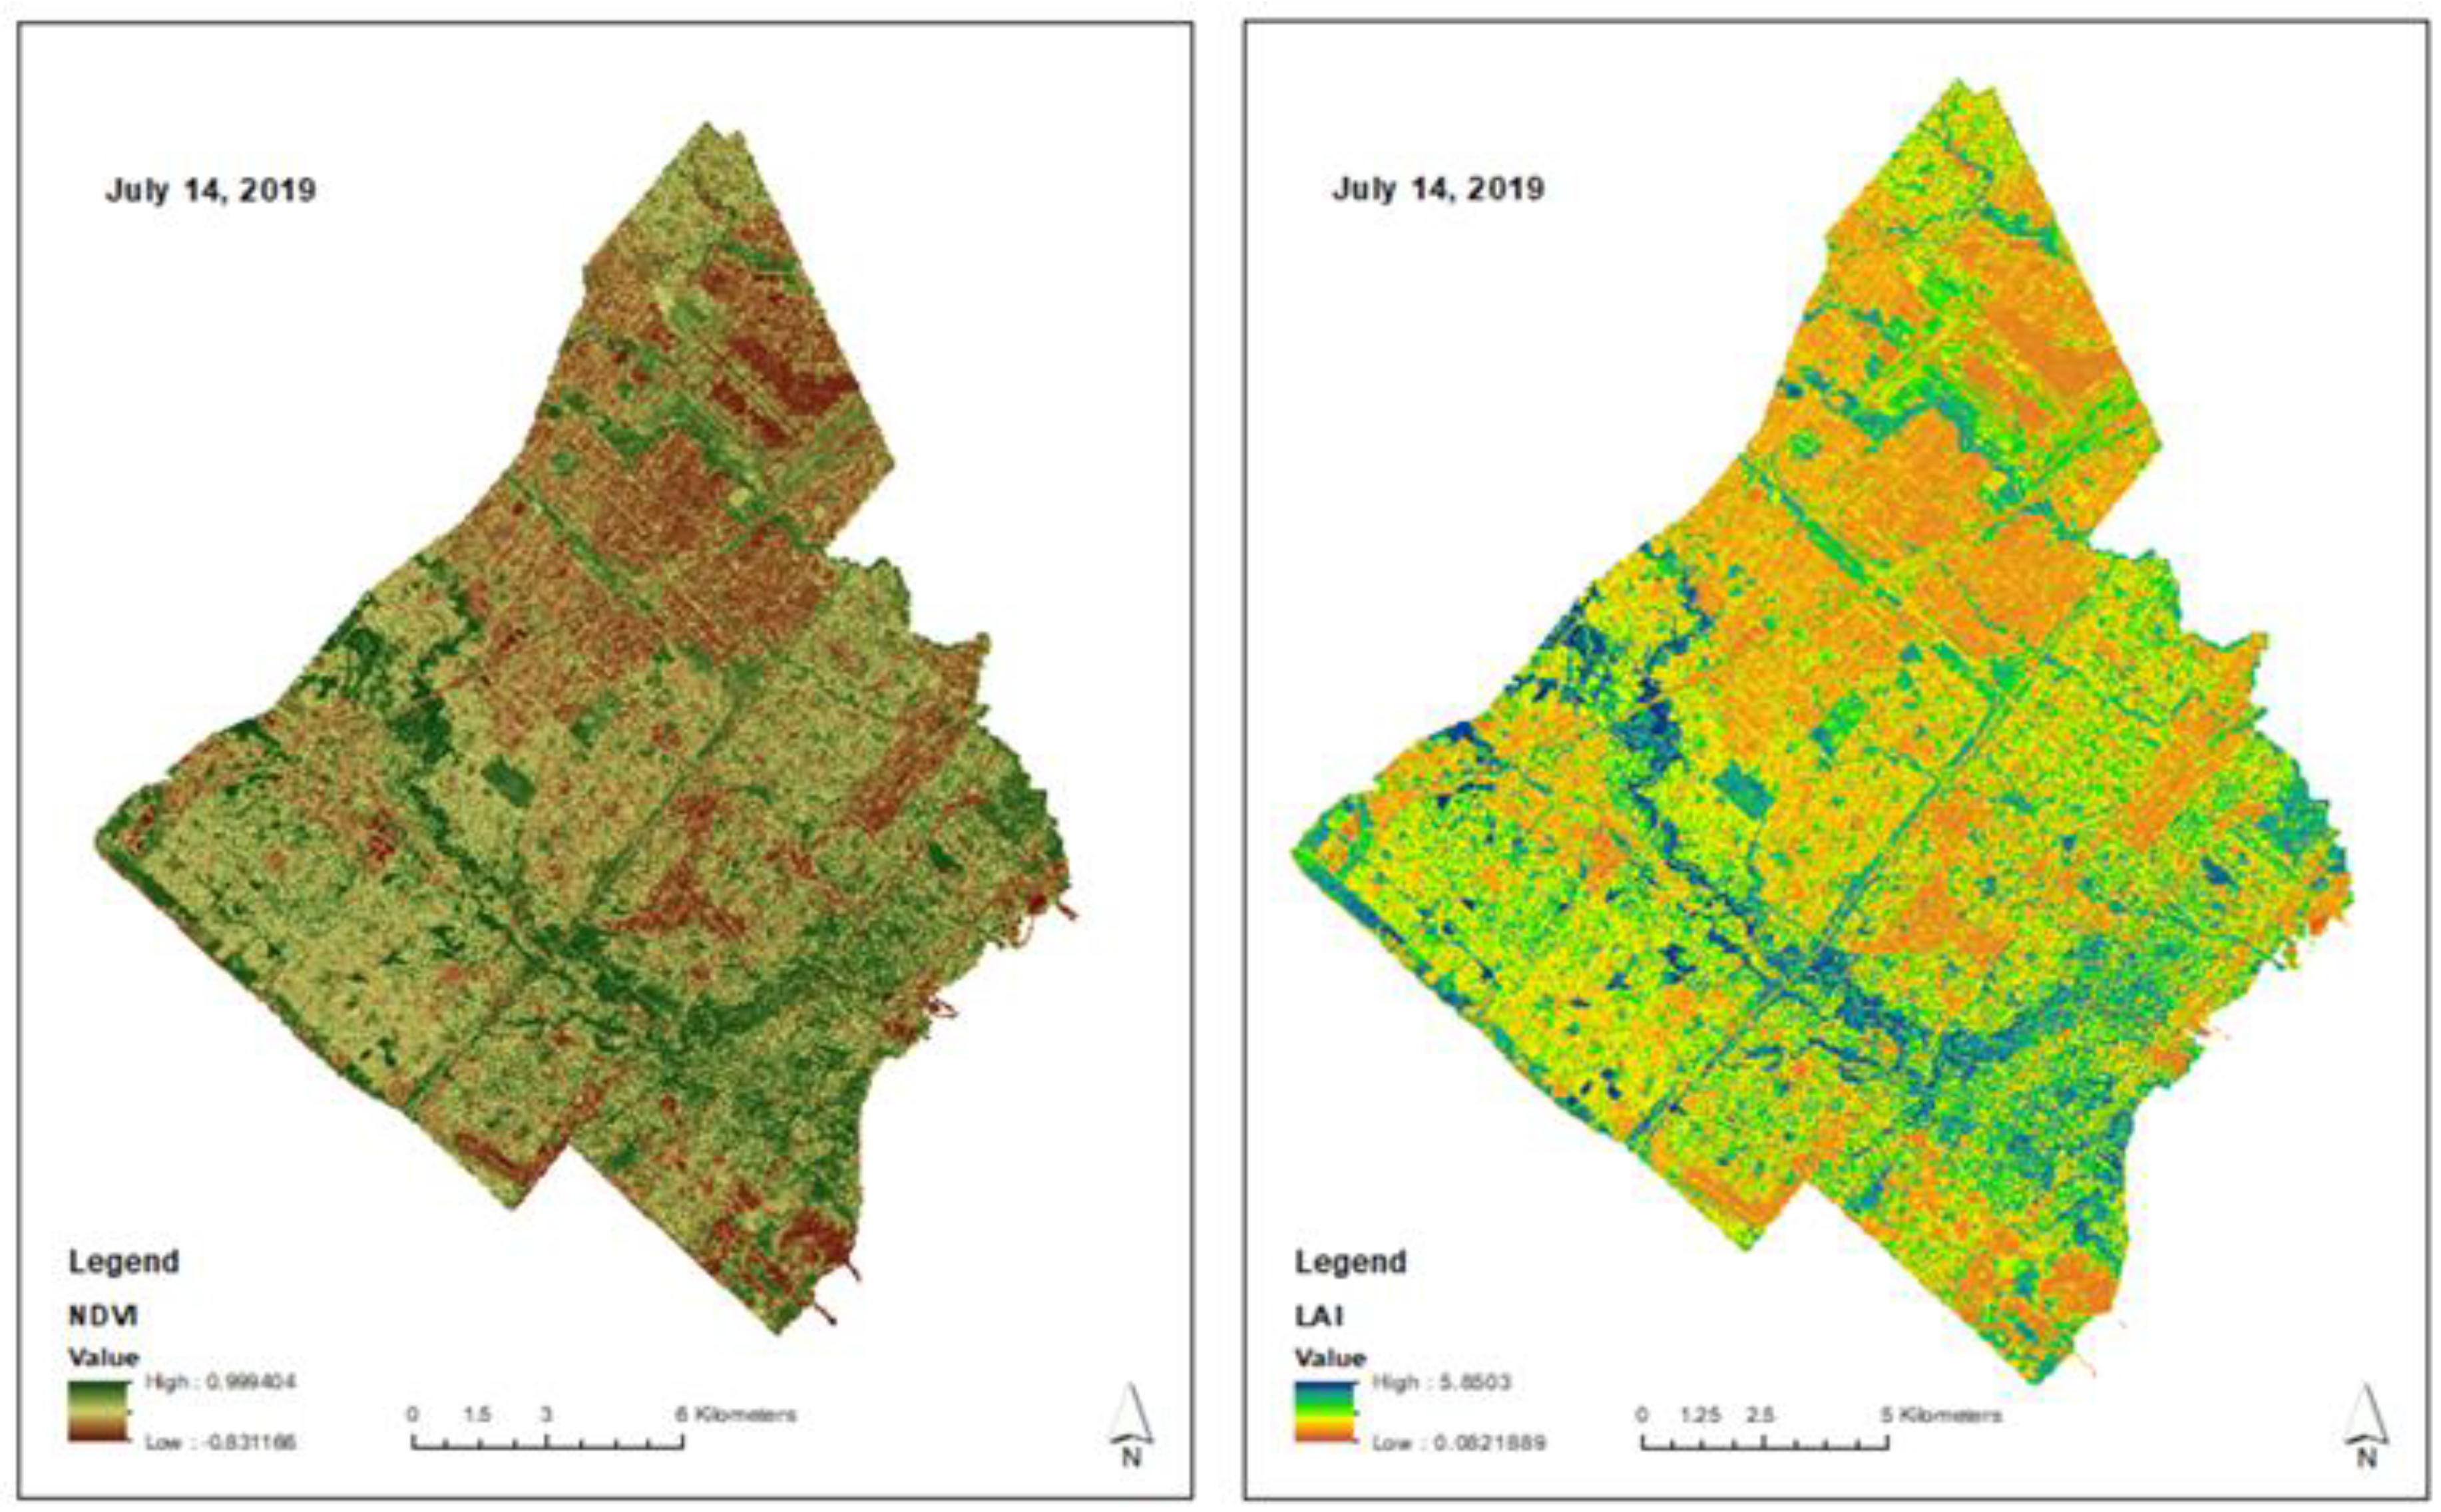
Table A2.
Dry deposition of PM2.5 by city-owned street trees in Mississauga during May 1 to September 30, 2019.
Table A2.
Dry deposition of PM2.5 by city-owned street trees in Mississauga during May 1 to September 30, 2019.
| Scientific Name | Amount of PM2.5 Deposited Per Species (g) | Percent of Total Deposition Per Species | Number of Trees Per Species | Percent of Total Trees | Amount of PM2.5 Deposition Per Tree (g) |
|---|---|---|---|---|---|
| Picea pungens | 18,329,696.25 | 65.94 | 10,248 | 5.11 | 1,788.61 |
| Pinus nigra | 3,286,017.20 | 11.82 | 5,004 | 2.5 | 656.68 |
| Picea abies | 1,498,729.79 | 5.39 | 1,535 | 0.77 | 976.37 |
| Pinus sylvestris | 598,184.67 | 2.15 | 1,389 | 0.69 | 430.66 |
| Picea glauca | 535,588.58 | 1.93 | 2,322 | 1.16 | 230.66 |
| Pinus strobus | 507,412.59 | 1.83 | 702 | 0.35 | 722.81 |
| Picea pungens | 420,318.48 | 1.51 | 2,632 | 1.31 | 159.7 |
| Tilia | 337,173.70 | 1.21 | 12,324 | 6.14 | 27.36 |
| Quercus rubra | 247,104.14 | 0.89 | 3,285 | 1.64 | 75.22 |
| Acer platanoides | 236,688.78 | 0.85 | 35,690 | 17.8 | 6.63 |
| Gleditsia triacanthos | 217,805.87 | 0.78 | 16,919 | 8.44 | 12.87 |
| Malus spp. | 162,528.17 | 0.58 | 10,194 | 5.08 | 15.94 |
| Acer saccharinum | 136,967.24 | 0.49 | 6,721 | 3.35 | 20.38 |
| Quercus alba | 96,708.94 | 0.35 | 475 | 0.24 | 203.6 |
| Thuja occidentalis | 91,621.79 | 0.33 | 2,297 | 1.15 | 39.89 |
| Quercus robur | 83,126.91 | 0.3 | 2,305 | 1.15 | 36.06 |
| Quercus macrocarpa | 52,721.08 | 0.19 | 945 | 0.47 | 55.79 |
| Pinus banksiana | 46,369.54 | 0.17 | 77 | 0.04 | 602.2 |
| Abies balsamea | 44,277.47 | 0.16 | 173 | 0.09 | 255.94 |
| Fraxinus pennsylvanica | 43,834.76 | 0.16 | 2,302 | 1.15 | 19.04 |
| Abies concolor | 38,099.93 | 0.14 | 107 | 0.05 | 356.07 |
| Acer x freemanii | 38,098.50 | 0.14 | 7,701 | 3.84 | 4.95 |
| Pinus resinosa | 32,889.82 | 0.12 | 52 | 0.03 | 632.5 |
| Ulmus pumila | 32,449.36 | 0.12 | 602 | 0.3 | 53.9 |
| Juglans nigra | 31,841.21 | 0.11 | 301 | 0.15 | 105.78 |
| Quercus palustris | 30,294.18 | 0.11 | 342 | 0.17 | 88.58 |
| Larix laricina | 26,265.33 | 0.09 | 56 | 0.03 | 469.02 |
| Picea pungens | 24,994.77 | 0.09 | 230 | 0.11 | 108.67 |
| Juniperus spp. | 23,592.92 | 0.08 | 909 | 0.45 | 25.95 |
| Acer saccharum | 23,409.34 | 0.08 | 3,140 | 1.57 | 7.46 |
| Ulmus parvifolia | 21,786.39 | 0.08 | 641 | 0.32 | 33.99 |
| Picea spp. | 21,124.67 | 0.08 | 94 | 0.05 | 224.73 |
| Prunus virginiana | 19,665.87 | 0.07 | 1,764 | 0.88 | 11.15 |
| Tsuga canadensis | 19,208.66 | 0.07 | 71 | 0.04 | 270.54 |
| Abies alba | 16,125.71 | 0.06 | 31 | 0.02 | 520.18 |
| Ulmus americana | 15,040.47 | 0.05 | 269 | 0.13 | 55.91 |
| Acer rubrum | 15,008.68 | 0.05 | 2,832 | 1.41 | 5.3 |
| Robinia pseudoacacia | 14,655.46 | 0.05 | 409 | 0.2 | 35.83 |
| Fraxinus excelsior | 14,280.96 | 0.05 | 517 | 0.26 | 27.62 |
| Tilia americana | 14,215.56 | 0.05 | 237 | 0.12 | 59.98 |
| Pyrus calleryana | 13,255.19 | 0.05 | 1,640 | 0.82 | 8.08 |
| Amelanchier spp. | 12,540.76 | 0.05 | 1,595 | 0.8 | 7.86 |
| Fraxinus americana | 12,520.53 | 0.05 | 770 | 0.38 | 16.26 |
| Cedrus spp. | 12,172.07 | 0.04 | 227 | 0.11 | 53.62 |
| Elaeagnus angustifolia | 12,142.45 | 0.04 | 1,313 | 0.65 | 9.25 |
| Pseudotsuga menziesii | 12,025.56 | 0.04 | 121 | 0.06 | 99.38 |
| Acer negundo | 10,276.75 | 0.04 | 825 | 0.41 | 12.46 |
| Acer platanoides | 9,203.41 | 0.03 | 5,109 | 2.55 | 1.8 |
| Quercus robur | 9,182.39 | 0.03 | 691 | 0.34 | 13.29 |
| Ulmus japonica | 9,111.90 | 0.03 | 2,375 | 1.18 | 3.84 |
| Syringa reticulata | 9,094.94 | 0.03 | 8,171 | 4.07 | 1.11 |
| Fraxinus spp. | 9,057.36 | 0.03 | 354 | 0.18 | 25.59 |
| Fagus grandifolia | 8,766.34 | 0.03 | 92 | 0.05 | 95.29 |
| Picea omorika | 8,474.30 | 0.03 | 91 | 0.05 | 93.12 |
| Celtis occidentalis | 8,085.00 | 0.03 | 2,052 | 1.02 | 3.94 |
| Taxus baccata | 7,982.61 | 0.03 | 201 | 0.1 | 39.71 |
| Betula papyrifera | 7,730.41 | 0.03 | 975 | 0.49 | 7.93 |
| Quercus bicolor | 7,543.18 | 0.03 | 287 | 0.14 | 26.28 |
| Catalpa speciosa | 6,725.03 | 0.02 | 285 | 0.14 | 23.6 |
| Prunus serotina | 6,500.96 | 0.02 | 114 | 0.06 | 57.03 |
| Tilia cordata | 5,856.49 | 0.02 | 2,376 | 1.18 | 2.46 |
| Carya ovata | 5,760.87 | 0.02 | 101 | 0.05 | 57.04 |
| Gleditsia triacanthos | 5,749.53 | 0.02 | 5,624 | 2.8 | 1.02 |
| Morus alba | 5,507.57 | 0.02 | 175 | 0.09 | 31.47 |
| Crataegus spp. | 5,032.34 | 0.02 | 365 | 0.18 | 13.79 |
| Morus spp. | 5,021.93 | 0.02 | 222 | 0.11 | 22.62 |
| Gleditsia triacanthos | 4,647.39 | 0.02 | 20 | 0.01 | 232.37 |
| Tilia cordata | 4,535.28 | 0.02 | 396 | 0.2 | 11.45 |
| Morus alba | 4,334.31 | 0.02 | 797 | 0.4 | 5.44 |
| Pyrus calleryana | 4,167.76 | 0.01 | 2,343 | 1.17 | 1.78 |
| Quercus velutina | 4,147.67 | 0.01 | 8 | 0 | 518.46 |
| Acer x freemanii | 4,116.27 | 0.01 | 4,101 | 2.04 | 1 |
| Juniperus virginiana | 3,836.54 | 0.01 | 56 | 0.03 | 68.51 |
| Aesculus hippocastanum | 3,535.56 | 0.01 | 499 | 0.25 | 7.09 |
| Malus domestica | 3,346.36 | 0.01 | 140 | 0.07 | 23.9 |
| Juglans cinerea | 3,340.43 | 0.01 | 20 | 0.01 | 167.02 |
| Acer campestre | 3,274.84 | 0.01 | 761 | 0.38 | 4.3 |
| Sorbus aucuparia | 3,178.79 | 0.01 | 250 | 0.12 | 12.72 |
| Ulmus spp. | 3,036.67 | 0.01 | 151 | 0.08 | 20.11 |
| Taxus cuspidata | 2,811.78 | 0.01 | 29 | 0.01 | 96.96 |
| Platanus x acerifolia | 2,766.47 | 0.01 | 718 | 0.36 | 3.85 |
| Chamaecyparis nootkatensis | 2,693.46 | 0.01 | 77 | 0.04 | 34.98 |
| Zelkova serrata | 2,679.52 | 0.01 | 167 | 0.08 | 16.05 |
| Quercus spp. | 2,500.69 | 0.01 | 61 | 0.03 | 40.99 |
| Acer rubrum | 2,442.91 | 0.01 | 2,972 | 1.48 | 0.82 |
| Prunus virginiana | 2,392.57 | 0.01 | 111 | 0.06 | 21.55 |
| Sorbus x commixta | 2,390.01 | 0.01 | 62 | 0.03 | 38.55 |
| Fagus sylvatica | 2,319.14 | 0.01 | 30 | 0.01 | 77.3 |
| Malus spp. | 2,267.17 | 0.01 | 284 | 0.14 | 7.98 |
| Prunus spp. | 2,242.82 | 0.01 | 210 | 0.1 | 10.68 |
| Fagus sylvatica | 1,891.18 | 0.01 | 21 | 0.01 | 90.06 |
| Ulmus americana | 1,881.98 | 0.01 | 45 | 0.02 | 41.82 |
| Fraxinus nigra | 1,846.73 | 0.01 | 107 | 0.05 | 17.26 |
| Tilia americana | 1,814.58 | 0.01 | 863 | 0.43 | 2.1 |
| Morus alba | 1,704.02 | 0.01 | 117 | 0.06 | 14.56 |
| Ailanthus altissima | 1,619.61 | 0.01 | 32 | 0.02 | 50.61 |
| Salix babylonica | 1,576.23 | 0.01 | 55 | 0.03 | 28.66 |
| Larix decidua | 1,565.15 | 0.01 | 8 | 0 | 195.64 |
| Acer platanoides | 1,512.53 | 0.01 | 475 | 0.24 | 3.18 |
| Malus domestica | 1,475.51 | 0.01 | 67 | 0.03 | 22.02 |
| Populus tremuloides | 1,357.07 | 0 | 135 | 0.07 | 10.05 |
| Pinus rigida | 1,201.38 | 0 | 3 | 0 | 400.46 |
| Catalpa bignonioides | 1,175.48 | 0 | 219 | 0.11 | 5.37 |
| Acer platanoides | 1,128.10 | 0 | 162 | 0.08 | 6.96 |
| Gymnocladus dioicus | 1,086.12 | 0 | 971 | 0.48 | 1.12 |
| Picea spp. | 1,082.34 | 0 | 16 | 0.01 | 67.65 |
| Juglans spp. | 1,070.46 | 0 | 21 | 0.01 | 50.97 |
| Pinus spp. | 1,070.43 | 0 | 8 | 0 | 133.8 |
| Prunus spp. | 885.09 | 0 | 52 | 0.03 | 17.02 |
| Acer ginnala | 861.38 | 0 | 484 | 0.24 | 1.78 |
| Populus deltoides | 859.63 | 0 | 26 | 0.01 | 33.06 |
| Carya cordiformis | 776.45 | 0 | 15 | 0.01 | 51.76 |
| Gleditsia triacanthos | 770.51 | 0 | 274 | 0.14 | 2.81 |
| Populus spp. | 767.95 | 0 | 83 | 0.04 | 9.25 |
| Acer platanoides | 706.59 | 0 | 1,234 | 0.62 | 0.57 |
| Cladrastis kentukea | 674.07 | 0 | 2 | 0 | 337.03 |
| Malus x hybrida | 673.1 | 0 | 389 | 0.19 | 1.73 |
| Magnolia x soulangeana | 646.3 | 0 | 126 | 0.06 | 5.13 |
| Ulmus thomasii | 634.21 | 0 | 20 | 0.01 | 31.71 |
| Metasequoia glyptostroboides | 594.51 | 0 | 8 | 0 | 74.31 |
| Robinia pseudoacacia | 585.75 | 0 | 46 | 0.02 | 12.73 |
| Juglans regia | 566.86 | 0 | 23 | 0.01 | 24.65 |
| Pinus mugo | 557.18 | 0 | 27 | 0.01 | 20.64 |
| Phellodendron amurense | 548.89 | 0 | 17 | 0.01 | 32.29 |
| Acer rubrum | 531.56 | 0 | 878 | 0.44 | 0.61 |
| Quercus montana | 521.97 | 0 | 49 | 0.02 | 10.65 |
| Prunus pensylvanica | 512.14 | 0 | 47 | 0.02 | 10.9 |
| Chamaecyparis obtusa | 511.66 | 0 | 22 | 0.01 | 23.26 |
| Populus x canadensis | 437.66 | 0 | 2 | 0 | 218.83 |
| Liriodendron tulipifera | 427.33 | 0 | 211 | 0.11 | 2.03 |
| Crataegus viridis | 424.53 | 0 | 69 | 0.03 | 6.15 |
| Acer platanoides | 414.51 | 0 | 298 | 0.15 | 1.39 |
| Fagus sylvatica | 400.92 | 0 | 8 | 0 | 50.12 |
| Malus x hybrida | 392.28 | 0 | 199 | 0.1 | 1.97 |
| Gleditsia triacanthos | 370.48 | 0 | 84 | 0.04 | 4.41 |
| Quercus robur | 367.1 | 0 | 34 | 0.02 | 10.8 |
| Ginkgo biloba | 332.02 | 0 | 789 | 0.39 | 0.42 |
| Ginkgo biloba | 326.05 | 0 | 208 | 0.1 | 1.57 |
| Sassafras albidum | 324.03 | 0 | 13 | 0.01 | 24.93 |
| Taxus canadensis | 315.52 | 0 | 1 | 0 | 315.52 |
| Sorbus americana | 313.25 | 0 | 30 | 0.01 | 10.44 |
| Syringa vulgaris | 300.88 | 0 | 305 | 0.15 | 0.99 |
| Populus grandidentata | 275.93 | 0 | 15 | 0.01 | 18.4 |
| Salix alba | 273.09 | 0 | 20 | 0.01 | 13.65 |
| Ulmus x vegeta | 254.05 | 0 | 133 | 0.07 | 1.91 |
| Aesculus carnea | 249.07 | 0 | 76 | 0.04 | 3.28 |
| Acer x freemanii | 233.96 | 0 | 223 | 0.11 | 1.05 |
| Betula alleghaniensis | 210.44 | 0 | 11 | 0.01 | 19.13 |
| Salix nigra | 210.37 | 0 | 12 | 0.01 | 17.53 |
| Fraxinus pensylvanica | 205.19 | 0 | 12 | 0.01 | 17.1 |
| Ulmus procera | 202.23 | 0 | 7 | 0 | 28.89 |
| Platanus x acerifolia | 183.92 | 0 | 9 | 0 | 20.44 |
| Rhus typhina | 178.03 | 0 | 200 | 0.1 | 0.89 |
| Acer x freemanii | 170.95 | 0 | 72 | 0.04 | 2.37 |
| Salix spp. | 165.31 | 0 | 46 | 0.02 | 3.59 |
| Populus alba | 153.13 | 0 | 8 | 0 | 19.14 |
| Carpinus caroliniana | 143.01 | 0 | 27 | 0.01 | 5.3 |
| Fagus sylvatica | 140.8 | 0 | 8 | 0 | 17.6 |
| Ulmus americana | 135.53 | 0 | 35 | 0.02 | 3.87 |
| Populus nigra | 124.86 | 0 | 8 | 0 | 15.61 |
| Acer spp. | 111.82 | 0 | 65 | 0.03 | 1.72 |
| Aesculus glabra | 103.01 | 0 | 167 | 0.08 | 0.62 |
| Fagus grandifolia | 102.82 | 0 | 33 | 0.02 | 3.12 |
| Acer rubrum | 99.45 | 0 | 26 | 0.01 | 3.83 |
| Tilia americana | 98.39 | 0 | 63 | 0.03 | 1.56 |
| Carpinus betulus | 92.99 | 0 | 107 | 0.05 | 0.87 |
| Fraxinus americana | 92.4 | 0 | 49 | 0.02 | 1.89 |
| Acer rubrum | 91.2 | 0 | 212 | 0.11 | 0.43 |
| Prunus cerasifera | 89.06 | 0 | 18 | 0.01 | 4.95 |
| Acer tataricum | 88.68 | 0 | 131 | 0.07 | 0.68 |
| Pyrus calleryana | 87.83 | 0 | 4 | 0 | 21.96 |
| Acer rubrum | 87.57 | 0 | 211 | 0.11 | 0.42 |
| Betula pendula | 82.9 | 0 | 23 | 0.01 | 3.6 |
| Salix fragilis | 80.83 | 0 | 5 | 0 | 16.17 |
| Ulmus scabra | 80.77 | 0 | 1 | 0 | 80.77 |
| Corylus colurna | 72.29 | 0 | 37 | 0.02 | 1.95 |
| Salix alba | 71.45 | 0 | 10 | 0 | 7.15 |
| Alnus glutinosa | 70.07 | 0 | 25 | 0.01 | 2.8 |
| Syringa vulgaris | 67.35 | 0 | 119 | 0.06 | 0.57 |
| Castanea dentata | 66.79 | 0 | 4 | 0 | 16.7 |
| Abies fraseri | 63.02 | 0 | 1 | 0 | 63.02 |
| Ulmus americana | 60.19 | 0 | 38 | 0.02 | 1.58 |
| Carpinus caroliniana | 59.03 | 0 | 12 | 0.01 | 4.92 |
| Acer palmatum | 57.1 | 0 | 65 | 0.03 | 0.88 |
| Salix matsudana | 56.51 | 0 | 14 | 0.01 | 4.04 |
| Ulmus americana | 53.87 | 0 | 42 | 0.02 | 1.28 |
| Acer pseudoplatanus | 53.05 | 0 | 24 | 0.01 | 2.21 |
| Zelkova serrata | 50.39 | 0 | 29 | 0.01 | 1.74 |
| Acer nigrum | 48.62 | 0 | 8 | 0 | 6.08 |
| Tilia americana | 43.12 | 0 | 29 | 0.01 | 1.49 |
| Cornus florida | 42.53 | 0 | 10 | 0 | 4.25 |
| Phellodendron amurense | 39.46 | 0 | 53 | 0.03 | 0.74 |
| Cercidiphyllum japonicum | 38.72 | 0 | 11 | 0.01 | 3.52 |
| Prunus serrulata | 32.48 | 0 | 11 | 0.01 | 2.95 |
| Acer saccharum | 32.29 | 0 | 26 | 0.01 | 1.24 |
| Fraxinus americana | 27.9 | 0 | 1 | 0 | 27.9 |
| Betula nigra | 26.51 | 0 | 9 | 0 | 2.95 |
| Salix discolor | 26.13 | 0 | 13 | 0.01 | 2.01 |
| Crataegus laevigata | 24.76 | 0 | 2 | 0 | 12.38 |
| Prunus glandulosa | 23.15 | 0 | 1 | 0 | 23.15 |
| Styphnolobium japonicum | 22.99 | 0 | 6 | 0 | 3.83 |
| Betula pendula | 22.47 | 0 | 6 | 0 | 3.75 |
| Cercis canadensis | 20.91 | 0 | 11 | 0.01 | 1.9 |
| Cotinus coggygria | 20.16 | 0 | 27 | 0.01 | 0.75 |
| Quercus imbricaria | 17.82 | 0 | 9 | 0 | 1.98 |
| Syringa patula | 17.14 | 0 | 38 | 0.02 | 0.45 |
| Quercus palustris | 16.73 | 0 | 5 | 0 | 3.35 |
| Fagus sylvatica | 15.1 | 0 | 6 | 0 | 2.52 |
| Syringa meyeri | 13.71 | 0 | 24 | 0.01 | 0.57 |
| Fraxinus americana | 12.68 | 0 | 6 | 0 | 2.11 |
| Morus rubra | 11.63 | 0 | 1 | 0 | 11.63 |
| Prunus pumila | 9.89 | 0 | 5 | 0 | 1.98 |
| Fagus sylvatica | 8.78 | 0 | 4 | 0 | 2.2 |
| Populus balsamifera | 8.18 | 0 | 6 | 0 | 1.36 |
| Corylus americana | 7.84 | 0 | 1 | 0 | 7.84 |
| Spiraea japonica | 7.73 | 0 | 1 | 0 | 7.73 |
| Cornus racemosa | 7.61 | 0 | 2 | 0 | 3.81 |
| Acer platanoides | 7.48 | 0 | 19 | 0.01 | 0.39 |
| Crataegus monogyna | 6.44 | 0 | 1 | 0 | 6.44 |
| Acer saccharinum | 6.19 | 0 | 11 | 0.01 | 0.56 |
| Syringa vulgaris | 6.15 | 0 | 16 | 0.01 | 0.38 |
| Caragana arborescens | 6.08 | 0 | 2 | 0 | 3.04 |
| Syringa vulgaris | 5.68 | 0 | 11 | 0.01 | 0.52 |
| Acer platanoides | 5.57 | 0 | 12 | 0.01 | 0.46 |
| Fraxinus quadrangulata | 5.07 | 0 | 1 | 0 | 5.07 |
| Fraxinus americana | 5.07 | 0 | 1 | 0 | 5.07 |
| Fraxinus americana | 4.3 | 0 | 1 | 0 | 4.3 |
| Platanus x acerifolia | 4.07 | 0 | 9 | 0 | 0.45 |
| Malus x hybrida | 3.45 | 0 | 2 | 0 | 1.72 |
| Acer x freemanii | 3.04 | 0 | 6 | 0 | 0.51 |
| Ulmus americana | 2.82 | 0 | 2 | 0 | 1.41 |
| Fagus sylvatica | 2.56 | 0 | 2 | 0 | 1.28 |
| Syringa reticulata | 2.45 | 0 | 3 | 0 | 0.82 |
| Prunus cerasifera | 2 | 0 | 1 | 0 | 2 |
| Euonymus alatus | 1.93 | 0 | 1 | 0 | 1.93 |
| Cornus sericea | 1.55 | 0 | 1 | 0 | 1.55 |
| Viburnum trilobum | 1.36 | 0 | 3 | 0 | 0.45 |
| Liquidambar styraciflua | 1 | 0 | 1 | 0 | 1 |
| Magnolia stellata | 0.9 | 0 | 1 | 0 | 0.9 |
| Ulmus glabra | 0.88 | 0 | 1 | 0 | 0.88 |
| Acer griseum | 0.87 | 0 | 2 | 0 | 0.44 |
| Acer x freemanii | 0.86 | 0 | 2 | 0 | 0.43 |
| Catalpa bignonioides | 0.7 | 0 | 1 | 0 | 0.7 |
| Syringa chinensis | 0.49 | 0 | 1 | 0 | 0.49 |
| Laburnum anagyroides | 0.31 | 0 | 1 | 0 | 0.31 |
Table A3.
Species matching for city-owned street trees.
| City-Owned Tree Species | Matched Species | Approach for Matching (Order Match or Leaf Shape Match) |
|---|---|---|
| Ulmus 'Accolade' | Sorbus intermedia | Shape Match |
| Fagus grandifolia | Quercus petraea | Order Match |
| Castanea dentata | Quercus petraea | Order Match |
| Ulmus americana | Sorbus intermedia | Shape Match |
| Corylus americana | Alnus glutinosa | Order Match |
| Carpinus caroliniana | Alnus glutinosa | Order Match |
| Sorbus americana | Sorbus intermedia | Order Match |
| Phellodendron amurense | Acer campestre | Order Match |
| Acer ginnala | Acer campestre | Order Match |
| Malus domestica | Sorbus intermedia | Order Match |
| Malus spp. | Sorbus intermedia | Order Match |
| Acer rubrum 'Armstrong' | Acer campestre | Order Match |
| Fraxinus spp. | Sorbus intermedia | Shape Match |
| Pinus nigra | Pinus nigra | Order Match |
| Acer × freemanii | Acer campestre | Order Match |
| Fraxinus americana 'Autumn Purple' | Fraxinus excelsior L. | Order Match |
| Abies balsamea | Pinus nigra | Order Match |
| Populus balsamifera | Alnus glutinosa | Shape Match |
| Tilia americana | Sorbus intermedia | Shape Match |
| Carya cordiformis | Quercus petraea | Order Match |
| Fraxinus nigra | Acer campestre | Leaf Shape |
| Prunus serotina | Sorbus intermedia | Order Match |
| Robinia pseudoacacia | Populus trichocarpa × deltoides | Order Match |
| Robinia pseudoacacia 'Purple Robe' | Populus trichocarpa × deltoides | Order Match |
| Acer nigrum | Acer campestre | Order Match |
| Quercus velutina | Quercus petraea | Order Match |
| Juglans nigra | Quercus petraea | Order Match |
| Salix nigra | Populus trichocarpa × deltoides | Order Match |
| Platanus × acerifolia 'Bloodgood' | Acer campestre | Order Match |
| Fraxinus quadrangulata | Fraxinus excelsior L. | Order Match |
| Pyrus calleryana 'Bradford' | Sorbus intermedia | Shape Match |
| Rhamnus cathartica | Sorbus intermedia | Shape Match |
| Quercus macrocarpa | Quercus petraea | Order Match |
| Euonymus alatus | Populus trichocarpa × deltoides | Shape Match |
| Juglans cinerea | Quercus petraea | Order Match |
| Taxus canadensis | Pinus nigra | Order Match |
| Populus × canadensis | Sorbus intermedia | Shape Match |
| Pyrus calleryana 'Chanticleer' | Sorbus intermedia | Shape Match |
| Prunus avium | Sorbus intermedia | Shape Match |
| Quercus montana | Quercus petraea | Order Match |
| Catalpa ovata | Fraxinus excelsior L. | Shape Match |
| Ulmus parvifolia | Sorbus intermedia | Shape Match |
| Syringa × chinensis | Fraxinus excelsior L. | Shape Match |
| Prunus virginiana | Sorbus intermedia | Shape Match |
| Acer platanoides 'Cleveland' | Acer campestre | Order Match |
| Picea pungens | Pinus nigra | Order Match |
| Acer platanoides 'Columnare' | Acer campestre | Order Match |
| Acer platanoides 'Columnare' | Acer campestre | Order Match |
| Acer platanoides 'Columnare' | Acer campestre | Order Match |
| Malus domestica | Sorbus intermedia | Shape Match |
| Syringa vulgaris | Fraxinus excelsior L. | Shape Match |
| Salix alba | Populus trichocarpa × deltoides | Shape Match |
| Taxus baccata | Pinus nigra | Order Match |
| Zelkova serrata | Sorbus intermedia | Shape Match |
| Fagus sylvatica 'Purpurea' | Quercus petraea | Order Match |
| Phellodendron amurense | Quercus petraea | Order Match |
| Salix matsudana 'Tortuosa' | Populus trichocarpa × deltoides | Shape Match |
| Populus deltoides | Sorbus intermedia | Shape Match |
| Salix × fragilis | Populus trichocarpa × deltoides | Shape Match |
| Acer platanoides 'Crimson King' | Acer campestre | Order Match |
| Acer platanoides 'Deborah' | Acer campestre | Order Match |
| Pseudotsuga menziesii | Pseudotsuga menziesii | Order Match |
| Picea glauca 'Conica' | Pinus nigra | Order Match |
| Tsuga canadensis | Pinus nigra | Order Match |
| Juniperus virginiana | Cupressus × leylandii | Shape Match |
| Thuja occidentalis | Cupressus × leylandii | Shape Match |
| Ulmus 'Morton Stalwart' | Sorbus intermedia | Shape Match |
| Ulmus 'Prospector' | Sorbus intermedia | Shape Match |
| Ulmus spp. | Sorbus intermedia | Shape Match |
| Acer platanoides 'Emerald Queen' | Acer campestre | Order Match |
| Fraxinus americana 'Empire' | Fraxinus excelsior L. | Shape Match |
| Ulmus procera | Sorbus intermedia | Shape Match |
| Crataegus laevigata | Sorbus intermedia | Shape Match |
| Quercus robur | Quercus petraea | Order Match |
| Quercus robur 'Columnar' | Quercus petraea | Order Match |
| Quercus robur 'Fastigiata' | Quercus petraea | Order Match |
| Juglans regia | Quercus petraea | Order Match |
| Alnus glutinosa | Alnus glutinosa | Order Match |
| Fraxinus excelsior | Fraxinus excelsior L. | Order Match |
| Fagus sylvatica | Quercus petraea | Order Match |
| Betula pendula | Alnus glutinosa | Order Match |
| Carpinus betulus | Quercus petraea | Order Match |
| Larix decidua | Pinus nigra | Order Match |
| Sorbus aucuparia | Sorbus intermedia | Shape Match |
| Chamaecyparis spp. | Cupressus × leylandii | Shape Match |
| Carpinus betulus 'Fastigiata' | Alnus glutinosa | Order Match |
| Prunus triloba | Sorbus intermedia | Shape Match |
| Prunus serrulata | Sorbus intermedia | Shape Match |
| Malus spp. | Sorbus intermedia | Shape Match |
| Cornus florida | Sorbus intermedia | Shape Match |
| Abies fraseri | Pinus nigra | Order Match |
| Acer × freemanii 'Marmo' | Acer campestre | Order Match |
| Ginkgo biloba | Acer campestre | Order Match |
| Ginkgo biloba | Acer campestre | Order Match |
| Syringa vulgaris 'Glenleven' | Fraxinus excelsior L. | Shape Match |
| Tilia × flavescens 'Glenleven' | Sorbus intermedia | Shape Match |
| Acer platanoides 'Globosum' | Acer campestre | Order Match |
| Spiraea × bumalda 'Goldflame' | Sorbus intermedia | Shape Match |
| Fraxinus pennsylvanica | Fraxinus excelsior L. | Order Match |
| Zelkova serrata 'Green Vase' | Sorbus intermedia | Shape Match |
| Tilia cordata 'Greenspire' | Sorbus intermedia | Shape Match |
| Cornus racemosa | Populus trichocarpa × deltoides | Shape Match |
| Acer platanoides 'Drummondii' | Acer campestre | Order Match |
| Crataegus spp. | Sorbus intermedia | Shape Match |
| Acer campestre | Acer campestre | Order Match |
| Viburnum opulus | Acer campestre | Order Match |
| Ulmus 'Homestead' | Sorbus intermedia | Shape Match |
| Gleditsia triacanthos | Populus trichocarpa × deltoides | Shape Match |
| Aesculus hippocastanum | Acer campestre | Order Match |
| Ostrya virginiana | Alnus glutinosa | Order Match |
| Syringa reticulata 'Ivory Silk' | Acer campestre | Order Match |
| Pinus banksiana | Pinus nigra | Order Match |
| Syringa × prestoniae 'James McFarlane' | Fraxinus excelsior L. | Shape Match |
| Cercidiphyllum japonicum | Alnus glutinosa | Order Match |
| Acer palmatum | Acer campestre | Order Match |
| Taxus cuspidata | Pinus nigra | Order Match |
| Juniperus spp. | Cupressus × leylandii | Shape Match |
| Acer platanoides 'Karpick' | Acer campestre | Order Match |
| Gymnocladus dioicus | Populus trichocarpa × deltoides | Shape Match |
| Syringa meyeri | Fraxinus excelsior L. | Shape Match |
| Prunus serrulata 'Kanzan' | Sorbus intermedia | Shape Match |
| Laburnum anagyroides | Fraxinus excelsior L. | Shape Match |
| Populus grandidentata | Alnus glutinosa | Order Match |
| Acer × freemanii 'Legacy' | Acer campestre | Order Match |
| Tilia spp. | Sorbus intermedia | Shape Match |
| Tilia cordata | Sorbus intermedia | Shape Match |
| Populus nigra 'Italica' | Alnus glutinosa | Order Match |
| Platanus × acerifolia | Acer campestre | Order Match |
| Acer negundo | Acer campestre | Order Match |
| Fraxinus americana 'Manitou' | Fraxinus excelsior L. | Order Match |
| Acer spp. | Acer campestre | Order Match |
| Metasequoia glyptostroboides | Cupressus × leylandii | Shape Match |
| Syringa 'Minuet' | Fraxinus excelsior L. | Shape Match |
| Cedrus spp. | Pinus nigra | Order Match |
| Pinus spp. | Pinus nigra | Order Match |
| Populus spp. | Alnus glutinosa | Order Match |
| Juglans spp. | Quercus petraea | Order Match |
| Salix spp. | Populus trichocarpa × deltoides | Shape Match |
| Syringa pubescens subsp. patula 'Miss Kim' | Fraxinus excelsior L. | Shape Match |
| Catalpa bignonioides 'Nana' | Fraxinus excelsior L. | Shape Match |
| Morus alba 'Pendula' | Sorbus intermedia | Shape Match |
| Pinus mugo | Pinus nigra | Order Match |
| Morus spp. | Sorbus intermedia | Shape Match |
| Carpinus caroliniana | Alnus glutinosa | Order Match |
| Celtis occidentalis | Sorbus intermedia | Shape Match |
| Prunus cerasifera 'Newport' | Sorbus intermedia | Shape Match |
| Catalpa speciosa | Fraxinus excelsior L. | Order Match |
| Acer platanoides | Acer campestre | Order Match |
| Acer platanoides 'Schwedleri' | Acer campestre | Order Match |
| Picea abies | Pinus nigra | Order Match |
| Acer truncatum × platanoides 'Norwegian Sunset' | Acer campestre | Order Match |
| Quercus spp. | Quercus petraea | Order Match |
| Sorbus hybrida | Sorbus intermedia | Shape Match |
| Aesculus glabra | Acer campestre | Order Match |
| Pyrus calleryana | Sorbus intermedia | Shape Match |
| Acer griseum | Acer campestre | Order Match |
| Acer platanoides 'Park Royal' | Order Match | |
| Fraxinus pennsylvanica 'Patmore' | Fraxinus excelsior L. | Shape Match |
| Crataegus laevigata 'Paul's Scarlet' | Sorbus intermedia | Shape Match |
| Caragana arborescens | Populus trichocarpa × deltoides | Shape Match |
| Prunus pensylvanica | Sorbus intermedia | Shape Match |
| Quercus palustris | Quercus petraea | Order Match |
| Ulmus 'Pioneer' | Sorbus intermedia | Shape Match |
| Pinus rigida | Pinus nigra | Order Match |
| Malus 'Profusion' | Sorbus intermedia | Shape Match |
| Fagus sylvatica 'Purpurea' | Quercus petraea | Order Match |
| Prunus cerasifera 'Nigra' | Sorbus intermedia | Shape Match |
| Prunus × cistena | Sorbus intermedia | Shape Match |
| Salix discolor | Populus trichocarpa × deltoides | Shape Match |
| Fagus sylvatica 'Fastigiata' | Quercus petraea | Order Match |
| Fraxinus pennsylvanica | Fraxinus excelsior L. | Order Match |
| Cercis canadensis | Alnus glutinosa | Order Match |
| Acer rubrum | Acer campestre | Order Match |
| Morus rubra | Sorbus intermedia | Shape Match |
| Acer platanoides 'Reitenbachii' | Acer campestre | Order Match |
| Quercus rubra | Quercus petraea | Order Match |
| Cornus sericea | Sorbus intermedia | Shape Match |
| Pinus resinosa | Pinus nigra | Order Match |
| Malus 'Red Splendor' | Sorbus intermedia | Shape Match |
| Tilia americana 'Redman' | Sorbus intermedia | Shape Match |
| Tilia americana 'Redmond') | Sorbus intermedia | Shape Match |
| Betula nigra | Alnus glutinosa | Order Match |
| Ulmus thomasii | Sorbus intermedia | Shape Match |
| Acer platanoides 'Royal Red' | Acer campestre | Order Match |
| Malus 'Royalty' | Sorbus intermedia | Shape Match |
| Aesculus × carnea 'Briotii' | Quercus petraea | Order Match |
| Elaeagnus angustifolia | Sorbus intermedia | Shape Match |
| Sassafras albidum | Sorbus intermedia | Shape Match |
| Magnolia × soulangiana | Sorbus intermedia | Shape Match |
| Prunus virginiana 'Schubert' | Sorbus intermedia | Shape Match |
| Ulmus glabra | Sorbus intermedia | Shape Match |
| Pinus sylvestris | Pinus nigra | Order Match |
| Acer platanoides 'Crimson King' | Acer campestre | Order Match |
| Picea omorika | Pinus nigra | Order Match |
| Amelanchier spp. | Sorbus intermedia | Shape Match |
| Robinia pseudoacacia 'Shademaster' | Populus trichocarpa × deltoides | Shape Match |
| Carya ovata | Quercus petraea | Order Match |
| Quercus imbricaria | Quercus petraea | Order Match |
| Ulmus pumila | Sorbus intermedia | Shape Match |
| Abies alba | Pinus nigra | Order Match |
| Acer saccharinum | Acer campestre | Order Match |
| Acer saccharinum 'Silver Queen' | Acer campestre | Order Match |
| Gleditsia triacanthos 'Skycole' | Populus trichocarpa × deltoides | Shape Match |
| Cotinus coggygria | Acer campestre | Order Match |
| Picea spp. | Pinus nigra | Order Match |
| Rhus typhina | Acer campestre | Order Match |
| Magnolia stellata | Sorbus intermedia | Shape Match |
| Acer saccharum | Acer campestre | Order Match |
| Gleditsia triacanthos var. inermis 'Sunburst' | Populus trichocarpa × deltoides | Shape Match |
| Quercus shumardii | Quercus petraea | Order Match |
| Quercus bicolor | Quercus petraea | Order Match |
| Liquidambar styraciflua | Acer campestre | Order Match |
| Acer pseudoplatanus | Acer campestre | Order Match |
| Platanus occidentalis | Acer campestre | Order Match |
| Larix laricina | Pinus nigra | Order Match |
| Acer tataricum | Acer campestre | Order Match |
| Syringa reticulata | Fraxinus excelsior L. | Shape Match |
| Ailanthus altissima | Populus trichocarpa × deltoides | Shape Match |
| Styrax japonicus | Populus trichocarpa × deltoides | Shape Match |
| Populus tremuloides | Alnus glutinosa | Order Match |
| Fagus sylvatica 'Tricolor' | Quercus petraea | Order Match |
| Ulmus 'Morton Glossy' | Sorbus intermedia | Shape Match |
| Liriodendron tulipifera | Acer campestre | Order Match |
| Corylus colurna | Alnus glutinosa | Order Match |
| Fagus sylvatica 'Pendula' | Quercus petraea | Order Match |
| Betula pendula 'Youngii' | Alnus glutinosa | Order Match |
| Chamaecyparis pisifera 'Filifera Pendula' | Cupressus × leylandii | Shape Match |
| Morus alba 'Pendula' | Sorbus intermedia | Shape Match |
| Salix babylonica | Populus trichocarpa × deltoides | Shape Match |
| Fraxinus americana | Fraxinus excelsior L. | Order Match |
| Fraxinus americana 'Kleinburg' | Fraxinus excelsior L. | Order Match |
| Betula papyrifera | Alnus glutinosa | Order Match |
| Ulmus americana | Sorbus intermedia | Shape Match |
| Abies concolor | Pinus nigra | Order Match |
| Morus alba | Sorbus intermedia | Shape Match |
| Quercus alba | Quercus petraea | Order Match |
| Pinus strobus | Pinus nigra | Order Match |
| Populus alba | Alnus glutinosa | Order Match |
| Picea glauca | Pinus nigra | Order Match |
| Salix alba | Populus trichocarpa × deltoides | Shape Match |
| Ulmus glabra | Sorbus intermedia | Shape Match |
| Betula alleghaniensis | Alnus glutinosa | Order Match |
| Cladrastis kentukea | Pinus nigra | Order Match |
References
- Pourali, M., Townsend, C., Kross, A., Guindon, A., & Jaeger, J. A. G. (2022). Urban sprawl in Canada: Values in all 33 Census Metropolitan Areas and corresponding 469 Census Subdivisions between 1991 and 2011. Data in Brief, 41, 107941. [CrossRef]
- Chettry, V. (2023). A Critical Review of Urban Sprawl Studies. Journal of Geovisualization and Spatial Analysis, 7(2), 28. [CrossRef]
- Murray, A. T., Davis, R., Stimson, R. J., & Ferreira, L. (1998). Public Transportation Access. Transportation Research Part D: Transport and Environment, 3(5), 319–328. [CrossRef]
- Zhang, X., Lyu, J., Zeng, Y., Sun, N., Liu, C., & Yin, S. (2021). Individual effects of trichomes and leaf morphology on PM2.5 dry deposition velocity: A variable-control approach using species from the same family or genus. Environmental Pollution, 272, 116385. [CrossRef]
- Xie, C., Guo, J., Yan, L., Jiang, R., Liang, A., & Che, S. (2022). The influence of plant morphological structure characteristics on PM2.5 retention of leaves under different wind speeds. Urban Forestry & Urban Greening, 71, 127556. [CrossRef]
- Wathanavasin, W., Banjongjit, A., Phannajit, J., Eiam-Ong, S., & Susantitaphong, P. (2024). Association of fine particulate matter (PM2.5) exposure and chronic kidney disease outcomes: A systematic review and meta-analysis. Scientific Reports, 14(1), 1048. [CrossRef]
- Fan, J., Li, S., Fan, C., Bai, Z., & Yang, K. (2016). The impact of PM2.5 on asthma emergency department visits: A systematic review and meta-analysis. Environmental Science and Pollution Research, 23(1), 843–850. [CrossRef]
- Maji, K. J., Dikshit, A. K., Arora, M., & Deshpande, A. (2018). Estimating premature mortality attributable to PM2.5 exposure and benefit of air pollution control policies in China for 2020. Science of The Total Environment, 612, 683–693. [CrossRef]
- Moreno, T., Querol, X., Alastuey, A., Ballester, F., & Gibbons, W. (2007). Airborne particulate matter and premature deaths in urban Europe: The new WHO guidelines and the challenge ahead as illustrated by Spain. European Journal of Epidemiology, 22(1), 1–5. [CrossRef]
- Al-Kindi, S. G., Brook, R. D., Biswal, S., & Rajagopalan, S. (2020). Environmental determinants of cardiovascular disease: Lessons learned from air pollution. Nature Reviews Cardiology, 17(10), 656–672. [CrossRef]
- Ng, C. F. S., Hashizume, M., Obase, Y., Doi, M., Tamura, K., Tomari, S., Kawano, T., Fukushima, C., Matsuse, H., Chung, Y., Kim, Y., Kunimitsu, K., Kohno, S., & Mukae, H. (2019). Associations of chemical composition and sources of PM2.5 with lung function of severe asthmatic adults in a low air pollution environment of urban Nagasaki, Japan. Environmental Pollution, 252, 599–606. [CrossRef]
- Dong, Z., Wang, S., Xing, J., Chang, X., Ding, D., & Zheng, H. (2020). Regional transport in Beijing-Tianjin-Hebei region and its changes during 2014–2017: The impacts of meteorology and emission reduction. Science of The Total Environment, 737, 139792. [CrossRef]
- Hasheminassab, S., Daher, N., Ostro, B. D., & Sioutas, C. (2014). Long-term source apportionment of ambient fine particulate matter (PM2.5) in the Los Angeles Basin: A focus on emissions reduction from vehicular sources. Environmental Pollution, 193, 54–64. [CrossRef]
- Guttikunda, S. K., Goel, R., & Pant, P. (2014). Nature of air pollution, emission sources, and management in the Indian cities. Atmospheric Environment, 95, 501–510. [CrossRef]
- Sofia, D., Gioiella, F., Lotrecchiano, N., & Giuliano, A. (2020). Mitigation strategies for reducing air pollution. Environmental Science and Pollution Research, 27(16), 19226–19235. [CrossRef]
- Jayasooriya, V. M., Ng, A. W. M., Muthukumaran, S., & Perera, B. J. C. (2017). Green infrastructure practices for improvement of urban air quality. Urban Forestry & Urban Greening, 21, 34–47. [CrossRef]
- Muresan, A. N., Sebastiani, A., Gaglio, M., Fano, E. A., & Manes, F. (2022). Assessment of air pollutants removal by green infrastructure and urban and peri-urban forests management for a greening plan in the Municipality of Ferrara (Po river plain, Italy). Ecological Indicators, 135, 108554. [CrossRef]
- Shen, J., Peng, Z., & Wang, Y. (2023). From GI, UGI to UAGI: Ecosystem service types and indicators of green infrastructure in response to ecological risks and human needs in global metropolitan areas. Cities, 134, 104176. [CrossRef]
- Wang, A., Wang, J., Zhang, R., & Cao, S.-J. (2024). Mitigating urban heat and air pollution considering green and transportation infrastructure. Transportation Research Part A: Policy and Practice, 184, 104079. [CrossRef]
- Beckett, K. P., Freer-Smith, P. H., & Taylor, G. (2000). Particulate pollution capture by urban trees: Effect of species and windspeed. Global Change Biology, 6(8), 995–1003. [CrossRef]
- Beckett, K. P., Freer-Smith, P., & Taylor, G. (2000). Effective Tree Species for Local Airquality Management. Arboriculture & Urban Forestry, 26(1), 12–19. [CrossRef]
- Freer-Smith, P. H., Beckett, K. P., & Taylor, G. (2005). Deposition velocities to Sorbus aria, Acer campestre, Populus deltoides × trichocarpa ‘Beaupré’, Pinus nigra and × Cupressocyparis leylandii for coarse, fine and ultra-fine particles in the urban environment. Environmental Pollution, 133(1), 157–167. [CrossRef]
- Freer-Smith, P. H., El-Khatib, A. A., & Taylor, G. (2004). Capture of Particulate Pollution by Trees: A Comparison of Species Typical of Semi-Arid Areas (Ficus Nitida and Eucalyptus Globulus) with European and North American Species. Water, Air, and Soil Pollution, 155(1), 173–187. [CrossRef]
- Barwise, Y., & Kumar, P. (2020). Designing vegetation barriers for urban air pollution abatement: A practical review for appropriate plant species selection. Npj Climate and Atmospheric Science, 3(1), 1–19. [CrossRef]
- Chen, D., Yan, J., Sun, N., Sun, W., Zhang, W., Long, Y., & Yin, S. (2024). Selective capture of PM2.5 by urban trees: The role of leaf wax composition and physiological traits in air quality enhancement. Journal of Hazardous Materials, 478, 135428. [CrossRef]
- Gaglio, M., Pace, R., Muresan, A. N., Grote, R., Castaldelli, G., Calfapietra, C., & Fano, E. A. (2022). Species-specific efficiency in PM2.5 removal by urban trees: From leaf measurements to improved modeling estimates. Science of The Total Environment, 844, 157131. [CrossRef]
- Sæbø, A., Popek, R., Nawrot, B., Hanslin, H. M., Gawronska, H., & Gawronski, S. W. (2012). Plant species differences in particulate matter accumulation on leaf surfaces. Science of The Total Environment, 427–428, 347–354. [CrossRef]
- Zhang, X., Lyu, J., Han, Y., Sun, N., Sun, W., Li, J., Liu, C., & Yin, S. (2020). Effects of the leaf functional traits of coniferous and broadleaved trees in subtropical monsoon regions on PM2.5 dry deposition velocities. Environmental Pollution, 265, 114845. [CrossRef]
- Dzierżanowski, K., Popek, R., Gawrońska, H., Sæbø, A., & Gawroński, S. W. (2011). Deposition of Particulate Matter of Different Size Fractions on Leaf Surfaces and in Waxes of Urban Forest Species. International Journal of Phytoremediation, 13(10), 1037–1046. [CrossRef]
- Chen, D., Yin, S., Zhang, X., Lyu, J., Zhang, Y., Zhu, Y., & Yan, J. (2022). A high-resolution study of PM2.5 accumulation inside leaves in leaf stomata compared with non-stomatal areas using three-dimensional X-ray microscopy. Science of The Total Environment, 852, 158543. [CrossRef]
- Chen, L., Liu, C., Zhang, L., Zou, R., & Zhang, Z. (2017). Variation in Tree Species Ability to Capture and Retain Airborne Fine Particulate Matter (PM2.5). Scientific Reports, 7(1), 3206. [CrossRef]
- Choi, Y.-K., Song, H.-J., Jo, J.-W., Bang, S.-W., Park, B.-H., Kim, H.-H., Kim, K.-J., Jeong, N.-R., Kim, J.-H., & Kim, H.-J. (2021). Morphological and Chemical Evaluations of Leaf Surface on Particulate Matter2.5 (PM2.5) Removal in a Botanical Plant-Based Biofilter System. Plants, 10(12), Article 12. [CrossRef]
- Hirabayashi, S. (2022). I-Tree Eco Biogenic Emissions Model Descriptions.
- Wesely, M. L., & Hicks, B. B. (2000). A review of the current status of knowledge on dry deposition. Atmospheric Environment, 34(12), 2261–2282. [CrossRef]
- Pace, R., Guidolotti, G., Baldacchini, C., Pallozzi, E., Grote, R., Nowak, D. J., & Calfapietra, C. (2021). Comparing i-Tree Eco Estimates of Particulate Matter Deposition with Leaf and Canopy Measurements in an Urban Mediterranean Holm Oak Forest. Environmental Science & Technology, 55(10), 6613–6622. [CrossRef]
- Riondato, E., Pilla, F., Sarkar Basu, A., & Basu, B. (2020). Investigating the effect of trees on urban quality in Dublin by combining air monitoring with i-Tree Eco model. Sustainable Cities and Society, 61, 102356. [CrossRef]
- Roy, A., Mandal, M., Das, S., Popek, R., Rakwal, R., Agrawal, G. K., Awasthi, A., & Sarkar, A. (2024). The cellular consequences of particulate matter pollutants in plants: Safeguarding the harmonious integration of structure and function. Science of The Total Environment, 914, 169763. [CrossRef]
- Soares, A. L., Rego, F. C., McPherson, E. G., Simpson, J. R., Peper, P. J., & Xiao, Q. (2011). Benefits and costs of street trees in Lisbon, Portugal. Urban Forestry & Urban Greening, 10(2), 69–78. [CrossRef]
- Wu, X., Yang, X., Qi, J., Feng, C., & Liang, S. (2021). Effects of economic structural transition on PM2.5-Related Human Health Impacts in China. Journal of Cleaner Production, 298, 126793. [CrossRef]
- Rasoolzadeh, R., Mobarghaee Dinan, N., Esmaeilzadeh, H., Rashidi, Y., & Sadeghi, S. M. M. (2024). Assessment of air pollution removal by urban trees based on the i-Tree Eco Model: The case of Tehran, Iran. Integrated Environmental Assessment and Management, 20(6), 2142–2152. [CrossRef]
- Ayturan, Z. C., Kongoli, C., & Kunt, F. (2024). Investigation of the effects of tree species on air quality using i-Tree software: A case study in California. Annals of Forest Research, 67(2), Article 2. [CrossRef]
- Nowak, D. J., Hirabayashi, S., Bodine, A., & Hoehn, R. (2013). Modeled PM2.5 removal by trees in ten U.S. cities and associated health effects. Environmental Pollution, 178, 395–402. [CrossRef]
- Kim, K., Jeon, J., Jung, H., Kim, T. K., Hong, J., Jeon, G.-S., & Kim, H. S. (2022). PM2.5 reduction capacities and their relation to morphological and physiological traits in 13 landscaping tree species. Urban Forestry & Urban Greening, 70, 127526. [CrossRef]
- García de Jalón, S., González del Tánago, M., & García de Jalón, D. (2019). A new approach for assessing natural patterns of flow variability and hydrological alterations: The case of the Spanish rivers. Journal of Environmental Management, 233, 200–210. [CrossRef]
- Climate Data (2024). Climate Mississauga (Ontario, Canada): Temperature, climate graph, climate table for Mississauga. Retrieved May 3, 2025, from https://en.climate-data.org/north-america/canada/ontario/mississauga-1676/.
- City of Mississauga. (2019). City-owned tree inventory. Retrieved October 30, 2023, from https://data.mississauga.ca/datasets/mississauga::city-owned-tree-inventory/about.
- Wang, R., Chen, J. M., Luo, X., Black, A., & Arain, A. (2019). Seasonality of leaf area index and photosynthetic capacity for better estimation of carbon and water fluxes in evergreen conifer forests. Agricultural and Forest Meteorology, 279, 107708. [CrossRef]
- Miller, P. (1768). The gardener’s dictionary (8th ed.). Printed for the author.
- Wróblewska, K., & Jeong, B. R. (2021). Effectiveness of plants and green infrastructure utilization in ambient particulate matter removal. Environmental Sciences Europe, 33(1), 110. [CrossRef]
- Janhäll, S. (2015). Review on urban vegetation and particle air pollution – Deposition and dispersion. Atmospheric Environment, 105, 130–137. [CrossRef]
- Chen, J. M., & Black, T. A. (1991). Measuring leaf area index of plant canopies with branch architecture. Agricultural and Forest Meteorology, 57(1), 1–12. [CrossRef]
- Yang, H., Yang, X., Heskel, M., Sun, S., & Tang, J. (2017). Seasonal variations of leaf and canopy properties tracked by ground-based NDVI imagery in a temperate forest. Scientific Reports, 7(1), 1267. [CrossRef]
- Feng, R., Zhang, Y., Yu, W., Hu, W., Wu, J., Ji, R., Wang, H., & Zhao, X. (2013). Analysis of the relationship between the spectral characteristics of maize canopy and leaf area index under drought stress. Acta Ecologica Sinica, 33(6), 301–307. [CrossRef]
- Planet. (2023). Planet Explorer dataset. Retrieved October 30, 2023, from https://www.planet.com/explorer.
- Gao, Z., Chen, Y., Zhang, Z., Duan, T., Chen, J., & Li, A. (2024). Continuous Leaf Area Index (LAI) Observation in Forests: Validation, Application, and Improvement of LAI-NOS. Forests, 15(5), Article 5. [CrossRef]
- Leblanc, S. G., & Chen, J. M. (2001). A practical scheme for correcting multiple scattering effects on optical LAI measurements. Agricultural and Forest Meteorology, 110(2), 125–139. [CrossRef]
- van Donkelaar, A., Hammer, M. S., Bindle, L., Brauer, M., Brook, J. R., Garay, M. J., Hsu, N. C., Kalashnikova, O. V., Kahn, R. A., Lee, C., Levy, R. C., Lyapustin, A., Sayer, A. M., & Martin, R. V. (2021). Monthly Global Estimates of Fine Particulate Matter and Their Uncertainty. Environmental Science & Technology, 55(22), 15287–15300. [CrossRef]
- Shimano, K. (1997). Analysis of the Relationship between DBH and Crown Projection Area Using a New Model. Journal of Forest Research, 2(4), 237–242. [CrossRef]
- Selmi, W., Weber, C., Rivière, E., Blond, N., Mehdi, L., & Nowak, D. (2016). Air pollution removal by trees in public green spaces in Strasbourg city, France. Urban Forestry & Urban Greening, 17, 192–201. [CrossRef]
- Morani, A., Nowak, D. J., Hirabayashi, S., & Calfapietra, C. (2011). How to select the best tree planting locations to enhance air pollution removal in the MillionTreesNYC initiative. Environmental Pollution, 159(5), 1040–1047. [CrossRef]
- Escobedo, F. J., & Nowak, D. J. (2009). Spatial heterogeneity and air pollution removal by an urban forest. Landscape and Urban Planning, 90(3), 102–110. [CrossRef]
- Tallis, M., Taylor, G., Sinnett, D., & Freer-Smith, P. (2011). Estimating the removal of atmospheric particulate pollution by the urban tree canopy of London, under current and future environments. Landscape and Urban Planning, 103(2), 129–138. [CrossRef]
- Baró, F., Chaparro, L., Gómez-Baggethun, E., Langemeyer, J., Nowak, D. J., & Terradas, J. (2014). Contribution of Ecosystem Services to Air Quality and Climate Change Mitigation Policies: The Case of Urban Forests in Barcelona, Spain. (2016). In Urban Forests. Apple Academic Press.
- Xing, Y., & Brimblecombe, P. (2020). Trees and parks as “the lungs of cities.” Urban Forestry & Urban Greening, 48, 126552. [CrossRef]
- Su, T.-H., Lin, C.-S., Lu, S.-Y., Lin, J.-C., Wang, H.-H., & Liu, C.-P. (2022). Effect of air quality improvement by urban parks on mitigating PM2.5 and its associated heavy metals: A mobile-monitoring field study. Journal of Environmental Management, 323, 116283. [CrossRef]
- Tan, X., & Shibata, S. (2022). Factors influencing street tree health in constrained planting spaces: Evidence from Kyoto City, Japan. Urban Forestry & Urban Greening, 67, 127416. [CrossRef]
- Roman, L. A., & Eisenman, T. S. (2022). Drivers of street tree species selection: The case of London planetrees in Philadelphia. In The Politics of Street Trees. Routledge.
- Lin, X., Chamecki, M., & Yu, X. (2020). Aerodynamic and deposition effects of street trees on PM2.5 concentration: From street to neighborhood scale. Building and Environment, 185, 107291. [CrossRef]
- Roman, Lara A., Tenley M. Conway, Theodore S. Eisenman, Andrew K. Koeser, Camilo Ordóñez Barona, Dexter H. Locke, G. Darrel Jenerette, Johan Östberg, and Jess Vogt. 2021. “Beyond ‘Trees Are Good’: Disservices, Management Costs, and Tradeoffs in Urban Forestry.” Ambio 50 (3): 615–30. [CrossRef]
- Pataki, D. E., Alberti, M., Cadenasso, M. L., Felson, A. J., McDonnell, M. J., Pincetl, S., Pouyat, R. V., Setälä, H., & Whitlow, T. H. (2021). The Benefits and Limits of Urban Tree Planting for Environmental and Human Health. Frontiers in Ecology and Evolution, 9, 603757. [CrossRef]
- de Guzman, E. B., Escobedo, F. J., & O’Leary, R. (2022). A socio-ecological approach to align tree stewardship programs with public health benefits in marginalized neighborhoods in Los Angeles, USA. Frontiers in Sustainable Cities, 4. [CrossRef]
- Gregory, K., & Ajibade, I. (2024). Participatory mapping of tree equity, preferences, and environmental justice in Portland, Oregon. Urban Forestry & Urban Greening, 97, 128374. [CrossRef]
- Russo, A., & Cirella, G. T. (2024). Urban Ecosystem Services in a Rapidly Urbanizing World: Scaling up Nature’s Benefits from Single Trees to Thriving Urban Forests. Land, 13(6), Article 6. [CrossRef]
- Salmond, J. A., Tadaki, M., Vardoulakis, S., Arbuthnott, K., Coutts, A., Demuzere, M., Dirks, K. N., Heaviside, C., Lim, S., Macintyre, H., McInnes, R. N., & Wheeler, B. W. (2016). Health and climate-related ecosystem services provided by street trees in the urban environment. Environmental Health, 15(1), S36. [CrossRef]
- Livesley, S. J., McPherson, E. G., & Calfapietra, C. (2016). The Urban Forest and Ecosystem Services: Impacts on Urban Water, Heat, and Pollution Cycles at the Tree, Street, and City Scale. Journal of Environmental Quality, 45(1), 119–124. [CrossRef]
- Erisman, J. W., & Draaijers, G. (2003). Deposition to forests in Europe: Most important factors influencing dry deposition and models used for generalisation. Environmental Pollution, 124(3), 379–388. [CrossRef]
- Zhao, J., Davies, C., Veal, C., Xu, C., Zhang, X., & Yu, F. (2024). Review on the Application of Nature-Based Solutions in Urban Forest Planning and Sustainable Management. Forests, 15(4), Article 4. [CrossRef]
- Askariyeh, M. H., Venugopal, M., Khreis, H., Birt, A., & Zietsman, J. (2020). Near-Road Traffic-Related Air Pollution: Resuspended PM2.5 from Highways and Arterials. International Journal of Environmental Research and Public Health, 17(8), Article 8. [CrossRef]
Figure 1.
A comparison of (a) average dry deposition velocity (cm/s), (b) LAI, (c) deposited area (cm2), and (d) DBH (cm) between high PM2.5 mitigation species on the left and low mitigation species on the right.
Figure 1.
A comparison of (a) average dry deposition velocity (cm/s), (b) LAI, (c) deposited area (cm2), and (d) DBH (cm) between high PM2.5 mitigation species on the left and low mitigation species on the right.
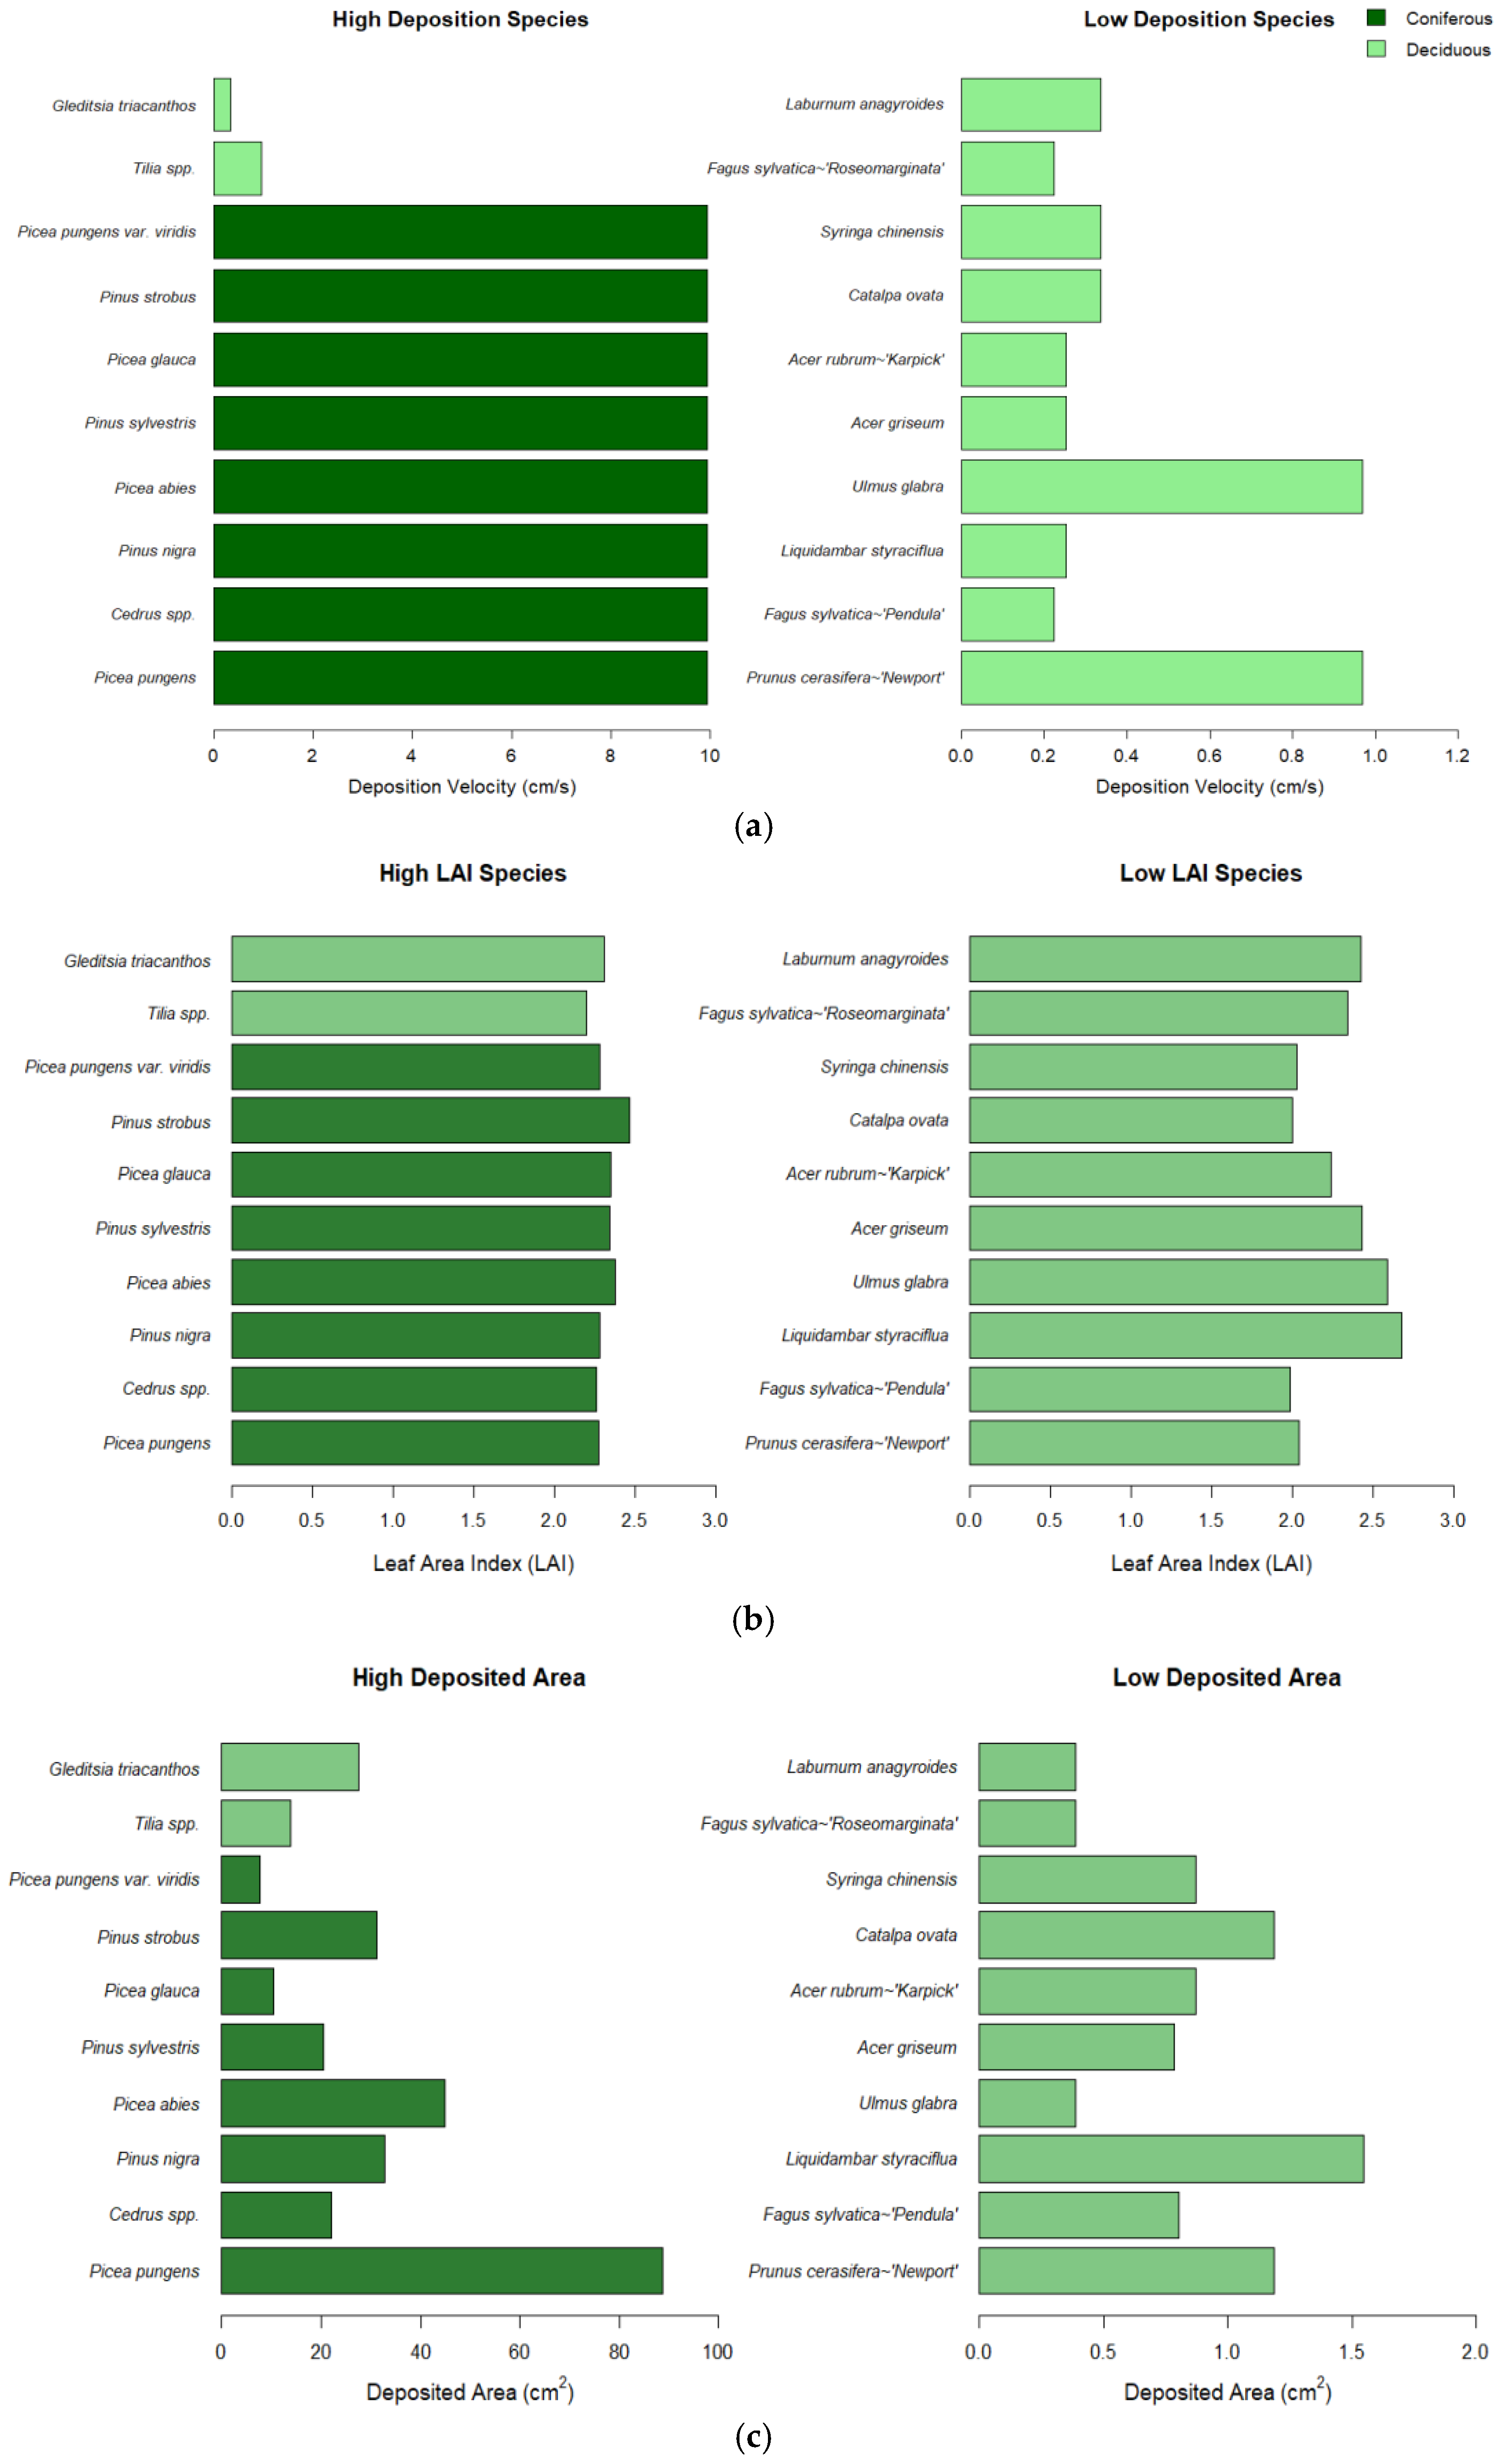
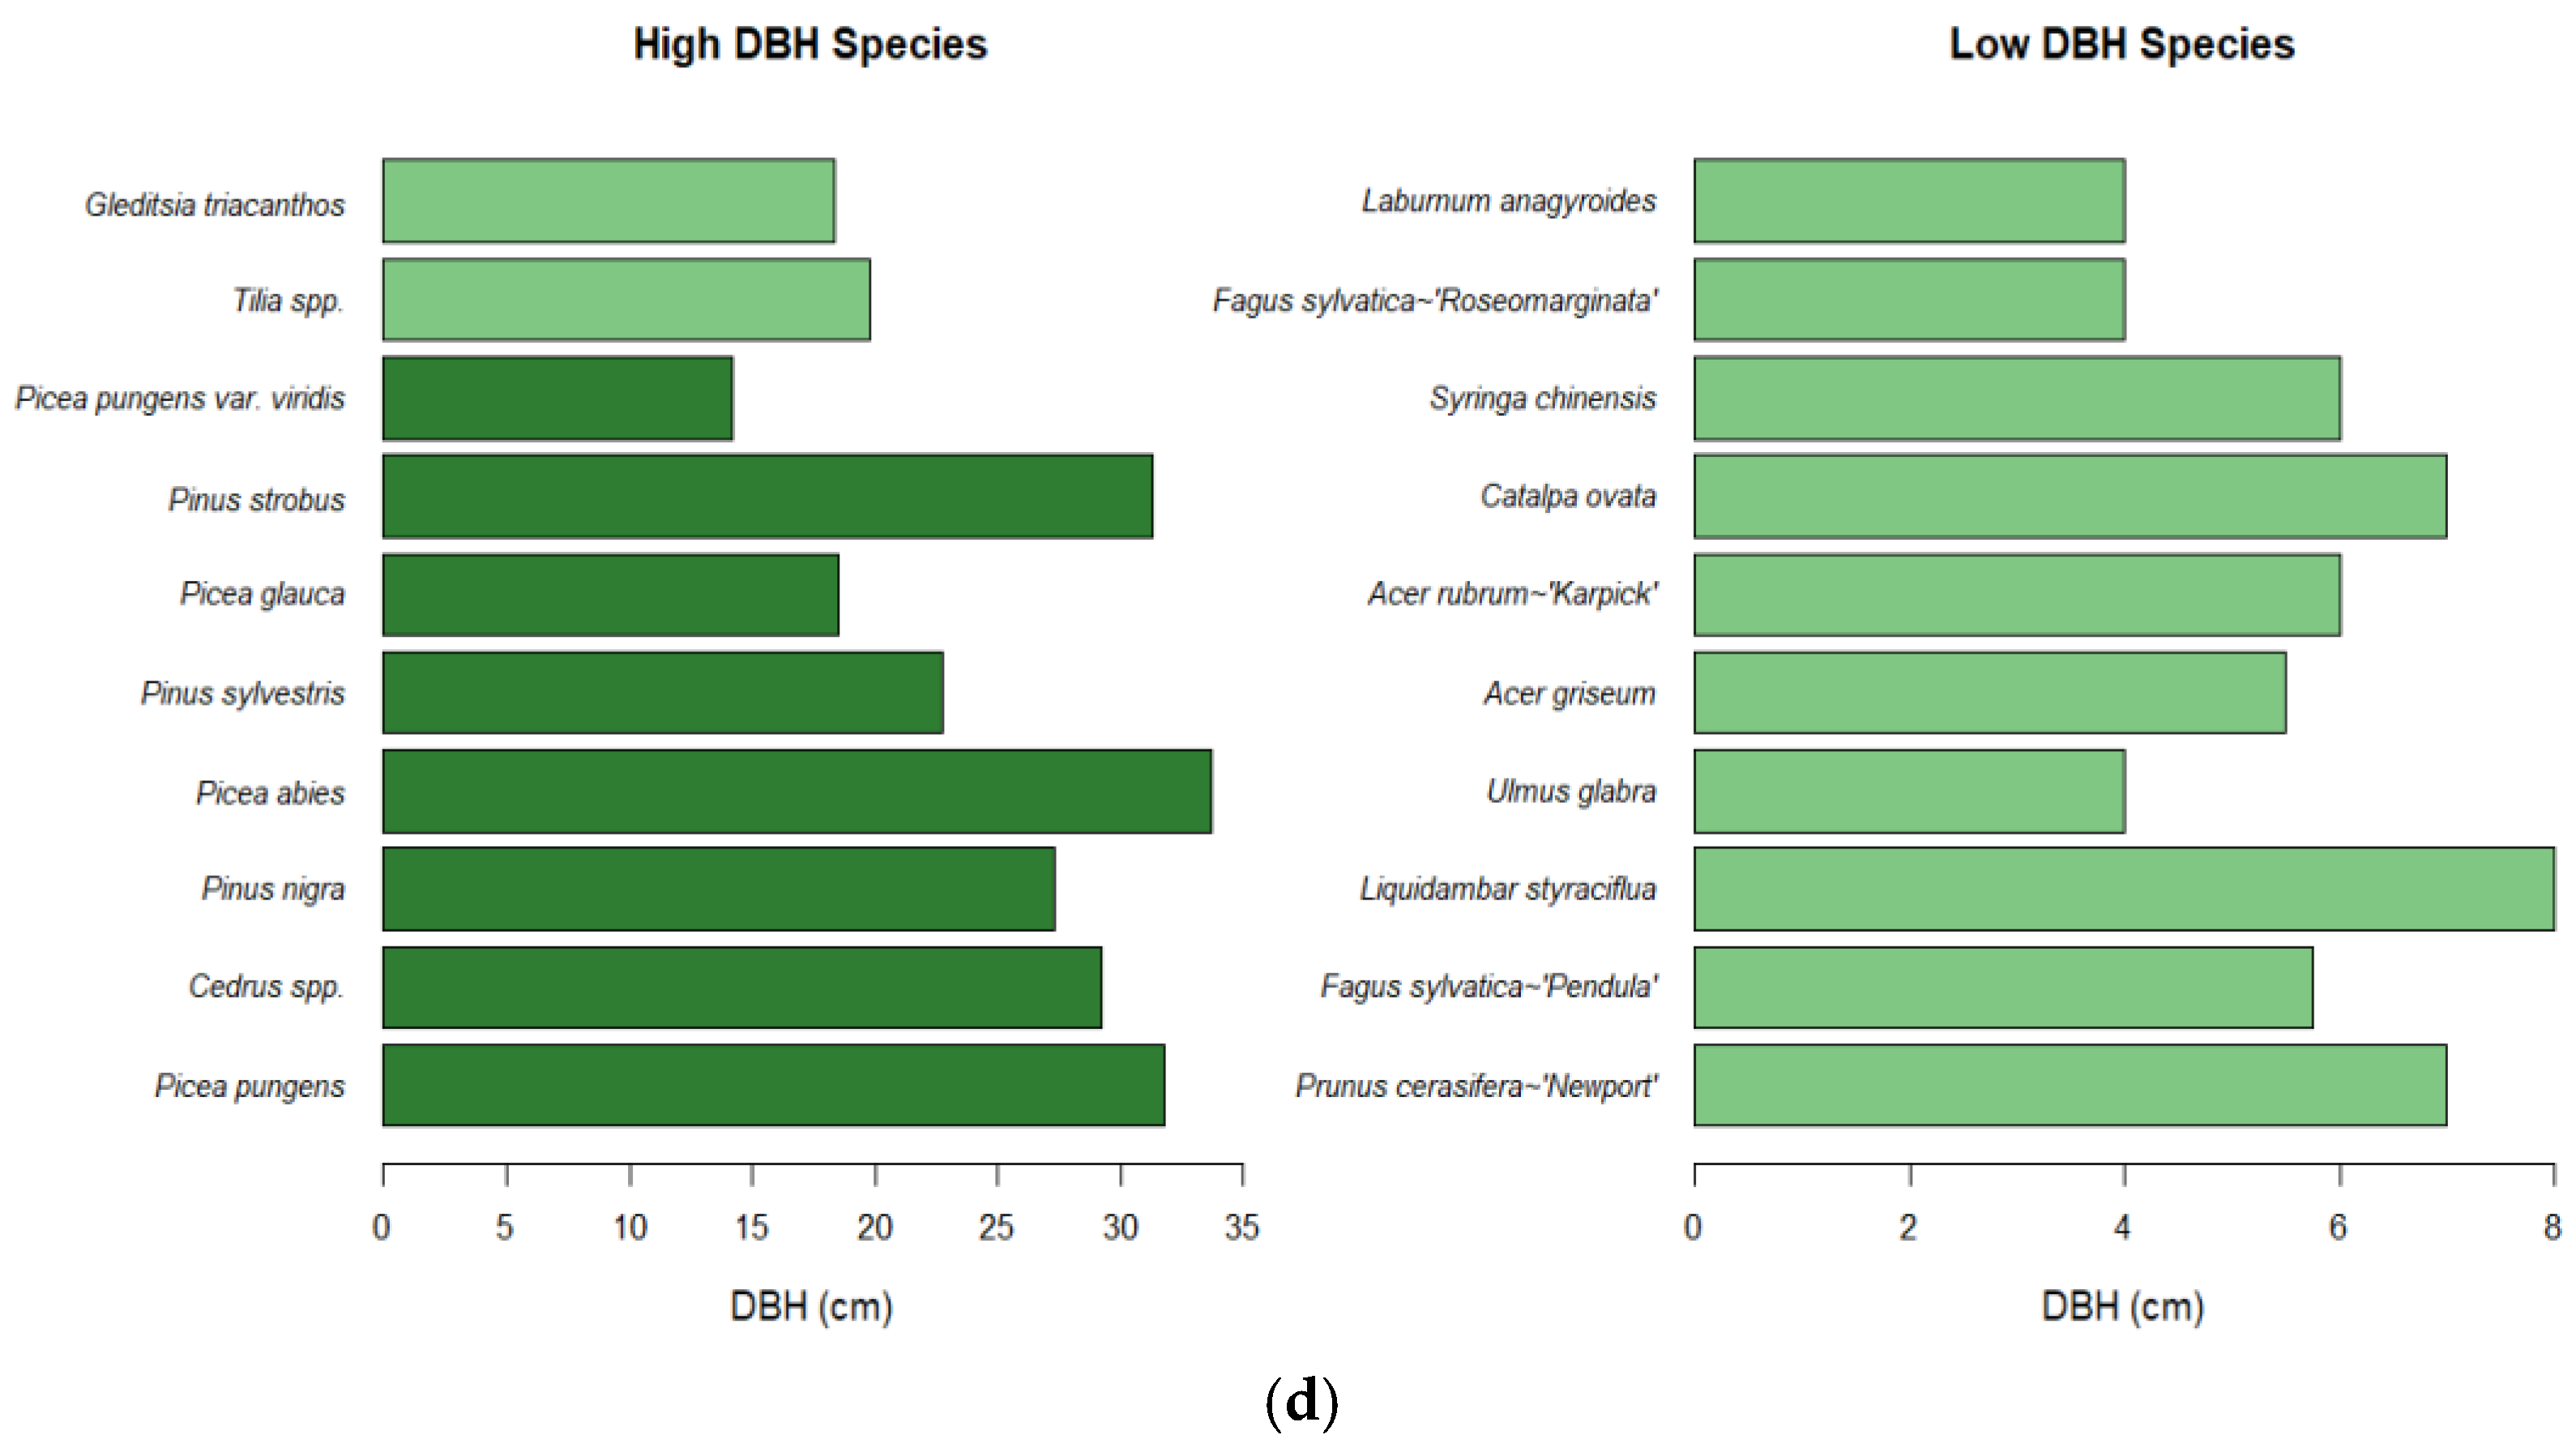
Table 1.
PM2.5 deposition at the species level for the top 10 city-owned street trees during the in-leaf season of 2019 in Mississauga, Canada.
Table 1.
PM2.5 deposition at the species level for the top 10 city-owned street trees during the in-leaf season of 2019 in Mississauga, Canada.
| Scientific Name |
Amount of PM2.5 Deposited Per Species (g) |
Percent of Total Deposition Per Species |
Number of Trees Per Species |
Percent of Total Trees |
Amount of PM2.5 Deposition Per Tree (g) |
|---|---|---|---|---|---|
| Picea pungens | 18,329,696 | 65.94 | 10,248 | 5.11 | 1,788 |
| Pinus nigra | 3,286,017 | 11.82 | 5,004 | 2.5 | 656 |
| Picea abies | 1,498,729 | 5.39 | 1,535 | 0.77 | 976 |
| Pinus sylvestris | 598,184 | 2.15 | 1,389 | 0.69 | 430 |
| Picea glauca | 535,588 | 1.93 | 2,322 | 1.16 | 230 |
| Pinus strobus | 507,412 | 1.83 | 702 | 0.35 | 722 |
| Picea pungens | 420,318 | 1.51 | 2,632 | 1.31 | 159 |
| Tilia | 337,173 | 1.21 | 12,324 | 6.14 | 27 |
| Quercus rubra | 247,104 | 0.89 | 3,285 | 1.64 | 75 |
| Acer platanoides | 236,688 | 0.85 | 35,690 | 17.8 | 6 |
Disclaimer/Publisher’s Note: The statements, opinions and data contained in all publications are solely those of the individual author(s) and contributor(s) and not of MDPI and/or the editor(s). MDPI and/or the editor(s) disclaim responsibility for any injury to people or property resulting from any ideas, methods, instructions or products referred to in the content. |
© 2025 by the authors. Licensee MDPI, Basel, Switzerland. This article is an open access article distributed under the terms and conditions of the Creative Commons Attribution (CC BY) license (http://creativecommons.org/licenses/by/4.0/).
Copyright: This open access article is published under a Creative Commons CC BY 4.0 license, which permit the free download, distribution, and reuse, provided that the author and preprint are cited in any reuse.


