Submitted:
04 June 2025
Posted:
18 June 2025
You are already at the latest version
Abstract
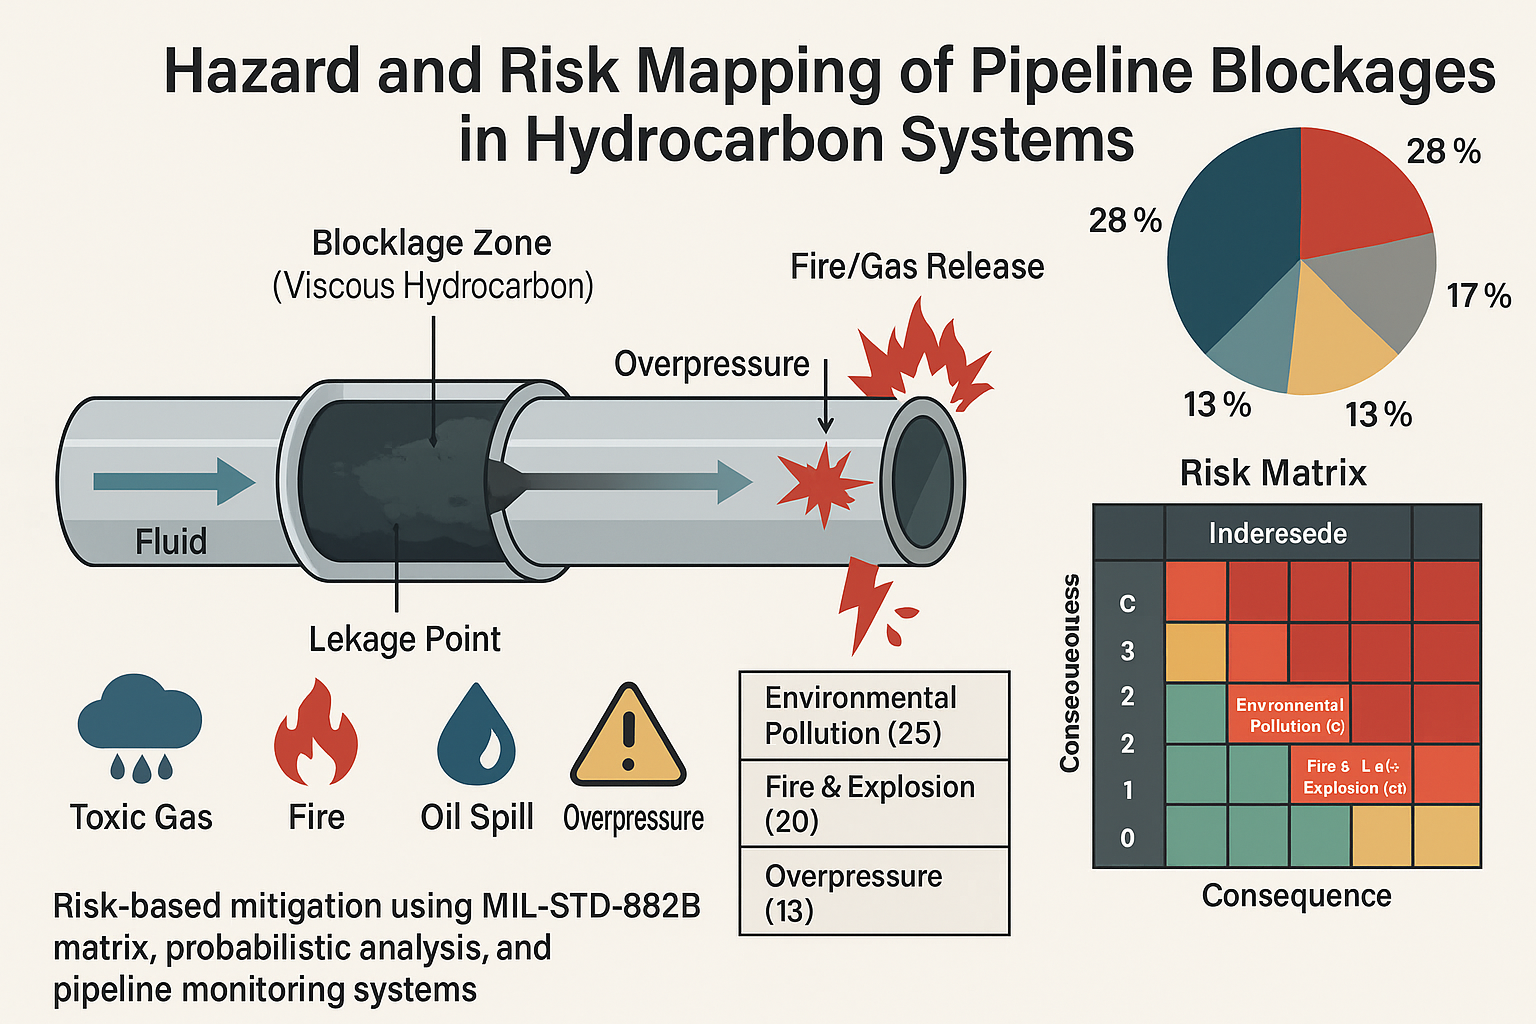
A pipeline network is a structured fluid transportation system with low operating costs and high efficiency. It is the leading choice for transporting oil from the collection station to the receiving end station, making pipeline facilities critical equipment that must be maintained for availability and reliability to ensure the smooth running of the oil production process. However, this piping system is not free from various risks of disruption, both in operation and maintenance or due to the fluid content flowing through it. Pipeline blockage is an event for which hazards and risks must be identified so that risk mitigation can be applied as a form of sustainable engineering to minimize damage. This paper reviews the identification of hazards and risks as well as the mitigation of pipeline blockage derived from various studies and events, comprehensively discussing them using a risk matrix. It was concluded that the greatest risks of pipe blockage are environmental damage at 28%, fire and explosion at 22%, hazardous and toxic gases at 17%, overpressure at 13%, economic loss at 11%, and loss of oil production at 9%, with environmental recovery costs of 88.6%.
Keywords:
Hazards
; pipeline blockage
; pipeline network
; risk
; sustainable engineering
1. Introduction
Pipes have a long and interesting history as a means of transporting fluids. It began with the ancient Chinese using bamboo pipes in 500 BC to drain water, and the Babylonians and Romans using clay and copper pipes to transport oil [1]. The use of simple iron oil pipes started in the late 18th century in 1860 in Titusville, Pennsylvania, at the first U.S. oil well [2], and in 1879, Standard Oil used the first long stretch of pipe, spanning 175 km, to transport oil [3]. In the 19th century, there was a revolution in pipeline networks with the construction of underwater pipelines using strong steel pipes that can withstand high pressure and the use of modern pipelines with insulation and welding technology developed with leak detection systems using instrumentation sensors [4].
The world’s longest pipeline, the Druzhba pipeline, runs from Russia to Central Europe (Germany, Poland, Hungary, Slovakia, and the Czech Republic), transporting crude oil over a distance of 4,000 kilometers and has been in operation since 1964 [5]. Other notable pipelines include the 8,700-kilometer Tarim Basin natural gas pipeline from Xinjiang in western China to Shanghai in eastern China with the West-East Gas Pipeline [6], the 4,324-kilometer Keystone pipeline that delivers crude oil from Alberta to refineries in Texas in the United States [7], the 1,224-kilometer Nord Stream that delivers hydrocarbons from under the Baltic Sea in Russia to Germany with a total capacity of 55 billion cubic meters per year [8], the 1,287-kilometer Trans-Alaska Pipeline that transports oil from the Arctic to the port terminal in Valdez [9], and the planned 4,300-kilometer Trans-Sahara gas pipeline to transport hydrocarbons from Africa to Europe [10].
The history of the pipeline system stretching across the earth’s surface has created a number of complex problems due to the average age of the pipelines, with the potential for leaks and delivery failures due to damage to piping and flow system instrumentation. Pipelines, which are considered to be the safest and most economical facilities for the delivery of oil, gas, and liquid refined products, have a number of accident risks with major consequences in terms of severe environmental and ecological damage, loss of life, damage to assets, and disruption of the economy of a company or a country. In the worst case, these risks can cause the suspension of production operations for a long period [11].
Based on a report by the UK Health and Safety Executive (HSE), the most significant hydrocarbon leaks occurred in 2009/2010, when there were 85 hydrocarbon leaks, up from 61 in 2008/2009 [12]. In 2023-2024, there was an oil pipeline leak owned by the gas company Perenco in Poole Harbour, Dorset, UK, where up to 200 barrels of petroleum hydrocarbons leaked and polluted the waters of Poole Harbour, eventually leading to an extensive recovery and cleanup operation and an incident declaration by local authorities [13]. A year earlier, in 2022, there was also a Nord Stream pipeline leak in the Baltic Sea, where an estimated 778 million cubic meters of methane gas leaked and spilled into the sea, damaging the marine ecology and environment throughout Russia and Western Europe [14].
According to the US Department of Transportation’s Pipeline and Hazardous Material Safety Administration, 3.3 million miles of pipelines in the US transport a combined 1.2 million barrels of hazardous materials per day, and 64% of US energy commodities are transported through the pipeline system [15]. The long history of pipeline leaks, resulting in marine and terrestrial environmental pollution and social friction, has destabilized energy production and the economy. Rejuvenating pipelines is costly, making replacing entire pipelines an uneconomical solution. It also takes more effort to carry out periodic inspections of pipelines spanning thousands of kilometers, with some areas being difficult to reach.
Therefore, to reduce the risk of damage and failure in pipeline systems, a risk assessment must be conducted as an option to determine preventive action decisions and increase awareness of environmental, life, and asset safety due to accidental damage to pipeline systems. While operational challenges in the oil and gas industry have been studied, the majority of the research conducted only partially and separately addresses risk issues, with the object of study being limited to the oilfield production system that benefits the economy and recovery factors independently, and only discusses the pipe damage factor due to natural corrosion over its operational life [16].
Research that has been done only focuses on minimum costs, such as the study by Beemaraj et al., 2024 [17], which focuses on flow layout design and structural system minimization efforts that impact construction cost efficiency. This is also proposed in research conducted by Muhammed et al., 2023 [18], which focuses on flow design approaches to reduce repair project costs.
This research model was also promoted by Wang et al., 2024 [19], with additional proposals for the integration of layout design based on manifold systems to minimize construction costs, in line with the research of Silva & Guedes Soares, 2023 and Aven & Pedersen, 2014 [20,21], where system feasibility at the beginning of the project is used to define the level of risk and project profitability. The risk assessed by some previous researchers only evaluates the risk limited to pipe quality degradation due to internal and external corrosion, such as the recent research by Woldesellasse & Tesfamariam, 2025 [22], which assesses pipeline risk using an integrated Bayesian network approach to estimate corrosion failures in pipelines exposed to external corrosion.
This was also researched by Shabani et al., 2025 [23] but with a different approach, namely using a metaheuristic to predict corrosion risk in machine performance-based pipelines with index-based sensitivity analysis for identifying external corrosion depth. Along with this research, Yang et al. [24], 2025 also analyzed the corrosion risk due to hydrogen damage mechanisms by quantitative risk assessment (QRA) studies and probabilistic analysis of failure causes. The development of risk assessment from the integration of economic and safety aspects of asset performance optimization by assessing the key risk levels in the oilfield design concept has also been studied by Bhattacharyya & Cheliyan, 2019 and J. Wang et al., 1996 [25,26].
Risk-based pipeline asset assessment methods have been studied for application in the optimal design of offshore facilities based on the probability and consequences of failure due to degradation over time, using Key Performance Indicators (KPIs) as a monitoring tool for various technical and management levels, and holistically assessing critical conditions from the field operational level to the top management strategic and tactical hierarchy [27]. Monitoring of gas and oil transmission network facilities is also performed in real-time by integrating field data using sensors with 3D modelling information so that pipeline safety and performance information can be monitored 24 hours a day [28]. The application of the Bayesian network method to assess the rate of pipeline degradation due to Under Deposit Corrosion (UDC) by calculating the predicted corrosion rate under different scenarios and influencing factors is considered an adaptive technique that can be used for early warning of pipeline degradation conditions, serving as a guideline for asset integrity management [29].
Zheng et al., 2025 examined the random risk model using the probability of failure influenced by the consequences of depth and corrosion on natural gas pipelines [30]. The random risk assessment is used as a basis for preventive maintenance policies based on corrosion and its risk level in the event of damage, with this method being used to minimize maintenance costs took another approach [27], developing a combined model of technical, economic, and safety optimization with a pipeline manifold risk approach. They considered manifold size and pipe structure material, production system requirements, and investment planning. The worst-case scenario was identified to handle the system’s intrinsic uncertainty.
According to the Global Energy Monitor report, in December 2020, there were 2,381 oil and gas pipeline segments in the world, crossing 162 countries, with a total length of 1.18 million kilometres, or 30 times the circumference of the earth [31]. Long hydrocarbon pipelines with large diameters that cross countries and continents pass through difficult and inaccessible places in a short time. An example is the 4,000-kilometer-long section of the Druzhba pipeline that crosses Belarus for 2,910 kilometres, Ukraine for 1,490 kilometres, Poland for 670 kilometres, Hungary for 130 kilometres, Lithuania for 332 kilometres, Latvia for 420 kilometres, and Slovakia and the Czech Republic for about 400 kilometres each. These pipelines cross 45 major rivers and 200 railroads and highways [32]. The majority of risk assessment studies on oil and gas pipeline systems conducted so far focus only on damage caused by internal and external corrosion, damage caused by other parties, and damage caused by natural disasters. However, one of the causes of leaks in pipelines is blockage in the pipe flow, which leads to an increase in the operating pressure of the pipe above the maximum allowable pressure, causing simultaneous leakage at many points. This is an emergency event where the time and location of the flow disturbance cannot be precisely monitored [33].
If there is a blockage in the pipe that increases the internal pressure and causes a leak in the Druzhba pipe section, it will result in uncontrolled environmental pollution, social disruption, economic disruption, and the cutting off of fuel supplies for heating homes in winter. This will cause a global disaster that will affect all countries in the world. Previous research on piping systems has only discussed the dangers of pipe leaks and methods for finding blockage points in piping systems. This paper will complement the research by discussing the risk of flow disruption from the piping system in the form of blockages in the pipe cross-section, with the discussion of disruptions, impacts, and mitigation efforts carried out using a probability and severity risk matrix so that the danger of blockage can be identified as one of the risks with very large consequences.
2. Methods
The article begins with a literature review to identify failures in the piping system, theoretical basis, current industry standards, and cases related to pipe leaks (Figure 1). The second stage of writing this article is to identify possible failures that have occurred by conducting a literature review and collecting information from the internet related to pipe leak incidents to calculate the probability (likelihood) and severity of the incidents that have occurred. The last stage is hazard identification of pipeline blockage using a risk matrix.
The 5x5 risk matrix (MIL-STD-882B) is a standard used by the United States Department of Defense for evaluating and managing risks in a system and process. The 5x5 risk matrix (MIL-STD-882B) has five levels of possibility and impact to form a 5 x 5 matrix box that can be used to identify risks and then group risks based on priority so that risks can be controlled with appropriate and fast action [34].
This matrix is generally a decision-making tool with semi-quantitative or qualitative assessment using decision-making theory to evaluate risk and make the best decision based on the possibility and impact. Using the theory of probabilistic risk assessment, it calculates the possibility of failure and impact. The theoretical model used is then combined with the Bayesian statistical model to update the probability of risk due to large data, allowing for more accurate estimates in the risk matrix. Fuzzy logic is also used to improve the concept of truth, replacing Boolean logic [33].
Specifically, it is difficult to obtain comprehensive statistical data showing information about pipeline blockage likelihood, so a probabilistic risk assessment approach is carried out using historical data combined with statistical analysis to calculate the probability of pipe blockage, which is part of the failure of the piping system, by considering various factors such as design, operation, and environment [35]. A statistical analysis approach using machine learning is used to collect historical data on pipe failures with machine learning algorithms to estimate the likelihood of future failures [36]. To strengthen the analysis, research was collected that focused on developing methods for detecting the location and severity of blockages in pipes [37].
Hazard identification and risk assessment are tools used in systematic emergency management to evaluate hazardous risks so that organizations can prepare for the worst by isolating hazards in a time- and resource-efficient manner. The first step in hazard identification is to find all the things that have the potential to cause accidents, harm, and disruption to individuals, groups, organizations, and the environment in the form of physical, chemical, biological, ergonomic, or psychosocial hazards [38].
Hazard identification can be done by direct observation of the work process and equipment or the environment, by interviews to obtain information about conditions that can cause harm, or by analyzing incident data from previous incident records or from the history of inspection and maintenance data that has been performed. Once the hazards have been identified, the next step is to assess the risk of each hazard, taking into account the likelihood of occurrence (probability) and the consequences of a hazard (severity).
The likelihood of a hazard occurring (probability) starts with the question of how often that hazard occurs, which can be answered by looking at historical event data and defined as very rarely (1), seldom (2), quite often (3), often (4), and very often (5), as explained in Table 1:
The likelihood probability score assessment is used to measure and provide an assessment of an event using existing data and information, with the assessment being in the form of the possibility of a similar event occurring. The stages of this likelihood assessment start from identifying events that will cause an impact, then collecting data from relevant information sources in the form of historical data, trends, the environment, and other information related to the probability assessment, and then selecting a likelihood assessment method that is evaluated qualitatively or quantitatively. For this likelihood assessment, it is necessary to pay attention to the accuracy of the data. If there is uncertain data, an assessment can be carried out by interviewing a team of experts to avoid individual subjectivity errors [39].
The probability of this event can be determined by analyzing historical data, i.e., using past data and calculating the level of risk that a similar event can occur. It can also be assessed using the opinion of experts who have experience in dangerous situations. In addition to predictions made with simulation models, which can be used when there is no data and expert opinion, environmental factors are considered external factors that affect the likelihood of the risk of hazardous conditions. Meanwhile, the impact of hazard consequences or severity is assessed from the severity of impact, which is defined as mild (1), minor (2), moderate (3), severe (4), and critical/major (5), with assessment parameters according to the following Table 2:
Table 2 serves as a reference for assessing the severity of a hazard risk, which is evaluated based on the aspects of health and safety, environmental impact, reputation, and property damage. Each aspect is then assessed on a scale from one to five based on the impact that occurs and the improvement efforts required.
The probability and severity are then used to calculate the level of risk that occurs, using the following formula [41]:
Once the probability of occurrence and severity are known, they are inputted into a 5x5 risk matrix, which is a tool for assessing and prioritizing conditions or states of production operations. The matrix is presented as Figure 2 with five rows and five columns, marked with values and colors as follows:
The risk matrix is a tool for identifying and evaluating risks in various operations, equipment, and conditions by mapping and managing risks in a structured manner. It is useful for identifying hazards, assessing risk levels based on their impact, and prioritizing action plans that must be taken based on the identified risks. The matrix also allows companies to monitor and evaluate risks at any time and mitigate new risks [42].
The risk level and categories classify the risk categories based on color, with hazard conditions which can be explained as shown in Table 3 as follow:
A risk level of 1-4, indicated by the green color, represents a low-risk category that is acceptable without risk reduction control. A risk level of 5-9, indicated by the yellow color, represents a moderate risk category where additional control is needed with a long-term plan. A risk level of 10-12, indicated by the orange color, represents a serious risk category where the risk of danger is not expected, and a short-term control plan must be implemented. Finally, a risk level of 15-25, indicated by the red color, represents a critical/major risk category that is unacceptable, requiring immediate action for a hazardous condition control plan [42].
3. Results and Discussion
3.1. Causes of Pipe Blockage
Under normal flow conditions through a pipe network, Bernoulli’s law equation applies. In ideal fluid flow (without friction and no energy loss), fluid pressure, kinetic energy, and potential energy remain constant along the flow line [43], as shown in Figure 3:
The blockage of the pipe diameter begins with the adhesion of material deposits on the pipe wall, which gradually causes a narrowing of the pipe cross-section (Figure 4). Finally, under certain conditions, the pipe hole through which this fluid passes becomes closed or blocked [44,45].
When there is a build-up of deposit material on the pipe wall, there will be a narrowing of the pipe cross-sectional diameter (), which will cause an increase in fluid velocity (), and there will also be a pressure drop at the downstream position ().
This attached material is a hydrocarbon compound, generally composed of 1-4% sulphur and nitrogen, oxygen, metals, salts, 13% hydrogen, and 85.5% carbon. Hydrocarbons with an API specific gravity between have the characteristic of freezing on the pipe wall at the pour point temperature [46,47].
Hydrocarbon complex mixtures are formed from several chemical compound structures consisting of aromatics, iso-paraffins, naphtha, sulphur compounds, nitrogen, paraffin, asphalt, and oxygen. This chemical mixture is grouped based on solubility and polarity, which results in viscosity properties. The higher the viscosity, the greater the flow resistance and the slower the speed of flow. The higher the viscosity, the greater the resistance to flow, and the slower the speed of the hydrocarbons flowing (velocity), where these viscous properties come from the mixture that exists in hydrocarbons, especially paraffin wax and asphalt [48,49].
The American Petroleum Institute standard (API gravity unit) is a unit for the specific gravity of crude oil. API gravity below or greater than 1000 is considered extra heavy oil, API gravity from to or 920 kg/m3 to 1000 kg/m3 is in the heavy category, and API greater than or less than 870 is light oil. Viscosity is the resistance of a fluid to flow or deform, also known as a measure of fluid thickness, measured in centipoise units. The higher the centipoise number, the higher the fluid viscosity [50].
Many mixtures of chemical structures form hydrocarbon complexes, which are classified according to solubility and polarity, contributing to viscosity properties. The higher the viscosity, the greater the flow resistance and the slower the speed of hydrocarbons flowing (velocity). These viscous properties come from mixtures that exist in hydrocarbons such as paraffin, iso-paraffin, asphalt, sulphur, and others [51].
Paraffin wax is a compound that sticks to the pipe wall and forms wax crystals when the temperature is below its cloud point at 14.2 °C–37.83 °C, commonly referred to as the Wax Appearance Temperature (WAT) [51,52].
Hydrocarbons with asphalt and wax content are usually difficult to flow through pipes because the high viscosity causes congealing and sticking to the pipe wall. Gradually, the cross-sectional diameter of the pipe through which the fluid flows shrink and closes (blockage), which is a very serious problem in hydrocarbon distribution operations [52].
The problem of wax deposition has been studied by modelling using equations from the disciplines of thermodynamics, heat transfer, mass transfer, fluid dynamics, and Petro-chemistry to design piping systems and maintenance strategies. However, it is very difficult to measure the rate of deposit formation, determine the point where deposits occur, the number of deposits formed, and the area and thickness of the deposits.
3.2. Risk of Pipe Blockage
Deposits adhering to the pipe wall will reduce the diameter of the pipe cross-section flow. At one point, this pipe diameter hole will suddenly close (totally blocked) without knowing the position, amount, and area of the blockage (Figure 6). The closure of this fluid flow will cause an increase in pumping pressure at the upstream position, which will be greater than the maximum allowable working pressure, causing the weakest part of the pipe or the smallest thickness to be penetrated by its working pressure, resulting in leakage (Figure 7) [53].
The number of leakage points due to this blockage in complex and long pipelines will be difficult to determine quickly and will take a long time to address (Figure 8). Until the point of blockage is resolved, the pressure increase cannot be controlled, and the potential for leakage can occur at any time along the complex pipeline network.
This leak can occur suddenly without being noticed along the pipe network, where the leak flow rate and the fluid pressure that comes out will be very difficult to handle quickly. The anomaly that occurs should start from an abnormal increase in pressure at the upstream position, a large pressure drops at the downstream position of the pipe, and an unnatural temperature loss. This anomaly will increase in intensity over time, and if ignored without corrective action or continued operation under normal conditions, it will increase the probability of pipe damage.
Calculation of the probability of failure and damage to the pipe and assessment of the consequences of the incident are key elements of the risk assessment of pipe blockages. The assessment of the risk of pipe blockages can be started by determining the rate of sediment formation and the damage mechanisms that can occur as a result of this sedimentation, which is assessed from the beginning until the estimated failure that causes leakage.
The probabilistic method is an assessment that is estimated to determine the possibility of failure, where the limit state approach is also applied so that the assessment results are more precise and not confusing. This limit state is influenced by inherent variables that are random and uncertain but can be modelled with probability theory. Risk assessment based on the probability of occurrence in the form of the release of toxic and hazardous gases that can cause fires, explosions, and respiratory disorders can be regulated based on the characteristics of the mixture of hydrocarbons that pass through the piping system.
The assessment of the risk of environmental pollution is based on the geographical risk passed by the pipeline network, which can be in the form of forests, rivers, seas, gardens, and other environmental ecosystems. The more difficult the geographical topography and the larger the area of the complex area with plant ecology and animal biota, the greater the risk will be assessed.
From the company’s perspective, it is used to assess the social risks caused by the assessment by calculating the impact on the health and activities of the surrounding community. If there are casualties, there is a non-linear relationship between the risk and the number of fatalities that can be calculated as a high level of social disruption risk that can affect the company’s reputation, the potential for large compensation payments for death and health recovery, termination of operating permits, and company closure by the government.
3.3. Identifying Pipe Blockage Hazard
Several hazards can be identified in the case of an unmonitored pipe blockage, namely the occurrence of overpressure upstream of the pipe, which will cause the pipe to rupture because it is unable to withstand the pressure (operating pressure above the maximum allowable working pressure).
Leaks that occur can result in oil spills, toxic gases, and flammable gases that can cause hazardous exposure to the surrounding environment and community. If not immediately isolated, they can cause environmental pollution due to crude oil seeping into the ground (oil spill) or polluting water bodies, endangering local ecosystems and requiring high costs for the clean-up process. Toxic gas leaks cause respiratory problems, such as hydrogen sulphide () gas, which can cause asphyxiation (lack of oxygen) and death of plants within a certain radius. The release of flammable gases causes fires and explosions that endanger lives and property. In addition, there is a risk that the company will experience a potential loss of production due to unplanned shutdowns to handle leaks.
The probability value of the possibility of the identified risk occurring can be used to assess the likelihood of the risk occurring according to Table 4 as follows:
Environmental damage becomes a certainty that occurs in the future if the blockage causes a leak, where the possibility of occurring is more than 80%, while the danger of overpressure will tend to increase from 50% to 80%, the same as the danger of fire and explosion and the potential for loss of production. The danger of hazardous and toxic gases and respiratory disorders will occur under certain conditions, such as leaks at higher ambient temperatures and wind flow in all directions, so it is only worth 20%–50%.
From Figure 9, it is very clear that environmental pollution has the greatest possibility of occurring compared to other potential hazards. This is because no matter how much crude oil is spilled, it will always result in environmental pollution on land and in water, where the only difference is the area contaminated by the volume of crude oil spilled. The dangers of overpressure, fire, explosion, and the potential for production loss are at the same probability value because pipeline blockages that can be identified too late can be minimized by stopping production and closing the flow in the blocked pipeline.
Meanwhile, the severity level is calculated using Table 2 severity assessment parameters, as shown in the following Table 5:
Meanwhile, hazardous and toxic gas leaks that can cause death depend on the chemical mixture contained in hydrocarbons, such as light hydrocarbon gases (methane, ethane, propane, and butane), which, in addition to causing dizziness, nausea, and hallucinations, can also form explosive mixtures in the air. Hydrogen sulphide () content at high doses can cause fainting, respiratory paralysis, and death. Hydrocarbons containing carbon monoxide (CO), carbon dioxide (), nitrogen oxide (), and sulphur oxide () can irritate the respiratory tract, causing headaches and respiratory disorders. At high concentrations, they can cause respiratory arrest.
The severity of the hazards is assessed based on the aspects of health and safety, environmental impact, reputation, and asset damage. From the health and safety aspect, all hazards except the potential loss of production are rated five because they can cause more than one fatality and impact the environment, such as causing smoke from fires and spreading fire to the surrounding area.
For the environmental impact aspect, hazardous and flammable gas leaks and environmental pollution are rated five because they will cause an oil spill of more than 500 barrels, causing permanent environmental damage. As a result, the company must provide special compensation to the affected community (economic losses). For this incident, a special team is needed to handle it. In the aspect of the company’s reputation, hazardous and toxic gas, fire and explosion, and environmental pollution are rated five because they will have an impact on reputation damage due to negative news from national and international media, disrupting society and violating the law, resulting in demands for rehabilitation and even demands to stop or close the operating permit.
For aspects that impact the environment, toxic and hazardous gas leaks, environmental pollution, and respiratory disorders are rated 5 because the hazards that occur require a very long time for the recovery process. From the aspect of company reputation, the severity of toxic and hazardous gas leaks, fire, and environmental contamination are also rated at the maximum because damage to this reputation can result in the termination of management permits by the government or the termination of hydrocarbon sales and purchase contracts with partners, thus affecting the company’s finances. As for the aspect of asset damage, fire and explosion hazards and environmental pollution are rated 5 because these hazards can cause the loss and damage of assets used by the company to produce hydrocarbons.
Aspects of asset damage, fire, and explosion hazards, and environmental damage are rated five because they will likely cause losses of more than USD 20,000,000, a decrease of more than 75% in daily production, and a stoppage of production for more than 30 days. Of all the aspects identified and assessed, the highest severity level is the leakage of hazardous and toxic gases, fire and explosion, and environmental damage. From the possible risks and severity, the risk levels can be identified as follows:
The risk level is then calculated by identifying the possibility and severity (Table 6). The highest risk level is 25 for environmental pollution, fire, and explosion, and hazardous and toxic gases. This risk is unacceptable, and a control action plan must be carried out immediately before a dangerous event occurs. If it occurs, action must be taken immediately by involving all stakeholders and rapid response teams from within and outside the company. Improvement efforts must also align with improvements in administrative documents, such as improvements to safety and environmental designs, procedures, and documents, and changes to critical management.
From Figure 11, it is known that the probability of occurrence is inversely proportional to the severity of each identified hazard (overpressure, hazardous and toxic gases, fire and explosion, environmental pollution, economic loss, and loss of production). Environmental pollution is very likely to occur with a high level of severity, almost the same as fire and explosion. While the danger of hazardous and toxic gases is still influenced by the composition of hydrocarbons, even though the severity level is at its maximum value, the probability of occurrence is smaller than that of fire and explosion. Loss of production will occur but is considered low for the severity level because it is considered that loss of production is only a delay in the hydrocarbons that will be produced. From the possible risk levels that have been calculated from the probability and severity levels, the risk levels can then be plotted on the risk matrix as follows:
The risk matrix shows that the red risks are environmental pollution, fire and explosion, and leakage of hazardous and toxic gases. From this risk matrix, the company can identify and evaluate risks in various modes of operating conditions and equipment so that risks can be managed and mapped in a structured manner by preparing all company resources to prevent the risk of danger from occurring. This includes conducting administrative controls and periodic checks, updating procedures periodically, finding the right method to avoid blockage or methods for finding blockage points, and complying with applicable standards and regulations. All preventive measures are arranged based on priorities and hazards that have been identified. From the matrix description, appropriate and fast actions can be decided immediately with effective and efficient resource management, periodic risk monitoring and evaluation, and socialization to improve a good culture for managing risks so that they do not become hazards that threaten the environment’s and the company’s sustainability.
This is in line with the costs that have been incurred for recovery in several cases that have occurred, based on the order of severity and risk level, as follows:
The oil spill in the Gulf of Mexico damaged the marine and coastal ecosystem and ecology due to the spill of 4 million barrels of oil for 3 months, which required a cost of USD 65 billion for handling and recovery [54]. The Piper Alpha fire and explosion in northeast Scotland caused 167 fatalities, which required a cost of USD 3.4 billion for repairs and compensation [55]. In the Bhopal accident case in India, toxic and hazardous gases caused thousands of fatalities and had long-term impacts on health and the environment, with recovery and compensation costs of USD 3 billion [56]. The overpressure incident in an old pipe, which caused major damage to surrounding settlements and claimed lives, occurred in the PG&E gas pipeline in the San Bruno area [16]. Economic losses of USD 54 billion occurred in the case of crude oil pipeline blockage in Nigeria, as well as the incident at Lake Nyos in Cameroon, Central Africa, which claimed many lives due to respiratory problems [57]. Finally, in the case of the Nord Stream Gas Pipeline, production losses amounted to 478,000 tons of [14].
3.4. Risk Mitigation
In order to prevent disasters caused by pipeline spills, risk mitigation is carried out as an effort to reduce the risk impact of this event, which is detrimental to the global environment and society. Mitigating the risk of this incident starts from the planning and design of the pipe, which must be calculated based on environmental conditions, fluid flow, nature, and characteristics of the fluid passing through it. This opinion was also conveyed by Palmer-Jones et al., 2006 [58] at the International Pipeline Conference in Canada, where pipe design, operation, inspection, and repair must be considered in the pipeline risk management system.
Strengthening the pipe layer with anti-corrosion materials, equipping the pipe with heaters and insulation, and equipping it with chemical injector facilities are the best choices for piping systems passing through disaster-prone and densely populated routes. Price et al. also conveyed the same opinion at the 2007 International Ocean and Polar Engineering Conference [59] for the use of anti-corrosion insulation on offshore pipelines.
The combination of advanced technology, rapid response, and careful planning is joint mitigation that must be prepared as a preventive measure, detection, and rapid action so that the impacts can be minimized. This is in accordance with the opinion of Tatiparthi et al., 2025, who suggested the use of Fiber Bragg Grating (FBG) sensors to detect blockages in real-time [60]. However, this combination will only be successful if supported by comprehensive and accurate field data, resulting in more sophisticated technological improvements and fast and precise responses. In addition, a deeper analysis of the level of research success needs to be synchronized with the cost-benefit analysis and performance of the pipeline facilities so that all risks and hazards that have been conveyed can be minimized.
Installation of monitoring and detection systems to monitor pipe flow, temperature, and pressure in real-time so that anomalous events can be analyzed immediately. Conduct internal pipe cleaning and periodic inspections with intelligent pigs and drone technology for pipe damage detection. Kim et al., 2024 developed a real-time deep learning-based pipe monitoring method that can save the cost of pipe flow simulator licenses [61]. Conducting regular and scheduled maintenance and repairs by providing a dedicated emergency response team, as well as complete materials and equipment for immediate response, where this emergency response event has been regulated in a special procedure that has an organizational structure and a team that has been trained and tested to deal with leakage events.
Provide specialized equipment to locate spills, such as booms and oil spill absorbent materials, to reduce the spread of oil spills that cause environmental pollution. Conduct audits and risk management periodically to assess and identify potential hazards, equipped with the history and results of inspections and repairs that have been carried out, so that the possibility of the occurrence of this leakage event can be measured and estimated.
Obtaining the right method to determine the exact location of the blockage in the pipeline, including the number of blockages, length, and thickness of the blockages that occur, so that proper handling of blockage events can be carried out immediately. This method of determining the location of the blockage must be established in a procedure so that it can be used as a guide to prevent repeated events from becoming a hazard in the future. Compliance with a country’s regulatory rules and following international standards (API) is something that must be done as an emergency preparedness step, and things that may conflict with local and international laws so as not to increase company losses that cause the termination of the oil and gas industry management license contract.
4. Conclusions
The identification of hazards and risks of hydrocarbon pipeline blockage must be carried out as a basis for the company to conduct a risk register that threatens its continuity. There are five major hazards identified from the possibility of hydrocarbon pipeline blockage, with the highest risk level being environmental damage at 28%, fire and explosion at 22%, hazardous and toxic gases at 17%, overpressure at 13%, economic losses at 11%, and potential loss of production at 9%, with an environmental restoration cost of 88.6%.
Environmental pollution has the possibility of occurring in the near future, namely a possibility of over 80% with a critical/severe level of severity that endangers health and safety (5), which can result in the death of more than 1 person, an impact on the environment (5) or an uncontrolled oil spill of more than 500 barrels, reputation (5) will be reviewed badly by the international media and the possibility of a violation of the law and damage to company assets (5) with losses of more than USD 20,000,000 or a possibility of a 75% decrease in production with a 30-day production stoppage.
Environmental pollution is the most difficult risk to recover from because it damages marine, coastal, and forest ecosystems and the ecological life of wildlife, contaminates soil and water, which disrupts the balance of microorganisms and soil fertility, where crude oil naturally takes time to decompose, leaving residues that are still toxic, thus disrupting the human socio-economic community. The cost of environmental and ecosystem restoration accounts for 88.6% of the total cost of restoration and remediation due to hydrocarbon spills.
High costs must be incurred for the recovery process, payment of fines, payment of compensation, repair and handling costs, and the possible closure of production for a long time and dealing with legal sanctions at a national and global level.
Author Contributions
Hamdani Wahab: Methodology, data collection, formal analysis, visualization, writing—original draft preparation, Nur Islami: Methodology, conceptualization, reviewing, Reni Suryanita: Conceptualization, reviewing, Amun Amri: Conceptualization, reviewing, Zuchra Helwani: Conceptualization, reviewing, Awaludin Martin: Methodology, conceptualization, reviewing.
Conflicts of Interest
Disclose any conflicts of interest, or explicitly state "The authors declare no conflicts of interest." Authors are required to disclose and acknowledge any personal circumstances or interests that may be perceived as inappropriately influencing the representation or interpretation of the research results.
References
- Cui, X.; Lai, W.; Lin, T. Long-distance water infrastructure, rural development and urban growth: Evidence from China. Journal of Urban Economics 2025, 146, 103736. [Google Scholar] [CrossRef]
- Hemeda, S.; Akarish, A.I.; El-Nagga, A.A.; et al. Engineering investigations and durability problems of the construction materials of the Roman Babylon of Egypt. Open Journal of Geology 2018, 8, 404. [Google Scholar] [CrossRef]
- Tarbell, I.M. The History of the Standard Oil Company (2 Volumes in 1); Cosimo, Inc.: New York, 2010. [Google Scholar]
- Samaei, S.R.; Ghahfarrokhi, M.A. A revolution in subsea energy transmission: harnessing the power of artificial intelligence for optimal pipeline design and execution. In Proceedings of the 2th International Conference on Creative achievements of architecture, urban planning, civil engineering and environment in the sustainable development of the Middle East; 2023. [Google Scholar]
- Roncevic, A.; Kovac, M.; Malenica, M. The Influence of Geopolitical Tensions on the Economy of the Druzhba Oil Pipeline. Economic and Social Development: Book of Proceedings 2023, pp. 360–366.
- Zhang, J.; Zheng, H.; He, W.; Huang, W. West-east gas pipeline project. Frontiers of Engineering Management 2020, 7, 163–167. [Google Scholar] [CrossRef]
- Wood, T. The many voices of business: Framing the Keystone pipeline in US and Canadian news. Journalism 2019, 20, 292–312. [Google Scholar] [CrossRef]
- Harris, S.J.; Schwietzke, S.; France, J.L.; Velandia Salinas, N.; Meixus Fernandez, T.; Randles, C.; Guanter, L.; Irakulis-Loitxate, I.; Calcan, A.; Aben, I.; et al. Methane emissions from the Nord Stream subsea pipeline leaks. Nature 2025, pp. 1–7.
- Swarz, R.S. The Trans-Alaska pipeline system: a systems engineering case study. In Proceedings of the Complex Systems Design & Management: Proceedings of the Seventh International Conference on Complex Systems Design & Management, CSD&M Paris 2016. Springer, 2016, pp. 17–27.
- Voytyuk, O. New Gas Pipelines as an Element of the Geopolitical Competition of Algeria and Morocco in Africa. African Journal of Economics, Politics and Social Studies 2023, 2, 21–44. [Google Scholar] [CrossRef]
- Pluvinage, G.; Elwany, M.H. Safety, reliability and risks associated with water, oil and gas pipelines; Springer Science & Business Media, 2007.
- Acheampong, T.; Kemp, A.G. Health, safety and environmental (HSE) regulation and outcomes in the offshore oil and gas industry: Performance review of trends in the United Kingdom Continental Shelf. Safety Science 2022, 148, 105634. [Google Scholar] [CrossRef]
- Taylor, A. Dorset’s Black Gold: A History of Dorset’s Oil Industry; Amberley Publishing Limited, 2021.
- Poursanidis, K.; Sharanik, J.; Hadjistassou, C. World’s largest natural gas leak from nord stream pipeline estimated at 478,000 tonnes. Iscience 2024, 27. [Google Scholar] [CrossRef] [PubMed]
- ASSESSMENT, F.E.; IMPACT, F.O.N.S. US DEPARTMENT OF TRANSPORTATION PIPELINE AND HAZARDOUS MATERIALS SAFETY ADMINISTRATION.
- Davidson, R.A.; Kendra, J.; Li, S.; Long, L.C.; McEntire, D.A.; Scawthorn, C.; Kelly, J. San Bruno California, September 9, 2010 gas pipeline explosion and fire. Technical report, Disaster Research Center, 2012.
- Beemaraj, S.B.; Muhammed, B.; Joshi, A.; Coche, E.; Chanet, A. A framework for early-stage automated layout design of subsea production system. Ocean Engineering 2024, 297, 117175. [Google Scholar] [CrossRef]
- Muhammed, B.; Beemaraj, S.B.; Joshi, A.; Chanet, A.; Coche, E. A novel approach for early-stage automated flowline design. Ocean Engineering 2023, 277, 114351. [Google Scholar] [CrossRef]
- Wang, Y.; Wang, Q.; Zhang, Y.; Yue, Q.; Zhang, X. Optimization of subsea production facilities layout based on cluster manifold system considering seabed topography. Ocean Engineering 2024, 291, 116575. [Google Scholar] [CrossRef]
- Silva, L.; Soares, C.G. Robust optimization model of an offshore oil production system for cost and pipeline risk of failure. Reliability Engineering & System Safety 2023, 232, 109052. [Google Scholar] [CrossRef]
- Aven, T.; Pedersen, L.M. On how to understand and present the uncertainties in production assurance analyses, with a case study related to a subsea production system. Reliability Engineering & System Safety 2014, 124, 165–170. [Google Scholar] [CrossRef]
- Woldesellasse, H.; Tesfamariam, S. Risk assessment of gas pipeline using an integrated Bayesian belief network and GIS: Using Bayesian neural networks for external pitting corrosion modelling. The Canadian Journal of Chemical Engineering 2025, 103, 98–109. [Google Scholar] [CrossRef]
- Shabani, M.; Kadoch, M.; Mirjalili, S. A novel metaheuristic-based approach for prediction of corrosion characteristics in offshore pipelines. Engineering Failure Analysis 2025, 170, 109231. [Google Scholar] [CrossRef]
- Yang, R.; Schell, C.A.; Rayasam, D.; Groth, K.M. Hydrogen impact on transmission pipeline risk: Probabilistic analysis of failure causes. Reliability Engineering & System Safety 2025, 257, 110825. [Google Scholar] [CrossRef]
- Bhattacharyya, S.; Cheliyan, A. Optimization of a subsea production system for cost and reliability using its fault tree model. Reliability Engineering & System Safety 2019, 185, 213–219. [Google Scholar] [CrossRef]
- Wang, J.; Yang, J.; Sen, P.; Ruxton, T. Safety based design and maintenance optimisation of large marine engineering systems. Applied Ocean Research 1996, 18, 13–27. [Google Scholar] [CrossRef]
- Silva, L.; Soares, C.G. Optimisation of offshore oilfield development including the risk of failure of subsea manifolds. Ocean Engineering 2025, 324, 120668. [Google Scholar] [CrossRef]
- Alijani Mamaghani, O.; Zolfaghari, M. An approach for facilities manager to reducing risks in gas pipelines through sensors and data intelligentization in BIM. Journal of facilities management 2025, 23, 141–159. [Google Scholar] [CrossRef]
- Dao, U.; Adumene, S.; Sajid, Z.; Yazdi, M.; Islam, R. A Bayesian network-based susceptibility assessment model for oil and gas pipelines suffering under-deposit corrosion. The Canadian Journal of Chemical Engineering 2025, 103, 126–136. [Google Scholar] [CrossRef]
- Zheng, Y.; Dong, Z.; Zhang, X.; Shi, H. Random risk assessment model and risk-based maintenance decisions for natural gas pipelines. Journal of Loss Prevention in the Process Industries 2025, 95, 105591. [Google Scholar] [CrossRef]
- Inman, M.; Aitken, G.; Zimmerman, S. Europe Gas Tracker Report. Global Energ y Monitor 2021. [Google Scholar]
- Fąfara, Z.; Matuła, R. Prędkość rozchodzenia się w rurociągu fali ciśnienia powstałej po uderzeniu hydraulicznym 2024.
- Kovačević, N.; Stojiljković, A.; Kovač, M. Application of the matrix approach in risk assessment. Operational Research in Engineering Sciences: Theory and Applications 2019, 2, 55–64. [Google Scholar] [CrossRef]
- Bartolini, S.; Martí, J.; Sobradelo, R.; Becerril, L. Probabilistic e-tools for hazard assessment and risk management. Volcanic unrest 2017, p. 47.
- Pettitt, G.; Morgan, B. A tool to estimate the failure rates of cross-country pipelines. In Hazards XXI: Process Safety and Environmental Protection in a Changing World; IChemE London, 2009; Vol. 294, p. 302.
- Barton, N.A.; Hallett, S.H.; Jude, S.R.; Tran, T.H. Predicting the risk of pipe failure using gradient boosted decision trees and weighted risk analysis. Npj Clean Water 2022, 5, 22. [Google Scholar] [CrossRef]
- Li, C.; Zhang, Y.; Jia, W.; Hu, X.; Song, S.; Yang, F. Blockage detection techniques for natural gas pipelines: A review. Gas Science and Engineering 2024, 122, 205187. [Google Scholar] [CrossRef]
- Berg, H.P. Risk management: procedures, methods and experiences. Reliability: Theory & Applications 2010, 5, 79–95. [Google Scholar]
- Aydin, N.; Seker, S.; Şen, C. A new risk assessment framework for safety in oil and gas industry: Application of FMEA and BWM based picture fuzzy MABAC. Journal of Petroleum Science and Engineering 2022, 219, 111059. [Google Scholar] [CrossRef]
- Standard, I.; Standard, N.Z. ISO 31010: Risk Management—Risk Assessment Techniques. International Organization for Standardization: Geneva, Switzerland 2019.
- Makajić-Nikolić, D. ISO 31000: Risk Management Guidelines. In Encyclopedia of Sustainable Management; Springer, 2020; pp. 1–4.
- Kline, J.J.; Hutchins, G. Enterprise risk management: A global focus on standardization. Global Business and Organizational Excellence 2017, 36, 44–53. [Google Scholar] [CrossRef]
- Hasnizam, P.A.; Taib, I.; Fadillah, S.N.K. Investigate How the Height Difference Affects the Flow Rate by Use Siphon System. Semarak Journal of Thermal Fluid Engineering 2025, 4, 25–34. [Google Scholar] [CrossRef]
- Elkatory, M.R.; Soliman, E.A.; El Nemr, A.; Hassaan, M.A.; Ragab, S.; El-Nemr, M.A.; Pantaleo, A. Mitigation and remediation technologies of waxy crude oils’ deposition within transportation pipelines: A review. Polymers 2022, 14, 3231. [Google Scholar] [CrossRef]
- Liu, Z.; Lv, S.; Ma, X.; Liu, C. Study on the Bridge Plugging Law of Pipeline Particles in Liquid-Solid System. Highlights in Science, Engineering and Technology 2025, 126, 155–162. [Google Scholar] [CrossRef]
- Barros, E.V.; Filgueiras, P.R.; Lacerda Jr, V.; Rodgers, R.P.; Romão, W. Characterization of naphthenic acids in crude oil samples–A literature review. Fuel 2022, 319, 123775. [Google Scholar] [CrossRef]
- Cauduro, V.H.; Alessio, K.O.; Gomes, A.O.; Flores, E.M.; Muller, E.I.; Duarte, F.A. A simple, fast and green method for API gravity, density, sulfur and nitrogen determination in crude oil by ATR-FTIR. Microchemical Journal 2024, 200, 110348. [Google Scholar] [CrossRef]
- Guo, K.; Li, H.; Yu, Z. In-situ heavy and extra-heavy oil recovery: A review. Fuel 2016, 185, 886–902. [Google Scholar] [CrossRef]
- Simanzhenkov, V.; Idem, R. Crude oil chemistry; Crc Press, 2003.
- Leiroz, A.; Azevedo, L. Studies on the mechanisms of wax deposition in pipelines. In Proceedings of the Offshore Technology Conference. OTC, 2005, pp. OTC–17081.
- Klass, A.B.; Meinhardt, D. Transporting oil and gas: US infrastructure challenges. Iowa L. Rev. 2014, 100, 947. [Google Scholar]
- Wang, C.S.; Ma, Q.L.; Lv, X.F.; Zhang, J.; Liu, Y.; Zhou, S.D. Experimental study on wax deposition of highly paraffinic oil in intermittent gas-oil flow in pipelines. Petroleum Science 2024, 21, 2080–2088. [Google Scholar] [CrossRef]
- Aumuller, J.J.; Carucci, V.A. MOP, MAOP, DP and MAWP: Understanding the Differences to Avoid Unnecessary Costs. In Proceedings of the Pressure Vessels and Piping Conference. American Society of Mechanical Engineers, 2013, Vol. 55645, p. V01BT01A059.
- Kwok, R.K.; Jackson, W.B.; Curry, M.D.; Stewart, P.A.; McGrath, J.A.; Stenzel, M.; Huynh, T.B.; Groth, C.P.; Ramachandran, G.; Banerjee, S.; et al. Association of Deepwater Horizon oil spill response and cleanup work with risk of developing hypertension. JAMA network open 2022, 5, e220108–e220108. [Google Scholar] [CrossRef]
- Drysdale, D.; Sylvester-Evans, R. The explosion and fire on the Piper Alpha platform, 6 July 1988. A case study. Philosophical Transactions of the Royal Society of London. Series A: Mathematical, Physical and Engineering Sciences 1998, 356, 2929–2951. [Google Scholar] [CrossRef]
- Saraf, S.; Karanjikar, M. Literary and economic impact of the Bhopal gas tragedy. Journal of loss prevention in the process industries 2005, 18, 274–282. [Google Scholar] [CrossRef]
- Apuke, O.D. Exploring the issues in oil production in the Niger Delta region of Nigeria security challenges and suggested solutions. Arabian Journal of Business and Management Review (Oman Chapter) 2017, 6, 59–83. [Google Scholar] [CrossRef]
- Palmer-Jones, R.; Turner, S.; Hopkins, P. A new approach to risk based pipeline integrity management. In Proceedings of the International Pipeline Conference, 2006, Vol. 42622, pp. 811–823.
- Price, J.C.; Laws, P. Coating And Insulation Selection For Corrosion Protection And Flow Assurance of Offshore Pipelines And Risers. In Proceedings of the ISOPE International Ocean and Polar Engineering Conference. ISOPE, 2007, pp. ISOPE–I.
- Tatiparthi, S.R.; De Costa, Y.G.; Wyllie, D.; Zhong, R.Y.; Hu, S.; Yuan, Z.; Whittaker, C.N.; Zhuang, W.Q. Real-Time detection of sewer water levels and blockages using UHF-RFID sensors. Water Research 2025, 278, 123380. [Google Scholar] [CrossRef] [PubMed]
- Kim, J.; Yoon, H.; Hwang, S.; Jeong, D.; Ki, S.; Liang, B.; Jeong, H. Real-time monitoring of CO2 transport pipelines using deep learning. Process Safety and Environmental Protection 2024, 181, 480–492. [Google Scholar] [CrossRef]
Figure 1.
Methodology for hazard identification and risk matrix.
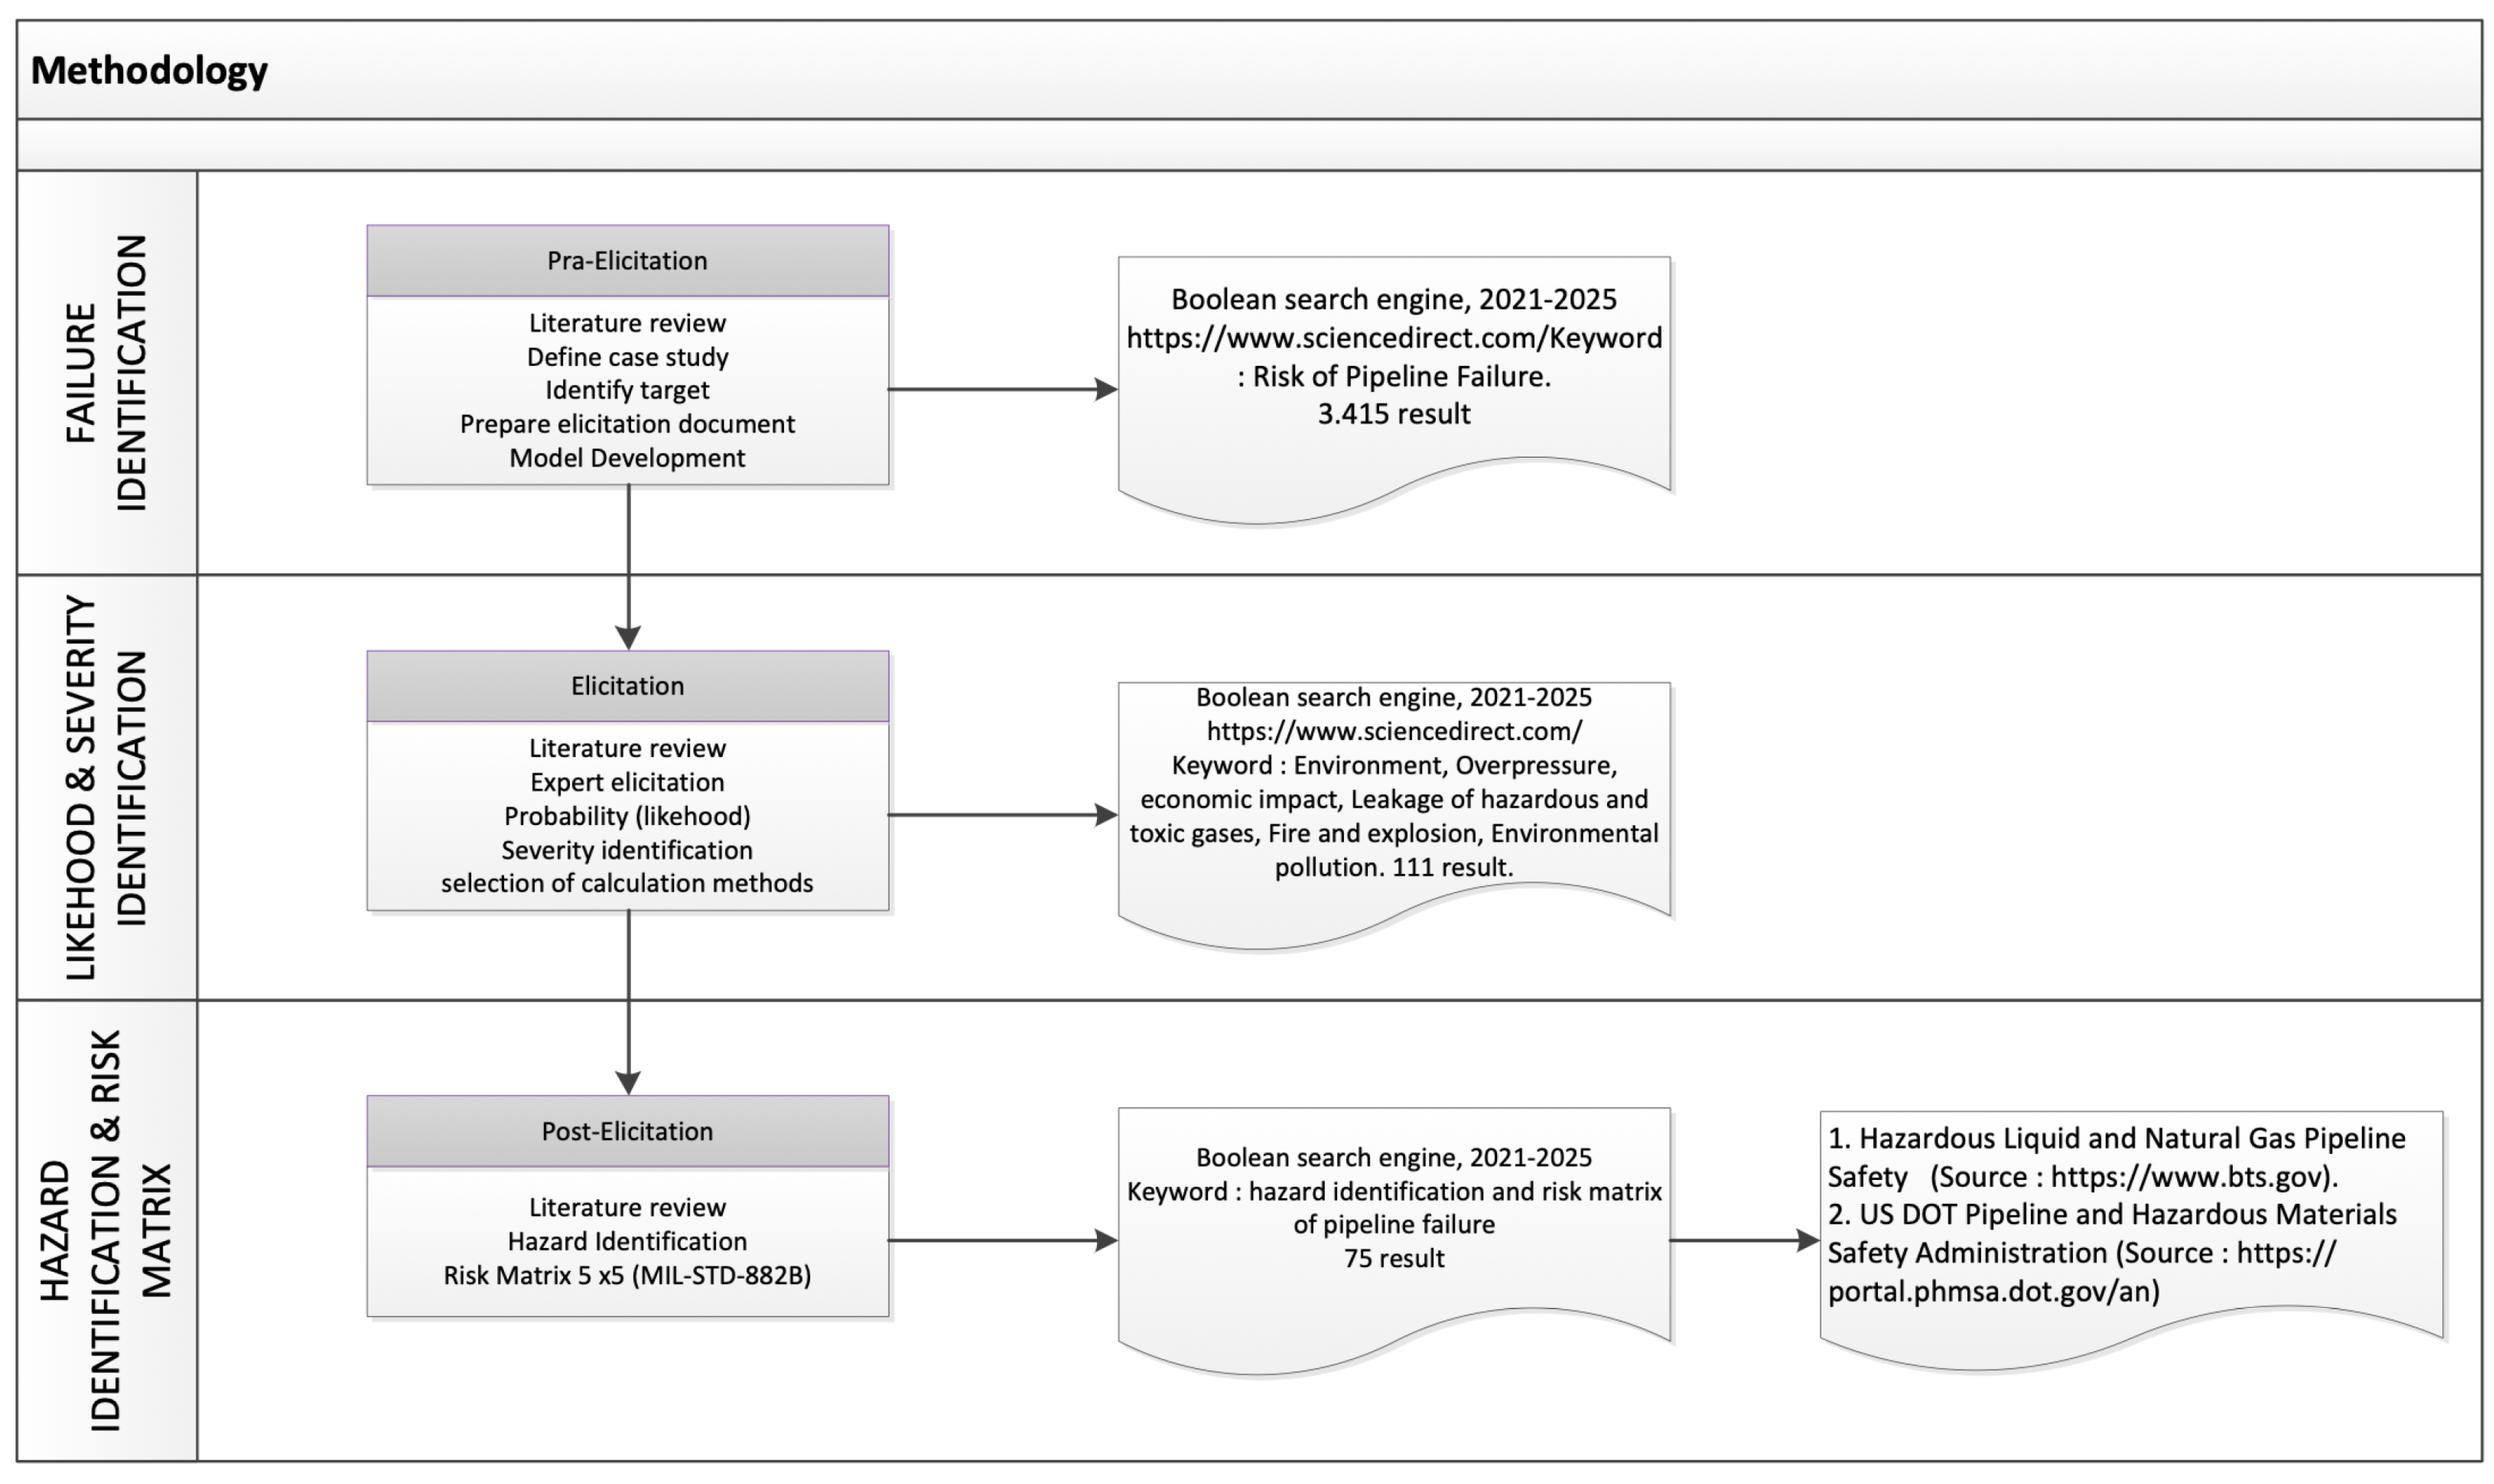
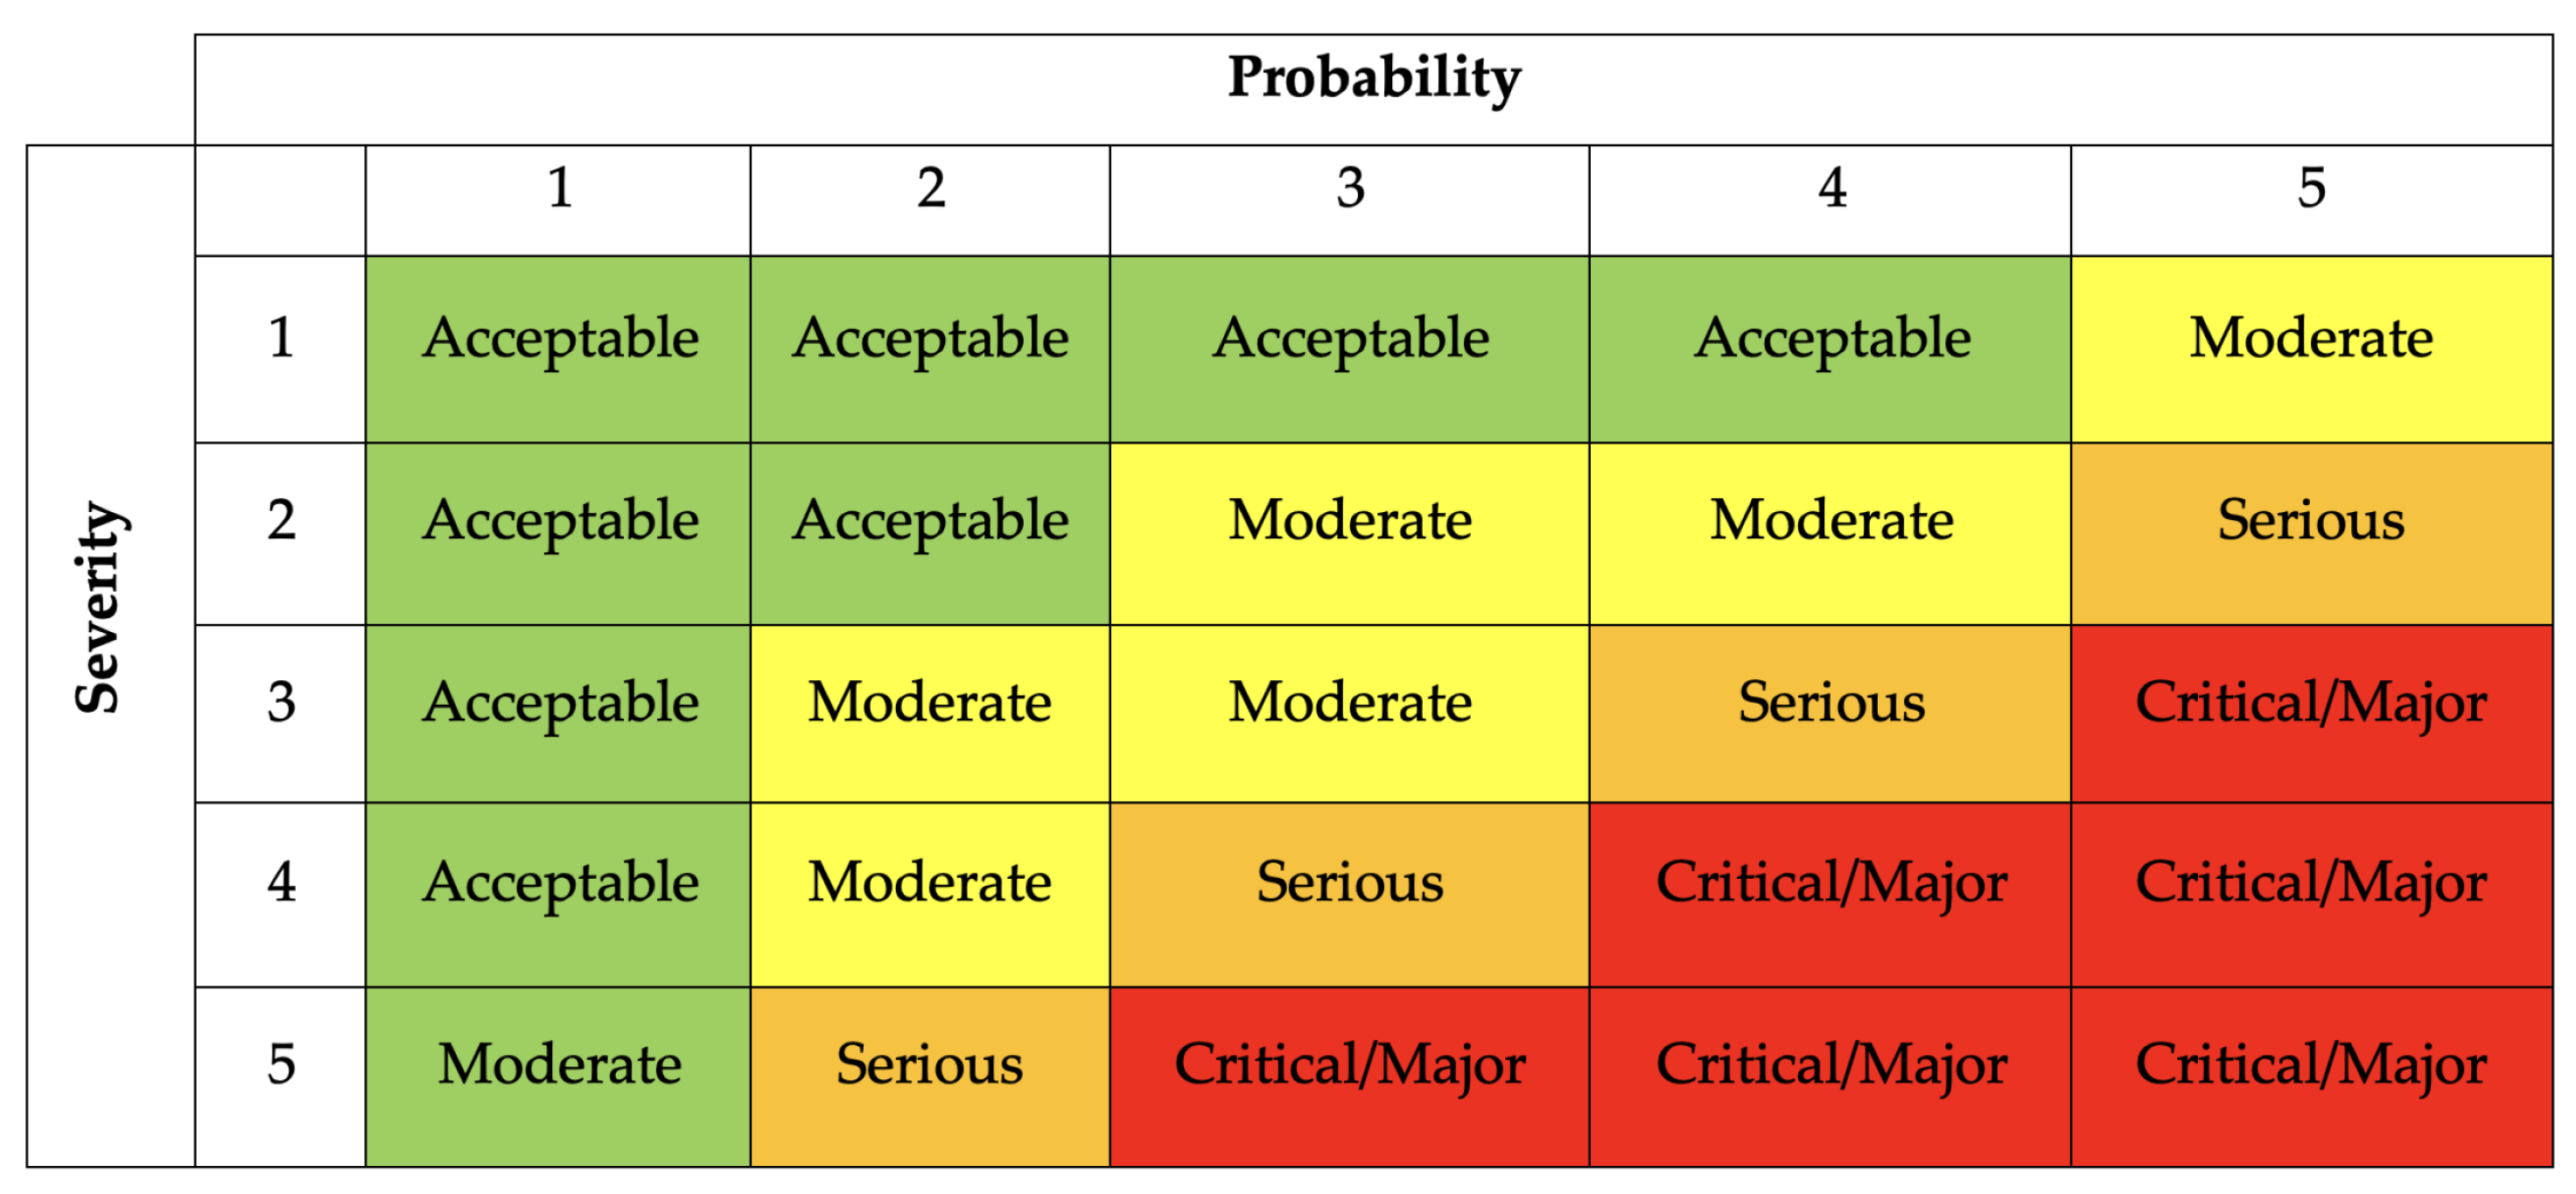
Figure 3.
Normal flow conditions of the pipe according to Bernoulli’s law.
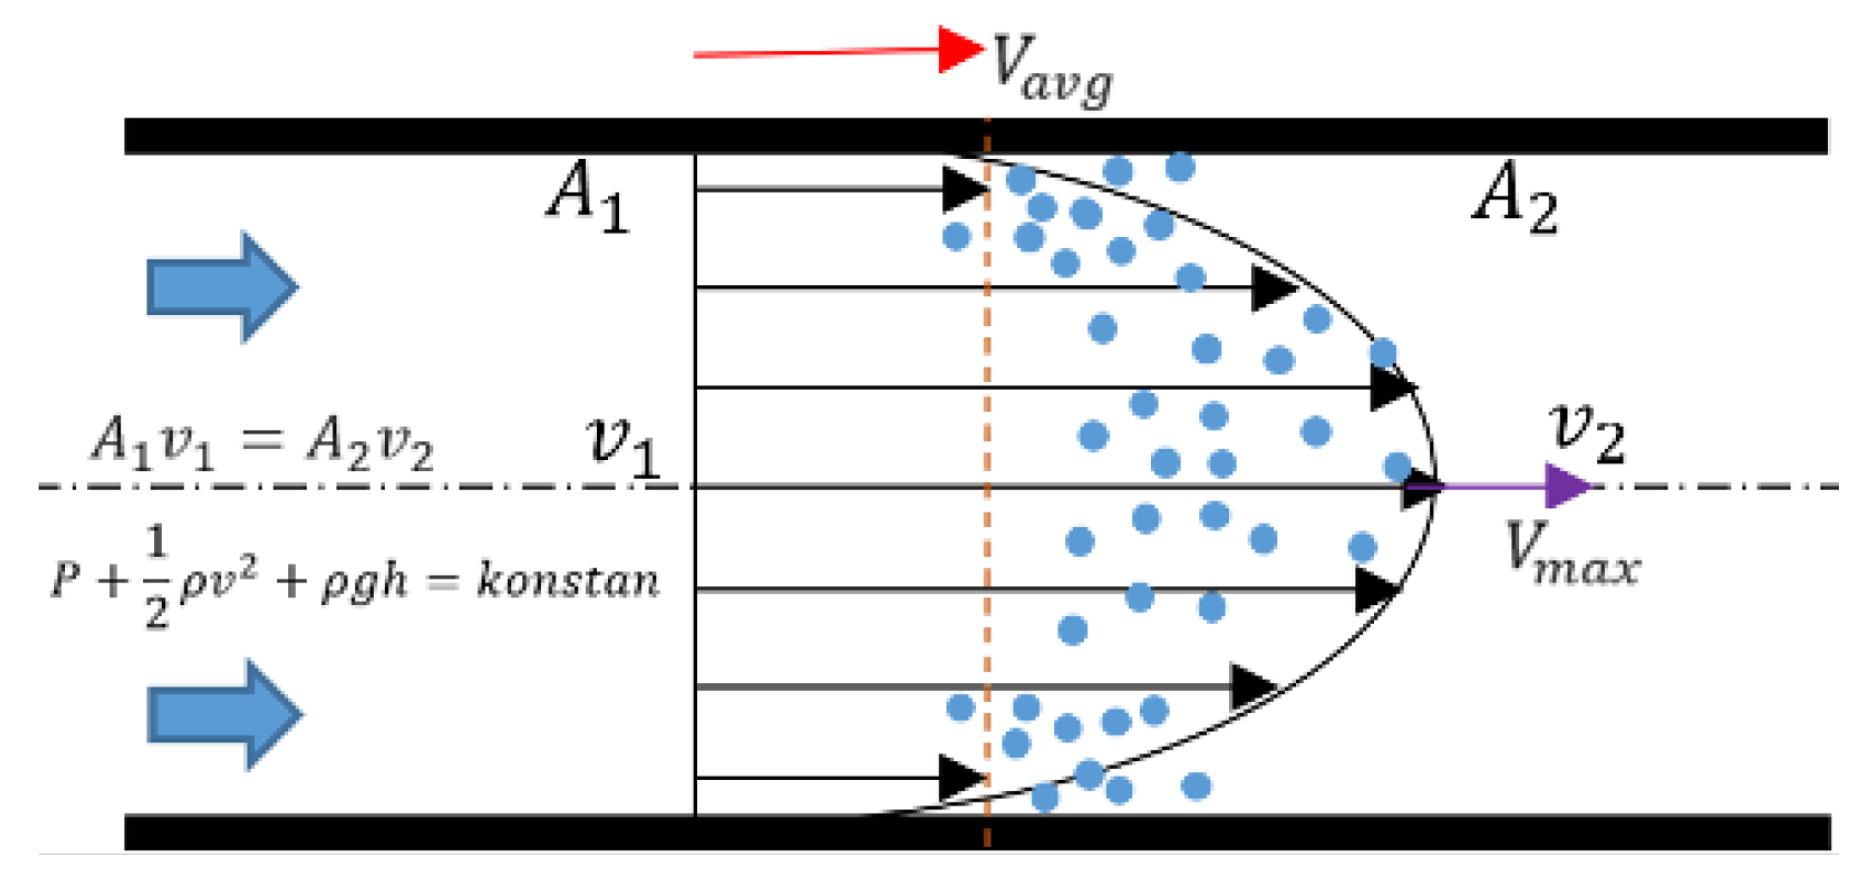
Figure 4.
Start of formation of deposits on pipe walls.
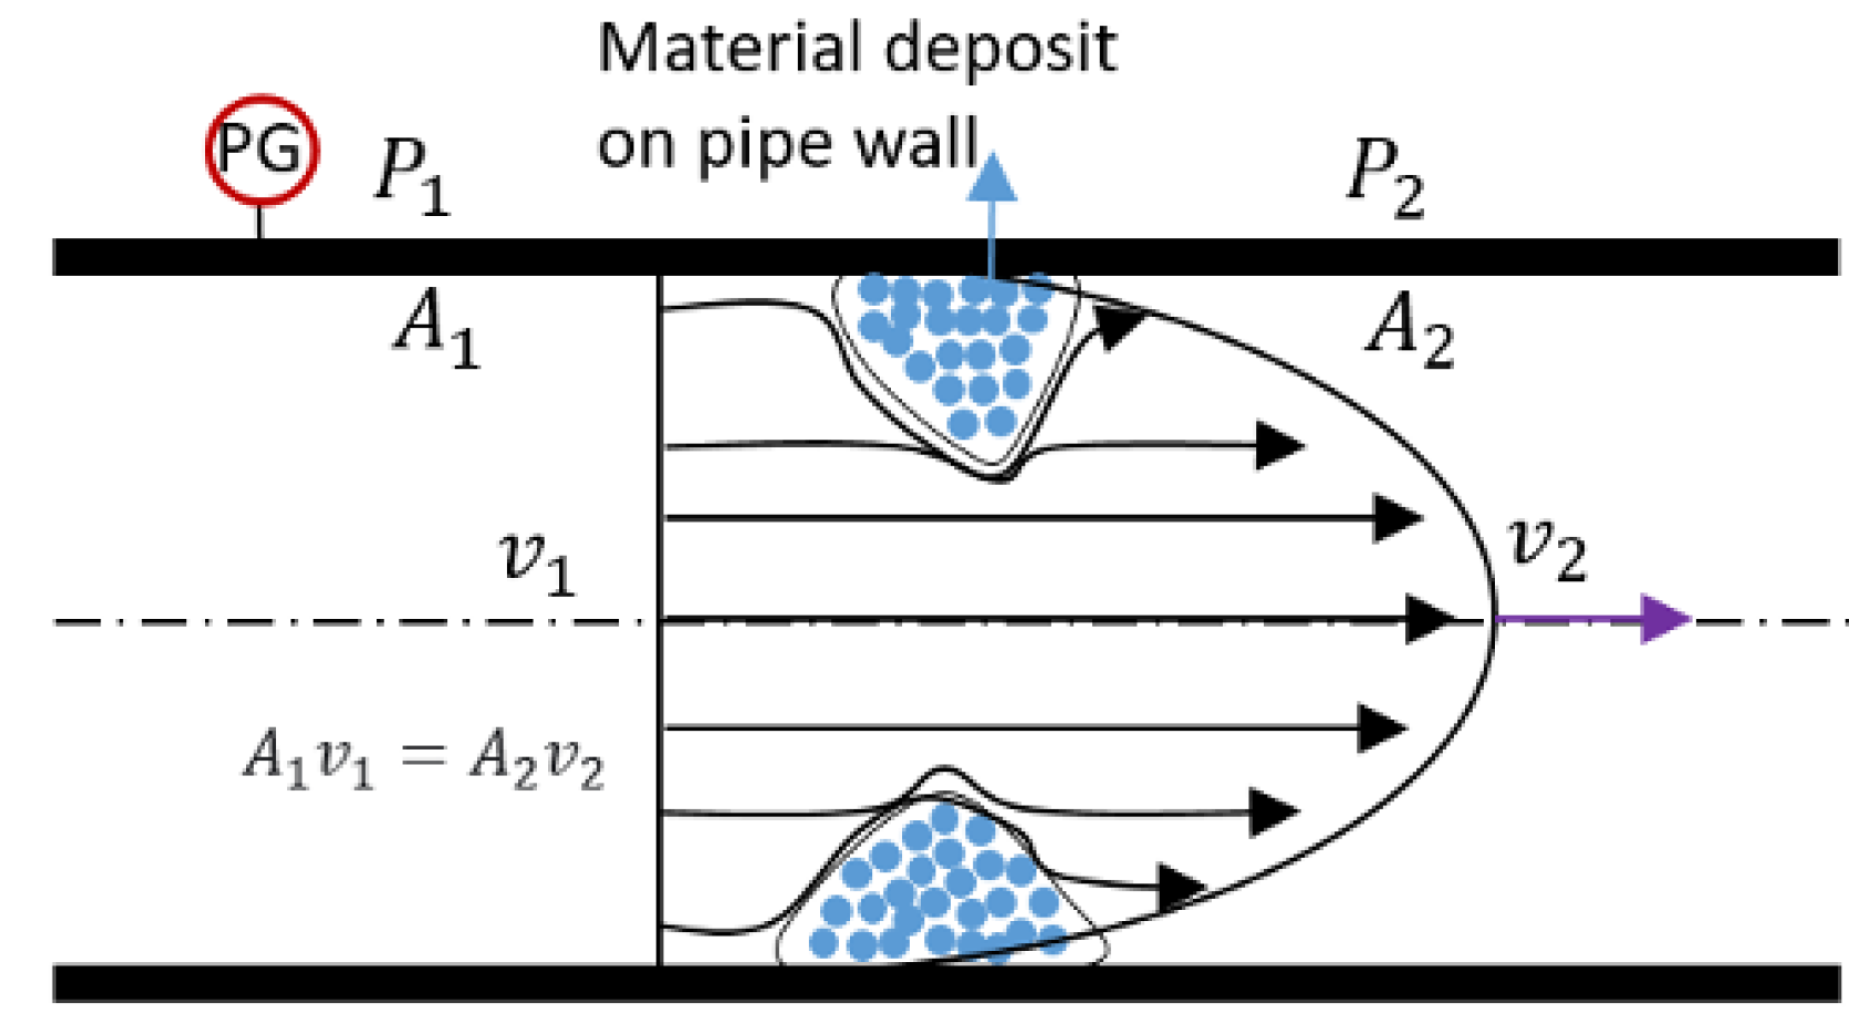
Figure 5.
Wax and asphalt deposit in pipeline.
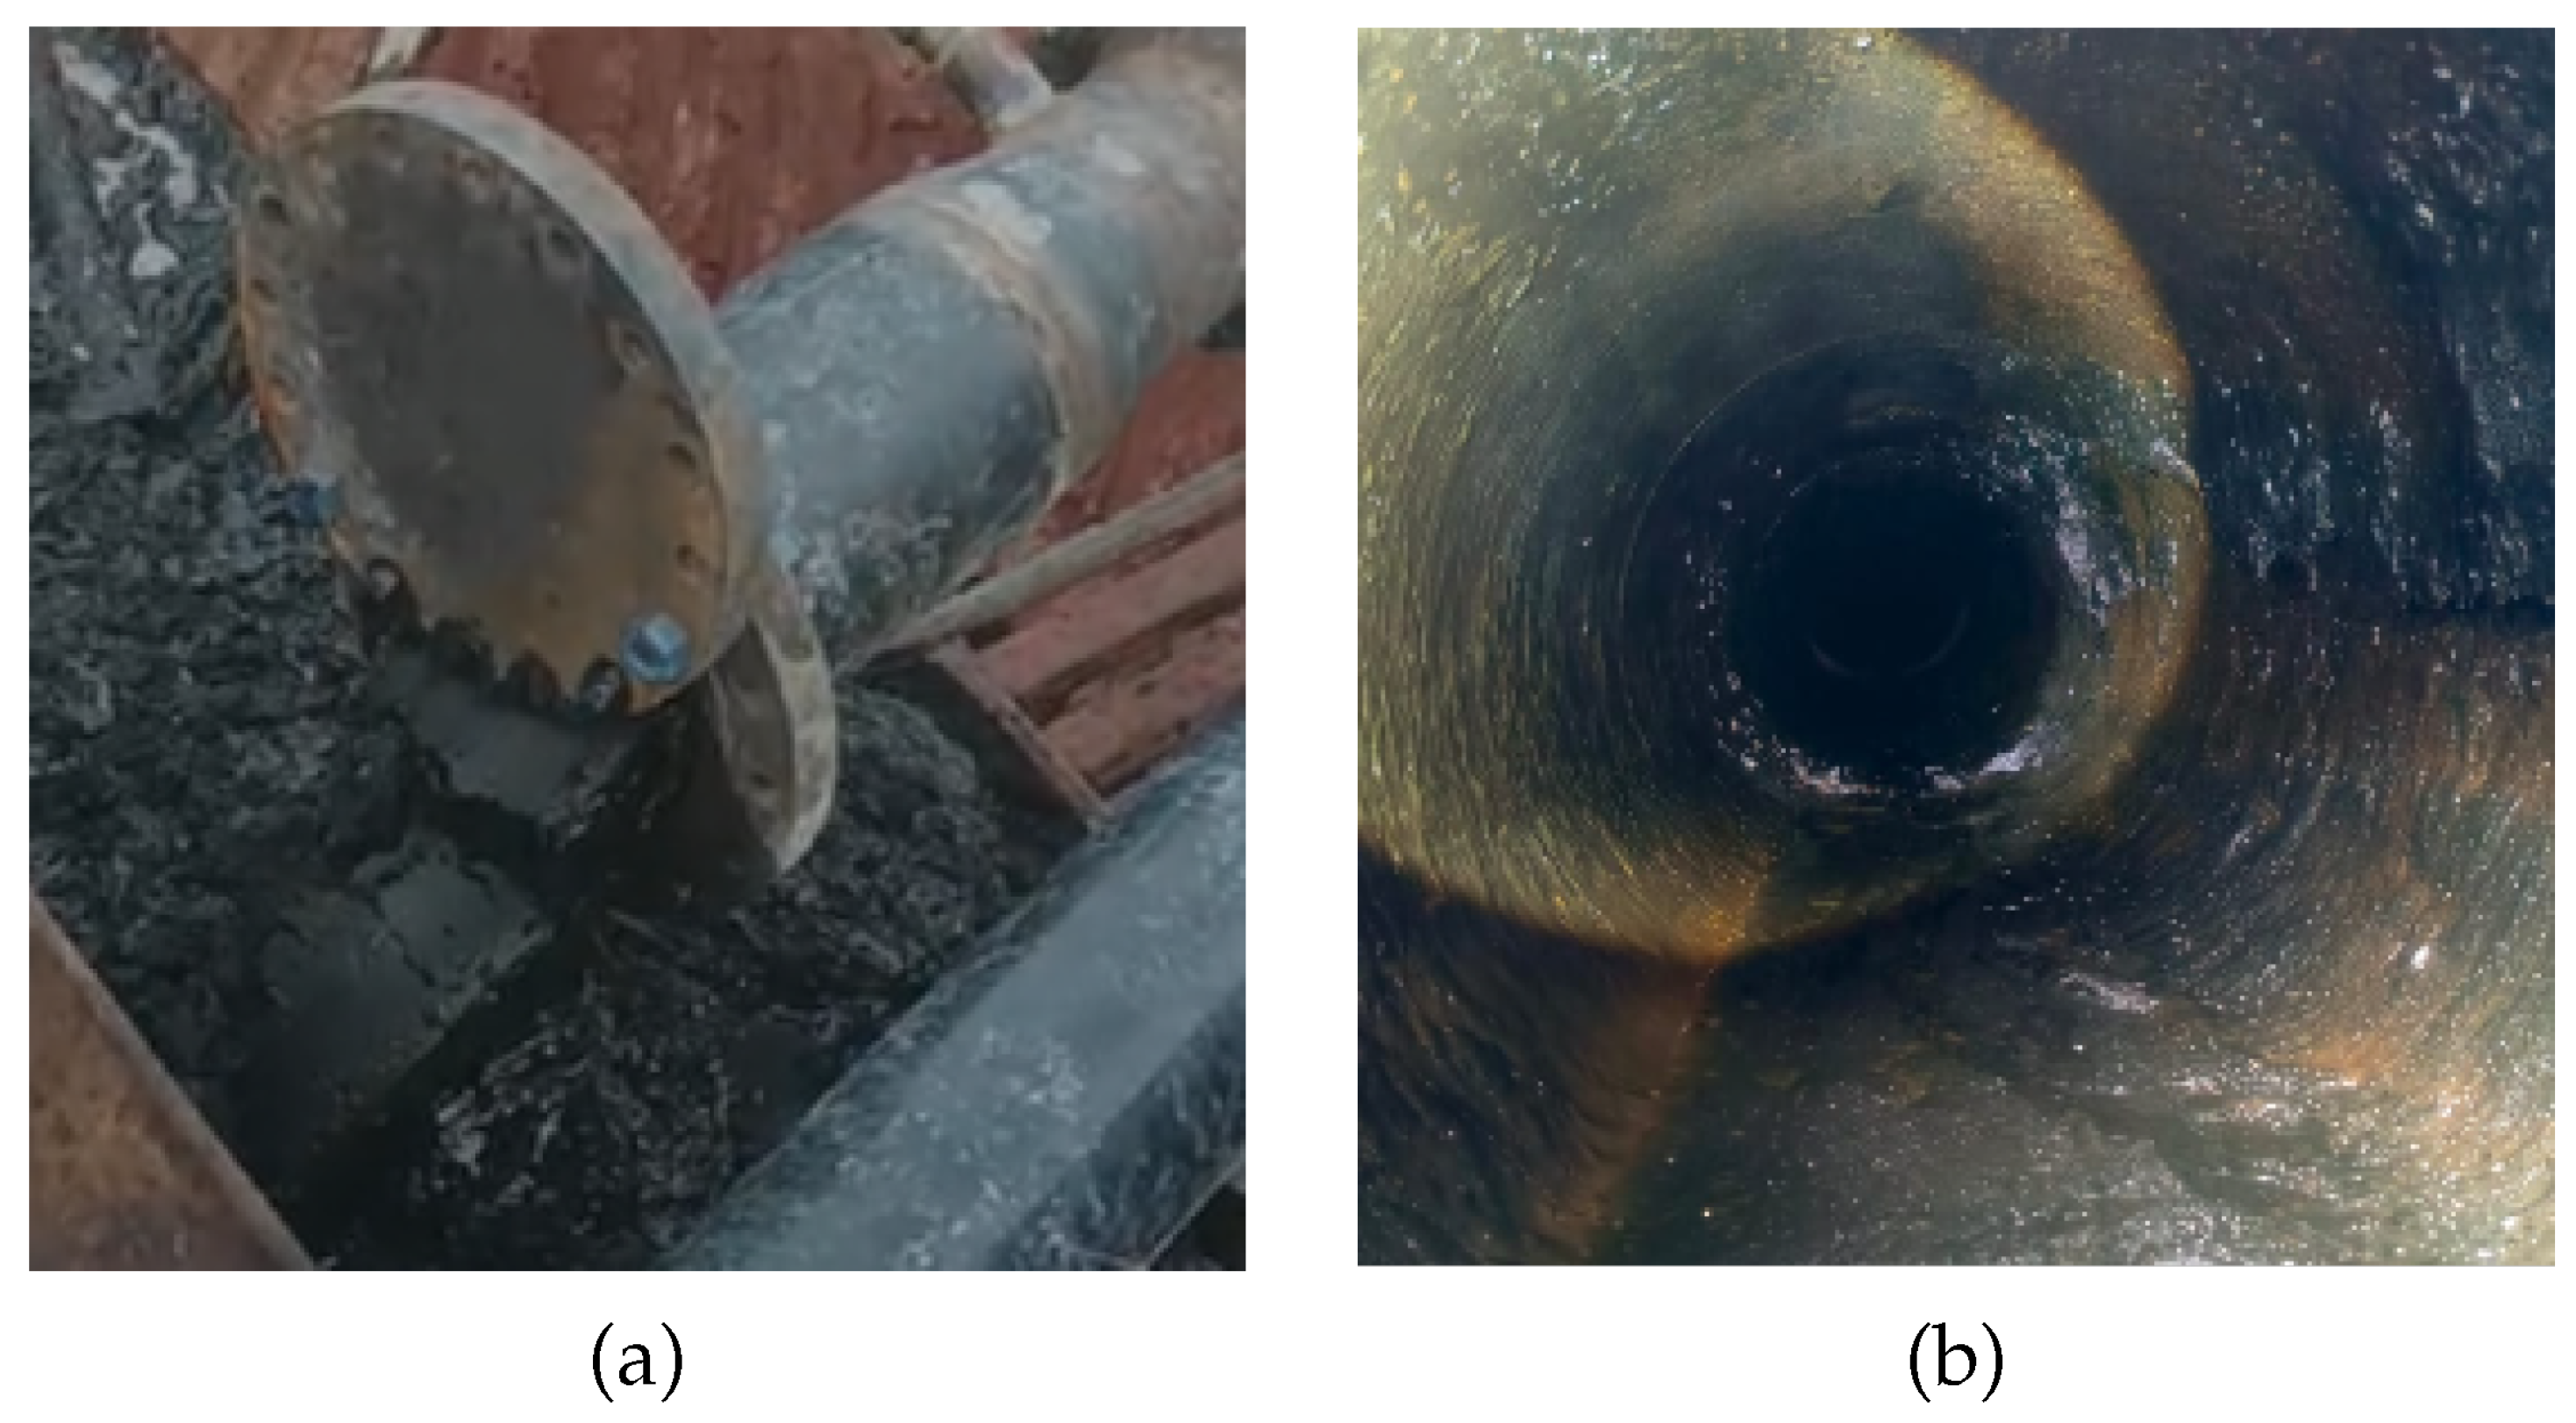
Figure 6.
Completely blocked flow ().
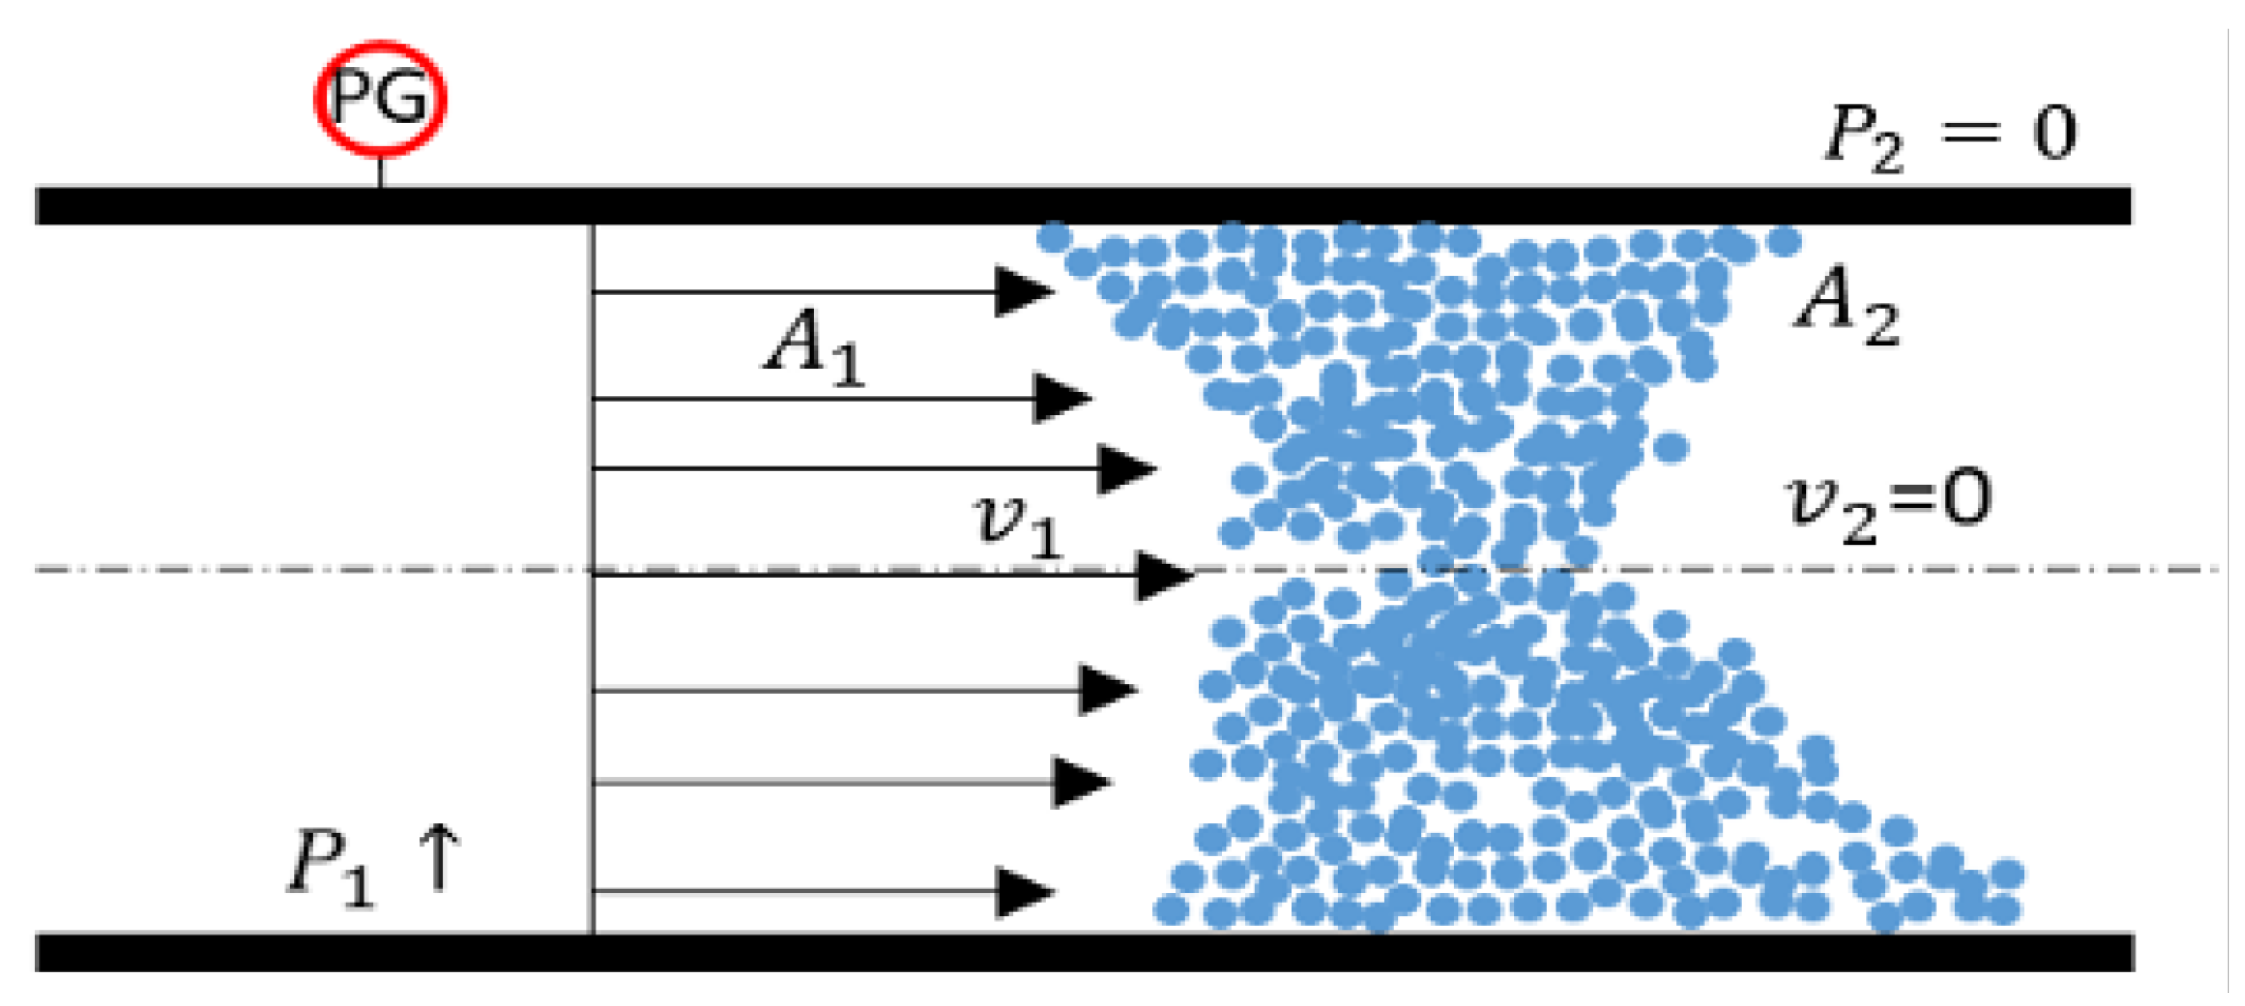
Figure 7.
Upstream Pressure increases causing the pipe to burst (MAOP>MAWP).
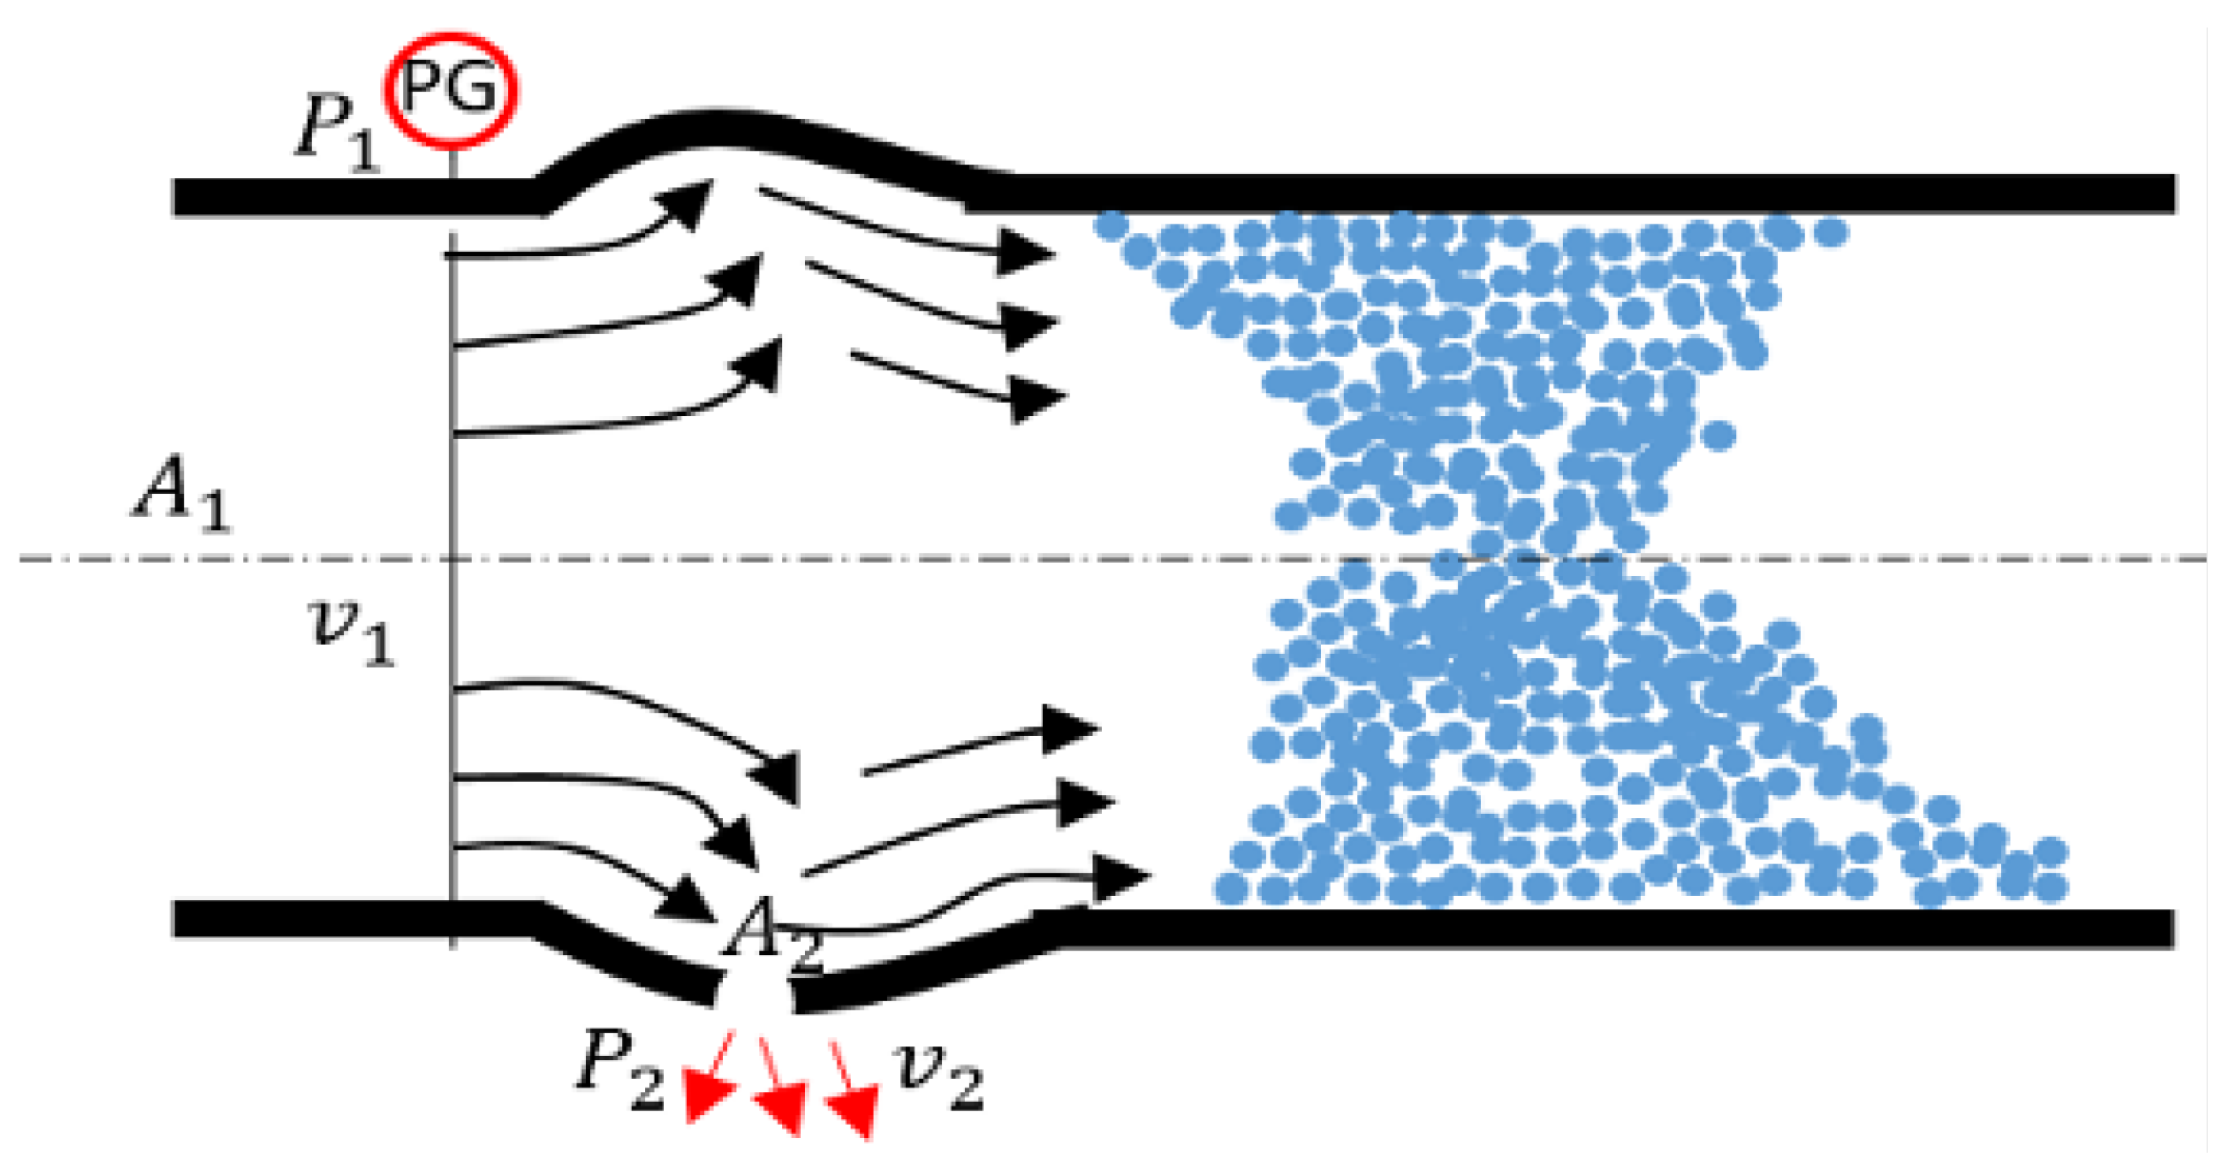
Figure 8.
Leaks can occur at several points that are difficult to detect.
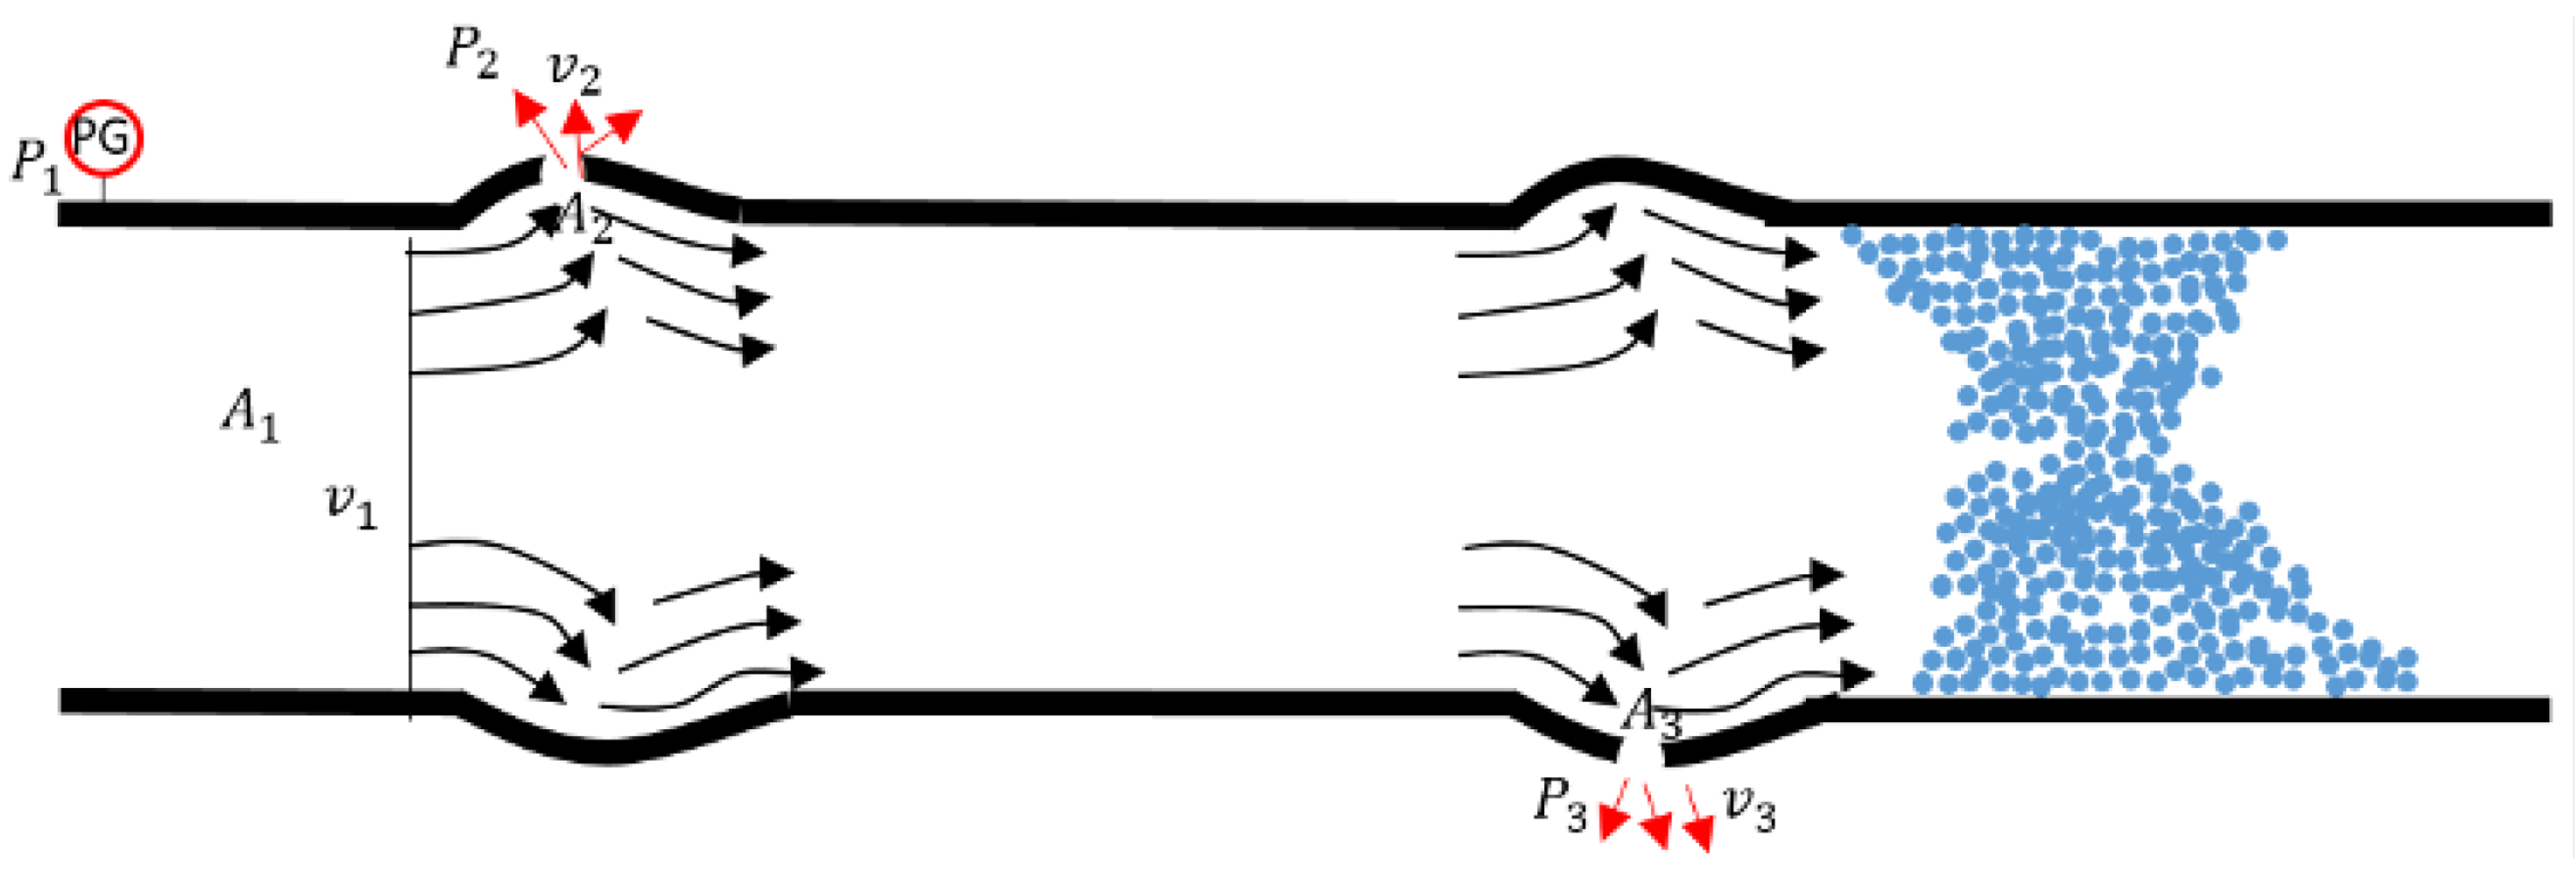
Figure 9.
Graph of the hazard caused by pipeline blockage.
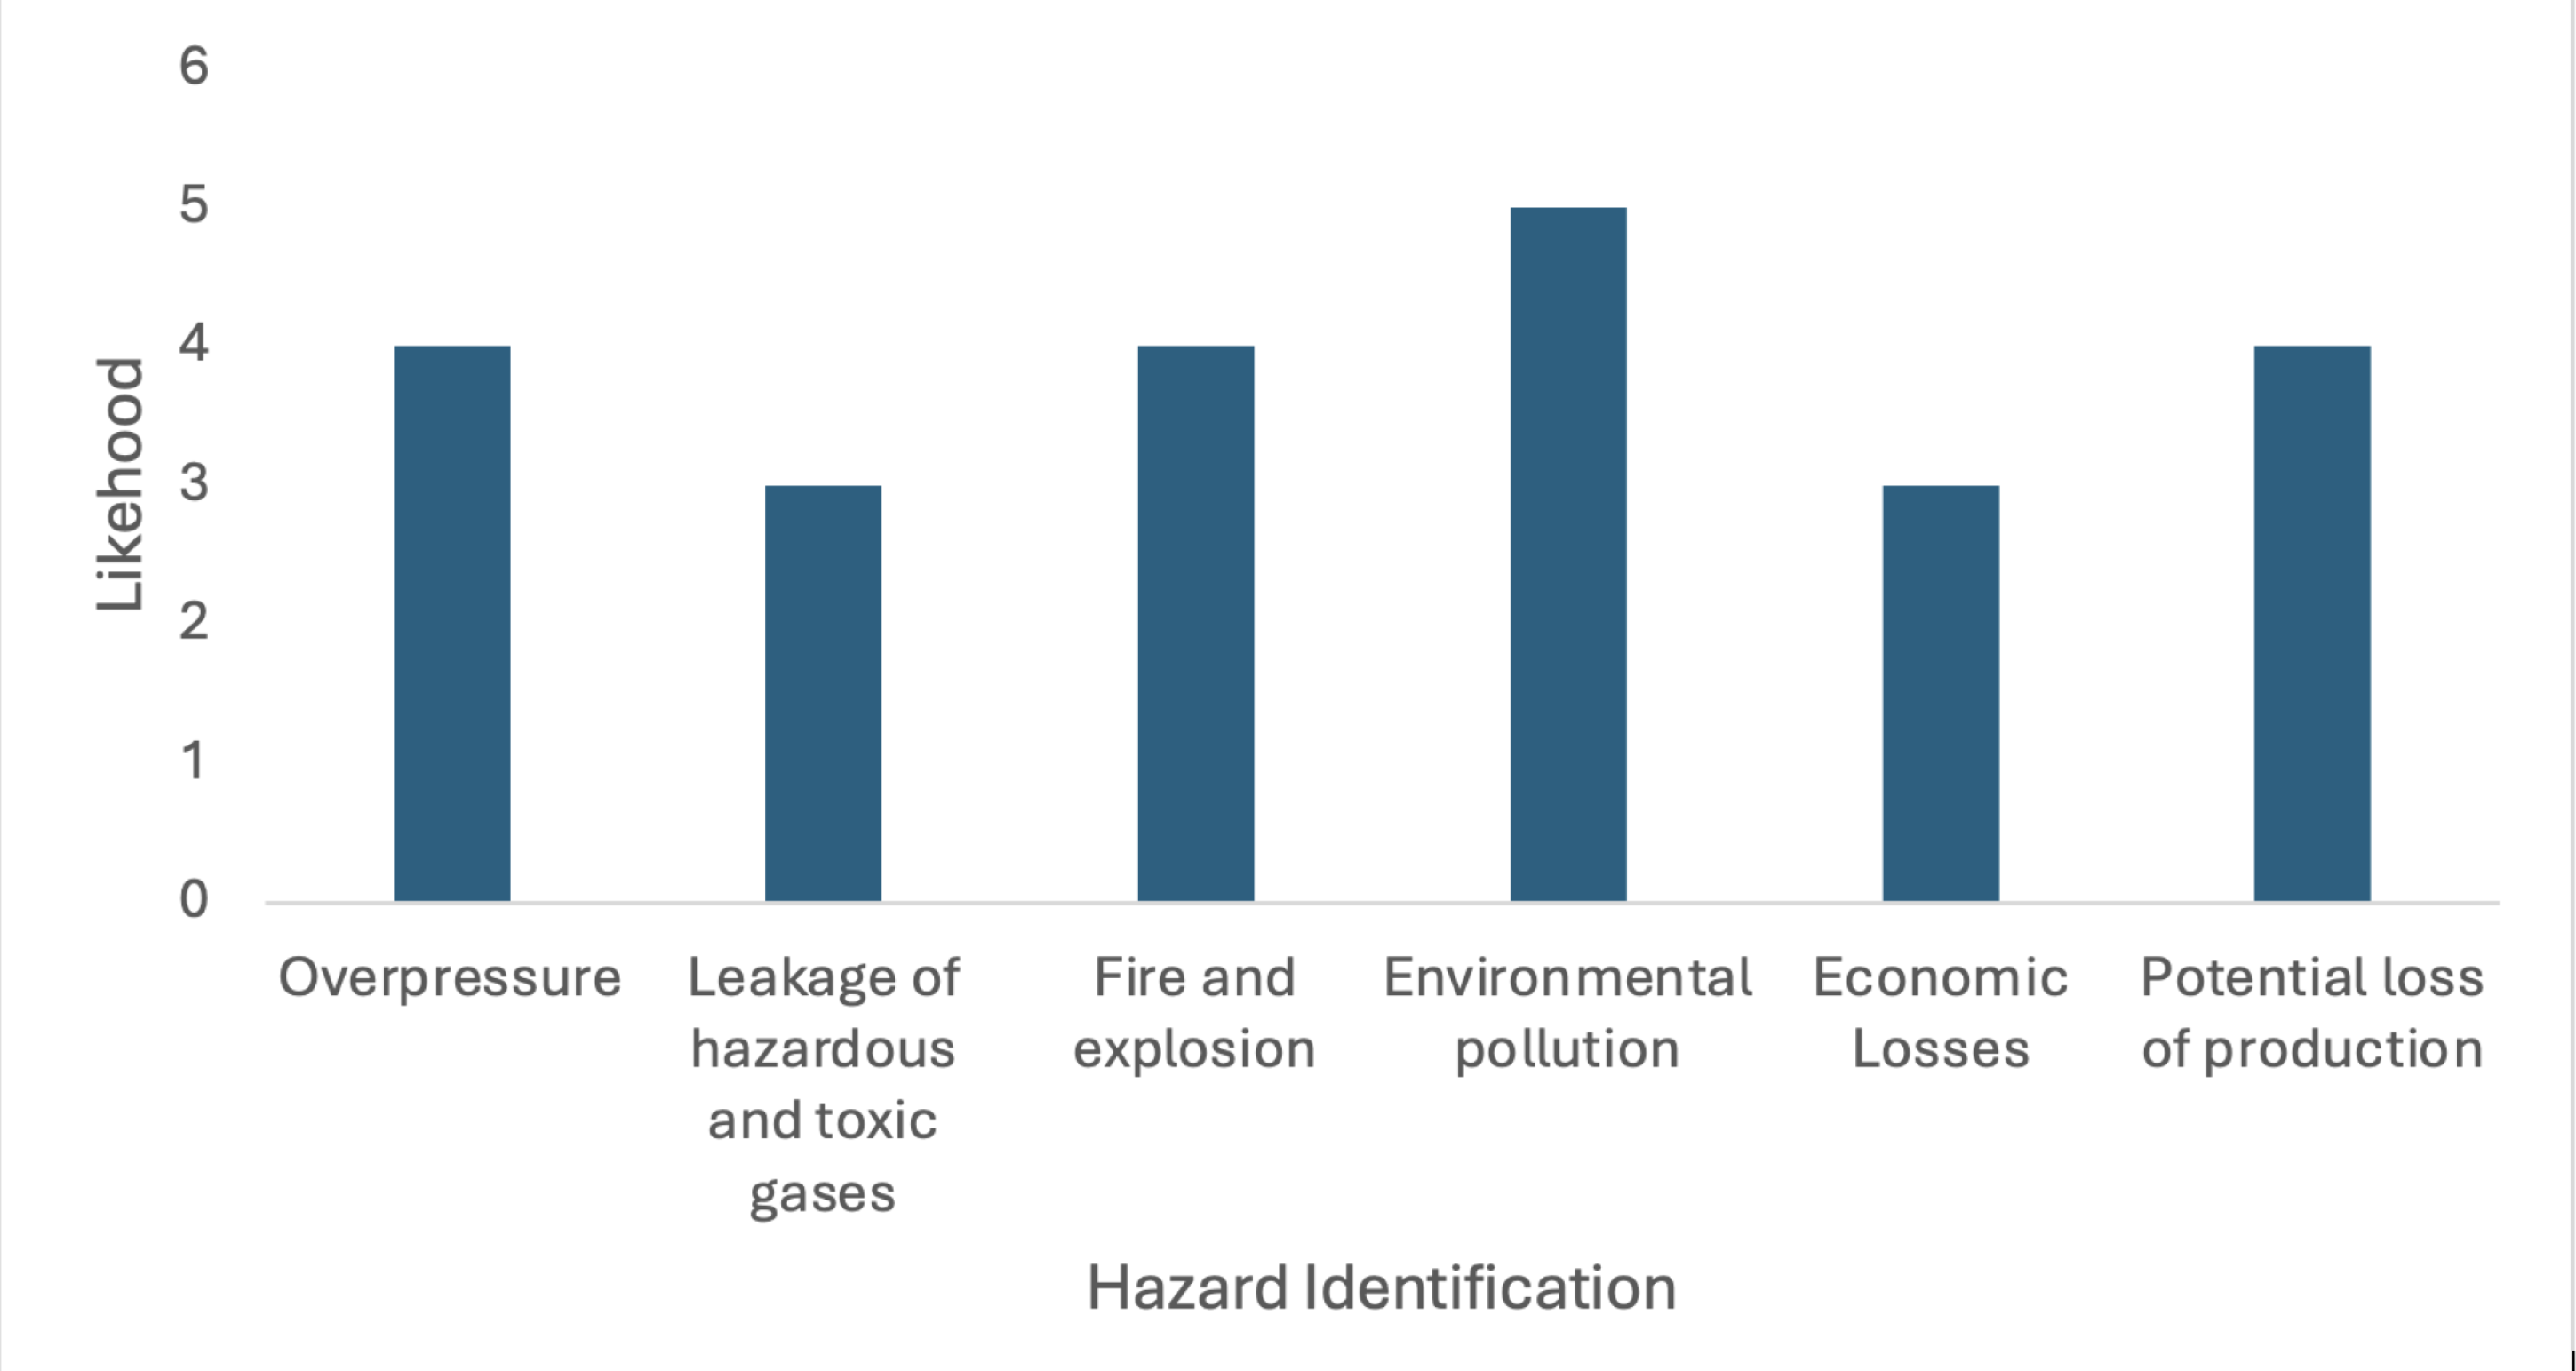
Figure 10.
Assessment of the severity caused by pipeline blockage.
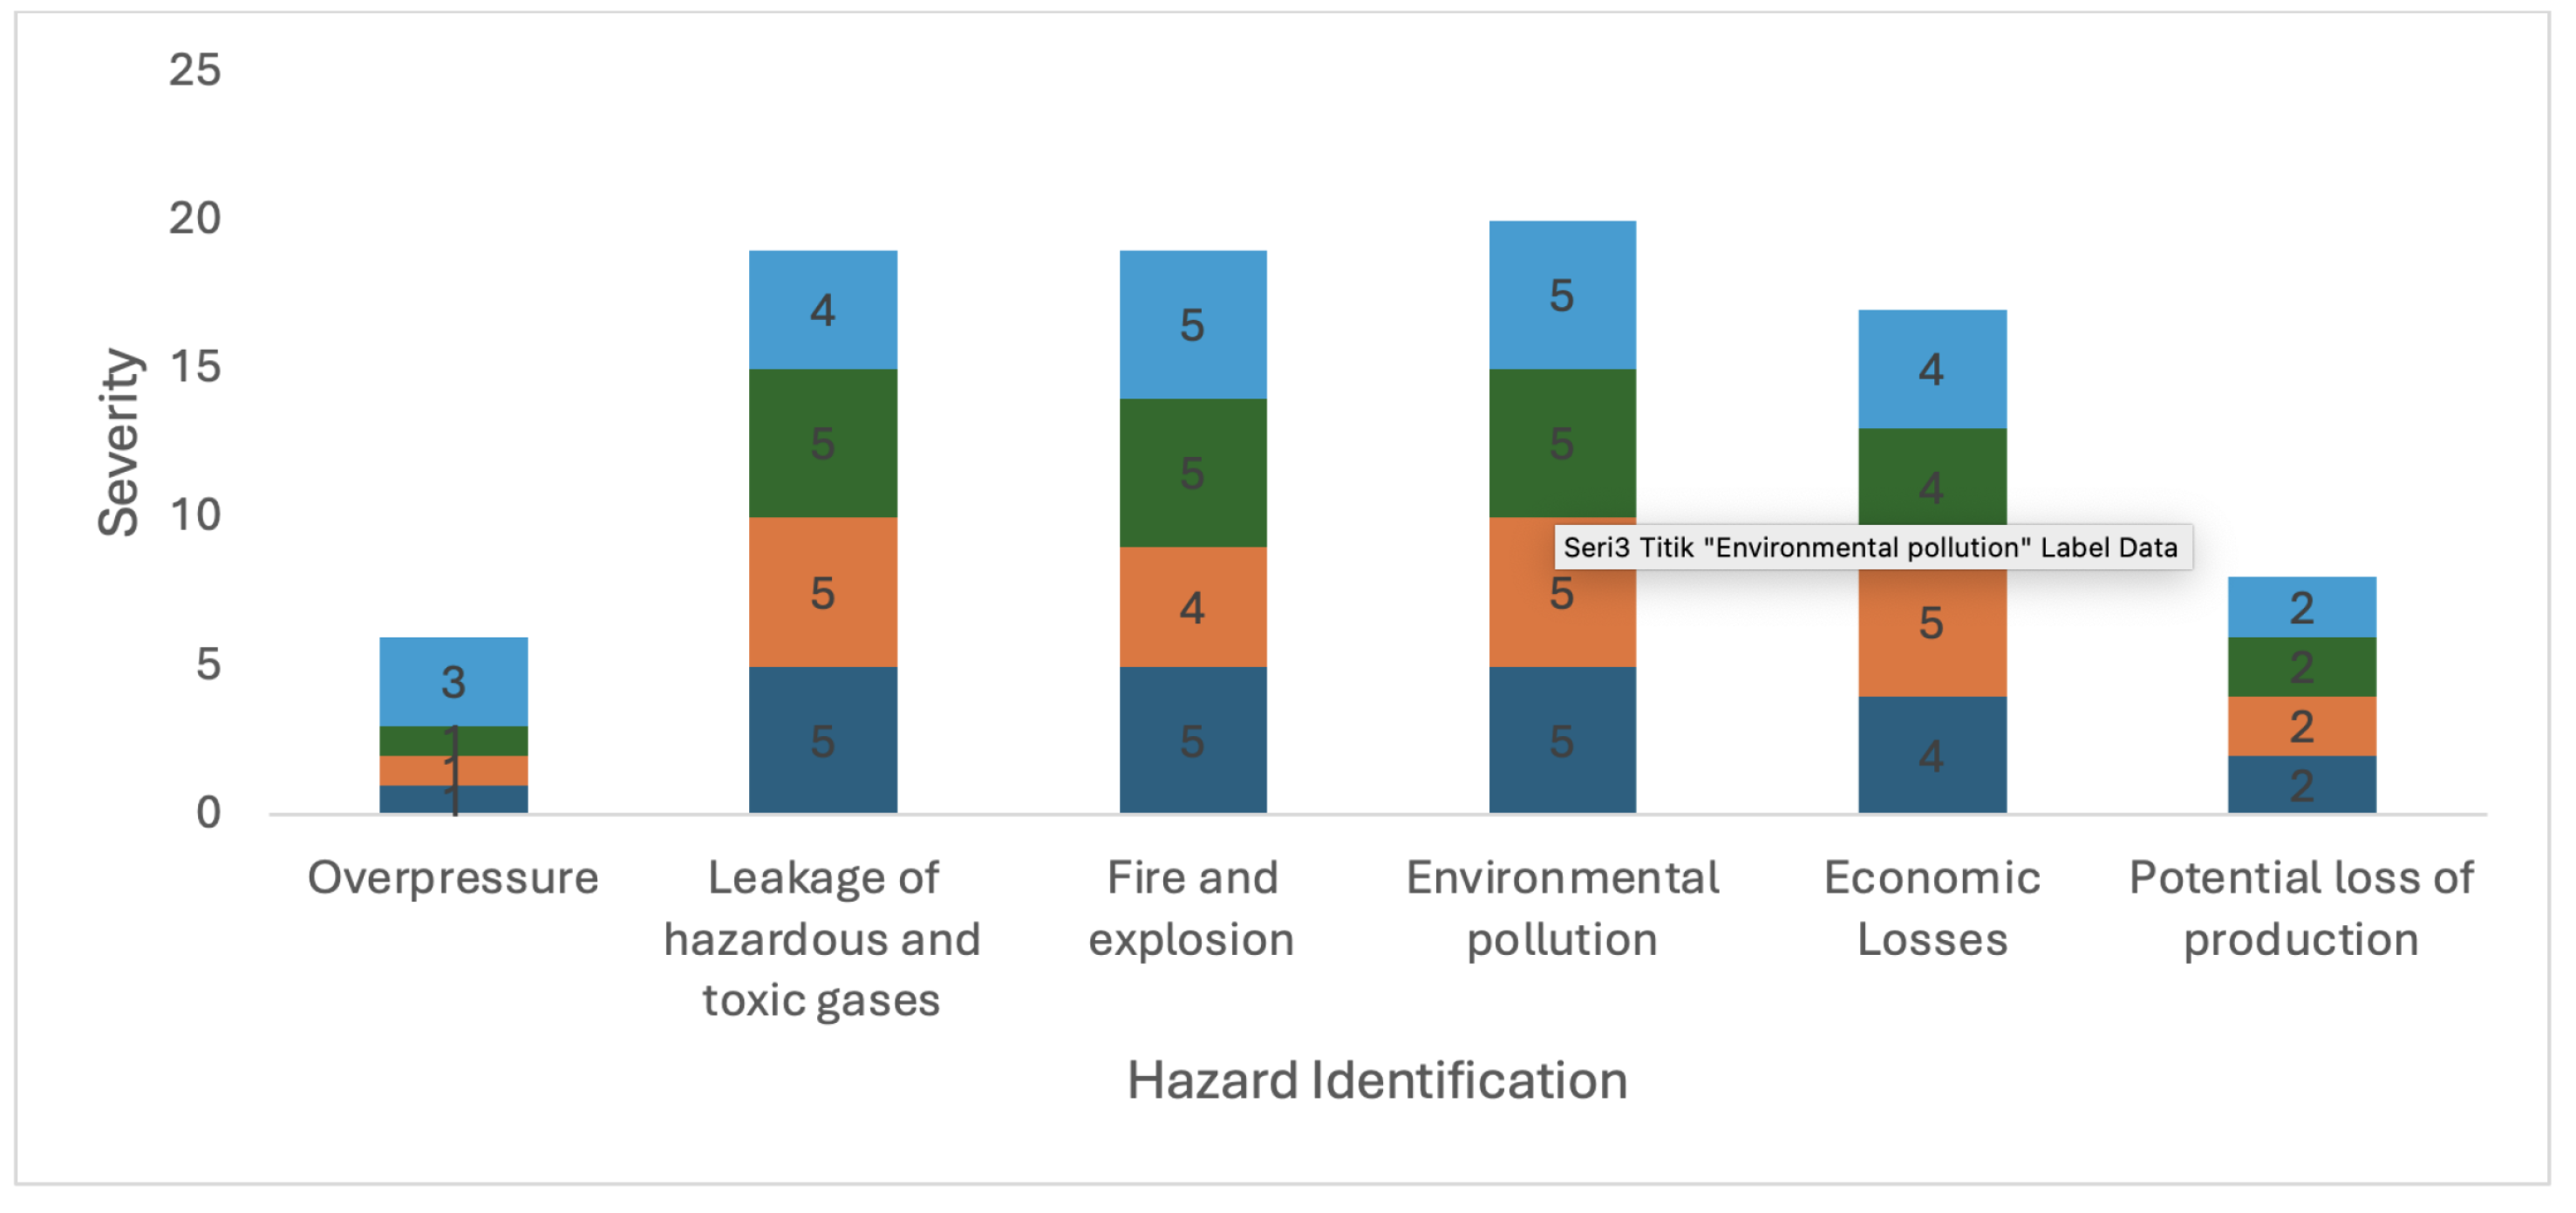
Figure 11.
Graph of pipeline blockage risk level.
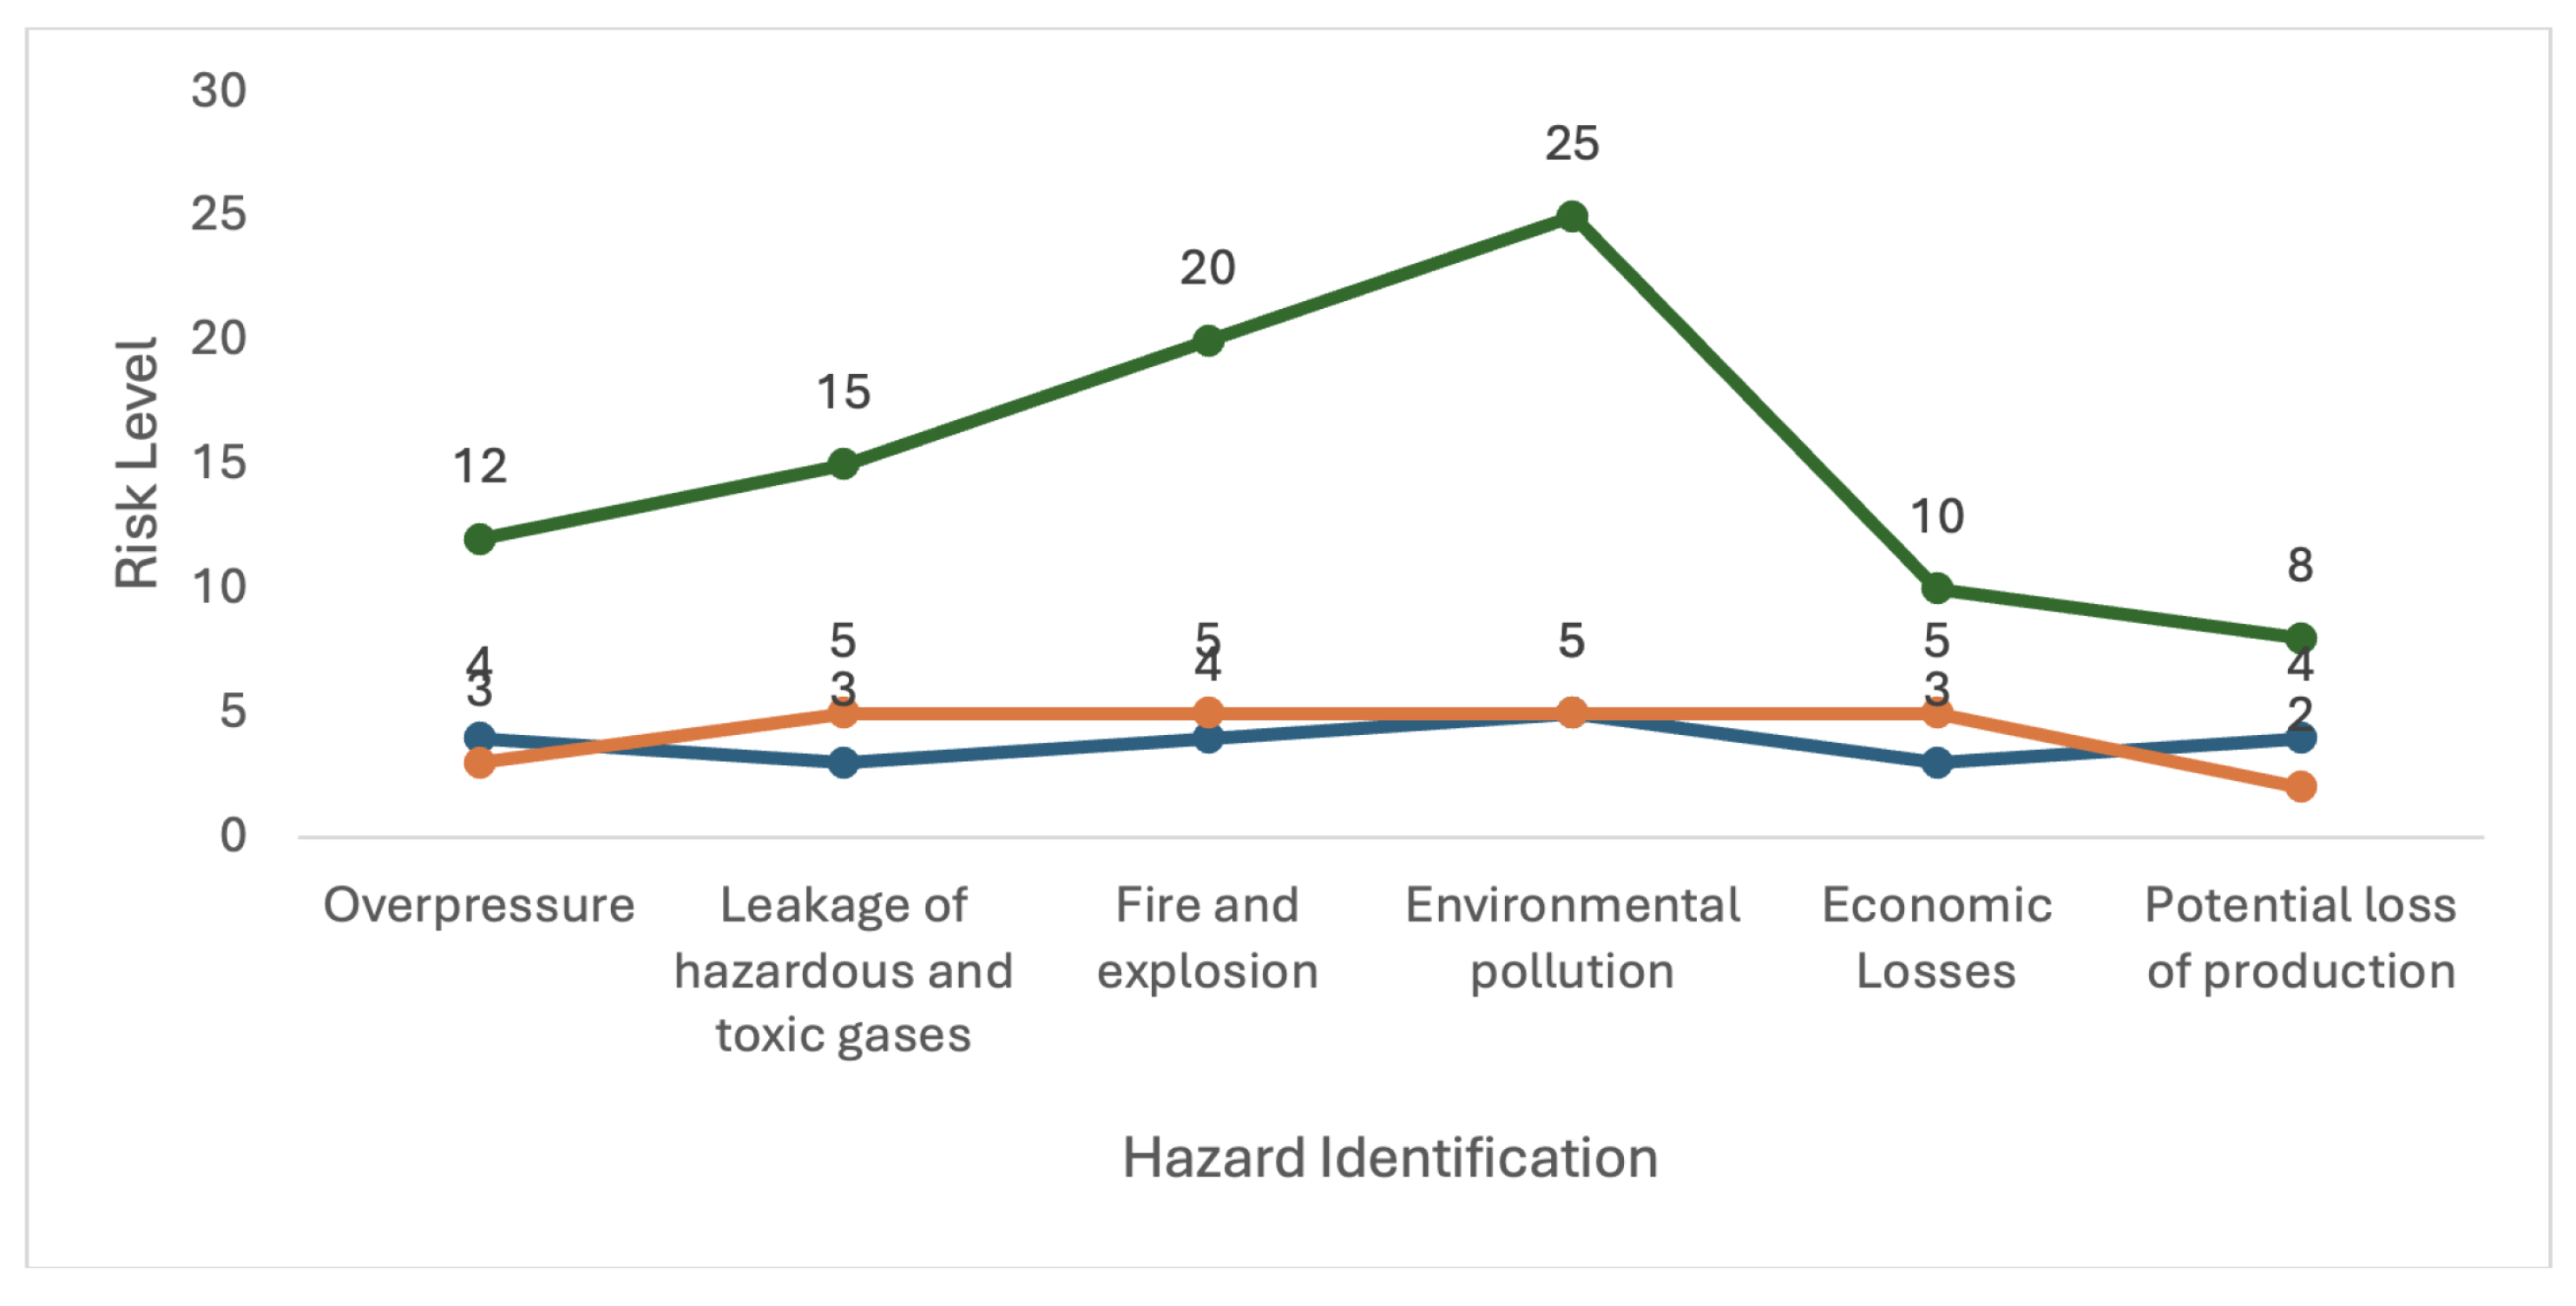
Figure 12.
Pipeline blockage risk matrix.
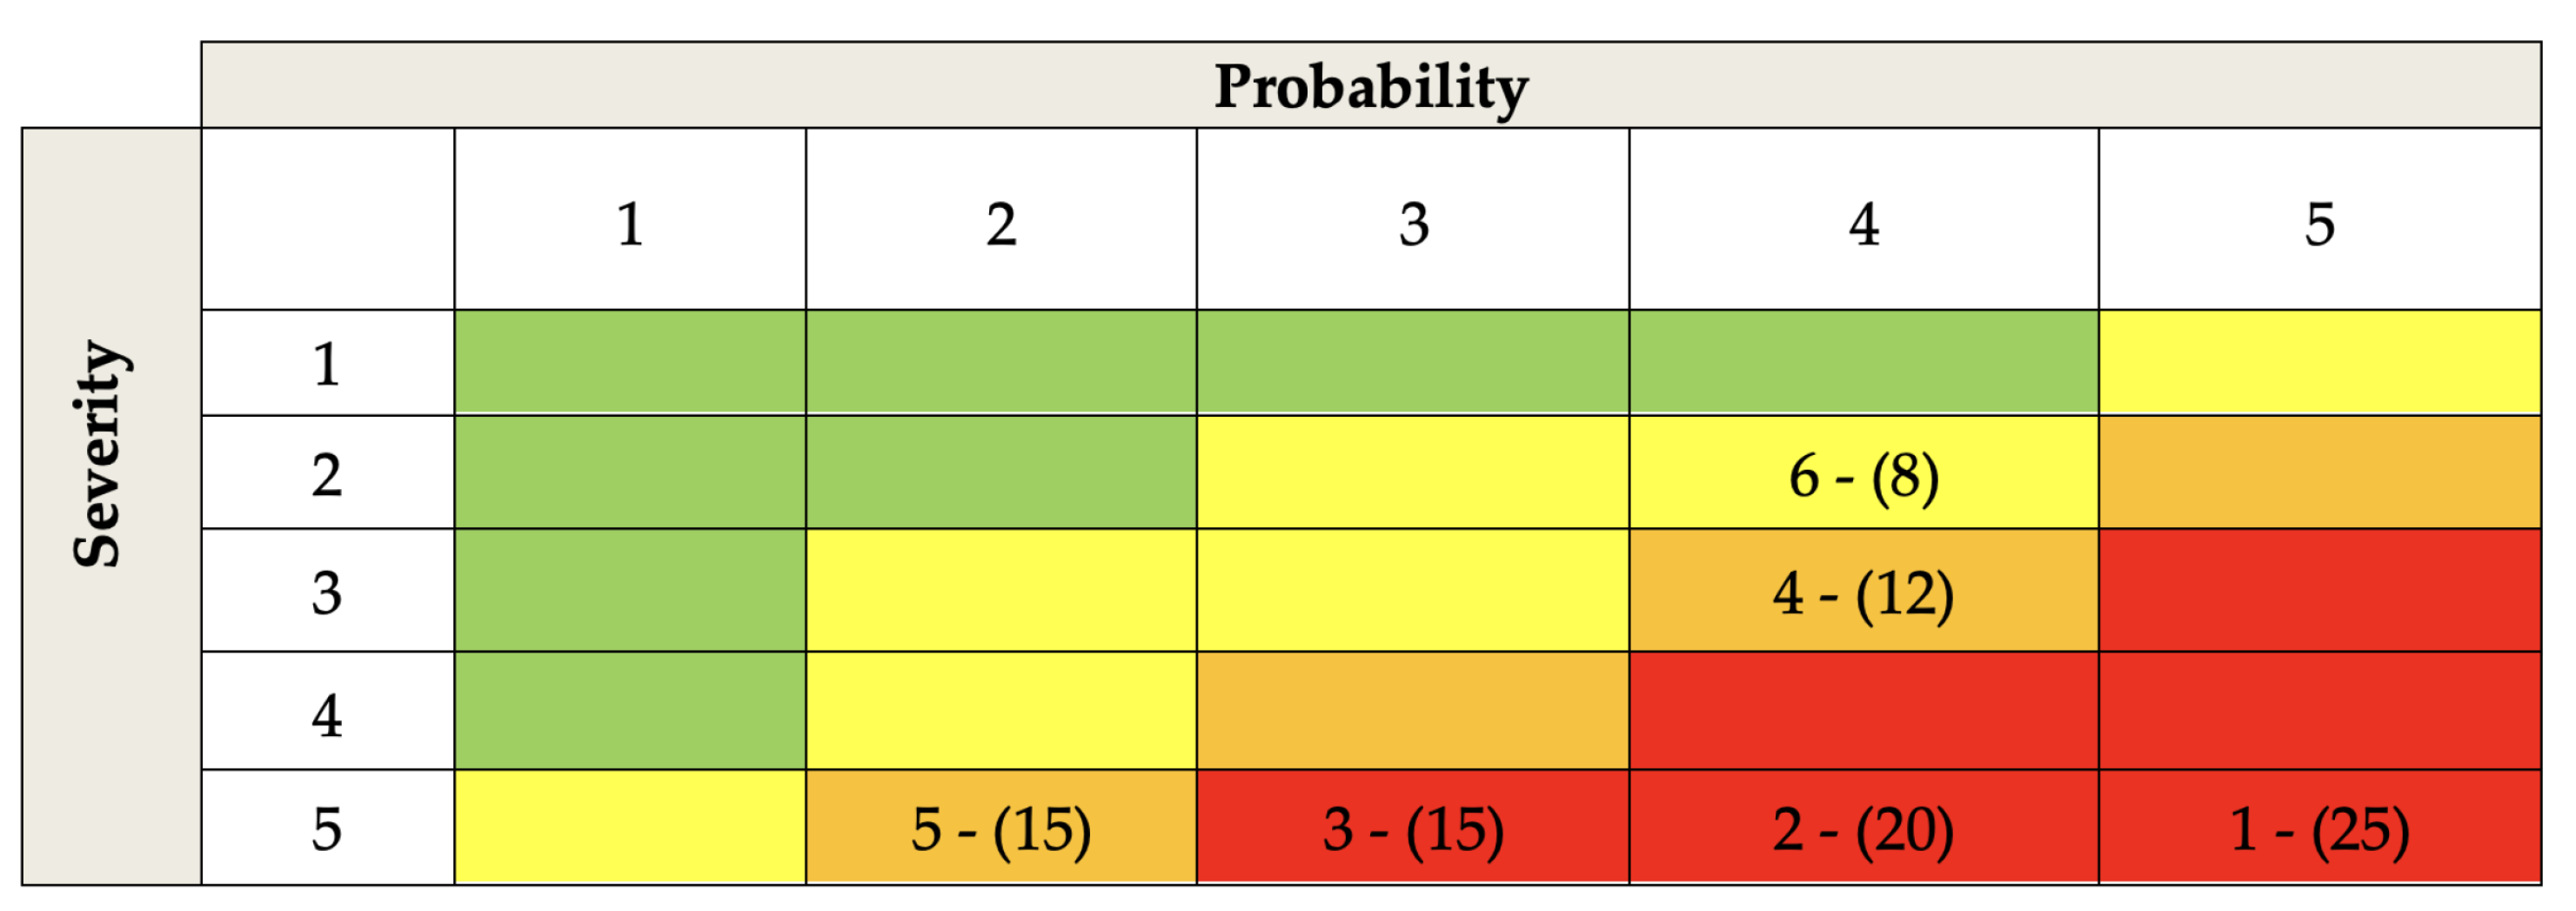

Table 1.
Likelihood probability score assessment [39].
Table 1.
Likelihood probability score assessment [39].
| Score Value | Opportunity Description | Estimated Probability | Detailed Description |
|---|---|---|---|
| 1 | Very Rarely | Almost never happens; it’s very unlikely. | |
| 2 | Seldom | – | It could happen, but the chances are slim. |
| 3 | Quite Often (Maybe) | – | This can happen under certain conditions. |
| 4 | Often | – | Tends to occur periodically. |
| 5 | Very Often (Almost Certainly) | It’s almost certain to happen in the near future. |
Table 2.
Severity assessment parameters [40].
Table 2.
Severity assessment parameters [40].
| Severity | Low (1) | Minor (2) | Moderate (3) | Serious (4) | Major (5) |
|---|---|---|---|---|---|
| Health and Safety | First Aid. | Medical Treatment Case. Restricted Work Case. Lost Time Injury (LTI) days. | LTI days. Severe health effects are not permanent. | Caused 1 death. Caused permanent and fatal illness. Influenced production shutdown. | More than 1 fatality. Affecting surrounding areas. Causing death from toxic chemicals. |
| Environ-mental Impact | Oil spill barrel. Dispersant control. | Oil spill barrels. It can be handled by workers immediately. | Oil spill barrels. Oil Spill Response Team handling. Moderate environmental damage that can be addressed and rehabilitated. | Uncontrolled oil spill barrels. Permanent environmental damage. Handling requires a special team from outside. Sensitive receptors must provide special compensation to the affected community. | Uncontrolled oil spill barrels. Permanent environmental damage. Handling requires a special team from outside. Sensitive receptors must provide special compensation to the affected community. |
| Reputation | Not in the media spotlight | Exposed by local media. Considered disturbing related parties. Potential for environmental rehabilitation by the government | Exposed by national and/or regional media and disrupting reputation. Violating legal aspects. Potential for environmental rehabilitation prosecution by the government. | Exposed by international and national media. Disturbing reputation. Violating legal aspects. Disturbing surrounding communities. Demands for environmental rehabilitation by the government. | Exposed by international and national media. Damaging reputation. Violating legal aspects. Disturbing surrounding communities Public opinion results in the cessation of operations. Demands for environmental rehabilitation by the government. |
| Property Damage | Loss . Production decline . Partial production shutdown day. | Loss of . Production reduction between . Total production stoppage less than 1 day (24 hours). | Loss of . Production declined between . Total production stoppage between 1 day to 7 days | Loss of . Production decline of . Total production stoppage between 15 days to 30 days | Loss > USD 20,000,000. Production decline . Total production stoppage days |
Table 3.
Risk level [42].
Table 3.
Risk level [42].
| 1-4 | 5-9 | 10-12 | 15-25 |
| Acceptable | Moderate | Serious | Critical/Major |
| Normally, conditions are acceptable without the application of additional controls. | Acceptable hazard conditions with safeguards to reduce risk through long-term planning. | Unexpected risk. Hazardous condition based on management approval. Consider reducing risk with short-term control planning. | The risk is unacceptable. Action must be taken immediately to reduce the risk. Plan control of the situation before the hazardous event occurs. |
Table 4.
Pipeline blockage likelihood.
| Ident. No | Hazard Identification | Likelihood (1-5) | Description |
|---|---|---|---|
| 1 | Overpressure | 4 | Tends to occur periodically (50% – 80%) |
| 2 | Leakage of hazardous and toxic gases | 3 | This can happen under certain conditions (20% – 50%) |
| 3 | Fire and explosion | 4 | Tends to occur periodically (50% – 80%) |
| 4 | Environmental pollution | 5 | It’s almost certain to happen in the near future (> 80%) |
| 5 | Economic Losses | 3 | It’s almost certain to happen in the near future (5% – 20%) |
| 6 | Potential loss of production | 4 | Tends to occur periodically (50% – 80%) |
Table 5.
Severity assessment of pipeline blockage.
| Ident. No | Hazard Identification | Health and Safety | Env. Impact | Reputation | Property Damage | Avg | Description |
|---|---|---|---|---|---|---|---|
| 1 | Overpressure | 1 | 1 | 1 | 3 | 3 | Moderate |
| 2 | Leakage of hazardous and toxic gases | 5 | 5 | 5 | 4 | 5 | Critical/Major |
| 3 | Fire and explosion | 5 | 4 | 5 | 5 | 5 | Critical/Major |
| 4 | Environmental pollution | 5 | 5 | 5 | 5 | 5 | Critical/Major |
| 5 | Economic Losses | 4 | 5 | 4 | 4 | 4 | Critical/Major |
| 6 | Potential loss of production | 2 | 2 | 2 | 2 | 2 | Moderate |
Table 6.
Pipeline blockage risk level.
| Ident. No | Hazard Identification | Likelihood (L) (1-5) | Severity (S) (1-5) | Risk Level () |
|---|---|---|---|---|
| 1 | Overpressure | 4 | 3 | 12 |
| 2 | Leakage of hazardous and toxic gases | 3 | 5 | 15 |
| 3 | Fire and explosion | 4 | 5 | 20 |
| 4 | Environmental pollution | 5 | 5 | 25 |
| 5 | Economic Losses | 3 | 5 | 15 |
| 6 | Potential loss of production | 4 | 2 | 8 |
Table 7.
Recovery Cost Estimate.
| Ident. No | Hazard Identification | Recovery Cost Estimate | Cost Reference |
|---|---|---|---|
| 1 | Environmental pollution | USD 65 billion | Deepwater Horizon, 2010 [54] |
| 2 | Fire and explosion | USD 3.4 billion | Piper Alpha Incident, 1988 [55] |
| 3 | Leakage of hazardous and toxic gases | USD 3 billion | Bhopal Incident, 1984 [56]. |
| 4 | Overpressure | USD 1 billion | San Bruno Incident, 2010 [16]. |
| 5 | Economic Losses | USD 54 billion | Crude Oil Pipeline Blockage – Nigeria [57]. |
| 6 | Potential loss of production | 478.000-ton | Nord Stream Gas Pipeline, 2022 [14]. |
Disclaimer/Publisher’s Note: The statements, opinions and data contained in all publications are solely those of the individual author(s) and contributor(s) and not of MDPI and/or the editor(s). MDPI and/or the editor(s) disclaim responsibility for any injury to people or property resulting from any ideas, methods, instructions or products referred to in the content. |
© 2025 by the authors. Licensee MDPI, Basel, Switzerland. This article is an open access article distributed under the terms and conditions of the Creative Commons Attribution (CC BY) license (http://creativecommons.org/licenses/by/4.0/).
Copyright: This open access article is published under a Creative Commons CC BY 4.0 license, which permit the free download, distribution, and reuse, provided that the author and preprint are cited in any reuse.


