
Submitted:
17 June 2025
Posted:
18 June 2025
You are already at the latest version
Abstract
This study developed a copper mineral prospectivity map for the Koldar Massif, Kazakhstan, using an integrated approach combining geophysical and satellite methods. A strong spatial-genetic link was identified between faults and hydrothermal mineralization, with faults acting as key conduits for ore-bearing fluids. Lineament analysis and density mapping confirmed the high permeability of the Koldar Massif, indicating its structural prospectivity. Hyperspectral and multispectral data (ASTER, PRISMA, WorldView-3) were applied for detailed mapping of hydrothermal alteration (phyllic, propylitic, argillic zones), which are critical for discovering porphyry copper deposits. In particular, WorldView-3 imagery facilitated the identification of new prospective zones. The transformation of magnetic and gravity data successfully delineated geological features and structural boundaries, confirming the fractured nature of the massif, a key structural factor for mineralization. The resulting map of prospective zones, created by normalizing and integrating four evidential layers (lineament density, PRISMA-derived hydrothermal alteration, magnetic, and gravity anomalies), is highly validated, successfully outlining the known Aktogay, Aidarly, and Kyzylkiya deposits. Furthermore, new, previously underestimated prospective areas were identified. This work fills a significant knowledge gap concerning the Koldar Massif, which had not been extensively studied using satellite methods previously. The key advantage of this research lies in its comprehensive approach and the successful application of high-quality multispectral imagery for mapping new prospective zones, offering a cost-effective and efficient alternative to traditional ground-based investigations.
Keywords:
copper mineralization
; hydrothermal alteration
; remote sensing
; hyperspectral data
; Worldview-3
; geophysics
; lineaments
; Koldar massif
; Kazakhstan
; deposit prediction
1. Introduction
The global mining industry faces a serious challenge: with 250 active copper mines across 40 countries and estimated reserves of 870 million tons, resource depletion is inevitable. S&P Global forecasts a copper deficit of 10 million tons by as early as 2035 [1], demanding immediate and decisive action.
Traditional approaches to increasing production, such as modernizing metal extraction processes or re-exploring the flanks of existing deposits, while important, cannot fully offset the anticipated deficit. These methods primarily optimize known resources but fail to uncover fundamentally new sources.
Therefore, there's an urgent need to attract and actively implement entirely new, advanced exploration methods and technologies. Only the comprehensive application of innovative approaches, including modern remote sensing, geophysics, artificial intelligence, and machine learning, will enable the efficient and timely discovery and commissioning of new, hidden deposits capable of meeting the growing global demand for copper. Without a radical shift in the exploration paradigm, a global copper deficit will become a reality.
Kazakhstan holds a significant position in the global copper market, accounting for approximately 4% of worldwide production. As of 2024, the country ranks among the top 11 global leaders in copper reserves, with proven reserves of 40.8 million tons (estimated at an additional 20 million tons). Over 77% of these reserves are concentrated in Central and Eastern Kazakhstan.
In Northeast Balkhash region, the primary prospects for copper are linked to the porphyry copper ore formation, with the most significant and frequent copper accumulations known within the Koldar ore cluster (Aktogay ore field). Copper occurrences here are predominantly of hydrothermal origin, less commonly skarn or sedimentary, and belong to various ore formations. However, practical exploration interest is exclusively focused on the porphyry copper vein-disseminated formation [2,3,4].
Despite its undeniable significance and the presence of known deposits, the Aktogay ore region remains critically underexplored. The majority of geological investigations in this key area were conducted over 40 years ago. At that time, these efforts relied on traditional exploration methods which, by modern standards, are insufficiently effective and representative to fully unlock the region's true potential.
While the fundamental geological framework of the area remains relevant, its vast yet largely concealed mineral potential demands urgent and comprehensive re-evaluation. This is achievable only through the active and widespread adoption of advanced remote sensing technologies and modern digital data interpretation. Employing these innovative approaches will not only allow for more comprehensive and precise mapping of known anomalies but also for the identification of previously undetected, deep-seated, or subtly expressed prospective structures. Such a comprehensive and in-depth re-evaluation is absolutely critical for the future development of Kazakhstan's copper industry and for ensuring its long-term sustainability amidst rising global demand.
Global experience demonstrates that the application of remote sensing data plays a crucial role in copper exploration worldwide [5,6,7,8,9,10,11]. Currently, both traditional and modern technological approaches are employed in mineral exploration. Traditional methods include geological [12,13,14,15,16,17,18], geophysical [19,20,21,22,23,24,25], and geochemical investigations [26,27,28,29]. Modern approaches increasingly integrate remote sensing technologies [30,31,32,33], Geographic Information Systems (GIS) [34,35,36,37], numerical modeling [38], and advanced computational tools like Artificial Intelligence (AI) and Machine Learning (ML) algorithms [39,40,41,42,43,44,45].
Recent advances in multi- and hyperspectral remote sensing have significantly improved the ability to detect and map hydrothermal alteration minerals associated with ore deposits. These techniques provide detailed spectral information that enables discrimination of mineral assemblages at high spatial and spectral resolution, supporting more effective geological mapping and mineral exploration in both arid and vegetated terrains [46].
To enhance the accuracy and reliability of data interpretation, the integration of multiple methods and technologies has become widespread [47,48,49,50,51,52]. This integrated approach allows for more effective assessment of mineral prospectivity and ensures reliable results.
In our study, a comprehensive set of geophysical and satellite data was utilized to map geological features associated with copper mineralization zones. Geophysical fields were employed to delineate lithological units and define geological boundaries. Specifically, gravity data allowed for the differentiation of various lithological formations based on density variations of rocks [53,54]. Concurrently, magnetic data were applied to identify magnetic anomalies, indicating the presence or absence of magnetic minerals linked to the heterogeneous lithology of the study area [55,56,57]. While both gravity and magnetic methods are effective individually, their joint application significantly enhances interpretation reliability. Each method compensates for the limitations of the other, thereby providing a more complete understanding of the regional geological structure [58,59,60,61].
Fault systems within the Earth's crust play a crucial role as conduits for the migration of ore-bearing hydrothermal fluids and organic compounds, thus participating in or creating the necessary conditions for the formation of mineral deposits [62,63]. In this regard, fault-related structures are considered a key control on mineralization, particularly of hydrothermal origin. The hypothesis of a spatial and genetic link between hydrothermal ore bodies and fault zones is widely regarded as one of the most promising for mineral deposit prediction. In this context, lineaments, which represent surface expressions of deep-seated tectonic structures, can serve as indicators of mineral mineralization, especially copper.
We applied lineament analysis to study the influence of tectonic deformation on rock permeability as a critical factor controlling ore-forming processes. Although this analysis does not directly identify mineral deposits, it plays a decisive role in identifying potentially mineralized zones, as well as the geometry and development mechanisms of ore-controlling structures.
Spectral analysis of satellite imagery, varying in sensor type and acquisition scale, represents a key outcome of this research and is an indispensable tool in modern geological exploration. Through a comprehensive analysis of ASTER, WorldView-3, and PRISMA optical images, zones of hydrothermal alteration associated with copper mineralization were successfully identified. This approach has long demonstrated its effectiveness in delineating prospective ore-bearing areas [64,65,66,67,68].
The results of this study offer an additional tool for integrating ground-based geological-geophysical and satellite methods to identify prospective porphyry copper structures across Kazakhstan.
2. Geographic and Geologic Settings of the Study Area
2.1. Geography
The study area is in the central part of the Ural-Mongolian fold belt, within the Dzungarian-Balkhash fold system (Balkhash crustal segment) in Northeast Balkhash. Administratively, the area is located in the Ayagoz district of the East Kazakhstan region of the Republic of Kazakhstan (Figure 1).
The landscape features gently undulating sandy plains and low hills, part of the Koldar Mountains, with a relative relief ranging from 5 to 30 meters and absolute elevations from 390 to 470 meters above sea level. The region experiences a sharply continental climate, characterized by significant diurnal and seasonal temperature fluctuations. Winters are cold and harsh, while summers are typically hot and arid. The river network, including the Ayagoz River, is poorly developed.
The study area is primarily an agricultural region, dominated by transhumant livestock farming (sheep breeding). To a lesser extent, it also supports dairy production and crop cultivation, including wheat, corn, sunflowers, and fodder grasses.
Vegetation is sparse, characteristic of semi-desert and dry steppe zones, consisting mainly of drought-resistant grasses and shrubs such as feather grass (Stipa spp.) and wormwood (Artemisia spp.). Due to the low vegetation cover and limited surface biomass, extensive outcrops of bedrock are present. These conditions are highly favorable for remote sensing, as they enhance the visibility and spectral detection of hydrothermal alteration zones associated with mineralization.
2.2. Geology
The Koldar intrusive massif is situated within the Aktogay uplift, at the intersection of the Katan-Emel-Bakanas structural-formational zone, and is structurally controlled by the sub-latitudinal Aktogay deep-seated fault.
This massif hosts the Aktogay ore field, which includes the large Aktogay and Aidarly porphyry copper deposits, as well as the smaller Kyzylkiya deposit [2]. The Aktogay deposit is centrally located within the massif, Aidarly in the western part, and Kyzylkiya in the eastern sector. The ore field is spatially associated with the Koldar granitoid intrusion, which intrudes middle-upper Carboniferous volcanic rocks of the Keregetas Formation and is overlain by volcano-sedimentary formations of the upper Carboniferous–lower Permian Koldar Formation.
Tectonically, the ore-bearing Koldar massif is located in the southeastern part of the Bakanas Synclinorium, within the northeastern segment of the Hercynian Pribalkhash-Ili andesite-intrusive-volcanic belt of the Dzungarian-Balkhash fold system. From a metallogenic perspective, this volcano-plutonic complex forms part of the Balkhash Copper Belt, which concentrates several major deposits, including Karatas, Kounrad, Sayak, and Aktogay, as well as numerous smaller occurrences. Long-lived fault systems and tectonic disturbances play a crucial role in both the geological architecture and the mineralization processes of the massif. Many of these structures originated during early stages of crustal development and remained active until the Alpine orogeny.
The Koldar intrusion exhibits a laccolithic morphology and comprises three distinct magmatic phases: an early phase of gabbro-diorites, gabbro-diabases, diorites, and granodiorites; an intermediate phase of biotite granites; and a late phase characterized by porphyritic granites and granite-porphyries [69].
Ore mineralization typically gravitates towards uplifts located in the marginal parts of anticlinoria or within the anticlinal limbs of their deposits. It is commonly associated with zones of blind deep-seated faults trending sub-latitudinal, northwesterly, and northeasterly, which serve as feeder channels for both magmatic and hydrothermal systems.
The mineralization is very closely spatially linked with stocks, dike-like bodies, and dikes of granodiorite-plagiogranite-porphyries and quartz diorite-porphyrites, which are considered additional intrusions related to the main phase. In some deposits, annular and semi-annular dikes are widely present, clearly delineating the boundaries of volcanotectonic structures. Porphyry copper mineralization is localized within hydrothermally altered rocks that are, to varying degrees, saturated with quartz, sometimes potash feldspar-quartz, and less commonly other compositions of veinlets containing copper and molybdenum sulfides. Monoquartz bodies and sericite-quartz, quartz-sericite metasomatites are widely developed, which are replaced by zones of weak quartz-chlorite-sericite alteration towards the periphery, and then by propylites and unaltered rocks. Mineralization here is localized mainly in zones of development of weak quartz-chlorite-sericite alteration and is occasionally superimposed on the propylite zone.
Zones of hydrothermally altered rocks with mineralization are often marked by local lows in magnetic and gravity fields. Conversely, the ore-hosting granitoids and volcanics are distinguished by large positive magnetic and gravimetric anomalies.
The Koldar ore cluster has prognostic resources (P2+P3 categories) of up to 15 million tons of copper, 276 thousand tons of molybdenum, and 60 tons of gold.
3. Materials and Methods
3.1. Data
In this study, satellite and geophysical datasets were processed and integrated to delineate prospective zones of copper mineralization. The satellite data included a digital elevation model (DEM), ASTER multispectral imagery, WorldView-3 high-resolution multispectral imagery, and PRISMA hyperspectral imagery.
The DEM was derived from ALOS-PALSAR FBS (Fine Beam Single polarization mode, HH) RT1 (Radiometrically Terrain Corrected) data, with a spatial resolution of 12.5 meters, obtained from the Alaska Satellite Facility (https://asf.alaska.edu/).
The ASTER image was selected based on two primary criteria. First, its 60 × 60 km scene size provided complete coverage of the study area within a single frame. Second, to ensure the capture of the full spectral range, data acquired prior to 2008 were necessary due to the failure of ASTER's shortwave infrared (SWIR) sensor in that year. Given that commercial mining at the Aktogay deposit commenced in 2015, a scene from August 30, 2004 (AST_L1B_0030830200200404054250_20240619115630_2680975) was chosen. This allowed for analysis unaffected by surface alterations resulting from subsequent mining activities. This image was downloaded from the official NASA Earthdata platform (https://search.earthdata.nasa.gov/).
The PRISMA image, acquired by the Italian Space Agency's hyperspectral satellite (https://prisma.asi.it) launched in 2019, provides data across 239 spectral channels within the 400–2500 nm range, encompassing visible, near-infrared, and shortwave infrared bands [70,71]. This extensive spectral resolution offers significant advantages for various geological exploration applications. The PRISMA scene from April 2, 2024 (PRS_L2D_STD_2024040202053906_2024040202053911_0001), was selected due to minimal cloud cover and moderate vegetation development. Despite being the early growing season, the semi-desert landscape's sparse vegetation allowed for effective detection of spectral features indicative of hydrothermal alteration.
All aforementioned ASTER and PRISMA remote sensing data are publicly available and can be downloaded free of charge after user registration.
A WorldView-3 image covering 25.4 km² of the Aidarly deposit was acquired commercially on May 11, 2019. WorldView-3 is a commercial high-resolution multispectral satellite equipped with multiple sensors. Operating in a 617 km orbit, it provides imagery with a spatial resolution of 31 cm in panchromatic mode, 1.24 m in multispectral mode, 3.7 m in SWIR, and 30 m with the CAVIS (Clouds, Aerosols, Vapors, Ice, and Snow) instrument. The satellite features a revisit time of less than one day. Owing to its ultra-high spatial resolution, WorldView-3 imagery complemented ASTER and PRISMA data, enabling detailed mapping of mineralized zones and refinement of geological structures.
Together, ASTER, PRISMA, and WorldView-3 provide complementary datasets that, when integrated, offer a robust basis for mineral exploration. A detailed characterization of these datasets is presented in Table 1.
At copper porphyry ore deposits, characteristic zonal complexes of hydrothermal alteration minerals are often observed. [72]. These minerals possess unique spectral absorption features across the Visible-Near-Infrared (VNIR), Shortwave Infrared (SWIR; 0.4–2.5 µm) and Thermal Infrared (TIR; 8.0–14.0 µm) wavelength ranges [73,74].
To remotely map and identify these hydrothermally altered rocks using ASTER, PRISMA, and WorldView-3 data, we compared the spectral signatures of image pixels with library spectral datasets of these minerals [75,76,77].
The spectral reflectance curves of indicator minerals for porphyry copper deposits exhibit characteristic absorption features that can be effectively detected by the ASTER, WorldView-3, and PRISMA sensors (Figure 2). ASTER, with its shortwave infrared (SWIR) bands, is particularly sensitive to absorption features associated with Al–OH and Fe–OH bearing minerals such as muscovite, kaolinite, and chlorite, typically around 1.6–2.4 µm. WorldView-3, due to its high spatial resolution and 8 SWIR bands, captures subtle variations in mineral spectra, enabling detailed mapping of alteration zones with diagnostic absorption features in the 1.2–2.3 µm range. PRISMA, as a hyperspectral sensor, provides continuous spectral coverage across the visible to SWIR range (0.4–2.5 µm), allowing for precise identification of diagnostic absorption features of key alteration minerals, including both phyllosilicates and carbonates. Together, these sensors enable the recognition of mineral-specific spectral patterns critical for discriminating hydrothermal alteration zones associated with porphyry copper systems.
Propylitic alteration is characterized by the development of chlorite, epidote, and calcite, which exhibit diagnostic absorption features primarily in the shortwave infrared (SWIR) region. Chlorite shows a broad absorption feature centered around 2.29-2.35 µm (Figure 3), associated with Fe-OH and Mg-OH vibrational modes. This feature is partially captured by ASTER Band 8 and is more clearly resolved in WorldView-3's SWIR Bands 7 and 8. PRISMA’s high spectral resolution allows for accurate identification and separation of chlorite from spectrally similar minerals. Epidote exhibits an absorption feature near 2.34 µm (Figure 3), which may overlap with chlorite but remains distinguishable using WorldView-3 and PRISMA data due to subtle shifts in reflectance minima. Calcite is recognized by a shallow absorption around 2.33-2.35 µm (Figure 3). These spectral responses enable the delineation of propylitic zones in the peripheral parts of porphyry systems.
Phyllic alteration is typically associated with illite, muscovite, quartz, and pyrite, with illite and muscovite providing the most distinctive spectral signatures in the SWIR region. Both minerals exhibit a sharp absorption feature near 2.20 µm related to Al–OH bonds (Figure 3), which is captured by ASTER Band 6 and effectively distinguished by the higher spectral fidelity of WorldView-3 and PRISMA. Illite tends to show a slightly shallower and broader absorption feature than muscovite, which can be resolved using the dense spectral sampling of PRISMA or the high spatial resolution of WorldView-3. Quartz and pyrite are spectrally neutral in the SWIR region, exhibiting minimal absorption features, but their presence can be inferred indirectly through associated mineral assemblages. The distinct Al–OH absorption around 2.20 µm allows reliable mapping of phyllic alteration zones (Figure 3), particularly in the central parts of porphyry systems.
Argillic alteration is dominated by kaolinite and alunite, both of which exhibit strong and diagnostic spectral features in the SWIR region. Kaolinite is characterized by a doublet absorption near 2.16 and 2.20 µm due to Al–OH vibrations (Figure 3), and a shoulder around 1.4 µm associated with OH stretching (Figure 3). These features are partially resolved by ASTER (Bands 5 and 6), better separated by WorldView-3, and most precisely defined in PRISMA hyperspectral imagery. Alunite displays a sharp absorption near 2.17 µm and secondary features at 1.48 and 1.77 µm (Figure 3), enabling confident identification in high-resolution datasets. PRISMA, with its continuous spectral coverage, offers the most effective discrimination between kaolinite, alunite, and other clay minerals. The clear and narrow absorption features of these minerals make them reliable indicators of advanced argillic alteration, often associated with high-sulfidation epithermal environments and the upper zones of porphyry systems.
Geophysical data for this study included magnetic and gravity fields. Magnetic data were obtained from the Republican Geological Fund of Kazakhstan. The averaged map of magnetic field anomalies (∆Тa) for the Bakanas synclinorium at a scale of 1:200,000, com-piled by the South Kazakhstan Geophysical Expedition in 1978, was used as a source of magnetic information [78]. Gravity data were represented by a Bouguer anomaly map calculated using a reduction density of 2.67 g/cm³, for which a certificate of authorship was previously obtained [79].
3.1. Methods
3.1.1. Lineament Analysis
To identify ore-controlling brittle structures (lineaments), we used remote sensing methods. Known porphyry copper deposits of the Koldar massif served as reference objects for verifying our results.
The primary input data was the ALOS DEM. The DEM was chosen due to its superior accuracy in identifying lineaments compared to optical imagery [80,81]. This is because many DEMs are generated from radar data, which offers significant advantages over optical data: they can acquire images at any time of day and in any weather, and they can detect objects invisible in the optical or infrared spectrum, including those hidden beneath snow, vegetation, or even below the Earth's surface. The complete data processing workflow is illustrated in Figure 4.
The methodological framework for lineament extraction comprised six sequential stages:
- 1)
- geological and tectonic analysis of the study area;
- 2)
- preprocessing of DEM data (hillshading);
- 3)
- automatic lineament extraction;
- 4)
- post-processing and manual filtering;
- 5)
- calculation of quantitative indicators, including rose diagrams and lineament density; and
- 6)
- validation using ground-truth data and production of final outputs.
The initial step involved reviewing geological maps and reports to understand the regional tectonic framework. Hillshade images were generated to enhance topographic contrast and facilitate better visualization of structural features. Following methodologies reported by [81,82,83], hillshading was applied using eight azimuth directions (0°, 45°, 90°, 135°, 180°, 225°, 270°, and 315°), with a fixed altitude angle of 45°, which proved effective for the local terrain. Hillshades were produced using the 3D Analyst tool in ArcMap.
Subsequently, automatic lineament extraction was carried out using the LINE mod-ule in PCI Geomatica. This module employs a three-step algorithm involving edge detec-tion, thresholding, and curve extraction. The algorithm relies on six configurable parame-ters [80,81,82,83,84,85]:
RADI: filter radius
GTHR: edge gradient threshold
LTHR: minimum curve length
FTHR: line fitting tolerance
ATHR: angular difference threshold
DTHR: link distance threshold
The optimal parameter values were determined through experimental tuning and literature references [80,81,82,83,84,85], taking into account terrain characteristics, image resolution, and the geological context (see Table 2).
After automated extraction, vectorized lineaments were manually filtered to elimi-nate false positives such as roads, railways, and anthropogenic features. While algorith-mic filtering can sort features based on length, shape, and orientation, visual inspection remains essential to ensure geological relevance. This involved comparing extracted fea-tures with known infrastructure and topographic maps.
To analyze the structural orientation, rose diagrams were generated using Rock-Works software. Additionally, a lineament density map was created in ArcMap using the Line Density tool, which calculates density as the total lineament length per unit area (km/km²).
3.1.2. Spectral Analysis
Pre-processing. All satellite images were selected to be cloud-free and with minimal vegetation cover to enhance the spectral contrast of lithological units. The ASTER (Level 1T) and WorldView-3 datasets were obtained as orthorectified images, but without radiometric or atmospheric corrections. Therefore, as part of the preprocessing workflow, both datasets were first subjected to radiometric correction by converting digital numbers (DN) into radiance values, accounting for sensor-specific calibration coefficients and acquisition geometry.
Subsequently, atmospheric correction was performed using the FLAASH (Fast Line-of-sight Atmospheric Analysis of Spectral Hypercubes) module in the ENVI software environment. The Mid-Latitude Summer (MLS) atmospheric model was selected to match the latitude of the study area (~46°N), while the "Rural" aerosol model was used to represent the natural, low-pollution characteristics of the region. FLAASH converts radiance data to surface reflectance, enabling reliable spectral analysis.
The PRISMA hyperspectral image was downloaded at Level 2D from the official ASI-PRISMA catalog (https://prisma.asi.it/), which provides atmospherically corrected, geocoded reflectance products using MODTRAN-based look-up tables (LUTs). Preprocessing of the PRISMA 2D data involved additional refinement steps to enhance spectral reliability. Specifically, noisy spectral bands located at the edges of the spectral range, unstable or dead detector channels, and regions heavily affected by atmospheric water vapor absorption (e.g., 1340–1450 nm and 1800–1950 nm) were excluded due to low signal-to-noise ratios.
Further, all pixels with invalid values (NaN), resulting from residual cloud contamination, instrument noise, or sensor limitations, were removed from the dataset. Since Level 2D data are already atmospherically corrected and expressed as surface reflectance, no additional atmospheric processing was required. To further enhance spectral stability, a Savitzky–Golay filter was applied to the reflectance spectra. This smoothing technique efficiently reduces high-frequency noise while preserving key spectral absorption features critical for mineralogical interpretation.
Thematic processing. To facilitate visual interpretation of hydrothermal alteration zones, FCC (False-Color Composite) imagery was generated from ASTER and PRISMA data using combinations of spectral bands sensitive to specific alteration minerals. Unlike standard RGB composites, FCCs incorporate infrared and SWIR bands, which enhance mineralogical contrasts by exploiting differences in surface reflectance. For example, secondary clays, ferruginous compounds, and silica exhibit distinct spectral characteristics that, in specific band combinations, appear as diagnostic colors (e.g., red, purple, or blue), effectively distinguishing altered from unaltered lithologies. This method supports rapid identification of alteration zones, geologic unit discrimination, detection of linear and ring structures, and preliminary localization of mineralized areas. FCC visualization has been widely recognized as a robust tool for the initial interpretation of both multispectral and hyperspectral data in geological studies [46,86].
To map hydrothermal alteration types-such as propylitic and argillic alterations-at the Aidarly copper porphyry deposit, the SAM (Spectral Angle Mapper) algorithm was applied. SAM is a supervised classification technique that quantifies the spectral similarity between image pixels and reference spectra in n-dimensional reflectance space, making it well-suited for mineral mapping applications [87,88]. This analysis utilized WorldView-3 data, which offers high spatial resolution (1.24 m) and moderate spectral resolution (8 VNIR (near-infrared) and 8 SWIR bands), enabling detailed delineation of mineralized zones.
SAM angle thresholds were empirically determined through iterative classification and validation against known alteration zones. Optimal classification performance was achieved using a spectral angle threshold of α = 0.85 for phyllic alteration and α = 0.75 for argillic alteration, balancing classification sensitivity with exclusion of background noise.
All preprocessing and thematic analyses, including atmospheric correction, spectral normalization, and supervised classification, were conducted using ENVI software. Visualization, spatial mapping, and further analysis of classified outputs were carried out in the ArcGIS environment.
3.1.3. Geophysical Processing
The raw geophysical field data were processed using Geosoft Oasis Montaj. Initially, the total magnetic intensity (TMI) data were corrected by subtracting the International Geomagnetic Reference Field (IGRF) to obtain the residual magnetic intensity (RMI). Subsequently, a reduction-to-the-pole (RTP) filter was applied to the RMI data to reposition anomalies directly over their sources, thus simplifying interpretation in areas with moderate to high magnetic inclinations.
Gravity data, represented by the Bouguer anomaly map (calculated using a reduction density of 2.67 g/cm³), were also transformed into a residual gravity anomaly map to isolate local variations by removing regional trends.
To enhance the interpretability of potential field data, a suite of derivative-based filters was applied, including:
Analytic Signal (AS), which highlights the edges of magnetic and gravity sources and enhances local anomalies by combining the horizontal and vertical gradients;
First Vertical Derivative (1VD), useful for enhancing shallow features and delineating structural boundaries;
Tilt Derivative (TDR), which emphasizes the transition zones between positive and negative anomalies;
Total Horizontal Derivative (HD or THDR) of the TDR, which aids in edge detection and boundary delineation of subsurface bodies.
The AS is particularly effective for identifying geological contacts and boundaries of magnetized bodies. It is calculated using the equation 1:
where M is the magnetic field, and the partial derivatives represent the gradients in the x, y, and z directions [89].
The VD of magnetic data is widely used in geophysical interpretation to enhance near-surface features while suppressing the effect of deep-seated sources. This technique increases the resolution of shallow anomalies, making it particularly valuable for identifying surface and sub-surface geological structures such as faults, fractures, dikes, and small ore bodies [90,91].
The VD filter emphasizes the rate of change of the magnetic field with depth, effectively highlighting discontinuities and abrupt variations in the magnetic field associated with structural and lithological boundaries.
The 1VD derivative of the magnetic field is calculated using the following equation 2:
where M is the magnetic field intensity and z is the vertical direction (depth). This derivative is typically implemented using frequency-domain techniques such as the Fourier transform, where vertical derivatives are calculated by multiplying the frequency spectrum of the magnetic data by a factor proportional to the wavenumber.
By applying the VD filter, geoscientists can obtain a clearer image of near-surface features, thereby improving the delineation of ore-controlling structures and enhancing the accuracy of geological interpretations.
The TDR is one of the most widely used edge detection filters in potential field data interpretation due to its ability to enhance shallow subsurface features without amplifying the high-frequency noise typically associated with higher-order vertical derivatives [92]. It is especially useful for mapping subtle magnetic lineaments related to faults, dikes, and lithological contacts.
TDR is calculated using the following equation 3:
where:
VD is the first vertical derivative of the magnetic field.
This arctangent relationship provides a normalized result in radians or degrees, allowing consistent interpretation of shallow and deep magnetic sources across varying geological conditions.
The HD TDR is a compound filter that enhances the edges of magnetic anomalies by detecting the maximum values located at the boundaries or corners of magnetic bodies [93]. This technique is particularly effective for delineating the edges of large and complex geological features. The HD TDR is calculated using the following equation 4:
where TDR is the tilt derivative, and x, y are the horizontal spatial directions. This filter measures the spatial gradient of the tilt derivative, thereby highlighting structural boundaries with high precision.
These derivatives significantly enhance the interpretability of geophysical data by emphasizing subtle variations in the magnetic and gravity fields. This, in turn, facilitates the identification of critical geological features such as mineralized zones, fault systems, lithological boundaries, and igneous intrusions.
4. Results
4.1. Analysis of Lineaments and Structural Density
The study analyzed eight hillshaded images generated from ALOS DEM data, covering an area of approximately 1215 km². It was observed that the azimuthal direction of illumination during hillshading directly influences the orientation of extracted lineaments. For instance, hillshades with azimuths of 90° and 270° emphasize lineaments with a predominant N–S orientation, while those at 135° and 315° highlight NE–SW oriented features. To ensure an objective and reliable result, all eight directions were processed and analyzed. The lineament field was extracted from the hillshaded images using the LINE module with the parameter set presented in Table 2.
The automatic extraction followed by manual filtering resulted in a total of 593 lineaments, ranging in length from 600 to 6152 meters. These lineaments are interpreted as crustal faults within the study area. They exhibit a linear geometry and possess key characteristics typical of tectonic structures in the region.
The next stage involved the calculation of quantitative indicators for the lineament field, including lineament density and rose-diagram construction (Figure 5). Rose-diagrams were generated within the boundaries of the Koldar Massif for both the extracted lineaments and faults derived from a 1:50,000-scale geological map (Figure 1). The rose-diagram for the extracted lineaments (Figure 5c) reveals three dominant orientation trends, which align with the structural patterns identified through ground-based geological mapping (Figure 5d). Statistical analysis indicates that sublatitudinal, NW–SE, and NE–SW fault orientations predominate in the study area. Most of the lineaments fall within the length range of 0.6–1.0 km (Figure 5a).
Lineament density values range from 0 to 3.5 km/km² (Figure 5b). However, the most geologically significant range in terms of ore mineralization potential lies between 2 and 3.5 km/km². These zones exhibit a high concentration of tectonic features that likely enhance rock permeability and could serve as pathways for hydrothermal fluid migration. Notably, areas with this level of lineament density spatially coincide with known porphyry copper deposits such as Aidarly and Aktogay, supporting their tectonic and hydrogeological significance during ore formation.
This correlation suggests that elevated lineament density is not merely a geomorphological characteristic, but a potential indirect predictor of mineralization. High-density zones may indicate regions of tectonic preparation conducive to porphyry copper deposition, especially at intersections or junctions of structures of different genetic origins. Therefore, areas with a lineament density exceeding 2 km/km² should be considered high-priority targets for further exploration activities.
4.2. False-Color Composites
To effectively map hydrothermal alteration zones within the Koldar Massif, data from two different satellite systems were utilized, each providing results at varying levels of spatial and spectral detail. In this study, two FCC were constructed using ASTER and PRISMA imagery. For ASTER, bands SWIR 4, 6, and 8 were used, while for PRISMA, SWIR bands 77, 133, and 150 were selected (Figure 6-7). Specific band combinations were chosen based on the analytical objectives and the spectral properties of the target materials.
Experimental analyses of ASTER imagery demonstrated that the RGB combination 4-6-8 was the most effective for identifying alteration zones in porphyry copper deposits. Depending on the ore deposit type, the presence of alteration zones can be a strong indicator of potential mineral resources in the region [94]. For instance, the occurrence of chlorite is particularly important for this deposit type. In Figure 6, zones of propylitic alteration are marked in green, while zones of phyllic alteration appear in pink hues. This color distinction is attributed to the high reflectance of alunite, kaolinite, and muscovite in band 4, compared to bands 6 and 8 [95].
Phyllic alteration can be recognized by the presence of sericite (or muscovite), which exhibits strong spectral absorption in the Al-OH feature, especially in ASTER band 6, with a weaker response in band 8 [96].
Figure 7 presents a hydrothermal alteration map generated using the FCC method applied to PRISMA hyperspectral imagery for the study area. Bright pink pixels within specific lithological units delineate the spatial distribution of phyllic alteration zones, while green pixels correspond to propylitic alterations. The resulting image provides valuable insight into the identification of hydrothermal alteration zones potentially associated with copper mineralization.
In the Koldar Massif, the propylitic alteration zones are characterized by significant concentrations of chlorite and epidote, indicative of low-temperature metamorphic processes. The phyllic alteration zones, represented by fine-layered metamorphic rocks, contain sericite, quartz, and pyrite, which further supports evidence of hydrothermal activity. These results enable more precise delineation of mineralized zones, thus informing targets for future detailed exploration.
4.3. Spectral Angle Mapper
Hydrothermal porphyry deposits are characterized by various mineralogical alteration zones, such as phyllic, argillic, and propylitic. The FCC method enabled the identification of phyllic and propylitic alterations, while the SAM method applied to WorldView-3 imagery revealed argillic and propylitic alterations at the Aidarly deposit. The processing of WorldView-3 multispectral data resulted in clearly delineated zones of hydrothermally altered minerals at Aidarly, which correlate well with the known geological structure of the deposit. Moreover, a similar hydrothermally altered zone was identified north of the Aidarly deposit, exhibiting comparable structural characteristics (Figure 8).
4.4. Magnetic Conversions
TMI map of the study area is dominated by elongated positive anomalies with intensities ranging from 6 to 11 nT. These zones are associated with volcanogenic formations of terrigenous andesite-dacite, andesite-basalt-rhyolite, and andesite-rhyolite assemblages. Smaller negative magnetic anomalies, reaching values down to –3 nT in the northern part of the area, are related to the volcanogenic-sedimentary rocks of the Koldar Suite (Figure 9a). The maximum value of the AS exceeds 0.006 nT/m, while values within the Koldar massif vary from 0.000016 to 0.002 nT/m, indicating a weak magnetic signature (Figure 9b). Two local minima can be distinguished: one in the northern part of the massif with an isometric rounded shape, and another in the northwest with an irregular shape. It is important to note that these values are relative and should not be interpreted as definitive boundaries of ore bodies.
The maps presented in Figure 10 correspond to: (a) 1VD, (b) TDR, and (c) HD TDR. The 1VD filter effectively suppressed regional magnetic anomalies, thereby enhancing shallow anomalies that reflect structural features of the Koldar massif. The TDR method facilitated the delineation of structural units that may correspond to faults and lineaments within the study area. Figure 10b clearly reveals elongated linear anomalies, predominantly trending north and northwest. The HD TDR highlighted magnetic anomalies with greater intensity, which may indicate the presence of concealed geological bodies. Although the general outlines resemble those produced by the TDR, the HD TDR revealed subtler variations in the magnetic field that might not have been detected through conventional data processing, making it a valuable tool for refining geological models (Figure 10c).
4.5. Gravic Conversions
The gravity field, converted into the Bouguer anomaly for the study area, reveals two prominent features: The Koldar positive anomaly and the Kyzylkaynar negative anomaly. The Koldar anomaly is located in the area of the eponymous mountains and occupies the central portion of the study area. It extends approximately 46 km in length and 33 km in width, with a predominant northwest orientation and a northeast-trending apophysis. The anomaly is characterized by medium intensity and is complicated by a series of superimposed local anomalies of higher orders, which correspond to intermediate and mafic intrusive bodies of the Koldar massif.
The Kyzylkaynar negative anomaly is situated in the northeastern part of the study area and also trends northwest. It corresponds to the surface exposure of intrusive rocks of granite–granodiorite composition (Figure 11a). While the Bouguer anomaly map can provide insights into the geometry and lithology of subsurface rocks, the observed anomalies are influenced by regional effects caused by deep-seated sources. To improve interpretation of near-surface features, mathematical transformations were applied to the gravity data.
The TDR is a transformation that provides a more balanced enhancement of gravity field data, particularly useful for detecting the position and orientation of density contrasts (anomalies). It is especially effective for delineating the boundaries and spatial extent of anomalous bodies, offering a more robust approach than using the 1VD derivative alone. The TDR technique helps clearly define anomaly edges, as the tilt angle is typically zero over the center of an anomaly and changes markedly at its boundaries (Figure 11b).
The HD TDR is a combined derivative measure that captures variations in all horizontal directions. It enhances the detection of edges or boundaries of gravity anomalies in the horizontal plane. As HD TDR applies a horizontal derivative to the tilt derivative, it improves the resolution of anomaly boundaries and localization of geological features. This transformation yielded clearer identification of local maxima and the delineation of geological contacts (Figure 11c).
5. Discussion
The spatial-genetic relationship between hydrothermal ore bodies and faults is considered one of the most promising hypotheses in geology for mineral deposit prediction. Earth's crustal fault systems act as conduits for the migration of ore-bearing fluids and organic compounds, playing a crucial role in forming deposits or creating necessary conditions for mineral accumulation [97,98,99]. Thus, faults are a primary factor in mineralization, especially of hydrothermal origin.
The morphology of the Koldar intrusive massif is structurally controlled by fault systems associated with hydrothermal activity. The delineated lineaments (Figure 5a) reflect vertical permeable structures that facilitated fluid migration from magmatic sources to ore-bearing structures in the upper crust. The Aktogay and Aidarly deposits formed under the influence of the sub-latitudinal Aktogay fault system (280-310°), while the Kyzylkiya deposit was influenced by northwesterly (azimuth 70-80°) and northeasterly (azimuth 280-310°) trending faults [100,101]. Lineament analysis within the study area revealed three dominant orientations: sub-latitudinal (270-280°), northwesterly (320-330°), and northeasterly (60-70°), as shown in the rose diagram (Figure 5c).
The lineament density map (Figure 5b) demonstrates a high concentration of faults and fractures within the Koldar massif. This indicates the presence of highly permeable zones and confirms the genetic link between fault tectonics and copper mineralization [102,103].
High-temperature hydrothermal fluids, enriched in potassium and hydrogen, cause significant mineralogical changes, forming characteristic potassic, phyllic, and propylitic zones in porphyry copper occurrences [104,105,106]. Minerals in these zones exhibit distinct spectral absorption features across the visible, VNIR, SWIR, and TIR (thermal infrared) electromagnetic spectrum ranges. These diagnostic features enable the effective detection and mapping of hydrothermal alteration zones using remote sensing data [96,107,108,109]. Spatial correlation of reference points, identified from the spectral signatures of hydrothermal alteration zones in the Aktogay copper mine area, showed an overall accuracy exceeding 71% based on field work results [110].
Considering the diverse spectral signatures of hydrothermal zones associated with porphyry copper systems, ASTER, PRISMA, and WorldView-3 data were utilized in this study. ASTER imagery showed strong correlation with petrographic data, while PRISMA imagery provided a more comprehensive view of hydrothermal alteration zones. As depicted in Figure 7, phyllic alteration, associated with sericite and muscovite (minerals typically formed by weakly acidic hydrothermal fluids), was identified in the central parts of the Aktogay, Aidarly, and Kyzylkiya deposits. These phyllic zones are encircled by propylitic alteration, linked to epidote, chlorite, and calcite minerals, indicating the influence of lower-temperature hydrothermal fluids.
WorldView-3 data processing, owing to its higher spectral and spatial resolution in the VNIR and SWIR bands, allowed for the identification of argillic and propylitic alteration zones at the Aidarly deposit and revealed a new prospective zone to the north (Figure 8). Argillic alteration is associated with clay minerals such as kaolinite and montmorillonite, indicative of intense hydrothermal activity, whereas propylitic alteration is characterized by elevated chlorite and epidote content, typically resulting from low-temperature metamorphic processes.
To suppress regional anomalies and enhance near-surface signals related to various structural features, as well as to delineate geological boundaries between different structural domains, geophysical data transformation was performed. Magnetic maps showed moderate magnetic susceptibility over the deposits due to the absence of strongly magnetic minerals. According to [111], alteration zones at the Aktogay deposit consist of potassium feldspar, biotite, albite, and quartz-sericite, all of which exhibit weak magnetization. The results of magnetic and gravity TDR and HD TDR are in good agreement, delineating altered zones in the southern part of the Koldar massif and a linear anomaly extending from north to northwest. These results reflect the fractured nature of the massif, a key indicator of structural prospectivity for mineralization.
The main outcome of this study is a map of prospective zones for copper mineralization in the Koldar massif (Figure 12), generated through a comprehensive application of methods. Four evidential layers were used for its creation: lineament density, hydrothermal alteration from PRISMA data, and magnetic and gravity anomalies. All layers were normalized to a scale of 0 to 1 and integrated into ArcGIS. Each input layer was divided into ten classes and assigned an equal weight of 25% in the final analysis.
Highly prospective areas, totaling approximately 25 km² or 20% of the massif's total area, were delineated (Figure 12a). The Kyzylkiya deposit in the northeastern part of the massif was identified as a prospective zone. The Aktogay deposit is characterized by a broad outer halo favorable for potential mineralization. An irregularly shaped prospective zone was also identified around the Aidarly deposit. Moreover, an anomalous zone located to the north (Figure 12b) is distinctly visible on the hydrothermal alteration map derived from WorldView-3 data using the SAM method (Figure 8).
Some highly prospective areas identified in the southern, northern, and western parts of the massif, given their geological setting, fall within Quaternary deposits. This is attributed to false-positive results obtained from PRISMA data, caused by anthropogenic factors: in the south, by a drying water body, and in the west, by sand dunes and salt flats due to their proximity to the eastern shore of Lake Balkhash.
Considering that this massif had not been thoroughly studied using satellite methods previously, the obtained results fill a significant knowledge gap, offering a comprehensive approach by integrating ground-based and satellite data. Unlike costly and labor-intensive ground surveys, satellite data can be acquired remotely, significantly reducing expenses and effort. Furthermore, most regional studies in this area were conducted in the 1990s using the technologies available at that time. Modern satellite data allow for the actualization and detailed refinement of previously obtained results, complementing them with highly precise and large-scale remote sensing.
The main advantages of this study lie in its comprehensive approach, combining ground-based and remote sensing data, and in the successful processing of high-quality WorldView-3 multispectral imagery, which enabled the mapping of a new prospective zone.
6. Conclusions
In this study, geophysical and satellite methods were utilized to construct a mineral prospectivity map for copper. Hyperspectral processing data expanded our understanding of hydrothermal alteration zones associated with porphyry copper deposits, building upon information obtained via ASTER. The SAM method, applied to WorldView-3 imagery, effectively mapped areas of argillic and propylitic hydrothermal alteration at the Aidarly deposit and also identified a new prospective area to its north. Lineament density analysis confirmed the theory of fault tectonics as a controlling factor in copper deposit formation. The transformation of geophysical data, specifically magnetics and gravity, allowed for the removal of regional background noise and the clear delineation of geological features and structural unit boundaries.
The resulting map of prospective zones for porphyry copper mineralization successfully highlighted the Aktogay, Aidarly, and Kyzylkiya deposits, indicating the map's high validation. Furthermore, an area adjacent to the Aidarly and Aktogay deposits was identified, suggesting the underestimated potential of these territories. This may indicate the need for more thorough investigation of these areas to refine geological characteristics and assess potential mineral reserves.
Future research will focus on deepening and detailing the obtained results through the use of high-resolution hyperspectral imagery, the implementation of machine learning to improve data clustering and determine the relevance of each method, the conduct of local geochemical and geophysical surveys to confirm the results of high-quality spectral analysis, and the creation of 3D models of prospective territories for a more comprehensive understanding of their geological structure.
Author Contributions
Conceptualization, D.T., A.V.; methodology, D.T., E.S., Z.S.; validation, D.T., A.V., E.S., ; formal analysis, D.T., Z.S.; investigation, D.T., E.S., H.A.; data curation, E.O., N.S., B.I.; writing—original draft preparation, D.T.; writing—review & editing, D.T., A.V., N.S.; visualization, D.T., A.B.; project administration, E.O., B.I.; funding acquisition, E.O., B.I. All authors have read and agreed to the published version of the manuscript.
Funding
The research was funded by the Committee of Science of the Ministry of Science and Higher Education of the Republic of Kazakhstan (Grant No. BR21882179).
Conflicts of Interest
The authors declare no conflicts of interest. The funders had no role in the design of the study; in the collection, analyses, or interpretation of data; in the writing of the manuscript; or in the decision to publish the results.
Abbreviations
The following abbreviations are used in this manuscript:
| DEM | Digital Elevation Model |
| SWIR | Shortwave Infrared |
| VNIR | Near-Infrared |
| TIR | Thermal Infrared |
| FLAASH | Fast Line-of-sight Atmospheric Analysis of Spectral Hypercubes |
| FCC | False-Color Composite |
| SAM | Spectral Angle Mapper |
| TMI | Total Magnetic Intensity |
| RMI | Residual Magnetic Intensity |
| AS | Analytic Signal |
| 1VD | First Vertical Derivative |
| TDR | Tilt Derivative |
| HD or THDR | Total Horizontal Derivative |
References
- S&P Global Inc. Annual Report 2022 – Powering Global Markets; S&P Global Inc.: New York, NY, USA, 2023; pp. 1–200. Available online: https://www.spglobal.com/en/annual-reports/2022 (accessed on 10 June 2025).
- Li, C.; Shen, P.; Pan, H. Mineralogy of the Aktogai Giant Porphyry Cu Deposit in Kazakhstan: Insights into the Fluid Composition and Oxygen Fugacity Evolution. Ore Geol Rev 2018, 95. [CrossRef]
- Seltmann, R.; Porter, T.M. 2005-The Porphyry Cu-Au/Mo Deposits of Central Eurasia: 1. Tectonic, Geologic & Metallogenic Setting and Significant Deposits. PGC Publishing 2005, 2, 467–512.
- Leriche, A.; Tims, S.; Saunders, E.; Mohr, P. Geotechnical Domaining for the Aktogay Porphyry Deposit Supported by Machine Learning Techniques.; October 2022.Author 1, A.B.; Author 2, C.D. Title of the article. Abbreviated Journal Name Year, Volume, page range.
- Ngcofe, L.; Minnaar, H.; Halenyane, K.; Chevallier, L. Multispectral and Hyperspectral Remote Sensing: Target Area Generation for Porphyry Copper Exploration in the Namaqua Metamorphic Province, South Africa. South African Journal of Geology 2013, 116. [CrossRef]
- Hosseinjani Zadeh, M.; Tangestani, M.H.; Velasco Roldan, F.; Yusta, I. Spectral Characteristics of Minerals in Alteration Zones Associated with Porphyry Copper Deposits in the Middle Part of Kerman Copper Belt, SE Iran. Ore Geol Rev 2014, 62. [CrossRef]
- Sojdehee, M.; Rasa, I.; Nezafati, N.; Abedini, M.V. Application of Spectral Analysis to Discriminate Hydrothermal Alteration Zones at Daralu Copper Deposit, SE Iran. Arabian Journal of Geosciences 2016, 9. [CrossRef]
- Tshanga M, M.; Ncube, L.; van Niekerk, E. Remote Sensing Insights into Subsurface-Surface Relationships: Land Cover Analysis and Copper Deposits Exploration. Earth Sci Inform 2024, 17, 3979–4000. [CrossRef]
- Sabbaghi, H.; Moradzadeh, A. ASTER Spectral Analysis for Host Rock Associated with Porphyry Copper-Molybdenum Mineralization. Journal of the Geological Society of India 2018, 91. [CrossRef]
- Mohammadi, F.A.; Amin, Z.M.; Ahmad, A. Bin Lineament Assessment of Aynak Copper Mine Using Remote Sensing Approach. In Proceedings of the IOP Conference Series: Earth and Environmental Science; 2020; Vol. 540.
- Ramezani, T.; Maanijou, M.; Taghavi, A.; Lentz, D.R. Influence of Tectonic Factor on Porphyry Copper Deposits Localization and Distribution (Arasbaran District, NW Iran): Synthesis of Alteration Patterns and Lineaments Using Digital Techniques. Geotectonics 2022, 56. [CrossRef]
- Decrée, S.; Robb, L. Ore Deposits: Origin, Exploration, and Exploitation; 2019;
- Hobbs, B.E. The Use of Structural Geology in the Mineral Exploration Industry. Australian Journal of Earth Sciences 2023, 70.
- Peters, S.G.; Jiazhan, H.; Zhiping, L.; Chenggui, J. Sedimentary Rock-Hosted Au Deposits of the Dian-Qian-Gui Area, Guizhou, and Yunnan Provinces, and Guangxi District, China. Ore Geol Rev 2007, 31. [CrossRef]
- Peters, S.G. USE OF STRUCTURAL GEOLOGY IN EXPLORATION FOR AND MINING OF SEDIMENTARY ROCK-HOSTED AU DEPOSITS Open-File Report 01-151;
- Akbarpour, A.; Vanaei, M.; Sadeghi, B. Geology, Mineralogy, and Alteration of the Cu-Pb Veins, and Their Significance in Mineral Exploration: A Case Study in the Khajeh-Nezam Area, SE Iran. Geochemistry 2024, 84. [CrossRef]
- Garwin, S.; Whistler, B.; Ward, J.; Vaca, S.; Mather, N.; Chand, M.; Silva, J.; Rosero, B.; Cruz, A.; Guachamin, A.; et al. The Application of Geologic Mapping, Core Logging, and 3-D Geoscientific Data Integration in the Exploration and Resource Expansion of Porphyry Copper-(Gold) Deposits: Examples from Recent Discoveries in Ecuador and Chile. SEG Discovery 2022. [CrossRef]
- Shah, S.T.H.; Khan, N.G.; Abbasi, M.I.H.; Tabassum, K.; Shah, S.K.W. The Mineralization and Structural Geology of the Porphyry Copper Deposits of Pakistan. Nepal J Sci Technol 2021, 19. [CrossRef]
- Sunder Raju, P. V.; Satish Kumar, K. Magnetic Survey for Iron-Oxide-Copper-Gold (IOCG) and Alkali Calcic Alteration Signatures in Gadarwara, M.P, India: Implications on Copper Metallogeny. Minerals 2020, 10. [CrossRef]
- Liang, S.; Sun, S.; Lu, H. Application of Airborne Electromagnetics and Magnetics for Mineral Exploration in the Baishiquan–Hongliujing Area, Northwest China. Remote Sens (Basel) 2021, 13. [CrossRef]
- Wright, P.M. Gravity and Magnetic Methods in Mineral Exploration. Economic Geology, Seventy-fifth Anniversary Volume (1905-1980) 1981. [CrossRef]
- Thomas, M.D.; Pilkington, M.; McCuaig, M. Evaluation of Mineral Exploration Targets Defined by Airborne Gravity Gradiometry through Gravity and Magnetic Modelling: Vicinity of the Iron Range Fault, Purcell Anticlinorium, Southern Canadian Cordillera. Can J Earth Sci 2019, 56. [CrossRef]
- Karaiskos, D.; Apostolopoulos, G.; Orfanos, C. Gravity Survey for Mineral Exploration in Gerolekas Bauxite Mining Site in Greece. Mining 2024, 5, 3. [CrossRef]
- Pinet, N.; Gloaguen, E.; Giroux, B. Introduction to the Special Issue on Geophysics Applied to Mineral Exploration. Can J Earth Sci 2019, 56. [CrossRef]
- Tao, G.; Wang, G.; Zhang, Z. Extraction of Mineralization-Related Anomalies from Gravity and Magnetic Potential Fields for Mineral Exploration Targeting: Tongling Cu(–Au) District, China. Natural Resources Research 2019, 28. [CrossRef]
- Chaffee, M.A. Geochemical Exploration Techniques Applicable in the Search for Copper Deposits; 1975;
- Li, J.; Zhou, Y.; Liu, C.; Zhang, S.; Yao, F.; Yang, G.; Hou, W. Geochemical Exploration Techniques with Deep Penetration: Implications for the Exploration of Concealed Potash Deposits in the Covered Area on the Southern Margin of the Kuqa Basin. Water (Basel) 2025, 17, 298. [CrossRef]
- Ouchchen, M.; Boutaleb, S.; Abia, E.H.; El Azzab, D.; Miftah, A.; Dadi, B.; Echogdali, F.Z.; Mamouch, Y.; Pradhan, B.; Santosh, M.; et al. Exploration Targeting of Copper Deposits Using Staged Factor Analysis, Geochemical Mineralization Prospectivity Index, and Fractal Model (Western Anti-Atlas, Morocco). Ore Geol Rev 2022, 143. [CrossRef]
- Afify, A.M.; Osman, R.A.; Wanas, H.A.; Khater, T.M. Mineralogical and Geochemical Studies of Copper Mineralization in the Paleozoic Sedimentary Section in Southwestern Sinai, Egypt. Ore Geol Rev 2022, 147. [CrossRef]
- Helmiza, F. Remote Sensing Intelligent Interpretation for Geology: From Perspective of Geological Exploration; 2025;
- Sabins, F.F. Remote Sensing for Mineral Exploration. Ore Geol Rev 1999, 14. [CrossRef]
- Yao, F.; Liu, S.; Wang, D.; Geng, X.; Wang, C.; jiang, N.; Wang, Y. Review on the Development of Multi- and Hyperspectral Remote Sensing Technology for Exploration of Copper–Gold Deposits. Ore Geol Rev 2023, 162. [CrossRef]
- Sun, W.; Liu, S.; Wang, M.; Zhang, X.; Shang, K.; Liu, Q. Soil Copper Concentration Map in Mining Area Generated from AHSI Remote Sensing Imagery. Science of the Total Environment 2023, 860. [CrossRef]
- Sikakwe, G.U. Mineral Exploration Employing Drones, Contemporary Geological Satellite Remote Sensing and Geographical Information System (GIS) Procedures: A Review. Remote Sens Appl 2023, 31.
- Tagwai, M.G.; Jimoh, O.A.; Shehu, S.A.; Zabidi, H. Application of GIS and Remote Sensing in Mineral Exploration: Current and Future Perspectives. World Journal of Engineering 2024, 21.
- Said, K.O.; Onifade, M.; Akinseye, P.; Kolapo, P.; Abdulsalam, J. A Review of Geospatial Technology-Based Applications in Mineral Exploration. GeoJournal 2023, 88. [CrossRef]
- Wallsten, B.; Magnusson, D.; Andersson, S.; Krook, J. The Economic Conditions for Urban Infrastructure Mining: Using GIS to Prospect Hibernating Copper Stocks. Resour Conserv Recycl 2015, 103. [CrossRef]
- Xiao, F.; Chen, X.; Cheng, Q. Combining Numerical Modeling and Machine Learning to Predict Mineral Prospectivity: A Case Study from the Fankou Pb–Zn Deposit, Southern China. Applied Geochemistry 2024, 160. [CrossRef]
- Shirmard, H.; Farahbakhsh, E.; Müller, R.D.; Chandra, R. A Review of Machine Learning in Processing Remote Sensing Data for Mineral Exploration. Remote Sens Environ 2022, 268.
- Zuo, R.; Cheng, Q.; Xu, Y.; Yang, F.; Xiong, Y.; Wang, Z.; Kreuzer, O.P. Explainable Artificial Intelligence Models for Mineral Prospectivity Mapping. Sci China Earth Sci 2024, 67, 2864–2875. [CrossRef]
- Yang, F.; Zuo, R.; Kreuzer, O.P. Artificial Intelligence for Mineral Exploration: A Review and Perspectives on Future Directions from Data Science. Earth Sci Rev 2024, 258, 104941. [CrossRef]
- Davies, R.S.; Trott, M.; Georgi, J.; Farrar, A. Artificial Intelligence and Machine Learning to Enhance Critical Mineral Deposit Discovery. Geosystems and Geoenvironment 2025, 4, 100361. [CrossRef]
- Shirazi, A.; Hezarkhani, A.; Shirazy, A.; Pour, A.B. Geochemical Modeling of Copper Mineralization Using Geostatistical and Machine Learning Algorithms in the Sahlabad Area, Iran. Minerals 2023, 13. [CrossRef]
- Abedini, M.; Ziaii, M.; Timkin, T.; Pour, A.B. Machine Learning (ML)-Based Copper Mineralization Prospectivity Mapping (MPM) Using Mining Geochemistry Method and Remote Sensing Satellite Data. Remote Sens (Basel) 2023, 15. [CrossRef]
- Lauzon, D.; Gloaguen, E. Quantifying Uncertainty and Improving Prospectivity Mapping in Mineral Belts Using Transfer Learning and Random Forest: A Case Study of Copper Mineralization in the Superior Craton Province, Quebec, Canada. Ore Geol Rev 2024, 166. [CrossRef]
- van der Meer, F.D.; van der Werff, H.M.A.; van Ruitenbeek, F.J.A.; Hecker, C.A.; Bakker, W.H.; Noomen, M.F.; van der Meijde, M.; Carranza, E.J.M.; de Smeth, J.B.; Woldai, T. Multi- and Hyperspectral Geologic Remote Sensing: A Review. International Journal of Applied Earth Observation and Geoinformation 2012, 14.
- Ghoneim, S.M.; Ali, H.F.; Abdelrahman, K.; Fnais, M.S.; Lala, A.M.S. Integrating Remote Sensing and Geophysical Data for Mapping Potential Gold Mineralization Localities at Abu Marawat Area, Central Eastern Desert, Egypt. Sci Rep 2024, 14, 18273. [CrossRef]
- Chattoraj, S.L.; Prasad, G.; Sharma, R.U.; Champati ray, P.K.; van der Meer, F.D.; Guha, A.; Pour, A.B. Integration of Remote Sensing, Gravity and Geochemical Data for Exploration of Cu-Mineralization in Alwar Basin, Rajasthan, India. International Journal of Applied Earth Observation and Geoinformation 2020, 91. [CrossRef]
- Araffa, S.A.S.; Abd-AlHai, M.M.; Mekkawi, M.M.; ElGalladi, A.A.M. Integrated Geophysical, Remote Sensing and Geochemical Investigation to Explore Gold-Mineralizations and Mapping Listvenites at Wadi Haimur, Eastern Desert, Egypt. Geocarto Int 2022, 37. [CrossRef]
- Mars, J.C.; Robinson, G.R.; Hammarstrom, J.M.; Zürcher, L.; Whitney, H.; Solano, F.; Gettings, M.; Ludington, S. Porphyry Copper Potential of the United States Southern Basin and Range Using ASTER Data Integrated with Geochemical and Geologic Datasets to Assess Potential Near-Surface Deposits in Well-Explored Permissive Tracts. Economic Geology 2019, 114. [CrossRef]
- Forson, E.D.; Menyeh, A.; Wemegah, D.D. Mapping Lithological Units, Structural Lineaments and Alteration Zones in the Southern Kibi-Winneba Belt of Ghana Using Integrated Geophysical and Remote Sensing Datasets. Ore Geol Rev 2021, 137. [CrossRef]
- Moradpouri, F.; Mohammad hayati A Copper Porphyry Promising Zones Mapping Based on the Exploratory Data, Multivariate Geochemical Analysis and GIS Integration. Applied Geochemistry 2021, 132. [CrossRef]
- Mnasri, M.; Amiri, A.; Nasr, I.H.; Belkhiria, W.; Inoubli, M.H. Integrated Geophysical Approach for Ore Exploration: Case Study of Sidi Bou Aouane–Khadhkhadha Pb–Zn Province – Northern Tunisia. Geophys Prospect 2023, 71. [CrossRef]
- Blakely, R.J. Potential Theory in Gravity and Magnetic Applications; 1995;
- Dadi, B.; Faik, F.; Boutaleb, S.; Abia, E.H.; Azzab, D. El; Ouchchen, M.; Mamouch, Y.; Echogdali, F.Z.; Mickus, K.L.; Abioui, M.; et al. Litho-Structural Interpretation of Aeromagnetic Anomalies Reveals Potential for Mineral Exploration in Tizi n’Test Region, Western High Atlas, Morocco. Sci Rep 2024, 14, 17116. [CrossRef]
- Ordóñez, C.; Ekwok, S.E.; Alkhayaat, A.; Bains, P.S.; Sharma, R.; Kumar, R.; Kulshreshta, A.; Mann, V.S.; Elmasry, Y. Delineation of Mineralization-Related Geologic Structures and Lithological Units Using Airborne Magnetic and Radiometric Data. Geomechanics and Geophysics for Geo-Energy and Geo-Resources 2024, 10, 184. [CrossRef]
- Li, J.; Wang, J.; Meng, X.; Fang, Y.; Li, W.; Yang, S. An Analysis and Interpretation of Magnetic Data of the Qing-Chengzi Deposit in Eastern Liaoning (China) Area: Guide for Structural Identification and Mineral Exploration. Minerals 2024, 14, 1272. [CrossRef]
- Yu, X. zhong; He, Y. yuan; Wang, M.; Zhang, J.; Zhang, X. jie; Fan, Z. guo Gravity and Magnetic Field Characteristics and Regional Ore Prospecting of the Yili Ancient Continent, West Tianshan, Xinjiang Uygur Autonomous Region, China. China Geology 2020, 3. [CrossRef]
- Ramakrishna, T.S. Gravity and Magnetic Methods in Geological Studies: Principles, Integrated Exploration and Plate Tectonics. Journal of the Geological Society of India 2012, 80. [CrossRef]
- Kheyrollahi, H.; Alinia, F.; Ghods, A. Regional Magnetic and Gravity Structures and Distribution of Mineral Deposits in Central Iran: Implications for Mineral Exploration. J Asian Earth Sci 2021, 217. [CrossRef]
- Bahía, M.E.; Strazzere, L.; Benedini, L.; Gregori, D.A.; Kostadinoff, J. Gravity and Magnetic Exploration Applied to Iron Ore Deposits in the Sierra Grande Area, Río Negro Province, Argentina. Geophys Prospect 2024, 72. [CrossRef]
- Werner, W. Examples of Structural Control of Hydrothermal Mineralization: Fault Zones in Epicontinental Sedimentary Basins - A Review. Geologische Rundschau 1990, 79.
- Codeço, M.S.; Weis, P.; Andersen, C. Numerical Modeling of Structurally Controlled Ore Formation in Magmatic-Hydrothermal Systems. Geochemistry, Geophysics, Geosystems 2022, 23. [CrossRef]
- Ghrefat, H.; Awawdeh, M.; Howari, F.; Al-Rawabdeh, A. Mineral Exploration Using Multispectral and Hyperspectral Remote Sensing Data. In Geoinformatics for Geosciences: Advanced Geospatial Analysis using RS, GIS and Soft Computing; 2023.
- Amer, R.; El Mezayen, A.; Hasanein, M. ASTER Spectral Analysis for Alteration Minerals Associated with Gold Mineralization. Ore Geol Rev 2016, 75. [CrossRef]
- Rajendran, S.; Nasir, S. ASTER Capability in Mapping of Mineral Resources of Arid Region: A Review on Mapping of Mineral Resources of the Sultanate of Oman. Ore Geol Rev 2019, 108.
- Alimohammadi, M.; Alirezaei, S.; Kontak, D.J. Application of ASTER Data for Exploration of Porphyry Copper Deposits: A Case Study of Daraloo-Sarmeshk Area, Southern Part of the Kerman Copper Belt, Iran. Ore Geol Rev 2015, 70. [CrossRef]
- Zhao, Z.F.; Zhou, J.X.; Lu, Y.X.; Chen, Q.; Cao, X.M.; He, X.H.; Fu, X.H.; Zeng, S.H.; Feng, W. jie Mapping Alteration Minerals in the Pulang Porphyry Copper Ore District, SW China, Using ASTER and WorldView-3 Data: Implications for Exploration Targeting. Ore Geol Rev 2021, 134. [CrossRef]
- Li, C.; Shen, P.; Pan, H.; Cao, C.; Seitmuratova, E. Geology and Ore-Forming Fluid Evolution of the Aktogai Giant Porphyry Cu Deposit, Kazakhstan. J Asian Earth Sci 2018, 165. [CrossRef]
- De Luca, G.; Carotenuto, F.; Genesio, L.; Pepe, M.; Toscano, P.; Boschetti, M.; Miglietta, F.; Gioli, B. Improving PRISMA Hyperspectral Spatial Resolution and Geolocation by Using Sentinel-2: Development and Test of an Operational Procedure in Urban and Rural Areas. ISPRS Journal of Photogrammetry and Remote Sensing 2024, 215, 112–135. [CrossRef]
- Vangi, E.; D’Amico, G.; Francini, S.; Giannetti, F.; Lasserre, B.; Marchetti, M.; Chirici, G. The New Hyperspectral Satellite PRISMA: Imagery for Forest Types Discrimination. Sensors 2021, 21, 1182. [CrossRef]
- Lowell, J.D.; Guilbert, J.M. Lateral and vertical alteration–mineralization zoning in porphyry ore deposits. Econ. Geol. 1970, 65, 373–408. [CrossRef]
- Abrams, M.J.; Brown, D.; Lepley, L.; Sadowski, R. Remote sensing of porphyry copper deposits in southern Arizona. Econ. Geol. 1983, 78, 591–604. [CrossRef]
- Spatz, D.M.; Wilson, R.T. Remote sensing characteristics of porphyry copper systems, western America Cordillera. In *Arizona Geological Society Digest*; Pierce, F.W., Bolm, J.G., Eds.; Arizona Geological Society: Tucson, AZ, USA, **1995**; Volume 20, pp. 94–108.
- Clark, R.N. Spectroscopy of rocks and minerals, and principles of spectrocopy. In Spectroscopy of Rocks and Minerals and Principles of Spectroscopy; Wiley: Hoboken, NJ, USA, 1999.
- Ngcofe, L.; Minnaar, H.; Halenyane, K.; Chevallier, L. Multispectral and hyperspectral remote sensing: Target area generation for porphyry copper exploration in the Namaqua Metamorphic Province, South Africa. South Afr. J. Geol. 2013, 116, 259–272. [CrossRef]
- Meerdink, S.K.; Hook, S.J.; Roberts, D.A.; Abbott, E.A. The ECOSTRESS spectral library version 1.0. Remote Sens. Environ. 2019, 230, 111196.
- Aniyatov I., L.V., S.A., I.S., O.I. Study of Criteria for Copper Mineralization Exploration in the North-Eastern Pribalkhashye Region Based on the Analysis of Deep Structures Using Geophysical Data; Almaty, 1978;
- Kassymkanova Khaini-Kamal, N.S.O.E. Updated Digital Gravity Map of the Republic of Kazakhstan at a Scale of 1:200,000 2024.
- Ali EL-Omairi, M.; El Garouani, A.; Shebl, A. Investigation of Lineament Extraction: Analysis and Comparison of Digital Elevation Models in the Ait Semgane Region, Morocco. Remote Sens Appl 2024, 36, 101321. [CrossRef]
- Shebl, A.; Csámer, Á. Reappraisal of DEMs, Radar and Optical Datasets in Lineaments Extraction with Emphasis on the Spatial Context. Remote Sens Appl 2021, 24. [CrossRef]
- Ahmadi, H.; Pekkan, E.; Seyitoğlu, G. Automatic Lineaments Detection Using Radar and Optical Data with an Emphasis on Geologic and Tectonic Implications: A Case Study of Kabul Block, Eastern Afghanistan. Geocarto Int 2023, 38. [CrossRef]
- Sichugova L.V; Fazilova D.Sh; Mukhtorov N.M DENSITY ANALYSIS OF LINEAMENTS USING REMOTE SENSING DATA. EPRA International Journal of Economic Growth and Environmental Issues 2020. [CrossRef]
- Ustinov, S.; Ostapchuk, A.; Svecherevskiy, A.; Usachev, A.; Gridin, G.; Grigor’eva, A.; Nafigin, I. Prospects of Geoinformatics in Analyzing Spatial Heterogeneities of Microstructural Properties of a Tectonic Fault. Applied Sciences (Switzerland) 2022, 12. [CrossRef]
- Salui, C.L. Methodological Validation for Automated Lineament Extraction by LINE Method in PCI Geomatica and MATLAB Based Hough Transformation. Journal of the Geological Society of India 2018, 92. [CrossRef]
- Delibaş, O.; Genç, Y. Re-Os Molybdenite Ages of Granitoid-Hosted Mo-Cu Occurrences from Central Anatolia (Turkey). Ore Geol Rev 2012, 44. [CrossRef]
- Amer, R.; Kusky, T.; El Mezayen, A. Remote Sensing Detection of Gold Related Alteration Zones in Um Rus Area, Central Eastern Desert of Egypt. Advances in Space Research 2012, 49. [CrossRef]
- Noori, L.; Pour, A.B.; Askari, G.; Taghipour, N.; Pradhan, B.; Lee, C.W.; Honarmand, M. Comparison of Different Algorithms to Map Hydrothermal Alteration Zones Using ASTER Remote Sensing Data for Polymetallic Vein-Type Ore Exploration: Toroud-Chahshirin Magmatic Belt (TCMB), North Iran. Remote Sens (Basel) 2019, 11. [CrossRef]
- Roest, W.R.; Verhoef, J.; Pilkington, M. Magnetic Interpretation Using the 3-D Analytic Signal. GEOPHYSICS 1992, 57. [CrossRef]
- Gay, S.P. STANDARD CURVES FOR MAGNETIC ANOMALIES OVER LONG HORIZONTAL CYLINDERS. GEOPHYSICS 1965, 30. [CrossRef]
- Ackerman, H.A.; Dix, C.H. THE FIRST VERTICAL DERIVATIVE OF GRAVITY. GEOPHYSICS 1955, 20. [CrossRef]
- Chibueze Okpoli, C.; Owoicho Ogbole, J.; Anthony Victor, O.; Olumide Okanlawon, G. Mineral Exploration of Iwo-Apomu Southwestern Nigeria Using Aeromagnetic and Remote Sensing. Egyptian Journal of Remote Sensing and Space Science 2022, 25. [CrossRef]
- Magnetic and Geothermal Data in El-Bahariya Oasis, Western Desert, Egypt. NRIAG Journal of Astronomy and Geophysics 2015, 4. [CrossRef]
- Liu, C.; Qiu, C.; Wang, L.; Feng, J.; Wu, S.; Wang, Y. Application of ASTER Remote Sensing Data to Porphyry Copper Exploration in the Gondwana Region. Minerals 2023, 13. [CrossRef]
- Feizi, F.; Mansuri, E. Separation of Alteration Zones on ASTER Data and Integration with Drainage Geochemical Maps in Soltanieh, Northern Iran. Open Journal of Geology 2013, 03. [CrossRef]
- Mars, J.C.; Rowan, L.C. Regional Mapping of Phyllic- and Argillic-Altered Rocks in the Zagros Magmatic Arc, Iran, Using Advanced Spaceborne Thermal Emission and Reflection Radiometer (ASTER) Data and Logical Operator Algorithms. Geosphere 2006, 2. [CrossRef]
- Structural Control of Mineral Deposits; 2019;
- Lidia Lonergan, J.W.; McCaffrey, K. Fractures, Fluid Flow and Mineralization: An Introduction. Geol Soc Spec Publ 1999, 155. [CrossRef]
- Zhang, Y.; Robinson, J.; Schaubs, P.M. Numerical Modelling of Structural Controls on Fluid Flow and Mineralization. Geoscience Frontiers 2011, 2. [CrossRef]
- Kalieva Aigul Assessment of the Material Composition of Ores and Host Rocks of Copper Deposit Aktogay by Spectroscopy. Dissertation, Satbayev University: Almaty, 2021.
- Otarbay Samal Geological Structure and Material Composition of Ores of Copper Porphyry Deposit Aktogay, Satbayev University: Almaty, 2020.
- Alizadeh, H.; Arian, M. Rule of Structural Factors in Formation of Porphyry Copper Deposits in South Western Part of Kerman Area, Iran. Open Journal of Geology 2015, 05. [CrossRef]
- Mirzaie, A.; Bafti, S.S.; Derakhshani, R. Fault Control on Cu Mineralization in the Kerman Porphyry Copper Belt, SE Iran: A Fractal Analysis. Ore Geol Rev 2015, 71. [CrossRef]
- Ahmadi, H.; Uygucgil, H. Targeting Iron Prospective within the Kabul Block (SE Afghanistan) via Hydrothermal Alteration Mapping Using Remote Sensing Techniques. Arabian Journal of Geosciences 2021, 14. [CrossRef]
- Yao, F.; Xu, X.; Yang, J.; Geng, X. A Remote-Sensing-Based Alteration Zonation Model of the Duolong Porphyry Copper Ore District, Tibet. Remote Sens (Basel) 2021, 13. [CrossRef]
- Lowell, J.D.; Guilbert, J.M. Lateral and Vertical Alteration-Mineralization Zoning in Porphyry Ore Deposits. Economic Geology 1970, 65. [CrossRef]
- Clark, R.N. Spectroscopy of Rocks Andminerals, and Principles of Spectrocopy. Remote sensing for the earth sciences: Manual of remote sensing 1999, 01.
- Di Tommaso, I.; Rubinstein, N. Hydrothermal Alteration Mapping Using ASTER Data in the Infiernillo Porphyry Deposit, Argentina. Ore Geol Rev 2007, 32. [CrossRef]
- Hunt, G.R. SPECTRAL SIGNATURES OF PARTICULATE MINERALS IN THE VISIBLE AND NEAR INFRARED. Geophysics 1977, 42. [CrossRef]
- Orynbassarova, E.; Ahmadi, H.; Adebiyet, B.; Bekbotayeva, A.; Abdullayeva, T.; Beiranvand Pour, A.; Ilyassova, A.; Serikbayeva, E.; Talgarbayeva, D.; Bermukhanova, A. Mapping Alteration Minerals Associated with Aktogay Porphyry Copper Mineralization in Eastern Kazakhstan Using Landsat-8 and ASTER Satellite Sensors. Minerals 2025, 15, 277. [CrossRef]
- Cao, M.J.; Li, G.M.; Qin, K.Z.; Evans, N.J.; Seitmuratova, E.Y. Assessing the Magmatic Affinity and Petrogenesis of Granitoids at the Giant Aktogai Porphyry Cu Deposit, Central Kazakhstan. Am J Sci 2016, 316. [CrossRef]
Figure 1.
(a) Geological map of study area (modified from RGF Report 45219 by V. M. Mertenov (sheets L-44-I, II, III), Almaty, 1997) and (b) Overview map of the study area.
Figure 1.
(a) Geological map of study area (modified from RGF Report 45219 by V. M. Mertenov (sheets L-44-I, II, III), Almaty, 1997) and (b) Overview map of the study area.
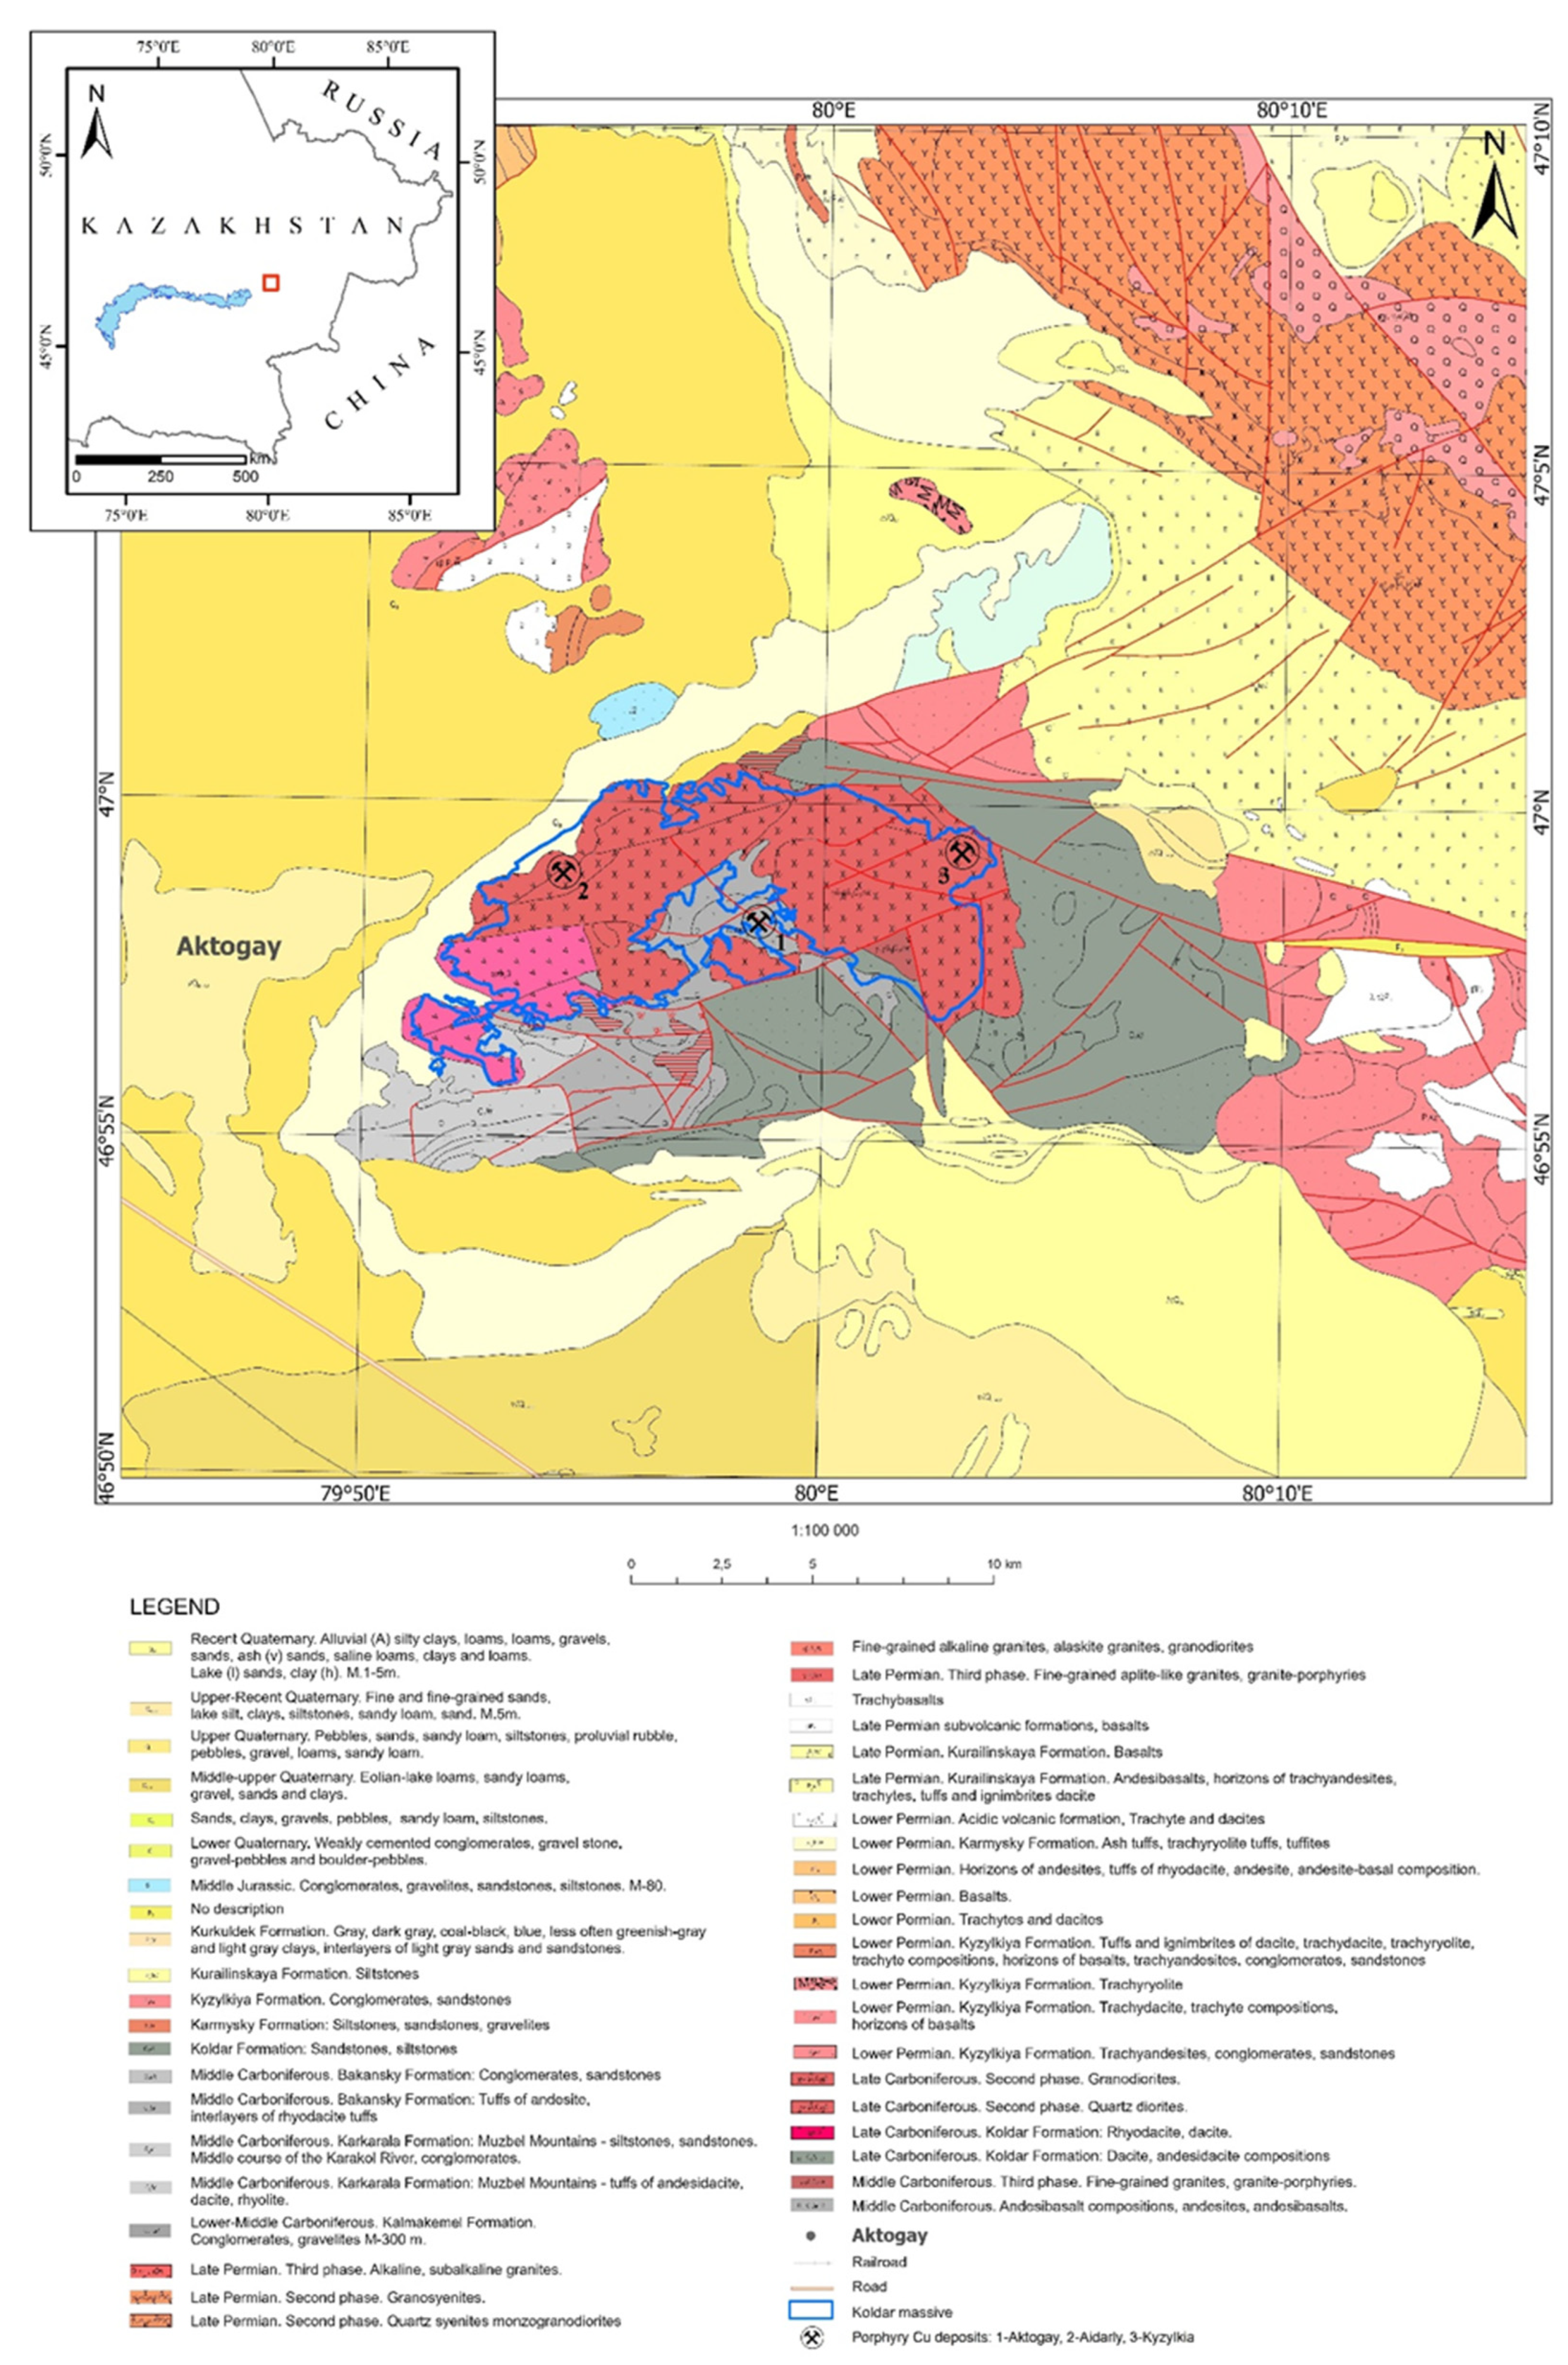
Figure 2.
Spectral reflectance of indicator rock minerals for porphyry copper deposits bands on the visible to short wave infrared region of electromagnetic spectrum range [76].
Figure 2.
Spectral reflectance of indicator rock minerals for porphyry copper deposits bands on the visible to short wave infrared region of electromagnetic spectrum range [76].
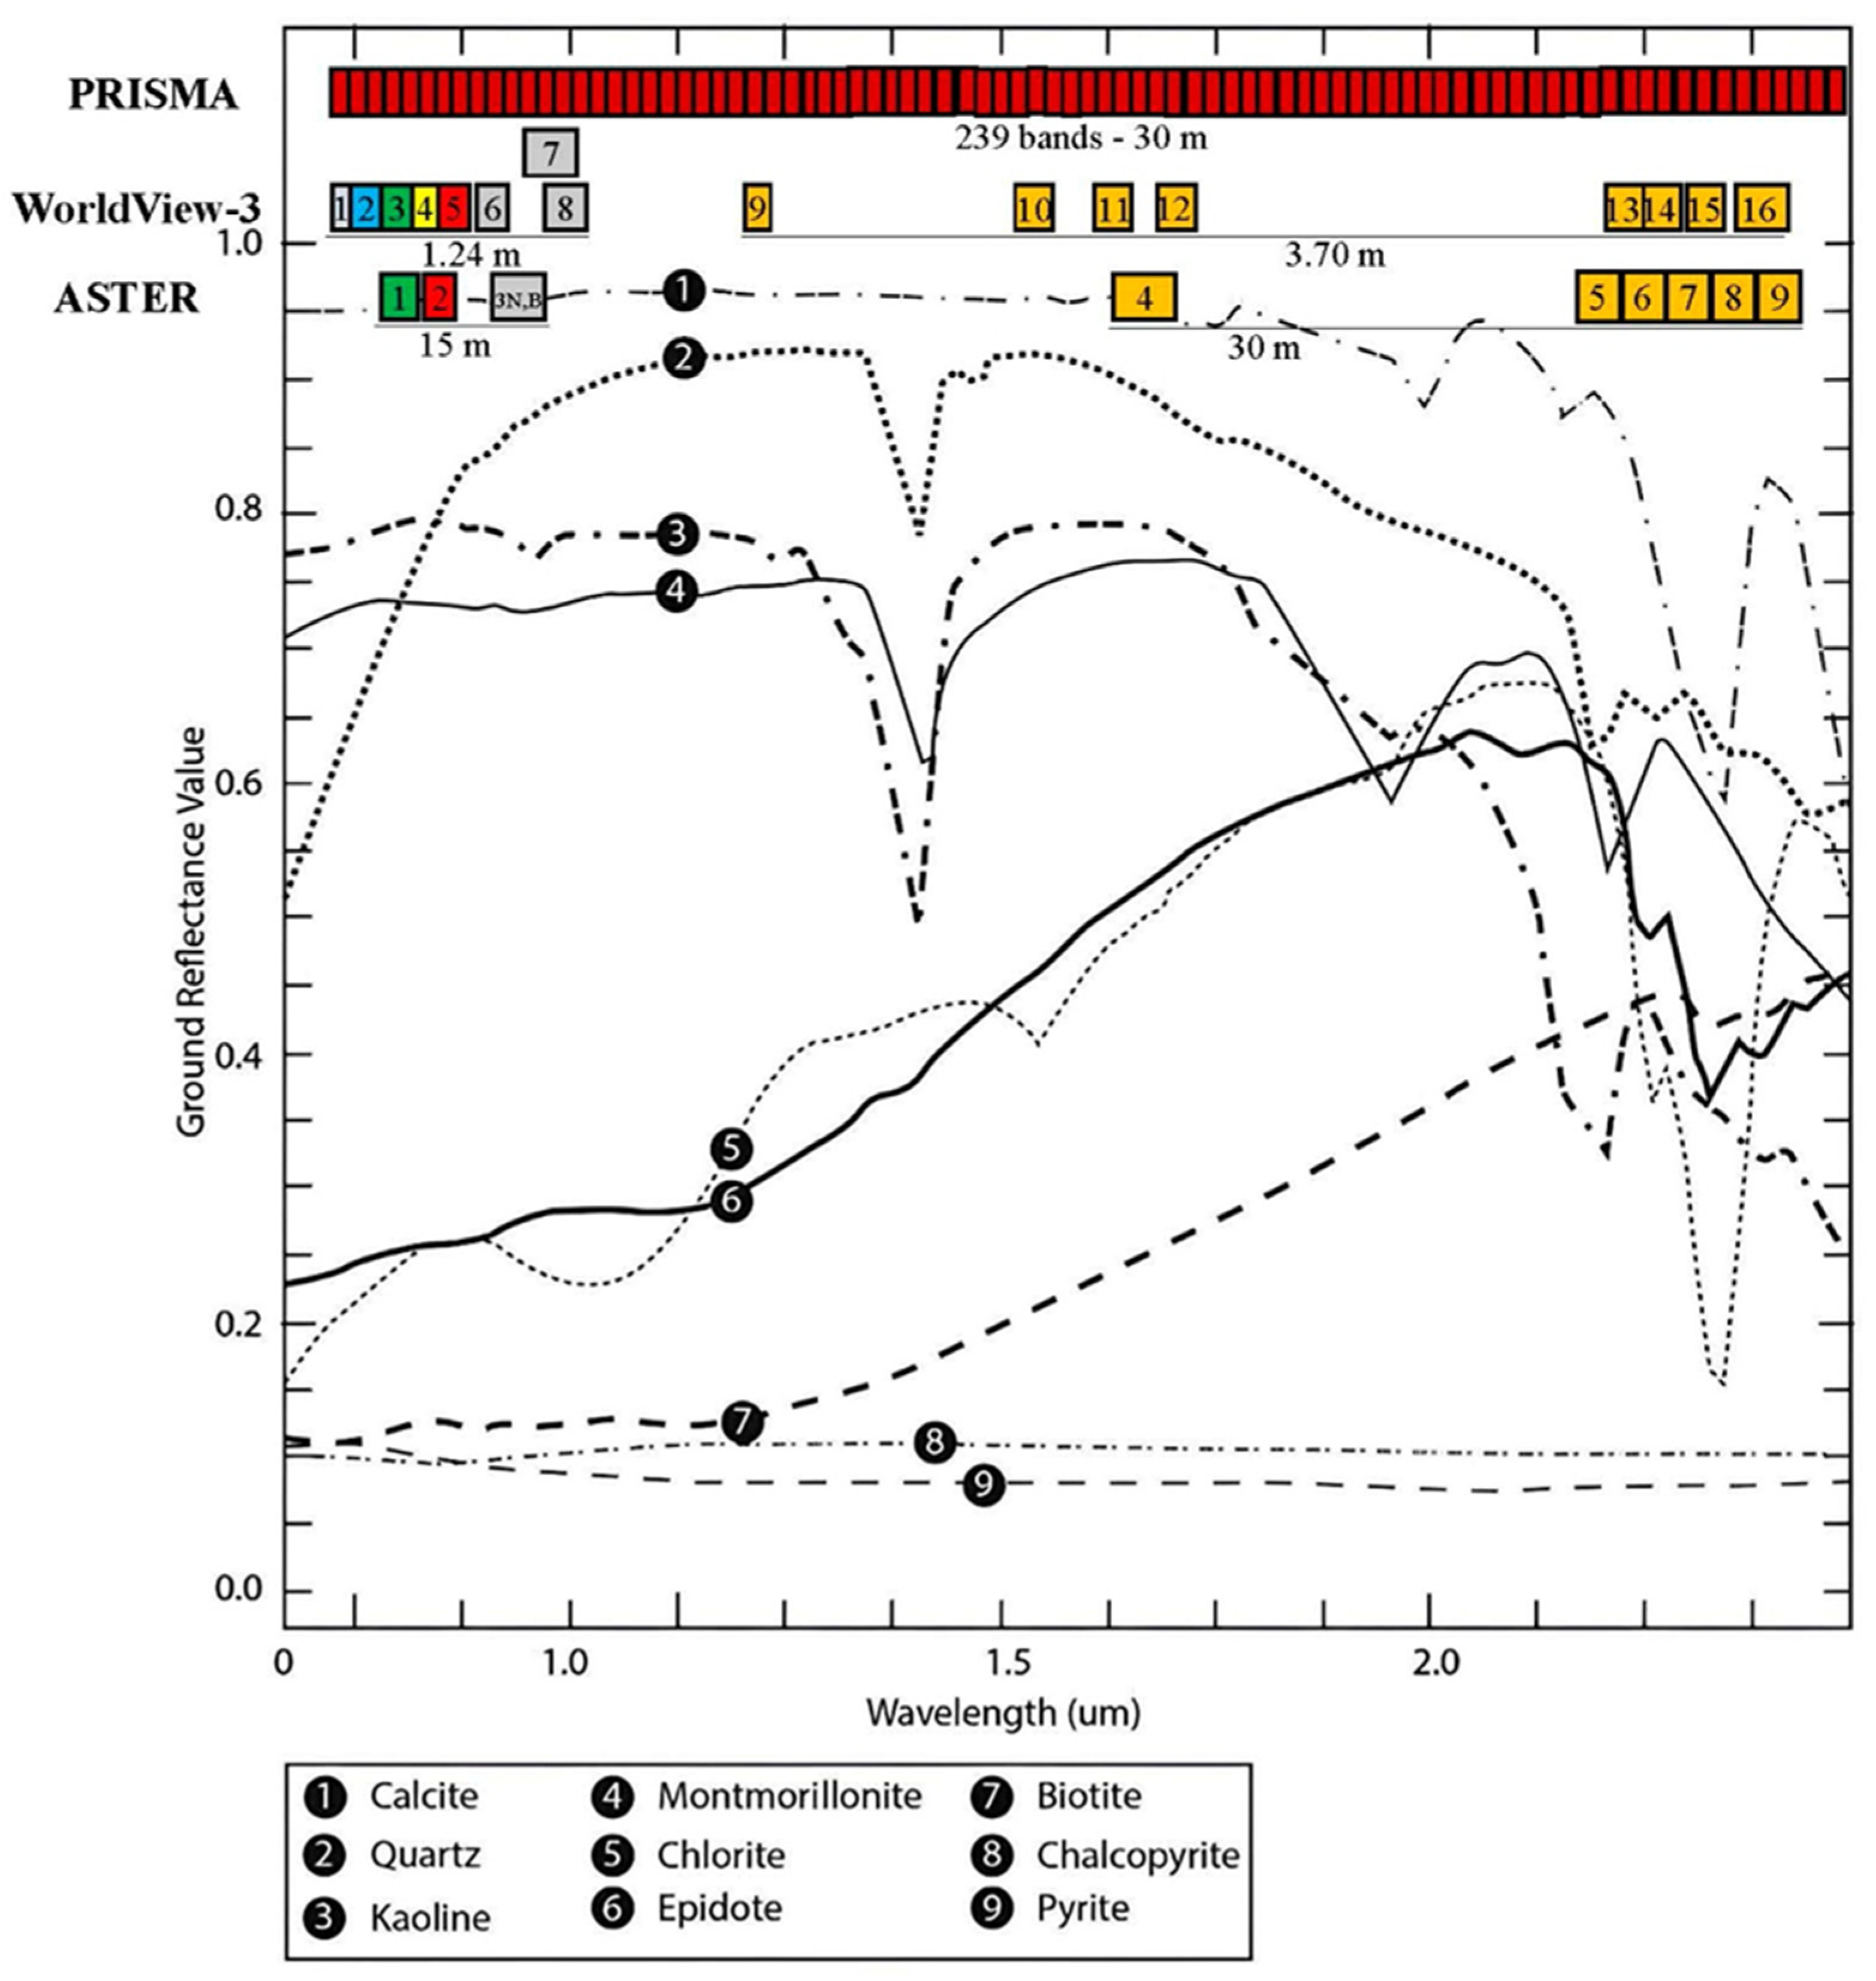
Figure 3.
Reflectance spectral of relevant hydrothermal alteration mineral for argillic, phyllic and propylitic for porphyry copper deposits [77].
Figure 3.
Reflectance spectral of relevant hydrothermal alteration mineral for argillic, phyllic and propylitic for porphyry copper deposits [77].
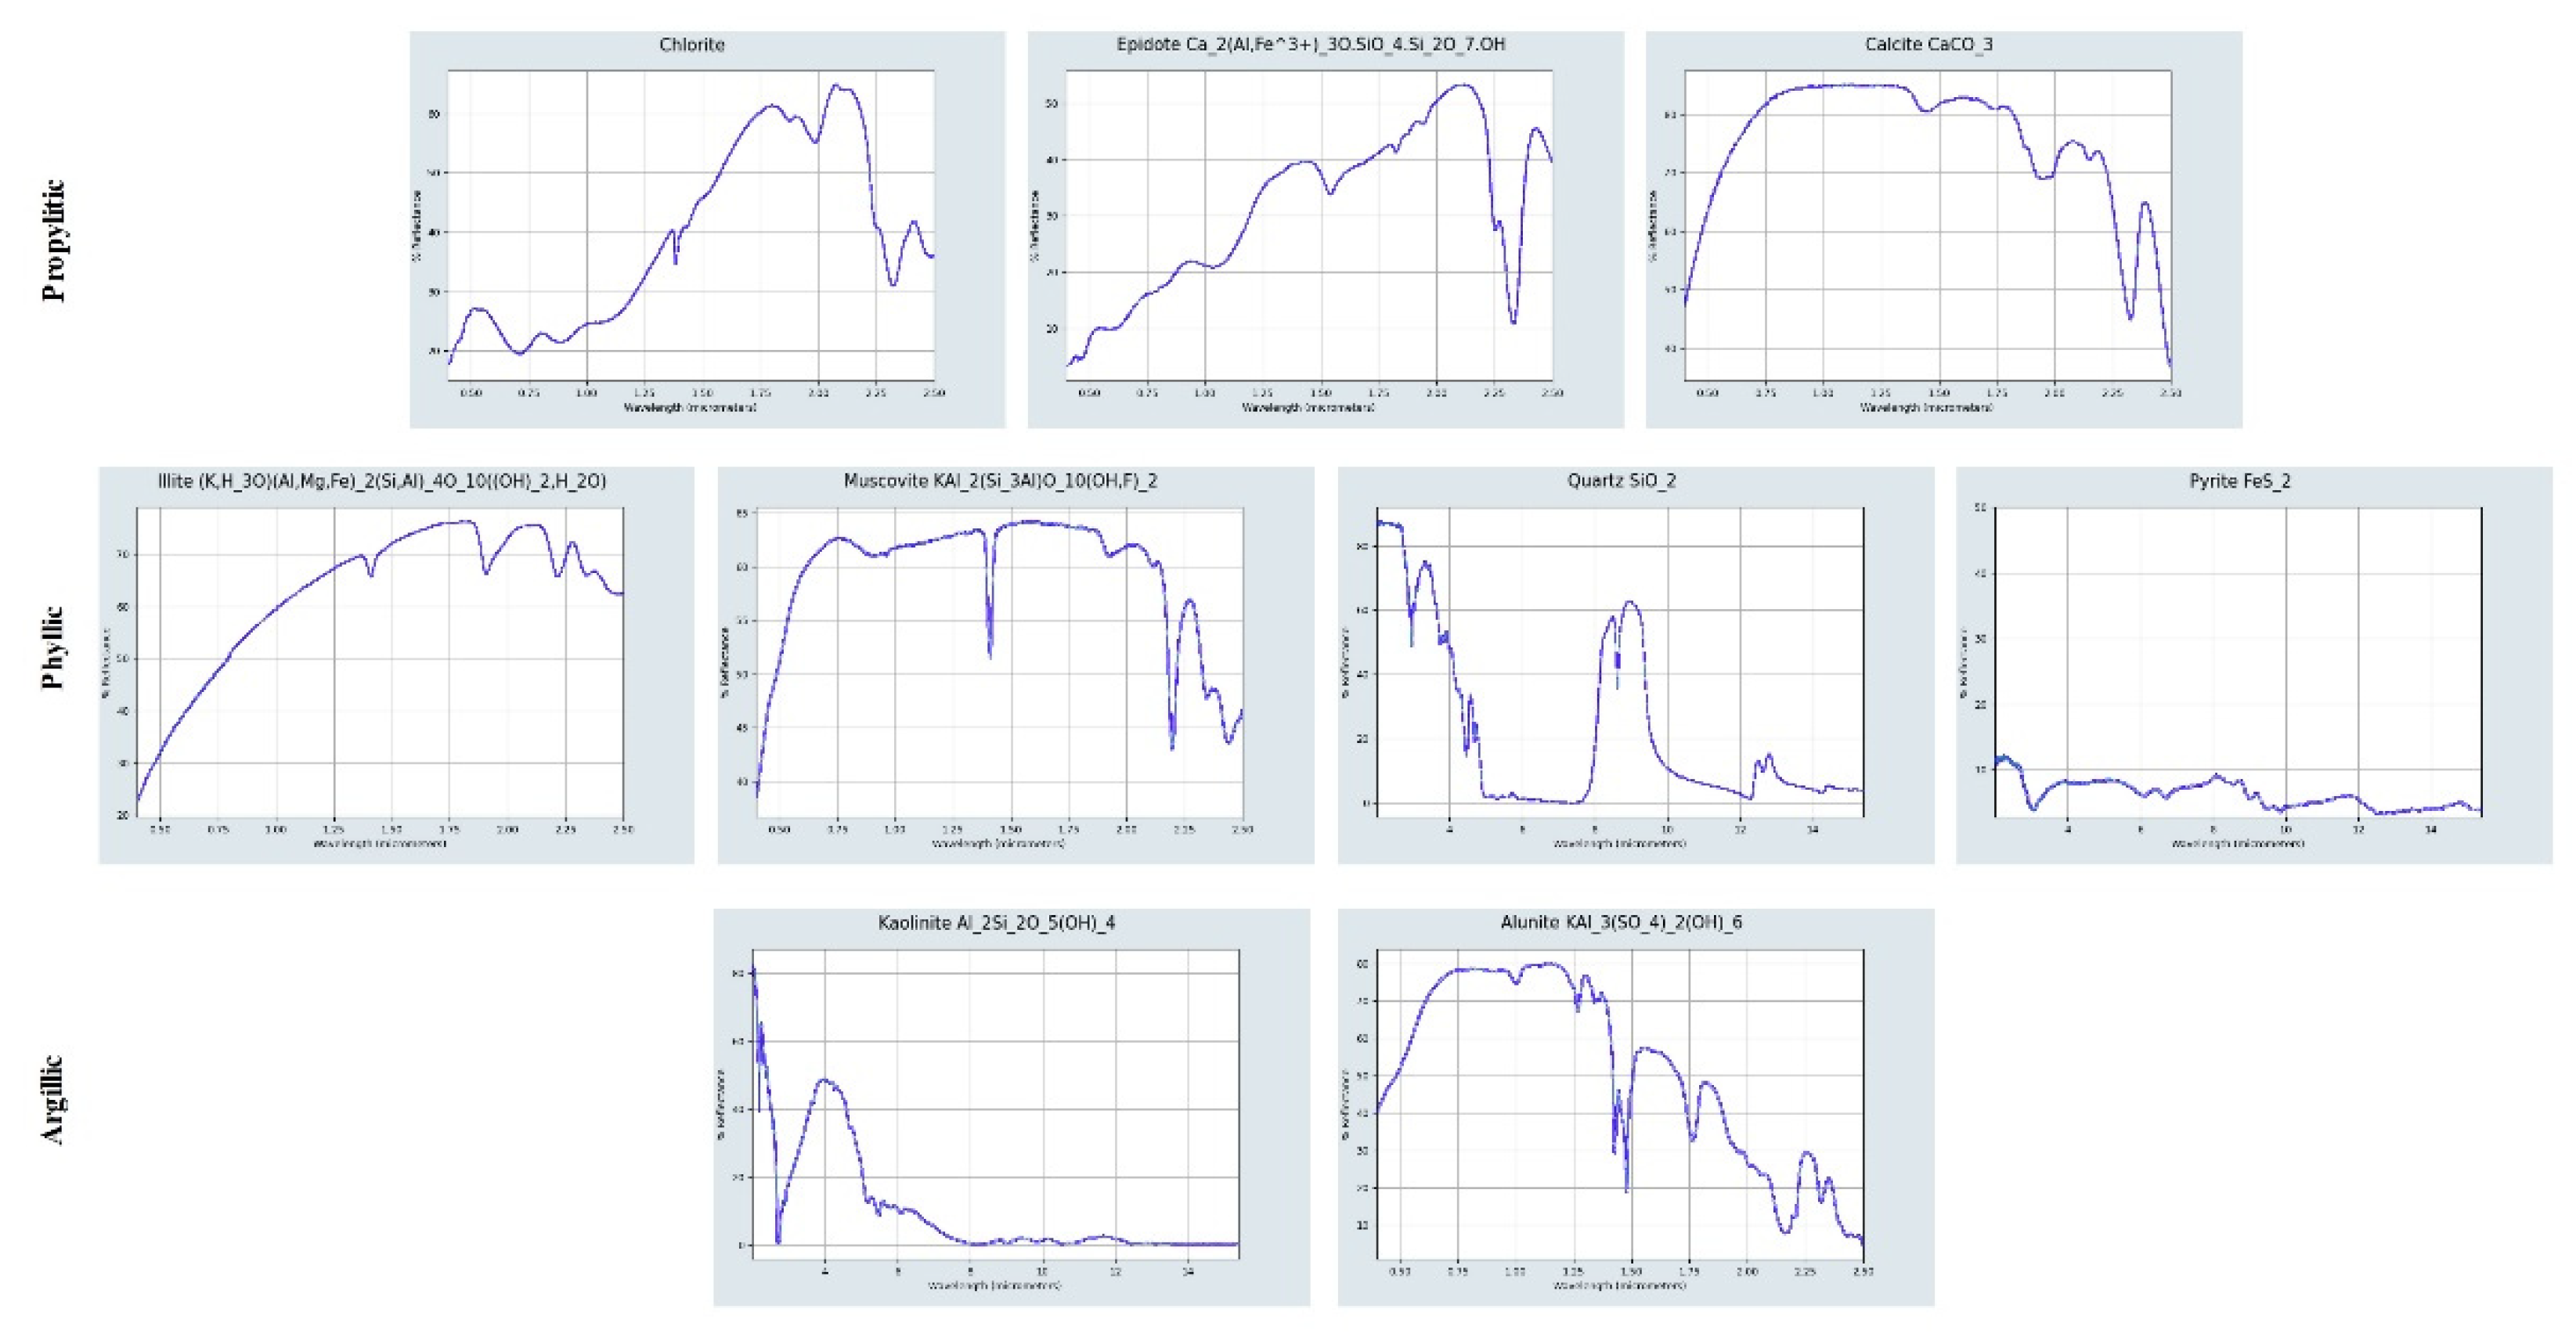
Figure 4.
The flow chart of the methodology.
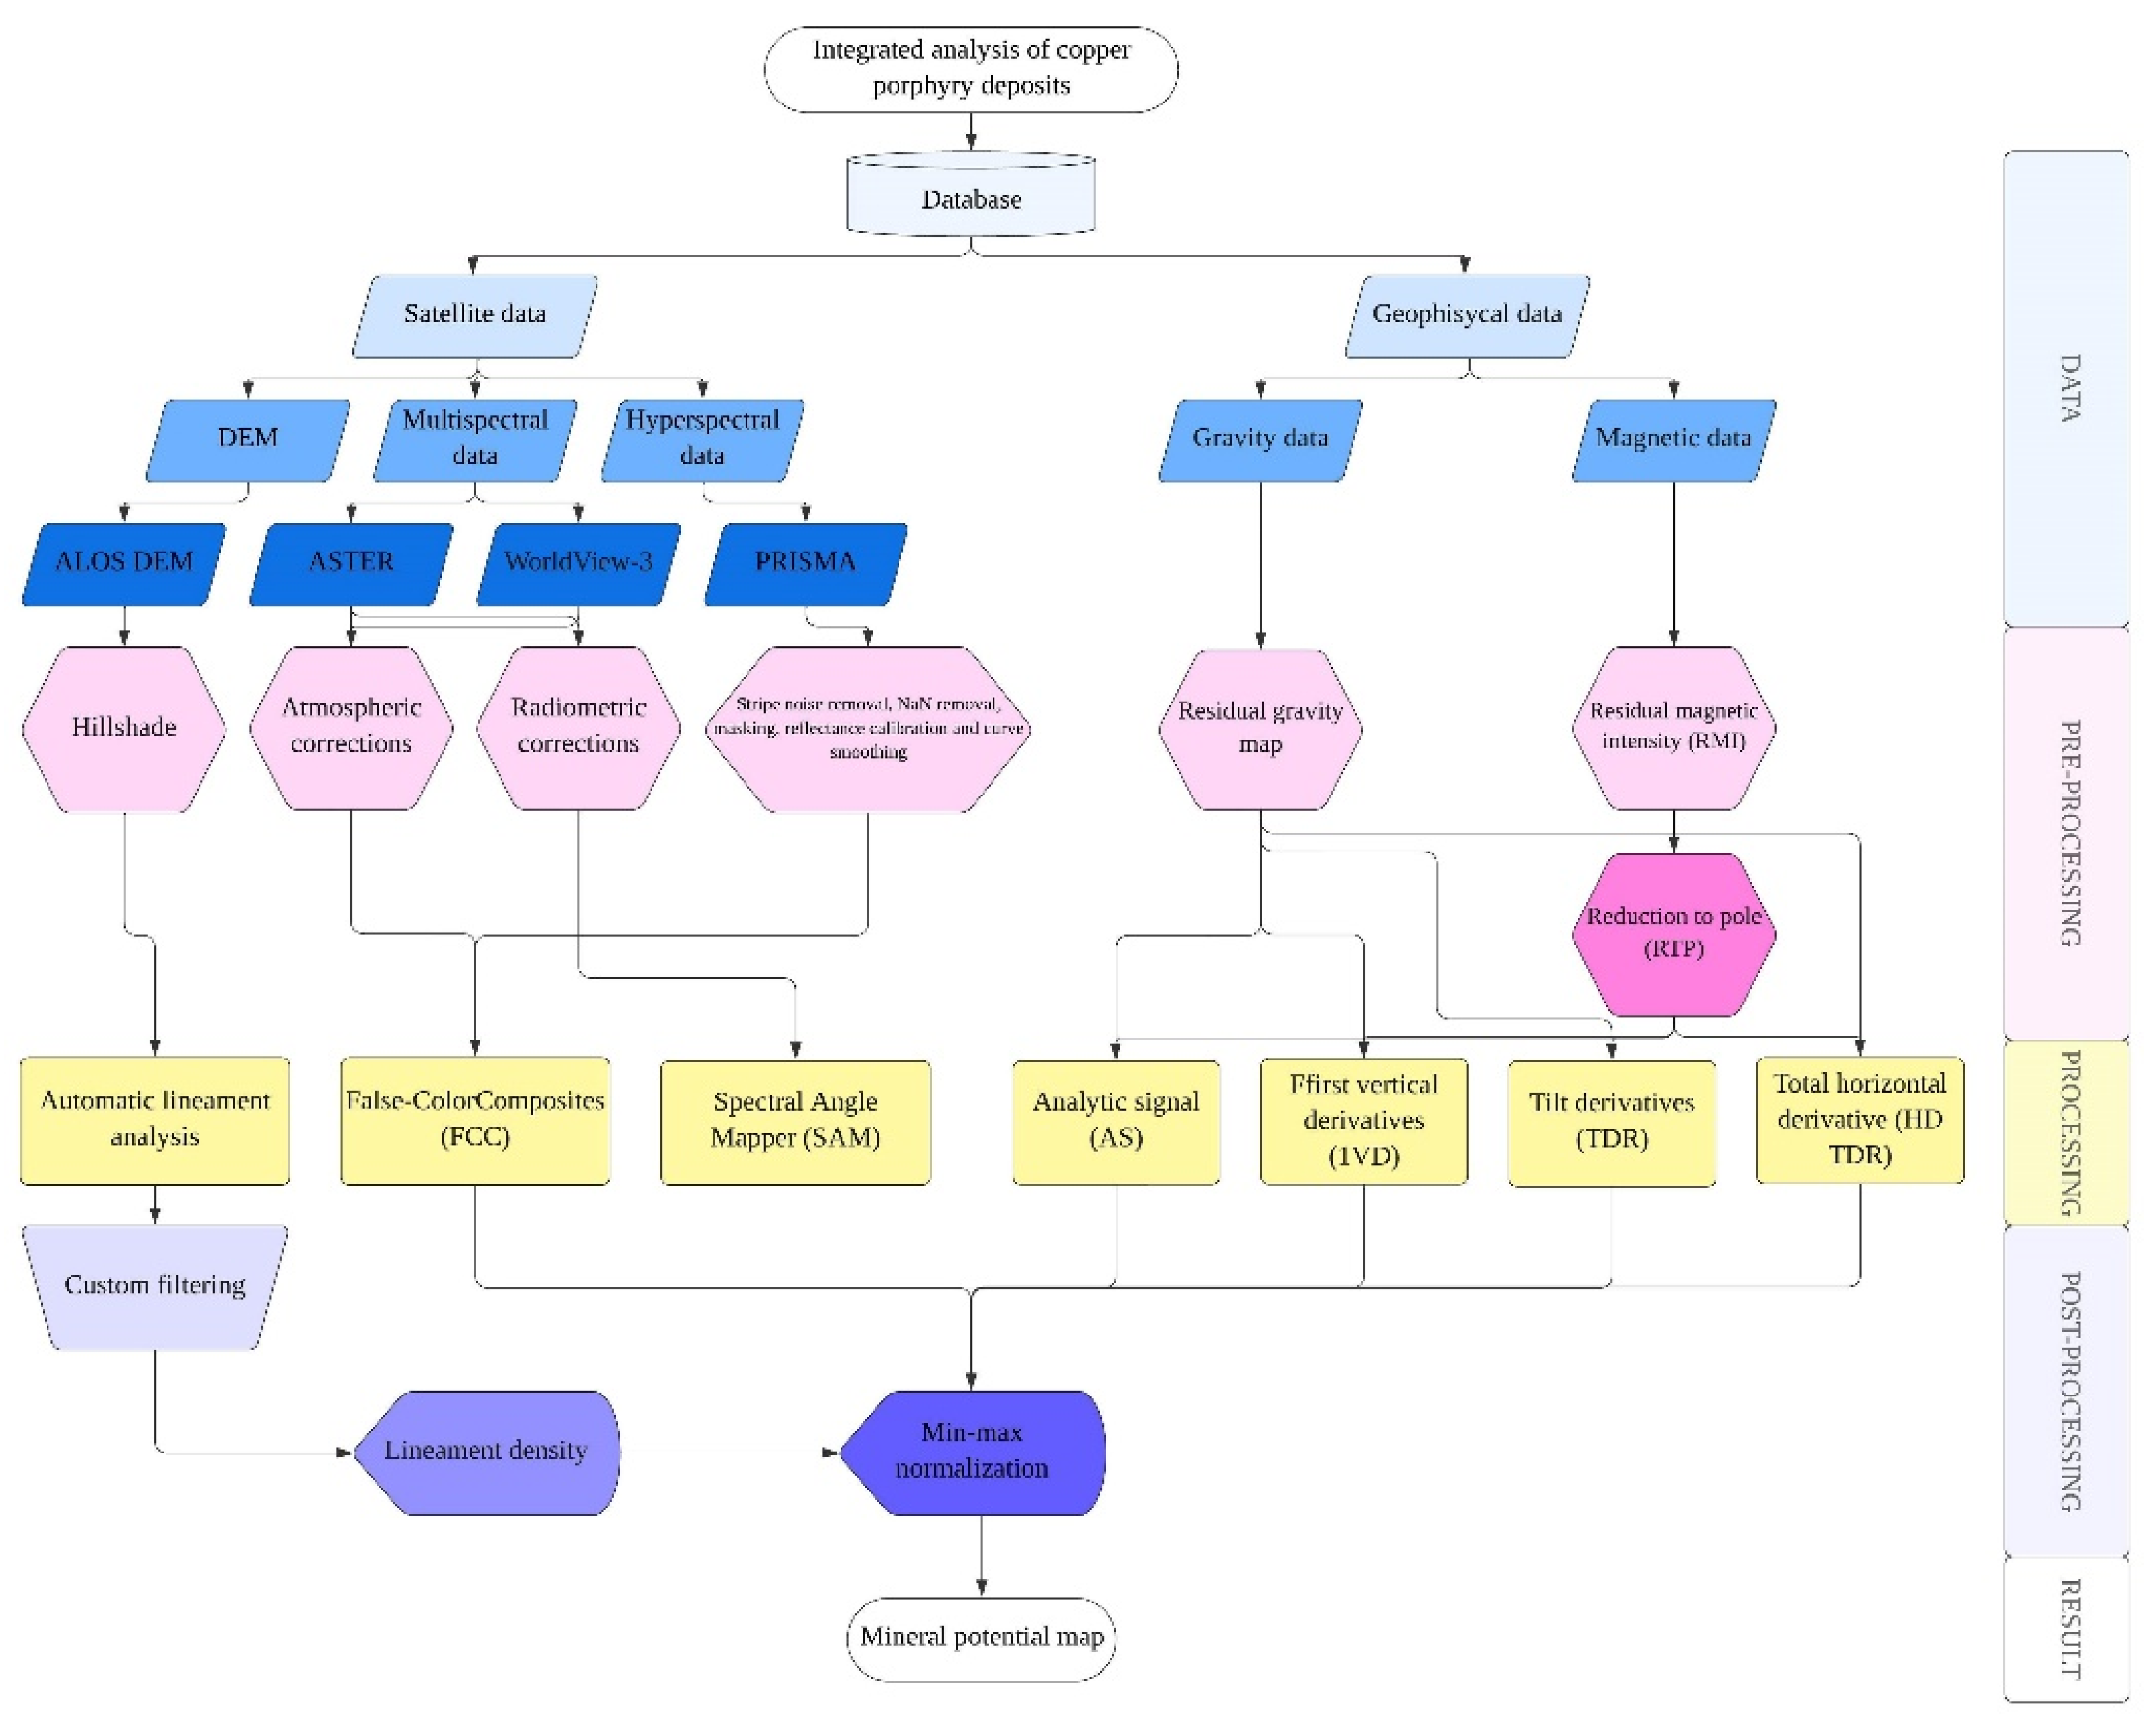
Figure 5.
(a) Lineament map and (b) structural density map of the Koldar Massif derived from DEM data; (c) lineament orientation trends and (d) geological fault orientations represented as rose diagrams.
Figure 5.
(a) Lineament map and (b) structural density map of the Koldar Massif derived from DEM data; (c) lineament orientation trends and (d) geological fault orientations represented as rose diagrams.
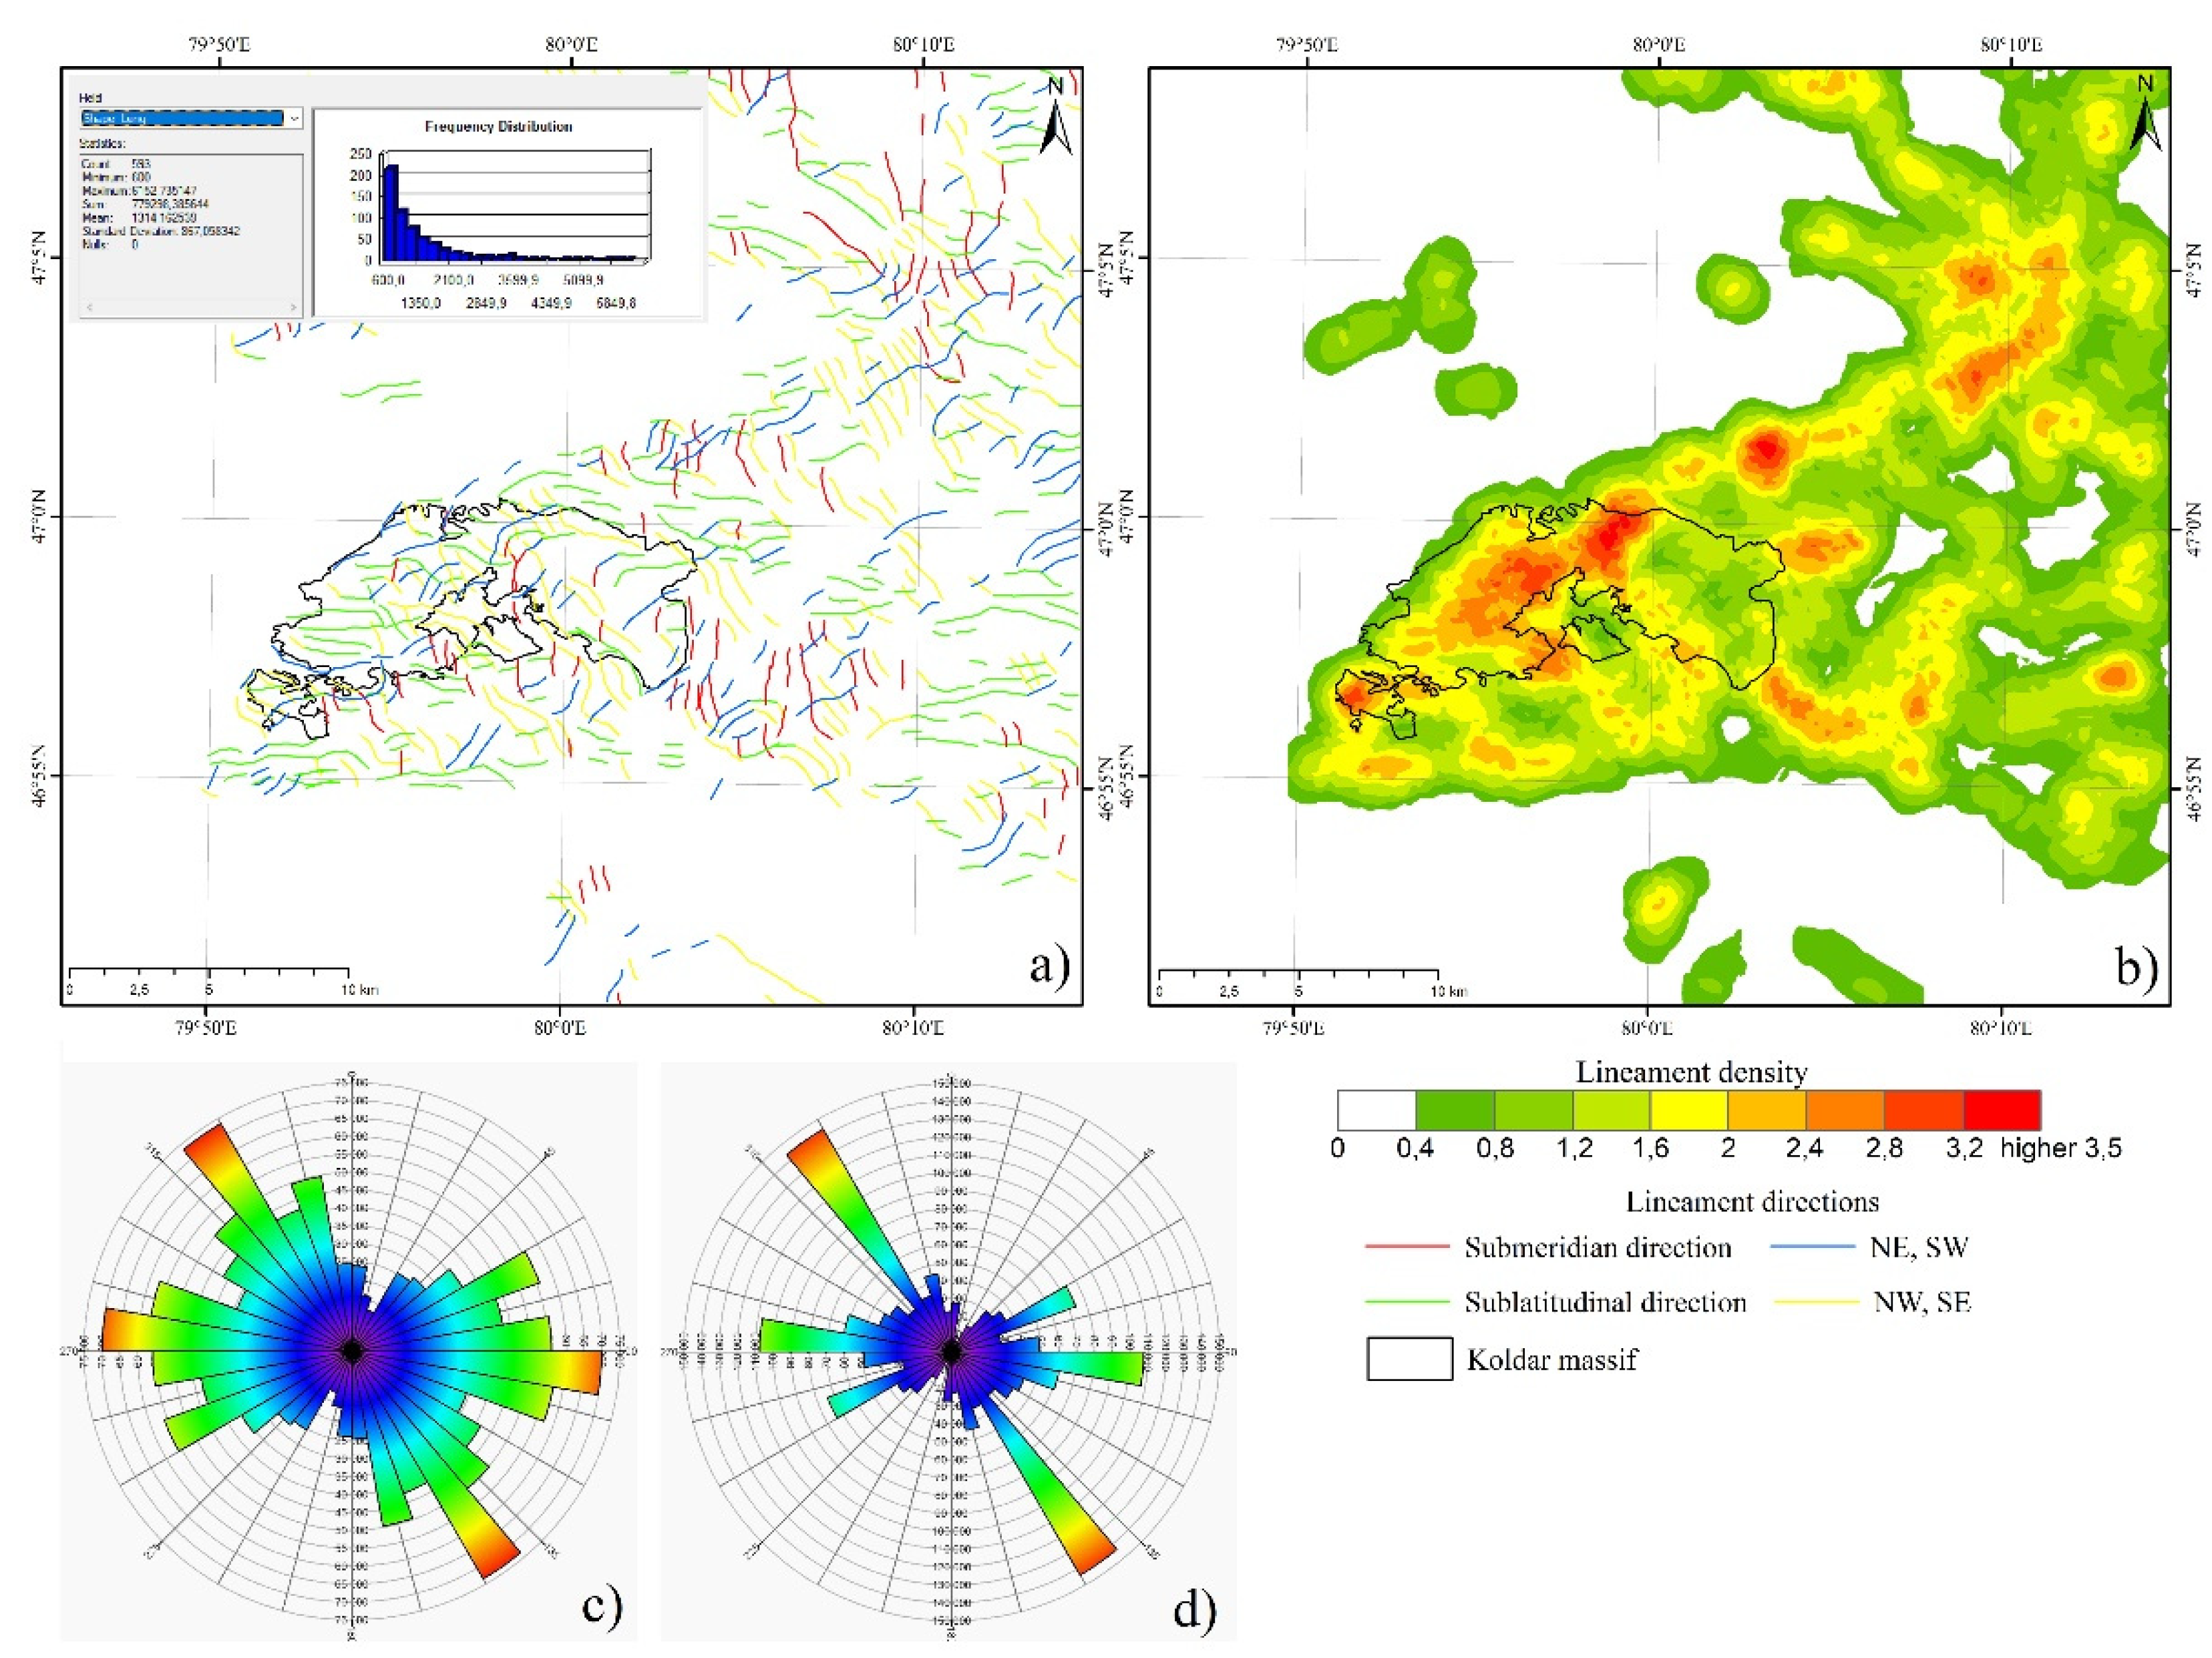
Figure 6.
Map of hydrothermal alteration zones in the Koldar Massif derived from ASTER data (Bands 4, 6, 8) using FCC method.
Figure 6.
Map of hydrothermal alteration zones in the Koldar Massif derived from ASTER data (Bands 4, 6, 8) using FCC method.
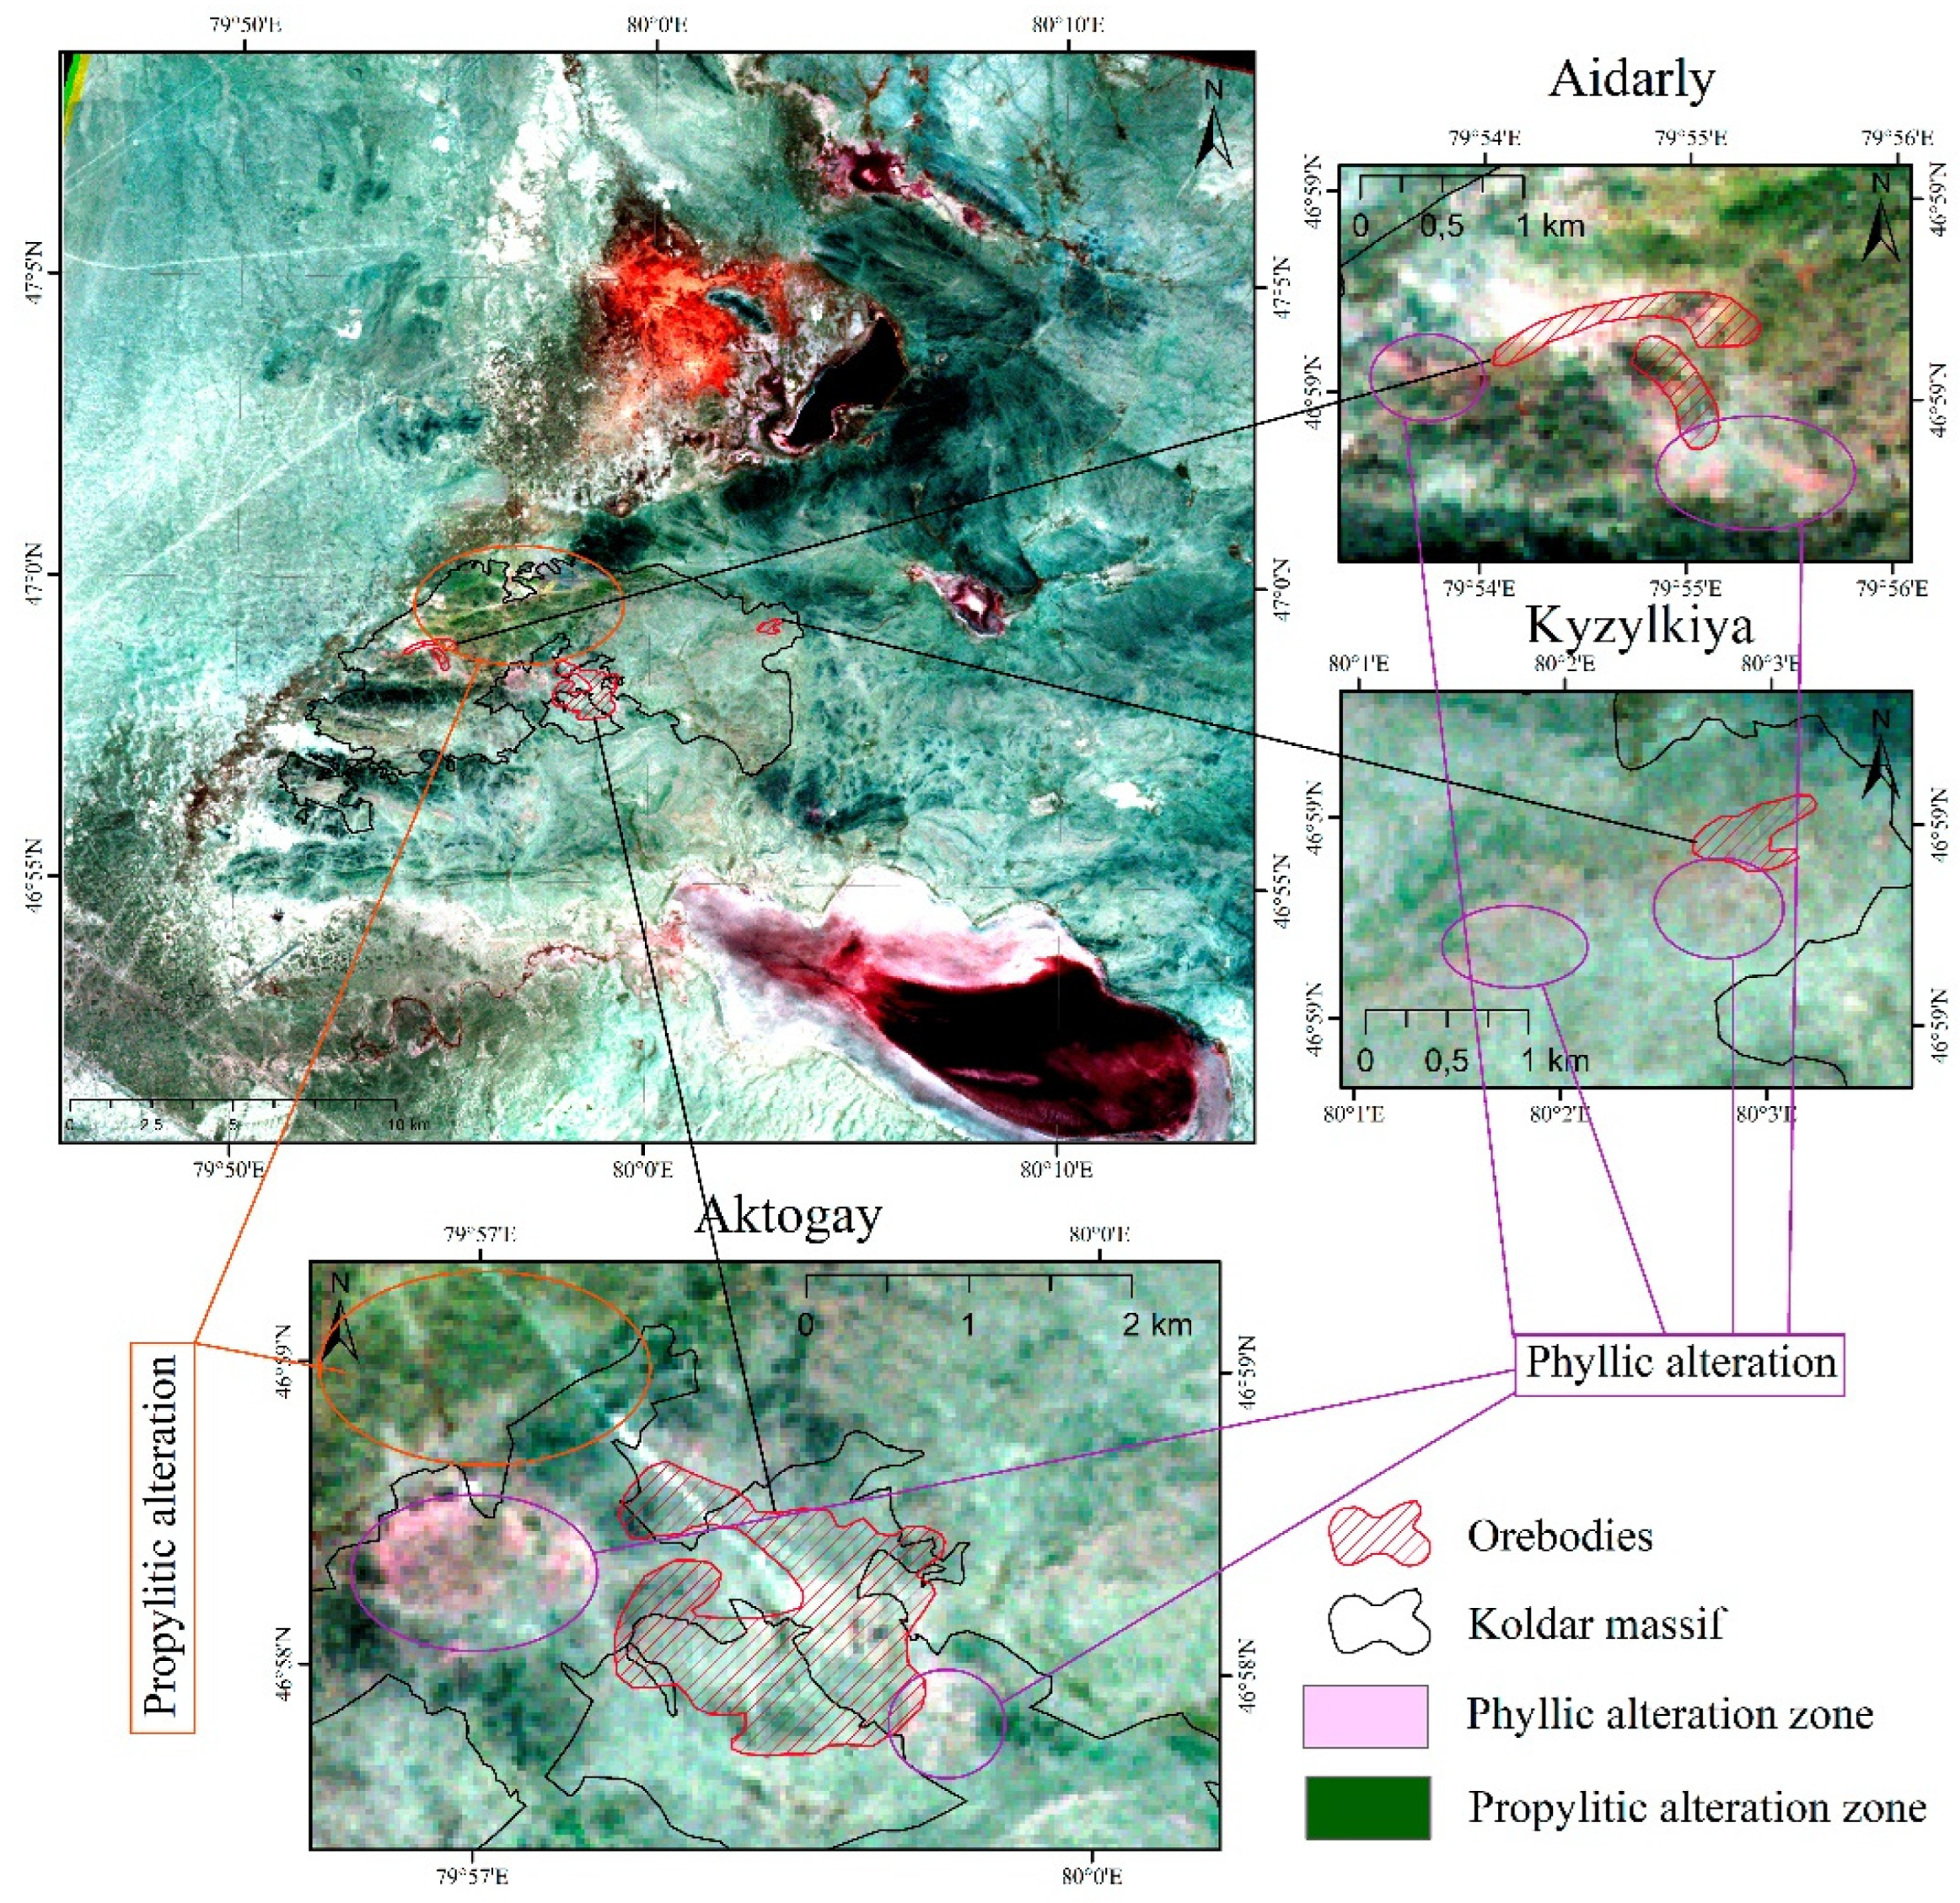
Figure 7.
Map of hydrothermal alteration zones in the Koldar Massif based on PRISMA data (Bands 77, 133, 150) using the FCC method.
Figure 7.
Map of hydrothermal alteration zones in the Koldar Massif based on PRISMA data (Bands 77, 133, 150) using the FCC method.
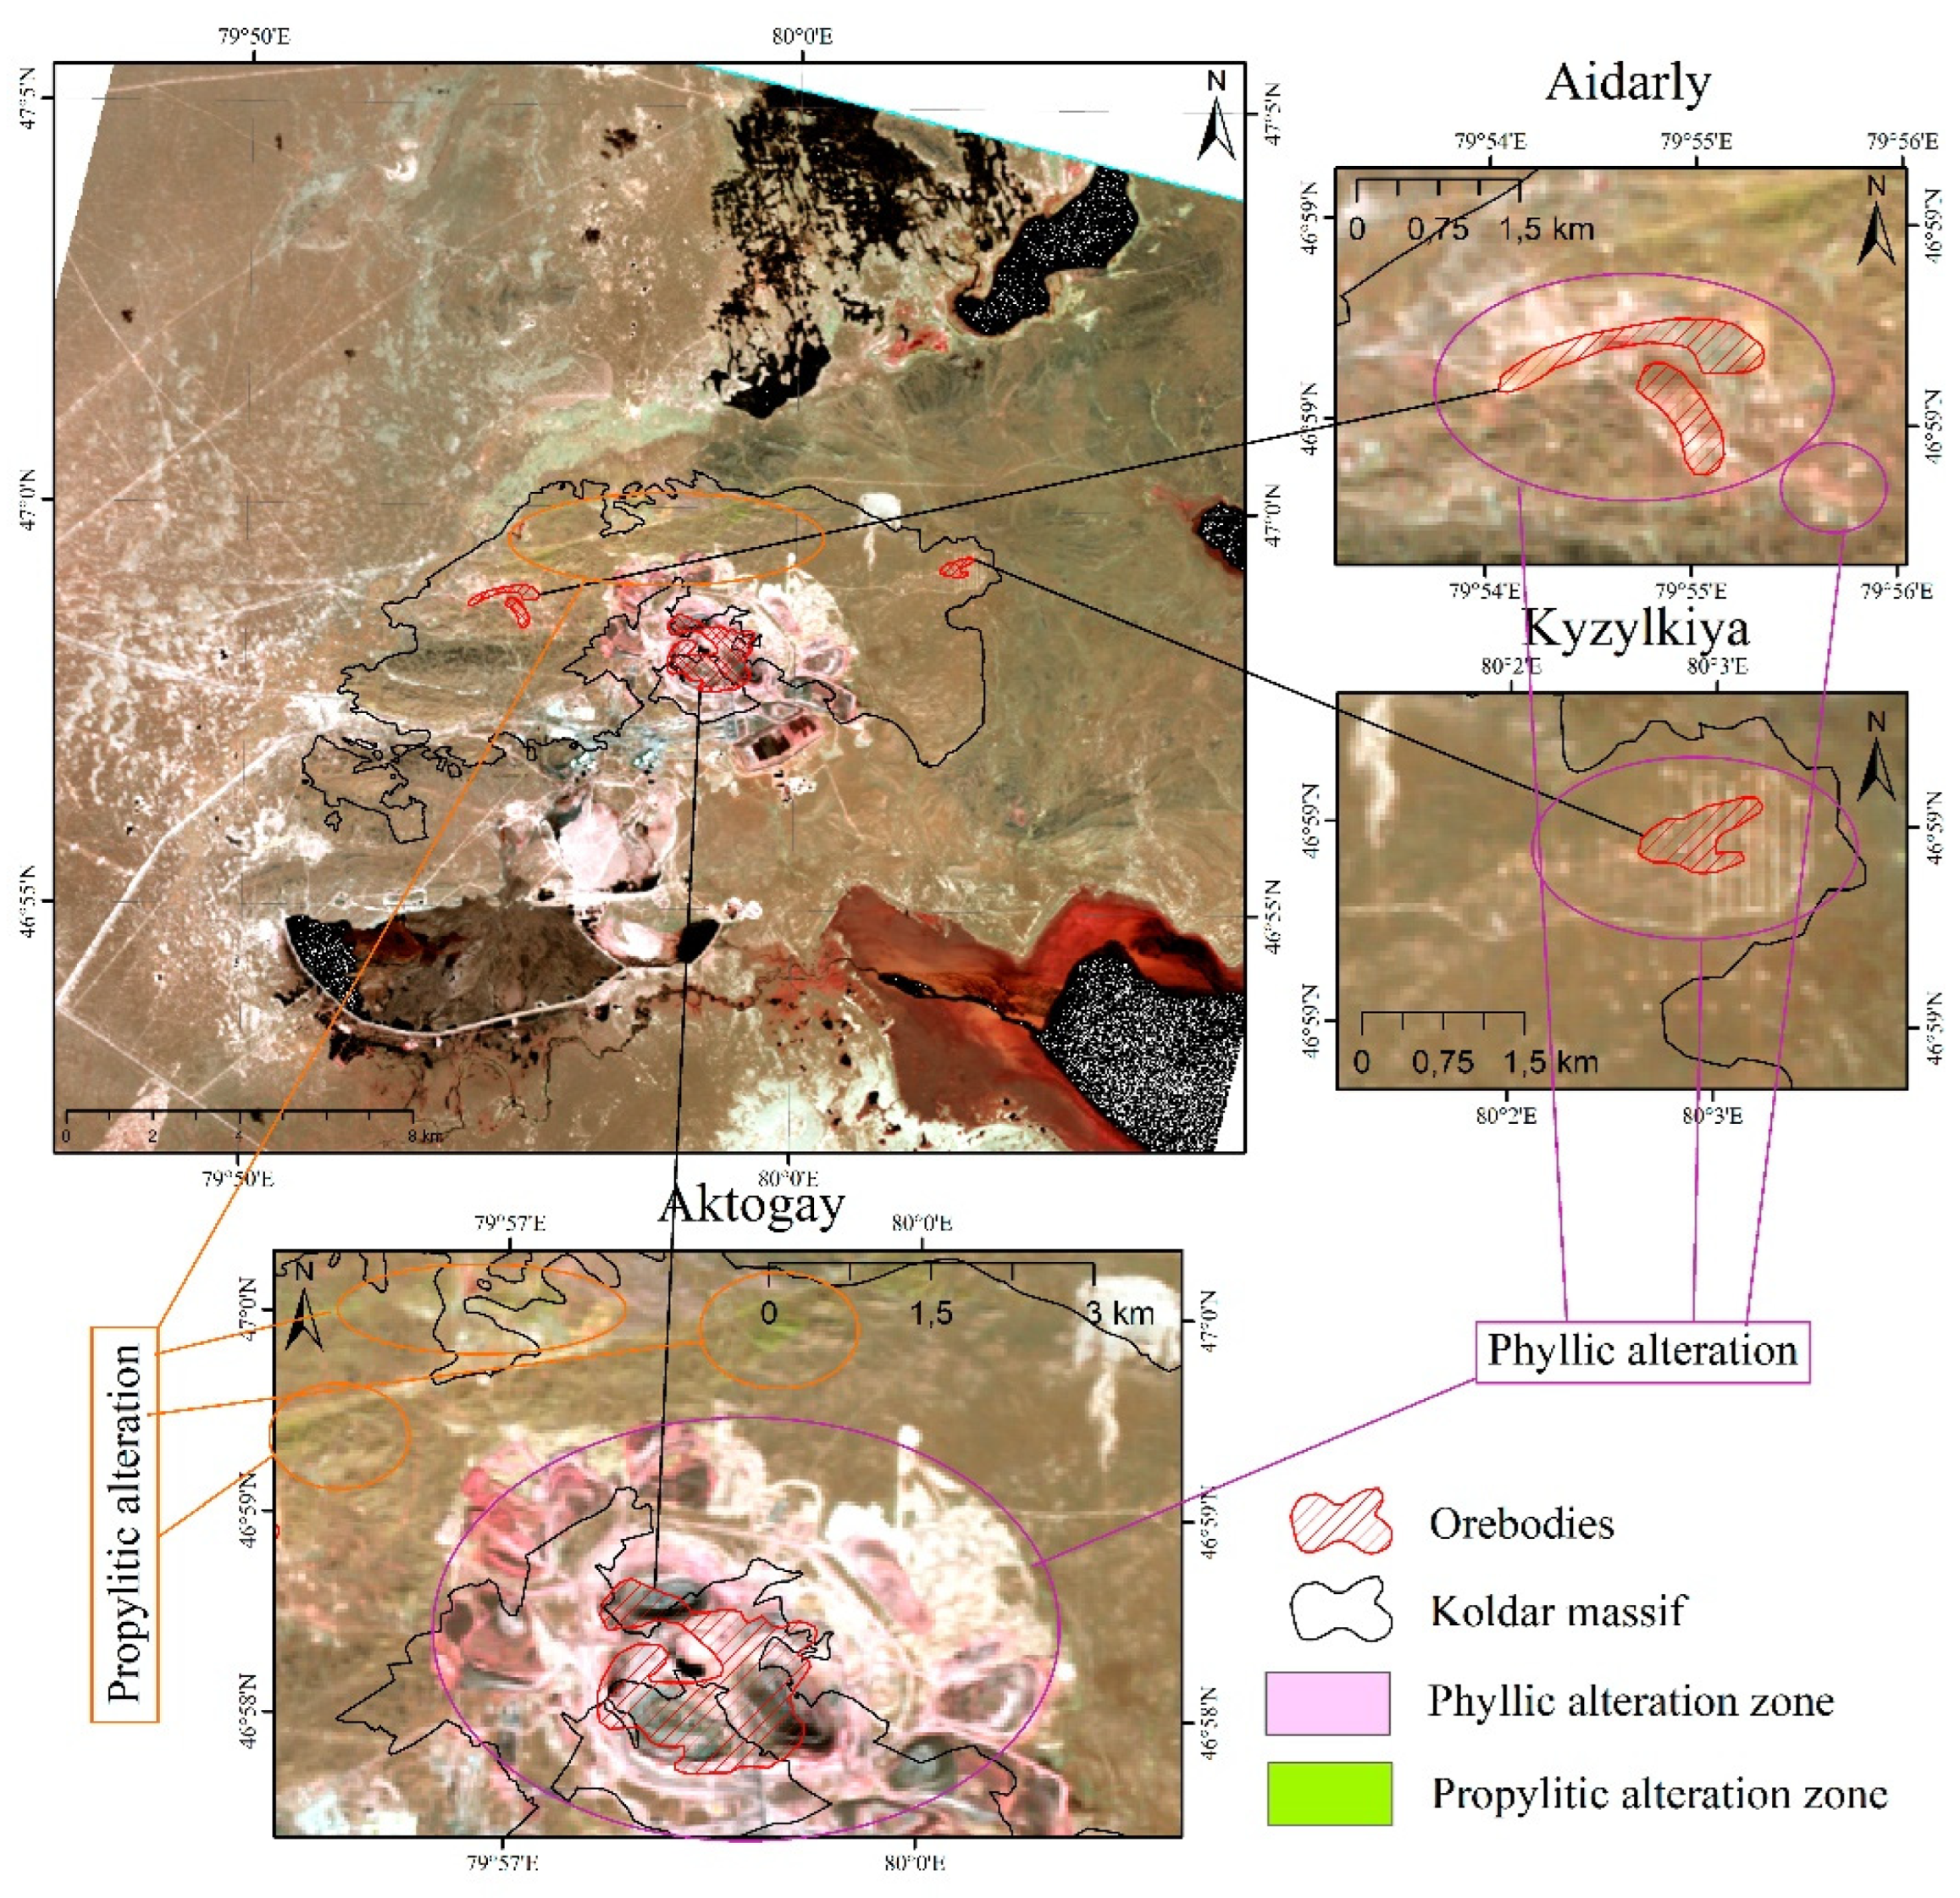
Figure 8.
Map of hydrothermal alteration zones at the Aidarly deposit based on WorldView-3 data using the SAM method.
Figure 8.
Map of hydrothermal alteration zones at the Aidarly deposit based on WorldView-3 data using the SAM method.
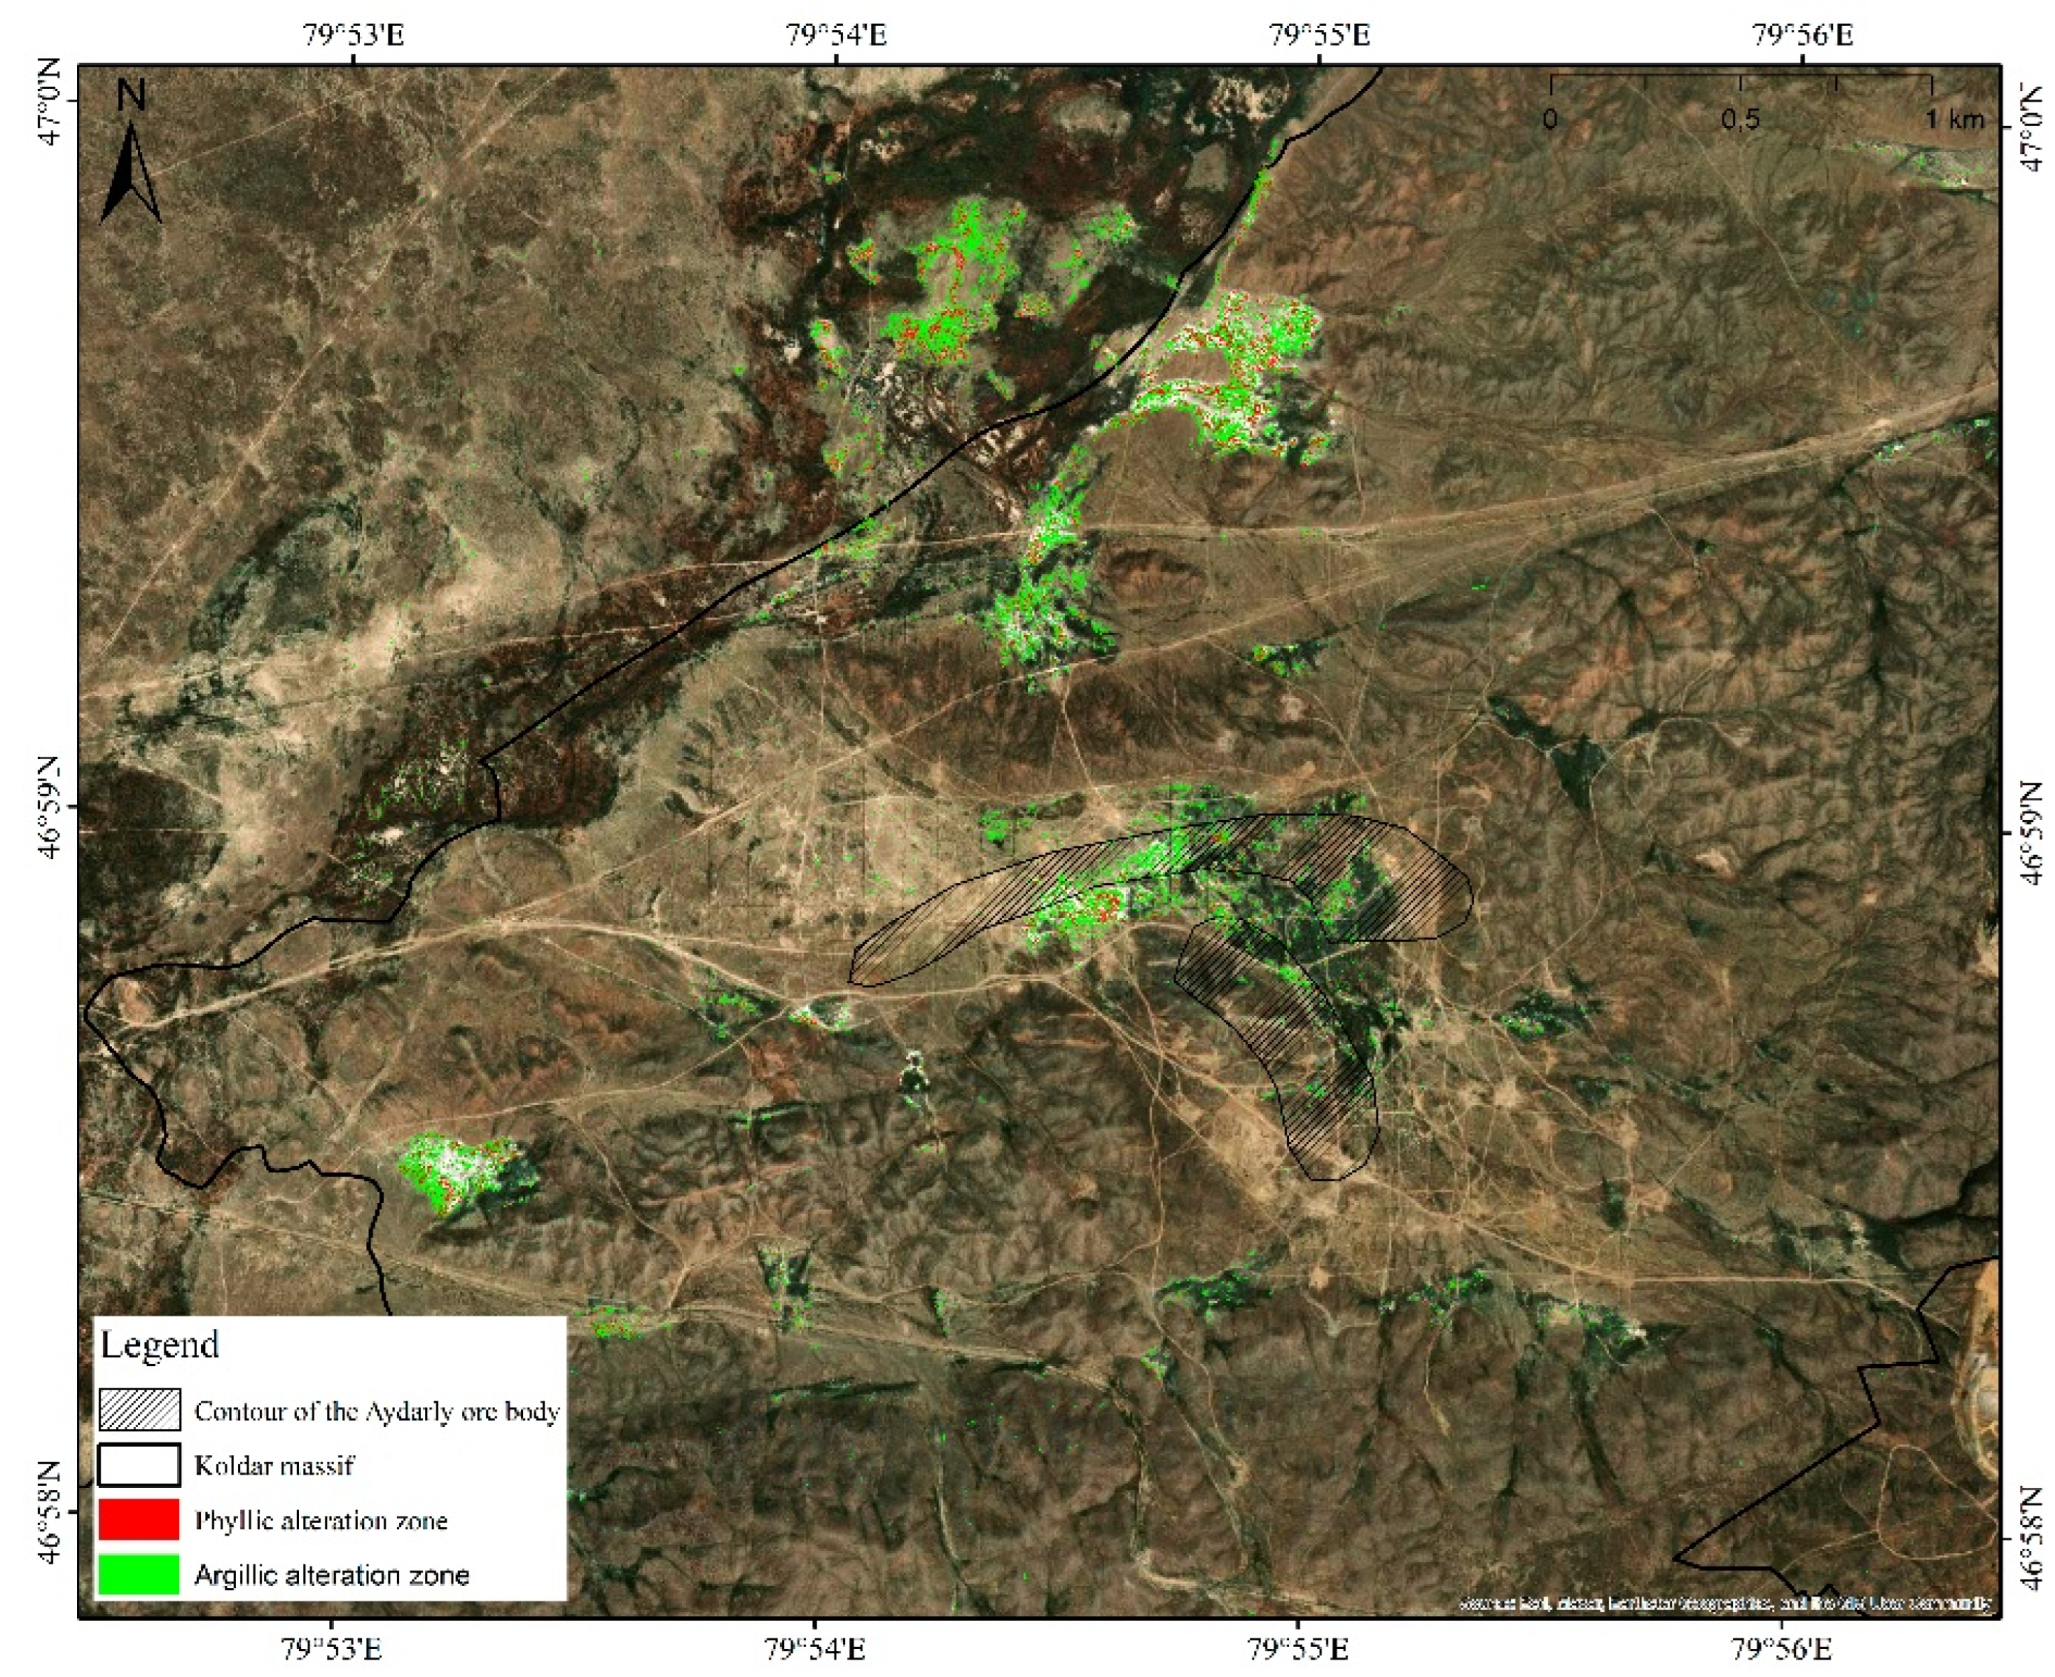
Figure 9.
(a) TMI map and (b) AS map of the study area.
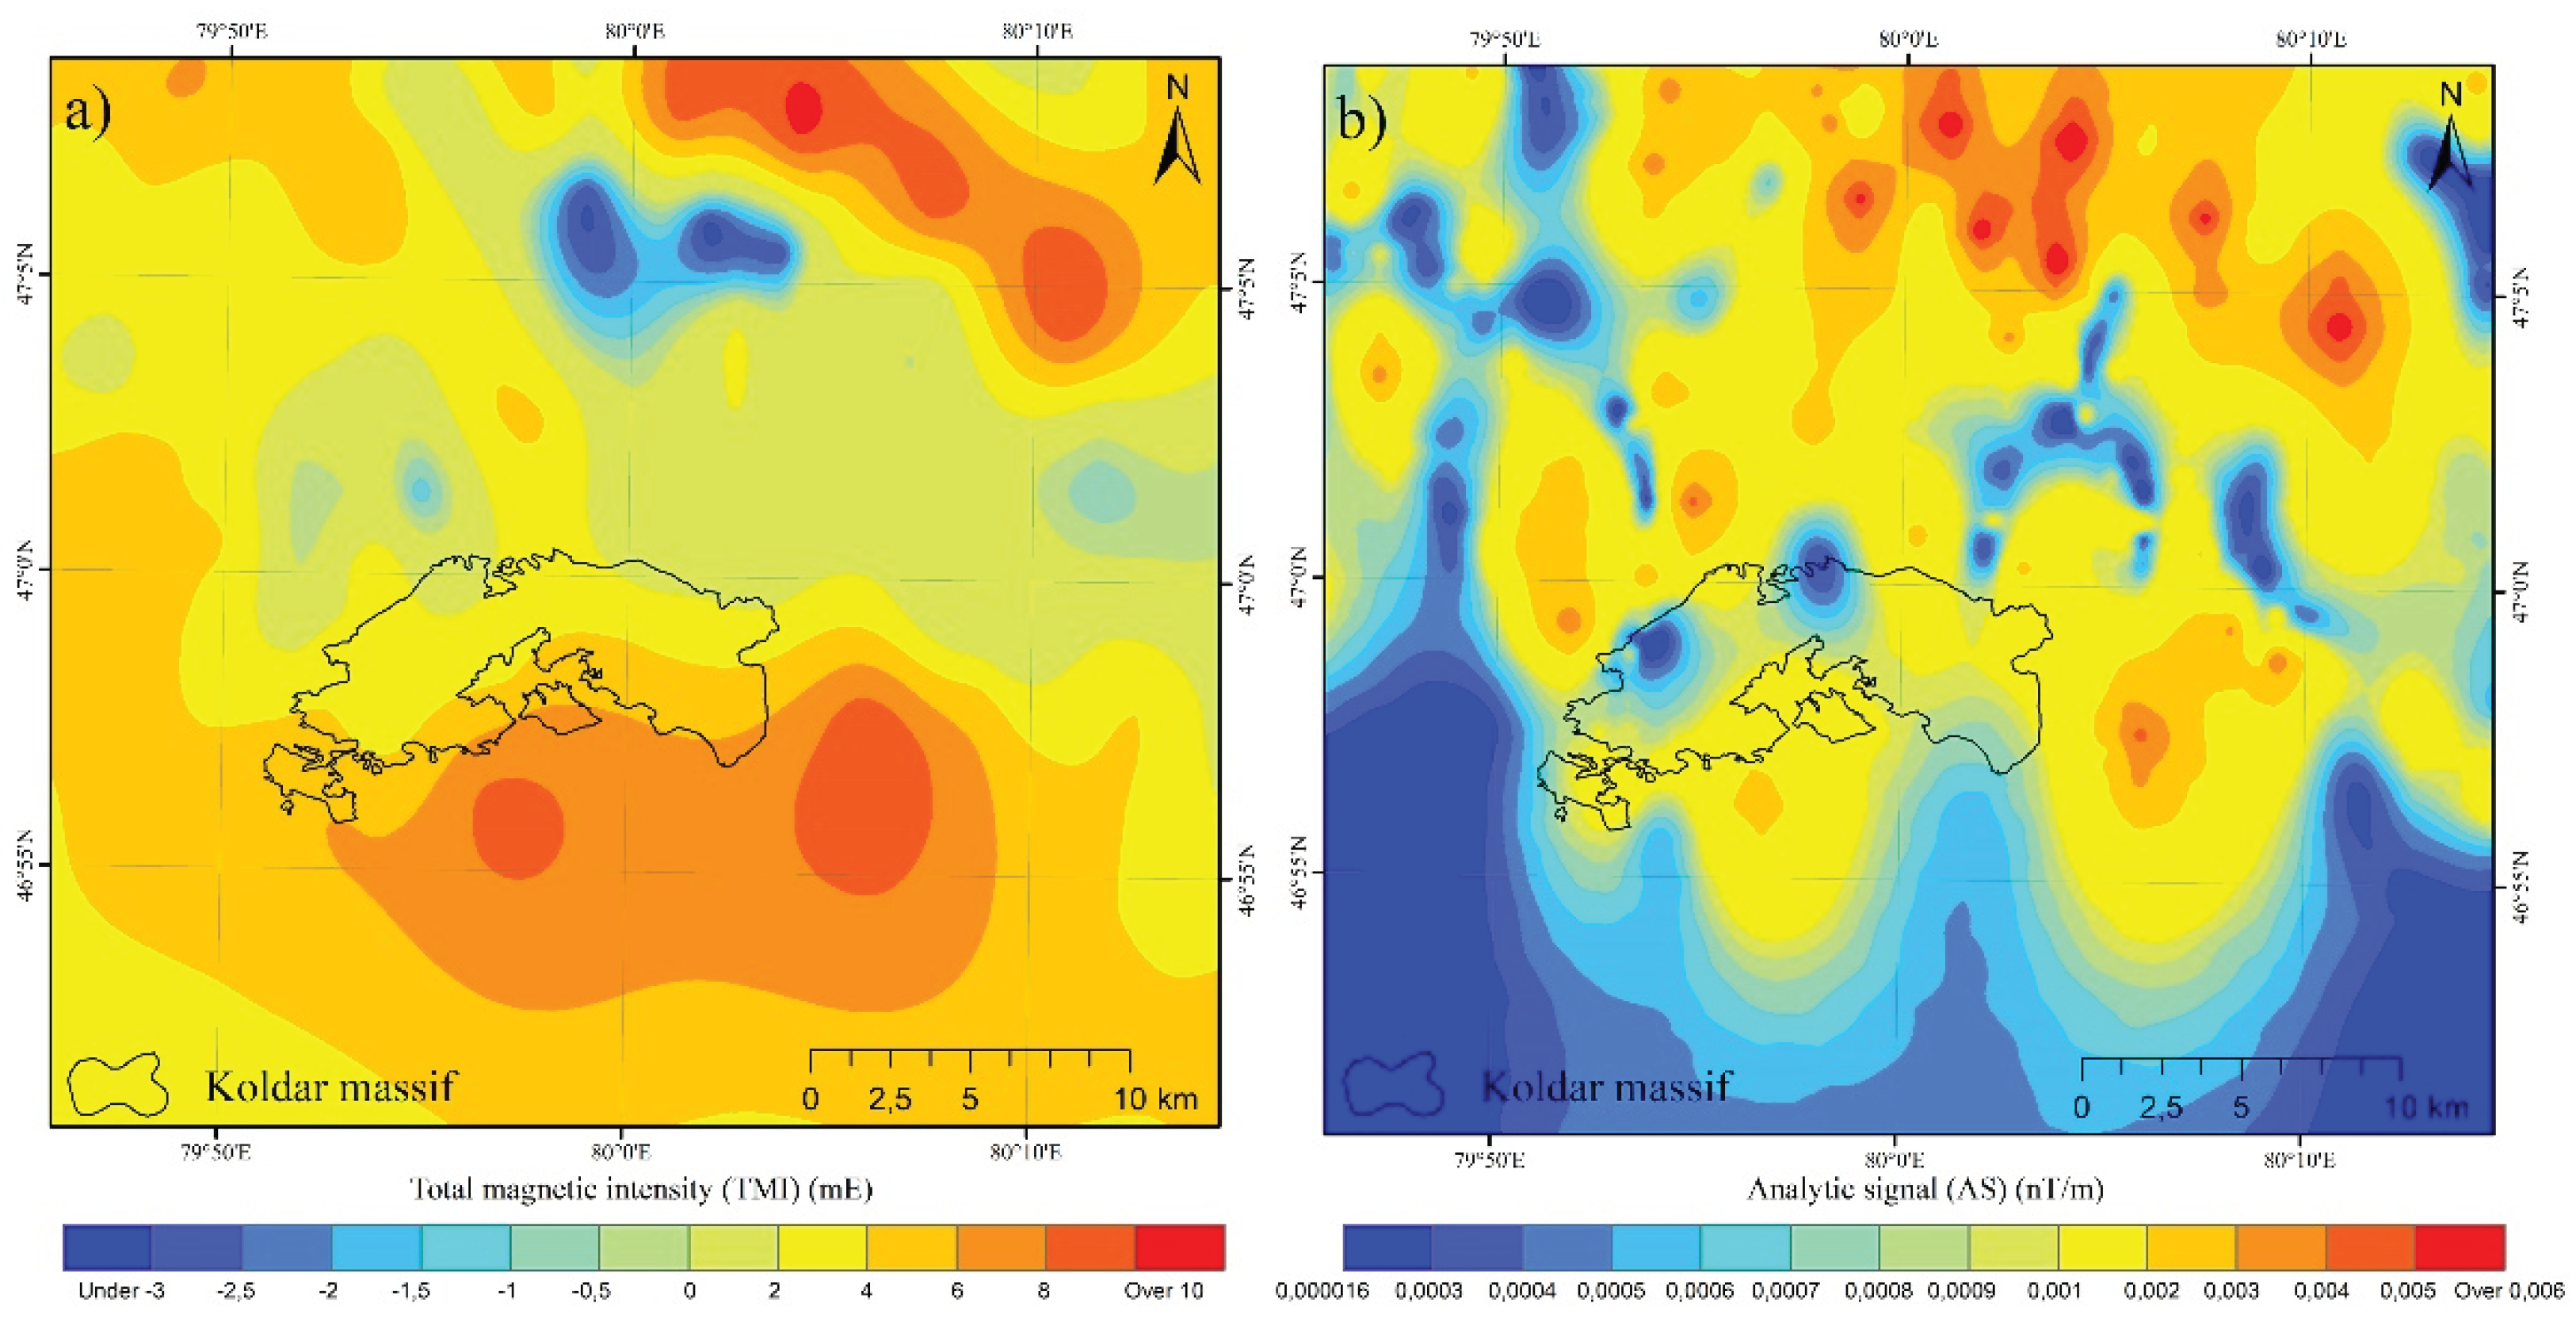
Figure 10.
(a) 1VD, (b) TDR, and (c) HD TDR maps derived from magnetic data of the Koldar massif.
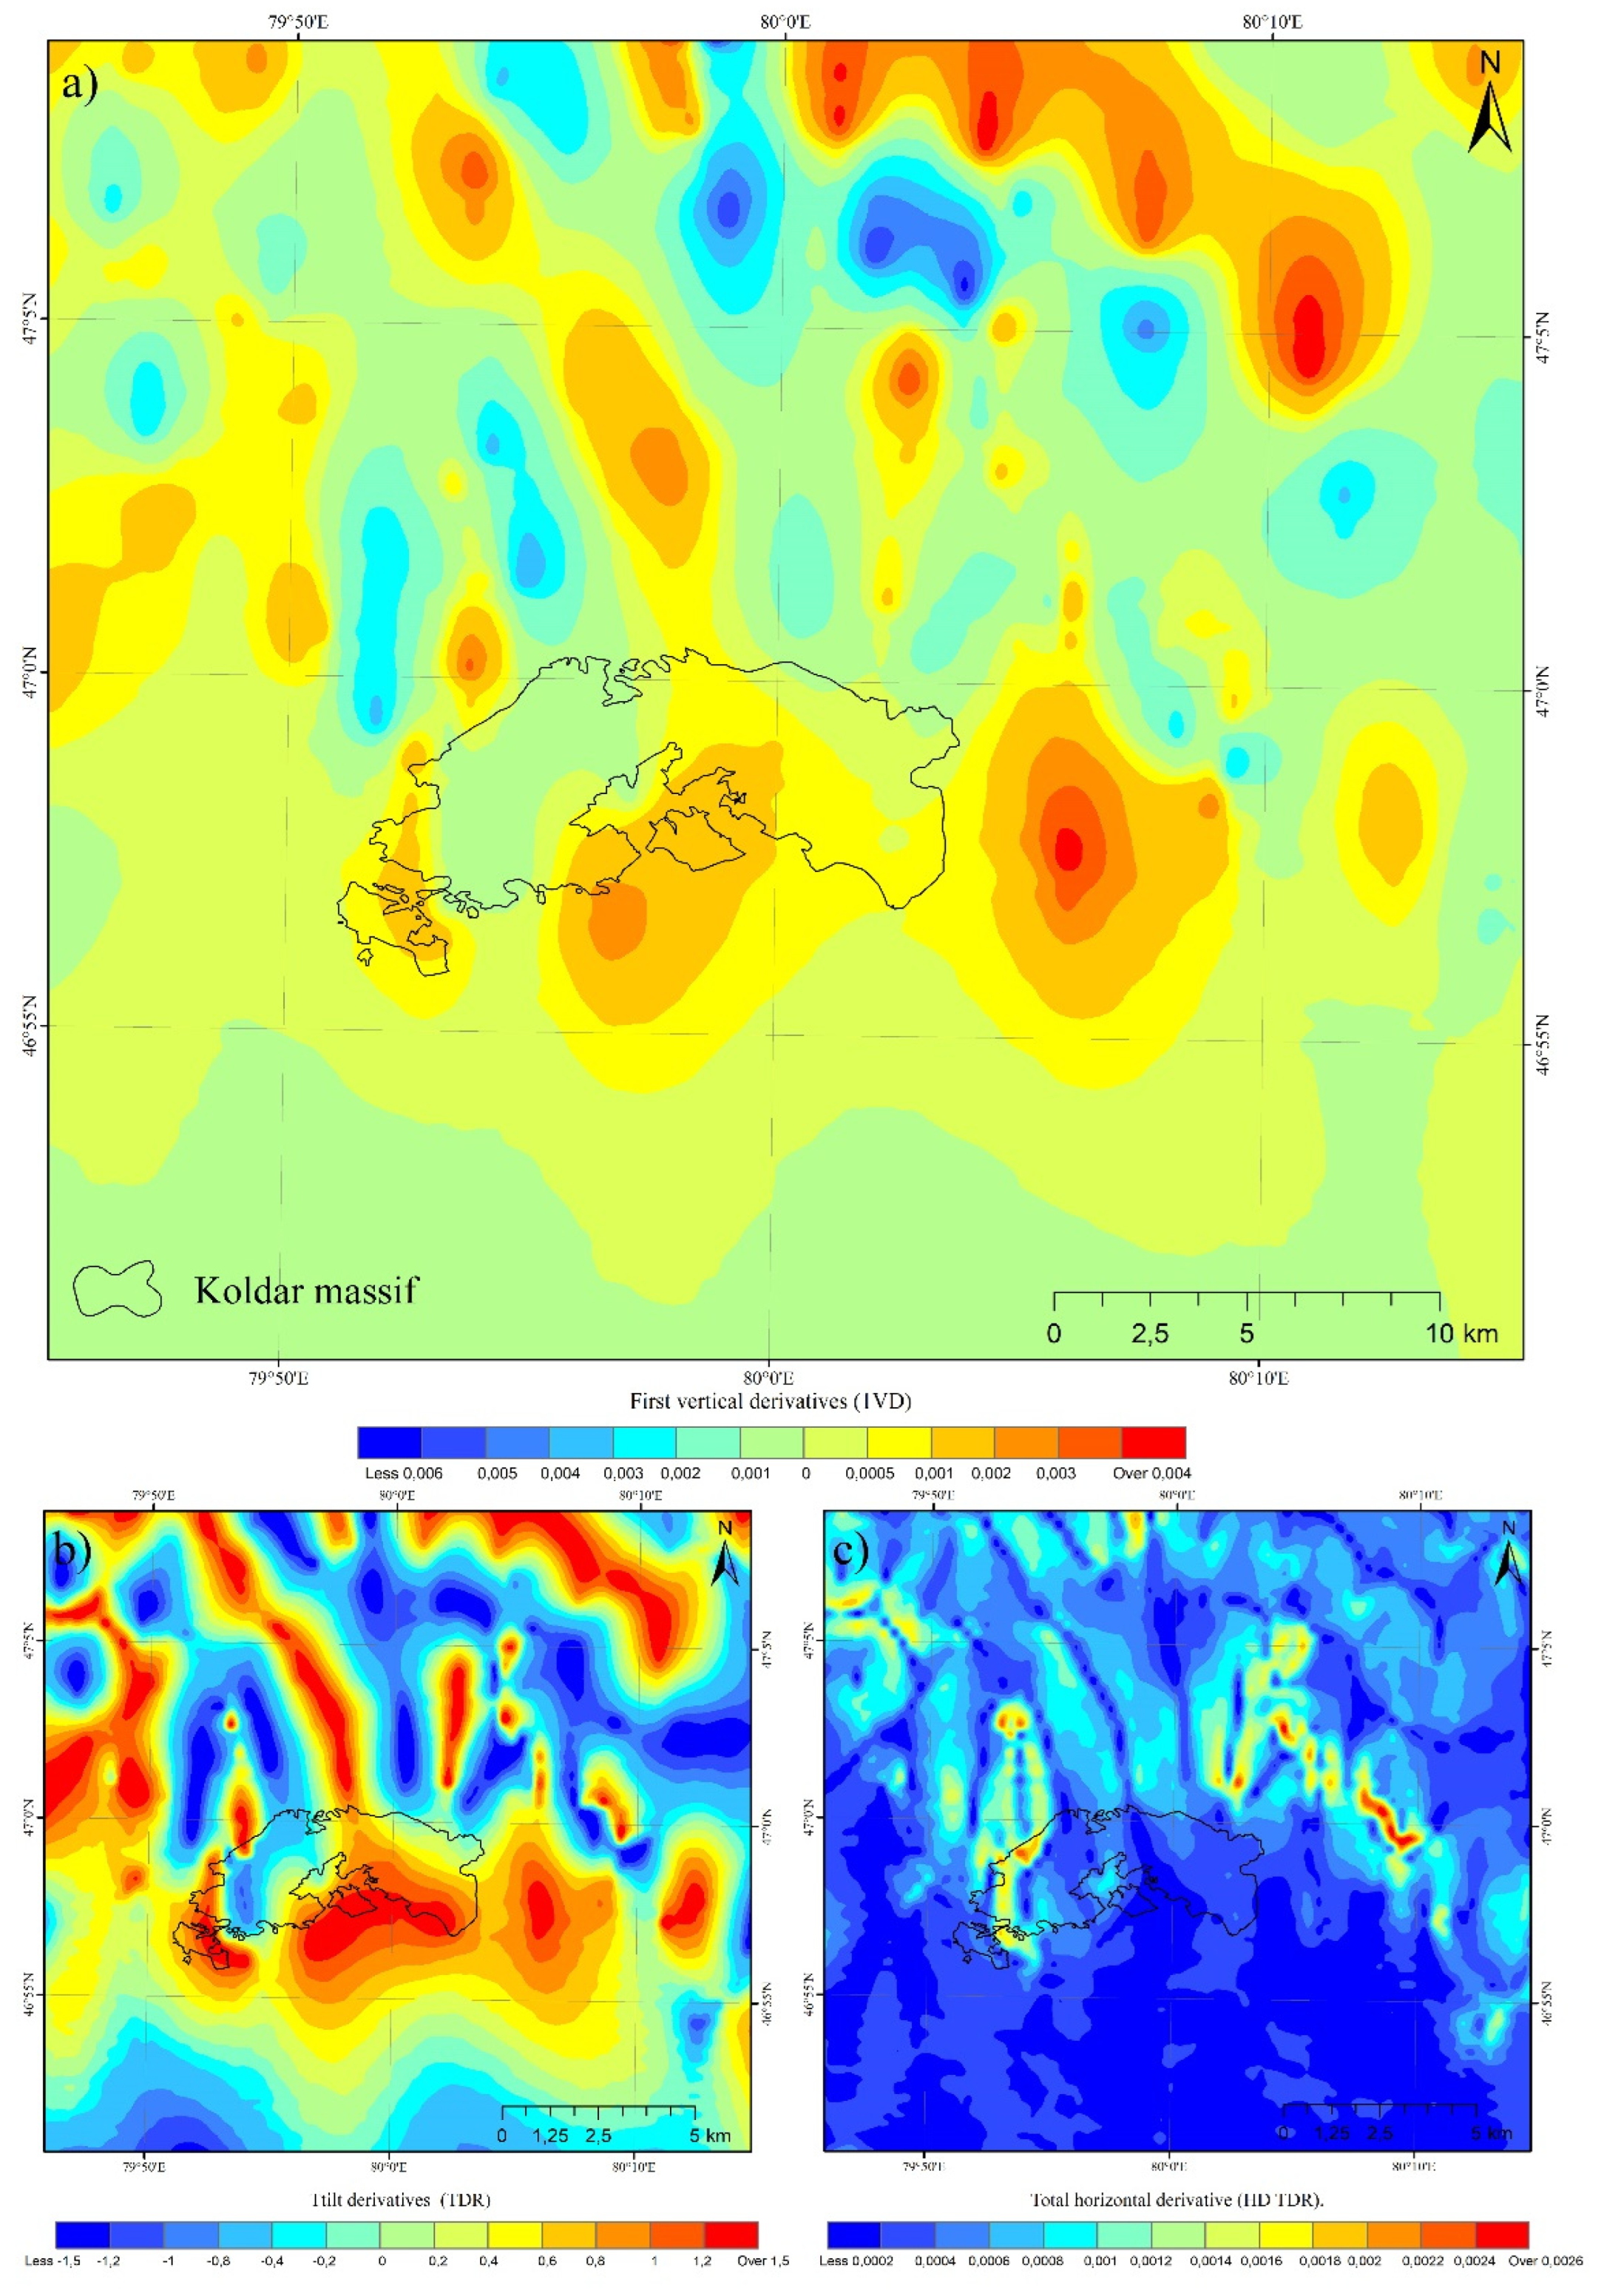
Figure 11.
(a) Bouguer anomaly map, (b) TDR, and (c) HD TDR maps based on gravity data of the Koldar massif.
Figure 11.
(a) Bouguer anomaly map, (b) TDR, and (c) HD TDR maps based on gravity data of the Koldar massif.
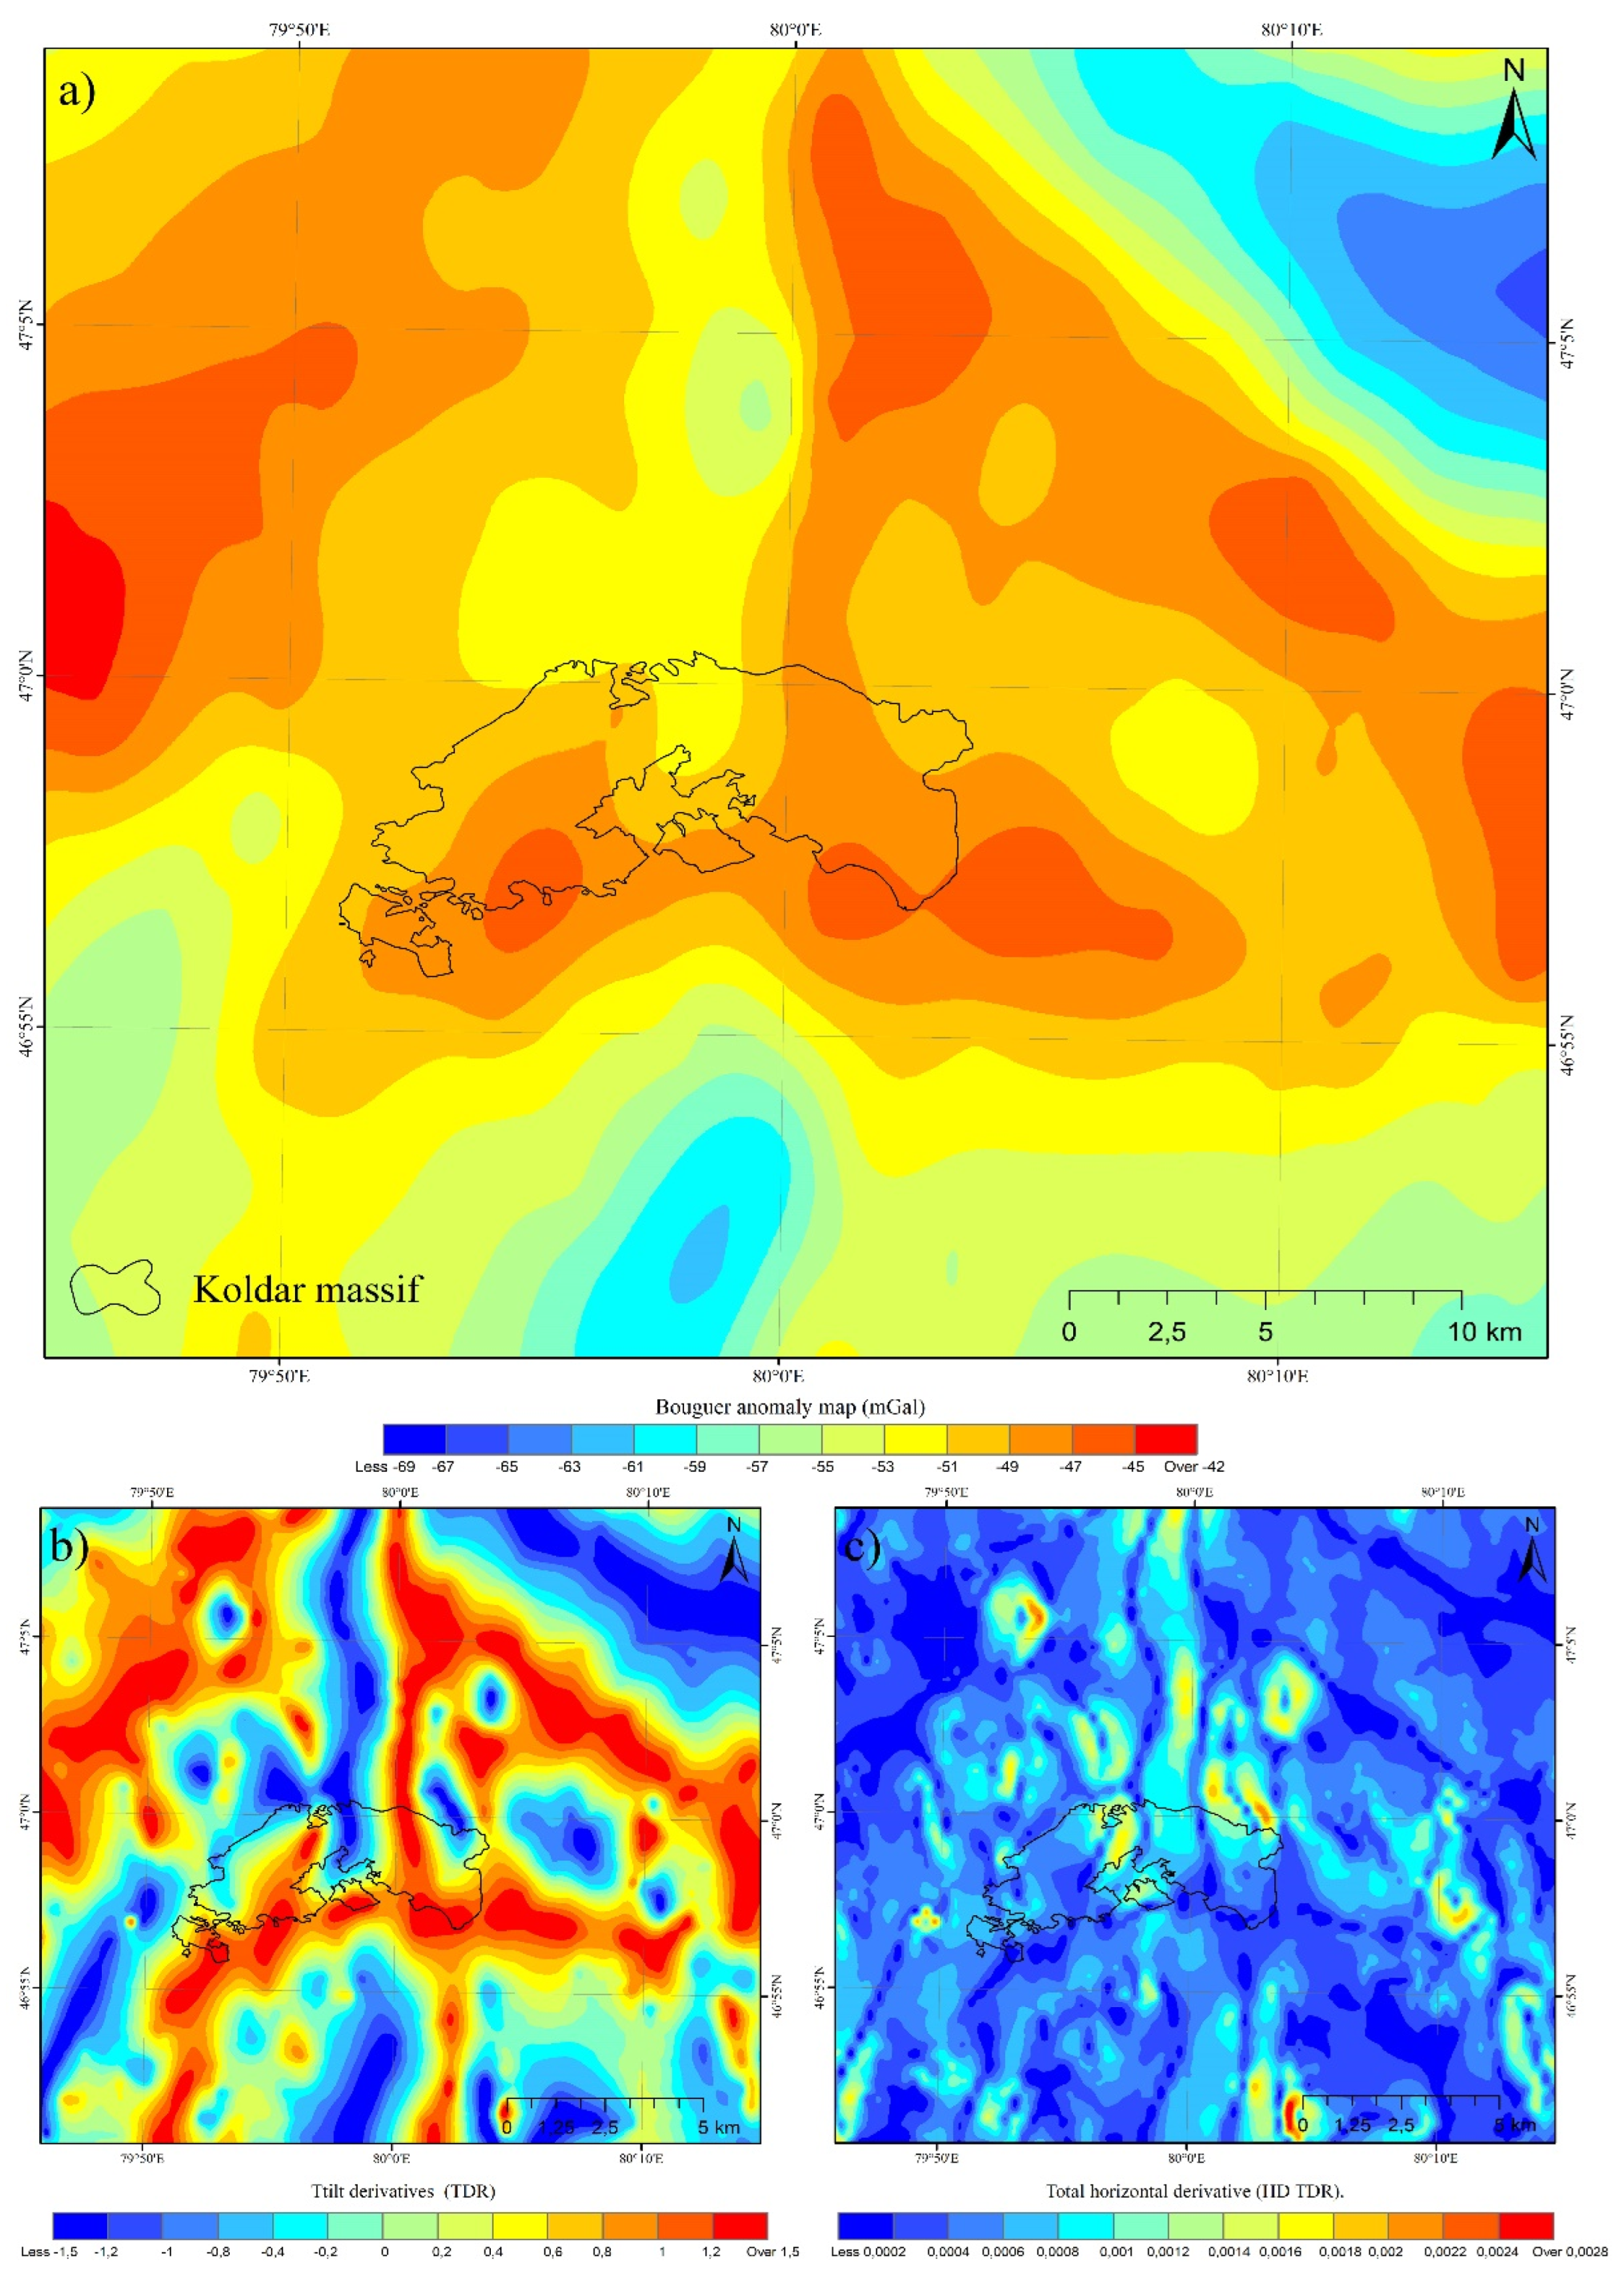
Figure 12.
(а) Mineral potential map of the Koldar massif and (b) Aydarly deposit.
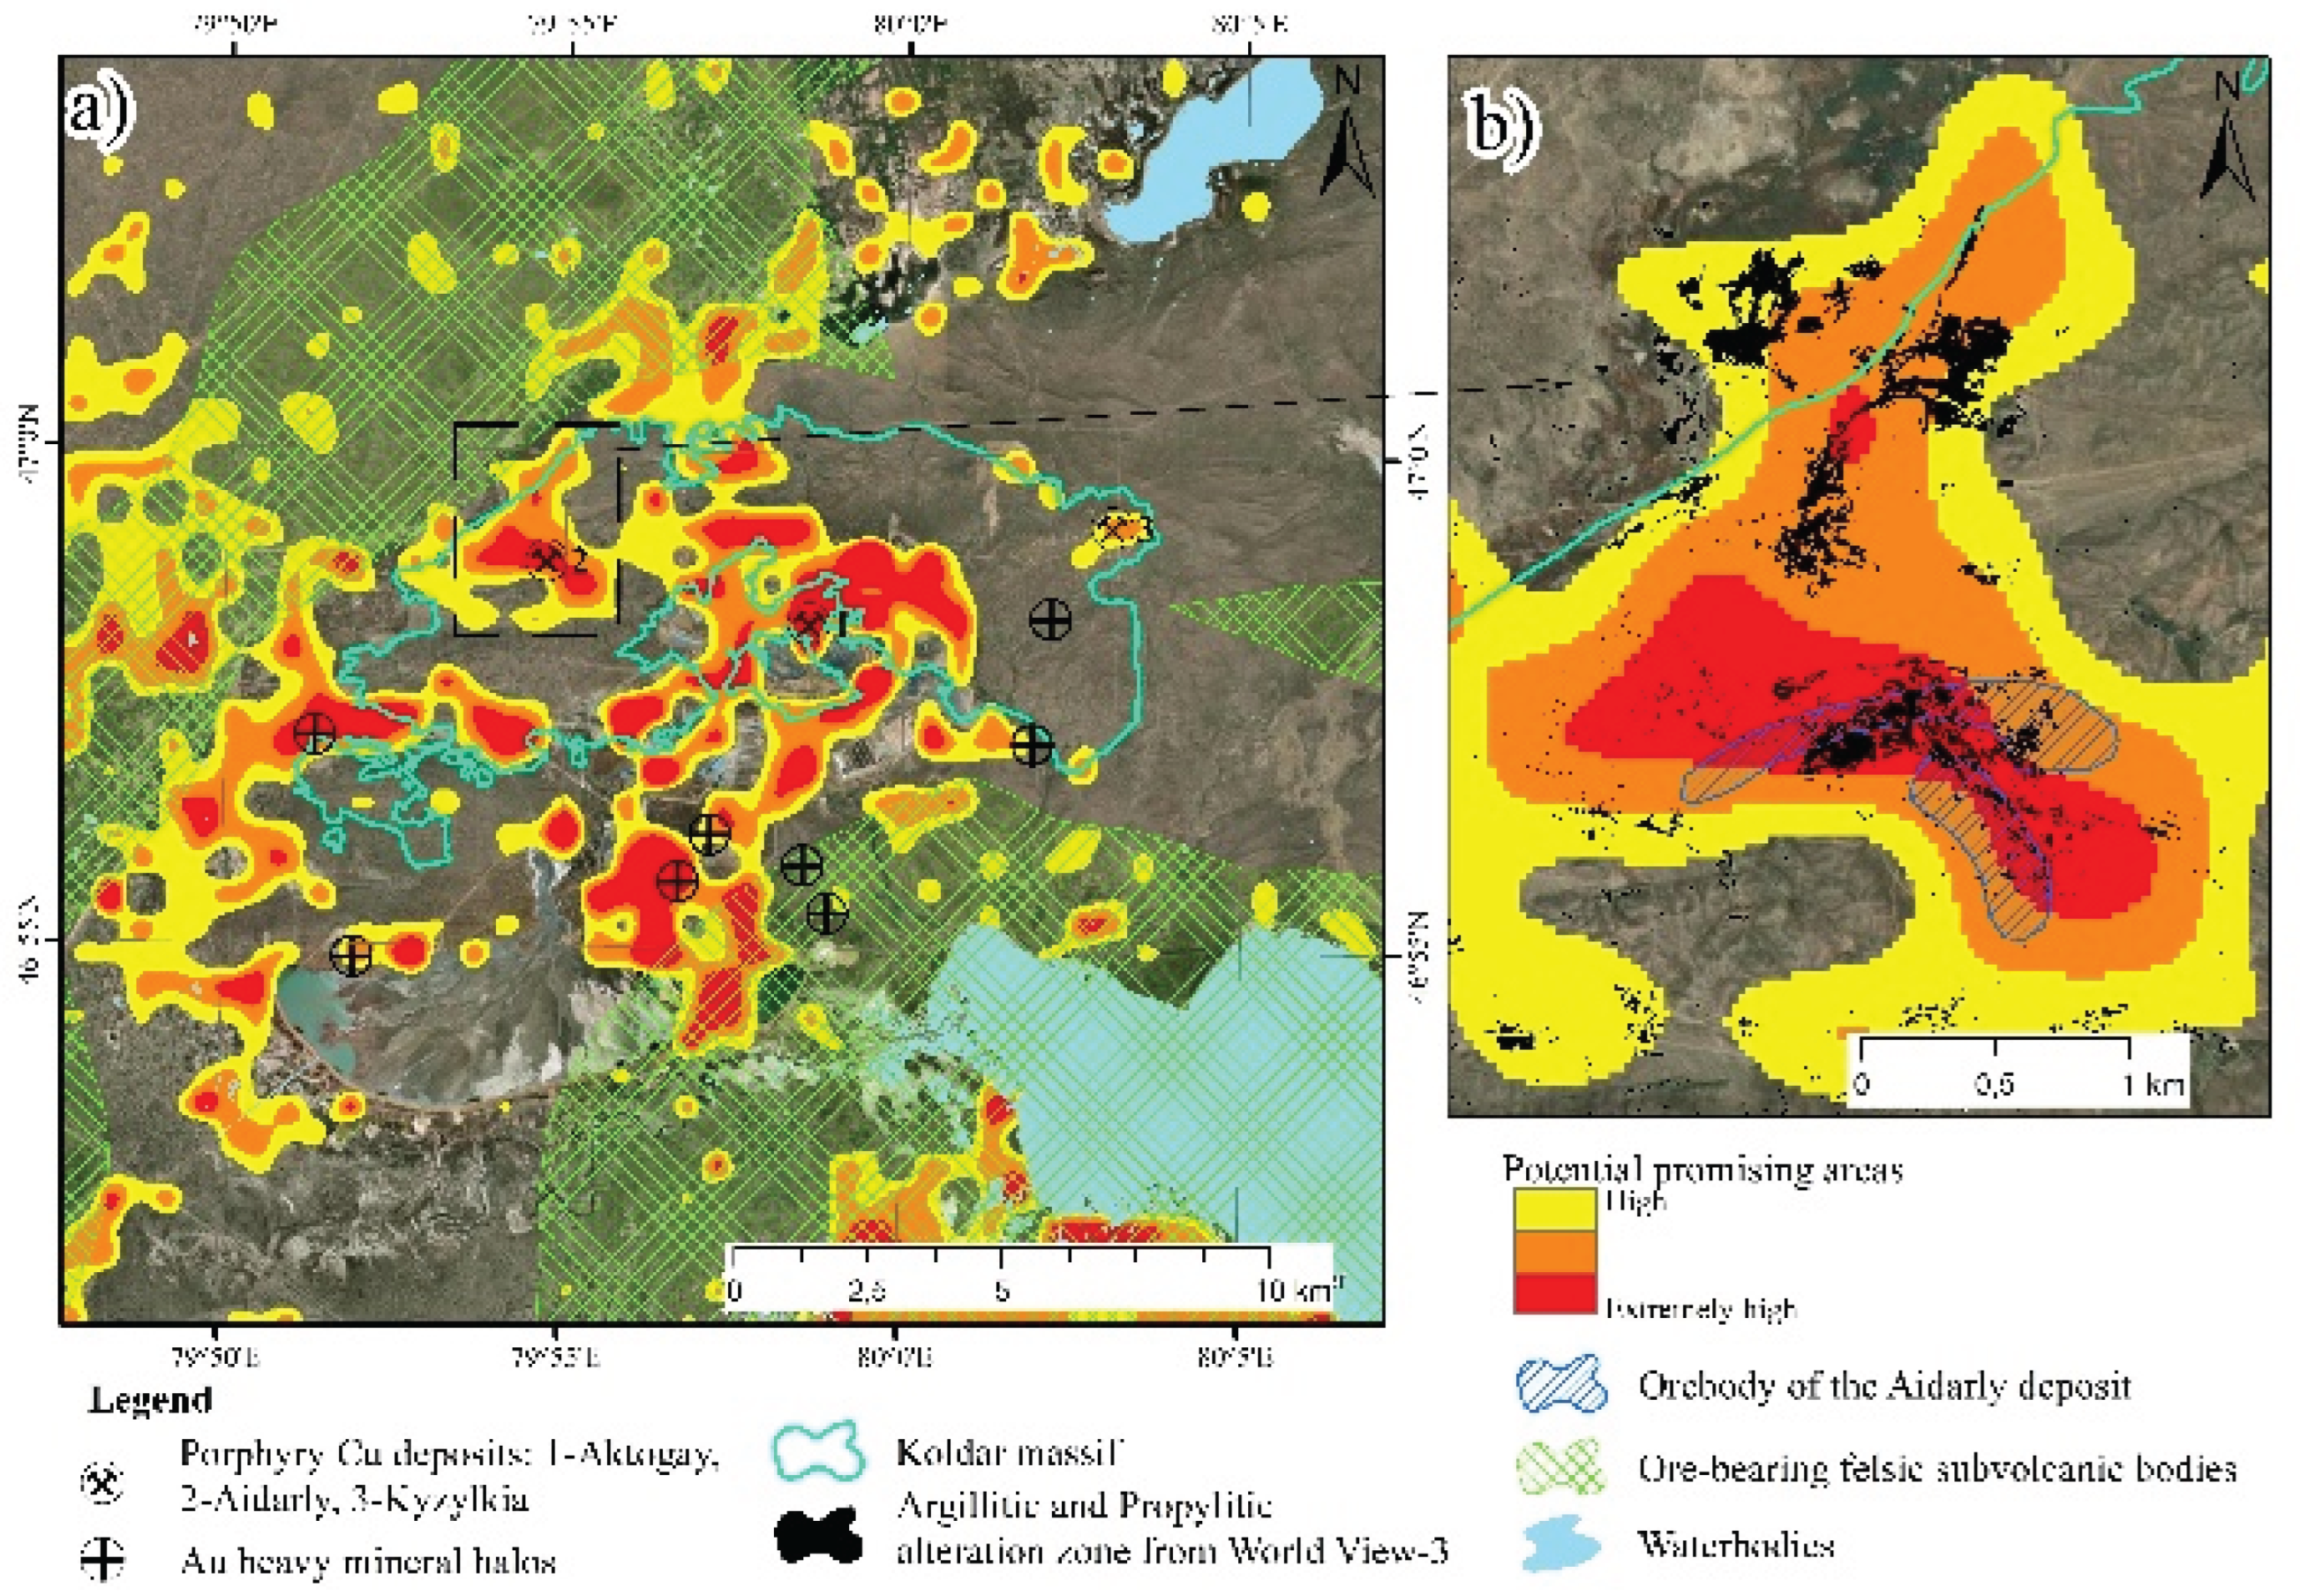

Table 1.
Characteristics of space data.
| Space images | Spectral bands | Spectral region (μm) |
Terrain Coverage (km) | Ground resolution cell (m) |
|---|---|---|---|---|
| ASTER | 14 | VNIR 0.52–0.86 SWIR 1.6–2.43 TIR 8.125–11.65 |
60 | VNIR 15 by 15 SWIR 30 by 30 TIR 90 by 90 |
| WorldView-3 | 28 | VNIR 0.4–1.04 SWIR 1.195–2.365 CAVIS 0.405–2.245 Pan 0.45–0.8 |
413.1 | Pan 0.31 VNIR 1.24 SWIR 3.7 CAVI 30 |
| PRISMA | 239 | 0.4–2.5 | 30 | 30 |
Table 2.
LINE module parameter values.
| Parameters | Description | Unit of measurement | Default values | Threshold values |
|---|---|---|---|---|
| RADI | For the detection of edges | pixel | 10 | 40 |
| GTHR | For the detection of edges | - | 100 | 200 |
| LTHR | Minimum length of a curve taken as lineament | pixel | 30 | 160 |
| FTHR | Allowed tolerance in curve fitting to form a polyline | pixel | 3 | 3 |
| ATHR | Maximum angle between two linked polylines |
degrees | 30 | 30 |
| DTHR | Maximum distance between two linked polylines |
pixel | 20 | 20 |
Disclaimer/Publisher’s Note: The statements, opinions and data contained in all publications are solely those of the individual author(s) and contributor(s) and not of MDPI and/or the editor(s). MDPI and/or the editor(s) disclaim responsibility for any injury to people or property resulting from any ideas, methods, instructions or products referred to in the content. |
© 2025 by the authors. Licensee MDPI, Basel, Switzerland. This article is an open access article distributed under the terms and conditions of the Creative Commons Attribution (CC BY) license (http://creativecommons.org/licenses/by/4.0/).
Copyright: This open access article is published under a Creative Commons CC BY 4.0 license, which permit the free download, distribution, and reuse, provided that the author and preprint are cited in any reuse.


