
Submitted:
16 June 2025
Posted:
17 June 2025
You are already at the latest version
Abstract
Tariff policy occupies a uniquely contentious role in modern economic policymaking. Historically, tariffs served as a primary source of government revenue, particularly before the institutionalization of income taxation. At the same time, they have long functioned as instruments of industrial protection, shielding domestic producers from foreign competition. The recent global resurgence of protectionist sentiment—particularly in developed economies—has reignited fundamental questions about the fiscal, economic, and political consequences of tariff interventions. This paper revisits these questions in the context of the United States between 1997 and 2024, a period marked by significant shifts in trade policy and macroeconomic volatility. Drawing on disaggregated tariff data, macroeconomic indicators, and public opinion polls, the study investigates three central questions: whether there exists a revenue-maximizing tariff rate, whether tariffs benefit or harm macroeconomic welfare, and how tariffs affect public support for government.
Keywords:
tariffs
; fiscal policy
; Laffer curve
; political economy
; welfare
1. Introduction
Tariff policy occupies a uniquely contentious role in modern economic policymaking. Historically, tariffs served as a primary source of government revenue, particularly before the institutionalization of income taxation. At the same time, they have long functioned as instruments of industrial protection, shielding domestic producers from foreign competition. The recent global resurgence of protectionist sentiment—particularly in developed economies—has reignited fundamental questions about the fiscal, economic, and political consequences of tariff interventions.
This paper revisits these questions in the context of the United States between 1997 and 2024, a period marked by significant shifts in trade policy and macroeconomic volatility. Specifically, the study addresses three core issues:
- (1)
- Is there a revenue-maximizing tariff rate in practice?
- (2)
- Do tariffs improve or impair macroeconomic welfare indicators such as GDP growth, inflation, and consumer expenditure?
- (3)
- To what extent do tariffs affect public approval or confidence in the federal government?
To explore these questions, the study develops a unified empirical framework that connects tariff policy to three key outcome domains: government revenue, economic welfare, and political support. The empirical analysis draws on highly disaggregated product-level tariff data from the Harmonized Tariff Schedule (HTS8), macroeconomic indicators from the Federal Reserve Economic Database (FRED), and longitudinal measures of public opinion from Gallup, the General Social Survey (GSS), and Pew Research Center. Using a combination of panel and time-series regression techniques, the study estimates nonlinear fiscal responses (via the tariff Laffer curve), welfare trade-offs, and political feedback effects. Special attention is given to identifying the revenue-maximizing tariff rate and determining whether it coincides with welfare-optimal or politically strategic outcomes.
The remainder of this paper is structured as follows. Section 2 reviews the theoretical and empirical literature on tariffs, emphasizing their fiscal, welfare, and political dimensions. Section 3 outlines the data sources and empirical strategy. Section 4 presents the main results. Section 5 discusses the implications of observed trade-offs between revenue, welfare, and public support. Section 6 concludes with a summary of findings and directions for future research.
2. Literature Review
2.1. Tariffs as a Source of Government Revenue
The fiscal role of tariffs has evolved significantly over time. In the early history of the United States, tariffs accounted for the majority of federal revenue, largely due to constitutional constraints on direct taxation and the administrative ease of border collection (Irwin, 2008; Levy, 2001). Even after the introduction of the income tax in 1913, tariff revenues remained a non-negligible component of the federal budget well into the twentieth century.
Modern trade theory has formalized the fiscal logic of tariff-setting using variants of the tariff Laffer curve, which posits that tariff revenue is a nonlinear function of the tariff rate: increasing tariffs raises revenue up to a point, beyond which import suppression leads to diminishing and ultimately declining returns. This framework is analytically grounded in public finance models of optimal taxation and has been empirically explored in recent simulation work (Evenett & Muendler, 2025). Their analysis shows that even under optimistic assumptions, tariff hikes can generate only limited revenue—insufficient to meaningfully offset other tax obligations or fund federal operations.
Beyond revenue maximization, scholars have examined the political economy of tariff design under fiscal motives. For instance, Srinivasan and Bhagwati (2015) extend the classical theory of optimal tariffs by incorporating the government’s preference for revenue over efficiency, demonstrating that revenue-seeking governments may impose higher and more distortionary tariffs than welfare-maximizing ones. Similarly, Amador and Bagwell (2012) explain why trade agreements, particularly under the WTO, often employ tariff caps rather than fixed tariffs. These caps provide governments with flexibility in revenue generation while maintaining credibility in international negotiations.
Together, this strand of literature provides the theoretical foundation for our first empirical investigation: identifying whether a revenue-maximizing tariff rate can be estimated from U.S. data and determining whether it aligns with historical policy outcomes.
2.2. Welfare Implications of Tariff Distortions
The welfare implications of tariff policy have been central to international trade theory and public economics since the seminal contributions by Bhagwati (1982) and Hatta (1977). Tariffs, by altering relative prices, inevitably introduce economic distortions, thus reallocating resources away from their optimal allocation under free trade conditions. Hatta (1977) explicitly characterized such welfare costs in terms of incremental policy changes, introducing a framework widely known as ”piecemeal reform theory,” which underscores the marginal benefits of reducing trade barriers toward welfare maximization.
Building upon these theoretical foundations, Bhagwati (1982) introduced the concept of ”Directly Unproductive, Profit-Seeking (DUP)” activities, defining tariffs as typical DUP instruments. Such policies not only shift resources from consumers to protected producers but also promote socially wasteful rent-seeking behavior, magnifying the overall welfare loss beyond traditional Harberger triangles of deadweight loss. Srinivasan and Bhagwati (2015) further developed this perspective, showing how tariffs motivated primarily by revenue objectives—rather than purely protectionist ones—tend to generate even larger welfare costs due to increased resource misallocation and intensified rent-seeking.
Empirically, economists have measured tariff-induced welfare losses using various metrics, including consumer price indices, real GDP growth, and personal consumption expenditures (PCE). Stern (1964), in a pioneering study on the United States, found that the existing tariff structure significantly distorted resource allocation, suggesting substantial efficiency gains if tariffs were reduced. More recently, Balassa (1965) systematically compared effective rates of protection across industrial countries, highlighting that nominal tariff rates alone underestimate the true economic distortions caused by cascading tariffs on intermediate goods.
The existing literature underscores that the ”welfare-maximizing” tariff rate generally lies below the revenue-maximizing rate identified in the fiscal literature. This finding raises critical policy questions: can a government seeking fiscal optimization also achieve macroeconomic efficiency, or must it inevitably choose between these competing goals?
2.3. Tariff Policy and Political Economy
Beyond their fiscal and welfare dimensions, tariffs play a critical role in the political economy landscape. Political economists have long recognized tariffs as tools used strategically by governments not merely to raise revenue or protect domestic industry, but also to secure and maintain political support. Groundbreaking work by Brock and Magee (1978) provides a seminal theoretical foundation, suggesting that tariff policies result from a political equilibrium driven by lobbying activities. According to their influential model, tariffs serve as rewards to politically influential special interest groups that provide crucial campaign contributions, thus shaping policy in favor of narrowly concentrated but politically pivotal interests.
Trefler (1993) advanced the political economy framework further by introducing the concept of the ”tariff cycle,” wherein industries affected by liberalization policies actively lobby for renewed protection, thus initiating repeated cycles of liberalization and re-protection. This cyclicality highlights how tariff policies are deeply embedded within dynamic political equilibria rather than static economic rationales.
Moreover, empirical work by Ray (2015) has reinforced the significance of political lobbying and employment levels in determining tariff protection. His cross-sectional analysis indicated that sectors characterized by high lobbying expenditures and employment densities systematically secure higher protection, aligning closely with political rather than purely economic determinants. Gardner and Kimbrough (1989), through historical analysis, showed that tariff levels often exhibit permanent or highly persistent characteristics due to political pressures rather than transient economic conditions.
Collectively, these findings raise crucial questions about the role of tariff policy in shaping public support for governments. Specifically, it remains unclear whether tariffs, while beneficial politically in the short term by rewarding influential constituencies, can maintain broader public approval over extended periods. This study aims to address this gap by empirically examining the political feedback effects of tariff policies in the contemporary United States context.
3. Data and Empirical Strategy
3.1. Dataset Construction
This study constructs a comprehensive dataset covering the period from 1997 to 2024, combining highly granular tariff data with macroeconomic and political variables. Tariff information is sourced from the U.S. International Trade Commission’s Harmonized Tariff Schedule at the eightdigit product level (HTS8), providing detailed records of both nominal (MFN ad valorem) and effective tariff rates (U.S. International Trade Commission, 2025). Macroeconomic indicators, including real GDP growth rates, Personal Consumption Expenditures (PCE), and the Consumer Price Index (CPI), are collected from the Federal Reserve Economic Database (FRED) (Federal Reserve Bank of St. Louis, 2025).
In addition to economic data, political indicators capturing public trust and government approval ratings are integrated into the analysis. These political support variables are obtained from widely recognized sources: Gallup’s Presidential Approval ratings (Inc., 2025), the General Social Survey’s Confidence in Institutions series (GSS), and Pew Research Center’s periodic assessments of public trust (Pew Research Center, 2024). By merging these multiple dimensions—tariffs, macroeconomic indicators, and public trust—this dataset facilitates a rigorous investigation of tariff policy outcomes across economic and political domains.
3.2. Key Variables
Our empirical framework employs four categories of variables, explicitly reflecting the central dimensions of our research questions—tariffs, revenue, welfare, and political trust. Table 1 summarizes the key variables used in the analysis.
These variables provide the empirical leverage to isolate the fiscal, economic, and political impacts of tariff policies.
3.3. Empirical Models
To systematically address our three research questions, we specify a series of econometric models:
- Revenue Equation (Tariff Laffer Curve)
We employ a quadratic panel specification to capture the nonlinear relationship between tariff rates and revenue:
Dutiesit = α + β1Tariffit + β2Tariff2it + uit
- 2.
- Welfare Regression (Composite Index)
To capture the multidimensional effects of tariff changes on economic welfare, we construct a standardized welfare index that aggregates both growth-enhancing and inflationary or recessionary macroeconomic indicators. Specifically, the index is defined as:
WelfareIndext = z(GDP PCHt) + z(PCE PCHt)+ z(MEHOINUSA672Nt)
− z(CPIAUCSL PCHt) − z(UNRATEt)
− z(CPIAUCSL PCHt) − z(UNRATEt)
This formula assigns positive weights to real GDP growth, personal consumption expenditure growth, and median household income, and negative weights to CPI inflation and unemployment rate. All components are standardized into z-scores to ensure comparability across different units and magnitudes.
We then estimate the following time-series regression to evaluate how effective tariff rates influence this composite index:
WelfareIndext = α + β Tarifft + δZt + εt
Here, Zt includes additional macroeconomic control variables where applicable. This approach allows for a unified assessment of whether higher tariffs contribute positively or negatively to overall economic well-being.
3. Political Approval Equation
Lastly, we analyze how tariffs impact political support by estimating:
where Zt represents additional control variables capturing political and economic conditions affecting public opinion.
Approvalt = α + βAvgTarifft + δZt + εt
Together, these models enable a comprehensive empirical assessment of tariff policies’ economic, fiscal, and political consequences.
3.4. Nonparametric LOWESS Estimation
To complement our parametric analysis, we implement Locally Weighted Scatterplot Smoothing (LOWESS), a technique introduced by Cleveland (1979) for robustly fitting a smooth curve through noisy data without assuming a specific global functional form. LOWESS operates by locally fitting simple polynomial regressions using weighted least squares, where observations near the target point receive greater weight.
This method is particularly suited for uncovering nonlinear patterns and visualizing the shape of empirical relationships, such as the Laffer-type curvature between effective tariff rates and collected duties. Its robustness stems from iterative reweighting procedures that diminish the influence of outliers and allow the smoothed curve to reflect the structure of the underlying data more faithfully.
In this paper, we apply LOWESS to HTS8-level tariff and revenue data to diagnose whether the estimated revenue peak from quadratic regressions corresponds to local patterns in the raw data. As Cleveland (1979) emphasizes, such smoothing techniques provide not only flexibility but also greater reliability in exploratory economic modeling.
4. Results
4.1. Revenue-Maximizing Tariff Rate
To identify the tariff rate that maximizes government revenue, we estimate a quadratic panel regression of tariff revenue (calculatedduties) on the effective tariff rate and its square. The model includes both product-level (HTS8) and year fixed effects to account for unobserved heterogeneity across products and over time. As shown in Table 2, both the linear and quadratic terms are statistically significant (p < 0.001), confirming the presence of a nonlinear relationship between tariff rates and revenue consistent with the Laffer curve hypothesis.
The estimated coefficients imply a revenue-maximizing effective tariff rate of approximately 1.2676 (or 127%), beyond which increases in the tariff rate begin to reduce government revenue. However, a nonparametric LOWESS smoothing plot reveals a more conservative turning point around 0.263 (or 26%), suggesting that in practice, the revenue-maximizing zone may lie at a much lower level, likely due to behavioral and demand-side responses not captured by the parametric model.
This divergence between the parametric and nonparametric estimates highlights the importance of considering empirical flexibility when analyzing fiscal policy instruments. While the theoretical optimum is higher, real-world revenue collection appears to peak at considerably lower tariff rates—possibly reflecting declining import volumes and increased evasion or substitution effects at high tariff thresholds.
4.2. Welfare Effects of Tariffs
To evaluate the macroeconomic welfare effects of tariff policy, we estimate two ordinary least squares (OLS) regressions: one linking effective tariff rates to real GDP growth, and the other linking tariffs to consumer price inflation.
In the first regression model, real GDP growth (gdp.pch) is regressed on the effective tariff rate, controlling for personal consumption expenditure growth (pce.pch) and CPI inflation (cpiaucsl.pch). As shown in Table 3, the coefficient on the tariff rate is negative and statistically significant (β = −0.131, p < 0.001), indicating that higher tariffs are associated with slower economic growth. Figure 3 visualizes this relationship. Although the fitted line appears upwardsloping, this is driven by high-density clustering in low-tariff, high-growth zones, highlighting the importance of interpreting regression results alongside visual diagnostics.
In the second model, CPI inflation is regressed on the effective tariff rate while controlling for GDP growth. As reported in Table 4, there is a strong positive relationship (β = 1.290, p < 0.001), confirming that higher tariffs raise consumer prices through supply-chain pass-through effects. This is illustrated in Figure 2, where the scatterplot and fitted line indicate a clear upward trend.
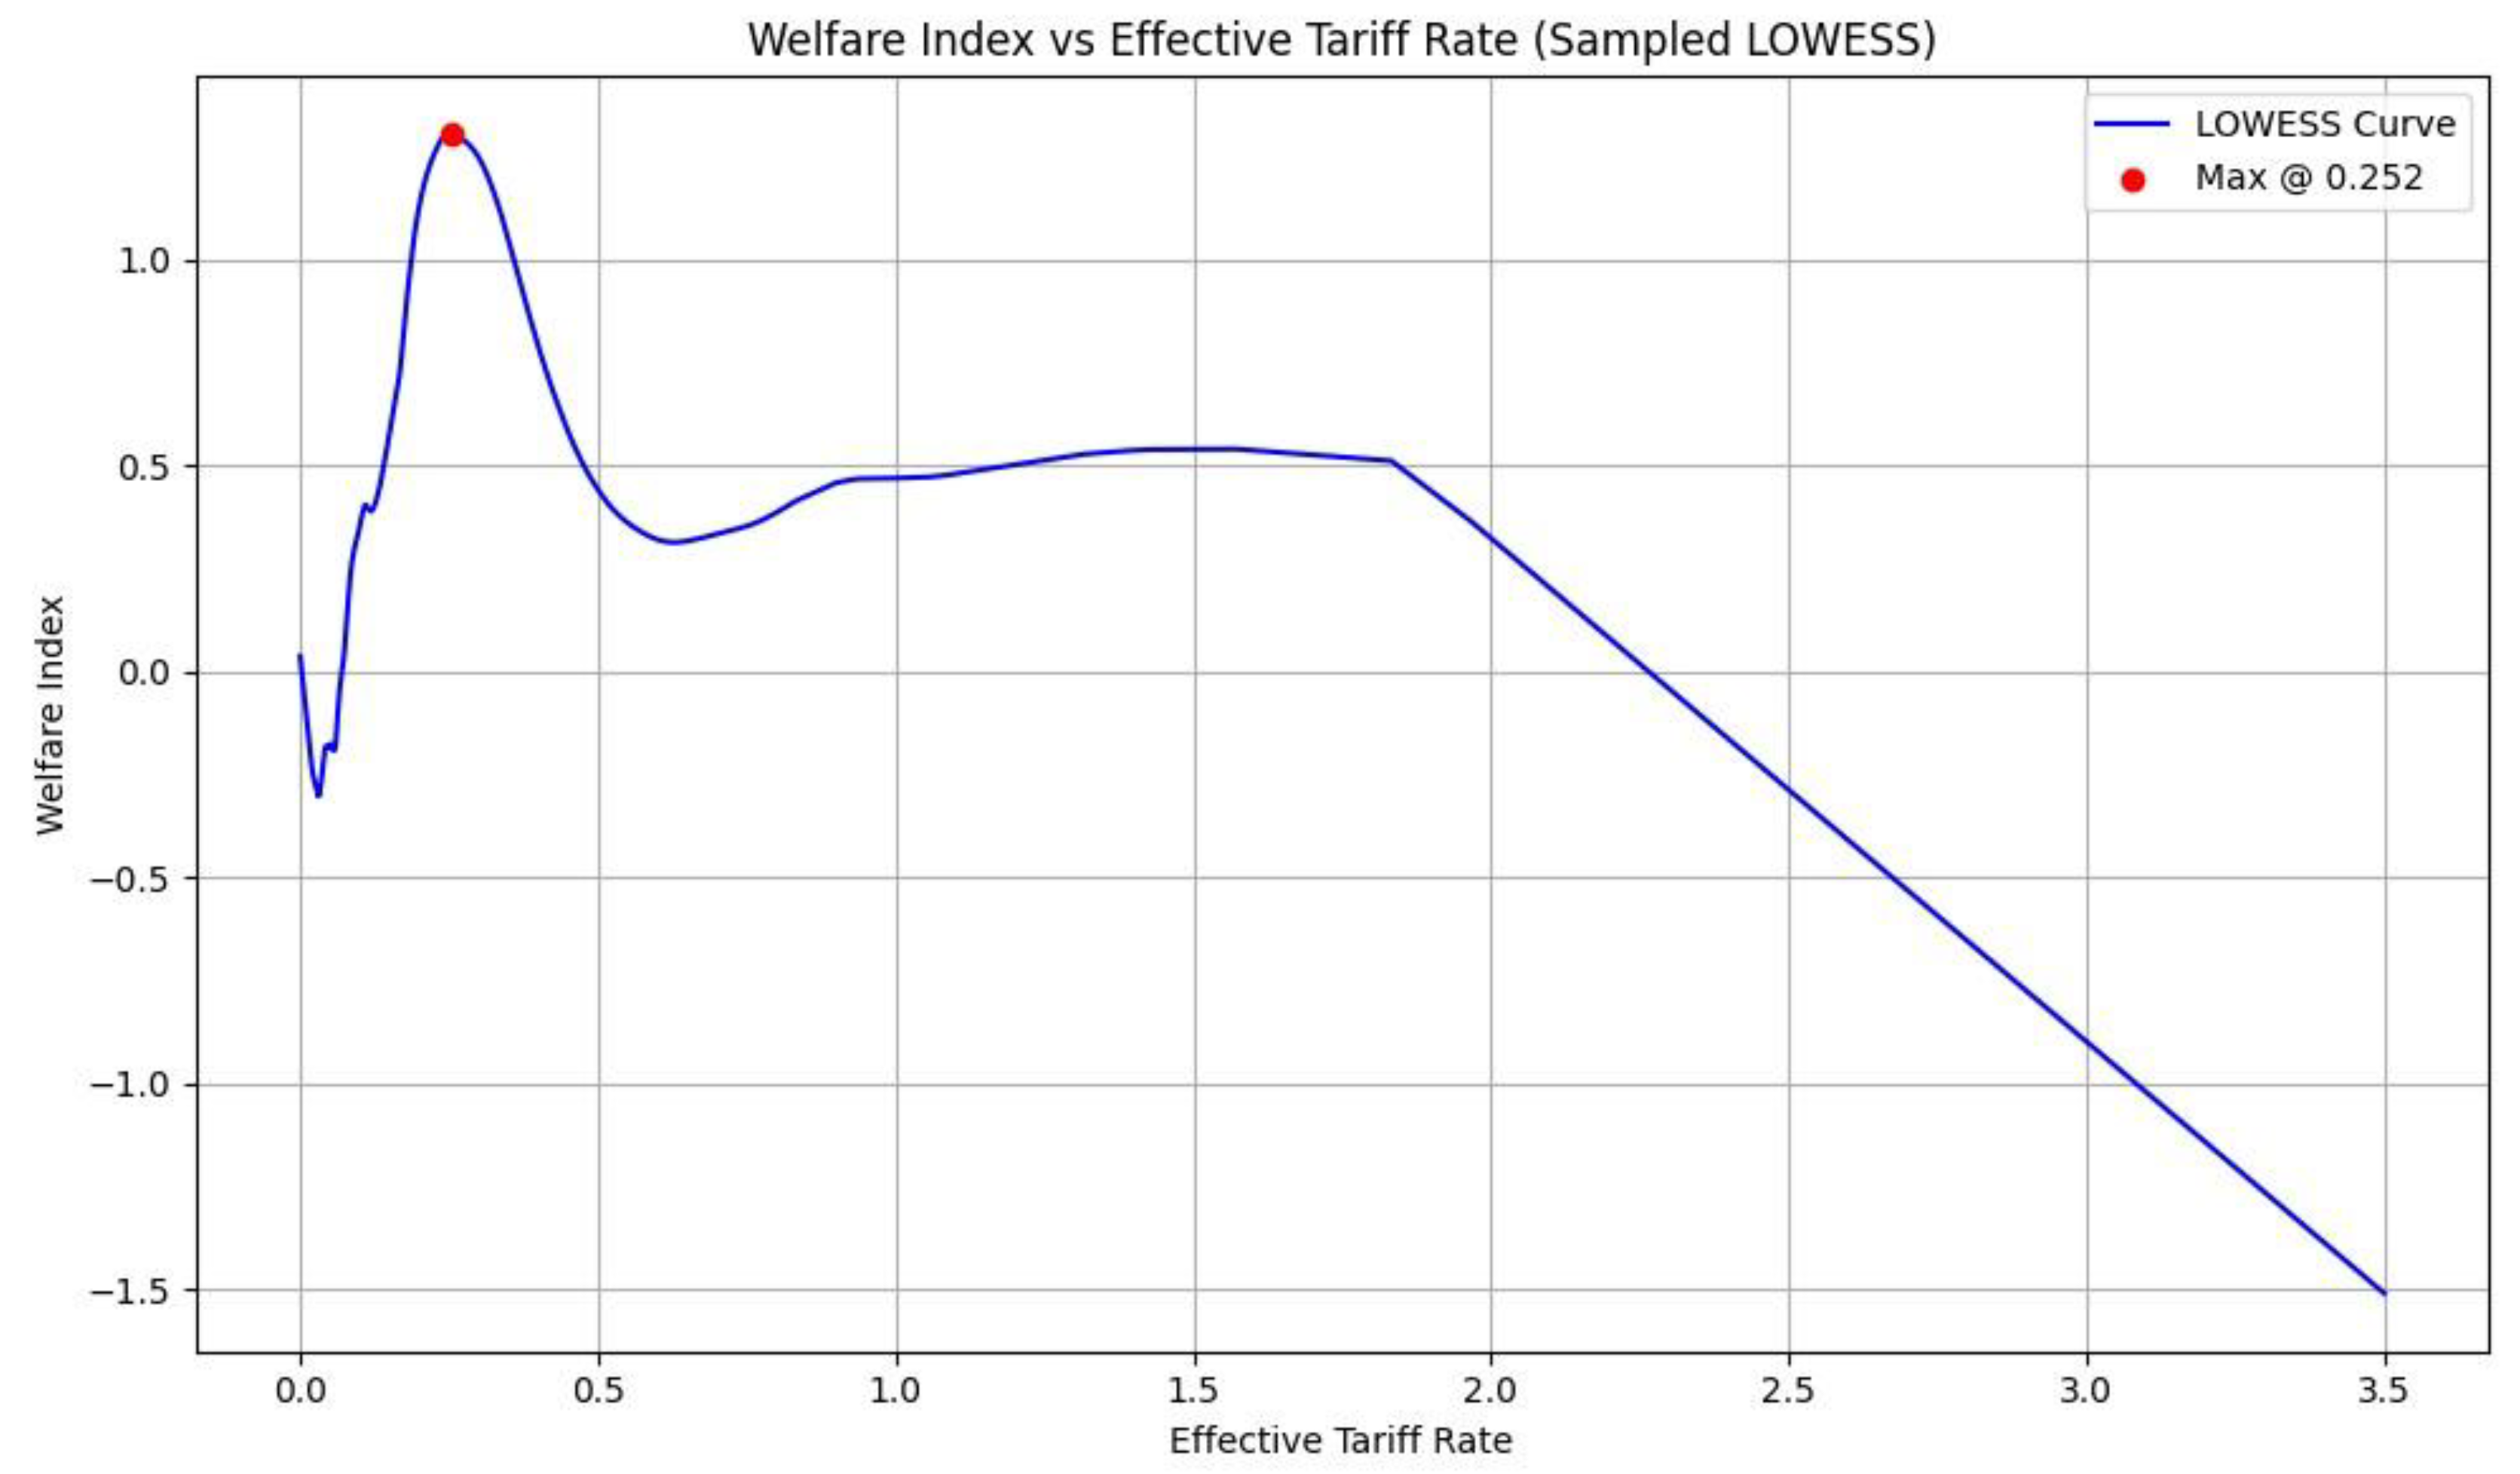
Together, these results highlight a fundamental macroeconomic trade-off: while tariffs may serve as a fiscal instrument, they appear to undermine overall economic well-being by reducing growth and elevating inflation. Importantly, the composite welfare index constructed in this study suggests that the welfare-maximizing tariff rate lies substantially below the revenue-maximizing threshold identified earlier (Figure 1). As visualized in Figure 4, the LOWESS-smoothed relationship between the effective tariff rate and the welfare index peaks at approximately 0.25, indicating that higher tariff levels beyond this point are likely to erode rather than enhance net welfare—underscoring the tension between fiscal yield and macroeconomic efficiency.
Figure 1.
Tariff Revenue vs. Effective Tax Rate: LOWESS Smoothing and Quadratic Fit.
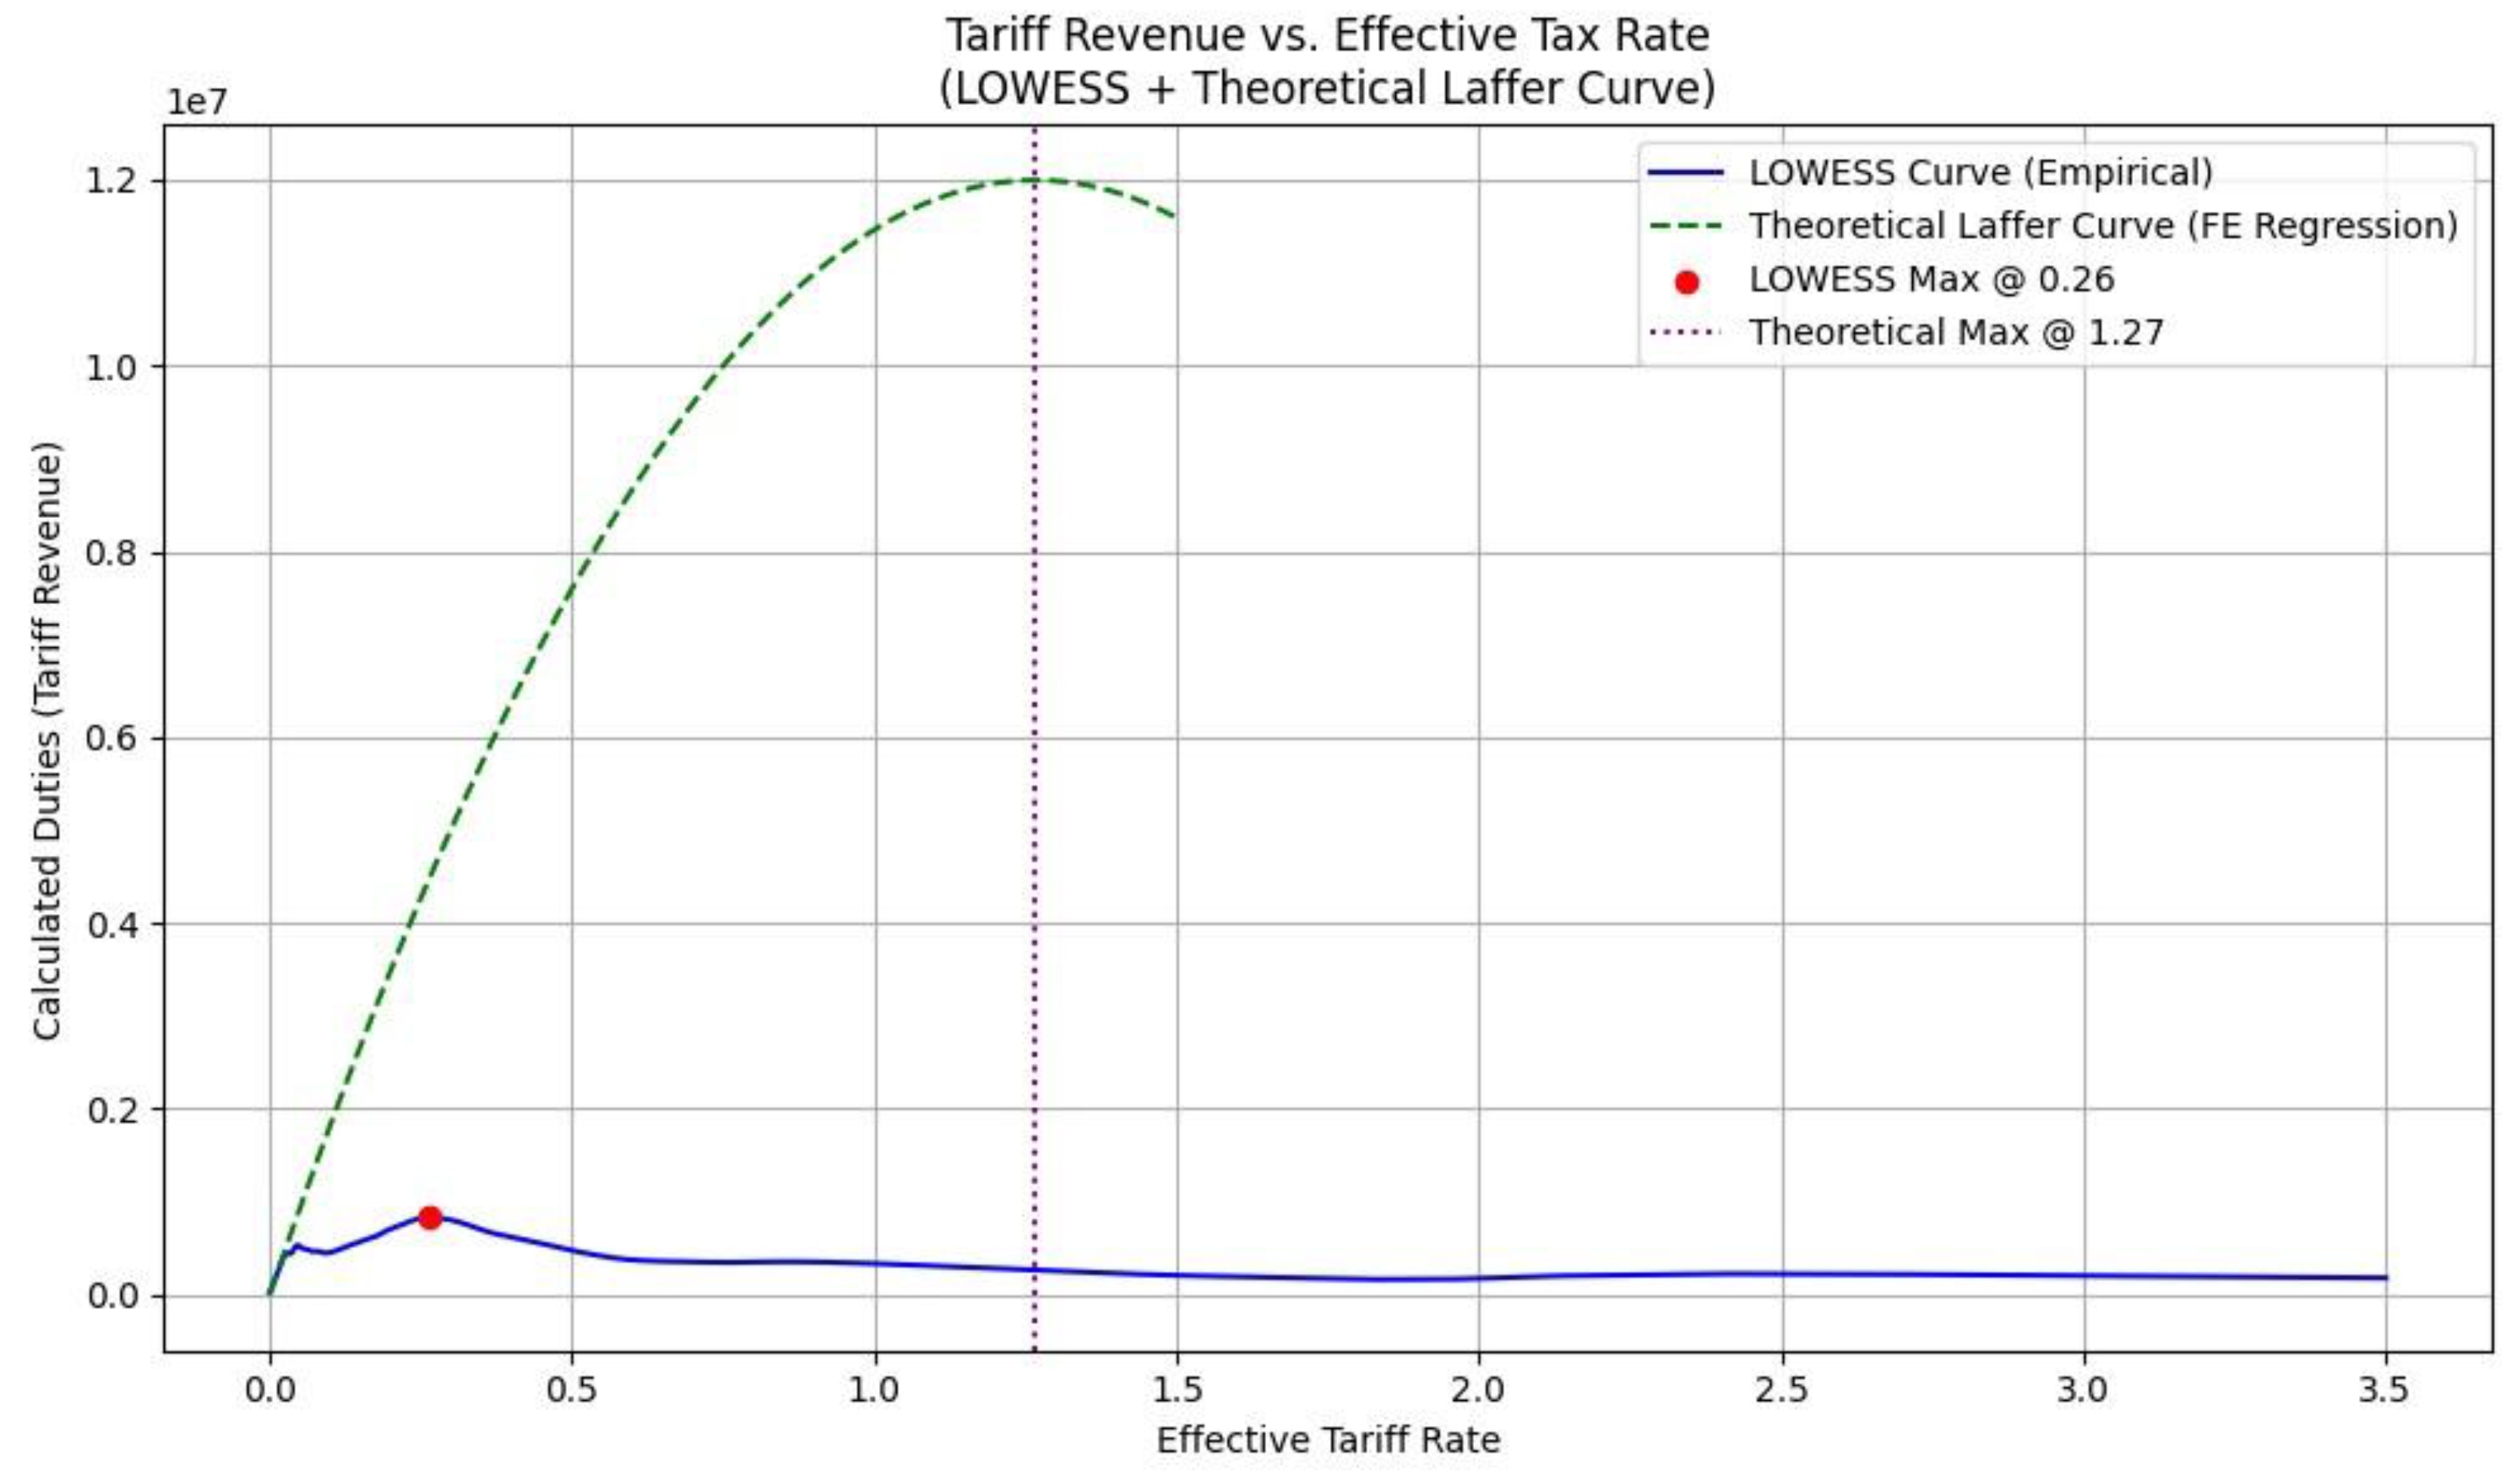

Table 3.
OLS Regression of Real GDP Growth on Tariff and Controls.
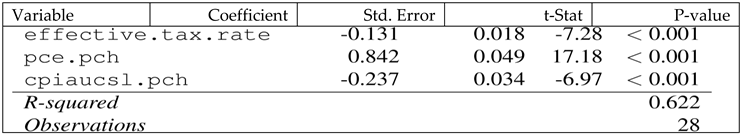 |
Table 4.
OLS Regression of CPI Inflation on Tariff and GDP.
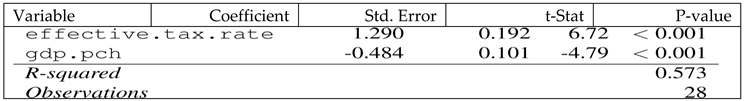 |
Figure 2.
CPI Inflation vs. Effective Tariff.
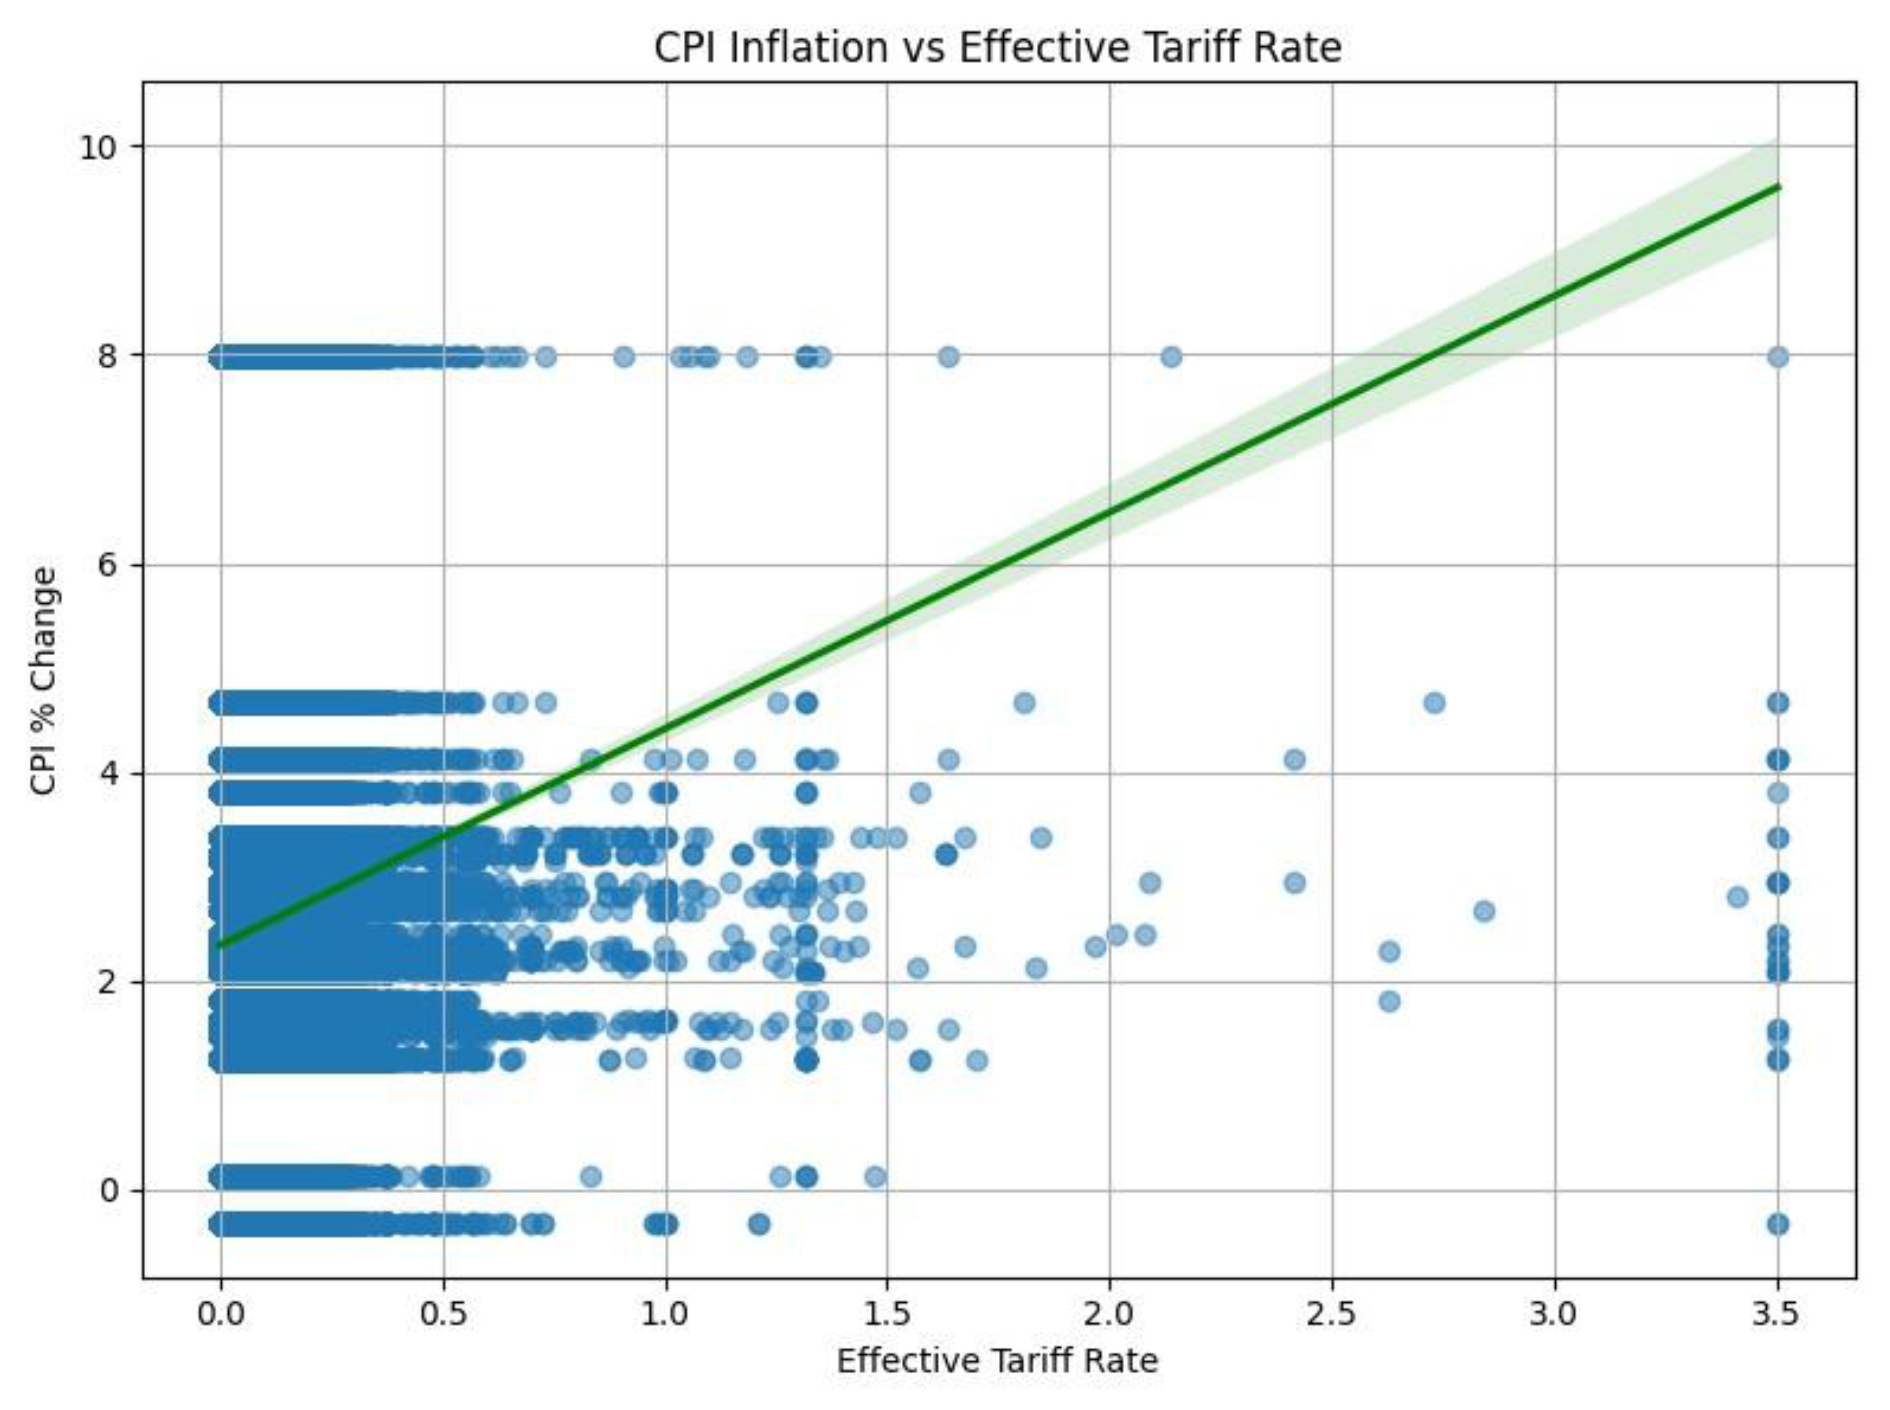
Figure 3.
Real GDP Growth vs. Effective Tariff.
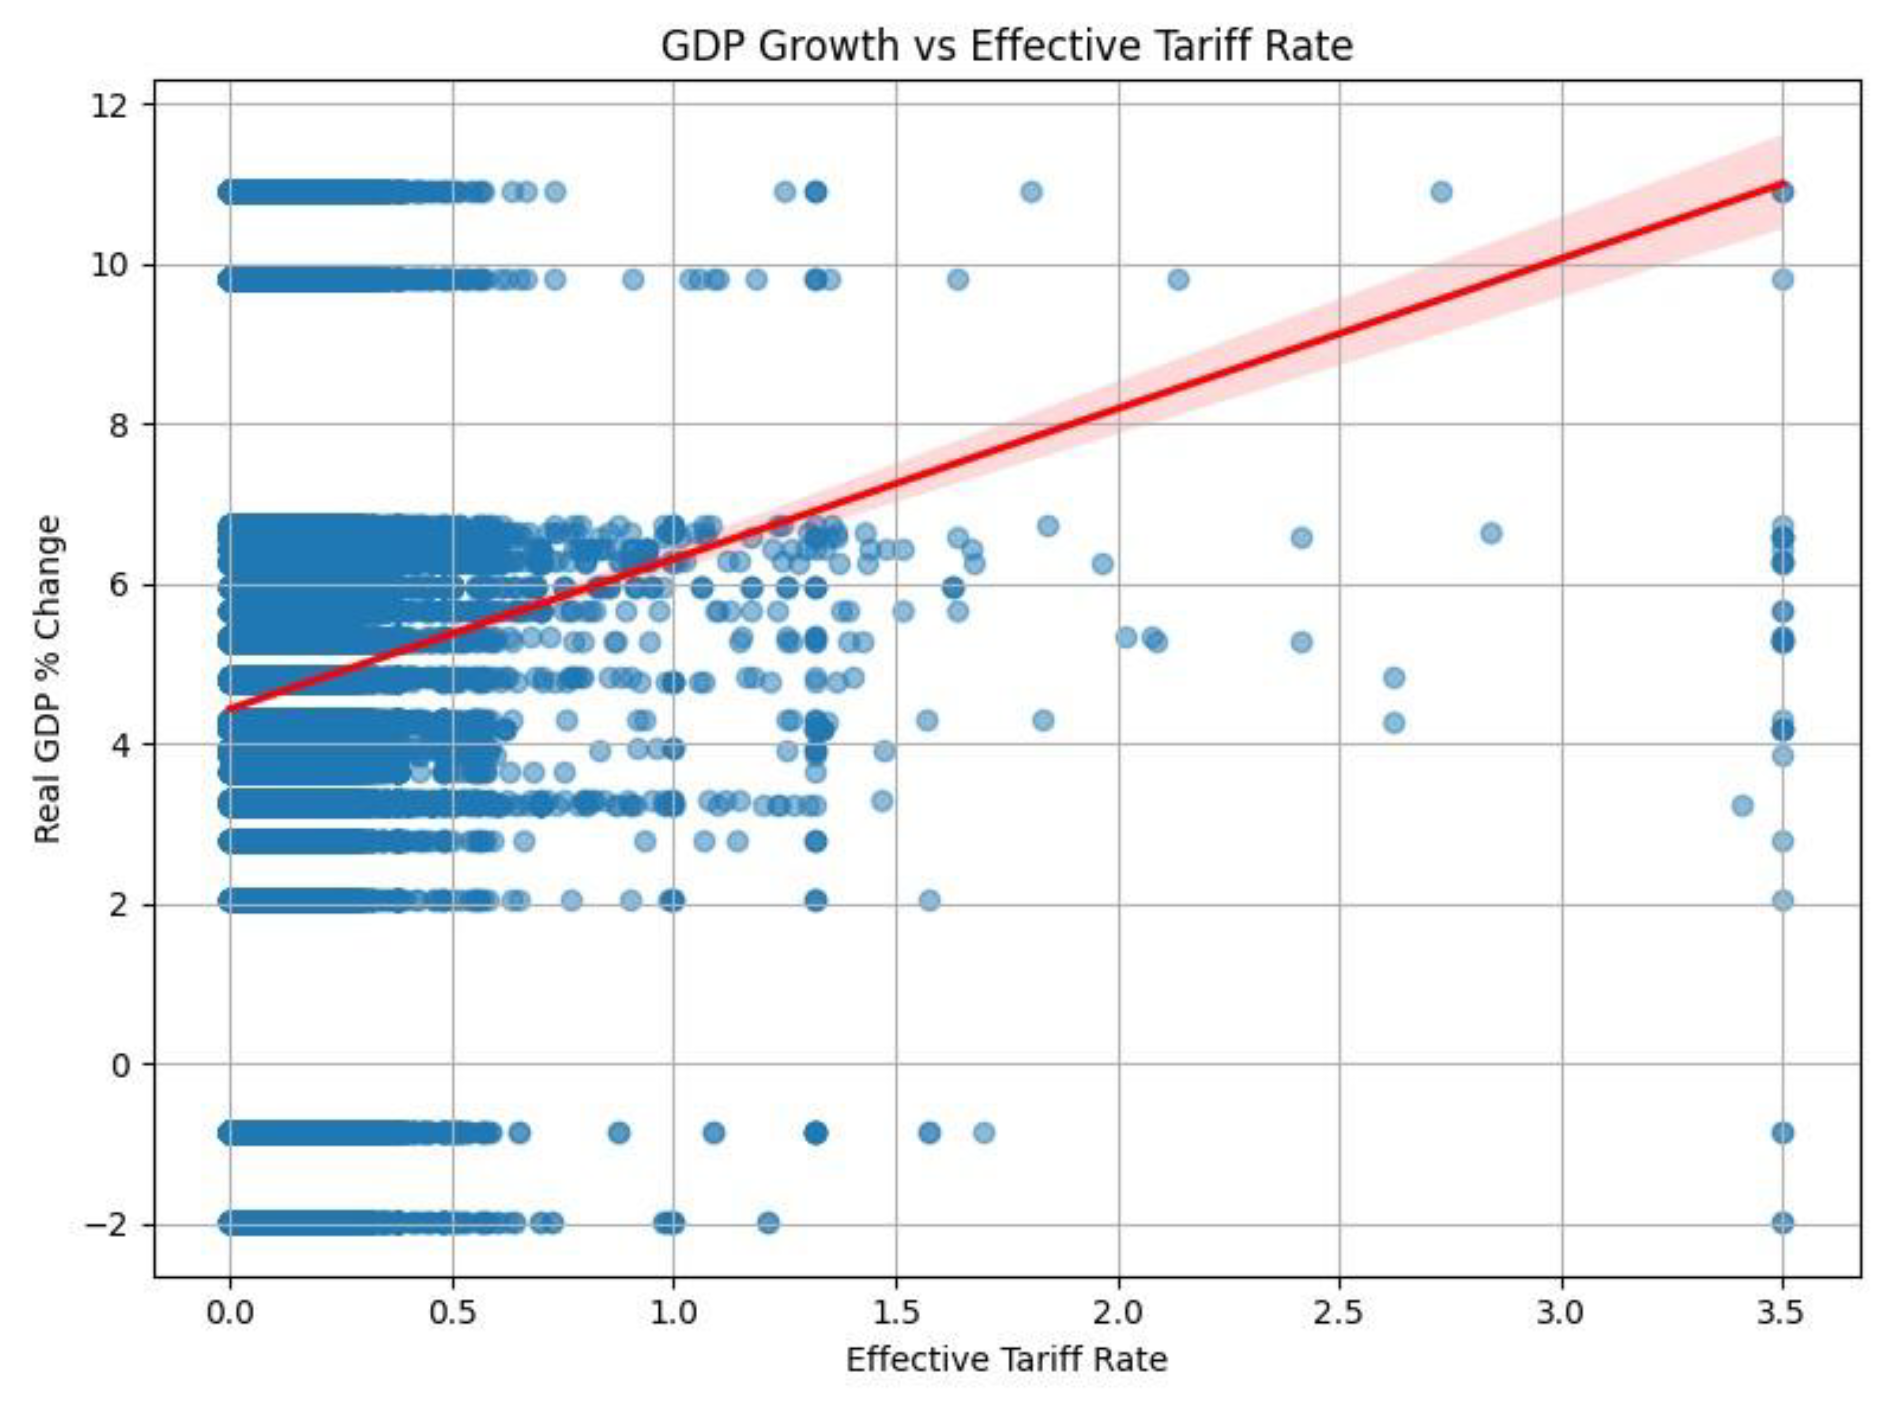
Figure 4.
Welfare Index vs. Effective Tariff Rate (LOWESS Smoothing).
4.3. Tariffs and Political Approval
To assess whether tariff policy affects public support for the federal government, we estimate two ordinary least squares (OLS) regressions linking average tariff rates to presidential approval ratings. These regressions aim to identify whether voters respond positively or negatively to changes in protectionist trade policy.
In the first model, we regress approval ratings on the contemporaneous average effective tariff rate. As shown in Table 5, the coefficient on avgtariff is negative and marginally significant (β = −124.716, p = 0.083), suggesting that higher tariffs may be associated with lower public approval. The R2 value of 0.111 indicates modest explanatory power, but the direction and magnitude of the effect are politically meaningful: a 1-point increase in average effective tariff is associated with an estimated 125-point decline in approval—although such changes in average tariffs are rare in practice.
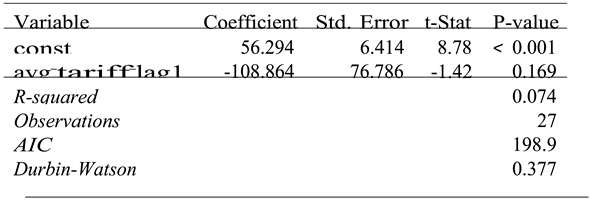
To explore potential lagged effects, we estimate a second model using the one-period lag of average tariff rate as the key explanatory variable. Results are presented in Table 6. The coefficient on avgtarifflag1 remains negative but is not statistically significant at conventional levels (β = −108.864, p = 0.169). The lower R2 and statistical insignificance in this model suggest that any potential public backlash to tariffs may be more immediate than delayed.
Taken together, these findings imply that tariff hikes may slightly reduce government approval in the short term, though the effect is not robustly significant across specifications. This raises important questions about the political calculus of protectionist policies: while tariffs may appeal to certain constituencies or industries, they could incur reputational costs at the national level, especially in times of macroeconomic instability.
Figure 5.
Yearly Trends in Average Effective Tariff Rate and Government Approval Rate (1997–2024).
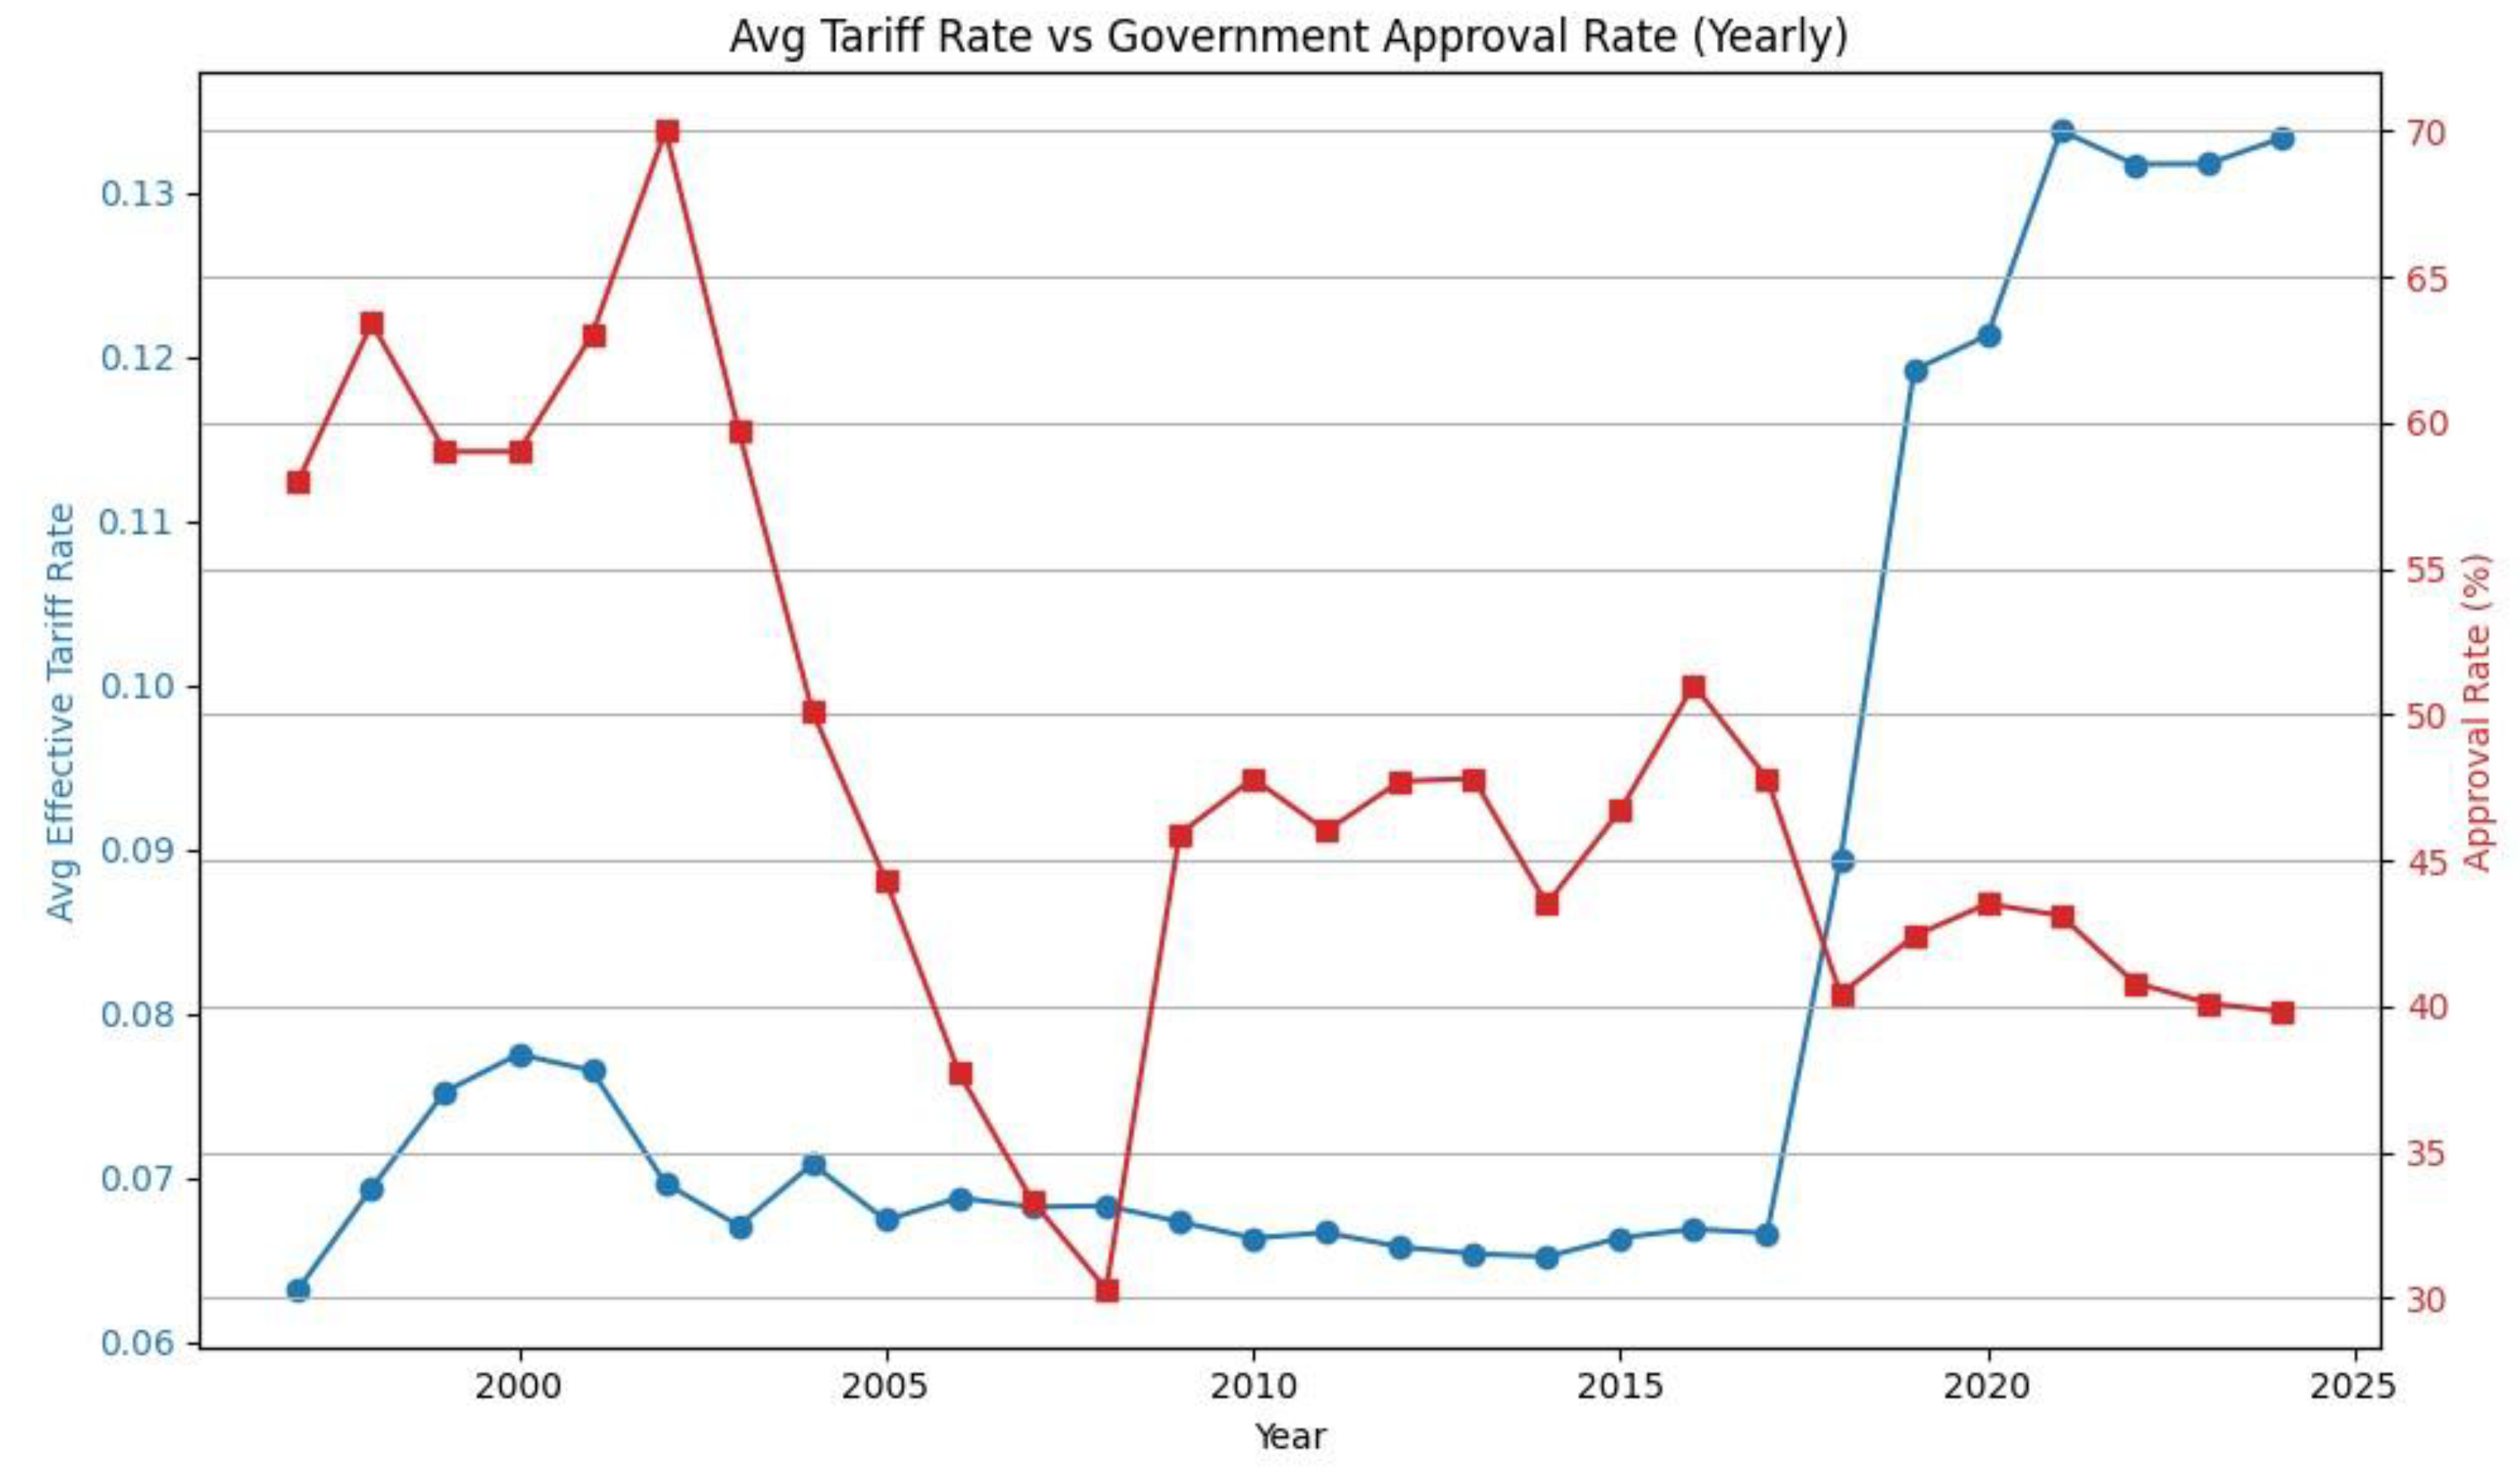
Table 5.
OLS Regression: Approval Rate ∼ Current Avg Tariff.
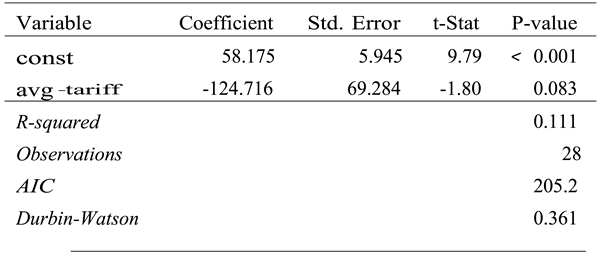 |
Table 6.
OLS Regression: Approval Rate ∼ Lagged Avg Tariff.
 |
4.4. Sectoral Heterogeneity in Tariff Responses
To examine how the effects of tariff policy vary across economic sectors, we conduct a disaggregated LOWESS analysis across 25 HS2-level industries. Figure 6 displays smoothed nonparametric relationships between effective tariff rates and six key outcome variables—CPI, PPI, import volume, tariff revenue, PCE growth, and political approval—each stratified by HS2 sector.
The patterns reveal substantial heterogeneity in both magnitude and direction of tariff effects. For example, sectors such as HS2 25 (Salt, Sulfur, Earths, Stone, Cement) and HS2 48 (Paper and Paperboard) show clear inverted-U relationships in both CPI and PPI responses, consistent with a Laffer-type tradeoff in price pressures. By contrast, sectors such as HS2 03 (Fish and Aquatic Invertebrates) display flatter curves, indicating relatively inelastic reactions to tariff changes.
Tariff revenue responses also vary widely. In some sectors, such as HS2 84 (Machinery), revenue appears to rise then plateau; in others, such as HS2 87 (Vehicles), revenue quickly declines as tariff rates rise—suggesting strong import suppression. Political feedback patterns, measured via sector-specific approval rates, show divergent trends: in a few sectors, tariffs correlate with increased approval, while in most, they are associated with erosion of political support.
These results confirm that the macroeconomic and political consequences of tariffs are not uniform across sectors. Aggregate-level estimates likely mask meaningful variation, and effective policy evaluation must account for sectoral asymmetries in both economic and political dimensions.
4.5. Sectoral, Labor, and Household Extensions
While prior sections have focused on aggregate revenue, welfare, and political effects, this section examines how tariff policy impacts labor markets, income distribution, and sector-specific macroeconomic dynamics. Using LOWESS-smoothed relationships between both effective tariff rates and MFN ad valorem rates and a set of disaggregated outcome variables, we assess how tariffs affect households and production beyond average macro-level aggregates.
Figure 7 presents a grid of 16 panels, each illustrating the relationship between tariffs and a labor or household outcome. Several key patterns emerge.
First, labor market outcomes show meaningful nonlinearity. Both the unemployment rate and the growth of real median income follow U-shaped or inverted U-shaped patterns, with optimal employment points around the effective tariff rate and 0% MFN rate, while income growth peaks at even lower levels of MFN (0.3-0.5). These results suggest that moderate tariffs may temporarily stimulate labor demand or retain jobs in protected sectors, but that such gains are not sustained at higher protection levels.
Second, income distribution indicators reveal stark asymmetries. Real median income levels peak at low-to-moderate tariffs (0.25–0.3), after which incomes fall substantially—likely due to rising prices (see CPI panels) and declining output. This suggests that tariffs may be regressive, disproportionately burdening middle- and lower-income households.
Third, household-level consumption and inflation indicators align with prior findings. CPI growth increases with tariffs under both measurement definitions, confirming the pass-through of trade costs into domestic prices. Meanwhile, PCE growth flattens or reverses at high tariffs, indicating erosion of real consumption capacity.
Finally, both real and nominal GDP growth reflect inverted-U trajectories, peaking well below the revenue-maximizing tariff rates estimated in Section 1. This confirms that output gains from tariff hikes are transitory and taper off at higher levels of trade restriction.
Taken together, these results demonstrate that the impact of tariffs varies significantly across labor, household, and sectoral dimensions. While modest protection may offer narrow short-term gains, tariffs above moderate thresholds appear to reduce purchasing power, exacerbate inflation, suppress median incomes, and hinder job creation. These distributional and labor market costs reinforce the broader conclusion that tariffs are not a neutral fiscal tool—but one with clear regressive and anti-growth tendencies at elevated levels.
5. Discussion
This study set out to empirically assess the trade-offs embedded in tariff policy across three key policy objectives: maximizing fiscal revenue, promoting macroeconomic welfare, and bolstering public political support. The findings presented in Sections ?? through ?? indicate that these objectives are not only non-aligned, but often structurally conflicting—particularly when disaggregated across industries, labor markets, and households.
Fiscal Revenue vs. Economic Efficiency
The quadratic and nonparametric analyses confirm that a revenue-maximizing effective tariff rate exists, estimated between 0.26 and 1.27, depending on the estimation method. However, this “fiscal optimum” does not coincide with the welfare-maximizing rate, which peaks around 0.25 based on a composite welfare index and GDP/inflation regressions. Beyond this threshold, higher tariffs systematically reduce GDP growth, elevate CPI inflation, and constrain household consumption growth (see Figures ??–7).
This divergence illustrates a fundamental fiscal-efficiency trade-off: while tariffs may raise public revenue in the short term, they do so at the cost of macroeconomic performance, especially for growth-sensitive and price-sensitive sectors.
Distributional and Labor Market Implications
The expanded analysis in Section ?? highlights that tariffs are not distribution-neutral. The impact of trade policy varies substantially by income group and employment status. For example:
- Unemployment rates decline modestly at low tariff levels, but rise beyond 3% effective tariff rate.
- Real median income levels and income growth peak at tariffs around 0.25–0.30 and decline sharply thereafter, suggesting regressive effects.
- Personal consumption expenditure (PCE) growth stagnates at higher tariffs, underscoring real consumption constraints.
These results suggest that tariff-based protectionism disproportionately harms middle- and lower-income groups, especially in inflationary contexts. In effect, tariffs behave as a regressive indirect tax, amplifying inequality while reducing aggregate demand.
Political Feedback: Symbolic but Costly
Despite their visibility, tariffs do not appear to generate consistent political benefits. As shown in Section ??, neither contemporaneous nor lagged tariff rates significantly increase presidential approval. While certain sectors may benefit politically, aggregate backlash or dissatisfaction appears more likely—particularly when rising prices or declining incomes are involved.
The Trilemma Revisited
Taken together, these results reinforce a central tariff policy trilemma:
A tariff rate that maximizes revenue tends to erode macroeconomic welfare; a tariff that protects welfare yields limited fiscal gain; neither configuration seems to enhance political approval in the aggregate.
Moreover, the inclusion of sectoral and household-level effects further complicates the picture: policy trade-offs are not symmetric across groups. Some industries or regions may benefit, while others are disproportionately harmed—raising further questions about equity, compensation, and legitimacy.
In short, tariff policy is a blunt and redistributive instrument. Its effects are real, but often diffuse, delayed, and regressive. While politically salient, tariffs should not be mistaken for costless or universally beneficial tools. As the data suggest, their trade-offs are sharp, structural, and ultimately inescapable.
6. Conclusion
This paper investigates the multifaceted effects of tariff policy in the United States between 1997 and 2024, using a unified empirical framework that links effective tariff rates to three distinct policy dimensions: fiscal revenue, macroeconomic welfare, and political support. Leveraging product-level (HTS8) tariff data, macroeconomic indicators from FRED, and national approval survey data, we analyze both parametric and nonparametric relationships across these domains.
The results show that while a revenue-maximizing tariff rate exists—ranging from approximately 0.26 (nonparametric) to 1.27 (quadratic regression)—this rate is significantly higher than the welfare-maximizing tariff, which lies closer to 0.25. Beyond this point, tariffs systematically suppress GDP growth, raise consumer prices, and reduce household consumption. Further analysis reveals that high tariffs are particularly regressive: they decrease real median income, constrain income growth, and widen distributional inequality.
Moreover, the political effects of tariff changes are weakly negative. Regressions using approval data show that neither contemporaneous nor lagged average tariff rates are associated with statistically significant improvements in public support. In fact, tariffs may erode political capital when their inflationary and welfare consequences become salient.
Taken together, these findings highlight a fundamental tariff policy trilemma:
A tariff rate that maximizes government revenue undermines economic welfare; a rate that supports welfare generates limited revenue; neither configuration reliably increases public approval.
Policy Implications
Given this trilemma, policymakers should avoid relying on across-the-board tariffs as a solution to complex fiscal or political problems. Instead:
- Tariff policy should be limited to targeted, temporary, and well-justified interventions (e.g., anti-dumping cases).
- Any protectionist measure should be paired with redistributive tools—such as transfers or tax credits—to offset regressivity.
- Broader fiscal goals should be addressed through comprehensive tax reform, not trade taxes.
- Long-run industrial policy objectives are better served by investment in competitiveness, not tariff walls.
Future Research Directions
This paper opens the door to several lines of future inquiry:
- Non-tariff barriers: Extend the framework to cover quotas, subsidies, and anti-dumping duties.
- Dynamic political feedback: Model time-varying effects of trade policy on approval using panel data and structural estimators.
- Cross-country comparisons: Replicate this analysis for other economies (e.g., China, EU, developing countries) to assess external validity.
- Household-level effects: Combine tariff data with household expenditure and wage microdata to analyze inequality channels more precisely.
In sum, while tariffs may serve symbolic or sectoral roles, their economy-wide consequences are clear, measurable, and often adverse. Policymakers should wield them cautiously—and only with full awareness of their structural trade-offs.
References
- Amador, M.; Bagwell, K. Tariff revenue and tariff caps. American Economic Review 2012. [CrossRef]
- Balassa, B. Tariff protection in industrial countries: An evaluation [Reprinted in 2015 edition]. Journal of Political Economy 1965, 73, 573–594. [Google Scholar] [CrossRef]
- Bhagwati, J.N. Directly unproductive, profit-seeking (dup) activities. Journal of Political Economy 1982, 90, 988–1002. [Google Scholar] [CrossRef]
- Brock, W.A.; Magee, S.P. The economics of special interest politics: The case of the tariff. American Economic Review 1978.
- Cleveland, W.S. Robust locally weighted regression and smoothing scatterplots. Journal of the American Statistical Association 1979, 74, 829–836. [Google Scholar] [CrossRef]
- Evenett, S.J.; Muendler, M.-A. (2025). Tariffs cannot fund the government: Evidence from tariff laffer curves. CEPR Discussion Paper.
- Federal Reserve Bank of St. Louis. (2025). Federal reserve economic data (fred) [Accessed: 202506-15].
- Gardner, G.W.; Kimbrough, K.P. The behavior of u.s. tariff rates. Journal of International Economics 1989.
- Hatta, T. A recommendation for a better piecemeal policy. Review of Economic Studies 1977, 44, 437–442. [Google Scholar] [CrossRef]
- Inc., G. (2025). Presidential approval ratings [Accessed: 2025-06-15].
- Irwin, D.A. (2008). Taxation and the political economy of the tariff. World Economy.
- Levy, P.I. (2001). Constitutional tariffs and incidental protection. Public Choice.
- Pew Research Center. (2024). Public trust in government: 1958–2024 [Accessed: 2025-06-15].
- Ray, E.J. The determinants of tariff and nontariff trade restrictions in the united states. Journal of Political Economy 2015. [CrossRef]
- Srinivasan, T.N.; Bhagwati, J. Revenue-seeking: A generalization of the theory of tariffs. Journal of Political Economy 2015.
- Stern, R.M. The effects of united states tariff structure on the efficiency of resource allocation. Review of Economics and Statistics 1964.
- Trefler, D. The political economy of the tariff cycle. American Economic Review 1993.
- U.S. International Trade Commission. (2025). Dataweb tariff data portal [Accessed: 2025-06-15].
Figure 6.
Sector-Level LOWESS Analysis: Tariff Effects by HS2 Category (CPI, PPI, Revenue, Approval).
Figure 6.
Sector-Level LOWESS Analysis: Tariff Effects by HS2 Category (CPI, PPI, Revenue, Approval).
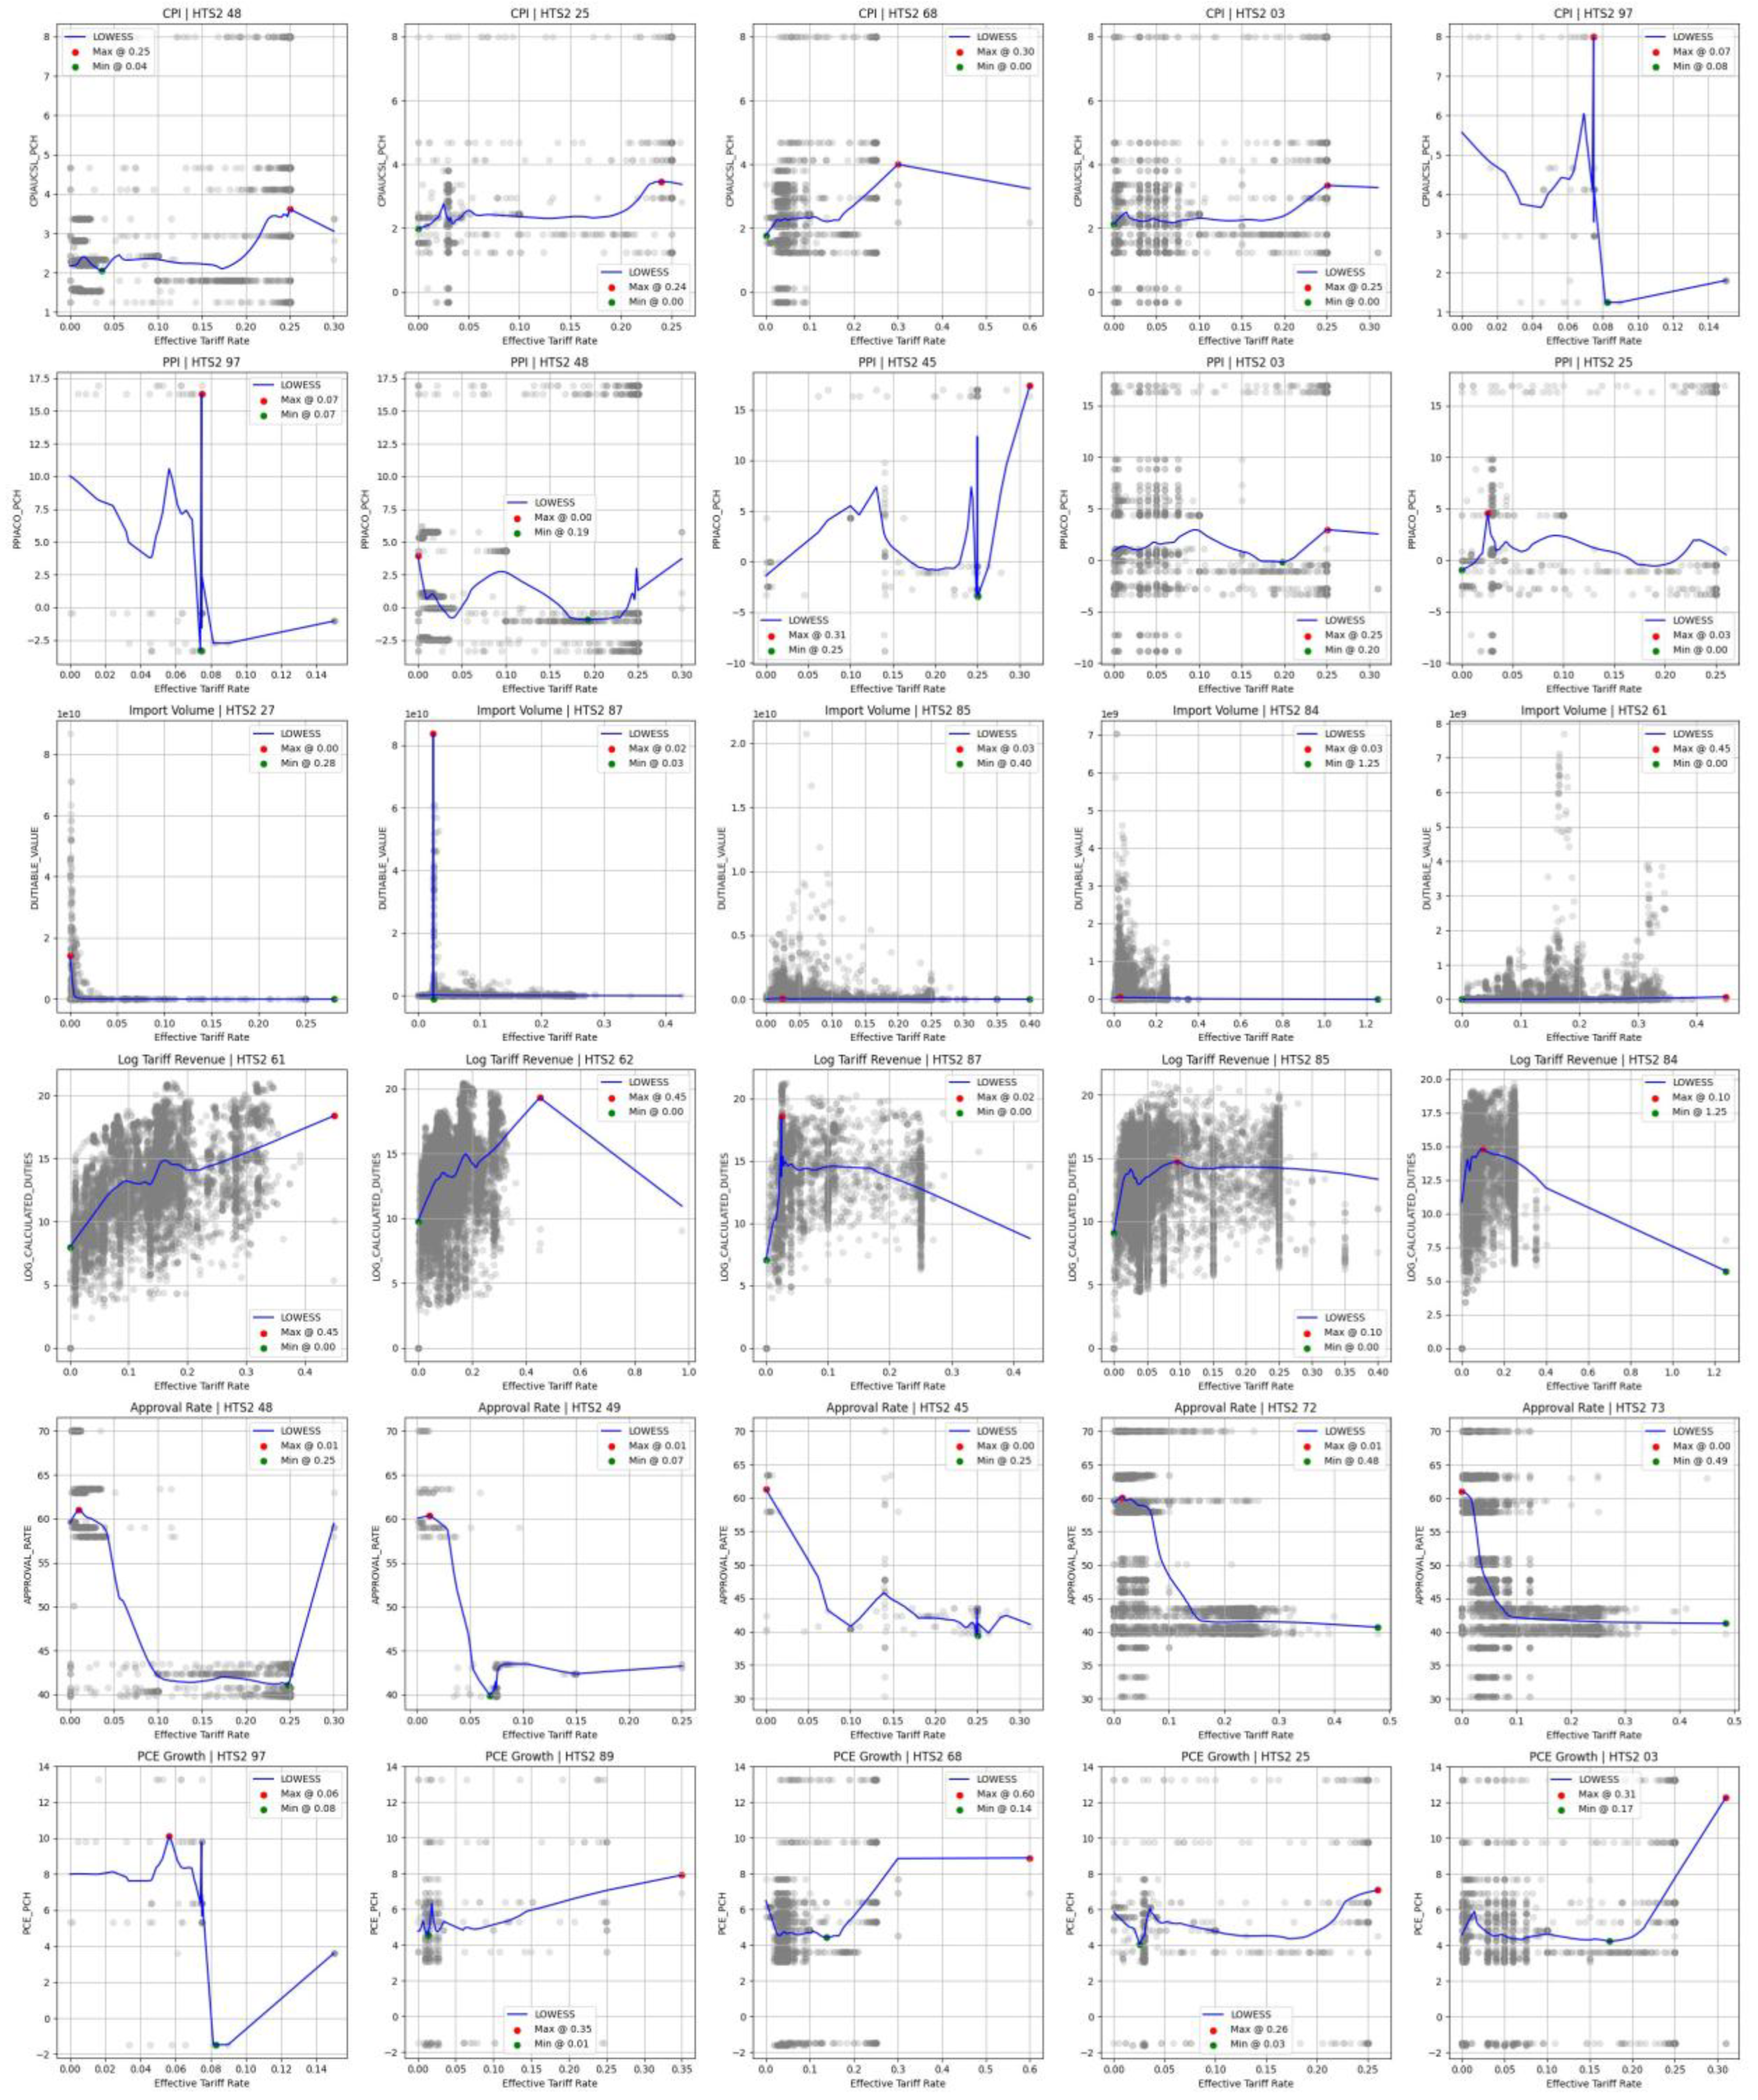
Figure 7.
Labor and Household Responses to Tariff Rates (LOWESS-Smooth, Effective and MFN).
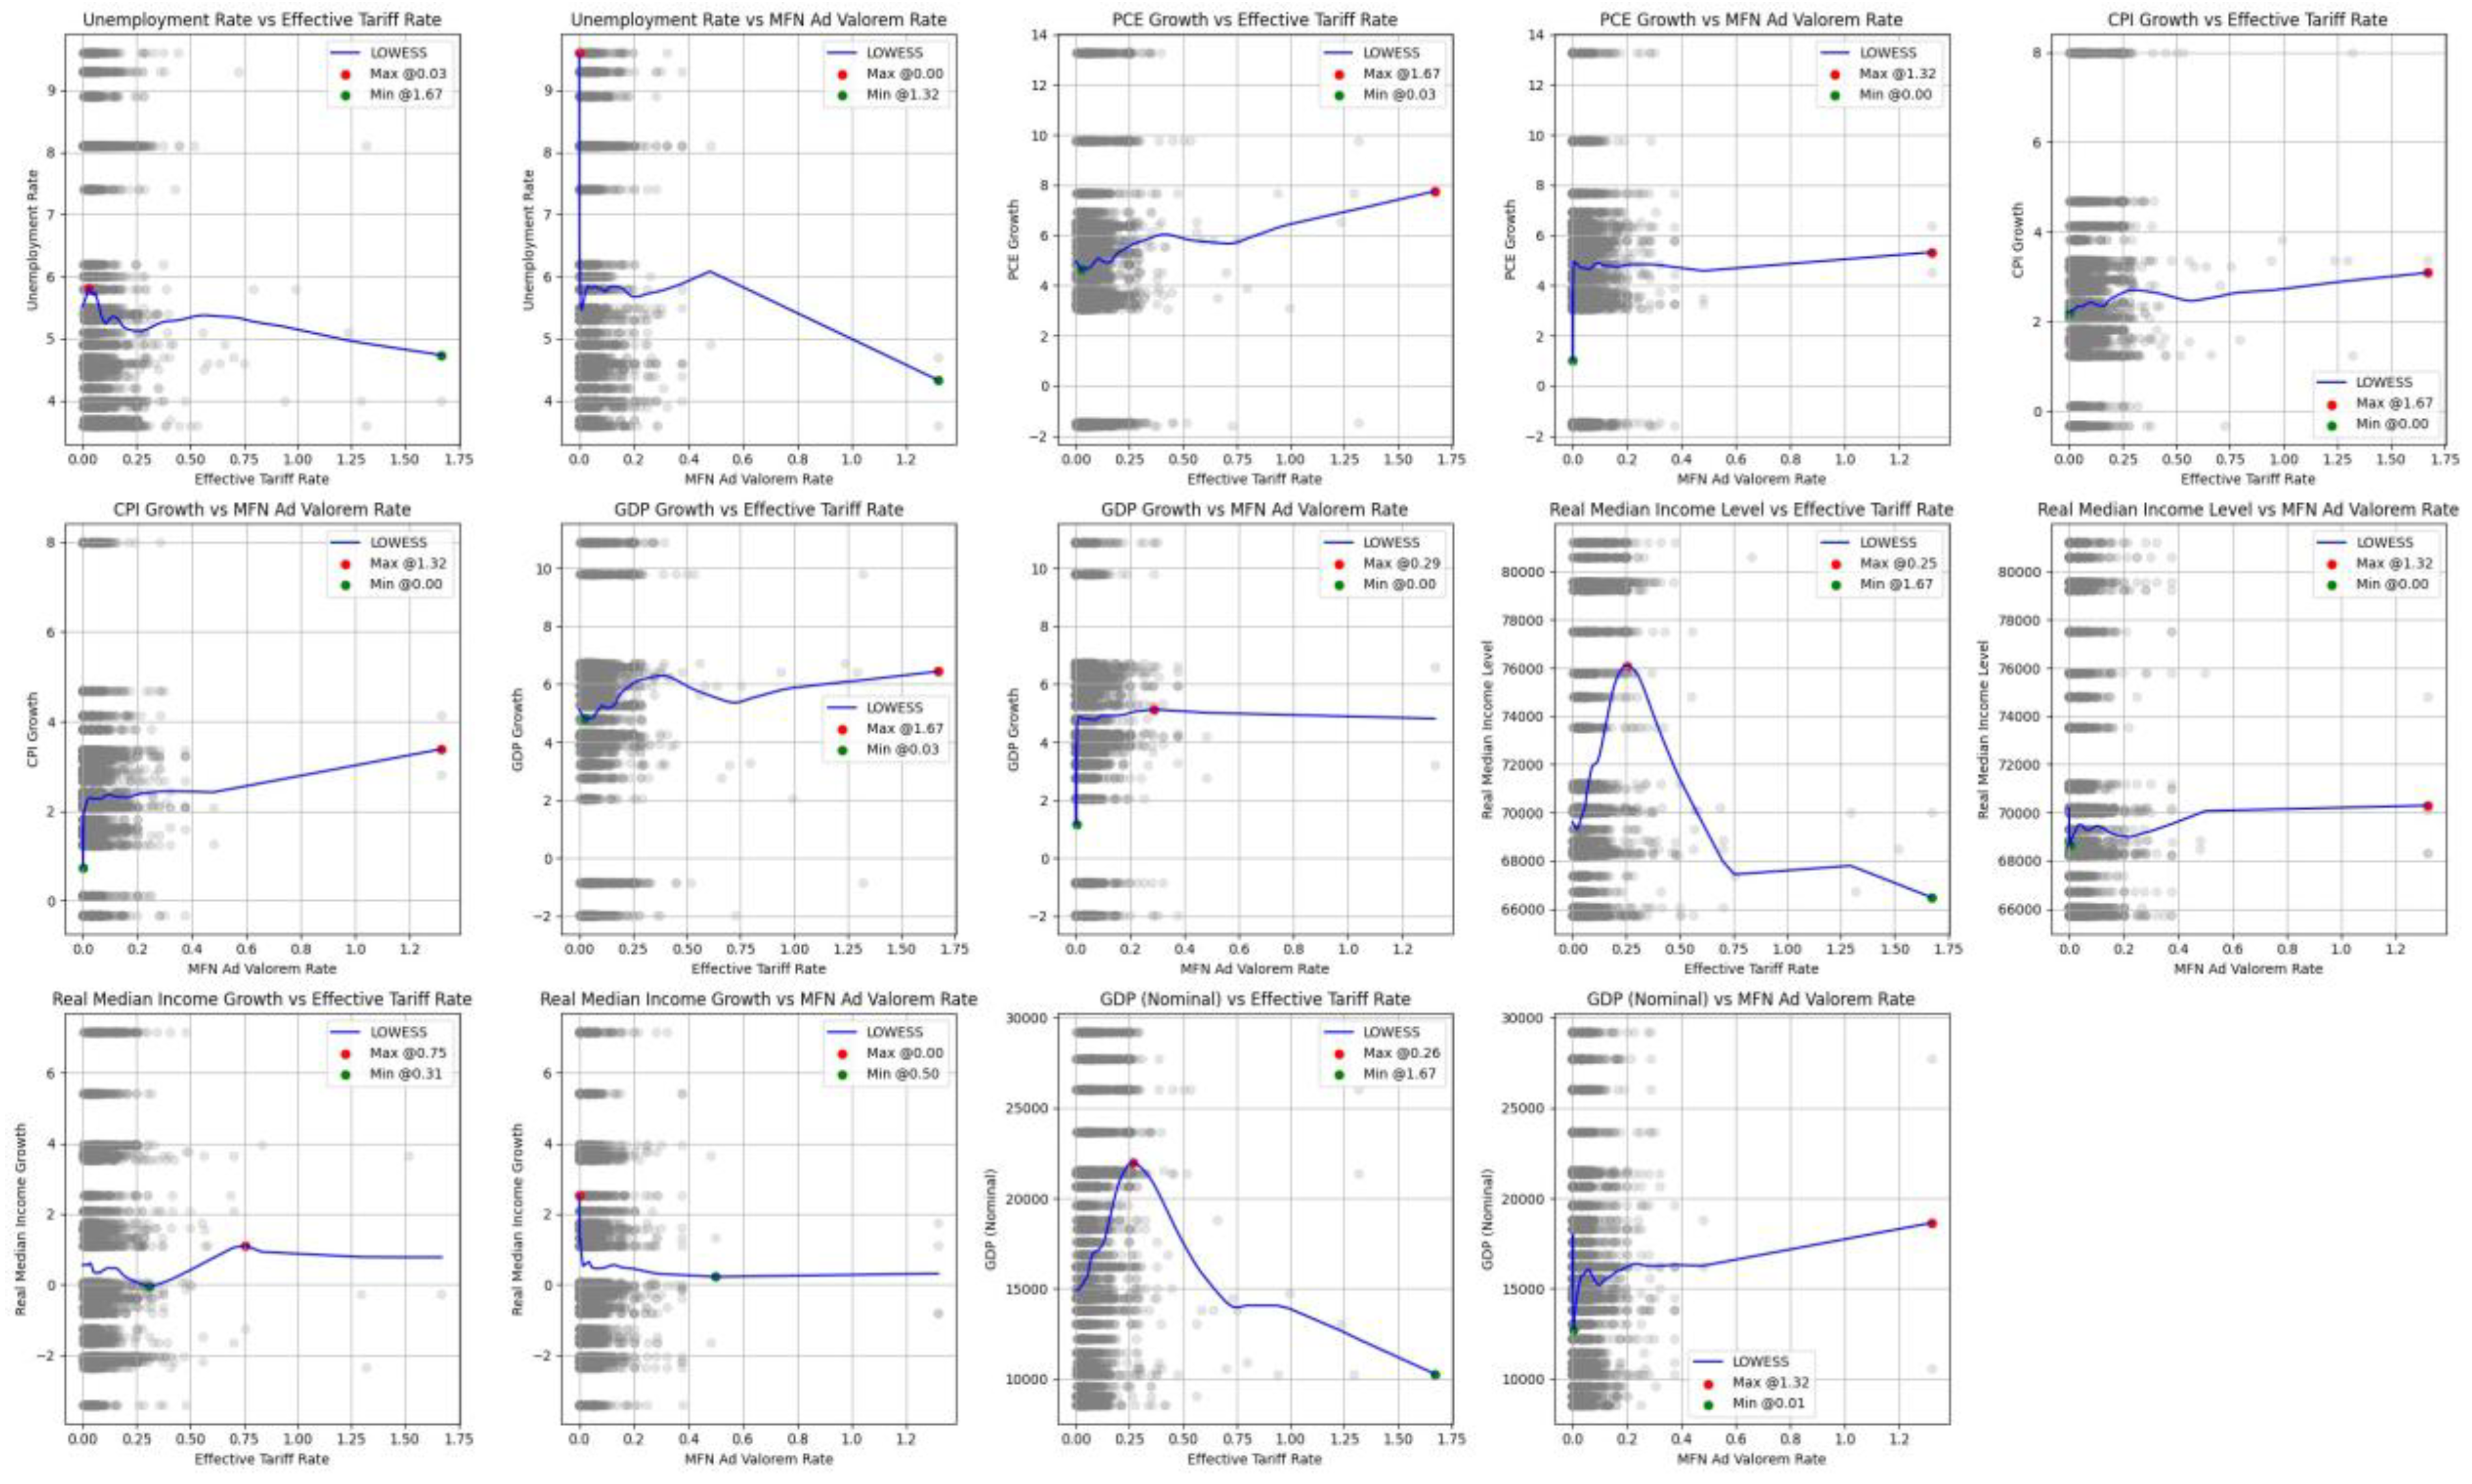
Table 1.
Key Variables Used in Empirical Analysis.
| Category | Variable Names | Explanation |
| Tariff | effectivetaxrate, mfnadvalrate | Effective and nominal MFN tariff rates (HTS8 level) |
| Revenue | Calculated Duties | Actual government tariff revenue collected |
| Welfare | GDPPCH, PCEPCH, CPIAUCSLPCH |
Indicators of macroeconomic welfare (growth and inflation) |
| Trust | Average Approval (%), Confidence to Gov |
Political support metrics from Gallup, GSS, Pew |
Table 2.
Quadratic Panel Regression of Tariff Revenue.
| Variable | Coefficient | Std. Error | t-Statistic | P-value |
| effectivetaxrate | 1.893e+07 | 7.724e+05 | 24.504 | 0.0000 |
| effectivetaxratesq | -7.466e+06 | 4.693e+05 | -15.909 | 0.0000 |
Disclaimer/Publisher’s Note: The statements, opinions and data contained in all publications are solely those of the individual author(s) and contributor(s) and not of MDPI and/or the editor(s). MDPI and/or the editor(s) disclaim responsibility for any injury to people or property resulting from any ideas, methods, instructions or products referred to in the content. |
© 2025 by the author. Licensee MDPI, Basel, Switzerland. This article is an open access article distributed under the terms and conditions of the Creative Commons Attribution (CC BY) license (http://creativecommons.org/licenses/by/4.0/).
Copyright: This open access article is published under a Creative Commons CC BY 4.0 license, which permit the free download, distribution, and reuse, provided that the author and preprint are cited in any reuse.


