Submitted:
16 June 2025
Posted:
17 June 2025
You are already at the latest version
Abstract
In order to improve the energy recovery efficiency during braking of electric vehicles, a high-frequency energy recovery system efficiency optimization algorithm based on GaN power module is constructed, and its electro-thermal coupling characteristics are analyzed through modeling, a three-dimensional efficiency response model of frequency-temperature-current is established, and a state-space predictive control and particle swarm optimization (PSO) fusion strategy is introduced to realize the dynamic adjustment of control parameters. The experimental data show that under the condition of 750kHz and 6A/cm², the conversion efficiency of GaN module is 89.5%; under the MPC-PSO control strategy, the system efficiency is increased to 90.3%, and the thermal loss is reduced to 23.7W; the on-resistance rises from 35mΩ to 80mΩ, which causes the efficiency to decrease by 2.9%. Comprehensive modeling, control and experimental verification show that the synergistic scheduling of GaN device performance and optimized control strategy can effectively improve the operational stability and energy utilization of the system under complex thermoelectric conditions.
Keywords:
gaN power modules
; energy recovery efficiency
; state space modeling
; MPC-PSO control
1. Introduction
With the rapid development of the new energy vehicle industry, braking energy recovery technology plays a key role in improving vehicle energy efficiency, extending driving range, and reducing energy consumption. Traditional silicon-based power devices face conversion efficiency bottlenecks under high-frequency and high-temperature conditions, making it difficult to meet the performance demands of modern electric vehicles. Gallium nitride (GaN) power modules, with their excellent switching characteristics and thermal stability, provide new technological support for high-frequency and low-loss recovery systems. Armenta-Déu and Cortés (2023) analyzed the architecture and performance characteristics of kinetic energy recovery systems in electric vehicles, highlighting the trade-offs between mechanical braking and electrical recovery efficiency . Wang and Zheng (2025) reviewed coordinated control strategies for compound braking systems, indicating that control precision is crucial in maximizing regenerative efficiency . Zheng et al. (2025) further proposed a composite braking control strategy under variable adhesion coefficients, which effectively integrates road conditions into the recovery control process . Luo et al. (2025) investigated the performance of thermal management systems in electric vehicles, emphasizing the importance of thermal coupling effects in power device operation . Nagy and Török (2025) compared simulation-based and regression-based methods in estimating EV power consumption, suggesting that powertrain modeling significantly influences energy prediction accuracy . Therefore, modeling energy recovery behavior based on GaN device characteristics and optimizing control strategies have become essential directions for upgrading the next-generation electric vehicle energy management systems.
2. Basic Principles of Electric Vehicle Energy Recovery System
The core principle of the electric vehicle energy recovery system is to convert the kinetic energy of the vehicle into electrical energy through the braking process and store it in the battery for subsequent use. The system utilizes the reverse mode of operation of the electric motor to convert the kinetic energy generated during vehicle deceleration into electrical energy, which is converted into DC power suitable for battery charging through an inverter. In order to improve the energy recovery efficiency, the design of the system needs to take into account the conversion efficiency of the power electronics, the energy storage capacity, and the optimization of the control strategy. In addition, the use of GaN power modules can effectively improve the switching frequency and energy conversion efficiency of the system, thus improving the overall energy recovery efficiency and reducing heat loss.
3. GaN Power Module Energy Recovery System Model Design
3.1. Basic Structure of Electric Vehicle Energy Recovery System
The electric vehicle energy recovery system is based on the mechanism of kinetic energy electrical conversion during vehicle braking, and its basic structure consists of an electric drive unit, a GaN power conversion module, a DC-DC converter, an energy storage unit and a central control module. Supported by GaN devices, the system can realize high-frequency switching operation at >500kHz level, which significantly reduces the deadband loss and conduction loss. The power conversion model establishes a synergistic expression for the electromagnetic energy transfer and thermal power loss by defining the input mechanical power , the reverse electromotive force and the GaN switching efficiency function . The efficiency improvement modeling introduces dynamic load matching coefficients and energy return path resistance matrix , which are combined with a three-dimensional constrained optimization algorithm to iteratively regulate the transient power allocation strategy [1] . The system modeling session is based on the state-space modeling framework, which converts the vehicle kinetic energy input into a time-domain control sequence, and realizes the dynamic optimal modulation of the inverter PWM signals through the predictive control algorithm to achieve an efficient and stable energy recovery path.
3.2. GaN Power Module Equivalent Power Conversion Models
In the electric vehicle energy recovery system, the conversion efficiency of the GaN power module directly affects the overall performance of the system, so it is necessary to establish an equivalent power conversion model that includes the coupling of the device's electrical characteristics and thermal response [2] . The input power of the system is defined as the mechanical kinetic energy conversion power , while the output electric power is regulated by the dynamic efficiency of the GaN module , taking into account both conduction and switching loss terms.. . The basic energy conversion relationship is expressed as:
where is the conversion efficiency function under frequency and temperature coupling, which is approximated as follows:
The function characterizes the efficiency degradation of GaN modules at high frequencies and high temperatures. According to the modeling parameter setting: , a three-dimensional efficiency response surface is constructed in the frequency range of 300-800kHz and junction temperature of 25-125°C (see Figure 1). The surface shows that the efficiency decays exponentially with increasing frequency, while the increase in junction temperature will bring about the superposition of secondary losses, resulting in the intensification of the overall efficiency degradation trend.
In addition, parameters such as on-resistance , switching charge , and thermal resistance need to be taken into account in the equivalent circuit modeling of GaN devices, with the range of values shown in Table 1. The loss model, on the other hand, consists of switching energy consumption and on-resistance terms, and the total loss is expressed as:
where is the turn-on and turn-off energy consumption, respectively, and is the current RMS value. By embedding this model into the overall system control framework, it can provide accurate physical inputs for subsequent efficiency optimization algorithms.
3.3. Modeling of Energy Recovery System Efficiency Improvement
In order to effectively improve the efficiency of the GaN power module-based electric vehicle energy recovery system, a comprehensive efficiency improvement model containing dynamic energy allocation, frequency-thermal response optimization and control modulation fusion mechanism is constructed [3] . The model is based on the multi-stage loss expression of the system power path to construct the mapping relationship between state-control-performance. The core energy flow function in the energy recovery path is set as
where is the GaN efficiency response function at frequency-temperature, is the real-time efficiency of inverter modulation, and is the DC conversion efficiency based on load current and return path impedance [4] .Figure 2 shows a 3D radar efficiency response plot constructed based on three-axis variables of frequency (200-900 kHz), junction temperature (20-140°C), and current density (2-10A/cm²), demonstrating the sensitivity of the system efficiency to the variation of multi-factor coupling.
In order to further reveal the contribution of the main influencing factors in the energy recovery system, the transient power transfer coefficients of each sub-module under different operating states are summarized in Table 2, covering four types of variables, namely, conduction resistance, switching frequency, slope of the thermal resistance curve, and PWM modulation depth. The rate of change of each variable on the efficiency index at an operating current of 8A, voltage of 360V, and frequency of 600kHz is shown as follows: the increase of GaN on-resistance by 5mΩ causes a decrease of by 1.3%; and the depth of PWM modulation is improved from 0.6 to 0.85, by 2.4%. This coefficient matrix provides a theoretical basis for the subsequent construction of a modulation optimization algorithm with control vectors as input [5] .
At the control model integration layer, a particle swarm optimization (PSO)-based parameter adaptive modulation controller is introduced to objective function
The weighting factor is used to dynamically balance the trade-off between efficiency and loss to ensure that the system still has high recovery stability and heat loss suppression capability under load disturbances [6] .
3.4. System Modeling and Algorithm Implementation
In the GaN power module-driven electric vehicle energy recovery system, the system modeling needs to accurately couple the high-frequency electro-thermal characteristics with the vehicle braking conditions, and construct an iteratively optimizable time-domain control mapping model [7] . The modeling adopts a multilayer state-space framework, in which the input vectors of the system include the hub kinetic energy input , the braking trigger delay , the switching frequency of the GaN device and the junction temperature , and the outputs are the DC bus current and the duty cycle of the PWM modulation . In order to dynamically characterize the efficiency fluctuation of the system under frequency/thermal coupling conditions, the following state transition function is constructed:
where is the transient load impedance and characterizes the amount of variation of GaN module on-resistance with thermal drift. The controller is designed using a predictive model control (MPC) and PSO fusion strategy with an optimization objective function of
Optimization of weights , initialization of velocity-position matrix by particle swarm, real-time iteration to minimize the energy loss path, and enhancement of control stability [8] . In Figure 3 demonstrates the continuous surface of the system efficiency change under the state change of frequency from 400 to 850 kHz and temperature from 35 to 110°C when the current density is maintained at 8A/cm² and the load resistance of the system is 0.18 Ω. The error bars indicate the range of the simulation deviation under the injection of the normalized noise model, which reflects the mechanism of the system's robustness assessment under the multi-parameter perturbation.
To support this algorithmic regulation strategy, Table 3 lists the core modeling parameters involved in the model with their dynamic ranges, including technical variables such as on-resistance drift, PWM rate of change thresholds, GaN temperature sensitivity coefficients, etc., which are used to describe the modeling input dimensions within the system. The table not only provides a quantitative basis for the sensitivity analysis of the modeling parameters, but also provides a mathematical and theoretical basis for the boundary condition setting of the controller design [9] .
4. Experimental Results and Analysis
4.1. Experimental Platform Construction
To evaluate the performance of GaN power modules in energy recovery systems, a high-frequency, real-time experimental platform is established, consisting of three integrated modules: (1) Power Drive and Load Simulation Module: A 650V, 20A GaN HEMT is used in a full-bridge configuration to emulate dynamic energy feedback. The system interfaces with a variable resistive-inductive load (0.1–2.5 Ω, 1–5 mH) to replicate transient operating conditions; (2) Real-Time Control and Data Acquisition Module: A dSPACE MicroLabBox, equipped with a TI C2000 DSP core, serves as the central controller. It captures GaN terminal voltage, current, and junction temperature through high-speed ADCs and supports 200 kHz real-time signal processing and PWM generation. (3) Measurement and Thermal Characterization Module: A Keysight PA2201A high-precision power analyzer and thermocouple array monitor power fluctuations and transient thermal behavior. The platform supports efficiency–temperature surface fitting and calibration, enabling precise performance modeling for future algorithm validation [10].
4.2. GaN Power Module Energy Conversion Experiments
In order to verify the conversion characteristics of GaN module in energy recovery system, the experiment tests its on-state loss, switching loss and overall efficiency trend under different operating conditions by controlling the frequency, load and ambient temperature parameters. The experimental results show that when the frequency is increased to 750kHz, the on-state loss of GaN device rises slightly, but the decrease of switching loss brought by high frequency effectively improves the overall energy efficiency of the system. In order to present its performance under different frequencies and current densities, Table 4 lists the dynamic conversion efficiency data of GaN modules.
As shown in Table 4, with a constant current density of 4 A/cm², increasing the switching frequency from 400 kHz to 750 kHz results in a drop in GaN module efficiency from 93.1% to 91.7%, a 1.4 percentage point decline. When the current density rises to 6 A/cm², the efficiency falls from 90.3% to 89.5% over the same frequency range, widening the loss to 0.8 percentage points. This demonstrates a nonlinear intensification of efficiency degradation under the combined stress of high current and high frequency.To further quantify the effect of thermal stress on energy efficiency, Table 5 presents the variation of thermal resistance across different junction temperatures, providing insight into the thermal bottleneck's contribution to GaN device performance degradation.
4.3. Validation of Energy Recovery System Efficiency Improvement
The validation of the system efficiency improvement centers on two paths: control algorithm optimization and hardware response characteristics. Dynamic braking simulation experiments are used to compare the recycling efficiency performance of the MPC-PSO fusion control with that of the traditional PI control strategy under different operating conditions. The results show that the optimized control has more significant efficiency retention ability in the high frequency band. In order to verify the performance difference between the strategies, Table 6 demonstrates the energy recovery efficiency and average heat loss of the three typical control methods at a frequency of 600 kHz and a junction temperature of 95 °C.
Table 6 shows that at 600 kHz and 95 °C, traditional PI control achieves 84.6% energy recovery efficiency with 36.2 W of heat loss. Implementing MPC raises efficiency to 88.1% and lowers heat loss to 28.5 W. With the MPC-PSO strategy, efficiency further improves to 90.3%, while thermal loss drops to 23.7 W. Compared to PI control, MPC-PSO increases efficiency by 5.7% and reduces thermal dissipation by 12.5 W, highlighting its strong system optimization capability.To quantify the impact of hardware characteristics, sensitivity analysis was conducted using different GaN on-resistance values, as detailed in Table 7.
As shown in Table 7, increasing GaN on-resistance from 35 mΩ to 80 mΩ reduces system efficiency from 92.6% to 89.7% and shrinks the PWM duty cycle from 0.82 to 0.74, exhibiting an almost linear decline. Each 20 mΩ increment leads to an average 1.45% efficiency drop, underscoring the high sensitivity of conduction loss to system performance. The duty cycle compression also reflects the limited dynamic response of the modulator, making it a critical factor in device selection and control strategy design.
5. Conclusions
The energy recovery system based on GaN power module has the characteristics of high frequency, high efficiency and low loss, and shows significant advantages in braking energy recovery of electric vehicles. By establishing a frequency-temperature coupled power conversion model, the key influencing factors of GaN device efficiency degradation are clarified; combining state-space modeling and MPC-PSO optimization control algorithm, the dynamic modulation and efficiency maintenance ability of the system under complex working conditions are realized. The experimental results verify the coupling effect of different control strategies, device parameters and thermal characteristics on the energy conversion efficiency, indicating that the synergistic optimization of control accuracy and hardware response is the core path to improve the system performance. In the future, the algorithm can be further combined with multi-physical field feedback modeling, on-board edge computing platform deployment and adaptive heat dissipation management strategy to expand the generalization capability of the algorithm among multi-model platforms, so as to promote the efficient implementation of the energy recovery system in the intelligent transportation energy system.
References
- Armenta-Déu, C.; Cortés, H. Analysis of kinetic energy recovery systems in electric vehicles. Vehicles 2023, 5, 387–403. [Google Scholar] [CrossRef]
- Wang, Z.; Zheng, Y. A review of coordinated control strategies for compound braking of electric vehicle ABS. Proceedings of the Institution of Mechanical Engineers, Part D: Journal of Automobile Engineering 2025, 239, 432–446. [Google Scholar]
- Zheng, Z.A.; Qin, Y.; Zhao, W.; et al. Composite braking control strategy for electric vehicles based on different adhesion coefficients. International Journal of Dynamics and Control 2025, 13, 1–16. [Google Scholar]
- Luo, Z.; Xiong, S.; Wen, M.; et al. Experimental Study on R290 Performance of an Integrated Thermal Management System for Electric Vehicle. Energies 2025, 18, 802. [Google Scholar] [CrossRef]
- Nagy, E.; Török, Á. Comparison of Simulation- and Regression-Based Approaches to Estimating Electric Car Power Consumption. Applied Sciences 2025, 15, 513. [Google Scholar] [CrossRef]
- Malozyomov, B.V.; Martyushev, N.V.; Kukartsev, V.V.; et al. Determination of the performance characteristics of a traction battery in an electric vehicle. World electric vehicle journal 2024, 15, 64. [Google Scholar] [CrossRef]
- Khan, M.R.; Haider, Z.M.; Malik, F.H.; et al. A comprehensive review of microgrid energy management strategies considering electric vehicles, energy storage systems, and AI techniques. Processes 2024, 12, 270. [Google Scholar] [CrossRef]
- Recalde, A.; Cajo, R.; Velasquez, W.; et al. Machine learning and optimization in energy management systems for plug-in hybrid electric vehicles: a comprehensive review. Energies 2024, 17, 3059. [Google Scholar] [CrossRef]
- De, D.; Das, U.; Nandi, C. A comprehensive approach of evolving electric vehicles (EVs) to attribute "green self-generation" -a review. Energy Harvesting and Systems 2024, 11, 20230023. [Google Scholar] [CrossRef]
- Acar, E.; Jain, N.; Ramu, P.; et al. A survey on design optimization of battery electric vehicle components, systems, and management. Structural and Multidisciplinary Optimization 2024, 67, 27. [Google Scholar] [CrossRef]
Figure 1.
Surface plot of GaN efficiency under frequency-temperature coupling conditions.
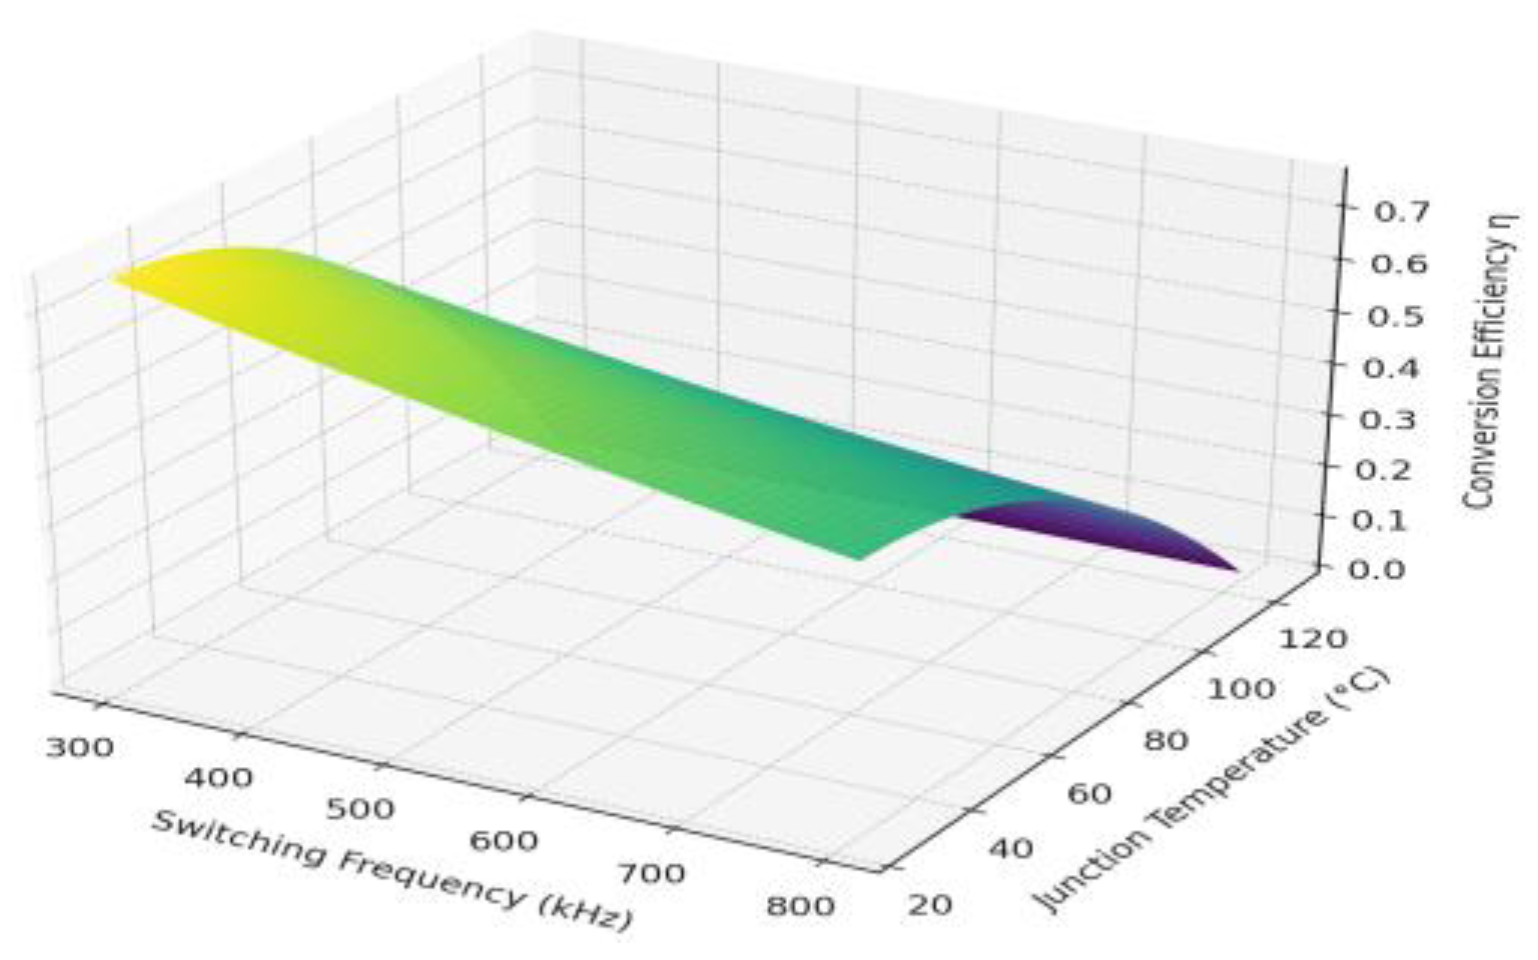
Figure 2.
Multi-factor response characteristics of GaN module efficiency.
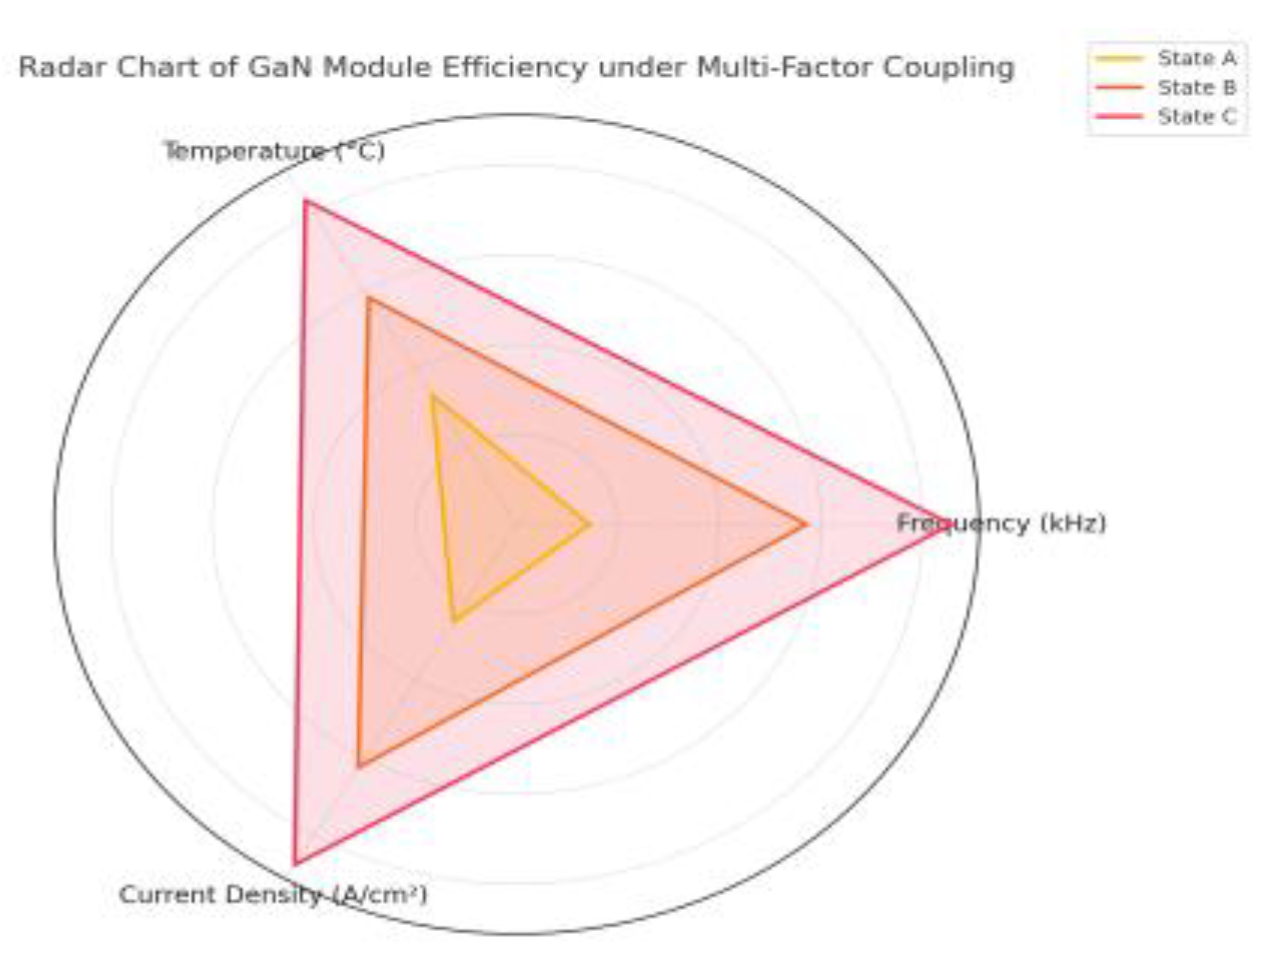
Figure 3.
System efficiency response plot based on frequency-temperature perturbation.
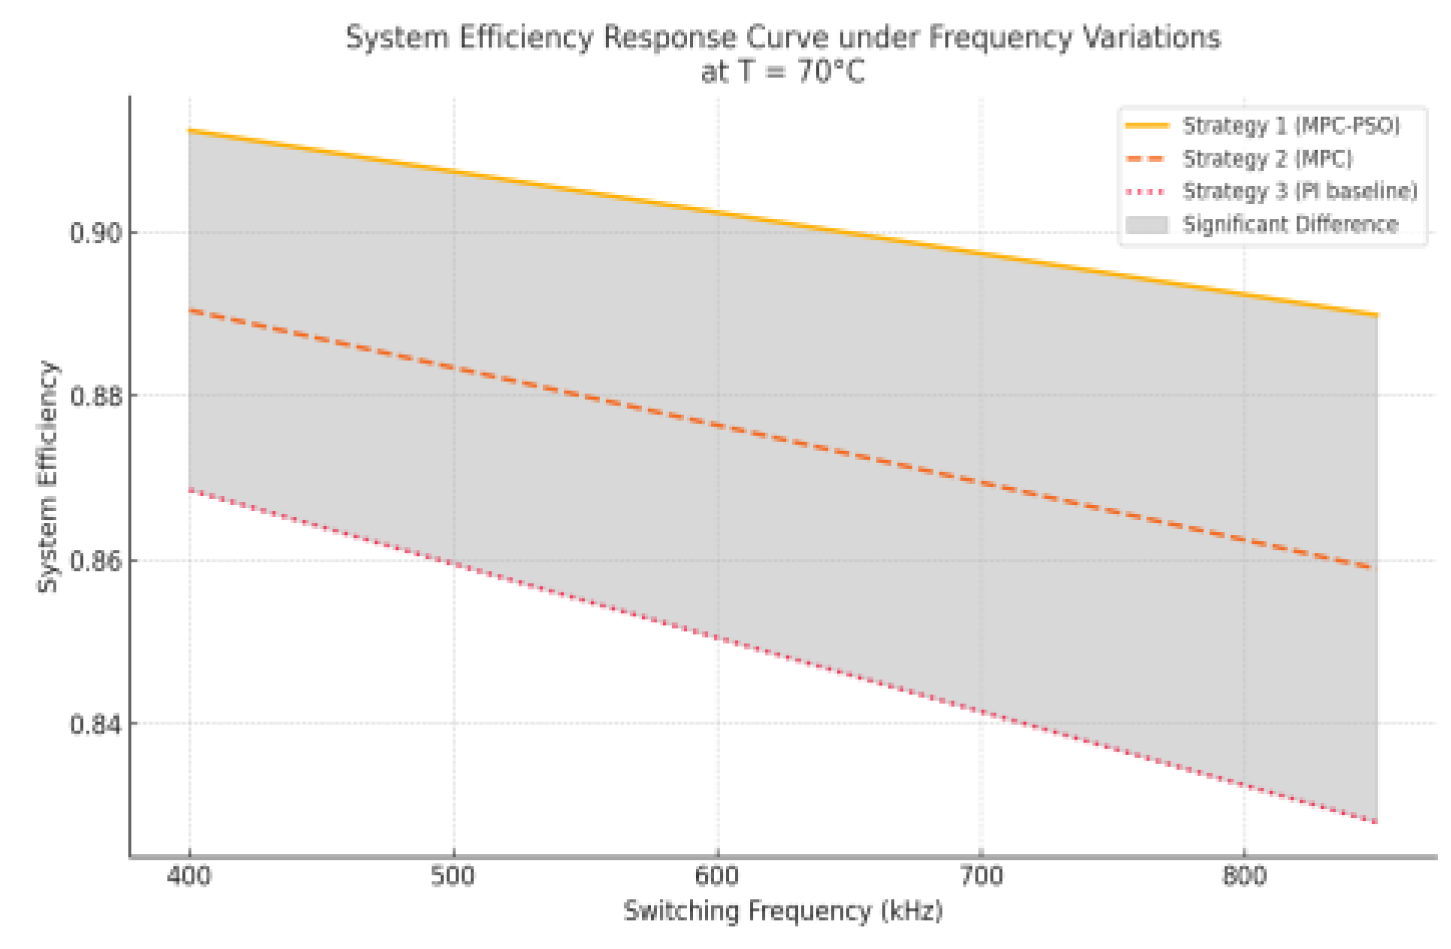

Table 1.
Comparison of key parameters of GaN power devices.
| parameter symbol | hidden meaning | Numerical range |
| on-resistance | 35 - 80 | |
| indirect gate charge | 6 - 12 | |
| Junction to shell thermal resistance | 1.0 - 1.6 | |
| Single switch energy consumption | 30 - 80 | |
| | Output Capacitance | 80 - 160 |
| | threshold voltage | 1.4 - 2.0 |
Table 2.
Table of dynamic transfer coefficients for key parameters of the energy recovery system.
| Parameter name | Operating range | Transmission impact factor |
| GaN on-resistance | 35 - 80 mΩ | -1.3%/5mΩ |
| PWM modulation depth | 0.3 - 0.9 | 0.096 |
| switching frequency | 200 - 900 kHz | -0.8%/100kHz |
| thermal resistance | 1.0 - 1.6 °C/W | -0.9%/0.2 |
Table 3.
Table of parameter ranges of key variables for system modeling.
| Parameter name | notation | scope | clarification |
| GaN on-resistance variation | 3.2 - 9.6 mΩ | Increases linearly with every 10°C of junction temperature rise | |
| PWM change rate threshold | | 0.001 - 0.08 | Controlling the duty cycle regulates the response rate |
| Temperature sensitivity factor | | 0.008 - 0.015 1/°C | GaN module efficiency response gradient to temperature rise |
| Predicted step size | 5 - 20 | MPC control of time-domain prediction step | |
| PSO particle swarm size | 30 - 100 | Iteratively optimize the number of particles |
Table 4.
Conversion efficiency test data of GaN modules at different frequencies and currents.
| Frequency (kHz) | Current density (A/cm²) | Conversion efficiency (%) |
| 400 | 4 | 93.1 |
| 600 | 4 | 92.4 |
| 750 | 4 | 91.7 |
| 600 | 6 | 90.3 |
| 750 | 6 | 89.5 |
Table 5.
Thermal resistance variation and efficiency degradation factor of GaN module at different junction temperatures.
Table 5.
Thermal resistance variation and efficiency degradation factor of GaN module at different junction temperatures.
| Junction temperature (°C) | Thermal resistance (℃/W) | Efficiency degradation factor (%/°C) |
| 40 | 1.05 | 0.06 |
| 70 | 1.18 | 0.09 |
| 100 | 1.32 | 0.13 |
| 125 | 1.45 | 0.17 |
Table 6.
Comparison of energy recovery efficiency and heat loss under different control strategies.
| control strategy | Recovery efficiency (%) | Heat loss (W) |
| PI control | 84.6 | 36.2 |
| MPC control | 88.1 | 28.5 |
| MPC-PSO control | 90.3 | 23.7 |
Table 7.
Sensitivity response test of on-resistance to system efficiency.
| On-resistance (mΩ) | System efficiency (%) | PWM duty cycle |
| 35 | 92.6 | 0.82 |
| 55 | 91.4 | 0.78 |
| 80 | 89.7 | 0.74 |
Disclaimer/Publisher’s Note: The statements, opinions and data contained in all publications are solely those of the individual author(s) and contributor(s) and not of MDPI and/or the editor(s). MDPI and/or the editor(s) disclaim responsibility for any injury to people or property resulting from any ideas, methods, instructions or products referred to in the content. |
© 2025 by the authors. Licensee MDPI, Basel, Switzerland. This article is an open access article distributed under the terms and conditions of the Creative Commons Attribution (CC BY) license (http://creativecommons.org/licenses/by/4.0/).
Copyright: This open access article is published under a Creative Commons CC BY 4.0 license, which permit the free download, distribution, and reuse, provided that the author and preprint are cited in any reuse.


