
Submitted:
13 June 2025
Posted:
16 June 2025
You are already at the latest version
Abstract
Energy crisis has been a persistent problem in Zimbabwe, yet the nation has renewable energy sources such as solar, wind and biogases just to mention a few. Therefore, the study develops a framework to enhance renewable energy production in Zimbabwe to ease the power crisis. Using time series data from 1980-2020, the study specifies an ARDL model with seven independent variables namely income, remittances, foreign direct investment, ZESA reliability, education level, public-private partnership investment and trade openness with renewable energy supply as the dependent variable. The short-run and long-run impact of the variables was determined. The study found out that income, foreign direct investment and education have a negative impact on renewable energy supply in the long run, whilst remittances, ZESA reliability and public private partnership investments have a positive effect. As a result of this a set of policies are recommended based on the findings of the study. The study recommends that the government should improve systems of cross border migration and also in order to promote and encourage more remittances. There is also need to increase market competition in the remittances industry to help increase scale and reduce costs. The study also recommends the government to embark on awareness programs on the importance of adopting renewable energy. In addition, efforts to facilitate the production of renewable energy in the country through programs like rural electrification should be scaled. Finally, efforts to attract large public private partnership investments (PPP) in the energy sector should be put in place since it was identified as an important factor that enhances renewable energy production.
Keywords:
renewable energy
; energy poverty
; rural electrification
; energy production
; Zimbabwe
; autoregressive distributive lag (ARDL)
; public-private partnerships (PPPs)
1. Introduction
Zimbabwe has been relying on thermal and hydro energy sources, which both can no longer be relied on since coal is highly associated with greenhouse gas emissions and reduced water for hydro power generation caused by a changing climate has resulted in shortage of hydroelectricity. Considering the period of 2010 -2015, there was a decline in the country’s electricity production from coal from 56% to 16% whilst hydro energy fell from 23% to 13% (World Bank, 2023). Yet, the production of energy from other renewable energy sources (excluding water) such as solar, wind and biogas has remained subdued despite their potential to sustain the country’s energy sector. Zimbabwe is one of the African countries having the least share of renewable energy as a percentage of electricity. Zimbabwe which has longer sunny summers and only generates 5 MW which is 1% of the country’s solar energy potential far less than Kenya, Thailand, and Canada, which produce 100 MW, 704 MW, and 1804 MW respectively, yet they have less sunny climates than Zimbabwe (Ministry of Energy and Power Development (MoEPD), 2019). However, with regard to biogas, geothermal and wind energy the nation has done little in terms of resource exploitation (Makonese, 2016). As a result, Zimbabwe produces electricity amounting to 1400 Megawatts (MW) against a peak demand of 1700 MW although the nation has an installed capacity to generate 2200 MW (MoEPD, 2020).
In an effort to curb the deficit, the government of Zimbabwe has been importing power from neighboring nations like Mozambique but this was to no avail since the nation was also obliged to export approximately 80 MW every year to Namibia under a commercial agreement (MoEPD, 2020). According to the World Bank (2023), only 40% of the national population have access to electricity services and of those with access, 78% are in urban areas and 16% in rural areas. Energy scarcity in Zimbabwe has been caused by the faulty and obsolete equipment at the existing thermal stations, falling water levels, lack of capital investment in the energy sector and also low investment in renewable energy (MoEPD, 2019). The power shortage continues to threaten the country’s economic growth and development since the effects are catastrophic both to the industry and the households. As of 2022, the nation experienced an immense power outage of up to 16 hours in a day. Alternatively, independent power producers have endeavored to revert access to power, through switching to renewable energy sources such as solar power, but the problem has not been resolved due to the low supply of renewable energy for power generation (Mbohwa, 2022).
The existing literature attributes several reasons to the low supply and uptake of renewable energy. For instance, Shandilya and Anannya (2018) attribute it to air pollution and poor governance whilst Opondo et al. (2021) recognizes low GDP per capita and education. More interestingly, Lawal (2023) argues that limited urbanization and high corruption are responsible for the low supply and uptake of renewable energy. In Zimbabwe, policy and institutional barriers, financial barriers and socio-cultural barriers are identified as driving factors of poor supply and uptake of renewable energy (Makonese, 2016; United Nations, 2022). Renewable energy has been identified as a key to sustainable energy supply, combating climate change simultaneously (Guo et al., 2022). To this effect the United Nations at the COP 27 has provided advice to the governments, to develop policies and frameworks that create a favorable environment for renewable energy production (Caver, 2023). Although the Zimbabwean government has put in place the National Renewable Energy Policy to promote renewable energy projects, this study enriches and edifies the national policy by bringing forth a framework that encourages the supply and uptake of renewable energy to support the energy industry.
The key objective of the study is to provide a framework to intensify power supply through renewable energy resources in Zimbabwe. The specific research objectives are: (i) to assess the potential energy that Zimbabwe can obtain from renewable energy sources (hydro, solar, geothermal, wind and biomass); (ii) to determine the factors affecting renewable energy supply in Zimbabwe; and (iii) to analyze the ways in which renewable energy supply can be accelerated in Zimbabwe.
2. Background of the Study
Zimbabwe’s energy is under the jurisdiction of the Ministry of Energy and Power Development (MoEPD). The ministry oversees both the energy regulatory board, the Zimbabwe Energy Regulatory Authority (ZERA), and the electricity supply board which is the Zimbabwe Electricity Supply Authority (ZESA) holdings. ZERA is mandated to regulate the entire energy sector in Zimbabwe in a fair, transparent, efficient and cost-effective manner for the benefit of the consumers and energy suppliers. ZESA is obligated to generate, import or export, transmit and distribute electricity both to the industrial and to the households. ZESA Holdings has its subsidiaries, the energy generating company, Zimbabwe Power Company (ZPC) and the Zimbabwe Electricity Transmission and Distribution Company, (ZETDC). Additional subsidiaries include the internet service provider PowerTel Communications (Private) Limited and the investment arm ZESA Enterprises (ZENT). Additionally, there are independent power producers (IPP’s) in the country which most of them produce power for their own consumption and these include Triangle Private Limited, SolGas Private Limited and Nyangani Renewable Energy Private Limited (MoEPD, 2021).
The country relies primarily on coal and hydroelectric systems, for electricity generation. Four coal power stations exist, Hwange power station being the largest with capacity of producing 920 MW, followed by Munyati (100MW), Bulawayo (90 MW) and Harare (80MW). With regard to the hydroelectric power generation Kariba dam (Kariba South Bank and Kariba South Bank Extension) and Tokwe Mukosi dam are the major stations with capacity of 933 MW and 15 MW respectively. Despite having the capacity to meet 70% of the local demand of electricity, there has been an underproduction from the combined coal power stations perhaps due to faulty old equipment at the stations. Production from hydroelectric sources has been adversely affected by low levels of water in Kariba dam, which is a major dam for hydroelectricity in Zimbabwe, however other small dams in the country are yet to be exploited.
Noticeable government efforts governments’ effort to curb the energy crisis include Gwanda solar project construction, construction of an additional two units, Hwange 7 and 8, expansion of Kariba South Hydro-electric Power Station (KSPS) Unit 7&8, construction of Batoka Gorge hydroelectric and repowering of the three power stations namely; Harare, Bulawayo and Munyati power stations (GoZ, 2022). However, despite these developments, electricity supply from renewable sources is subdued as the country fails to meet the country’s total demand of 1700 MW despite its great potential (GoZ, 2022). Resultantly, the crisis has been posing a threat to the economic performance, since power is a master requirement by all sectors. Figure 1 shows the trends in the electricity production from coal and hydro sources, renewable energy uptake as well as economic performance.
Figure 1 shows that from the 1990’s, production of electricity from coal was on a decline up to 2008, while electricity generated from hydroelectric sources rose during the same period, perhaps this was due to good rains leading to better levels of water in Kariba Dam. However, during the same period, a sharp rise in economic growth was witnessed from -9.02% in 1992 to 10.36% in 1996. However, the country’s economic growth fell to -17% in 2003 due to currency instability and inflation that hit the nation during the time (Makonese, 2019). Although there was a surge in thermal power from 2009 to 2015 as shown in Figure 1, this could not sustain the nation since production from hydro-sources tremendously declined during the period (MoEPD, 2019). The nation supplemented the supply of electricity by importing more power from South Africa. With this, power imports steadily increased from 3.22% of the energy budget in 2009 to 15% of the energy budget in 2015 (World Bank, 2023). Power deficit continued to hit nation due to poor water levels at Kariba dam, depreciation of equipment at the existing power station and low uptake of renewable energy. In 2012, the government launched the National Energy Policy, seeking to promote the optimum supply and utilization of energy for economic growth, but growth continued to decline reaching a growth rate of 2.03% in 2015 from 15.74% in 2012. Energy supply from alternative sources like renewable sources remained subdued during the time, otherwise energy supply would have improved for more industrialization leading to economic growth. Renewable energy is also the most preferable source of energy since it helps in promoting the achievement of carbon reduction goals.
To contribute to the global climate target of reduced carbon emission enabling sustainable economic development, Zimbabwe developed a National Climate Change Response Strategy (NCCRS) in 2014 and launched the Zimbabwe’s Intended Nationally Determined Contribution of 2015, along with the Zimbabwe’s National Climate Change Response Strategy in the same year (GoZ, 2022). In 2016, the government released the Zimbabwe Climate policy in 2016 and submitted again another Intended Nationally Determined Contribution (INDC) to the United Nations Framework Convention on Climate Change (UNFCCC) in response to the Warsaw decision and the Lima call to action in 2022 (GoZ, 2022). However, despite these policies, there is still subdued production of renewable energy in the country as compared to other nations in the region. Figure 2 shows electricity generated in 2020 from renewable energy sources supply by some African countries.
As indicated in Figure 2, generates the least power from solar as compared to South Africa, Kenya, Namibia and Malawi, while electricity production from wind is far below that of South Africa, Kenya and Namibia. Although electricity generated from bioenergy surpass that of some countries, Zimbabwe’s production is subdued compared to its neighboring country South Africa. Regarding hydro electricity production, Zimbabwe is better than some African countries although it is lower than that of Kenya. As a result, renewable energy production in Zimbabwe remained very low as compared to other African countries even though Zimbabwe is more endowed with the resources than such countries (IRENA, 2022) as illustrated in Figure 3:
Despite having the capacity to generate more electricity from renewable energy sources such as solar, wind, biomass, and biogas than other countries, Zimbabwe’s renewable energy production remains quite low. Taking for instance from solar, few small solar stations were established, and amongst them only a small fraction contribute power to the national Grid. Illustrating the point, Table 1 shows some of the solar power stations in Zimbabwe.
Presented in Table 1 are the major existing solar power stations in Zimbabwe. It is evidenced in the table that most solar producers are the independent power producers who only produce for their own consumption. Due to these under developments in renewable energy technologies as of 2020 the access to electricity (% of population) stood at 40% nationwide, the most deprived being the rural areas (World Bank, 2023). Apart from solar energy, energy from other renewable sources such as the bagasse, biomass, wind and mini hydropower, have not been fully exploited although the government struggles to meet the power demand (MoEPD, 2019). Therefore, this study seeks to provide a roadmap and a structured framework to enhance the production of renewable energy to alleviate the nation from energy poverty for socio-economic development.
2.1. Problem Statement
Zimbabwe is experiencing a serious energy crisis because of its major electrical sources’ struggling to meet the local demand yet it is abundantly endowed with renewable energy sources which if tapped unto would help the nation to address the energy supply challenges. The country has an installed capacity to generate 2300 MW (from thermal and hydro), however the actual power generation capacity is 1400 MW against a peak demand of 1700MW yet the country’s abundant renewables have the ability to offset the power deficit for surplus (MoodMoEPD, 2021). For instance, the nation has abundant solar that has a potential to generate 600 MW, geothermal (50 MW), biomass (1 000 MW), small hydro (120 MW), and wind (100 MW), according to IREA (2020). However, less than 20% of hydro potential has been tapped to far, and only 1% of solar potential has been exploited, with little progress made in biogas and geothermal (IREA, 2020). According to the International Renewable Energy Agency (2022), Zimbabwe with 46 % of energy generated from renewable energy sources, has the lowest share of renewable energy in the region, trailing South Africa with 86%, Zambia (85%), and Mozambique (87%). In Zimbabwe, 58% of the 46% of renewable energy comes from hydro and marine sources only, implying that little energy is generated from solar, wind and biogas. Against this facade, this study put forward a framework to accelerate renewable energy production in order to alleviate the country’s energy crisis.
Few studies in Zimbabwe have given some general overview on the renewable energy production in stating the challenges in the sector (Zwiniora, 2022; Makonese, 2016). However, amongst them only few studies have put forward empirical models to enhance renewable energy production in Zimbabwe like what other scholars did in Thailand, China and Kenya (Omoju, 2020; Murshed, 2020). As a result of this, this study put forward an empirical model for accelerating renewable energy adoption in Zimbabwe.
2.2. Justification of the Study
Although the investigations to determine the drivers of renewable energy production have been undertaken by Omri and Nguyen (2014), Murshed (2020), Omoju (2020), Akintande et al. (2020) and Opondo et al. (2021), the majority of these studies were conducted in more industrialized and developed nations than Zimbabwe. The study advances the body of knowledge by determining the key determinants of renewable energy production in developing nations like Zimbabwe. This study differs from other Zimbabwean studies in that a framework to enhance renewable energy production was brought forward unlike the study of Makonese, (2016) and Zwiniora (2022) who analyzed the performance of the energy sector and assessing the potential renewable energy that the energy sector can derive. Additionally, other studies concentrated more on the backdrops in the Zimbabwean energy sector which is also another distinctive aspect with this study since it focused on a model to enhance renewable energy supply.
Adding on to the above, it is amongst the goals of the Zimbabwean government to develop an upper middle-income economy and attain a 40% reduction of greenhouse gas emission by year 2030 according to Government of Zimbabwe (GoZ, 2021). Therefore, to deliver these ambitious developments a key strategy is to develop a model to enhance renewable energy uptake which brings adequate supply of electricity from clean sources (hydro, solar, geothermal, wind and biomass). Thus, the study is essential to the policy makers, and other government agencies like Environmental Management Agencies since, as it augments the National Renewable Policy of Zimbabwe. Additionally, the study promotes the achievement of the Sustainable goals 7 and 13 of giving access to electricity to everyone and combating climate change respectively. Finally, the study contributed to the empirical literature for academic purposes as it will provide an empirical model to accelerate the production of renewable energy in the country.
3. Literature Review
3.1. Theoretical Literature Review
The Accelerator theory was conceived by Thomas Nixon Carver in 1903 and Albert Aftalion, among others, before Keynesian economics, but it came into public knowledge as the Keynesian theory began to dominate the field of economics in the 20th century. The Accelerator theory rests on the argument that that capital investment outlay is a function of output. The theory postulates that investment expenditure increases when either demand or income increases. When faced with excess demand, the accelerator theory posits that companies typically choose to increase investment to meet their capital to output ratio, thereby increasing their profits. The theory also suggests that when there is excess demand, suppliers can either decrease demand by raising prices to meet the level of demand (Ali, 2016). When income or consumption increases, investment will increase by a multiple amount because of the need to produce more commodities. In this case, investment is induced by changes in income or consumption. The accelerator coefficient (v) is the ratio between induced investment ∆I and an initial change in consumption expenditure ∆C, mathematically this can be presented as:
v = ∆I/∆C or ∆I = v∆C
Therefore, to produce a given amount of output Yt, with v is capital-output ratio, the required amount of capital stock Kt to produce Yt output will be given by the following equation:
Kt = vYt
Equation (2) implies that, capital-output ratio (v) is equal to K/Y and in the theory of accelerator this capital-output ratio (v) is assumed to be constant. Therefore, under the assumption of constant capital-output ratio, changes in output are made possible by changes in the stock of capital ∆Ktwhich then represent investment. Since increase in the stock of capital in a year (Kt – Kt-1) represents investment in that year, the above Equation (2) can be written as below:
I1 = V (yt – yt-1)
Equation (3) reveals that as a result of increase in income in any year t from a previous year t- 1, increases investment v times more than the increase in income, thus, capital-output (v) ratio, which represents the magnitude of the accelerator. However, the theory is subject to critique since some of its assumptions do not hold in the real world, for instance assuming that no machines are lying idle and no extra shift working is possible. If there had been excess capacity and extra shift working was possible, the supply of goods could be increased with the existing equipment and the accelerator would not come into play. In addition, investment is affected by many other factors, such as investor confidence and the “animal spirits” of firms which the theory did not account for. However, despite the above limitations of acceleration principle, it points out investment as a crucial variable to enhance production. Based on the accelerator theory, investment in renewable energy is a function of the output of firms. Therefore, investment in renewable energy sources increases the supply of renewable energy. Thus, output is an important variable in the production of renewable energy.
Tobin’s Q f investment theory was put forward by James Tobin in 1968. Tobin’s q theory of investment relates fluctuations in investment to changes in the stock market. Investment fluctuations are caused by fluctuations in the stock market. The theory explains investment using the difference between the stock market valuation of a firm’s real assets and the replacement costs of these assets. According to Tobin’s q-investment theory, firms base their investment decisions on q, where q represents the ratio between the market value of all physical capital and its replacement costs. Tobin’s Q was typically used as a technique for forecasting investment behavior.
q= {Equity Market Value + Liabilities Market Value}
{Equity Book Value + Liabilities Book Value}
In the case that q is above one (q>1), the stock market values the firm more than the market value of its real assets. In this case a firm can increase its value by acquiring additional capital. Thus, firms will invest and increase their capital stock. In the opposite case, when q is smaller than one (q<1), the market value of the firm is less than the replacement costs of the firm’s assets. In this case a firm does not replace depreciated capital, because the market values the additional investment less its costs. Hence, the capital stock will decrease. Borrowing from the Tobin q theory, the key determinant of investment is the ratio of the market value of the company and the replacement cost which adds a new avenue through which changes in the stock market may affect the economy by affecting the allure of investing. However, investments depend not just on the stock market’s current value (in the numerator of q), but also on a number of lag values. The theory also failed to account for other key determinants of investment such as output as recognized by the accelerator theory.
The Choice Awareness theory focuses on how to put into practice radical technological innovations like renewable energy systems, which will also necessitate organizational and institutional transformations in society. The Choice Awareness theory emphasizes the presumption that many current organizational interests will work to keep major technological innovations off the agenda at many levels, with references to discourse and power theories. The foundation of the Choice Awareness theory is the observation that this condition frequently results in a situation where there is no other option. A society may feel as a whole that they have no choice but to construct another coal-fired power plant, for example. However, the Choice Awareness theory continues to assert that this is untrue: society does not have a choice. The theory explains how to become conscious of this option, allowing people to discuss the future together and reach better decisions.
The idea focuses on collective decision-making in a process that includes numerous people and organizations representing various interests and viewpoints, as well as varying degrees of power to sway the outcome. Although the theory is not exhaustive, it stresses the crucial point that preexisting organizational interests will frequently try to remove options from the political decision-making process. The Choice Awareness theory promotes counterstrategies that include developing technical alternatives, conducting feasibility studies using institutional economic thinking, and developing public regulation measures that take competing interests into account. It also calls for modifications to the democratic decision-making framework.
This study is underpinned on the accelerator theory of investment which states that investment spending rises when either demand or income rises. The theory purports that when there is excess demand, companies can either meet demand by raising prices or increase investment to meet the level of demand, and companies typically choose to increase production, thereby increasing profits, to meet their fixed capital to output ratio. Since there is excess demand for energy in Zimbabwe income was identified as one of the variables that may lead to a massive investment in renewable energy technologies. The accelerator theory is based on real facts that explain investment in the Zimbabwean context where income plays a pivotal role in harnessing investment.
3.2. Empirical Literature Review
Using a panel data of 64 countries, Omri and Nguyen (2014) examined the factors affecting the uptake of renewable energy over a period of 21 years spanning from 1990 - 2011. Dynamic system-GMM panel model was employed to determine the determinants of renewable energy adoption. Factors that were examined include carbon emissions, economic growth, crude oil price, and trade openness. Carbon emission and trade openness were determined as the main factor driving the renewable energy usage. Increase in oil prices had a smaller negative effect on the usage of renewable energy. However, the findings were in contrast with the findings from other scholars (Opondo et al., 2021) where renewable energy uptake reduces carbon emission. Economic growth was found not to influence renewable energy uptake whereas Sonmez & Manso (2014) found it to have a positive effect. Therefore, the present study adopted the variables used by Omri and Nguyen and a different model, Auto Regressive Distributed Lag (ARDL) model, was employed to validate the findings of Omri and Nguyen (2014).
Sisodia et al. (2015) used a panel data model to examine the determinants of solar and wind energy investment in European Union-27 (EU-27). The study used data spanning from 1995–2011 and OLS was applied. Their findings suggested that the strong regulation perception negatively affects solar energy investment. In addition, lower sunshine hours in EU-27 were found to speed up investment on wind energy. The study went on to test the net effect on prices using random effects modelling. Results suggested that energy generation through wind and solar insignificantly determine retail electricity prices to households and had negligible effect on industrial prices. However, the present study differs from the study of Sisodia et al. (2015) in the sense that the present study seeks to understand the factors that drive supply of all renewable energy, not just wind and solar. Using a systematic literature review, Boucert (2020) investigated the quantitative determinants of renewable energy deployment, reviewing the literature that arose in the late 2000s. Findings indicated that there was less consensus on the effect of the economic, environmental, and energy-related determinants on renewable energy deployment. The study concluded that regulatory, political, and demographic factors were the major drivers of renewable energy deployment. However, despite its contribution to the body of literature, the study used many measures of renewable energy deployment and inconsistent findings were obtained. Therefore, the current study put forward a model for renewable energy supply using a renewable energy consumption (% of total energy) as a sole measure.
Murshed (2020) investigated the non-linear impact of information communicating and technology trade (ICT), on renewable energy developments, energy use efficiency, access to cleaner cooking fuels, and a reduction in carbon dioxide emissions across South Asian economies. The econometric findings showed that trade in ICT directly improves renewable energy consumption, raises renewable energy shares, lowers energy use intensity, promotes the use of cleaner cooking fuels, and lowers carbon dioxide emissions. Moreover, ICT trade indirectly reduces carbon dioxide emissions by increasing the use of renewable energy, strengthening energy efficiency, and expanding access to cleaner cooking fuels. Despite its contribution to the body of literature, the study was regional study and its findings may not be applicable to a sole developing nation like Zimbabwe. Therefore, this paper put forward a model that explains the Zimbabwean context and the findings will not mislead the policy makers in the country.
In China, Omoju (2020) analyzed the determinants of renewable energy development using a systematic literature review analysis. The study came to the conclusion that real gross domestic product (GDP) growth hinders China’s adoption of renewable energy while foreign direct investment and trade openness considerably support renewable energy in China. According to the Omoju (2020), the reason real GDP may be at odds with renewable energy is that the size of renewable energy does not grow proportionally to the size of overall energy consumption. Similar to how financial development benefits renewable energy, the risks associated with financing renewable energy projects owing to ambiguous future climate legislation and lengthy payback periods reduce the sector’s contribution to the growth of renewable energy. However, with regard to GDP the findings were in contrast with those of Opondo (2021) who concluded that GDP promotes renewable energy adoption. Using a different approach, ARDL model, this study also examined the effect of GDP, trade opens and FDI on renewable energy supply in Zimbabwe contributing to the body of literature. The choice of ARDL model is over its ability to deal with endogeneity because the model is free from residual correlation.
Fatima et al. (2021) conducted a multi-facet content analysis as well as the least squares modelling analysis to identify factors that drive renewable energy generation (REG) development in Pakistan. The study used questionnaire surveys to collect the data from the academia in universities and professionals from Islamabad Electric Supply Company. Lack of good governance, inability to adapt to renewable energy, and governmental energy policies were revealed to be the major hindrances to the development of renewable energy sources, while endowed resources, power production methodology, demand for renewable energy, investment climate for renewable energy projects, economic returns of renewable energy projects, environmental effects, and public acceptance were revealed to be the major facilitators of renewable energy generation development. Environmental consequences were deemed to be the least significant factor, while a lack of good governance was determined to be the most significant factor. Also, it was established that public approval was one of the main factors influencing REG development. Despite its contribution to the body of literature, the study used cross-sectional data which may suffer from heteroscedasticity. However, this current study used time series data which gives information on changes over time and a different modelling technique of ARDL was employed.
In Africa, also most of the studies focused on drivers of renewable energy uptake, for instance Akintande et al. (2020) developed a renewable energy consumption model for the five most populous countries in Africa using annual data spanning between 1996 and 2016. The selected countries were Nigeria, DR Congo, Ethiopia, South Africa, and Egypt. The study used the Bayesian Model Averaging (BMA) procedures to analyze the effect of thirty-four variables. The findings of the study indicated that energy use, population growth, urban population, electric power consumption, human capital were positively related to renewable energy consumption. Although the BMA adopted by the researcher is a better model to account for model specification and variable selection, it does not give a long run and short run effects. To determine the short run and long run effects, this study employed the ARDL model.
Opondo et al. (2021) investigated factors affecting renewable energy consumption in Sub Saharan Africa (SSA). The paper considered the panel autoregressive distributed lags (ARDL) panel models of 23 SSA countries using time series data from 1998 to 2014. The study found out that, in the long run, renewable energy consumption was positively influenced by gross domestic product (GDP) per capita and education index in the long run. Adding on, the study established that variables like, CO2 emissions per capita, and life expectancy index could negatively influence renewable energy consumption in the long run. The study emphasized the necessity of managing and implementing renewable energy development in an efficient manner in order to advance social indicators like education indexes, while enhancing economies and lowering CO2 emissions. Although Opondo et al. (2021) immensely contributed to the body of literature, the study left out Zimbabwe in the selected sample of SSA countries, there are chances that findings may not portray the Zimbabwean situation. Against this facade, this current study borrowed the ARDL model and some of the variables from the study of Opondo et al. (2021) to probe a model to enhance renewable energy uptake in Zimbabwe.
In Zimbabwe, Chipango (2021) outlined the possible reasons why renewable energy might fail to end the energy crisis in Zimbabwe. Using a qualitative analysis, the paper suggested that socio-economic and political factors were possible factors responsible for making renewable energy not to end the energy crisis in Zimbabwe. However, there was not enough evidence to support the findings since these were based on the researcher’s perspective. The present paper provides enough evidence through a model for renewable energy technologies to alleviate the energy crisis in Zimbabwe. Makonese (2016) explored and outlines the development of renewable energy in Zimbabwe. The study discussed the prospects and the challenges to the promotion of the usage of renewable energy technologies in the country. The study identified policy and institutional barriers, technical barriers, financial barriers and socio-cultural barriers as challenges in the adoption of renewable energy in Zimbabwe. Creating a vibrant renewable energy market, legal framework, and the removal of import duties on the renewable energy technologies were suggested as ways to promote renewable energy uptake in Zimbabwe. Despite it shedding light on the subject, the study was not based on empirical evidence since it was a qualitative analysis. Therefore, the current study conducted a quantitative analysis, empirically based, to put forward an empirical model to enhance the supply of renewable energy technologies in Zimbabwe.
Given that renewable energy is a reliable and sustainable energy for the future, it is important to understand its main drivers and to draw robust policy implications for the energy sector. From the literature reviewed, most studies made use of panel data (Sisodia et al., 2015; Akintande et al., 2020) and qualitative analysis (Boucert, 2020; Chipango, 2021) to understand the factors that determine renewable energy uptake globally. However, there is a dearth of information on the main factors influencing the supply of renewable energy in Zimbabwe. Notwithstanding this front, this study differs from others in that it employed time series data to identify the variables influencing the production of renewable energy in Zimbabwe using the ARDL model.
4. Methodology
In line with the first objective of assessing the potential energy that Zimbabwe can obtain from renewable energy sources (hydro, solar, geothermal, wind and biomass) the study used a systematic literature review approach. The potential was determined from what the literature portrays in line with the megawatts that the nation can generate from renewable energy sources. Linked to the second objective stated in Section 1, the study borrowed factors influencing renewable energy uptake from the existing theories and empirical literature. Therefore, the theoretical and empirical models guided the study in putting forward a framework to enhance renewable energy uptake in Zimbabwe. According to the Accelerator theory, investment in the production of renewable energy technologies is a function of output. This implies that renewable energy supply in a country is a function of the national output of that nation. Mathematically this can be expressed in an equation as below:
where RES is the renewable energy supply and INCM is the national income.
Following the study by Opondo et al. (2021), who investigated the determinants of renewable energy consumption in SSA, the current study borrowed several variables (income, trade openness and education) as well as the ARDL model. The present study also considered other variables such as foreign direct investment, remittances, ZESA reliability, education level, private investment, public investment and price of electricity. Therefore, renewable energy uptake is expressed as a function of the above stated variables as below.
where RES = Renewable energy supply, INCM = Income level, REMT = Remittances, FDI = Foreign direct investment, PPP = Public Private Partnership, ZSRE = ZESA reliability, EDUC= Education level and TO = Trade openness.
RES = f (INCM, REMT, FDI, PPP, ZSRE, EDUC, TO) ……………1
Considering the drivers of renewable energy supply stated above, the following ARDL model (p,q…q) was specified:
In the case that cointegration exist, then the following Error Correction Model (ECM) will be estimated, otherwise an ARDL will be estimated:
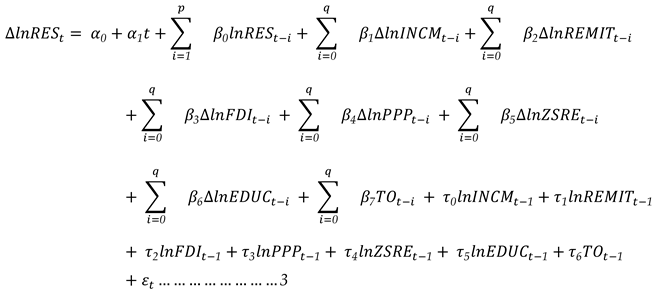
denotes the intercept, is the coefficient of the trend variable and trend variable is there to capture the effect of time, βs are short run coefficients, are long run coefficients and is a stochastic error term.
4.1. Variable Description
Renewable Energy Supply (RES)
Renewable energy refers to the energy that is obtained from resources that are naturally replenished on a human timescale, these include wind, biomass, solar, geothermal, and water energy are among them (Vainius, 2008). Due to excess demand of renewable energy in Zimbabwe, what is supplied equals to what is consumed. Therefore, the study used consumption as a measure of renewable energy supply. Many countries like Zambia, Kenya and South Africa are exploring the development of renewable energy as a way to reduce their reliance on hydro and thermal power for sustainable and reliable energy supply, also lowering greenhouse gas (GHG) emissions. Renewable energy technologies can reduce fuel costs and generate revenue for a nation, generating jobs for those in charge of project management, installation, and maintenance, as well as those in the supply chain. As a result, increased renewable energy supply improves the performance of the economy. As a dependent variable, the study used renewable energy consumption (% of total final energy consumption) as a proxy for renewable energy supply since it has been widely adopted by other scholars (Omri and Nguyen, 2014; Opondo, 2021).
Income Level
Income is the amount of money coming to a person or a corporation (usually interpreted as meaning annually) whether as payment for services or as interest or other profit from investment. According to the accelerator theory of investment, income is regarded as a key determinant of investment. A rise in the national income, as measured by gross domestic product (GDP), would result in proportional increase in capital investment spending. Investment expenditure escalates when either demand or income increases. When there is excess demand, the theory posits that companies typically choose to increase production, thereby increasing profits, to meet their fixed capital to output ratio. Investment is shown by way of increasing capital stock. Increase in the investment technologies of renewable energy will result in a rise in renewable energy supply. Therefore, a positive coefficient is expected from the national income variable. The study used GDP per capita as a proxy for income since the variable has been adopted by other scholars in their studies (Omoju, 2020; Opondo et al., 2021).
Remittances
The International Monetary fund (2020) remittances are defined typically as transfers from one person to another person and compensation of employees. Personal transfers consist of all current transfers in cash or in kind made or received by resident households to or from nonresident households. Compensation of employees refers to the income of border, seasonal, and other short-term workers who are employed in an economy where they are not resident and of residents employed by nonresident entities. Remittances capacitate both households and entities to afford the purchase of renewable energy technologies which then boost production of renewable energy. Therefore, a positive sign is expected from this variable. As a measure of remittances, the study used remittances expressed as a % of GDP. The variable has been widely used by other scholars (Das et al.,2021; Subramaniam et al., 2022).
Public Private Partnerships
Brock (2022) defined public-private partnerships (PPP’s) as cooperations between the government and private-sector companies to finance, build, and operate projects. They are long-term contracts between governments and private organizations to deliver public services or facilities. Private-public partnerships are a crucial tool for developing a thriving economy. They combine the agility and innovation of private businesses with the civic perspective offered by governments. Communities that use these collaborations well can gain a variety of advantages, including promoting energy sustainability initiatives, relieving traffic congestion, and boosting total employment development. Therefore, PPP’s increases the adoption of renewable energy technologies promoting more production hence, a positive coefficient is expected from the variable. The study adopted PPP Public private partnerships investment in energy measured in current US$ as a measure to the variable.
ZESA Reliability
According to World Bank (2023), 52.74% of the Zimbabwean population have access to grid electricity which probably implies that 47.26% uses alternative sources to grid electricity such as use of generators, firewood, energy from renewable sources etc. Kanambura (2019) alluded that ZESA Holdings is on the brink of collapse due to a plethora of problems, including rampant power theft, non-payment of electricity bills, vandalization of infrastructure, as well as insufficient foreign currency, as evidenced by explosive internal report. The above set of reasons are resulting in the majority of the local citizens not to be confident on the grid electricity hence forth switching to alternative sources. The failure of ZESA Holdings to supply adequate electricity may be considered as the source not to be reliable for both industrial and household use and if access is improved grid supply may be considered reliable. To capture ZESA reliability, the study used gap between the demand of grid electricity and the amount of electricity supplied in each year. If grid electricity is supplied in adequate amounts, then ZESA becomes reliable and the supply of renewable energy becomes low and if ZESA is not reliable than renewable energy uptake will be high. Therefore, a positive coefficient is expected from the variable. Despite the fact that other academics have not included the variable in their studies, this study regarded it as a pertinent variable.
Education Level
One of the key determinants of technological adoption is knowledge. Knowledge comes through many ways, for example campaigns and schooling. In the uptake of renewable energy, education perhaps plays a pivotal role in accelerating the usage of the technologies. Therefore, increased education level is perceived to widen the understanding of the greater advantage of adopting renewable energy technologies thus a positive coefficient is expected from the variable. The study adopted education completion rate for total lower secondary as a percentage of relevant groups, as a proxy to the variable. The variable was also employed by Opondo et al. (2021) in examining the determinants of renewable energy.
Trade Openness
Trade openness refers to the degree to which economic policies encourage or impede trade between nations (Zhang et al., 2021). For instance, if a nation adopts a policy of high trade tariffs, which reduces the appeal of international trade, other nations will be discouraged from exporting to that nation and accepting its imports. If a nation adopts a policy of low trade tariffs on renewable energy technologies, both households and industries will be encouraged to import the technologies hence increasing uptake of renewable energy. Therefore, the opening more for trade encourages production of renewable energy thus there is an anticipated positive relationship between trade openness and renewable energy uptake. Against this assertion, a positive sign is expected from the variable. The study used total trade measured as a percentage of GDP as a measure of trade openness. Zhang et al. (2021) also adopted the variable as a determinant of renewable energy.
Foreign Direct Investment
Foreign direct investment refers to the net inflows of investment to acquire a lasting management interest in an enterprise operating in an economy other than that of the investor (World Bank, 2023). FDI is a source of capital that enables firms to expand and it can be a source of innovation that encourages the move to renewable energy sources, which enhances energy efficiency. FDI may serve as a catalyst for new ideas that advance energy efficiency. Therefore, more FDI encourages production of renewable energy uptake, thus a positive sign is expected from the variable. The study adopted FDI expressed as a percentage of GDP as a measure of the variable. Doytch and Narayan (2016) also used FDI as a determinant of renewable energy.
The study used time series data covering the period of 1990 to 2021. The data for all the variables used were obtained from the World Bank.
4.2. ADRL Model Specification
This study applied the linear Autoregressive Distributed Lag (ARDL) bounds testing procedure proposed by Pesaran and Smith (1998), Pesaran et al. (2001) and was recently improved by Narayan (2005). This methodology has also been employed in other empirical studies for example Opondo (2021) who investigated the determinants of renewable energy uptake in SSA. The choice of ARDL bounds testing approach settles on its applicability in a model irrespective of whether the explanatory variables are I(0) or I(1) (Pesaran and Shin, 2001). Furthermore, the approach does not suffer from a considerable small sample bias (Mah, 2000) but necessarily pushes short-run dynamics into the residuals as in the Engle-Granger (1987) technique (Pattichis, 1999). In addition, it yields unbiased and consistent estimators regardless of endogeneity problems in the model and also it provides short run and long run effect of the independent variables. For the above reasons the ARDL approach was adopted in this study.
Error Correction Model
Error Correction Model (ECM) is an econometric model that captures the adjustment of economic variables towards long run equilibrium relationships. Only cointegrated variables have a long run relationship that calls for ECM since this implies that these variables will converge in the long run equilibrium. Therefore, if there is long run equilibrium among the variables in equation 2 then an error correction modelling will be determined.
4.3. Pre- and Post-Diagnostic Tests
Stationarity test is done to check for the existence of a unit root in time series data with the aim to avoid spurious regressions. A unit root is said to exist in a series if its mean, variance and covariance between two time periods do not vary overtime (Gujaratі, 2004). A very high R2 (in excess of 0.9) is obtained even if there is no meaningful relationship between variables if time series are not stationary (Gujarati, 2004). The existence of a unit root can be tested using the Augmented Dickey-Fuller (ADF) and Phillips Perron (PP) test. This study employs the ADF. The presence of a unit root implies that the variables are non-stationery and differencing was done to make them stationary. Multicollinearity is a situation where there is a perfect, exact, or linear relationship among some or all regressor variables in a model (Gujaratі, 2004). The problem of multicollinearity results in larger variances which will then affect the t- test, F- test and confidence interval leading in misleading conclusions. To detect multicollinearity the study adopts the pairwise correlation matrix approach where if the absolute pairwise coefficient value exceeds 0.8 then this signals the problem. As a remedy to the problem the study dropped correlated variables. Gujarat (2004) defined heteroscedasticity as a situation where the variance of the error term is not constant over time. Although the coefficients remain unbiased, heteroscedasticity causes estimates to be inefficient therefore the BLUE property if affected. Consequently, as a result of overstated standard errors, misleading test results and wider confidence intervals will be obtained. To test for the problem of heteroscedasticity this study employed Breusch-Pagan-Godfrey (BPG) test and general least squares is adopted as a remedy to the problem.
Model misspecification can be as a result of wrong functional form or omission of a relevant variable and therefore as a result bias and inconsistent coefficients are obtained. To check for model misspecification Ramsey RESET test is used in this study. The normality assumption is significant for confidence interval and hypothesis testing which usually follows a student t-distribution. The study employed the Jacque-Bera (JB) as a test for the normality assumption. Apart from normality this study checked for the validity of the F- test. A model is deemed valid if the results pass the F-test, which is positively associated with R-squared. The probability of the F-test is compared with 5% level of significance as a check for the validity of the whole model. R-squared is employed to test the goodness of fit of the regression model and at least 50% of economic growth should be explained by independent variables in the model.
5. Presentation and Analysis of Findings
5.1. Determining Renewable Energy Potential in Zimbabwe
Zimbabwe is one of the African countries with a potential to market and promote the development of renewable energy technologies in the region (Zimbabwe Energy Profile, 2023). The renewable energy comes in various forms not limited to hydro, wind, solar, biomass and geothermal.
According to the Country Energy Information Zimbabwe, the nation has a gross theoretical hydropower potential of approximately 18 500 GWh a year, the technically feasible potential being is approximated at 17 500 GWh per year, of which to date, less than 20% of this potential has been exploited. Although much of the power is generated at Kariba hydropower station, the potential still exists in other parts of the country such as Rusitu, Osborne (Manicaland), Mazvikadei dam (Mashonaland West), Manjirenji (Masvingo), Sebakwe dam (Midlands), Mzingwane dam (Matabeleland) and Lake Chivero (Harare) just to mention a few. To improve the country’s energy generation, mix solar energy is one alternative that the Zimbabwean government can exploit to improve electricity supply. Zimbabwe’s climate is ideal for the installation of solar panels because of its high radiation levels and abundance of sunshine, which result in an annual electricity potential of 359 kWh/m2 (Kuijik, 2012). The average solar insolation in the country varies between 5.7 and 6.5 kWh m-2 day-1. For the domestic sector, the potential for energy from solar PV and solar water heaters is 300 MW of which to date, only 1% is said to have been utilized. Solar water heaters are expected to reduce electricity demand by 27%, if 50% of the potential is exploited (Batidzirai et al., 2009).
The geothermal power potential in Zimbabwe was estimated to be at 50 MW/ year and to date, the nation has done nothing yet in terms of the resource exploitation. The rift valley, which has a significant potential for geothermal energy, is not far from Zimbabwe. Zimbabwe was among the first African countries to adopt the windmill water pump system that had not been harnessing electricity generation from renewable resources. Wind speeds in Zimbabwe were estimated at 3.5 m s-1 at a standard height of 10 m. According to the International Renewable Energy Agency (2020), most parts of Zimbabwe have for wind energy generation including the Eastern highlands, Matabeleland and Great dyke region. Bagasse has the potential to be used to produce electricity throughout the nation. After the sugar juice has been removed from the shredded sugar cane, the moist fiber known as bagasse is left behind. The moist fiber has a co-generation potential of 633 GWh/ year (International Renewable Energy Agency (2020). For every 5 million tonnes of sugarcane crushed from Triangle Limited and Hippo Valley Estates a total of 1 million tonne of bagasse can be collected. In a survey conducted in 2003, Hippo Valley Estates alone produced more electricity from the power plant than is necessary. The sugar industry can potentially generate 517 GWh of electricity per year for the nation.
Since the potential renewable energy that can be derived from each type of renewable energy has been determined, the study determined the factors that affect the production of renewable energy in Zimbabwe. The following was the descriptive statistics of the data used to determine the drivers of renewable energy production.
5.2. Descriptive Statistics
Table 2 presents a summary on the description of the data used in framing the framework to enhance renewable energy supply in Zimbabwe. The table shows that 40 observations were pulled from each variable from 1980-2020. The mean, maximum and minimum values were determined from the sample and renewable energy supply (RES) as total of final energy reached a maximum of 82.46% and a minimum of 62.38% during the course of the study. With regard to income (INCM) a maximum growth rate of 21.25% was recorded whilst remittances (REMIT) as a percentage of GDP reached a maximum of 13.61% during the study period. Foreign direct investment (FDI) in the country as a percentage of GDP reached a minimum and maximum of 0.45% and 6.94% respectively. A total of US$ 29730000000 was estimated as the highest value for Public private partnerships investment in renewable energy during the period of the study. The highest gap between the demand and supply of the grid electricity in percentage terms was estimated at approximately 71.9% whilst the lowest disparity was estimated at 47.25%, shown by the variable ZESA reliability (ZSRE). The population was highly educated during the course of the study as reflected by the highest literacy rate of 88.69% with a lowest value of 72.32%. Trade openness as a percentage of GDP reached a maximum of 109.52%. The data was then checked for stationarity and the findings are presented in the following Table 3.
Presented in Table 3 are the unit root tests results where it is indicated that renewable energy supply, remittances, ZESA reliability, education and trade openness were not stationary at 5% level and these variables were made stationary after the first difference highlighted by the order of integration I(1). With regard to income, FDI and private public partnership investments, since the p-values are less than 0.05 we reject Ho and conclude that the variables are stationary at 5%. These variables are integrated of order I(0). The variables were tested for multicollinearity and the findings were presented in Table 4 presented below:
4.4. Multicollinearity Test
Table 4 shows the pairwise correlation coefficients between the explanatory variables. Since there is no pairwise correlation coefficient above 0.8 there is not enough evidence to support the hypothesis of multicollinearity, therefore we conclude that the model is free from the problem of multicollinearity.
4.4. Graphical Relatiosnhip
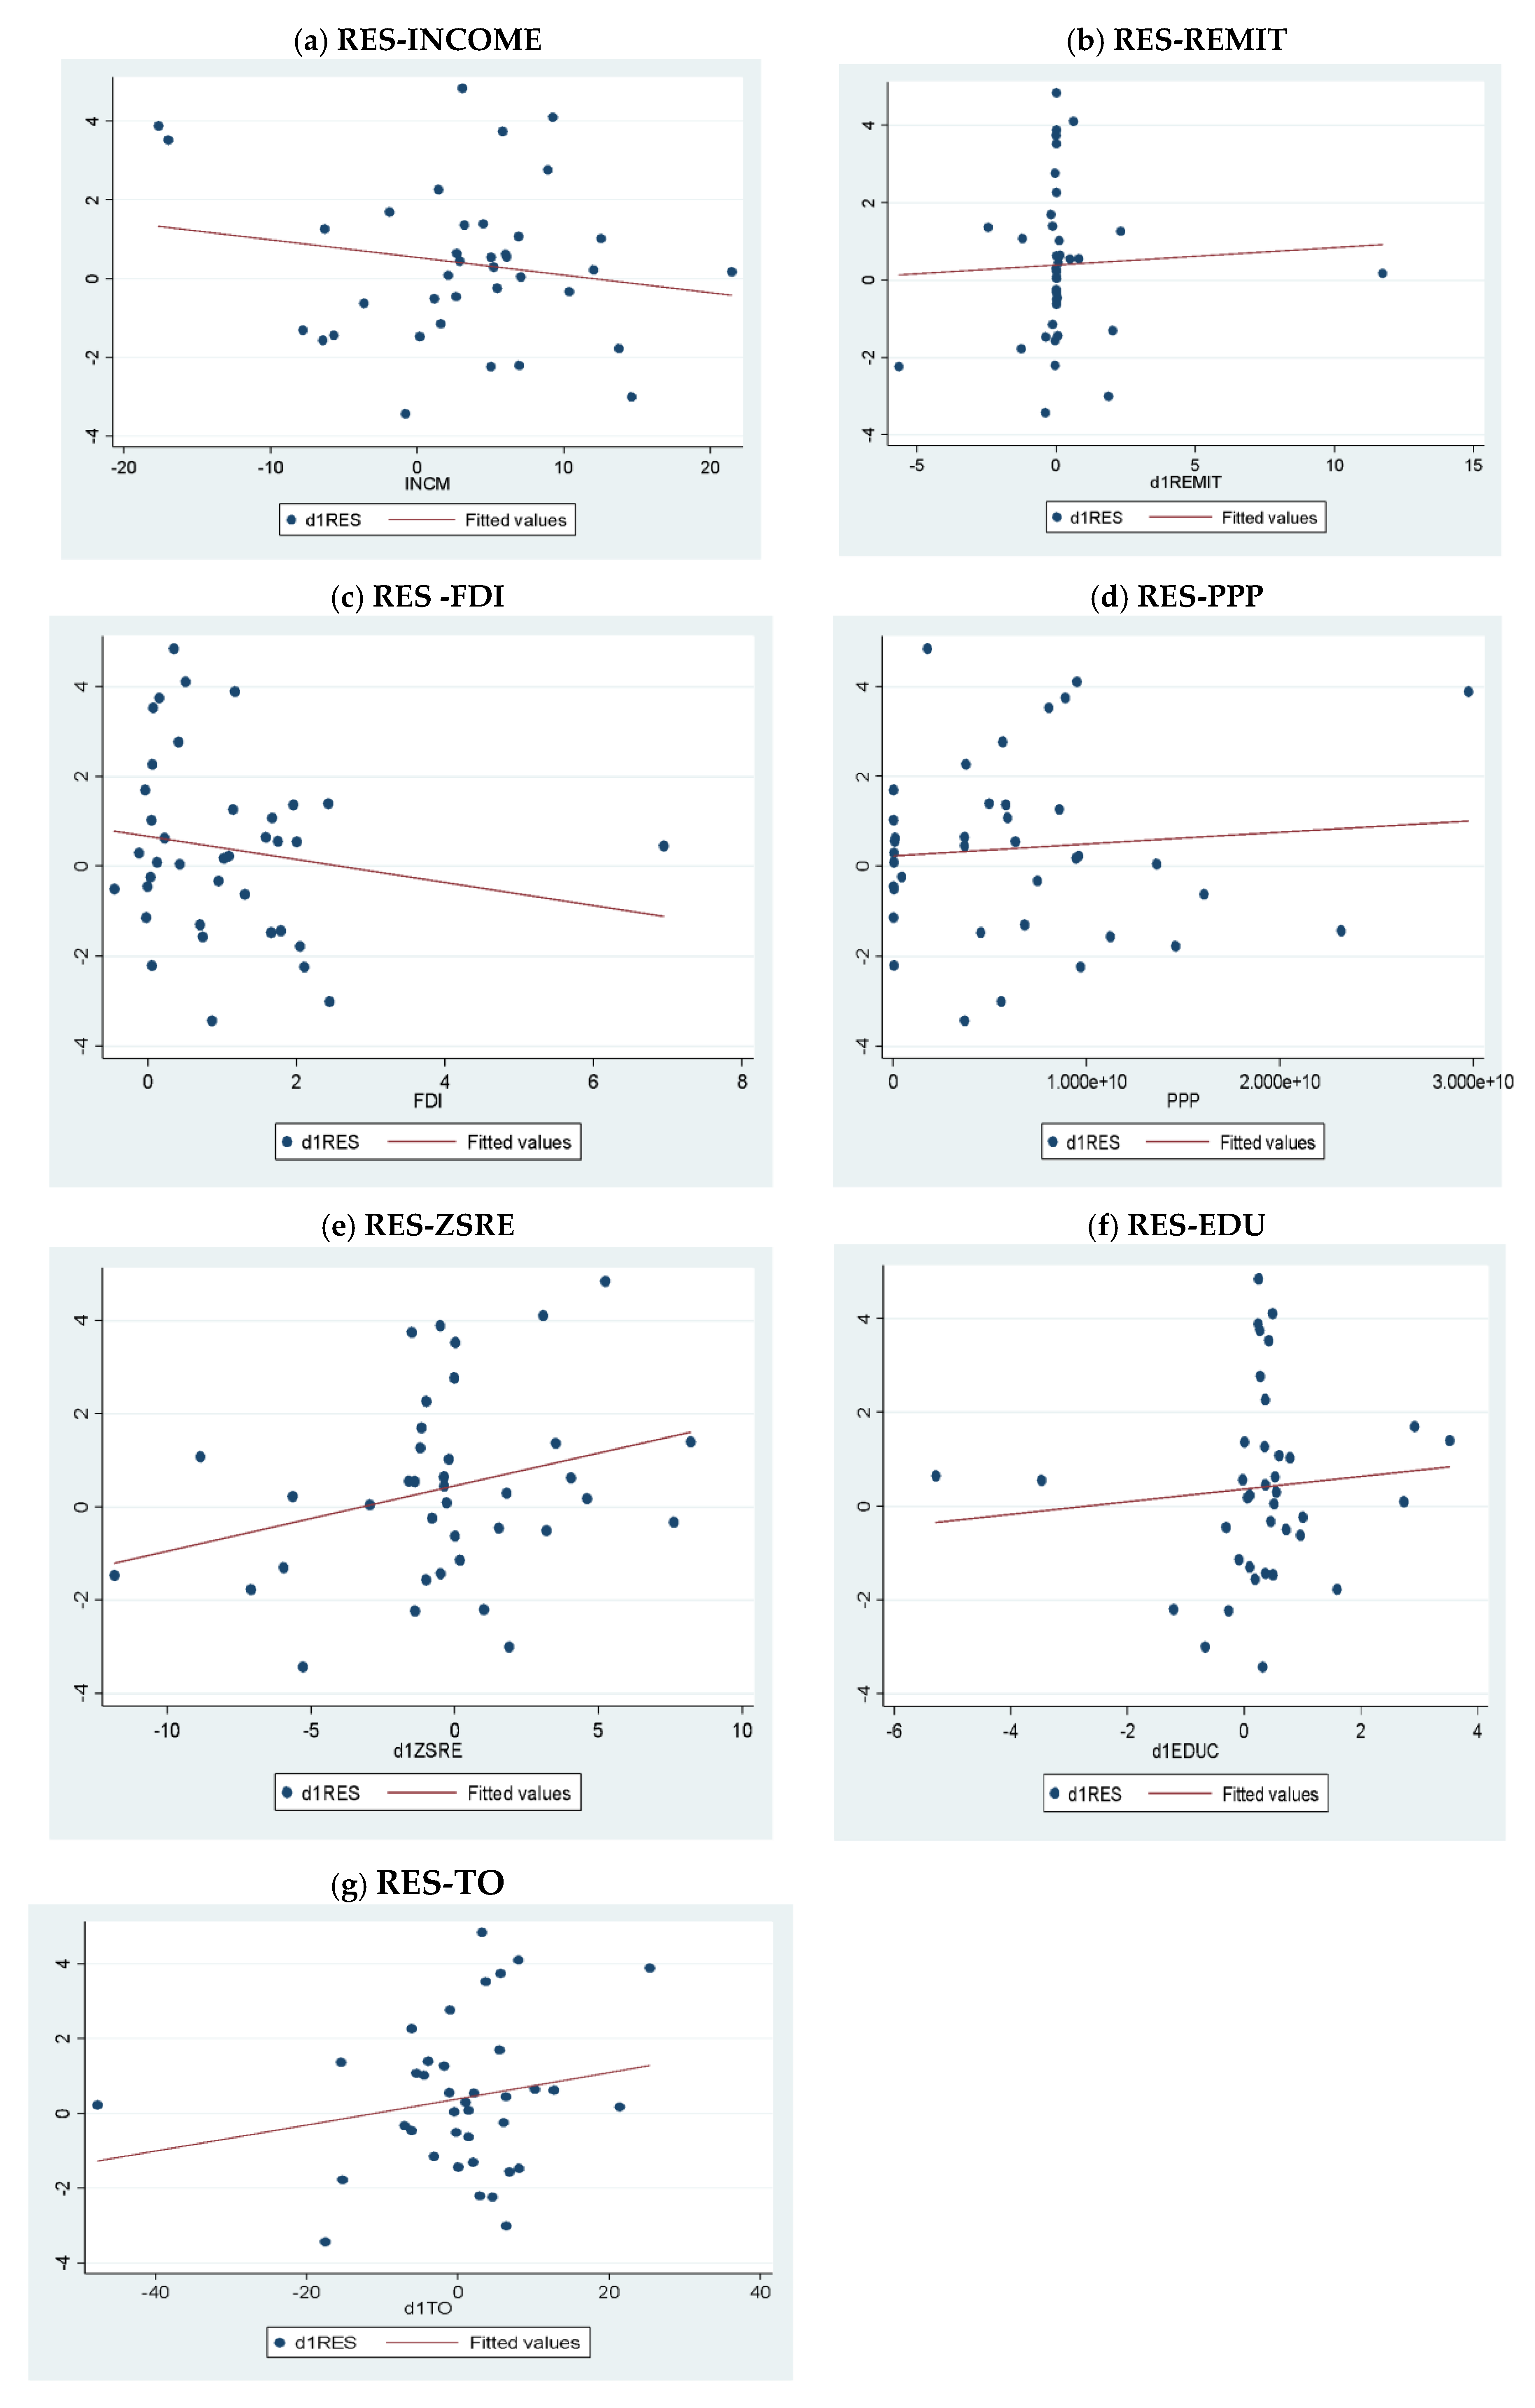
There is a positive relationship
Discussion of the scatter plots
- (a)
- There is a moderate negative linear relationship between renewable energy supply and income level.
- (b)
- There is a weak positive linear relationship between renewable energy supply and remittances.
- (c)
- There is a weak negative linear relationship between renewable energy supply and FDI.
- (d)
- There is a weak positive linear relationship between renewable energy supply and public private partnership investments.
- (e)
- There is a weak positive linear relationship between renewable energy supply and ZESA reliability.
- (f)
- There is a weak positive linear relationship between renewable energy supply and education level.
- (g)
- There is a moderate positive linear relationship between renewable energy supply and trade openness.
From the above conclusion’s income, FDI and ZESA reliability portrayed some relationships that are in contrast with the expected signs. However, although some variables portrayed some expected signs, the above scatter plots suffer from the limitation that they do not give some quantitative measure on the relationship. Therefore, an ARDL was estimated to quantify the relationship between renewable energy supply and the explanatory variables in the model.
4.6. ARDL REGRESSION RESULTS
Table 6 shows the estimated ARDL model with a lag selection of ARDL (4,4,4,4,1,0,0,0) selected depending on the least AIC. The findings show that there are significant effects of the lags of some of the macroeconomic variables on renewable energy production. Only the second lag of renewable energy supply was significant in explaining renewable energy production whilst both remittances and its first lag was significant at 10% level. ZESA reliability was significant at 5% level whilst both its second and forth lag was highly significant (at 1% level) in explaining renewable energy production in Zimbabwe. With regard to education itself, the first three lags were significant in determining renewable energy production. Income and public private partnership investment were significant at 5% level whilst foreign direct investment was significant at 1% level in determining renewable energy production in the country. However, trade openness showed not to explain renewable energy production in Zimbabwe. An adjusted R-squared of 82% reflects that 82.33% of renewable energy production in Zimbabwe are being explained by the combined significant explanatory variables in the model. The variables were tested for cointegration to determine if there is a long-run relationship between renewable energy supply and the explanatory variables and the following findings were determined:
5.2.1. Testing for Cointergration
H0: no levels relationship
F-statistic= 16.505
Table 7 shows the findings from the bounds test which tested a null hypothesis that; there is no long-run relationship between renewable energy production and the explanatory variables. Comparing the value of F-statistics, case 1: if this value is lower than the I(0) coefficients we fail to reject the null hypothesis and conclude that there is no long rum relationship, case 2; if this value is greater than I(1) the coefficients we reject the null hypothesis and conclude that can there is long-run relationship, and case 3; if this value lies between two bounds it will be inconclusive. Since the value of F-statistics is greater than all the upper bound I(1) coefficients we reject the null hypothesis and conclude that there is a long-run relationship at all levels of significance i.e at 1%, 5%, and 10%. Therefore, an error correction ARDL model was regressed and the following findings were determined.
5.2.2. Error Correction Model
The Error Correction Term (ECT) shows how much of the disequilibrium is being corrected, that is, the extent to which any disequilibrium in the previous period is being adjusted in current point. A positive coefficient indicates a divergence, while a negative coefficient indicates convergence. The above model shows a negative coefficient of -1.926 which is significant at 1% level indicating convergence. The estimate of the ECT implies that the adjustment from short run to long run is instantaneous and is in full. In addition, the findings also show that remittances, ZESA reliability, income, foreign direct investment, education and public private partnership investment significantly explain renewable energy production in the long-run. The model was diagnosed for heteroscedasticity problem, autocorrelation problem, normality and stability, the findings were presented in Table 9.
Table 9 presents the findings from the heteroscedasticity test, autocorrelation test, normality test and model specification test. Heteroscedasticity problem was tested using the White test and since the p-value from the White test (0.4140) is above 0.05 we fail to reject the null hypothesis of homoscedasticity and conclude that the variances are homoscedastic (constant). Using the Breusch Godfrey Serial Correlation Test, the p-value of 0.4470 also leads to the failure to reject the null hypothesis which says there is no autocorrelation concluding that the model is free from autocorrelation problem. The Jarque-Bera (JB) test was used to check for normality of the residuals, the p-value (0.9512) found highly confirms that normality of residuals as we fail to reject the null hypothesis that residuals are normally distributed at 5% level. The model satisfied all the diagnostic tests therefore the error correction model regression was explained below. The model was correctly specified as shown by the p-value of above 0.05.
5.3. Interpretation of the Error Correction Model Findings
5.3.1. Long Run Impact of Variables
Remittances was identified as one of the key drivers of renewable energy production in the long run. The long run coefficient of remittances was positive and statistically significant at the 1% level. The positive sign of remittances corresponds to the expected sign mentioned in chapter three. Table 10 shows that a unit increase in remittances increases the production of renewable energy by 1.58. This demonstrates that a remittance plays a crucial role in promoting renewable energy production. This is due to its impact in capacitating households to be able to purchase renewable energy technologies such as solar panels, batteries and inverters there by easing the energy crisis in the country. These findings correspond to the null hypothesis stated in chapter one and consistent with prior investigations (Das et al.,2021; Subramaniam et al., 2022).
Another key determinant of renewable energy production was ZESA reliability in the long run. The long run coefficient of ZESA reliability was positive and statistically significant at 5% level. However, the sign of the coefficient was in contrast with the expected sign stated in the previous chapter. As presented in Table 10 a unit increase in the reliability of ZESA increases the production of renewable energy by 0.55 units. In other words, if the gap between supply and demand of electricity approaches zero in the long run then more people will produce renewable energy most likely because of lack of confidence in ZESA and households and anticipate an increase in electricity rates thereby still need to produce more energy from renewable energy. Adding on, if ZESA becomes more reliable the prices of renewable energy technologies will fall which may as well attract more customers who favor clean energy. The findings correspond to the scatter plots.
Education showed that it plays a crucial role in promoting the production of renewable energy in Zimbabwe. The long run coefficient of education was negative and statistically significant at 1% level which contrasting the expected sign stated in chapter three. A unit increase in literacy rate led to a fall in the production of renewable energy by 3.14 in the long run. A possible explanation to this is that as time goes being more educated may not lead to the promotion of renewable energy production rather the adoption of renewable energy technologies may fall due to fact that the educated ones prefer conventional electricity since once installed, they last for life rather than depending on solar which may attract high maintenance costs and recondition of batteries and other equipment. The findings are in contrast with what other studies found (Opondo et al. 2021).
Findings showed that income is also negatively related to renewable energy production in the long run. The long run coefficient of income was negative and statistically significant at 10% level. The findings showed that a unit increase in income in the long run reduces renewable energy production by 0.073 units. These findings are in contrast with what was expected since increase in income is anticipated to increase renewable energy. However, a possible explanation to this is that in the long run people will be holding more income with the zeal not to adopt renewable energy supply but rather having electricity from ZESA and this is will be caused by the fact that the high-income earners will prefer and afford to stay in areas where electricity is always available. The findings are in line with the findings of Omoju (2020) and in contrast with the findings of Opondo et al., (2021) who found a positive effect of income on renewable energy production.
Regarding foreign direct investment, a negative long run coefficient was also determined. The coefficient was statistically significant at 1% level. A unit increase in foreign direct investment reduces the production of renewable energy by 2.22. The sign of the coefficient is not in line with the expected sign stated in the previous chapter. The findings showed that in the long run companies and individuals investing in Zimbabwe will no prefer to use renewable energy since all the installations would have taken place in the short run as a way to curb electricity challenge entailing that in the long run the potential investors would prefer and expect the government to have solved the energy crisis.
5.3.2. Short Run Impact of Variables
The first lag of renewable energy supply was statistically significant in explaining renewable energy production in Zimbabwe. The variable was statistically significant at 5% level. A unit increase in previous year’s renewable energy production increases the current renewable energy by 1.11units. This is because those who used renewable energy in the previous year would have yielded positive results in terms of production, and quality of life which will then lure other companies and households to adopt renewable energy as a source of energy in the short run where there is electricity crisis. Remittances and its lags showed to have a negative impact and the coefficients were statistically significant at 1 % level. A unit increase in remittances reduces renewable energy production by 2.58 whilst previous year’s remittances reduce renewable energy production by 2.23 and that of the third-year lead showed to reduce renewable energy production by 1.32. This implies that in the short run remittances will not boost renewable energy production entailing that remittances will be channeled towards other areas and sectors other than in the production of renewable energy. ZESA reliability negatively affects renewable energy production in the short run. The coefficient of ZESA reliability and its first three lags were statistically significant at 1% level. A unit increase in the reliability of ZESA reduces the production of renewable energy by 1.33 whilst its third lag reduces renewable energy supply by 0.96 units. This implies that when the gap between demand and supply of electricity goes down households and companies will no longer prefer renewable energy since ZESA will be more reliable. This conforms to the expected sign stated in chapter three.
In the short run education showed to play a greater impact in promoting the promotion of renewable energy production. The coefficient of education was statistically significant at 1% level. A unit increase in education increases renewable energy production by 3.69. The findings conform the expected sign stated in the previous chapter since increased education level is perceived to widen the understanding of the greater advantage of adopting renewable energy technologies. The findings are in line with those of Opondo et al. (2021).
6. Summary, Conclusion and Policy Recommendation
The study presented an empirical ARDL model, putting forward a framework to enhance renewable energy production in Zimbabwe. The study specified a model with seven independent variables namely income, remittances, foreign direct investment, ZESA reliability, education level, public private partnership investment and trade openness, renewable energy production being the dependent variable. Time series data from the period of 1980 to 2020 was employed and the data for the variables was obtained from the World Bank database. All tests and estimations were done using STATA 15 statistical software. The ARDL model used in the study passed the cointegration test for long run relationship therefore an Error Correction Model was estimated. The long run and short run results were portrayed and the model passed all the post diagnostic tests. Renewable energy production was positively related to remittances, ZESA reliability and public private partnerships whilst it was negatively impacted by education, income and foreign direct investment in the long run. Whereas in the short run renewable energy supply in the previous year and education positively impacted renewable energy production while remittances and ZESA reliability negatively affected renewable energy production.
Remittances was identified as one of the key drivers of renewable energy production. In the long run a unit increase in remittances increases the production of renewable energy by 1.58. This demonstrates that a remittance plays a crucial role in promoting renewable energy production. This is due to its impact in capacitating households to be able to purchase renewable energy technologies such as solar panels, batteries and inverters there by easing the energy crisis in the country. These findings correspond to the null hypothesis stated in chapter one and consistent with prior investigations. ZESA reliability was also found to increase renewable energy supply in the long run. A unit increase in the reliability of ZESA increases the production of renewable energy by 0.55 units. If the gap between supply and demand of electricity approaches zero in the long run then more people will produce renewable energy most likely because of lack of confidence in ZESA and households and anticipate an increase in electricity rates thereby still need to produce more energy from renewable energy. If ZESA becomes more reliable the prices of renewable energy technologies will fall which may as well attract more customers who favor clean energy.
In the short run renewable energy production is driven by the renewable energy produced in the previous year and education. The amount of renewable energy production increases by 1.11 units for every unit more renewable energy was produced the previous year. This is because in the near term, when there is a power problem, adopting renewable energy as a source of energy may entice other businesses and households. Those that used renewable energy in the previous year would have produced favorable results in terms of production and quality of life. With regard to education, it was shown to boost renewable energy generation by 3.69 units. The results are in line with what was anticipated given that higher education levels are thought to raise awareness of the benefits of implementing renewable energy technologies.
6.1. Policy Implications
Improve Systems of Cross Border Migration
The findings of this study indicated that remittances are an essential tool that can be used to boost renewable energy production. This study has a policy implication that Zimbabwe’s government must create a conducive climate for increased remittances. Systems of cross-border migration must be given top priority by policymakers if they are to boost the economies of emerging countries. Legal, smart, safe, and egalitarian systems of cross-border migration should be prioritized by governments across the board since they will strengthen the economies of emerging countries. Developing the ability for the money they send home to be converted into profitable investments and contribute to everyone’s economic growth is equally crucial.
Embark on Awareness Programs
They found out that education is one of the important tools that can be used to harness renewable energy production in the short-run. Therefore, it has been observed that people lack knowledge and experience in operating these energy technologies. The study recommends the Government agencies in collaboration with NGOs, communities and international agencies should embark to promote awareness of renewable energy technologies. These initiatives include campaigns such as free demonstrations regarding the use and benefits of renewable energy technologies which should be facilitated by trained and experienced personnel. Also, the government should structure programs to invite developers and inform them about the different programs and support mechanisms, financing provisions, and other incentives and programs. The findings of the study validate one of the suggested pillars by the National Renewable Energy Policy of Zimbabwe to raise awareness in order to.
Facilitate the Production Renewable Energy in Short Run
The study also found out that in the short run ZESA reliability reduces renewable energy production whilst it increases renewable energy in the long run. This implies that if the gap between the demand and supply of electricity is large renewable energy will be demanded and supplied more in the short run. Therefore, since currently the gap between demand and supply of electricity is high, there are going to be more acquisitions of renewable energy technologies to increase the production of the energy. The acquisitions may be abroad or local, therefore to facilitate this the government should exempt relevant taxes and other costs that may limit acquisitions. The government should also offer subsidies to those that may need to embark on massive renewable energy projects because they have potential to sell to the national grid. Despite facilitating the production of renewable energy, the government should take the short run period as a period to revamp other stations for non-renewable energy such as coal power stations to ease the energy crisis.
Prioritize Renewable Energy Production in the Long Run
However, beyond just facilitating, in the long run the government should embark on accelerating the production of renewable energy. In the long run even if the gap between supply and demand of electricity is very high the study discovered that renewable energy production will fall. Therefore, in the long-run, the government is recommended and mandated to prioritize more programs like Rural Electrification be funded more to continue to better improve the electrification levels in rural areas through renewable energy.
Attract Large Public Private Partnership Investments (PPP)
Public private partnerships have been identified also as the key driver of renewable energy production. Zimbabwe as a nation should attract large public private partnership investment in renewable energy. Chan and Kyei (2016) discovered that public private partnerships can be attracted by political stability, governments positivity towards the private sector, strong legal framework and more accessibility to financial markets whilst Li etal. (2005) discovered that government guarantees also lure the private sector since it raises the confidence level of private investors. In the long run the government should not depend much on income, foreign direct investment and education as drivers of renewable energy production as they may adversely affect the production of renewable energy. However, strong institutions in favor of renewable energy production should be in place such that more investment in renewable energy is enhanced.
6.2. Areas for Further Study
The study provided a framework to enhance renewable energy production in Zimbabwe, however future studies may investigate other factors outside the model of this study, that may accelerate the renewable energy production.
References
- Akintande, A., (2020). Modeling the determinants of renewable energy consumption: Evidence from the five most populous nations in Africa. Energy Journal, Volume, 206, pp117992, issn: 0360-5442. [CrossRef]
- Au, Y. A, & Zafar, H. (2008). A Multi-Country Assessment of Mobile Payment Adoption. In Working Paper SERIES.
- Bourcet C. (2020). Empirical determinants of renewable energy deployment: A systematic literature review. Energy Economics. Vol 85, pp 104563.
- Chen, L. Da, & Tan, J. (2004). Technology adaptation in E-commerce: Key determinants of virtual stores acceptance. European Management Journal. [CrossRef]
- Caver,N., (2023). Climate change and its Impact: Energy Outlook and Energy Saving Potential in East Asia 2020, Jakarta.
- Chipango, E.F., (2021). Why renewable energy won’t end energy poverty in Zimbabwe. Academic rigour, journalistic flair.
- s, A.K., McFarlane, A., & Carels, L. (2021). Empirical exploration of remittances and renewable energy consumption in Bangladesh. Asia-Pacific Journal of Regional Science, 5, 65 - 89.
- Doytch, N., & Narayan, S.W. (2016). Does FDI influence renewable energy consumption? An analysis of sectoral FDI impact on renewable and non-renewable industrial energy consumption. Energy Economics, 54, 291-301.
- Dwivedi, Y. K., Rana, N. P., Chen, H., & Williams, M. D. (2011). A meta-analysis of the unified theory of acceptance and use of technology (UTAUT). IFIP Advances in Information and Communication. [CrossRef]
- Fatima N, Li Y, Ahmad M, Jabeen G, Li X. Factors influencing renewable energy generation development: a way to environmental sustainability. Environ Sci Pollut Res Int. 2021 Oct;28(37):51714-51732. . Epub 2021 May 14. [CrossRef] [PubMed]
- Government of Zimbabwe (2022). Zimbabwe’s Intended Nationally Determined Contribution (INDC) Submitted to the United Nations Framework Convention on Climate Change (UNFCCC). https://unfccc.int/sites/default/files/NDC/2022-06/Zimbabwe%20First%20NDC.pdf.
- Government of Zimbabwe (2019). National Adaptation Plan: Roadmap for Zimbabwe. https://napglobalnetwork.org/resource/national-adaptation-plan-nap-roadmap-for-zimbabwe/.
- International Renewable Energy Agency (2022). Energy Profile Zimbabwe: https://www.irena.org//media/Files/IRENA/Agency/Statistics/Statistical_Profiles/Africa/Zimbabwe_Africa_RE_SP.pdf.
- Jean, T. (2020). “Zimbabwe: Tatanga and Sable Chemicals agree on a 50 MWp solar power station”. Paris, France: Afrik21.africa.
- Jean, M.T. (2022). “Zimbabwe: Kibo Energy takes over 100 MWp solar project in Victoria Falls”. Afrik21.africa. Paris, France.
- Kamalad, S. (2021), ‘Thailand Country Report’, in Han, P. and S. Kimura (eds.), Energy Outlook and Energy Saving Potential in East Asia 2020, Jakarta: ERIA, pp.270-280.
- Makonese, T. (2016). Renewable energy in Zimbabwe. Research Gate. 1-9. 10.1109/DUE.2016.7466713.
- Mita, B., Sefa A.C., Sudharshan, R.P. (2017). The dynamic impact of renewable energy and institutions on economic output and CO2 emissions across regions, Renewable Energy,Volume 111, Pages 157-167, ISSN 0960-1481, . [CrossRef]
- Murshed M. (2020). An empirical analysis of the non-linear impacts of ICT-trade openness on renewable energy transition, energy efficiency, clean cooking fuel access and environmental sustainability in South Asia. Environ Sci Pollut Res Int. Vol (29). [CrossRef]
- Ministry of Energy and Power Development (2019). National Renewable Energy Policy. Zimbabwe-RE-Policy-2019.pdf (acecdn.net).
- Ministry of Energy and Power Development (2019). Independent Power Producers: National Renewable Energy Policy. Zimbabwe-RE-Policy-2019.pdf (acecdn.net).
- Mbohwa, C (2023). Zimbabwe: An Assessment of the Electricity Industry and What Needs to Be Done. The Electricity Journal. Vol15,(7). Pg 82-91. ISSN 1040-6190. [CrossRef]
- Oshlyansky, L., Cairns, P., & Thimbleby, H. (2007). Validating the Unified Theory of Acceptance and Use of Technology (UTAUT) tool cross-culturally. People and Computers XXI HCI.But Not as We Know It - Proceedings of HCI 2007: The 21st British HCI Group Annual Conference, 2(September). [CrossRef]
- Omri A. and Nguyen D. K. (2014). On the determinants of renewable energy consumption: International evidence. Energy. Vol (72), 1, Pages 554-560.
- Omoju E. O., Okonkwo U. J. and Lin B. (2020). Factors influencing renewable electricity consumption in China. Renewable and Sustainable Energy Reviews. Vol 55, Pages 687-696.
- Robert, T. (2021). “Belarus Investors Win Tender For 100 Megawatt Solar Plant”. NewZimbabwe.com. Harare.
- Subramaniam, Y., Masron, T.A., & Loganathan, N. (2022). Remittances and renewable energy: an empirical analysis. International Journal of Energy Sector Management.
- Sisodia G.S, Soares I. (2015). Panel data analysis for renewable energy investment determinants in Europe. Applied Economics Letters, 22(5), 397-401.
- Sisodia et al.(2015). Does the use of Solar and Wind Energy Increase Retail Prices in Europe? Evidence from EU-27. Energy Procedia vol 79 pp506 – 51.
- Schillewaert, N., Ahearne, M. J., Frambach, R. T., & Moenaert, R. K. (2005). The adoption of information technology in the sales force. Industrial Marketing Management.
- World Bank. (2023). Indicators | Data (worldbank.org).
- United Nations (2023). Climate Change 2023: Synthesis Report. Climate Change 2023: Synthesis Report | UNEP - UN Environment Programme.
- United Nations (2022). COP27: Delivering for people and the planet | United Nations: https://www.un.org/en/climatechange/cop27.
- Venkatesh, V. (2016). The Unified Theory of Acceptance and Use of Technology: A SYNTHESIS AND THE ROAD AHEAD. International Journal of Sociotechnology and Knowledge Development, 17(5), 328– 376. [CrossRef]
- Zhang, Mingming & Zhang, Shichang & Lee, Chien-Chiang & Zhou, Dequn, 2021. Effects of trade openness on renewable energy consumption in OECD countries: New insights from panel smooth transition regression modelling. Energy Economics, Elsevier, vol. 104(C).
Figure 1.
Electricity Generated from Coal and Hydro sources and Renewable sources. Source: World Bank (2023).
Figure 1.
Electricity Generated from Coal and Hydro sources and Renewable sources. Source: World Bank (2023).
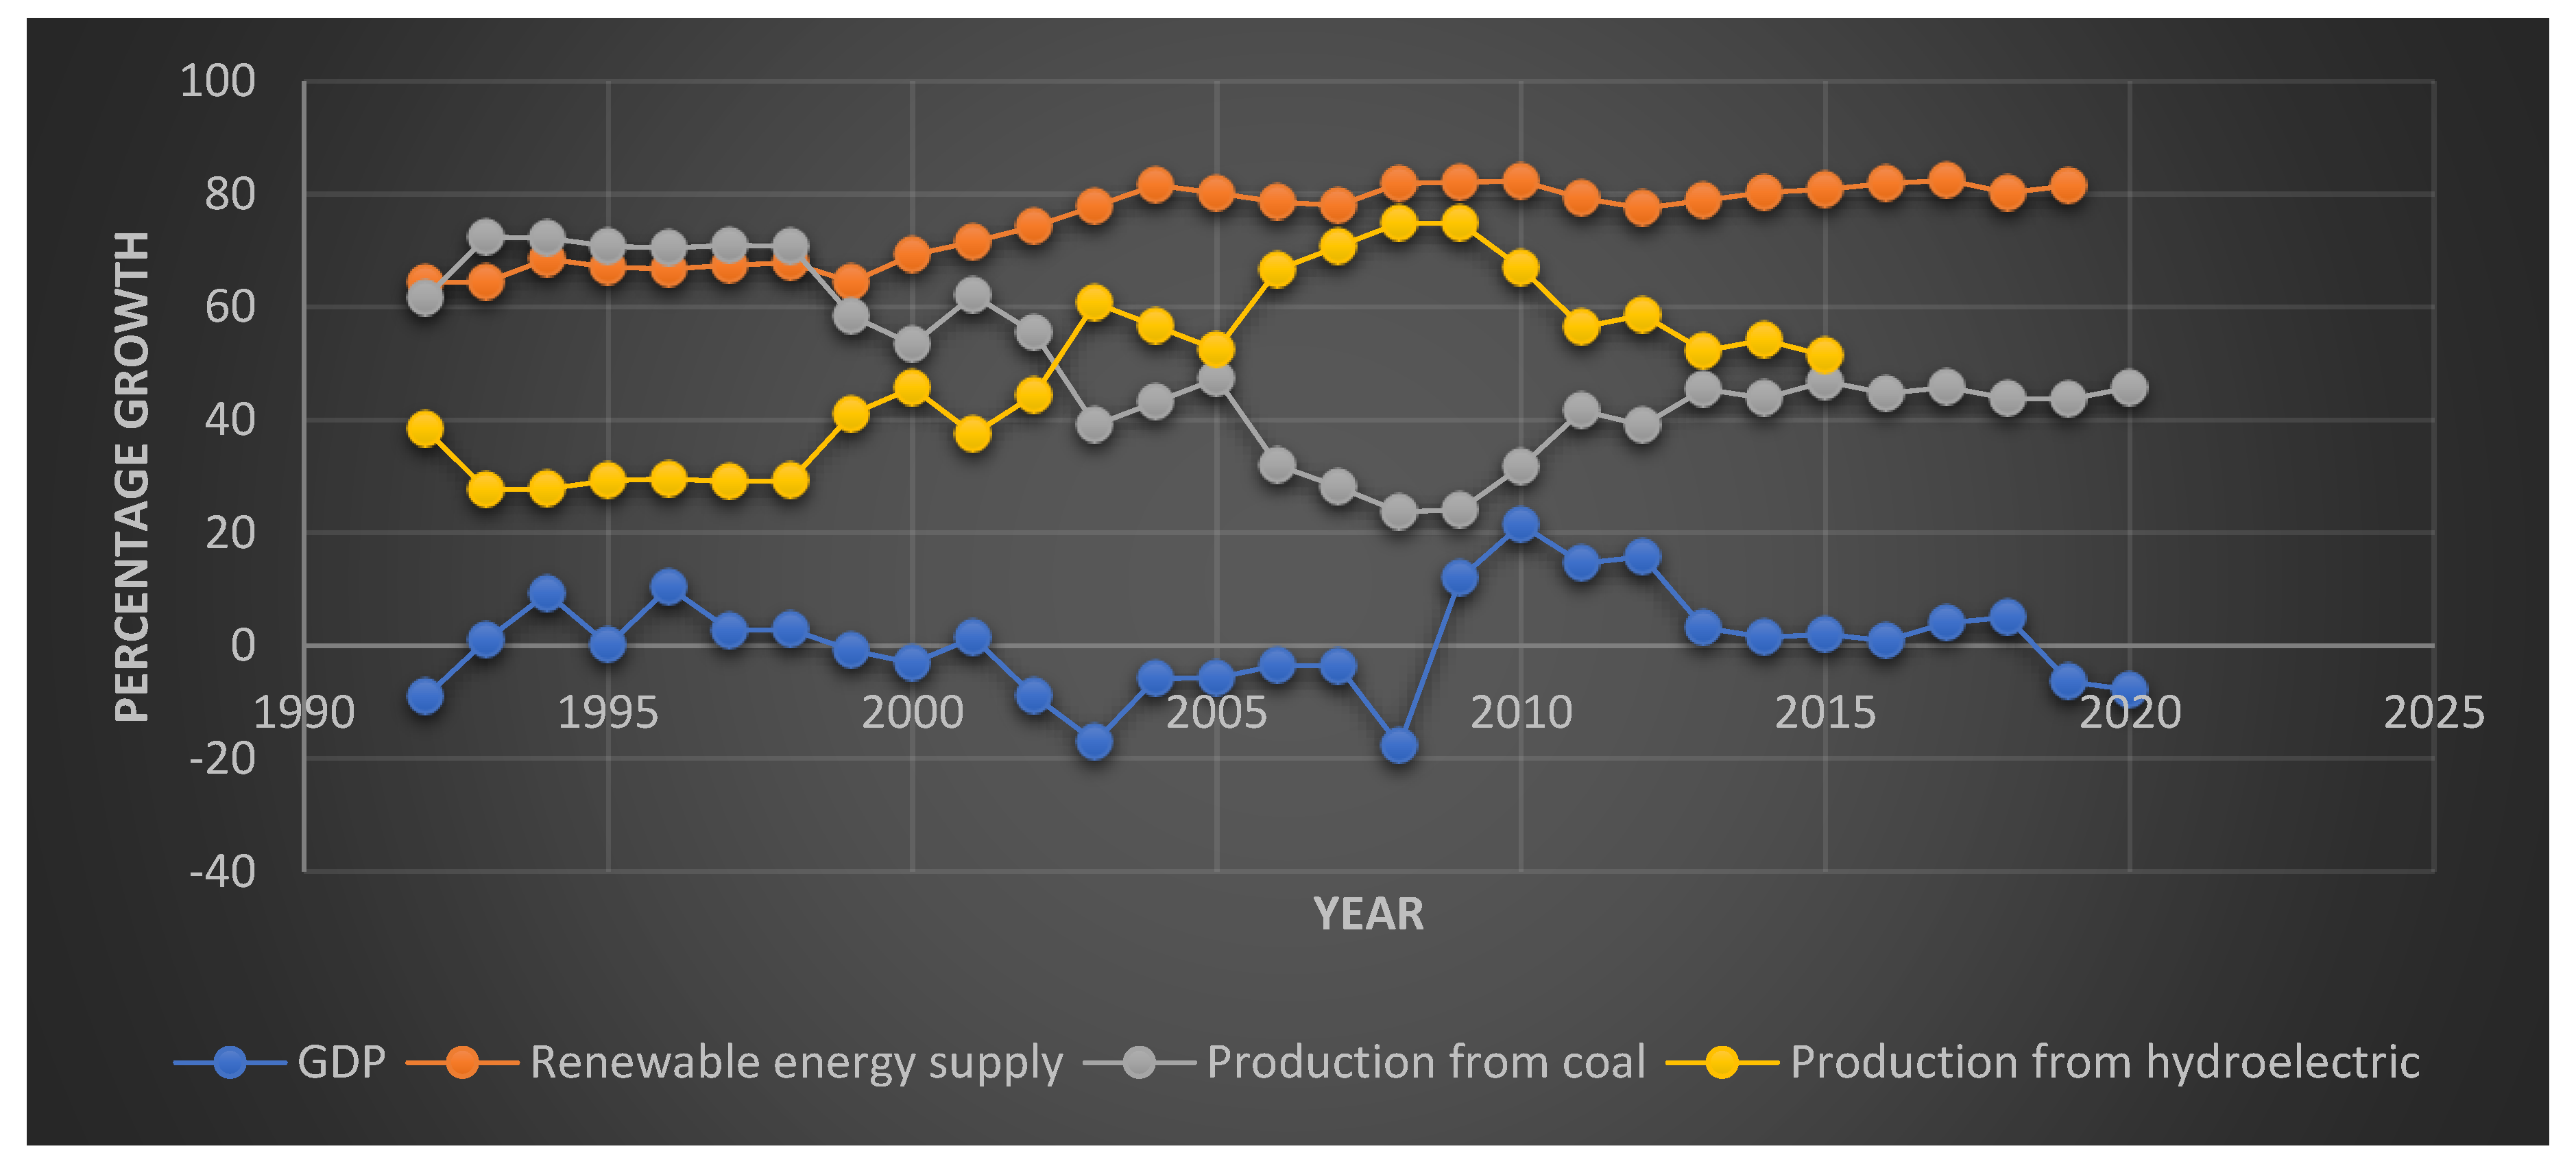
Figure 2.
Electricity Generated from Renewable Sources in 2020. Source: International Renewable Energy Agency (2022).
Figure 2.
Electricity Generated from Renewable Sources in 2020. Source: International Renewable Energy Agency (2022).
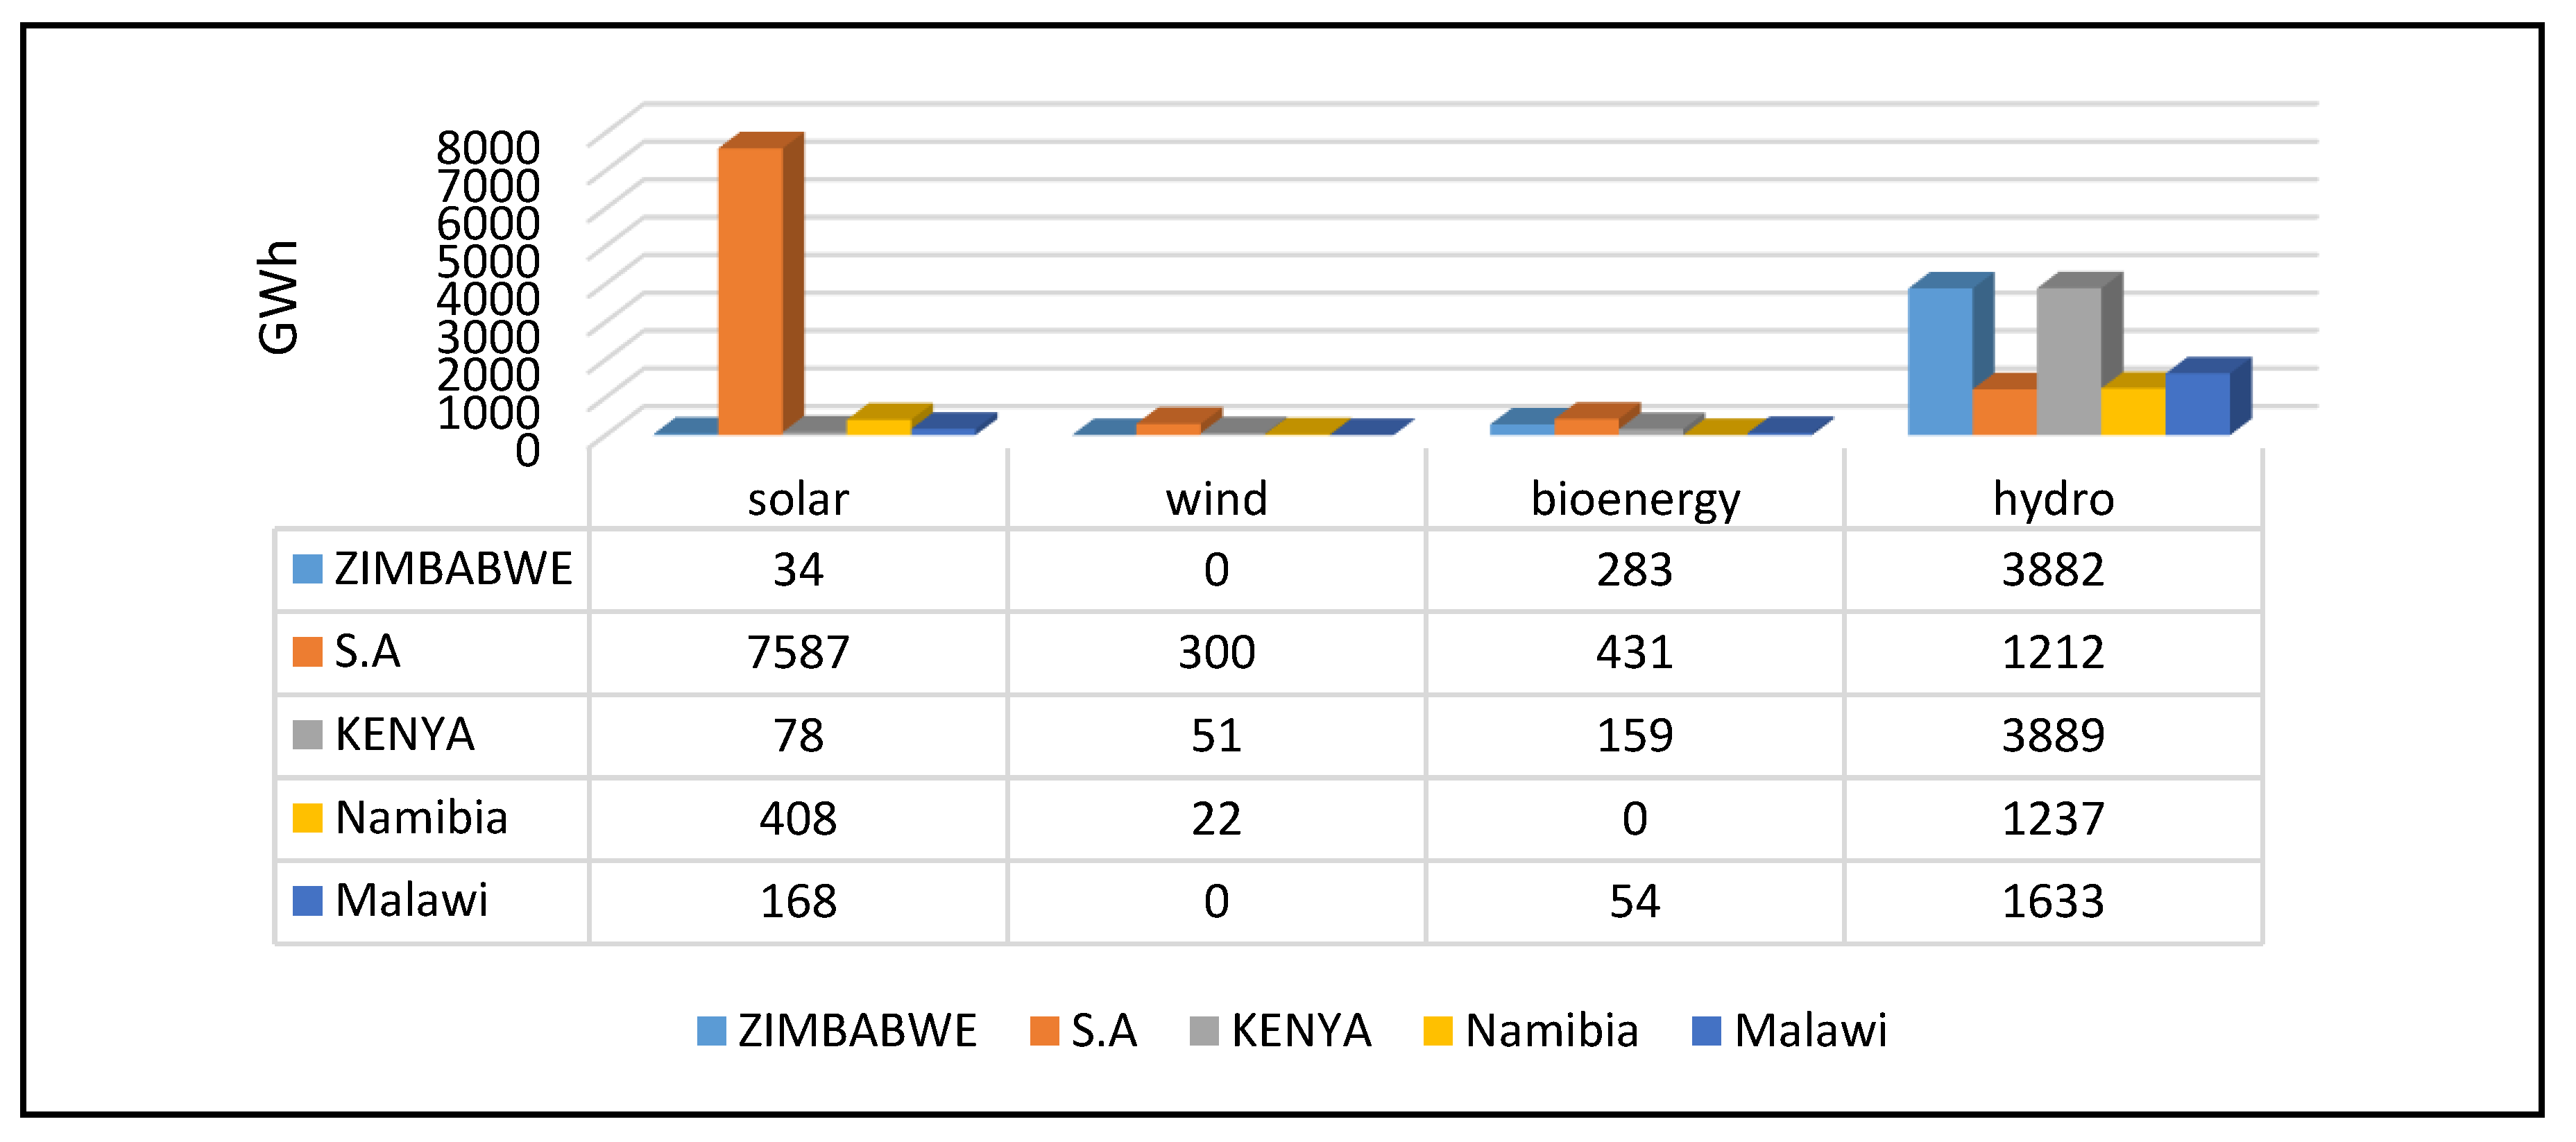
Figure 3.
Share of Renewable Energy in National Electricity Generation. Source: MoEPD and International Renewable Energy Agency (2022).
Figure 3.
Share of Renewable Energy in National Electricity Generation. Source: MoEPD and International Renewable Energy Agency (2022).
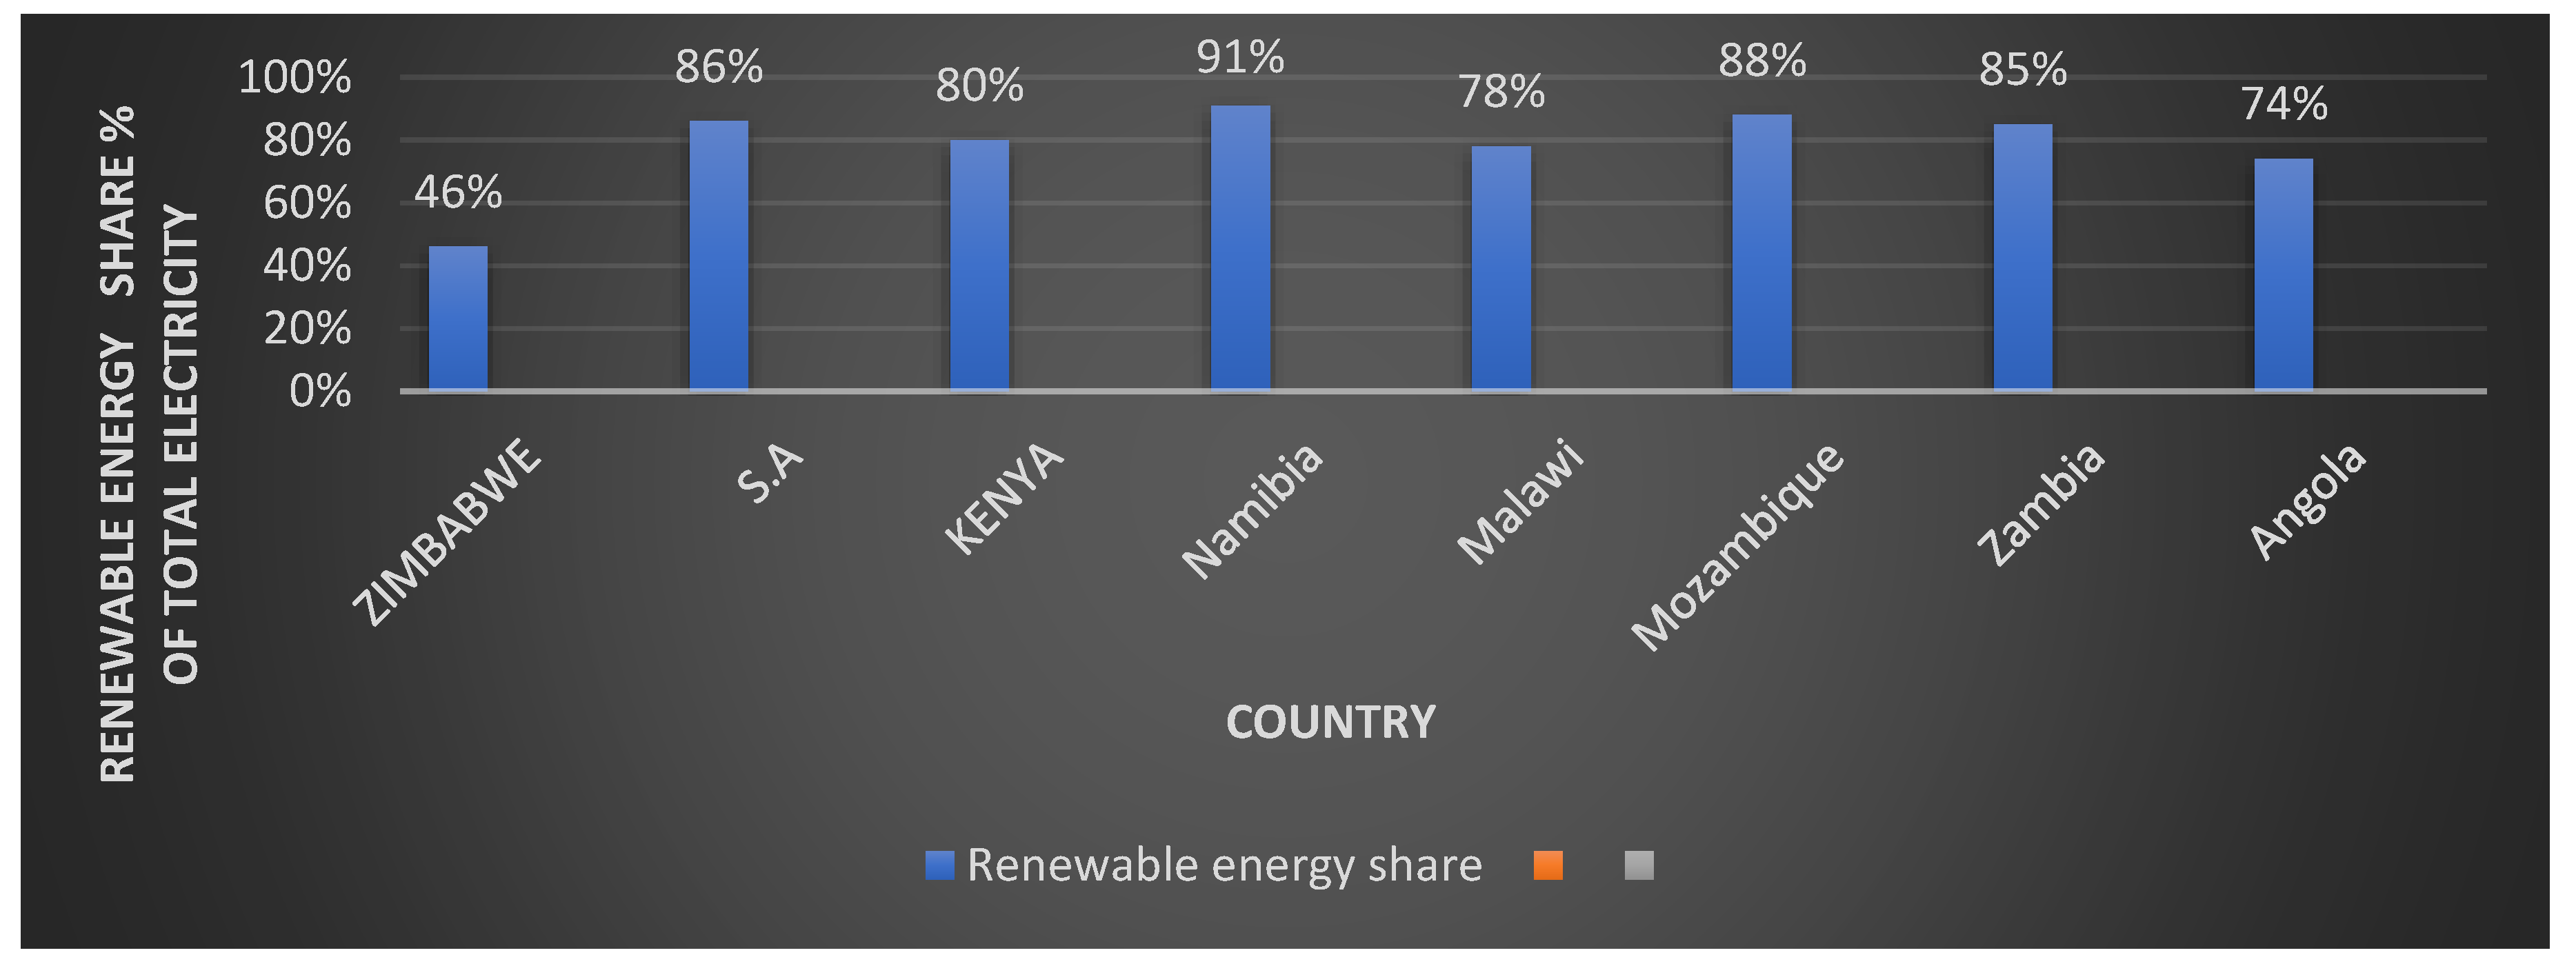

Table 1.
Solar Power Stations in Zimbabwe.
| Solar power station | Province | Owner of station | Capacity (Megawatts) | Electricity Generated (Megawatts)in 2018 | |
| Chiredzi solar power | Masvingo | Triangle solar system | 90 | 90 | |
| Collen Bawn Solar power station | Matebeleland south | Pretoria Portland Cement | 32 | 32 | 16MW to be sold to ZETDCL |
| Kwekwe solar power station | Midlands | Kwekwe Energy Power | 50 | 50 | |
| Norton solar power station | Mashonaland south | Norton solar company | 100 | 100 | Energy to be sold to ZETDCL. |
| Umguza solar power station | Matebeleland North | AF power private limited | 200 | 200 | |
| Victoria falls solar power station | Matebeleland North | Kibo energy Plc | 100 | 100 |
Source: MoEPD (2019).
Table 2.
Data Description.
| Variable | Obs | Mean | Std. Dev. | Min | Max |
| RES | 40 | 72.302 | 7.733 | 62.378 | 82.46 |
| INCM | 40 | 3.557 | 7.879 | -17.669 | 21.452 |
| REMIT | 40 | 2.735 | 4.491 | .004 | 13.611 |
| FDI | 40 | .972 | 1.274 | -.453 | 6.94 |
| PPP | 40 | 6059000000 | 6585000000 | 7300000 | 29730000000 |
| ZSRE | 40 | 62.777 | 5.138 | 47.252 | 71.9 |
| EDUC | 40 | 81.846 | 4.218 | 72.326 | 88.693 |
| TO | 40 | 63.184 | 16.804 | 35.917 | 109.522 |
Source: Authors calculations using STATA 15.
Table 3.
Stationarity Test Results.
| Variable |
ADF p-value@ level |
ADF p-value @ first difference |
Order of integration |
| RES | 0.8354 | 0.0000 | I(1) |
| INCM | 0.0002 | - | I(0) |
| REMIT | 0.6114 | 0.0000 | I(1) |
| FDI | 0.0010 | - | I(0) |
| PPP | 0.0107 | - | I(0) |
| ZSRE | 0.4097 | 0.0000 | I(1) |
| EDUC | 0.3222 | 0.0000 | I(1) |
| TO | 0.1771 | 0.0000 | I(1) |
Source: Authors calculations using STATA 15.
Table 4.
Multicollinearity Test Results.
| Variables | (1) | (2) | (3) | (4) | (5) | (6) | (7) |
| (1) INCM | 1.000 | ||||||
| (2) d1REMIT | 0.264 | 1.000 | |||||
| (3) FDI | 0.033 | -0.066 | 1.000 | ||||
| (4) PPP | -0.364 | 0.025 | 0.240 | 1.000 | |||
| (5) d1ZSRE | 0.152 | 0.205 | -0.099 | -0.148 | 1.000 | ||
| (6) d1EDUC | -0.048 | -0.053 | -0.110 | -0.003 | 0.072 | 1.000 | |
| (7) d1TO | -0.226 | 0.314 | 0.010 | 0.136 | 0.243 | -0.120 | 1.000 |
Source: Authors calculations using STATA 15.
Table 6.
ARDL Regression Results. ARDL (4,4,4,4,1,0,0,0) regression
| d1RES | Coef. | Std.Err. | t | P>t | [95%Conf. | Interval] |
| d1RES | ||||||
| L2. | -0.548 | 0.130 | -4.200 | 0.008 | -0.883 | -0.213 |
| d1REMIT | ||||||
| --. | 0.471 | 0.192 | 2.450 | 0.058 | -0.023 | 0.966 |
| L1. | 0.348 | 0.142 | 2.450 | 0.058 | -0.017 | 0.712 |
| d1ZSRE | ||||||
| --. | -0.285 | 0.106 | -2.680 | 0.044 | -0.558 | -0.012 |
| L2. | 0.556 | 0.101 | 5.500 | 0.003 | 0.296 | 0.816 |
| L4. | 0.964 | 0.145 | 6.660 | 0.001 | 0.591 | 1.336 |
| d1EDUC | ||||||
| --. | -2.361 | 0.382 | -6.190 | 0.002 | -3.343 | -1.380 |
| L1. | -3.311 | 0.445 | -7.450 | 0.001 | -4.454 | -2.168 |
| L2. | -0.988 | 0.239 | -4.130 | 0.009 | -1.603 | -0.374 |
| L3. | 0.417 | 0.181 | 2.300 | 0.070 | -0.049 | 0.884 |
| INCM | ||||||
| --. | -0.264 | 0.067 | -3.930 | 0.011 | -0.436 | -0.091 |
| FDI | -4.275 | 0.668 | -6.400 | 0.001 | -5.992 | -2.558 |
| PPP | 0.000 | 0.000 | 3.560 | 0.016 | 0.000 | 0.000 |
| d1TO | -0.027 | 0.051 | -0.540 | 0.613 | -0.157 | 0.103 |
| _cons | 5.937 | 0.807 | 7.360 | 0.001 | 3.864 | 8.010 |
Source: Authors calculations using STATA 15.
Table 7.
Bounds Test Results.
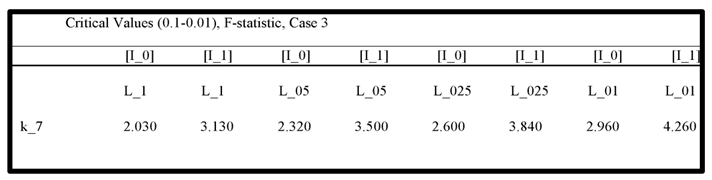 |
Source: Authors calculations using STATA 15.
Table 8.
Error Correction Model. ARDL (4,4,4,4,1,0,0,0) regression.
| D.d1RES | Coef. | Std.Err. | t | P>t | [95%Conf. Interval] | SIG | ADJ |
| d1RES | |||||||
| L1. | -1.926 | 0.303 | 6.350 | 0.001 | -2.705 | -1.146 | *** |
| LONGRUN RESULTS | |||||||
| d1REMIT | 1.584 | 0.342 | 4.630 | 0.006 | 0.704 | 2.463 | *** |
| d1ZSRE | 0.547 | 0.207 | 2.640 | 0.046 | 0.015 | 1.079 | ** |
| d1EDUC | -3.140 | 0.601 | -5.220 | 0.003 | -4.686 | -1.594 | *** |
| INCM | -0.073 | 0.030 | -2.430 | 0.059 | -0.151 | 0.004 | * |
| FDI | -2.220 | 0.507 | -4.380 | 0.007 | -3.523 | -0.917 | *** |
| PPP | 0.000 | 0.000 | 3.670 | 0.015 | 0.000 | 0.000 | ** |
| d1TO | -0.014 | 0.027 | -0.520 | 0.628 | -0.085 | 0.056 | |
| SHORTRUN RESULTS | |||||||
| d1RES | |||||||
| LD. | 1.105 | 0.289 | 3.820 | 0.012 | 0.361 | 1.849 | ** |
| d1REMIT | |||||||
| D1. | -2.578 | 0.502 | -5.130 | 0.004 | -3.870 | -1.287 | *** |
| LD. | -2.231 | 0.396 | -5.630 | 0.002 | -3.249 | -1.212 | *** |
| L2D. | -2.273 | 0.380 | -5.990 | 0.002 | -3.249 | -1.297 | *** |
| L3D. | -1.319 | 0.281 | -4.700 | 0.005 | -2.041 | -0.598 | *** |
| d1ZSRE | |||||||
| D1. | -1.338 | 0.299 | -4.470 | 0.007 | -2.108 | -0.568 | *** |
| LD. | -1.468 | 0.247 | -5.940 | 0.002 | -2.104 | -0.833 | *** |
| L2D. | -0.912 | 0.164 | -5.560 | 0.003 | -1.334 | -0.491 | *** |
| L3D. | -0.964 | 0.145 | -6.660 | 0.001 | -1.336 | -0.591 | *** |
| d1EDUC | |||||||
| D1. | 3.685 | 0.545 | 6.770 | 0.001 | 2.285 | 5.085 | *** |
| INCM | |||||||
| D1. | -0.123 | 0.080 | -1.540 | 0.183 | -0.327 | 0.082 | *** |
| _cons | 5.937 | 0.807 | 7.360 | 0.001 | 3.864 | 8.010 | *** |
***p<0.01, **p<0.05and*p<0.1. R2= 0.9843, Adjusted R2= 0.9087. Source: Authors calculations using STATA 15.
Table 9.
Diagnostic Tests results.
| Test | Method used | p-value | Conclusion |
| Heteroscedasticity Test | White test | 0.4140 | No Heteroskedasticity |
| Autocorrelation Test | Breusch-Godfrey Serial Correlation Test | 0.4470 | No Autocorrelation |
| Normality Test | Jarque-Bera test | 0.9512 | Error term is Normally Distributed |
| Model Specification Test | Ramsey RESET Test | 0.0988 | Model Is Correctly Specified |
Source: Authors calculations using STATA 15.
Disclaimer/Publisher’s Note: The statements, opinions and data contained in all publications are solely those of the individual author(s) and contributor(s) and not of MDPI and/or the editor(s). MDPI and/or the editor(s) disclaim responsibility for any injury to people or property resulting from any ideas, methods, instructions or products referred to in the content. |
© 2025 by the authors. Licensee MDPI, Basel, Switzerland. This article is an open access article distributed under the terms and conditions of the Creative Commons Attribution (CC BY) license (http://creativecommons.org/licenses/by/4.0/).
Copyright: This open access article is published under a Creative Commons CC BY 4.0 license, which permit the free download, distribution, and reuse, provided that the author and preprint are cited in any reuse.


