
Submitted:
04 March 2025
Posted:
04 March 2025
You are already at the latest version
Abstract
Renewable energy is very important for sustainable development. The transition from traditional energy sources to renewable energy sources is a current research topic. Within this framework, the purpose of the study is to analyze the determinants of renewable energy production for the period 2001-2021, specific to OECD countries. Since OECD countries have different levels of development, the threshold regression model was preferred. In addition, it was supported by panel causality test for the purpose of determine the direction of the relationship between the variables. The findings of the study show that GDP is directed more towards clean energy at higher OIP and IVA levels. Countries with lower OIP and lower IVA are more growth-oriented and directed more towards RES. Therefore, it is understood that at higher OIP and IVA, growth will be directed less towards RE and will reduce RES to a less significant extent.
Keywords:
renewable energy
; industry value added
; crude oil import prices
; gross domestic product
1. Introduction
Energy resources constitute one of the fundamental components of economic growth. However, energy resources create multidimensional effects in terms of global environmental problems and sustainable development policies. Energy consumption based on fossil fuels stands out as the main source of environmental threats such as carbon emissions and climate change [17]. The conversion to renewables has become a necessity and has increased academic interest in the economic and environmental benefits of these sources. However, since studies on the scope of economic and structural factors affecting renewable energy (RE) supply are limited, more in-depth studies are required in this area.
RE supply is critical for both sustainable development and energy supply security [10]. As countries turn to their own RE supply, their energy independence increases and their dependence on energy imports decreases. In addition, integration with RE sources can accelerate the sustainable development process through the expansion of green financing opportunities and technology transfers [11].
The goal of this article is to uncover the economic determinants of RE production. Crude oil import prices (OIP) are an important dynamic in terms of costs in energy markets. It is considered a critical factor that can affect the conversion to renewables due to the substitution effect [3]. The energy demand structure and technology level of countries are important indicators of industry value added (IVA). Therefore, the IVA of countries can affect the type of energy they use [2]. On the other hand, GDP is an important determinant of the transition to RE [10].
This study examines the economic determinants of RE supply by focusing on OECD countries between 2001 and 2021. Since OECD countries have different levels of development, a more in-depth analysis was aimed by using the threshold regression model. The factors affecting RE production will contribute to the development of strategies that will accelerate sustainable development and the conversion to renewables. In addition, this study aims to shed light on future academic research by filling theoretical and empirical gaps in the literature.
2. Literature Review
The relationship between renewable energy (RE) and economic factors has been widely discussed in the literature. While numerous studies examine RE consumption and its effects on economic growth [9,25,27] research on the determinants of RE supply remains relatively limited. Economic and structural factors influencing RE supply require further investigation to support the development of sustainable energy policies.
A key area of focus in the literature is the role of financial mechanisms and policy frameworks in facilitating the transition to RE. Government policies, including subsidies, tax incentives, and feed-in tariffs, play a critical role in promoting RE investments [12]. Similarly, entry barriers and lobbying power in the fossil fuel sector negatively affect RE expansion [33]. The increasing role of green financing—such as green bonds, carbon pricing mechanisms, and sustainable investment funds—has been highlighted as a crucial factor in accelerating the adoption of renewable energy [11]. Despite these advancements, the effectiveness of financial instruments in different economic contexts remains an open question.
Another critical dimension is the link between energy price volatility and RE production. The literature presents mixed findings regarding the impact of crude oil import prices (OIP) on RE investment. Oil price fluctuations significantly influence the RE transition, particularly in oil-importing countries [16,31]. However, some studies argue that technological progress can increase RE production independently of oil price movements [4,26]. This suggests that while short-term energy price fluctuations may influence RE investment decisions, long-term structural policies and technological advancements play a more dominant role.
The role of technological innovation in the RE sector has also gained prominence in recent studies. Investment in smart grids, battery storage technologies, and decentralized energy systems has significantly improved the feasibility and efficiency of RE adoption [11]. Countries with high levels of R&D investment and innovation capacity tend to achieve higher RE penetration [22]. However, the extent to which these technological advancements translate into large-scale RE adoption varies depending on regulatory support and market conditions.
In the context of economic growth and industrial structure, prior research has largely focused on the relationship between RE expansion and GDP. Some studies emphasize the positive impact of economic growth on energy transformation, aligning with the notion that wealthier nations have more resources to invest in sustainable energy [17]. Conversely, some suggest that industrial value-added (IVA) may act as a barrier to RE adoption, as energy-intensive industries remain dependent on fossil fuels [2,13]. This highlights the need for sector-specific policy interventions to facilitate RE integration in industrial economies. Some studies concluded that increased RE production increased IVA in Ireland [24]. Another study stated that there is no linkage between RE use and IVA [18]. Industry policies support RE investments in European Union countries [20]. Moreover, some studies argued that the RE is limited in high industrialized countries [29].
Finally, the transition to RE is increasingly being analyzed from a regional and country-specific perspective. Some studies explore the determinants of RE supply in Germany, France, and Türkiye, revealing that structural reforms play a crucial role in shaping the energy transition [30]. While Germany and Türkiye have successfully implemented policies to reduce fossil fuel dependency, France has shown a weaker link between RE policies and economic growth. These findings suggest that the impact of economic factors on RE supply varies based on national energy policies, institutional frameworks, and market dynamics.
Given the gaps in the literature, this study aims to provide an extensive analysis of the economic determinants of RE supply in OECD countries. By employing a panel threshold regression model and panel causality tests, this research seeks to identify the key drivers of RE adoption, contributing to the ongoing debate on energy transition strategies.
3. Theoretical Framework
The relationship between economic growth and renewable energy (RE) supply has been widely studied through various theoretical lenses. Understanding the economic determinants of RE production requires a robust theoretical framework that incorporates both macroeconomic and sector-specific perspectives. This study builds upon three key theoretical approaches: Green Growth Theory, the Environmental Kuznets Curve (EKC) Hypothesis, and Sustainable Development Models.
3.1. Green Growth Theory
Green Growth Theory suggests that economic growth and environmental sustainability can be mutually reinforcing [19]. According to this perspective, as economies grow, they invest in cleaner technologies, improve energy efficiency, and transition away from fossil fuel dependence. The substitution effect between crude oil and RE is a central component of this theory, as higher oil prices and industrial expansion incentivize firms and governments to shift towards sustainable energy solutions [1].
This framework also highlights the role of innovation, policy support, and financial mechanisms in accelerating RE adoption. Countries with strong green financing structures—such as carbon pricing, feed-in tariffs, and research & development incentives—tend to achieve a faster transition to renewables [15]. Our study incorporates this perspective by examining how GDP influences RE supply within OECD economies.
3.2. The Environmental Kuznets Curve (EKC) Hypothesis
The EKC hypothesis predicates that economic growth initially leads to environmental degradation, but afterwards reaching a certain income threshold, higher growth promotes sustainability [7]. This U-shaped relationship suggests that early stages of industrialization rely heavily on fossil fuels, whereas developed economies have the financial and technological capacity to invest in clean energy.
Empirical studies testing the EKC hypothesis in the energy sector have found mixed results. While some studies confirm that higher GDP leads to greater RE adoption in developed economies [17], others argue that industrialized economies face structural barriers that slow the transition [2]. Our study tests these assumptions by incorporating a panel threshold regression model to identify GDP thresholds beyond which RE adoption accelerates.
3.3. Sustainable Development Models
Sustainable development theories emphasize a balanced approach between economic growth, environmental conservation, and social welfare [32]. Unlike Green Growth Theory, which assumes that growth inherently leads to sustainability, sustainable development frameworks stress the need for strong regulatory institutions, market incentives, and coordinated international efforts [23].
In this context, industrial value added (IVA) plays a crucial role. High IVA levels often indicate a strong manufacturing base, which is traditionally dependent on fossil fuels. However, sustainable development models argue that by implementing sector-specific energy policies and technological innovation, industrial economies can transition towards RE while maintaining economic competitiveness [11]. Our study integrates this perspective by examining the negative impact of IVA on RE supply and discussing policy measures to overcome these structural barriers.
4. Data and Methodology
4.1. Data Description
Renewable energy supply (RES), oil import prices (OIP), industry value added (IVA) and gross domestic product (GDP) variables were used in the study. Natural logarithms of all variables were used. The study covers between 2001-2021 period. While RES is the dependent variable, OIP, IVA and GDP are included in the model as independent variables. General explanations and the resources of the variables are denoted in the Table 1.
The study focuses on the determinants of the RES. In this context, 19 OECD countries (Australia, Belgium, Canada, Czechia, Denmark, France, Germany, Italy, Japan, Korea, Netherlands, New Zealand, Norway, Portugal, Spain, Sweden, Türkiye, United Kingdom and United States) were analyzed in the study. Rest of the OECD countries were not included in the analysis due to data missing. Table 2 gives the descriptive statistics of the variables.
4.2. Methods
Panel threshold regression model is widely employed in macroeconomic empirical researches because they provide basic and clear economic inferences compared to other regression models. On the other hand, threshold regression models ensure complex estimation and deduction due to the inconvenience factors. In order to avoid this complexity, fixed effect panel threshold models have been developed [6]. The threshold regression estimator can be written as follows;
where Xit is a vector including entire the supressor’s of the estimator, qit represents the threshold variable, and γ represents the level of threshold. For this reason, estimator is considered as a specific condition of the threshold estimator with either qit < γ or qit ≥ γ for all i = 1, 2, 3, …, and t = 1, 2, 3, …,T. Our model can be specified as follows;
The double threshold regression estimator used in the study is as follows:\
A priori tests need to be performed to select the tests to be used in panel data models. Neglecting cross-sectional dependence can lead to skewed statistical results [8]. For this purpose, the Pesaran CD test is performed to reveal whether there is cross-sectional dependence in the series. The Pesaran CD test statistics are given in the equation below [21];
where N represents the units, T identifies the time, i and j are the linkage matrix factors, and ̂ρij is the sample estimate of the residuals.
In order to analysis findings to be coherent and impartial, the series must be made stationary. Unit root tests are performed to test the stationarity of the series. In the analysis, Levin, Lin and Chu (LLC) [14] panel unit root test was preferred. Subtract cross sectional means version of the test is applied because of cross sectional dependence. The LLC test supposes that all units have the same autoregressive parameter (). Moreover, the constant and trend parameters differ by unit;
where dmt denotes the vector of deterministic variables and ami expresses its parameters. The H0 of the test is set as "panels include unit roots". If the H0 is rejected, the series is accepted to be stationary.
As a sensitivity check, the MADF (Multivariate Augmented Dickey Fuller) panel unit root test developed by [28] is employed to account for cross-sectional dependence. MADF is among the second-generation tests. MADF test statistic is the standard Wald statistic;
where and represents consistent estimators of and , respectively. The H0 of the test is established as "all timeseries in the panel are I(1) processes". If the MADF test statistic is lower than the critical value, the H0 can not be rejected.
There can be unidirectional or mutual causality from one variable to another among economic variables. The existence and direction of causality can be analyzed through panel causality tests. Dumitrescu-Hurlin improved the Granger causality test for heterogeneous models [5];
where lag length (k) is the same for each unit of the panel and the panel is balanced while the autoregressive parameter and slopes vary with units. The H0 of the test is set as "X does not Granger-cause Y". If the H0 is not rejected, then variable X does not cause Y for all units in the panel.
5. Results and Discussion
Panel data estimators tend to have cross-sectional dependence. Therefore, Pesaran CD cross-sectional test was first performed to ensure consistency of the results. The test findings are given in Table 3 below.
In the results in Table 3, the H0 is rejected and there is cross-sectional dependence in the variables. Therefore, the existence of a unit root could substantially influence the asymptotic behavior of test.
The existence of cross-sectional dependence is also important in terms of selecting the unit root test. In the existence of cross-sectional dependence, it is appropriate to use second-generation panel unit root tests that are resistant to it. In this context, the Levin, Lin and Chu (LLC) test was selected which addresses cross-section mean differences. In addition, the MADF test was also applied for sensitivity check which is among the third-generation panel unit root tests. The findings of both tests are given in Table 4 below.
The statistical results of both tests in Table 4 are less than the critical value at the 95% level for all variables. Then, the existence of unit root is rejected for all variables and the series are accepted to be stationary. The regression parameters can be interpreted and spurious regression will not occur.
Table 5 summarizes the estimation results of the pooled, fixed effects and random effects estimations for the 19 OECD members from 2000 to 2021. In the following, F and Hausman tests were performed to select the best estimation method. The findings of the fixed-effect estimator indicates that the value of F-test p-value was lower than %5 confidence level and the H0 was rejected. Therefore, the fixed-effect method was approved. Then, Hausman test was applied to select between fixed or random effects. The H0 of the Hausman test was rejected and the fixed effect estimator is selected.
Table 5 demonstrates that in the fixed-effect estimation, IVA negatively effects on RES for the 19 OECD from 2000 to 2021. The coefficient of CO2e relative to innovation equals − 1,63. It means that a one unit increase in IVA can reduce RES by 1,63 unit. Conversely, GDP has a significant positive effect on RES. The elasticity of RES relative to GDP is 2,34. Therefore, a one unit increase in GDP increases RES by 2.34. Nevertheless, estimates propose that OIP will not significantly affect the RES.
The fixed-effect threshold estimator is performed to sensitivity check. First, the threshold values were tested. Then, the threshold value of the variable was computed. Accordingly, first, the double-threshold was model. Related to F-stat value, the triple-threshold estimator was rejected. Therefore, we selected the double-threshold estimator. Table 6 shows the threshold effect estimator results, containing the RSS, MSE, F-stat, the probability value of the F-stat and critical values. The F-stat at 5% level is significant and double threshold estimator is convenient.
Table 7 gives the threshold estimator (GDP) and confidence intervals. Th-1, Th-21 and Th-22 express the single-threshold estimator, the two estimators in a double-threshold model, respectively. So, the points change between 26.79 and 27.34. The effects of GDP on the RES were changed in between these points. It can be viewed the threshold confidence interval in Figure 1.
Table 8 denotes the result of fixed effects threshold estimation. As the GDP increase the coefficient of RES with respect to OIP and IVA has increased. At high levels of GDP, it is seen an increase in the impact of OIP and IVA on RES.
These findings unveil that GDP was conducted more toward RES at the higher levels of OIP and IVA. This policy has led to higher GDP in RES and, higher OIP and IVA. Countries that have lower OIP and lower IVA have been more growth-focused and more conducted to RES. Therefore, at higher OIP and IVA, it appears that growth will shift less towards RES and less toward reducing RES. Table 8 proposes that a one unit increase in the OIP diminishes RES by -0.14 unit. Also, a one unit increase in the IVA will reduce RES by -1.72 unit.
Following the regression analysis, panel causality test was performed to decide the direction of the linkage. The findings of the Dumitrescu-Hurlin (DH) panel causality test are given in Table 9 below.
Table 9 shows the DH causality test results. There is a mutual causality between LRES and LOIP. Moreover, there is a unidirectional causality linkage from LIVA to LRES and from LGDP to LRES.
RE is one of the most important issues for all countries. The transition to RE has been conducted in the literature in the context of various studies. OIP, IVA, and GDP are important determinants of RES. The aim of the article is to analyze the economic factors affecting RES in OECD countries. The article makes significant contributions to the literature by examining the effects of crude OIP, IVA and GDP variables on RES. The panel threshold regression and panel causality tests were applied to reveal the relationship between the variables.
Our results indicate that GDP was directed more towards clean energy at the higher levels of OIP and IVA. Countries that have lower OIP and lower IVA have been more growth-oriented and more directed to RES. Therefore, at higher OIP and IVA, it seems that the growth will move less towards RE and reduce RES less significantly.
When compared with studies in the literature, the findings of this article show both similarities and differences. Some studies emphasized the positive impact of economic growth on energy transformation, and the findings of this study regarding GDP also presented a framework parallel to these findings [17]. On the other hand, other stated that oil prices have a strong effect on the tendency towards RE, this study observed that the effect of oil import prices was limited [3]. This difference may be due to differences in energy policies of OECD countries, as well as to the economic conditions of the period. On the other hand, our findings are similar to the study in the literature [2] and revealed that IVA has a negative effect on RES. This situation reveals that fossil fuel dependency in industrialized economies makes the transition to RE difficult.
6. Conclusions
The transition to renewable energy (RE) is a critical issue for sustainable economic development and energy security. This study investigates the economic factors influencing RE supply in OECD countries between 2001 and 2021, employing a panel threshold regression model and panel causality tests. The findings indicate that gross domestic product (GDP) has a significant positive impact on RE supply, suggesting that economic growth facilitates a shift toward cleaner energy sources. In contrast, industry value added (IVA) negatively affects RE supply, implying that highly industrialized economies face structural challenges in transitioning away from fossil fuels. Additionally, crude oil import prices (OIP) show a limited effect on RE supply, suggesting that the substitution between fossil fuels and renewables is weaker than expected.
By employing a panel threshold regression model, we test the hypothesis that GDP positively affects RE supply but only after reaching a specific income level, consistent with the EKC hypothesis. Additionally, we explore whether high IVA acts as a barrier to RE expansion, in line with sustainable development theories. Through this approach, our study bridges the gap between theoretical and empirical research, offering new insights into how economic factors shape RE adoption in OECD countries.
From a policy perspective, the study’s findings underline several important implications for accelerating the transition to renewable energy. First, countries should implement stronger green financing mechanisms to support investment in RE infrastructure and innovation. Financial incentives, including subsidies, tax reductions, and low-interest loans for renewable energy projects, can help reduce the cost burden on investors and encourage faster adoption. Additionally, policymakers should focus on removing regulatory barriers that hinder the expansion of renewables, such as lengthy approval processes, grid integration challenges, and market entry restrictions.
Second, given the negative impact of IVA on RE supply, governments should focus on decarbonizing industrial sectors through technological advancements and policy incentives. This can be achieved by promoting energy efficiency measures, supporting research and development in clean production technologies, and encouraging the adoption of circular economy practices. Additionally, carbon pricing mechanisms and emission reduction targets can help drive industries toward a more sustainable energy mix.
Third, while OIP has shown a limited direct impact on RE supply, energy policy frameworks should consider long-term stability in energy pricing and security. Diversifying energy sources and reducing dependence on fossil fuel imports can help mitigate external economic shocks and strengthen the resilience of national energy systems. In this regard, regional cooperation and international partnerships can play a crucial role in facilitating knowledge transfer, investment collaboration, and the development of integrated renewable energy markets.
This study provides some important recommendations to policy makers to increase RES. First, investments in RES infrastructure should be increased considering the impact of economic growth on energy transition. Second, innovative technologies and incentive mechanisms should be put into place to reduce fossil fuel dependency in the industry sector. Finally, long-term strategies should be developed to reduce the impact of oil prices and increase energy supply security. These findings provide important clues in the conversion process to low-carbon economies and provide a solid foundation for future research.
Author Contributions
: Conceptualization, A.A.Ç., M.B.T and İ.S.; analysis, M.B.T.; Investigation, A.A.Ç and İ.S.; methodology, M.B.T and İ.S.; supervision, A.A.Ç and İ.S.; writing, review and editing, A.A.Ç., M.B.T. and İ.S. All authors have read and agreed to the published version of the manuscript.
Funding
This research received no external funding.
Data Availability Statement
The original contributions presented in this study are included in the article. Further inquiries can be directed to the corresponding authors.
Conflicts of Interest
All authors declare no conflict of interest.
References
- Aghion, P; Hepburn, C; Teytelboym, A; Zenghelis, D. Path dependence, innovation and the economics of climate change. The New Climate Economy, 2014, 1-17.
- Apergis, N; Payne, J.E. Renewable energy consumption and economic growth: Evidence from a panel of OECD countries. Energy Policy. 2010, 38, 656-660. [CrossRef]
- Bilgili, F; Ozturk, I. Biomass energy and economic growth nexus in G7 countries: evidence from dynamic panel data. Renewable and Sustainable Energy Reviews, 2015, 49, 132-138. [CrossRef]
- Cheon, A; Urpelainen, J. Oil prices and energy technology innovation: An empirical analysis. Global Environmental Change, 2012, 22, 407-417. [CrossRef]
- Dumitrescu, E.I; Hurlin, C. Testing for Granger non-causality in heterogeneous panels. Economic Modelling, 2012, 29, 1450-1460. [CrossRef]
- Hansen, B.E. Threshold effects in non-dynamic panels: estimation, testing, and inference. Journal of Econometrics, 1999, 93, 345-368.
- Grossman, G.M; Krueger, A.B. Economic growth and the environment. The Quarterly Journal of Economics, 1995, 110, 353-377.
- Hoes, O.A.C; Meijer, L.J; Ent, R.J; Giessen, N.C. Systematic high-resolution assessment of global hydropower potential. PLoS ONE, 2017, 12, e0171844, 1-10.
- Inglesi-Lotz, R. The impact of renewable energy consumption to economic growth: a panel data application. Energy Economics, 2016, 53, 58-63. [CrossRef]
- International Energy Agency (IEA). World Energy Outlook 2022. IEA Publications, Available online: https://www.iea.org/reports/world-energy-outlook-2022 (06.09.2024).
- International Renewable Energy Agency (IRENA). Renewable Energy Statistics 2021. IRENA Publications. Available online: https://www.irena.org/publications/2021/Jul/Renewable-Energy-Statistics-2021 (08.09.2024).
- Johnstone, N; Haščič, I; Popp, D. Renewable energy policies and technological innovation: evidence based on patent counts. Environmental and Resource Economics, 2009, 45, 133-155. [CrossRef]
- Kilinc-Ata, N; Dolmatov, A. Renewable energy and economic growth nexus in OECD and BRICS countries. Environmental Science and Pollution Research, 2023, 30, 1720-1736.
- Levin, A; Lin, C.F; Chu, C.S.J. Unit root tests in panel data: asymptotic and finite-sample properties. Journal of Econometrics, 2002, 108, 1-24. [CrossRef]
- Li, Y.X; Cheng, H.F; Ni, C.J. Energy transition policy and urban green innovation vitality-A quasi-natural experiment based on new energy demonstration city policy. China Population, Resources and Environment, 2023, 33, 137-149.
- Magazzino, C; Giolli, L. Renewable energy production during the pandemic: evidence from Italy. Renewable Energy, 2024, 152, 477-489.
- Marques, A. C; Fuinhas, J.A. The role of energy prices in the economic growth-renewable energy consumption nexus: evidence from the EU-27 countries. Renewable Energy. 2012, 43, 251-261.
- Menegaki, A.N. Growth and renewable energy in Europe: a random effect model analysis. Energy Economics, 2011, 33, 257-263.
- OECD. Environmental Claims. OECD Green Growth Papers 2011, Available online: https://www.oecd.org/en/publications/environmental-claims_5k9h3633prbq-en.html (03.11.2024).
- Papież, M; Śmiech, S; Frodyma, K. Determinants of renewable energy development in the EU countries A 20- year perspective. Renewable and Sustainable Energy Reviews, 2018, 91, 918-934. [CrossRef]
- Pesaran, M.H. General diagnostic tests for cross section dependence in panels. IZA DP, 2004, 1240, 1-39. [CrossRef]
- Przychodzen, J; Przychodzen, W. Determinants of renewable energy production in transition economies: a panel data approach. Energy, 2020, 191, 116583. [CrossRef]
- Sachs, J.D. The Age of Sustainable Development, 1st ed.; Columbia University Press: Columbia, USA, 2015.
- Sgobba, A; Meskell, P. On-site renewable electricity production and self consumption for manufacturing industry in Ireland: Sensitivity to techno-economic conditions. Journal of Cleaner Production, 2019, 207, 894-907. [CrossRef]
- Shafiei, S; Salim, R.A. Non-renewable and renewable energy consumption and CO2 emissions in OECD countries: A comparative analysis. Energy Policy, 2014, 66, 547–556. [CrossRef]
- Sovacool, B.K; Brown, M.A. Competing dimensions of energy security: an international perspective. Annual Review of Environment and Resources, 2010, 35, 77-108. [CrossRef]
- Taghvaee, V.M; Shirazi, J.K; Boutabba, M.A; Aloo, A.S. Economic Growth and Renewable Energy in Iran. Iran. Econ. Rev. 2017, 21, 789-808.
- Taylor, M.P; Sarno, L. The behavior of real exchange rates during the post–bretton woods period. Journal of International Economics, 1998, 46, 281–312. [CrossRef]
- Topçu, M; Tuğcu, C.T. The impact of renewable energy consumption on income inequality: Evidence from developed countries. Renewable Energy, 2020, 151, 1134-1140. [CrossRef]
- Uçaravcı, N; Akın, M. A comparative analysis of the relationship between renewable energy production and economic growth. Alphanumeric Journal, 2023, 11, 1-16.
- Uçkun-Özkan, A. Oil price shocks and renewable energy consumption: the role of economic policy uncertainty. Sosyoekonomi, 2023, 31, 217-240.
- United Nations. Our Common Future. Report of the World Commission on Environment and Development, Available online: https://www.are.admin.ch/are/en/home/media/publications/sustainable-development/brundtland-report.html (05.12.2024).
- Zhao, Y; Tang, K; Wang, L. Do renewable electricity policies promote renewable electricity generation? Evidence from panel data. Energy Policy, 2013, 62, 887-897. [CrossRef]
Figure 1.
Threshold confidence intervals.
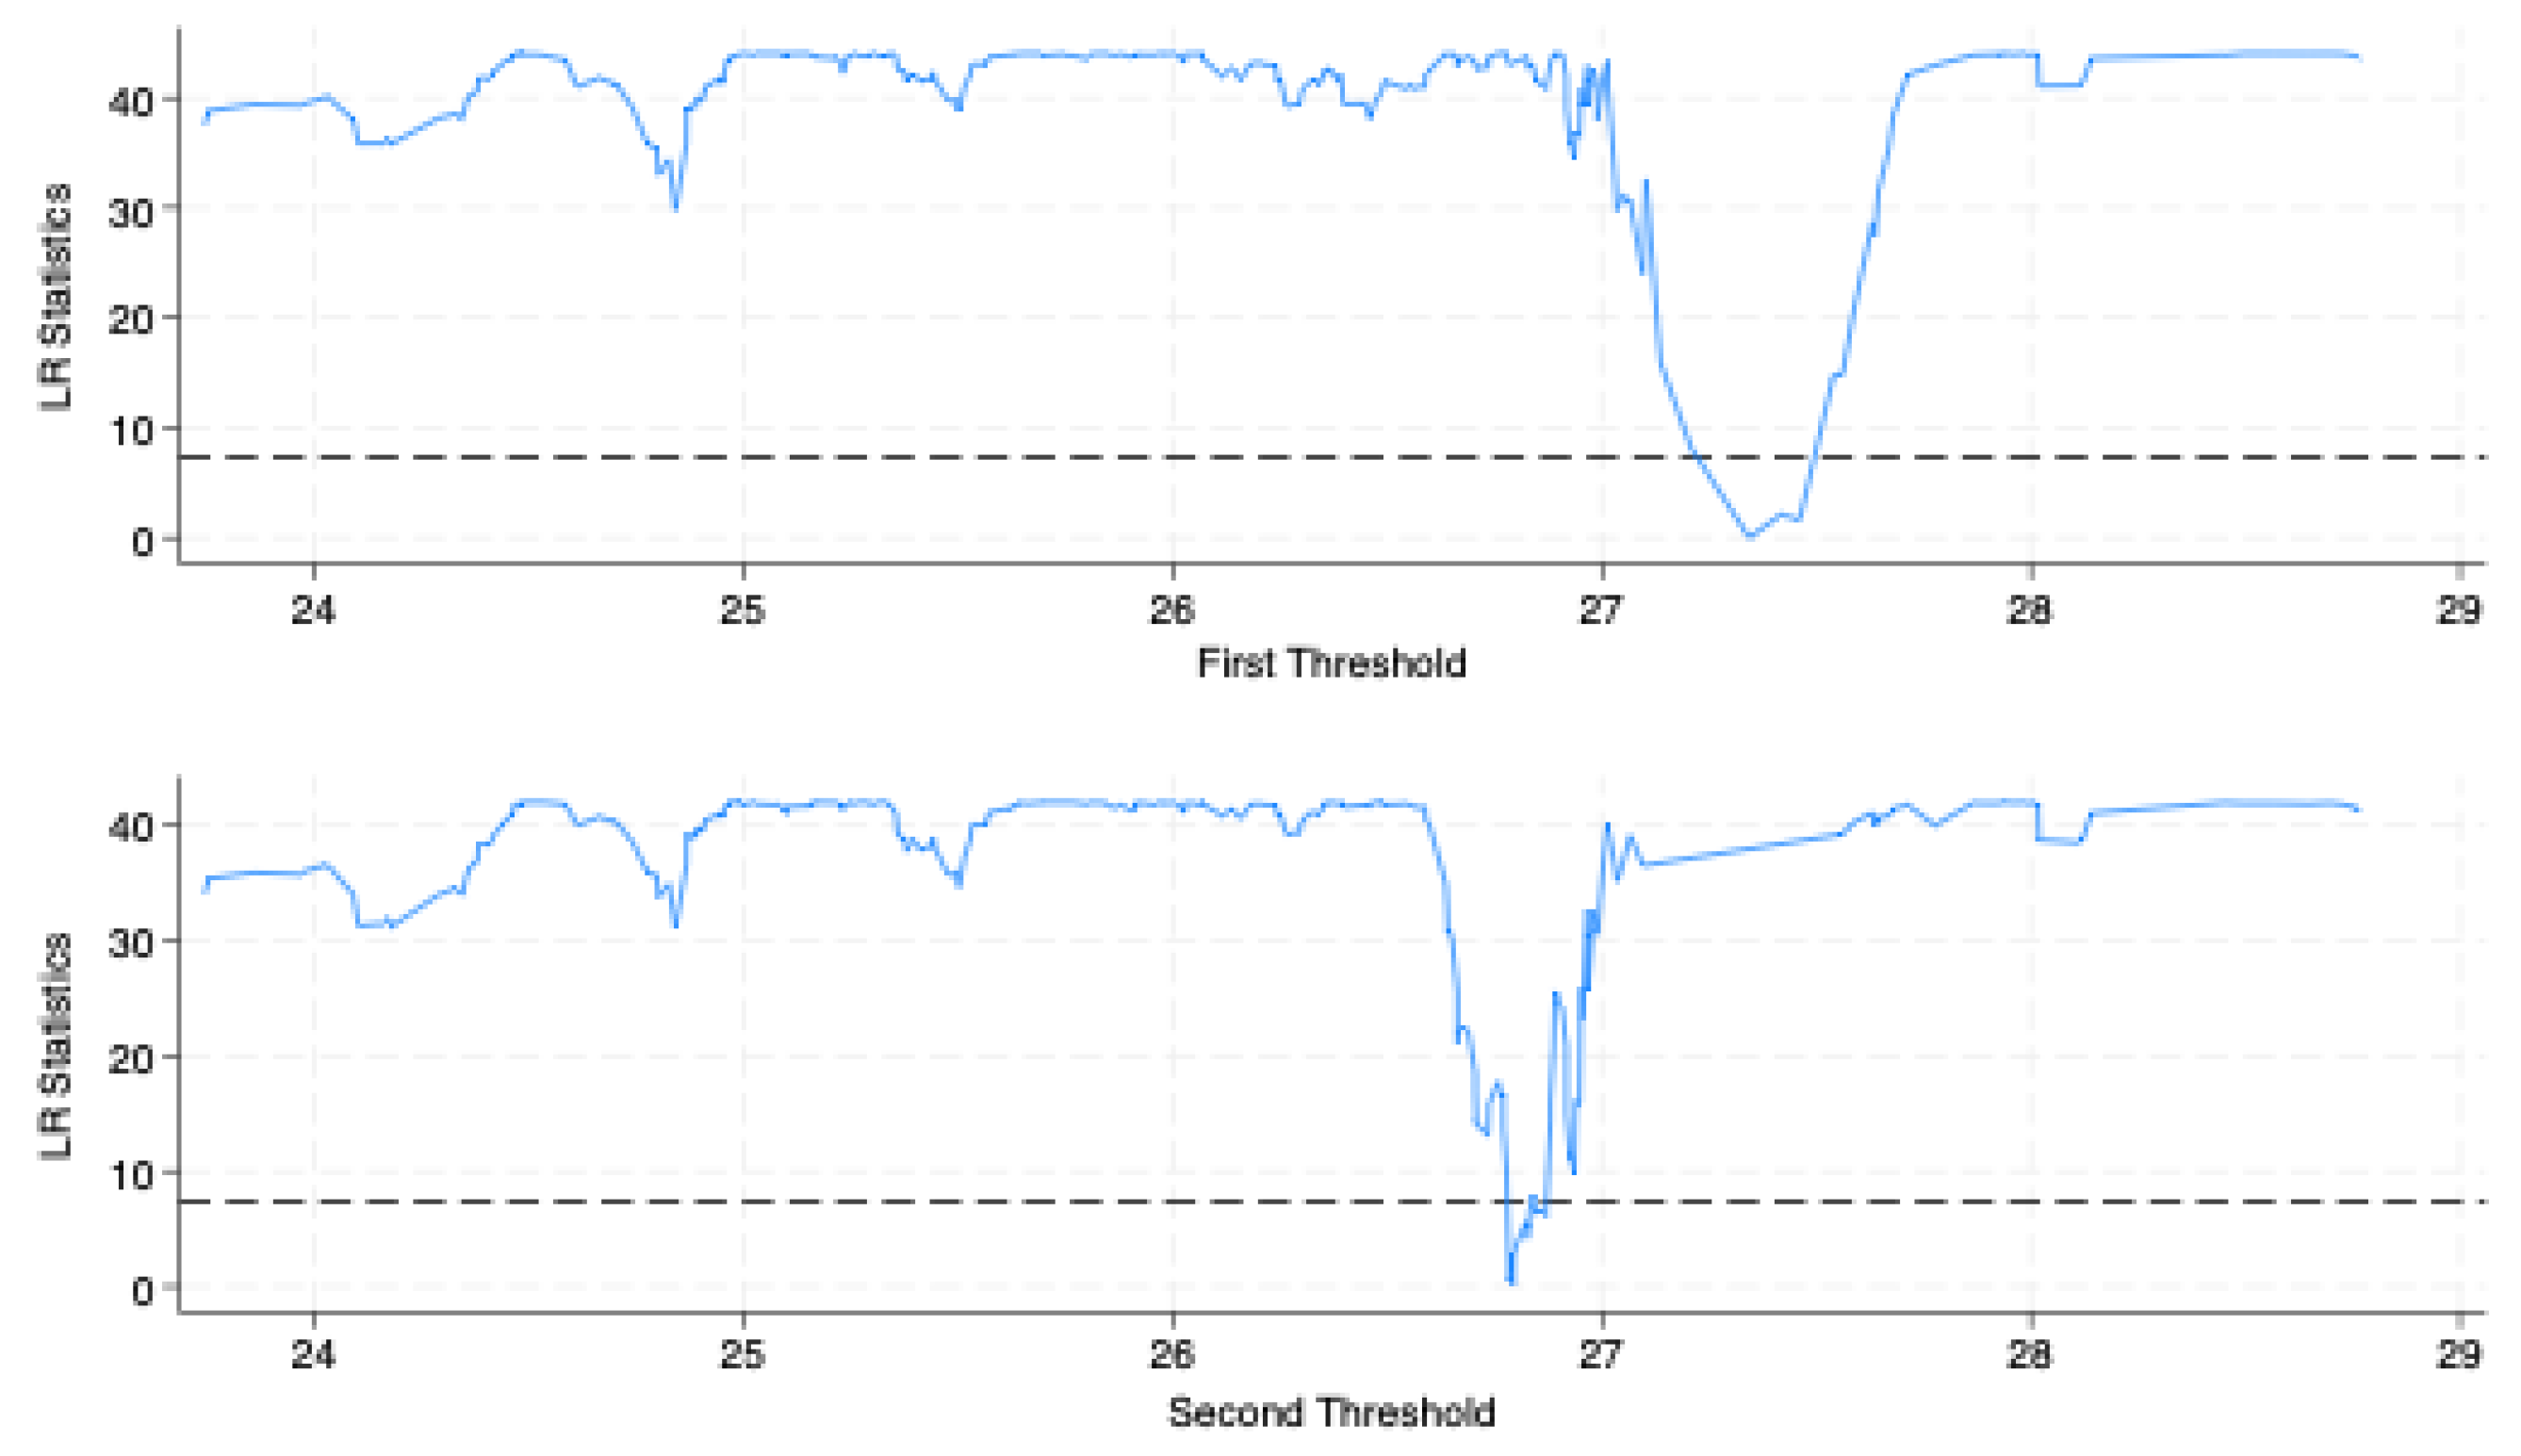

Table 1.
General explanations and the resources of the variables.
| Variable | Explanation | Resource |
|---|---|---|
| LRES | Logarithm of total renewable energy supply | OECD |
| LOIP | Logarithm of crude oil import price | OECD |
| LIVA | Logarithm of industry value added | World Bank |
| LGDP | Logarithm of gross domestic product | World Bank |
Table 2.
Descriptive statistics.
| Variable | Observation | Mean | Standard Dev. | Min. | Max. |
|---|---|---|---|---|---|
| LRES | 418 | 9.207179 | 1.127076 | 6.458369 | 12.07197 |
| LOIP | 418 | 4.047082 | 0.4767781 | 3.094219 | 4.768818 |
| LIVA | 418 | 26.12945 | 1.216307 | 23.24209 | 29.05889 |
| LGDP | 418 | 27.55565 | 1.238374 | 24.68642 | 30.79201 |
Table 3.
Cross sectional dependence test results.
| Variable | CD-test | p-value | average joint-T | |
|---|---|---|---|---|
| LRES | 53.069 | 0.000 | 22.00 | 0.87 |
| LOIP | 61.178 | 0.000 | 22.00 | 1.00 |
| LIVA | 47.909 | 0.000 | 22.00 | 0.78 |
| LGDP | 54.273 | 0.000 | 22.00 | 0.88 |
Table 4.
Panel unit root rest results.
| Test | LLC | MADF | ||||
|---|---|---|---|---|---|---|
| Variable | Statistic | p-value | MADF | Approx 5% CV | ||
| LRES | -2.4782 | 0.0066 | 335.101 | 36.616 | ||
| LOIP | -4.0307 | 0.0000 | 176.518 | 36.616 | ||
| LIVA | -3.8395 | 0.0001 | 787.705 | 36.616 | ||
| LGDP | -3.1117 | 0.0009 | 1259.733 | 36.616 | ||
Table 5.
Regression models estimation results.
| Pooled | Fixed effect | Random effect | ||||
|---|---|---|---|---|---|---|
| Variable | Coefficient | t-statistics (p-value) | Coefficient | t-statistics (p-value) |
Coefficient | z-statistics (p-value) |
| LOIP | 0.0519856 | 0.60 (0.549) |
-0.0572547 | -1.25 (0.212) |
-0.0460254 | -1.05 (0.292) |
| LIVA | -0.1164369 | -0.58 (0.565) |
-1.63987 | -8.00 (0.000) |
-1.587876 | -7.91 (0.000) |
| LGDP | 0.7268899 | 3.65 (0.000) |
2.343858 | 11.81 (0.000) |
2.274118 | 11.67 (0.000) |
| C | -7.990702 | -8.56 (0.000) |
-12.29872 | -6.77 (0.000) |
-11.78103 | -7.02 (0.000) |
| R2 | 0.4611 | |||||
| Adj. R2 | 0.4571 | |||||
| F | (3, 414) = 118.06 | (18, 396) = 168.40 | ||||
| Prob > F | 0.0000 | 0.0000 | ||||
| Wald chi2(3) | 376.45 | |||||
| Prob > chi2 | 0.0000 | |||||
| R2 within | 0.4808 | 0.4807 | ||||
| R2 between | 0.4139 | 0.4145 | ||||
| R2 overall | 0.4176 | 0.4183 | ||||
| rho | 0.90200224 | 0.8983324 | ||||
| Hausman | 3.47 (0.0000) |
|||||
Table 6.
Double threshold effect estimator results.
| Threshold | RSS | MSE | F-stat | Prob | CV10 | CV5 | CV1 |
|---|---|---|---|---|---|---|---|
| Single | 30.2696 | 0.0764 | 35.55 | 0.3182 | 64.5206 | 69.0354 | 81.4537 |
| Double | 27.3327 | 0.0690 | 42.55 | 0.0455 | 37.1622 | 41.2168 | 52.5914 |
Table 7.
Threshold confidence intervals.
| Model | Threshold | Lower | Upper |
|---|---|---|---|
| Th-1 | 27.3437 | 27.1724 | 27.4176 |
| Th-21 | 27.3437 | 27.2081 | 27.4176 |
| Th-22 | 26.7927 | 26.7840 | 26.7939 |
Table 8.
Fixed effect threshold regression results.
| Coef. | Std. err. | t-stat | p-value | 95% conf. int. | ||
|---|---|---|---|---|---|---|
| LOIP | -0.1399694 | 0.0428401 | -3.27 | 0.001 | -0.2241933 | -0.0557455 |
| LIVA | -1.726343 | 0.1875705 | -9.20 | 0.000 | -2.095107 | -1.357579 |
| cat#c.LGDP | ||||||
| 0 | 2.385824 | 0.1815794 | 13.14 | 0.000 | 2.028838 | 2.74281 |
| 1 | 2.399302 | 0.1815397 | 13.22 | 0.000 | 2.042395 | 2.75621 |
| 2 | 2.428983 | 0.1818696 | 13.36 | 0.000 | 2.071426 | 2.786539 |
| C | -11.10371 | 1.663369 | -6.68 | 0.000 | -14.3739 | -7.833518 |
F (18,394) 196.75 (0.000).
Table 9.
Panel causality test results.
| Causality | Statistic | Probability |
| LRES→LOIP | -2.4665 | 0.0136 |
| LOIP→LRES | 4.0029 | 0.0001 |
| LRES→LIVA | 0.4437 | 0.6573 |
| LIVA→LRES | 5.1220 | 0.0000 |
| LRES→LGDP | -1.1515 | 0.2495 |
| LGDP→LRES | 8.7204 | 0.0000 |
Disclaimer/Publisher’s Note: The statements, opinions and data contained in all publications are solely those of the individual author(s) and contributor(s) and not of MDPI and/or the editor(s). MDPI and/or the editor(s) disclaim responsibility for any injury to people or property resulting from any ideas, methods, instructions or products referred to in the content. |
© 2025 by the authors. Licensee MDPI, Basel, Switzerland. This article is an open access article distributed under the terms and conditions of the Creative Commons Attribution (CC BY) license (http://creativecommons.org/licenses/by/4.0/).
Copyright: This open access article is published under a Creative Commons CC BY 4.0 license, which permit the free download, distribution, and reuse, provided that the author and preprint are cited in any reuse.


