
Submitted:
13 June 2025
Posted:
16 June 2025
You are already at the latest version
Abstract
Background/Objectives: Restored CD4 absolute counts (CD4AC) and CD4/CD8 ratio in the settings of continuous antiretroviral treatment (ART) do not exclude a low-level immune activation associated with HIV reservoirs, microbial translocation, or the side-effects of ART itself, that accelerates ageing of people living with HIV (PLHIV). To delineate biomarkers of incomplete immune restoration in PLHIV on successful ART, we evaluated T-lymphocyte mitochondrial parameters in relation to phenotypic markers of immune exhaustion and senescence. Methods: PLHIV with sustained viral supression, CD4AC >500 and CD4/CD8 ratio >0.9 on ART (n=39) were compared to age-matched ART-naïve donors (n=27) and HIV(-) healthy controls (HC, n=35). CD4 and CD8 differentiation and effector subsets (CCR7/CD45RA and CD27/CD28), activation, exhaustion, and senescence markers (CD38, CD39 Treg, CD57, TIGIT, PD-1) were determined by flow cytometry. Mitochondrial mass (MM) and membrane potential (MMP) of CD8 and CD4 T cells were evaluated with MitoTracker Green and Red flow cytometry dyes. Results: ART+PLHIV differed from HC by increased CD4 TEMRA (5.3 (2.1-8.8) vs. 3.2 (1.6-4.4), p<0.05), persistent TIGIT+CD57-CD27+CD28- CD8+ subset (53.9 (45.5-68.9) vs. 40.1 (26.7-58.5), p<0.05), and expanding preapoptotic TIGIT-CD57+CD8+ effectors (9.2 (4.3-21.8) vs. 3.0 (1.5-7.3), p<0.01) in correlation with increased CD8+ MMP (2527 (1675-4080) vs.1477 (1280-1691), p<0.01). These aberrations were independent of age, time to ART, ART duration, and were combined with an increasing CD4 T cell MMP and MM. Conclusions: In spite of recovered CD4AC and CD4/CD8, the increased CD8+ MMP combined with elevated markers of exhaustion and senescence in ART+PLHIV, signals a malfunction of the CD8 effector pool, that may compromise viral reservoirs latency.
Keywords:
HIV
; antiretroviral treatment
; immune restoration
; viral suppression
; immune exhaustion and senescence
; mitochondrial dysfunction
1. Introduction
When applied early enough, contemporary antiretroviral therapy (ART) can prevent AIDS and increase significantly the life expectancy of people living with HIV (PLHIV) [1]. However, ART does not eliminate latent HIV viral reservoirs and does not prevent the low-level chronic immune activation associated with HIV reactivation, concomitant chronic infections, microbial translocation in gut, or ART itself, thus finally leading to non-infectious degenerative diseases and accelerated ageing [2,3].
CD4T cells are the principal target of HIV, and their absolute count (AC) has long served as a surrogate marker of viral activity used to determine the stage of immune deficiency, the right time to start ART, and the effect of antiviral treatment [4]. However, a number of studies have shown that restoring CD4AC above the critical for immune deficiency level (350 cells/µL) does not necessarily correspond to complete immune recovery [5].
Another classical immune parameter, the CD4/CD8 ratio, has proved to be a more sensitive indicator of on-going immune activation in the settings of long term ART and suppressed HIV viral load [6]. CD4/CD8 ratio was shown to correlate with important biological and clinical parameters as the activation of the CD8 T cell pool, generally indicating active viral infection, the rate of non-infectious inflammatory co-morbidity (affecting the cardio-vascular, renal or nervous system), or the dimensions of the residual viral reservoir [2]
Further on, two phenomena are tightly linked to the process of continuous immune activation, and persistent HIV reservoirs: terminal differentiation and malfunction of virus-specific T cell clones expressing inhibitory receptors (immune exhaustion), and accelerated immune senescence (analogous to age-related immune senescence) characterized by altered subset composition decreased thymic output, telomere shortening, and senescent-associated secretory phenotype of T cells [7]. The latter triggers mitochondrial dysfunction, resulting in increased ROS production, DNA damage, altogether driving further the CD8 activation and systemic inflammation. In this context, a number of phenotypic and functional markers were studied as potential biomarkers of incomplete immune restoration in response to ART, including: the expression of molecules associated with exhaustion like PD1, PD-L1, and TIGIT, inhibition (CD39+Treg; CD160), or apoptosis (CD57, FasL), the thymic output, relative telomere length (RTL), proleiferative capacity, glucose uptake or cytokine secretion potential of CD4 and CD8 T cells [8,9,10,11].
Mitochondria are key to immune cell functions by providing ATP via complete oxidative phosphorylation (OXPHOS), regulating calcium signaling and storage, as well as apoptosis signaling pathways [12]. Mitochondrial dysfunction leading to increased ROS production and DNA damage is a hallmark of ageing, and therefore – intrinsic to chronic HIV infection in the settings of continuous ART. Early initiation and strict adherence to ART have been shown to reduce the risk of comorbidities [13]. On the other hand, ART has also been associated with low-grade inflammation, mitochondrial dysfunction, and senescence in various cell types, even after relatively short-time exposure [14]. There is clearly a need to further investigate HIV- and ART-induced mitochondrial compromise and inflammaging, as well as to identify reliable parameters for monitoring the effects of long-term ART.
In the present study, we evaluated the mitochondrial mass and membrane potential of CD4 and CD8 T cells in relation to established phenotypic markers of immune exhaustion and senescence, as potential sensitive biomarkers of incomplete immune restoration in PLHIV on continuous ART and with undetectable HIV viral load.
2. Materials and Methods
2.1. Study Populations
Peripheral blood from PLHIV (n = 66) was collected at the Specialized Hospital for Active Treatment of Infectious and Parasitic Diseases, Sofia, Bulgaria in the course of routine immune monitoring according to the national policies. Of them, 39 were on continuous ART (A, HIV+ART+), and 27 were ART-naïve (B, HIV+ART-). The ART+ individuals had been on therapy for least 2 years (range 2–24), with peripheral CD4AC above 500 cells/µL, and CD4/CD8 ratio >0.9 during their last checkup. Control samples were obtained from HIV (-) age- and sex-matched individuals during prophylactic examinations (HC, n = 35). They were clinically healthy, without a history of chronic diseases, or hospitalization in the last 2 months, or usage of immunostimulatory or immunosuppressive drugs, no obesity (body mass index < 30), complete blood count and routine biochemistry tests - within the normal ranges, no HSV, EBV or active CMV infection and no record of addictions or other dependencies.
Fresh obtained whole heparin venous blood was collected and employed for phenotyping analysis as well as to isolate peripheral blood mononuclear cells (PBMC) by density centrifugation using Lymphocyte Separation Medium (LSM, cat# LSM-A, Capricorn Scientific) for mitochondrial analysis.
The project was approved by the Ethics Committee of the National Center for Infectious and Parasitic Diseases - Sofia, Bulgaria. (Institutional Review Board/Institutional Ethics Committee (IRB/IEC) number: IRB 00006384), protocol No 3/2024).
2.2. Multicolor Phenotyping Analysis of Surface Markers
The share and AC of lymphocytes (CD45+), T-cells (CD3+), helper T-cells (CD3+CD4+), cytotoxic T-cells (CD3+CD8+), proportions of CD4 and CD8 naïve (CD45RA+ CCR7+), central memory (CD45RA-CCR7+), effector-memory (CD45RA-CCR7-), terminal effector memory (CD45RA+CCR7-), regulatory CD4 T cells (Treg, CD25highCD127-), and CD8 T cell effector subsets at different stages of differentiation/senescence/exhaustion (TIGIT and CD57 co-expression on CD27+28+; CD27+CD28-; CD27-CD28- subsets) were determined by standard multicolor flow cytometry.
For phenotypic analysis of CD4 and CD8 T cells surface markers, whole blood samples were stained by adding pre-titrated concentrations of directly conjugated antibodies resuspended in staining buffer (Cat# 342417, BD), followed by 15 min incubation at room temperature, in the dark, 10 min incubation with fix-lysing solution (Cat #349202, BD) and repeated washing with PBS. CD4AC was determined in TRUCount tubes with MultiTest combination (Cat# 342447, BD) according to manufacurer’s instructions. For each test 50 µL of whole blood were used. Stained samples were acquired immediately on a FACSCanto II flow cytometer using FACSDiva v. 6.1.3 software.
The following mAbs were used in the multi-color flow cytometry panel: anti-h CD3 AmCyan (cat# 339186), anti-h CD4 (PE cat# 565999), anti-h CD25 (APC-Cy7 cat# 557753), anti-hCD45RA (FITC cat# 555488), anti-h CCR7 (PE-Cy cat# 560765), anti-h CD38 (PE cat# 2117530); anti-h CD8 (APC cat# 340659), anti-h CD27 (AF700 cat# 356416); anti-h CD127 (PcpCy5.5 cat# 353220), anti-h CD8 (V450, cat# E-AB-F1110Q) and anti-h CD57 (FITC cat# E-AV-F-1067C), anti-h CD45 (FITC cat# 2522025), anti-h CD45 (PerCP cat# E-AB-F1137F), anti-h PD-1 (APC cat#2496040), anti-h PDL-1 (PE cat# 2568040), anti-h CD28 (APC cat#377610), anti-h TIGIT (BV421 cat#2463550), anti-h CD39 (cat #E-AB-F1165C). T lymphocyte activation was evaluated by the number of CD38 molecules expressed on CD4+ and CD8+ T cells (CD38 antibody-binding sites, ABS) were quantified using the Quantibrite PE CD38 calibration flow cytometry kit (cat# 340495, BD Bioscience) according to manufacturer’s instructions.
Gating strategy: lymphocytes were defined on a CD45 vs. SSC plot; the proportions of basic T-lymphocyte subsets were determined after plotting CD3 vs. SSC, CD3 vs. CD4 and CD3 vs. CD8 expression, respectively. Naïve (CD45RA+CCR7+), central-memory (CD45RA-CCR7+), effector memory (EM, CD45RA-CCR7-) and terminal effector memory (TEMRA, CD45RA+CCR7-) subsets were defined according to the combined expression of CD45RA vs. CCR7 within gated CD4+ and CD8+T cells. Treg were defined as CD25highCD127- cells within gated CD4+ T lymphocytes. Markers of exhaustion/senescence were studied on CD4- and CD8-gated T cells, as well as on effector T cell subsets determined by CD28/CD27 co-expression.
2.3. Mitochondrial Analysis
Measurements of mitochondrial mass (MM) and mitochondrial membrane potential (MMP) were performed using MitoTracker Green FM for Flow Cytometry (MTG, cat #m46750) and MitoTracker Red (MTR, cat #m22425) respectively (Thermo Fisher Scientific). PBMC from whole blood were separated using density gradient centrifugation, transferred to 1 mL of colorless RPMI1640 + 10% Fetal Calf Serum and stored at 4°C overnight. Before staining, cells were allowed to reach room temperature. 1 × 10⁵ PBMC were surface stained with CD45, CD3 and CD8 mAbs to define CD4 and CD8 T cell subsets. Subsequently 500 µL MTG and MTR in PBS were added at a final concentration of 1:2000 for MTG and 25 nM for MTR, respectively, incubated at 37 °C in a 5% CO2 humidified incubator for 30 min, washed once and analyzed within 2 h. Fluorescence Minus One (FMO) controls were used for accurate gating of positive populations.
2.4. Statistical Analysis
Comparisons of quantitative parameters between groups were performed by the non-parametric Kruskall-Wallis test followed by post-hoc Dunn test; correlations were evaluated by Spearman’s rank test. Statistical significance was set at p = 0.05. Quantitative variables are expressed as median and interquartile range (IQR); Statistical analyses were carried out with SPSS v. 23 and GraphPad Prism v. 9.5.
3. Results
3.1. Basic Demographic and Immune Parameters of the Studied Groups
The basic demographic and laboratory characteristics of the patients’ and control groups are given in Table 1. No significant differences existed between age and sex distribution in the groups. According to the study design, ART+ PLHIV were with suppressed HIV viral load (VL), and immune response to continuous therapy. Consequently, CD4AC (median (IQR)) was significantly higher than those of ART- donors: 856 (711–1224) vs. 302 (136–527), p < 0.0001, and did not differ from those of HC: (902 (784–1334), p > 0.05. In addition, the CD4/CD8 ratio of ART+HIV- donors was significantly higher as compared to ART-HIV+: 1.31 (1.13–1.71) vs. 0.31 (0.19–45), p > 0.001, and comparable to that of HC (1.8 (1.5–2.21), p > 0.05), precluding any on-going significant immune activation and inflammation process.
The evaluation of the subset composition of CD4 and CD8 T cell pools in terms of naïve, CM, EM and TEMRA subsets showed a significant decrease of CM CD4 as well as of naïve and CM CD8 T in untreated HIV infection, at the expense of TEMRA CD4 and EM CD8, respectively (Figure 1).
ART restored completely the CD8 T cell subset composition, and almost completely that of CD4, with the exception of a slightly increased CD4 TEMRA subset: 5.3 (2.1–8.8) vs. 3.2 (1.6–4.4), p < 0.05.
3.2. Expression of Activation, Exhaustion and Senescence Markers by CD4 and CD8 T Cells of PLHIV on Successful ART
We further evaluated well accepted markers of CD4 and CD8 T cell chronic activation in group A, as compared to untreated PLHIV and HC: the number of CD38 molecules CD38 ABS expressed by CD4 and CD8 T cells, and the share of total (CD25highCD127lo/neg), and induced (CD39+) CD4 Treg. Except for CD39+Treg, a significant increase was documented in untreated PLHIV, that returned to HC values after continuous and successful ART. Thus, CD38ABS on CD4 and CD8 T, and percentage of total, and CD39+Treg in group A were not significantly different from HC: 1291 (1002–1957) vs. 1021 (873–1379); 836 (666–1174) vs 749 (626–865); 3.35 (2.55–4.73) vs 2.7 (1.8–3.6) and 13.65 (3.25–33.93) vs 18.1 (5.6–31.6), respectively (p > 0.05 for all, data not shown).
PD1 is a well characterized exhaustion marker expressed on T cells as a result of extreme stimulation. In line with this, we observed increased PD1 expression in untreated PLHIV that returned to HC values in the settings of ART treatment: 329 (263–403) vs. 273 (213–328) vs. 267 (230–318), KW p > 0.05 and 320 (285–375) vs. 277 (226–303) vs 210 (175–272), KW p < 0.05 for CD4 and CD8 T cells of groups B, group A and HC, respectively. Likewise, TIGIT, another check-point receptor associated with T-cell exhaustion, was increased on CD4 and CD8 T cells of untreated patients, while not differing significantly from HC after successful ART: 35.7 (27.6–42.5) vs. 26.1 (18.7–30.5) vs. 21.7 (17.4–27.2) and 66.9 (55.3–79.1) vs. 52.9 (42.5–60.6) vs. 41.1 (32.4–56.2) for CD4 and CD8 T cells of groups B, A, and HC, respectively. (KW p < 0.05 for both, Supplementary Table S1).
Persistent HIV infection induces in many ways accelerated proliferation and telomere attrition of CD4 and CD8 T cells, and ART may aid to this effect. Well-accepted markers of viral driven exhaustion and premature senescence are TIGIT and CD57. The antigen-driven differentiation of effector T cells is characterized by the gradual loss of CD28 and CD27 co-stimulatory receptors, and acquisition of CD57 and/or TIGIT depending on the type of stimulus.
The comparison of these markers sh”wed ’hat even in the settings of successful ART, group A exhibited significantly increased CD27-CD28-CD8 T and CD57+TIGIT-CD8 T subsets as compared to HC: 34.8 (28.5–55) vs 24.75 (8.67–33.5), p < 0.05 and 9.2 (4.3–21.8) vs 3.0 (1.5–7.3), p < 0.01, (Figure 2A,B).
To characterize in more detail these persistent changes, we studied CD57/TIGIT co-expression in each CD28/CD27 defined subset within the CD8 and CD4 pools. Changes were obvious in the settings of untreated HIV infection (Figure 3a), and most of them disappeared after treatment (Figure 3b,c).
The increased share of CD57+TIGIT- CD8 observed in ART+ PLHIV was mostly confined to the CD27-CD28- subset (Figure 3, row 4,b). At the same time, the increased expression of TIGIT on CD57-CD27+CD28- CD8 T in ART (-) PLHIV (Figure 3, row3,a) remained significantly higher as compared to HC after treatment (53.9 (45.5–68.9 vs 74.1 (60–80.1) vs 40.1 (26.7–58.5), p < 0.05), (Figure 3, row 3,b,c and Figure 4A).
Notefully, TIGIT- CD57+ CD8 subset correlated with the increase of effector CD8 T (data not shown) and was in inverse correlation with the TIGIT+CD57-CD27+CD28- intermediate effector subset (Figure 4B). The same subset analysis among CD4 T cell pool did not reveal any significant differences between ART+PLHIV and HC (data not shown).
Neither CD57+TIGIT- CD8 T, nor TIGIT+ CD57- CD27+CD28- CD8 T cells correlated with the age or treatment duration in the group of ART+ PLHIV. On the other hand, TIGIT+CD57- CD8 subset correlated directly with CD4 and CD8 AC (data not shown).
Thus, in PLHIV with suppressed HIV VL and restored CD4AC and CD4/CD8 ratio, we observed persistence of exhausted effector memory TIGIT+ CD8 T cells, at the expense of highly ytolytic CD57+ effectors within the intermediate pool. Therefore, the effector functions were largely confined to the apoptosis-prone CD57+CD27-CD28- subset.
3.3. Mitochondrial Function in CD4 and CD8 T Cells of PLHIV on Successful ART
Mitochondria are essential to T cell activity, and mitochondrial dysfunction is considered to precede T cell exhaustion. We evaluated the mitochondrial mass (MM) and mitochondrial membrane Potential (MMP) in CD4 and CD8 T cells of ART+ PLHIV as key parameters of immune cell functionality, and compared them to treatment-naïve patients and HC. CD8 T cell MM was significantly increased in untreated PLHIV, and decreased in the settings of ART to the levels of HC: 3541 (1926–6443) vs 2252 (1541–2583), p > 0.05, (Figure 5A).
On the other hand, CD4 MM remained comparable to ART (-) PLHIV: 7225 (4304–14504) vs. 7022 (6017–9884), p > 0.05), and significantly elevated as compared to HC: 7225 (4304–14504) vs 4163 (3462–6073, p < 0.05), (Figure 5B). CD8 MMP was significantly increased in untreated HIV infection, and remained significantly higher in the settings of ART (ART+ vs. HC: 2527 (1675–4080) vs 1477 (1280–1691) p < 0.01. (Figure 5C). Increased CD4 MMP did not reach a statistical significance in untreated PLHIV vs. HC: 3832 (2555–5576) vs 2634 (2352–4388, p > 0.05). However, in spite of successful ART it increased further and was significantly higher as compared to HC in ART+HIV+ donors: 5430 (3600–6534) vs 2634 (2352–4388), p < 0.05, (Figure 5D). As expected, both mitochondrial parameters correlated closely with each other, and between CD 8 and CD4 T cells. Age impacted only MM but had no effect on MMP (Rho = 0.73; p < 0.0001 and Rho = 0.32; Rho 0.35; p > 0.05 respectively). We did not find correlations between MM and MMP and CD4AC or CD4/CD8 nadirs, time from diagnosis to start of ART, or ART duration, either (Figure 6A).
In addition, different ART regimens did not affect differently MMP and MM. However, we observed a significant correlation between the increased TIGIT- CD57+ CD8 subset and CD8 MMP in ART+ PLHIV (Rho=0.45, p < 0.05), (Figure6B).
4. Discussion
The concept of immune restoration as a result of ART has developed over the years, as well as the surrogate markers of “complete” immune recovery employed. It is now well accepted that CD4AC > 500 is not equivalent to restoration, and CD4/CD8 ratio is the more sensible predictor of non-infectious degenerative complication due to an ongoing low-level immune activation. Moreover, CD4/CD8 ratio was proposed as a potential marker of HIV reservoir and its intermittent escape from suppression [6,15].
We studied a cohort of ART(+) PLHIV with both restored CD4AC and CD4/CD8 ratio in an attempt to identify biomarkers that were still significantly different from HC as a more subtle indicator of incomplete immune recovery. Our results showed that effector-memory and effector CD8 T subsets expressing TIGIT and CD57 molecules, as well as CD8T MMP remain significantly elevated in successfully treated patients, and that elevation was independent of age, therapy duration, time to treatment or CD4AC nadir. Most importantly, the increased level of senescent and exhausted CD8 T cells was combined with an increasing CD4 T cell MMP, despite the lack of important pnenotypic aberrations within the T cell pool.
T cell immunoglobulin and ITIM domain (TIGIT) was identified as inhibitory immune check point, which is induced upon activation on NK and memory T cell subsets, and interferes with T cell metabolism thereby affecting adaptive immunity. Expression of TIGIT within the CD8 T cell effector pool has been documented in different pathological settings [16]. HIV infection was shown to induce TIGIT, alongside with PD1, particularly on the intermediately differentiated CD27+CD8 effector pool containing also the HIV-specific effector cells. While TIGIT expression on CD4 T correlated with HIV viral load, this expression was retained on CD8 T effectors even in the settings of ART-controlled viral suppression. Simultaneous blocking of PD-L1 and TIGIT restored ex-vivo effector T cell response in patients with advanced melanoma, and notably in chronic HIV infection, proposing TIGIT as a novel target for personalized therapy approach in PLHIV [17,18,19].
In line with, and extending the previous findings, we demonstrated persistently enhanced TIGIT expression in long-term treated PLHIV with stable HIV viral suppression (for at least 2 years), restored CD4AC and CD4/CD8 ratio, and no clinical or laboratory signs of immune activation. The elevated TIGIT expression affected particularly the “intermediately differentiated “CD28-CD27+CD57- CD8 T subset which has both cytolytic and proliferative potential, thus rendering a large fraction of viral- specific CD8+ T cells, including most of the HIV- and CMV-specific clones vulnerable to negative regulation. Persistent TIGIT expression in the settings of ART could be, but not only, a result of previous reactivations of HIV reservoirs and /or CMV infection. It should be noted that in our study group, TIGIT+CD8 subset did not correlate with expression of other activation or exhaustion markers (CD38, CD39, PD1), pointing rather to past than to on-going stimuli. One interesting observation was the direct correlation of TIGIT+ effector subset with CD4AC and CD8 AC, which supports the idea of virus-driven stimulation. Notefully, the so called transitional memory (CD27+CD45RA-CCR7-) T cells that largely overlap with CD27+CD57-CD28- subset were shown to be the principal harbor of HIV reservoir [20].
We did not observe any correlation of increased TIGIT+ CD8 T cells with impaired mitochondrial parameters. However, TIGIT+ CD8+ T cells were shown to have signifcantly reduced expression of glycolysis genes, including GLUT1, HK1 and HK2, which resulted inimpaired glucose uptake and glycolysis – defects that directly affected T cell functions in HIV infection [21]. Whatever the cause, persistent elevated TIGIT+CD57+CD8 T in ART+ PLHIV should be considered as an important possibility to improve immune restoration, and a target of specifically tailored immune therapy.
CD57 is a well-known biomarker of end-stage CD27(-) effector T cells, exhibiting high cytolytic activity but restricted proliferative potential [22,23]. In HIV progressors, uncoordinated upregulation of CD57, and accumulation of HIV-specific CD8+CD27+CD57+ cells was documented as a sign of impaired CD8 T-cell differentiation contributing to failure of cellular immune control [24]. Lee et al. described the presence of CD57+ T lymphocytes in acute HIV infection that could be reversed with early started treatment. Recently, a study by Elias Junior et al. demonstrated a higher proportion of cells expressing CD57 among ART(+) PLHIV with CD4AC>350 as compared to age-matched HIV- controls, concluding that the restoration of normal levels of CD57-expressing T lymphocytes remains insufficient with current treatments [11]. We further extend this observation to (ART+) PLHIV with CD4AC>500 and, importantly, with normalized CD4/CD8 ratio. The latter excludes any major immune activation processes of infectious, autoimmune or neoplastic origin. Indeed, there were no laboratory or clinical data of concomitant infections or chronic degenerative diseases among our ART+HIV+ study group.
It should be noted that the biological relevance of CD57 expression on CD8 effector cells is not unequivocal. Several studies have correlated the presence of CD57+ T lymphocytes with reduced immune performance typical of exhausted cells in other infections with cytomegalovirus [25], Epstein–Barr virus [26], Mycobacterium tuberculosis [27] and Trypanosoma cruzi [28,29]. On the other hand, an increased CD57+CD27+ CD8 T subset among melanoma TIL could proliferate in response to IL-2 and differentiate into CD57+CD27- T with increased perforin expression and potent anti-tumor cytotoxicity. Therefore, CD57 was defined rather as a marker of truly end-stage effector CTL, than of T-cell senescence [23]. Also, CD57+ CD4 T cells were shown to exhibit significant cytotoxic activity against leukemia cells [30]. In our cohort of long-term treated patients with immune response to ART, CD57 expression was elevated mostly on the CD8 subset as compared to HC (Figure 2), and correlated inversely with the TIGIT+CD57- intermediate subset (Figure 4B). We could hypothesize an on-going stimulation of microbial or non-infectious origin, driving the differentiation of a limited number of TIGIT- clones to a terminal CD57+ stage, risking exhaustion in case of chronic or too vigorous activation.
The increased metabolic requirements of CD57+ effectors in our ART+study group were confirmed by changes of T cell mitochondrial parameters. Mitochondria are essential for the vigorous metabolism of immune cells. Their compromise leads to increased oxidative stress, ROS accumulation, decreased membrane potential, and ultimately – to cellular apoptosis. It is well known that both HIV-infection and ART-treatment can contribute to mitochondrial damage, and hence - to accelerated senescence, and cellular dysfunction in PLHIV [14]. We examined MM and MMP of CD4 and CD8 T cells in PLHIV with completely restored CD4AC and CD4/CD8, aiming to evaluate the “price” of this formal restoration in terms of compromised metabolism, and its association with the observed aberrations in the effector cell pool. In line with the results of Yu, F et al. on large cohorts of ART-naïve and virally suppressed PLHIV, we observed increased CD4 and CD8 MM in active HIV infection, as a sign of increased metabolic activity of virally stimulated immune cells [31]. On the other hand, in our ART+ cohort CD8 MM returned to HC values, while CD4MM further increased to become significantly different from HC. Yu, F et al. explained the late MM rebound in both CD4 and CD8 T of ART+ PLHIV with accumulating effects of ART after more than 3 years of treatment [31]. In our cohort, however, there was no correlation between MM and ART duration, and most donors were on ART for a lot longer than 3 years (8y, 5–10). Moreover, the effects observed in CD4 and CD8 T cells were different. It is known that CD4 and CD8 T cells have different metabolic capacities and susceptibility to ageing. A higher MM was described in CD4 EMRA as compared to CD8 EMRA, corresponding to a slower rate of immunosenescence [32]. It is tempting to speculate that the higher CD4 MM in the case of our ART+ cohort was associated with the observed significant enrichment in EMRA CD4 T cells, and that was not a necessarily negative sign. However, a previous study of Masson et al. showed that CM CD4 T had the highest MM, comparable in HIV(-) and HIV+ART+ donors, and CD4 CM T are a consistent part of HIV reservoirs [33]. Therefore, an increasing CD4 T MM in ART+PLHIV would be rather an alarming sign of HIV reservoir reactivation. Moreover, a significantly higher mitochondrial mass (MM) was reported in HIV-specific CD8+ T cells sensitive to apoptosis [34].
Cellular respiration and ATP synthesis depend largely on MMP. It was shown that changes in MMP play a key role in apoptotic cascade, and apoptosis is key of immune cells in the pathogenesis and progression of HIV infection. In our study we found an increased MMP of CD4 and CD8 T cells of PLHIV, that was not restored by ART. Moreover MMP increased further in CD4 T of ART+ patients.
According to Sternfeld et al. MMP was reduced in HIV-infected, ART-naïve patients compared to HIV(-) healthy subjects, and correlated negatively with the decreasing CD4AC and the increasing percentage of apoptotic lymphocytes [35]. Another study in ART-naïve and ART-exposed PLHIV demonstrated a significantly higher level of CD8 MMP in ART-naïve patients compared with HIV-negative controls, while no significant difference in CD4 MMP was observed. After long enough ART (>3 yrs) MMP in CD8+T cells gradually recovered to nearly normal levels [31].
One explanation of the conflicting results on MMP in HIV patients might be the staining techniques. A comparison between tetramethylrhodamine methyl ester and different MitoTrackers showed that probes have different sensitivity to FCCP-induced depolarization and different numerical value expression [36]. Controversies may be also attributed to different characteristics of the study groups, as well as to the particular dynamics of this parameter. Thus, a decrease of MMP has been hypothesized to be a marker of apoptotic cells. including activated T lymphocytes. However, Matarrese P et al. demonstrated that the mitochondrial membrane was hyperpolarized once lymphocytes were activated and this event preceded susceptibility to apoptotic cell death [37]. In addition, apoptosis proneness associated with an increased MMP could be exogenously modulated, e.g., by cytokines [38,39]. In line with those results, we propose that the increased CD8 T cell MMP observed in ART+PLHIV is an early apoptotic event, associated with continuous low-level activation that drives the gradual differentiation of the intermediate effector pool into terminal CD57+effectors, and, consequently, to its gradual exhaustion. A weakened capacity for CD8 effector response potentially increases the risk for reactivation of CD4 T cells, including those harboring dormant HIV. The significant correlation between increased MMP and CD57+TIGIT-CD57 CD8 T subset in ART+ PLHIV corroborates with this hypothesis.
It should be noted that prolonged exposure to ART was also shown to increase the adverse effects of HIV infection on mitochondrial functions [14]. Different ARV classes were shown to impact differently T cell metabolism, with NRTIs, NNRTIs, PIs but not INSTIs decreasing MMP [40]. We acknowledge as a limitation the small number of samples that were simultaneously phenotyped and assessed for mitochondrial markers in our study, and therefore, the impossibility to precisely evaluate ARV-specific adverse effects on MMP. Never-the-less, we did not observe any correlation between increased MMP and: ART regimen (INSTI vs. non-INSTI), ART duration, age, time to diagnosis, or time from diagnosis to treatment.
5. Conclusions
Our study on ART+PLHIV with undetectable HIV VL, and recovered CD4AC and CD4/CD8, points out several phenotypic and mitochondrial parameters signaling incomplete immune restoration. Increased MMP of CD8 T cells precedes the malfunction of CD8 effector pool, and deserves attentive monitoring, while persistently increased TIGIT+ intermediate effectors are a legitimate target for immune-mediated therapeutic interventions.
Supplementary Materials
The following supporting information can be downloaded at the website of this paper posted on Preprints.org, Table S1.
Author Contributions
Conceptualization, M.N. and R.E.; methodology, M.N. and R.E.; software, D.V., R.E. and Y.T.; validation, M.N.; formal analysis and resources, I.A., L.G, R.D, D.V.,Y.T. and N.Y.; data curation, D.V., R.E. and Y.T; writing—original draft preparation, D.V and M.N.; writing—review and editing, M.N, R.E,.Y.T., D.V.; project administration, R.E.; funding acquisition, R. E. All authors have read and agreed to the published version of the manuscript.
Funding
This research was funded by Bulgarian National Science Fund, Research Grant KP-06-H73/9/14.12.2023, “Oxidative stress and mitochondrial activity in T-lymphocytes: potential biomarkers for monitoring long-term antiretroviral therapy in HIV+ individuals”.
Institutional Review Board Statement
The study was conducted in accordance with the Declaration of Helsinki and approved by the Ethics Committee of the National Centre of Infectious and Parasitic Diseases, Sofia, Bulgaria, Protocol 5/2024, (NCIPD IRB 00006384).
Informed Consent Statement
Informed consent was obtained from all subjects involved in the study.
Data Availability Statement
The authors confirm that the data supporting the findings of this study are available within the article.
Conflicts of Interest
The authors declare no conflicts of interest.
Abbreviations
The following abbreviations are used in this manuscript:
| ART | Contemporary antiretroviral therapy |
| PLHIV | People living with HIV |
| HIV | Human immunodeficiency viruses |
| AIDS | Acquired immunodeficiency syndrome |
| ARV | Antiretroviral drugs |
| NRTIs | Nucleoside Reverse Transcriptase Inhibitors |
| NNRTIs | Non-nucleoside Reverse Transcriptase Inhibitors |
References
- Bloch, M.; John, M.; Smith, D.; Rasmussen, T.A.; Wright, E. Managing HIV-associated inflammation and ageing in the era of modern ART. HIV Med 2020, 21 (Suppl 3), 2–16. [Google Scholar] [CrossRef] [PubMed]
- Serrano-Villar, S.; Gutierrez, C.; Vallejo, A.; Hernandez-Novoa, B.; Diaz, L.; Abad Fernandez, M.; Madrid, N.; Dronda, F.; Zamora, J.; Munoz-Fernandez, M.A.; et al. The CD4/CD8 ratio in HIV-infected subjects is independently associated with T-cell activation despite long-term viral suppression. J Infect 2013, 66, 57–66. [Google Scholar] [CrossRef]
- Streeck, H.; Maestri, A.; Habermann, D.; Crowell, T.A.; Esber, A.L.; Son, G.; Eller, L.A.; Eller, M.A.; Parikh, A.P.; Horn, P.A.; et al. Dissecting drivers of immune activation in chronic HIV-1 infection. EBioMedicine 2022, 83, 104182. [Google Scholar] [CrossRef]
- Gergen, M.; Hewitt, A.; Sanger, C.B.; Striker, R. Monitoring immune recovery on HIV therapy: Critical, helpful, or waste of money in the current era? AIDS 2024, 38, 937–943. [Google Scholar] [CrossRef] [PubMed]
- Okulicz, J.F.; Le, T.D.; Agan, B.K.; Camargo, J.F.; Landrum, M.L.; Wright, E.; Dolan, M.J.; Ganesan, A.; Ferguson, T.M.; Smith, D.M.; et al. Influence of the timing of antiretroviral therapy on the potential for normalization of immune status in human immunodeficiency virus 1-infected individuals. JAMA Intern Med 2015, 175, 88–99. [Google Scholar] [CrossRef] [PubMed]
- Ron, R.; Moreno, E.; Martinez-Sanz, J.; Branas, F.; Sainz, T.; Moreno, S.; Serrano-Villar, S. CD4/CD8 Ratio During Human Immunodeficiency Virus Treatment: Time for Routine Monitoring? Clin Infect Dis 2023, 76, 1688–1696. [Google Scholar] [CrossRef] [PubMed]
- Coppe, J.P.; Desprez, P.Y.; Krtolica, A.; Campisi, J. The senescence-associated secretory phenotype: The dark side of tumor suppression. Annu Rev Pathol 2010, 5, 99–118. [Google Scholar] [CrossRef]
- Mittelbrunn, M.; Kroemer, G. Hallmarks of T cell aging. Nat Immunol 2021, 22, 687–698. [Google Scholar] [CrossRef]
- Gubser, C.; Chiu, C.; Lewin, S.R.; Rasmussen, T.A. Immune checkpoint blockade in HIV. EBioMedicine 2022, 76, 103840. [Google Scholar] [CrossRef]
- Yero, A.; Shi, T.; Farnos, O.; Routy, J.P.; Tremblay, C.; Durand, M.; Tsoukas, C.; Costiniuk, C.T.; Jenabian, M.A. Dynamics and epigenetic signature of regulatory T-cells following antiretroviral therapy initiation in acute HIV infection. EBioMedicine 2021, 71, 103570. [Google Scholar] [CrossRef]
- Elias Junior, E.; Gubert, V.T.; Bonin-Jacob, C.M.; Puga, M.A.M.; Gouveia, C.G.; Sichinel, A.H.; Tozetti, I.A. CD57 T cells associated with immunosenescence in adults living with HIV or AIDS. Immunology 2024, 171, 146–153. [Google Scholar] [CrossRef] [PubMed]
- Wang, Q.; Yuan, Y.; Liu, J.; Li, C.; Jiang, X. The role of mitochondria in aging, cell death, and tumor immunity. Front Immunol 2024, 15, 1520072. [Google Scholar] [CrossRef] [PubMed]
- Lundgren, J.D.; Borges, A.H.; Neaton, J.D. Serious Non-AIDS Conditions in HIV: Benefit of Early ART. Curr HIV/AIDS Rep 2018, 15, 162–171. [Google Scholar] [CrossRef] [PubMed]
- Schank, M.; Zhao, J.; Moorman, J.P.; Yao, Z.Q. The Impact of HIV- and ART-Induced Mitochondrial Dysfunction in Cellular Senescence and Aging. Cells 2021, 10, 174. [Google Scholar] [CrossRef]
- Belaunzaran-Zamudio, P.F.; Naranjo, L.; Caro-Vega, Y.; Castillo-Mancilla, J.R.; Camiro-Zuniga, A.; Fuentes-Garcia, R.; Crabtree-Ramirez, B.E.; Sierra-Madero, J.G. Incomplete Antiretroviral Therapy Adherence Is Associated with Lower CD4-CD8 Ratio in Virally Suppressed Patients with HIV Infection in Mexico. AIDS Res Hum Retroviruses 2023, 39, 136–144. [Google Scholar] [CrossRef]
- Jantz-Naeem, N.; Bottcher-Loschinski, R.; Borucki, K.; Mitchell-Flack, M.; Bottcher, M.; Schraven, B.; Mougiakakos, D.; Kahlfuss, S. TIGIT signaling and its influence on T cell metabolism and immune cell function in the tumor microenvironment. Front Oncol 2023, 13, 1060112. [Google Scholar] [CrossRef]
- Johnston, R.J.; Comps-Agrar, L.; Hackney, J.; Yu, X.; Huseni, M.; Yang, Y.; Park, S.; Javinal, V.; Chiu, H.; Irving, B.; et al. The immunoreceptor TIGIT regulates antitumor and antiviral CD8(+) T cell effector function. Cancer Cell 2014, 26, 923–937. [Google Scholar] [CrossRef]
- Chauvin, J.M.; Pagliano, O.; Fourcade, J.; Sun, Z.; Wang, H.; Sander, C.; Kirkwood, J.M.; Chen, T.H.; Maurer, M.; Korman, A.J.; et al. TIGIT and PD-1 impair tumor antigen-specific CD8(+) T cells in melanoma patients. J Clin Invest 2015, 125, 2046–2058. [Google Scholar] [CrossRef]
- Chew, G.M.; Fujita, T.; Webb, G.M.; Burwitz, B.J.; Wu, H.L.; Reed, J.S.; Hammond, K.B.; Clayton, K.L.; Ishii, N.; Abdel-Mohsen, M.; et al. TIGIT Marks Exhausted T Cells, Correlates with Disease Progression, and Serves as a Target for Immune Restoration in HIV and SIV Infection. PLoS Pathog 2016, 12, e1005349. [Google Scholar] [CrossRef]
- Chomont, N.; El-Far, M.; Ancuta, P.; Trautmann, L.; Procopio, F.A.; Yassine-Diab, B.; Boucher, G.; Boulassel, M.R.; Ghattas, G.; Brenchley, J.M.; et al. HIV reservoir size and persistence are driven by T cell survival and homeostatic proliferation. Nat Med 2009, 15, 893–900. [Google Scholar] [CrossRef]
- Calvet-Mirabent, M.; Sanchez-Cerrillo, I.; Martin-Cofreces, N.; Martinez-Fleta, P.; de la Fuente, H.; Tsukalov, I.; Delgado-Arevalo, C.; Calzada, M.J.; de Los Santos, I.; Sanz, J.; et al. Antiretroviral therapy duration and immunometabolic state determine efficacy of ex vivo dendritic cell-based treatment restoring functional HIV-specific CD8+ T cells in people living with HIV. EBioMedicine 2022, 81, 104090. [Google Scholar] [CrossRef]
- Strioga, M.; Pasukoniene, V.; Characiejus, D. CD8+ CD28- and CD8+ CD57+ T cells and their role in health and disease. Immunology 2011, 134, 17–32. [Google Scholar] [CrossRef]
- Wu, R.C.; Hwu, P.; Radvanyi, L.G. New insights on the role of CD8(+)CD57(+) T-cells in cancer. Oncoimmunology 2012, 1, 954–956. [Google Scholar] [CrossRef]
- Hoji, A.; Connolly, N.C.; Buchanan, W.G.; Rinaldo, C.R., Jr. CD27 and CD57 expression reveals atypical differentiation of human immunodeficiency virus type 1-specific memory CD8+ T cells. Clin Vaccine Immunol 2007, 14, 74–80. [Google Scholar] [CrossRef]
- Lee, S.A.; Sinclair, E.; Hatano, H.; Hsue, P.Y.; Epling, L.; Hecht, F.M.; Bangsberg, D.R.; Martin, J.N.; McCune, J.M.; Deeks, S.G.; et al. Impact of HIV on CD8+ T cell CD57 expression is distinct from that of CMV and aging. PLoS ONE 2014, 9, e89444. [Google Scholar] [CrossRef]
- Cencioni, M.T.; Magliozzi, R.; Nicholas, R.; Ali, R.; Malik, O.; Reynolds, R.; Borsellino, G.; Battistini, L.; Muraro, P.A. Programmed death 1 is highly expressed on CD8(+) CD57(+) T cells in patients with stable multiple sclerosis and inhibits their cytotoxic response to Epstein-Barr virus. Immunology 2017, 152, 660–676. [Google Scholar] [CrossRef]
- Lee, J.Y.; Jeong, I.; Joh, J.S.; Jung, Y.W.; Sim, S.Y.; Choi, B.; Jee, H.G.; Lim, D.G. Differential expression of CD57 in antigen-reactive CD4+ T cells between active and latent tuberculosis infection. Clin Immunol 2015, 159, 37–46. [Google Scholar] [CrossRef]
- Albareda, M.C.; Laucella, S.A. Modulation of Trypanosoma cruzi-specific T-cell responses after chemotherapy for chronic Chagas disease. Mem Inst Oswaldo Cruz 2015, 110, 414–421. [Google Scholar] [CrossRef]
- Arguello, R.J.; Albareda, M.C.; Alvarez, M.G.; Bertocchi, G.; Armenti, A.H.; Vigliano, C.; Meckert, P.C.; Tarleton, R.L.; Laucella, S.A. Inhibitory receptors are expressed by Trypanosoma cruzi-specific effector T cells and in hearts of subjects with chronic Chagas disease. PLoS ONE 2012, 7, e35966. [Google Scholar] [CrossRef]
- Watanabe, N.; Takaku, T.; Takeda, K.; Shirane, S.; Toyota, T.; Koike, M.; Noguchi, M.; Hirano, T.; Fujiwara, H.; Komatsu, N. Dasatinib-induced anti-leukemia cellular immunity through a novel subset of CD57 positive helper/cytotoxic CD4 T cells in chronic myelogenous leukemia patients. Int J Hematol 2018, 108, 588–597. [Google Scholar] [CrossRef]
- Yu, F.; Hao, Y.; Zhao, H.; Xiao, J.; Han, N.; Zhang, Y.; Dai, G.; Chong, X.; Zeng, H.; Zhang, F. Distinct Mitochondrial Disturbance in CD4+T and CD8+T Cells From HIV-Infected Patients. J Acquir Immune Defic Syndr 2017, 74, 206–212. [Google Scholar] [CrossRef] [PubMed]
- Callender, L.A.; Carroll, E.C.; Bober, E.A.; Akbar, A.N.; Solito, E.; Henson, S.M. Mitochondrial mass governs the extent of human T cell senescence. Aging Cell 2020, 19, e13067. [Google Scholar] [CrossRef]
- Masson, J.J.R.; Murphy, A.J.; Lee, M.K.S.; Ostrowski, M.; Crowe, S.M.; Palmer, C.S. Assessment of metabolic and mitochondrial dynamics in CD4+ and CD8+ T cells in virologically suppressed HIV-positive individuals on combination antiretroviral therapy. PLoS ONE 2017, 12, e0183931. [Google Scholar] [CrossRef] [PubMed]
- Petrovas, C.; Mueller, Y.M.; Dimitriou, I.D.; Altork, S.R.; Banerjee, A.; Sklar, P.; Mounzer, K.C.; Altman, J.D.; Katsikis, P.D. Increased mitochondrial mass characterizes the survival defect of HIV-specific CD8(+) T cells. Blood 2007, 109, 2505–2513. [Google Scholar] [CrossRef]
- Sternfeld, T.; Tischleder, A.; Schuster, M.; Bogner, J.R. Mitochondrial membrane potential and apoptosis of blood mononuclear cells in untreated HIV-1 infected patients. HIV Med 2009, 10, 512–519. [Google Scholar] [CrossRef]
- Desai, S.; Grefte, S.; van de Westerlo, E.; Lauwen, S.; Paters, A.; Prehn, J.H.M.; Gan, Z.; Keijer, J.; Adjobo-Hermans, M.J.W.; Koopman, W.J.H. Performance of TMRM and Mitotrackers in mitochondrial morphofunctional analysis of primary human skin fibroblasts. Biochim Biophys Acta Bioenerg 2024, 1865, 149027. [Google Scholar] [CrossRef] [PubMed]
- Matarrese, P.; Gambardella, L.; Cassone, A.; Vella, S.; Cauda, R.; Malorni, W. Mitochondrial membrane hyperpolarization hijacks activated T lymphocytes toward the apoptotic-prone phenotype: Homeostatic mechanisms of HIV protease inhibitors. J Immunol 2003, 170, 6006–6015. [Google Scholar] [CrossRef]
- Gergely, P., Jr.; Niland, B.; Gonchoroff, N.; Pullmann, R., Jr.; Phillips, P.E.; Perl, A. Persistent mitochondrial hyperpolarization, increased reactive oxygen intermediate production, and cytoplasmic alkalinization characterize altered IL-10 signaling in patients with systemic lupus erythematosus. J Immunol 2002, 169, 1092–1101. [Google Scholar] [CrossRef]
- Matarrese, P.; Di Biase, L.; Santodonato, L.; Straface, E.; Mecchia, M.; Ascione, B.; Parmiani, G.; Belardelli, F.; Ferrantini, M.; Malorni, W. Type I interferon gene transfer sensitizes melanoma cells to apoptosis via a target activity on mitochondrial function. Am J Pathol 2002, 160, 1507–1520. [Google Scholar] [CrossRef]
- Gay, L.; Desquiret-Dumas, V.; Nagot, N.; Rapenne, C.; Van de Perre, P.; Reynier, P.; Moles, J.P. Long-term persistence of mitochondrial dysfunctions after viral infections and antiviral therapies: A review of mechanisms involved. J Med Virol 2024, 96, e29886. [Google Scholar] [CrossRef]
Figure 1.
Comparison between the differentiations profiles of CD4 and CD8 T cell pools of the studied groups. The relative shares of naïve, CM, EM, and TEMRA among the CD4 T (A) and CD8 T (B) cells are presented. Statistical differences were evaluated by the non-parametric Kruskall-Wallis test. Only the statistical differences between ART+HIV+ and HC are marked, * p < 0.05.
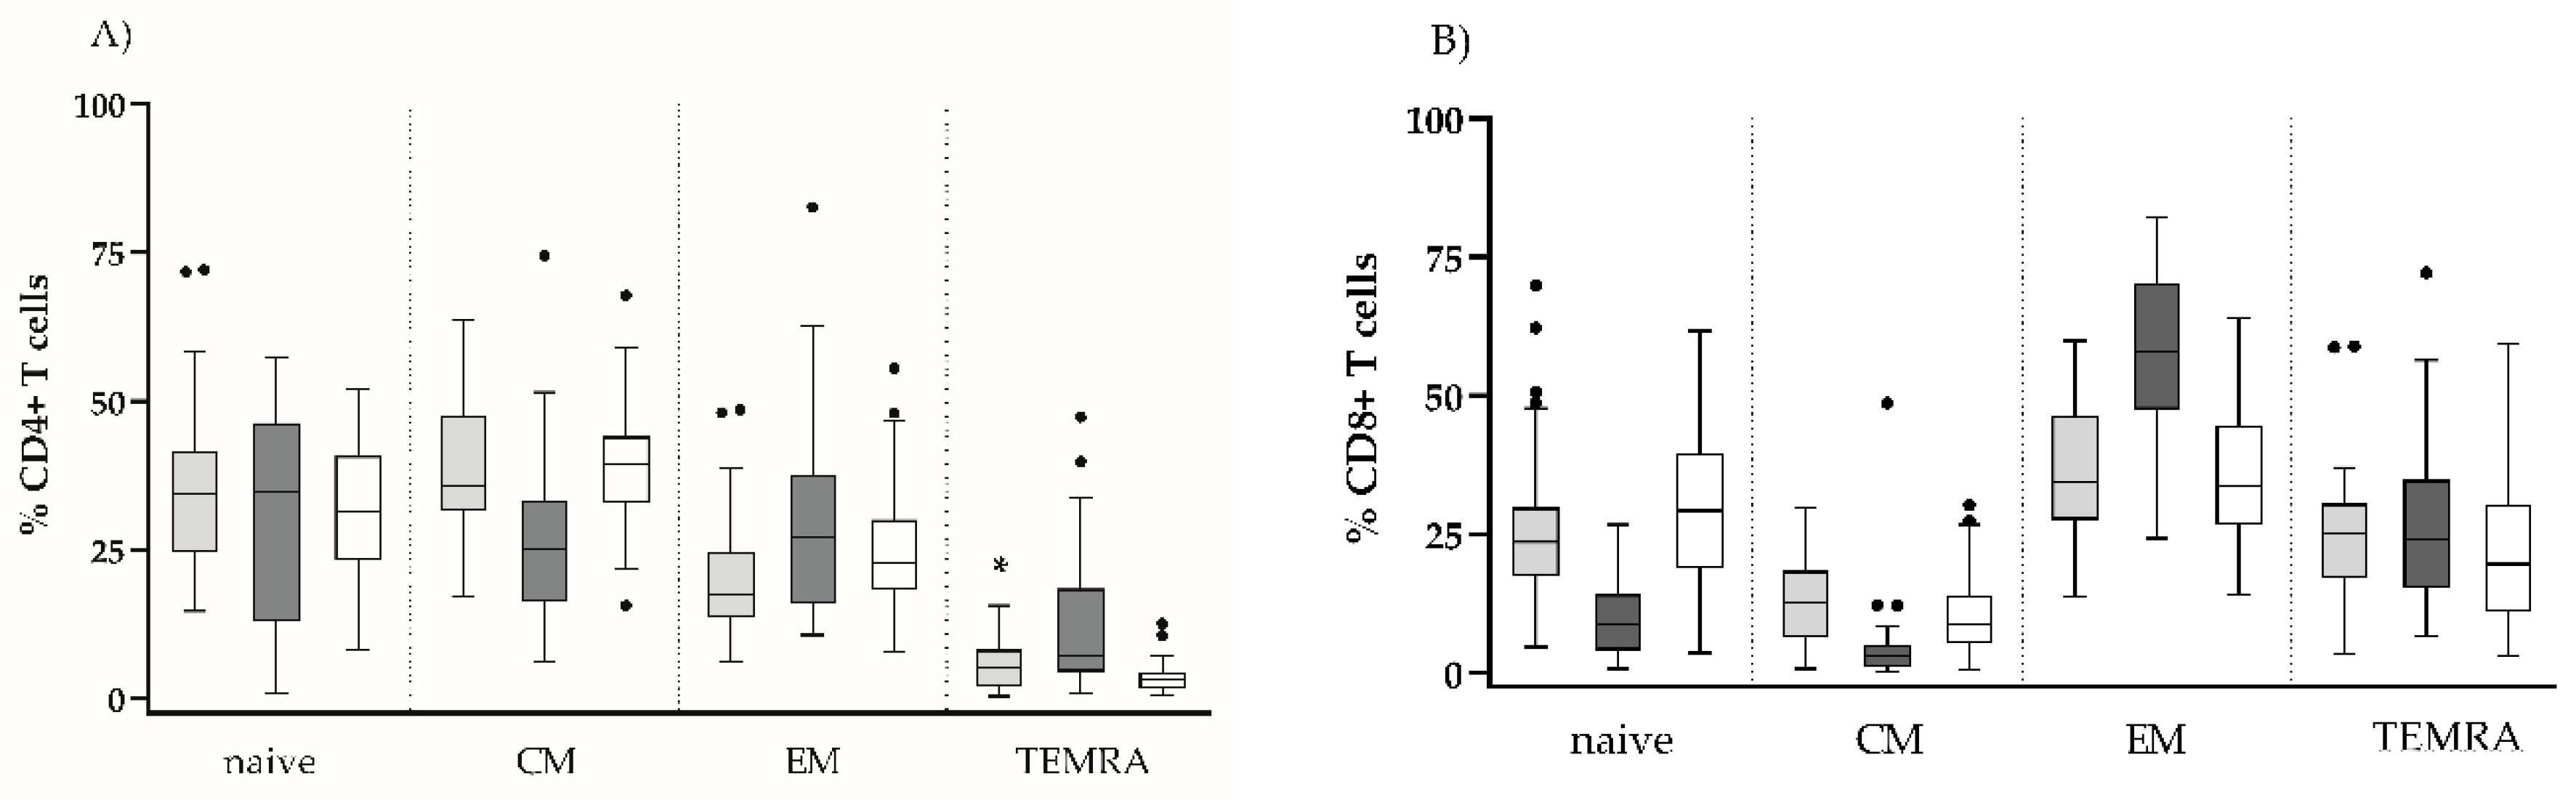
Figure 2.
Effector CD8 T cell subsets with exhausted/senescent phenotype in the settings of ART: CD27-CD28- (A), TIGIT-CD57+ (B) Individual values for the three studied groups are presented. Gating strategy: For (A). the percentage of CD27-CD28-, and within CD8+CD3+ gated lymphocytes was determined; for (B). TIGIT-CD57+ cells were determined as percent from CD8+CD3+ gated lymphocytes (* p < 0.05; *** p < 0.001, ns, non-significant).
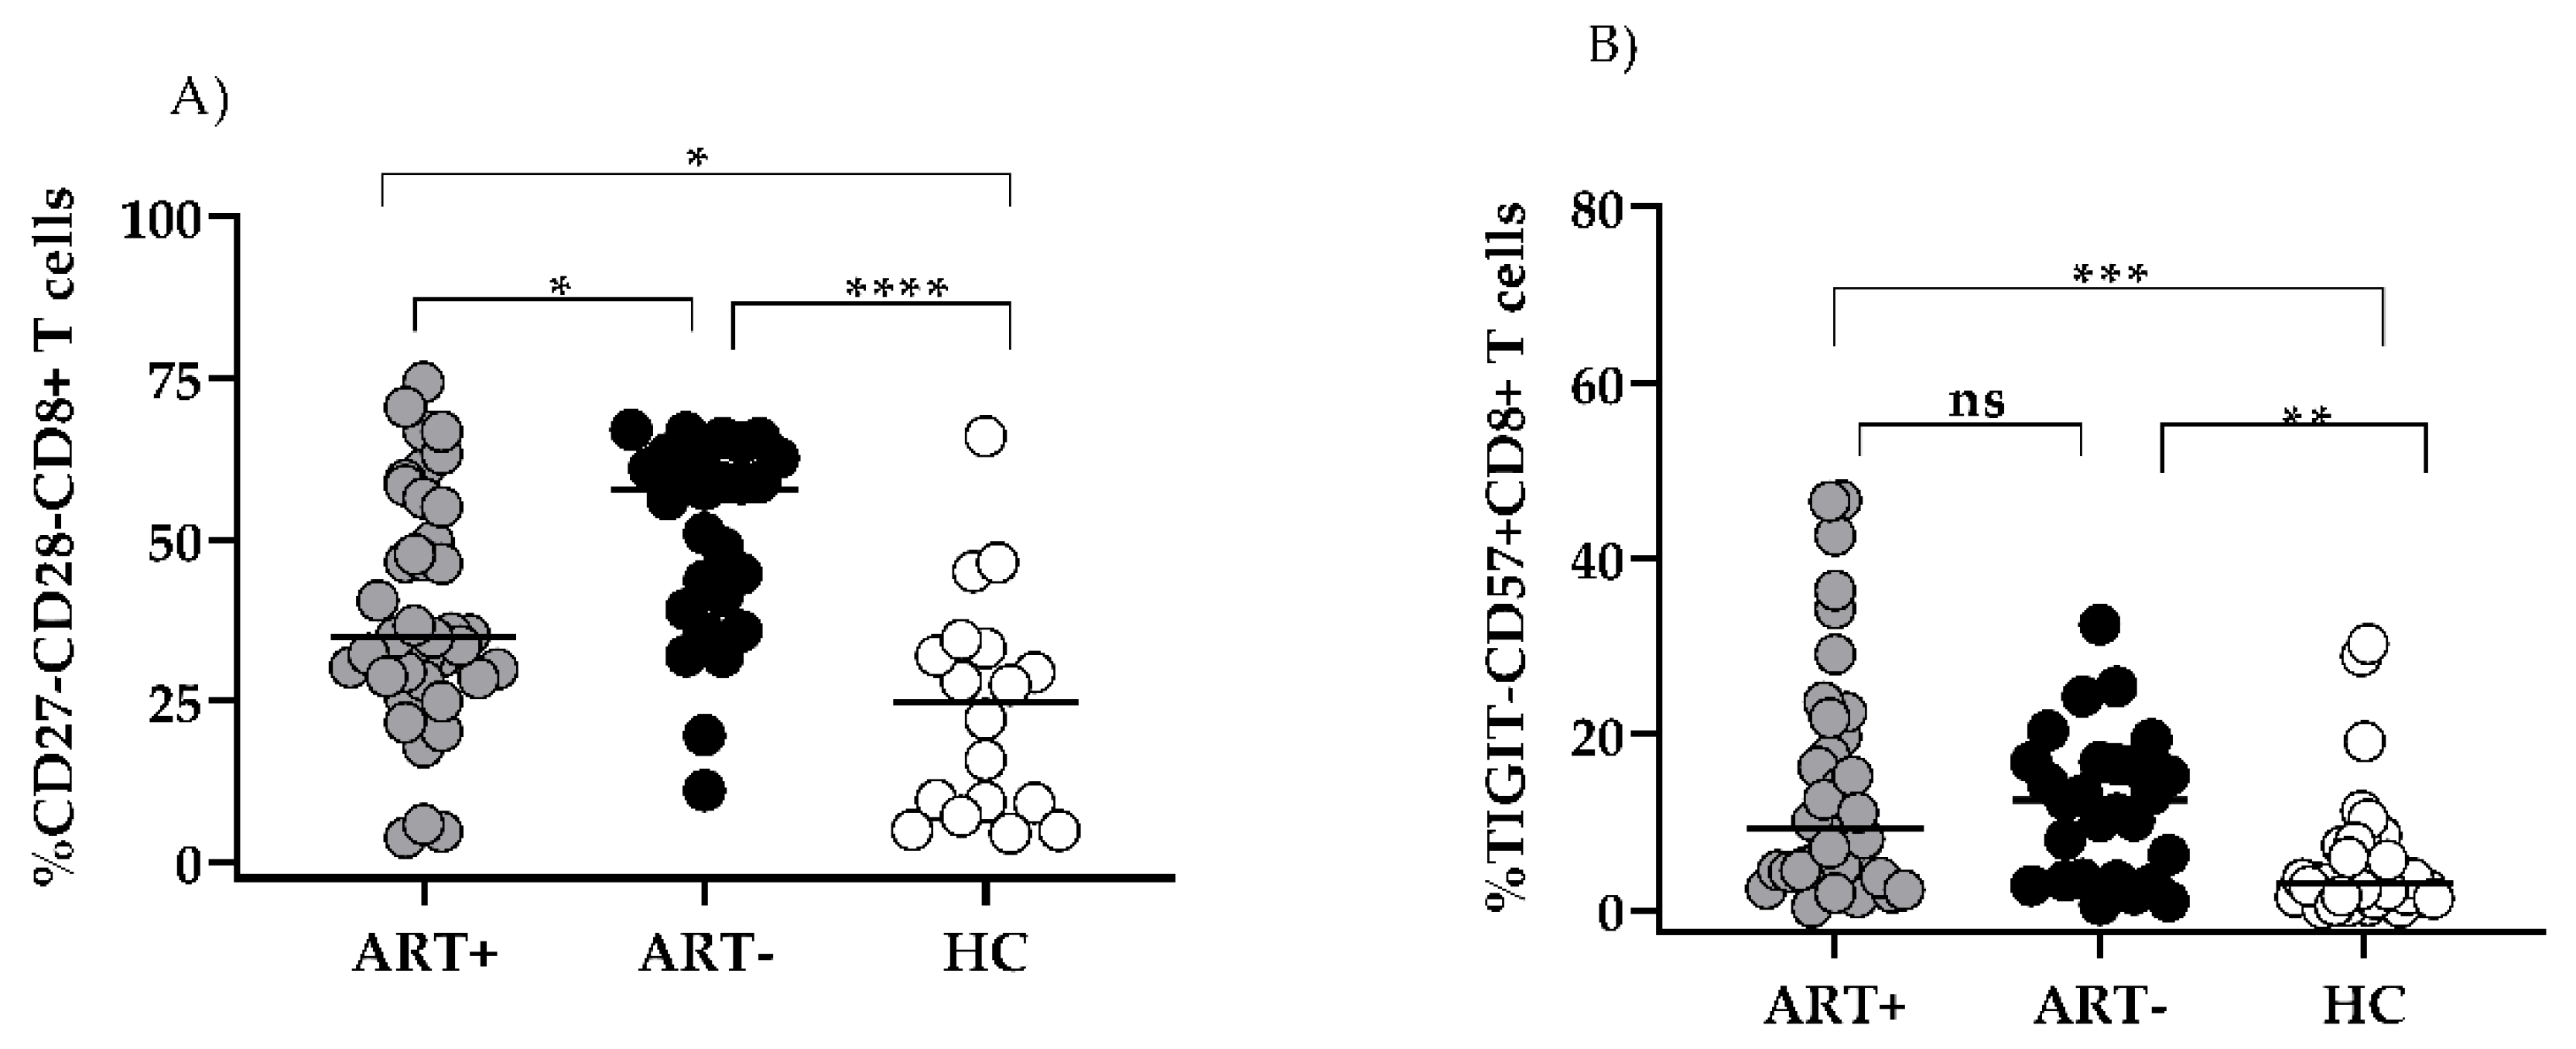
Figure 3.
Co-expression of CD57/TIGIT on CD27/CD28-defined subsets of HIV+ART- (A), HIV+ART+ (B) and HIV- donors (C): Samples were stained with a combination of CD57/CD28/CD8/CD3/TIGIT/CD27 mAbs. Gating strategy: Within the CD3+CD8+ gate, effector T cell subsets were determined by CD28/CD27 co-expression. The percentage of TIGIT+CD57-, TIGIT+CD57+, TIGIT-CD57+ and TIGIT-CD57- cells were determined in each CD27/CD28 defined CD8 T cell subset. Representative samples are shown.
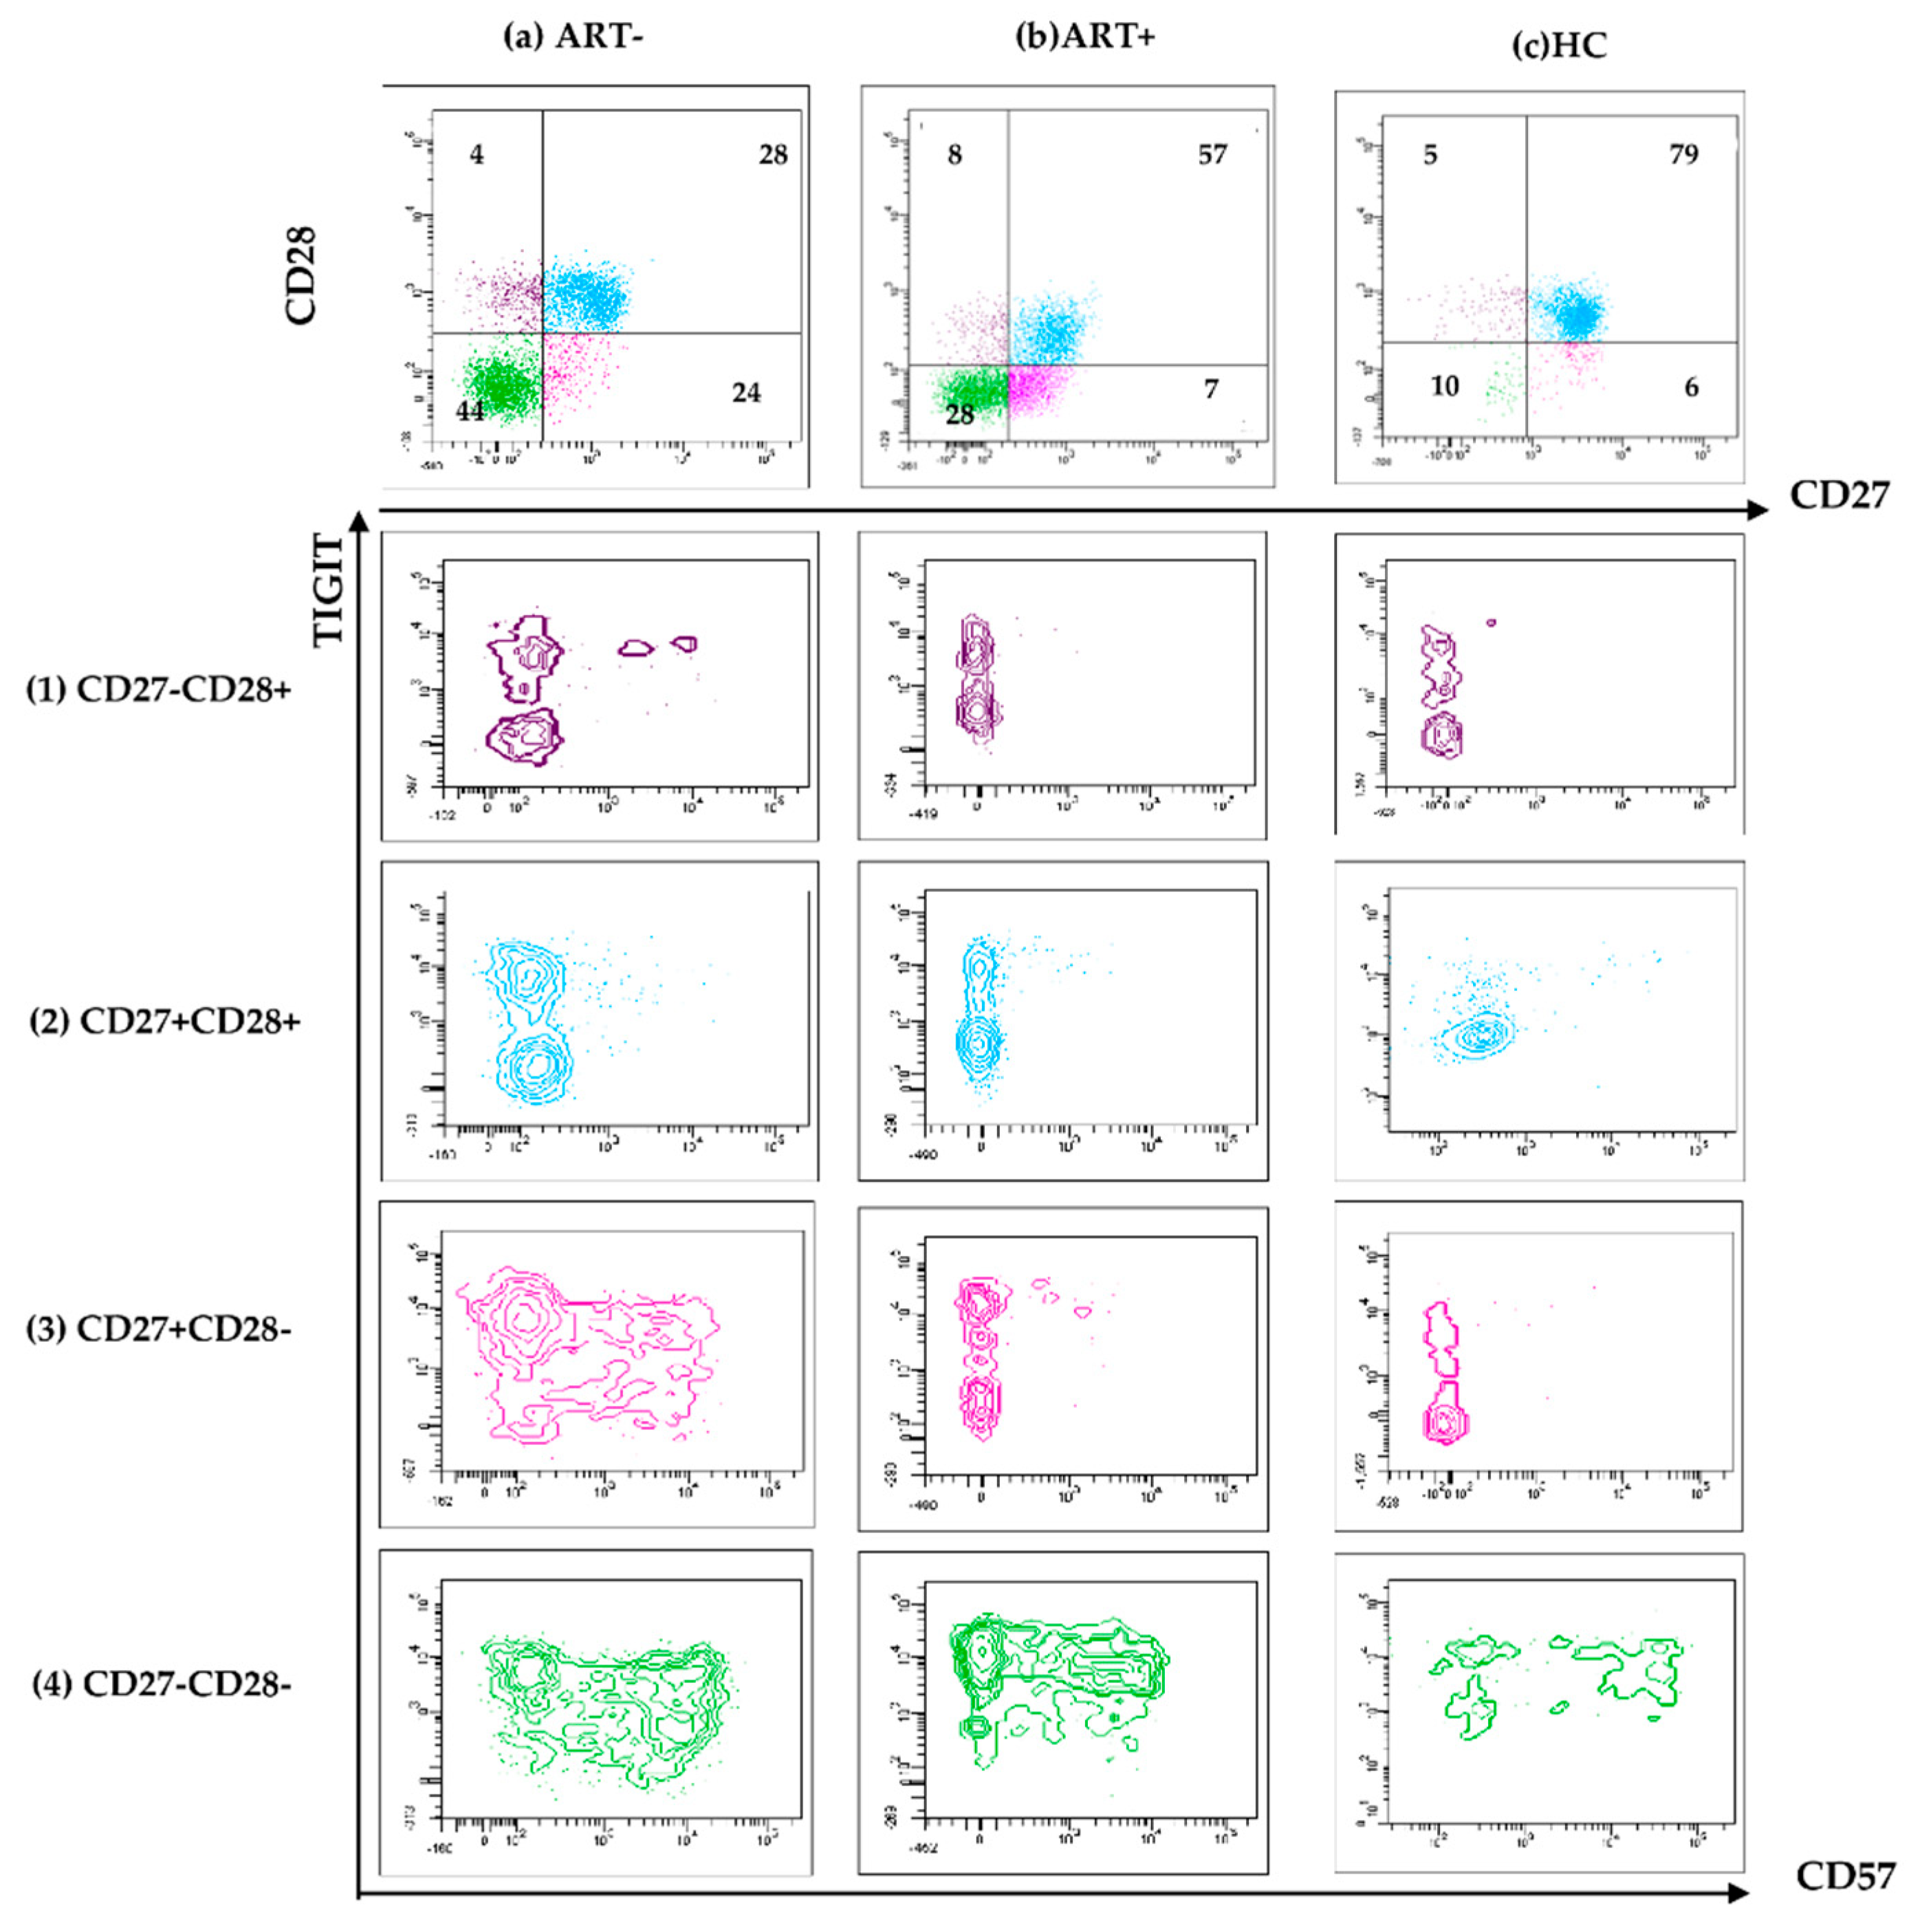
Figure 4.
Exhausted CD8 T cells persist in the settings of successful ART: TIGIT+CD57-CD27+CD28- CD8 T cells are compared between the studied groups (A) Inverse correlation between TIGIT+CD57-CD27+CD28- CD8 T and CD57+TIGIT- CD8 T. (B) Individual values for the three studied groups are presented. (* p < 0.05; ** p < 0.01, *** p < 0.001, ns, non-significant; MW).
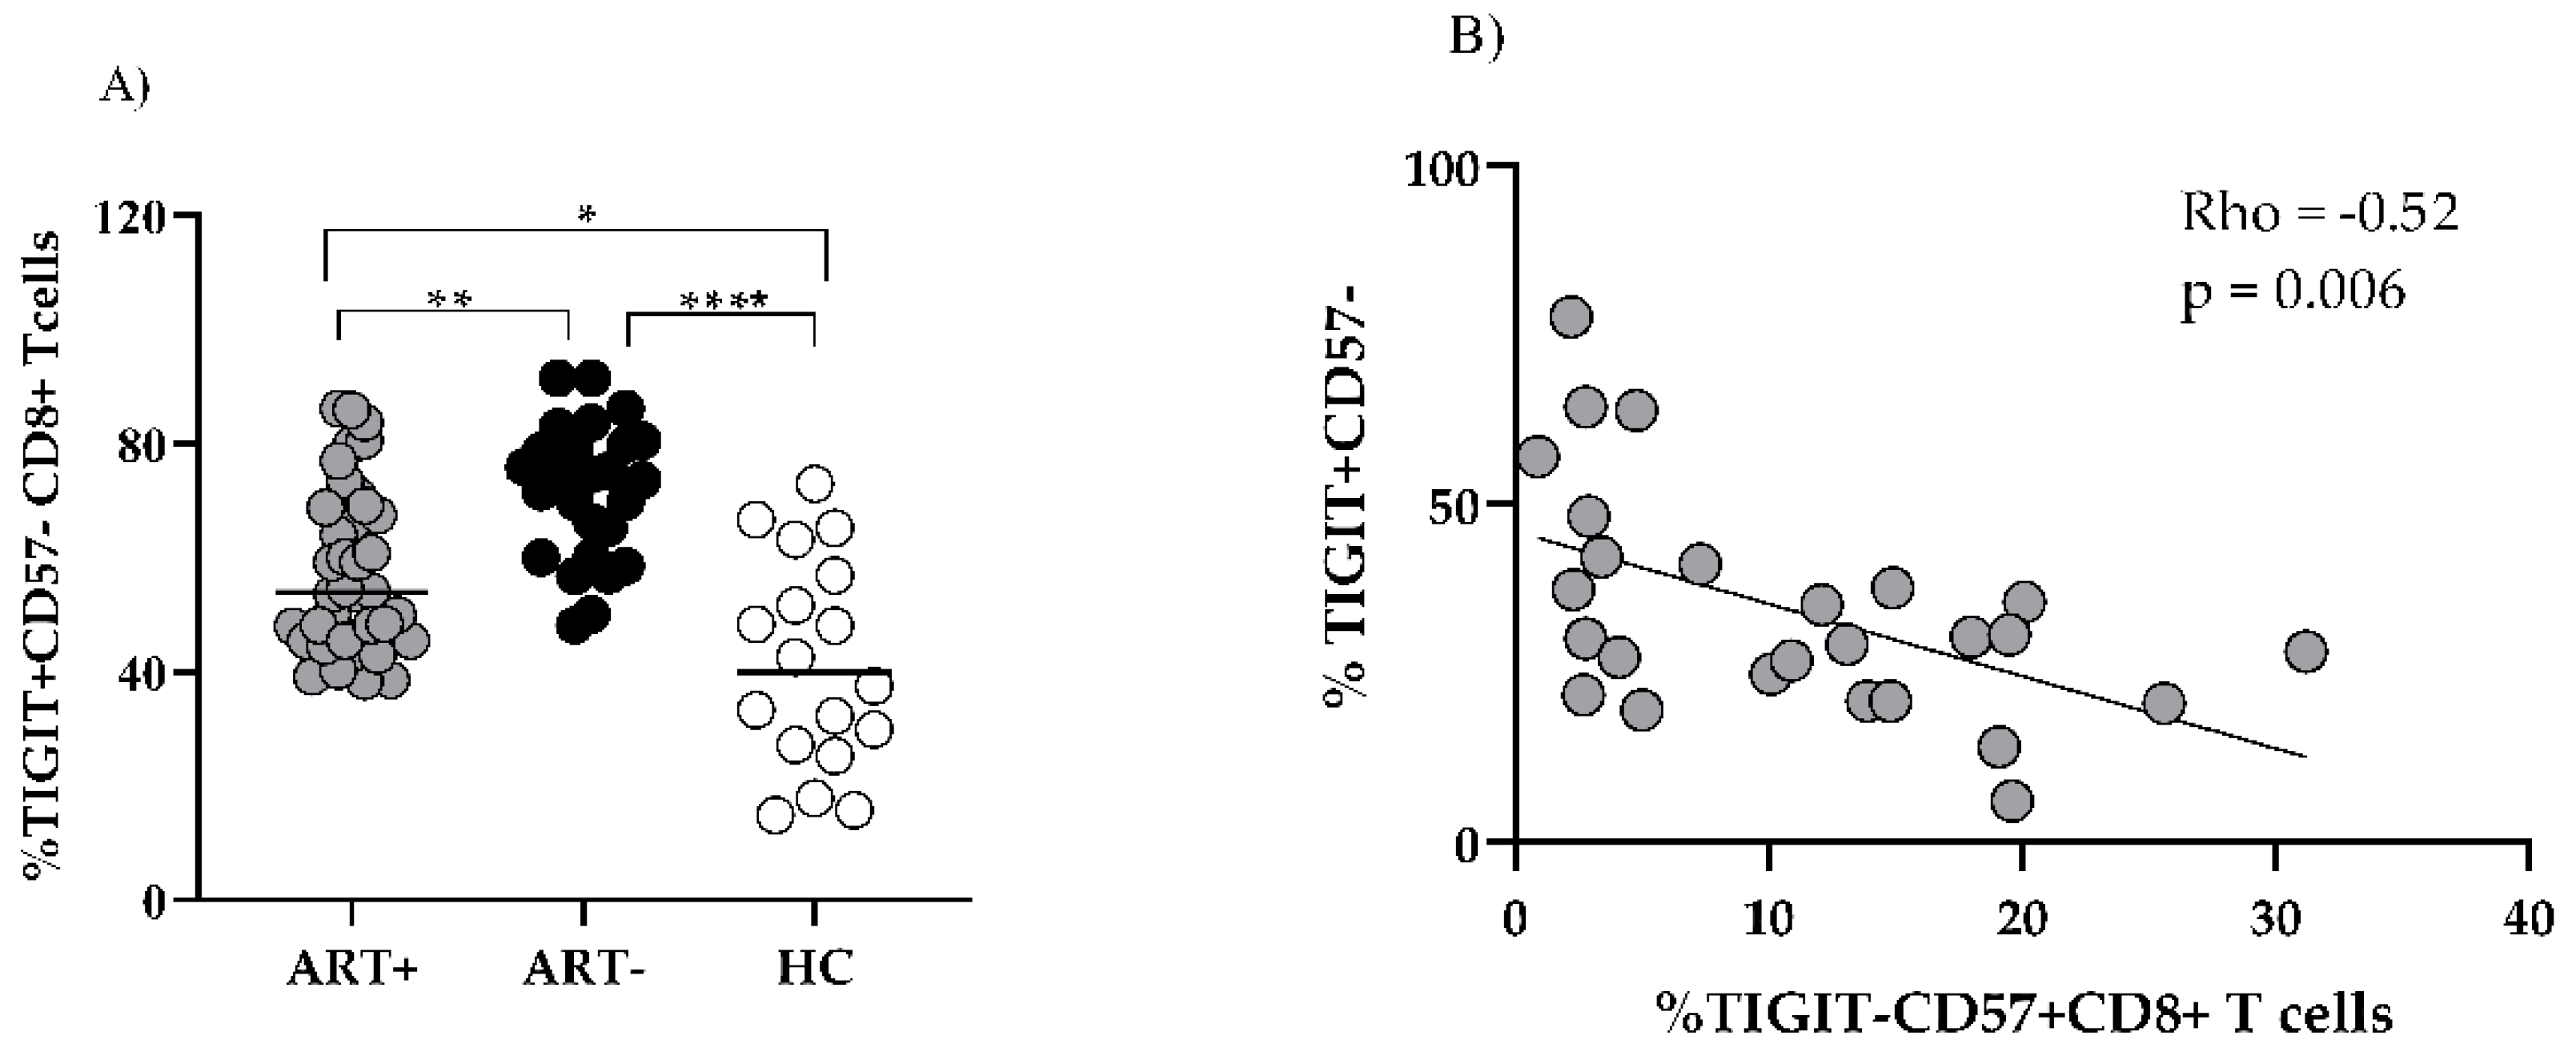
Figure 5.
Mitochondrial parameters of T cells in the settings of ART. Mitochondrial Mass (MM) MFI (A,B) (and MMP (C,D) in CD8 (A,C) and CD4 (B,D) T cells of ART+ PLHIV, ART- PLHIV and HC. Individual values are presented. * p < 0.05; ** p < 0.01; *** p < 0.001.
Figure 5.
Mitochondrial parameters of T cells in the settings of ART. Mitochondrial Mass (MM) MFI (A,B) (and MMP (C,D) in CD8 (A,C) and CD4 (B,D) T cells of ART+ PLHIV, ART- PLHIV and HC. Individual values are presented. * p < 0.05; ** p < 0.01; *** p < 0.001.
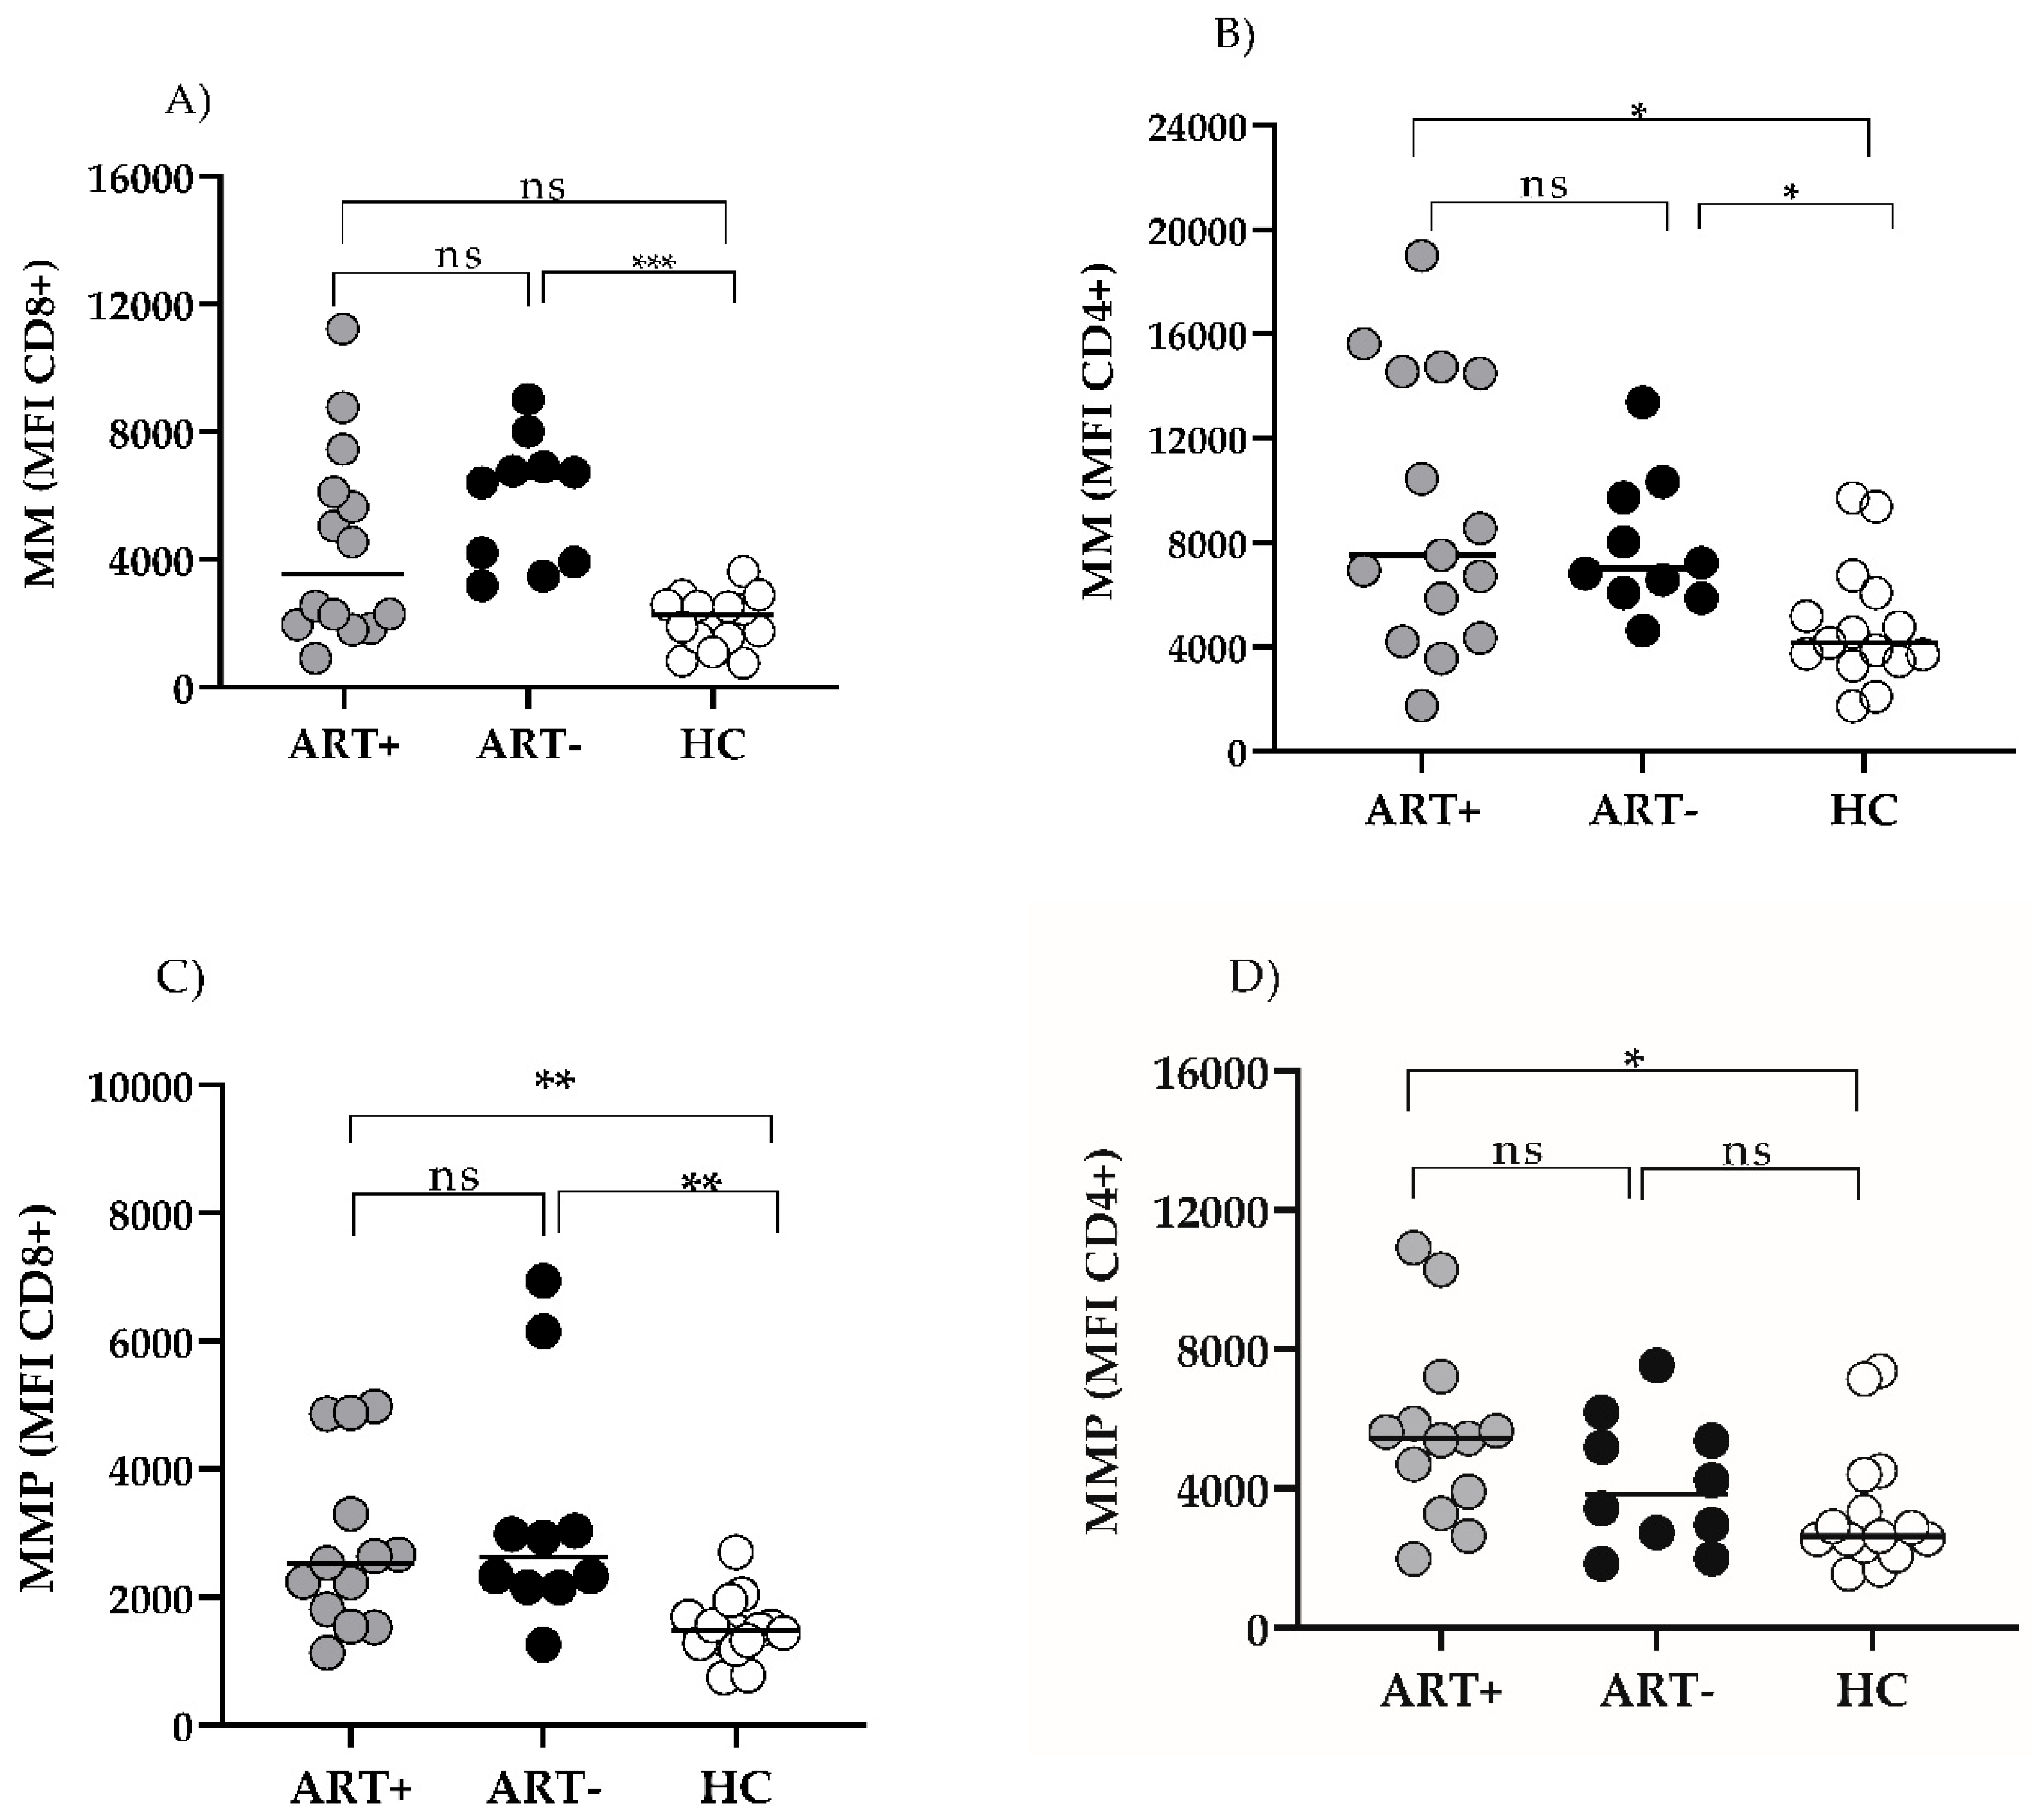
Figure 6.
Correlations of T cell MMP in ART+ PLHIV. CD4 and CD8 T MMP does not correlate with ART duration (A); CD8 MMP correlates with TIGIT- CD57+CD8 T effectors (B).
Figure 6.
Correlations of T cell MMP in ART+ PLHIV. CD4 and CD8 T MMP does not correlate with ART duration (A); CD8 MMP correlates with TIGIT- CD57+CD8 T effectors (B).
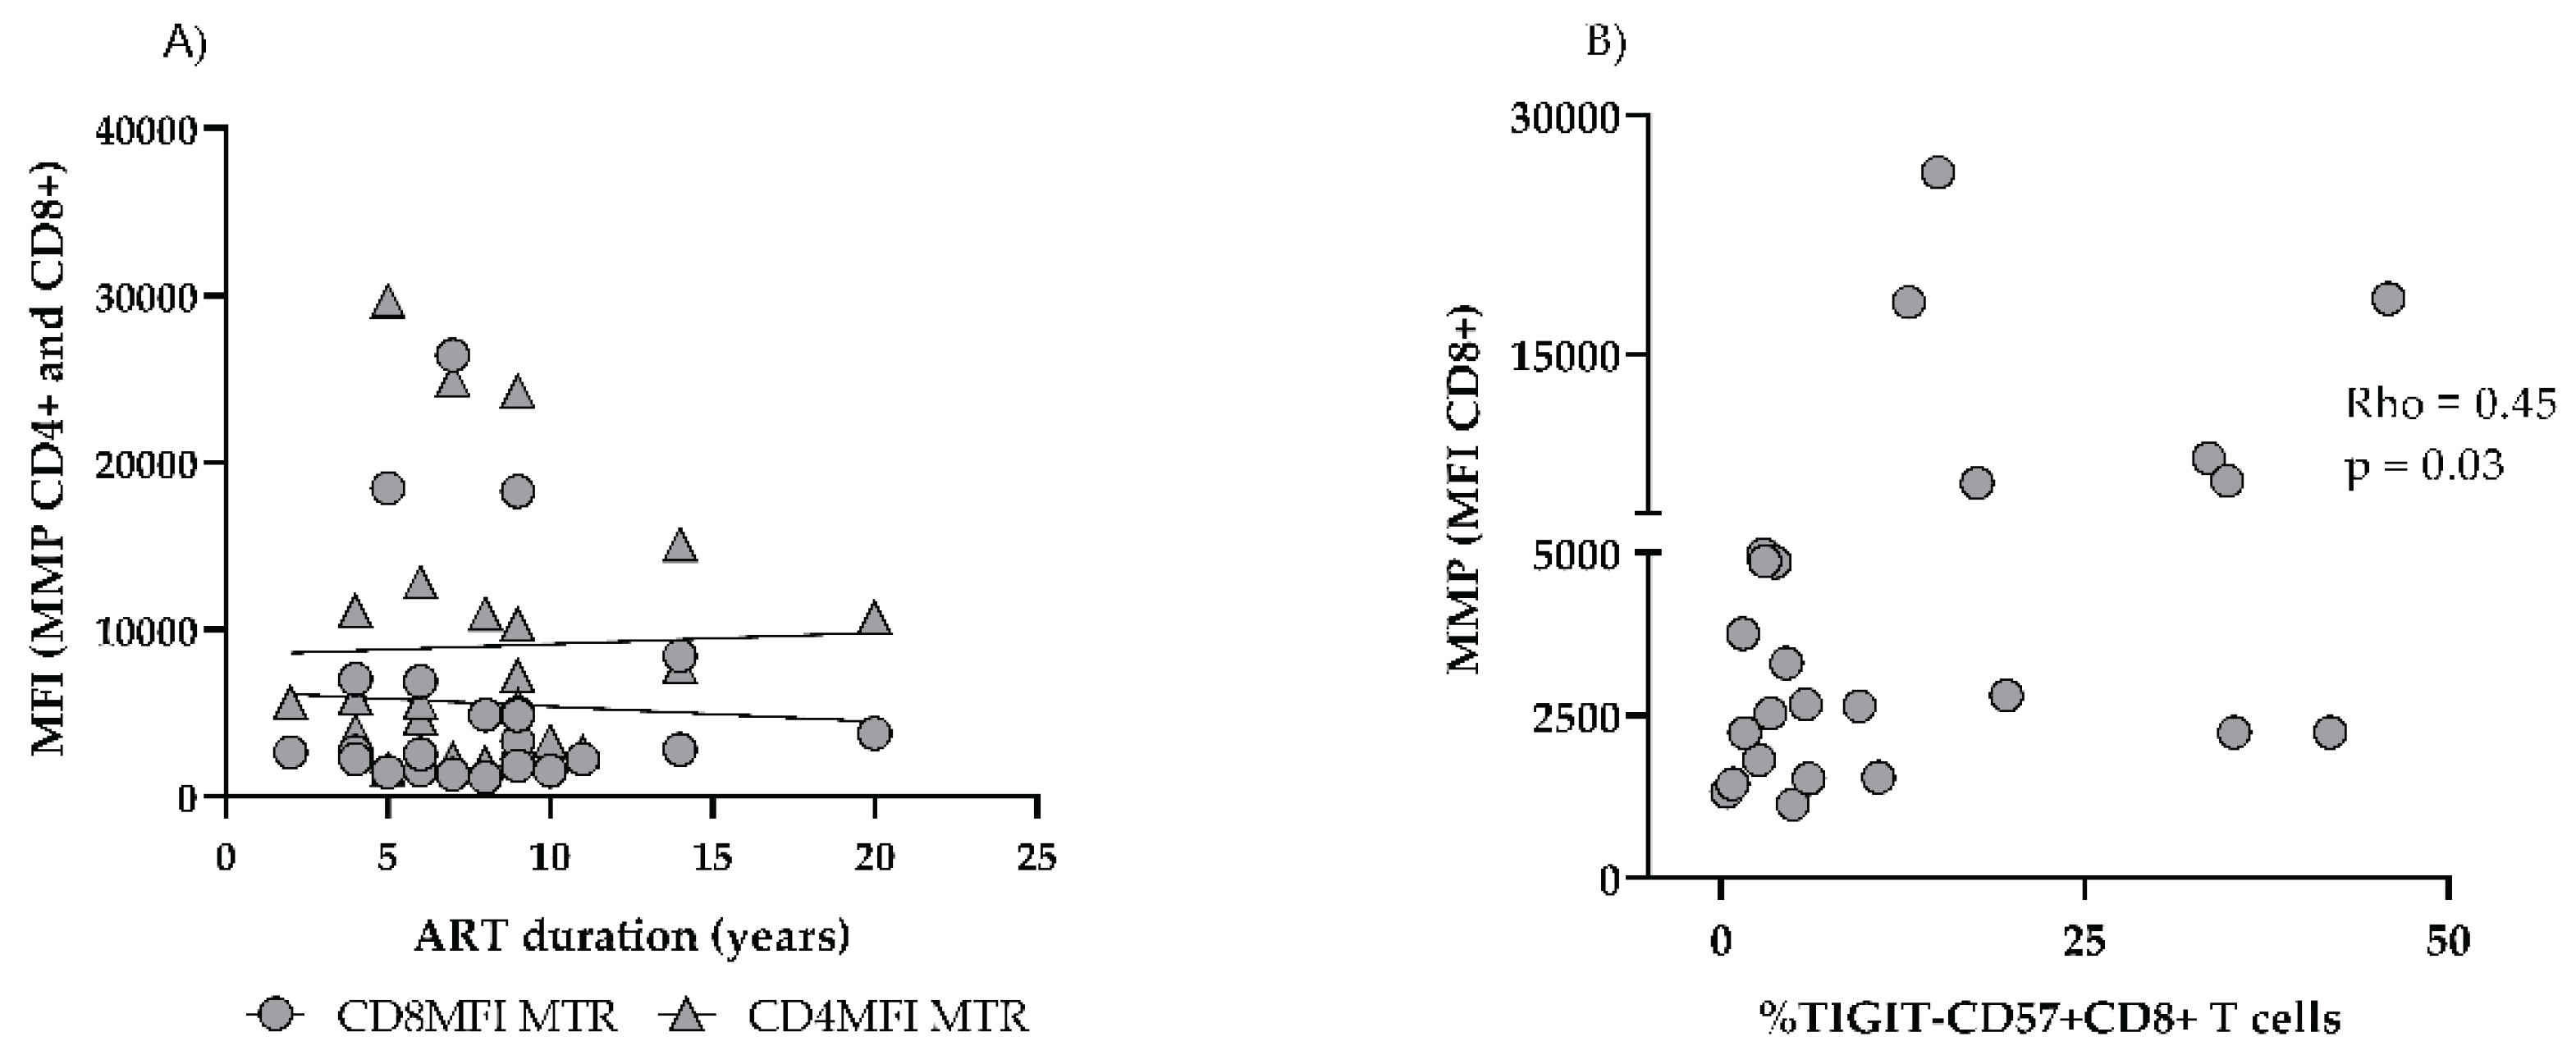

Table 1.
Basic demographic and immune parameters of the studied groups. p1 A+ vs. B; p2 A vs. HC; p3 B vs. HC; Quantitative variables expressed as median (IQR).
Table 1.
Basic demographic and immune parameters of the studied groups. p1 A+ vs. B; p2 A vs. HC; p3 B vs. HC; Quantitative variables expressed as median (IQR).
| Parameter | A (HIV+ART+) |
B (HIV+ART-) |
HC | p1 | p2 | p3 |
|---|---|---|---|---|---|---|
| M/F (n) |
26/13 | 22/5 | 21/14 | ns | ns | ns |
| Age (years) |
45 (34–51) |
40 (32–48) |
37 (29–45.5) |
ns | ns | ns |
| CD4 T AC (Cells/µL) |
856 (711–1224) |
302 (136–527) |
902 (784–1334) |
**** | ns | **** |
| CD8 T AC (Cells/µL) |
702 (528–878) |
965 (441–1221) |
505 (405–731) |
ns | ns | ** |
| CD4/CD8 Ratio | 1.31 (1.13–1.71) |
0.31 (0.19–45) |
1.8 (1.5–2.21) |
**** | ns | **** |
Disclaimer/Publisher’s Note: The statements, opinions and data contained in all publications are solely those of the individual author(s) and contributor(s) and not of MDPI and/or the editor(s). MDPI and/or the editor(s) disclaim responsibility for any injury to people or property resulting from any ideas, methods, instructions or products referred to in the content. |
© 2025 by the authors. Licensee MDPI, Basel, Switzerland. This article is an open access article distributed under the terms and conditions of the Creative Commons Attribution (CC BY) license (http://creativecommons.org/licenses/by/4.0/).
Copyright: This open access article is published under a Creative Commons CC BY 4.0 license, which permit the free download, distribution, and reuse, provided that the author and preprint are cited in any reuse.


