
Submitted:
13 June 2025
Posted:
13 June 2025
You are already at the latest version
Abstract
The stiffness of the extracellular matrix (ECM) plays a pivotal role in the progression of osteoarthritis (OA), particularly by promoting hypertrophic differentiation of chondrocytes, which hinders cartilage regeneration and accelerates pathological ossification.This study aimed to investigate how substrate stiffness modulates hypertrophic chondrocyte behavior and whether it can reverse their phenotype towards a more stable, chondrogenic state. A series of tunable polydimethylsiloxane (PDMS) substrates with stiffnesses ranging from 78 to 508 kPa were fabricated to simulate varying mechanical microenvironments. Hypertrophic chondrocytes were cultured on these substrates, and their morphology, nuclear architecture, gene/protein expression, and mechanotransductive signaling pathways were systematically evaluated. After 7 to 21 days of culture, chondrocytes on stiffer matrices exhibited enlarged nuclei, increased cytoskeletal tension, and enhanced focal adhesion signaling. This corresponded with upregulation of osteogenic and hypertrophic markers such as RUNX2, COL10A1, and COL1A1. In contrast, cells on softer substrates (78 kPa) displayed reduced nuclear YAP localization, higher levels of phosphorylated YAP, and significantly increased expression of COL2A1 and SOX9, indicating reversion to a chondrogenic phenotype. Furthermore, differential activation of Smad1/5/8 and Smad2/3 pathways was observed depending on matrix stiffness, contributing to the phenotype shift. Matrix stiffness exerts a significant regulatory effect on hypertrophic chondrocytes via YAP-mediated mechanotransduction. Soft substrates promote phenotype reversion and cartilage-specific gene expression, offering a promising biomechanical strategy for cartilage tissue engineering and OA intervention.
Keywords:
Cartilage regeneration
; Chondrocyte hypertrophy
; PDMS
; YAP signaling
; Mechanical microenvironment
; Phenotype reversion
; Matrix stiffness
; Smad signaling
; Tissue engineering
1. Introduction
Osteoarthritis (OA) is a common, multifactorial degenerative joint disease marked by progressive cartilage degradation and chondrocyte dysfunction. While mechanical stress and aging are known contributors, increasing evidence highlights that biochemical and molecular factors also play essential roles in cartilage deterioration. Notably, upregulation of matrix metalloproteinases (MMPs) and ADAMTS enzymes has been shown to accelerate matrix breakdown and cartilage degeneration [1,2]. Among the pathological processes, the phenotypic transformation of chondrocytes is particularly critical. As the only cell type in articular cartilage, any dysfunction in chondrocytes directly impacts tissue homeostasis. Studies have demonstrated that abnormalities such as apoptosis, autophagy defects, and hypertrophic differentiation are closely associated with OA progression [3,4]. Hypertrophic chondrocytes—characterized by expression of COL10A1, RUNX2, and MMP13—mimic the terminal differentiation state of growth plate chondrocytes and promote endochondral ossification. Such premature hypertrophy disrupts normal cartilage repair and is frequently observed in both clinical and experimental OA samples [5,6,7,8,9,10,11,12] .In addition, inflammatory responses driven by chronic low-grade inflammation also contribute to cartilage breakdown and bone remodeling through cytokine and chemokine production [13,14]. The induction of chondrocyte hypertrophy is influenced by multiple factors including mechanical stimuli, receptor signaling, and intracellular pathways [15,16].As hypertrophy progresses, expression of Type I and X collagen, MMP13, and other ossification-related markers increases, further aggravating the disease process [17,18]. Various signaling pathways, particularly Wnt/β-catenin and Ihh, have been implicated in regulating this transition [5,19].
Despite emerging regenerative therapies such as autologous chondrocyte implantation (ACI) and low-intensity pulsed ultrasound (LIPUS), current interventions remain insufficient to reverse chondrocyte hypertrophy or restore native phenotype [20,21]. Therefore, elucidating the mechanisms underlying hypertrophic chondrocyte differentiation and developing effective strategies for phenotype modulation remain urgent challenges in cartilage tissue engineering [7]. Recent studies highlight the role of the mechanical microenvironment, especially ECM stiffness, in regulating chondrocyte fate. Mechanotransduction occurs primarily through integrins, focal adhesion kinase (FAK), and the YAP/TAZ signaling axis [22,23]. YAP, a key mechanosensitive transcriptional co-activator, responds to matrix elasticity by shifting its localization between the nucleus and cytoplasm, thereby modulating gene expression patterns [24,25]. Its activity is tightly linked to the RhoA/ROCK cytoskeletal tension and FAK-dependent pathways [26,27]. These factors have also been shown to regulate stem cell differentiation, proliferation, and tissue regeneration potential [28,29,30].
However, how matrix stiffness modulates hypertrophic chondrocytes specifically—and whether such mechanical cues can reverse their phenotype—remains largely unexplored. In this study, we constructed a series of PDMS-based culture platforms with controlled stiffness to simulate diverse mechanical conditions. We investigated how these mechanical environments influence chondrocyte morphology, gene/protein expression, and YAP-related signal transduction, aiming to provide novel insights into cartilage regeneration via biomechanical regulation.
2. Experimental Methods
2.1. Steps for Preparing PDMS Substrates
For the construction of PDMS substrates with different stiffnesses, Sylgard 184 and Sylgard 527 elastomer kits (Dow Corning) were mixed from 10 kPa to 508 kPa. The mixture was thoroughly stirred according to the ratio of the curing agent and degassed before finally being fully cured at room temperature for 72 h until fully crosslinked. Afterward, the cured PDMS substrates were subjected to an oxygen plasma system treatment for 5 min (CUTE, Femto-Science Inc., Korea). Then, they were quickly immersed in a solution containing 10% (v/v) 3-aminopropyl triethoxysilane (APTES, Sigma-Aldrich) in 99% anhydrous ethanol and heated at 60 °C for 3 h to provide the surface of the substrate with amino functional groups. After washing 3–5 times with sterile DW to clean the APTES. Next, the sample substrates were placed in a 2.5% (v/v) glutaraldehyde solution provided by Sigma-Aldrich, left standing for 1 h at room temperature, and washed 3–5 times with sterile PBS and rapidly sterilized with 75% alcohol. PBS was used again to rinse off residual ethanol. Finally, the substrate underwent a 2-hour incubation at 37 °C in a 0.2% (w/v) type I collagen solution to finalize the coating for later application.
2.2. Primary Chondrocyte Culture
SD rats, aged 4 weeks, were acquired from the institution's animal experiment center. The costal cartilage tissue was collected under aseptic conditions, and then excess non-chondral tissues such as perichondrium, fat, and blood vessels around the chondral surface were removed with forceps under a dissection microscope, cut into small pieces about 1 mm3 to facilitate enzymes, added with pre-prepared 2% collagenase type II solution, placed in, gently shaken or knocked by hand in 37℃ water bath for 30 min to digest, filtered out the undigested debris after digestion with 200 mesh cell strainer, collected suspension containing cells, combined with high glucose DMEM medium containing 10% FBS, then spun at 2000 rpm for 3 minutes , discarded supernatant, suspended cells in complete DMEM medium with 10% FBS and 1% penicillin streptomycin (PS), seeded in 100 mm culture dishes, cultured in 5 % CO2 incubator at 37℃, Cells that were approximately 90% confluent were digested with 0.25% trypsin EDTA and passaged at a 1:3 ratio, with P4 chondrocytes being used for the subsequent experiment.
2.3. Cell Compatibility Test on PDMS Surfaces
Viability/Cytotoxicity Kit for Mammalian Cells by Live/Dead® (Cat. No. R37601, Life technologies, Carlsbad, CA, USA) was used to detect chondrocyte viability 24 h after chondrocytes were seeded on PDMS surfaces according to the manufacture's instruction. Four-well plates were filled with PDMS substrates, then we added the prepared staining solution (calcein AM and ethidium homodimer-1). Incubate samples in room temperature dark condition for 15 min. After that, gently washed samples with sterile PBS. Then observe and image the samples under fluorescent microscope (FITC channel & Texas red channel).
2.4. SA-β-Galactosidase Staining
Cellular aging was marked by the activity of β-galactosidase (SA-β-Gal). Senescent β-gal test reagents including SA-β-Gal working solution, staining fixative, safranin B, was purchased from Senescence beta galactosidase Staining Kit (G1580, Solarbio, Beijing, China). About 15 min before testing, first fixed cells with staining fixative, then add the SA-β-Gal working solution, and incubated the cells in dark condition at 37 ° C for 10 hours. Then we observed images using an inverted optical microscope. Green / blue green precipitates indicated positive results, while those without green/orange precipitate indicated negative results. Number of positive cells counted using ImageJ software (NIH, US).
2.5. YAP Detection via Immunofluorescence Staining
Cells were fixed with 4% PFA for 15 minutes after 7 days, then washed three times with PBS for 5 minutes each, permeabilized with 0.2% Triton X-100 for 10 minutes, and washed again three times in PBS for 5 minutes each. Cells were treated with 5% BSA for one hour. The YAP primary antibody (Santa Cruz Biotechnology, sc-101199, Dallas, TX) was diluted at a 1:200 ratio in the blocking buffer and left on the cells overnight at 4 °C. Cells were washed three times in PBS for 10 min each time to remove unbound antibodies. The secondary antibody with a fluorescent label was diluted to a 1:100 ratio and incubated in the dark for one hour at room temperature. Cells had their nuclei stained with a 1 µg/mL DAPI solution for 5 to 10 minutes at room temperature, and were then washed three times in PBS, with each wash lasting 5 minutes. A confocal microscope was employed to capture images for observing YAP in the cells. Nuclei appear blue and YAP appears green when observed under fluorescence microscope due to fluorescent dye Alexa Fluor 488 attached to anti-YAP antibody.
2.6. COL-2 Immunofluorescence Staining
Cells were fixed with 4% paraformaldehyde for 15 minutes at room temperature after 21 days, then washed three times with PBS for 5 minutes each , treated with 0.2% Triton-X100 for 10 minutes to permeabilize, followed by two additional washes with PBS, each lasting 5 minutes. Non-specific interactions of proteins were inhibited by treating with 5% bovine serum albumin for an hour at room temperature. Collagen type II primary antibody (sc-52658, Santa Cruz Biotechnology, USA) overnight incubation at 4 °C was performed on the cells using a 1:150 dilution in blocking buffer. Cells were washed 3×5 minutes in PBS and non-bound primary antibodies were removed. Alexa Fluor 488, a secondary antibody with a fluorescent tag, was diluted at a ratio of 1:100 and used in the dark for an hour. A DAPI solution (1 µg/mL) was used to counter-stain the nuclei for 5–10 minutes. After being washed three times for five minutes in PBS, the cells were imaged with a confocal laser scanning microscope to observe where collagen type 2 interacts with the cells. Green represents collagen II interaction site within cells while nucleus appears blue upon visualization under fluorescence microscope after staining with DAPI dye.
2.7. Western Blot
Following 21 days in differentiation culture, the cells underwent PBS washing and trypsin digestion. Cells were collected after centrifugation and the supernatant was discarded. The cells were washed again with PBS and the cell pellets under an ice bath were lysed with lysis buffer containing protease inhibitor (Halt™ Protease & Phosphatase Inhibitor Cocktail, 100X, Thermo Scientific, Waltham, MA, USA; EBA-78440, Elpis Biotech, Daejeon, Korea) for 30 min at 4 °C on ice. The suspension was centrifuged at 10,000 rpm for 10 min at 4 °C as instructed in the kit manual. The concentration of protein was determined with a Pierce™ BCA Protein Assay Kit from Thermo Scientific.The supernatants containing samples were heated at 100 °C for 10 min, and separated by SDS-PAGE. Gel-separated samples were blotted onto PVDF membranes pre-soaked in a cold tray filled with deionized water (Bio-Rad, based in Hercules, CA, United States). The membrane was incubated with 5% SolMate BSA Grade IY (GeneAll, Seoul, South Korea) for 1 hour at room temperature, then treated with primary antibodies and β-actin antibodies (as a loading control) at 4 °C overnight. The next day, the membranes were rinsed three times with TBST (15 min each time), and incubated for 1 h with HRP conjugated anti-mouse/rabbit IgG (Cell Signaling Technology). Using the LAS4000 mini protein imaging system by GE Healthcare, protein signals were visualized with the help of SuperSignal™ West Pico and SuperSignal™ West Pico Plus chemiluminescence detection reagents from Thermo Scientific. Images were captured with ImageJ 1.52P software. (The list of antibodies used in this study is provided in the Supplementary Data. Table S1).
2.8. Analysis Using Quantitative Real-Time PCR (qRT-PCR)
According to the manufacturer's instructions, total RNA was isolated using TRIzol reagent from (Invitrogen, located in Carlsbad, CA, USA). The synthesis of complementary DNA (cDNA) was executed with the iScript™ cDNA Synthesis Kit by Bio-rad. Quantitative real-time PCR (qRT-PCR) amplifications were conducted using StepOne Plus Real-Time PCR System (Applied Biosystems) and SensiMix™ SYBR Hi-ROX Mix (Bioline, London, UK; Cat. No. QT-605-05). Reactions contained a total volume of 20 μL and four replicates per sample. The expression levels of genes relative to a control were assessed using the 2^(-delta delta Ct) formula. The findings are expressed as means ± SD from three independent experiments, and the relevant statistical tests were used for analysis.
2.9. Alizarin Red S Staining and Quantification of Mineralization
AR staining was performed to observe the mineralization potential induced by hypertrophic differentiation of chondrocytes growing on PDMS substrates with different stiffness. Briefly, after certain culture time, we poured off the culture medium, Cells underwent two washes in PBS before being fixed in 4% formaldehyde for 20 minutes at room temperature. After three times washing with deionized water, we stained cells in 2% AR solution (pH 4.1) for 20 min at room temperature. We washed cells sufficiently until background removal using deionized water and air-dried overnight at room temperature. Representative pictures were captured under an inverted optical microscope to observe calcified deposits. To count the mineralized area, we washed the stained samples five-six times with PBS to reduce the background stain and gently blotted dry with absorbent paper without tearing cell layer. Fluorescence images were obtained from a fluorescence microscope equipped with FITC channel and Texas Red channel. ImageJ 1.52P was used to count mineralized areas, and statistical analyses were performed using GraphPad Prism.
2.10. Safranin O Staining and Quantitative Analysis
To determine extracellular matrix synthesized during differentiation as well as differentiation state and maturation of the matrix produced by chondrocytes cultured under varied substrate stiffness condition, Safranin O staining method was used to detect GAG deposit. After 21 days of culture differentiation, the cells were rinsed twice with PBS and fixed in 4% paraformaldehyde at room temperature for 10-15 minutes. We covered the cells with a drop of 0.1% Safranin O solution and allowed it to incubate for 5-10 minutes at room temperature. When there is a need to increase contrast when stain samples having more amounts of GAG content, we could increase staining duration up to 15 min. Stainable sample was thoroughly washed by gentle rinsing using distilled water or PBS 2-3 times. To perform carefully and avoid dislodging cells, brief destaining step using 70% ethanol for 30 s - 1 min was conducted on stainable samples. After removing excessive dye by blotting gently with absorbent paper without tearing cell layer, stainable samples were observed under microscope. Samples presenting red color indicated GAG rich area where cartilage-like specific matrix was produced. Pictures were taken under fluorescent microscope and ImageJ 1.52P software was applied for measuring areas stained. Results of statistical analysis and graphical presentation was also done via GraphPad Prism.
2.11. Analysis of Statistics
GraphPad Prism 8.0.2 software was used for statistical analysis, and the data were presented as mean ± SD. The differences among the groups were assessed using one-way ANOVA, followed by multiple comparison tests and an unpaired T test. Western Blot or immunostaining images were quantitatively analyzed using ImageJ 1.52P software, and p < 0.05 was considered significant.
3. Result
3.1. Construction and Surface Characterization of PDMS Substrates
To determine whether substrate stiffness regulated the hypertrophic phenotype of chondrocytes, we first prepared three kinds of PDMS with different stiff substrates: 78 kPa, 258 kPa, and 508 kPa (Figure 1A). We found that the Young's modulus of PDMS could be stably controlled around 78 kPa, 258 kPa, and 508 kPa by changing the curing temperature and the proportion of prepolymer and curer during mixing (n = 6/group), which can meet the mechanical requirements of cell culture (Figure 1B). On this basis, in order to better attach cells on the PDMS surface, we further carried out hydrophilicity enhancement treatment. Results of static water contact angle show that before treatment, the "–" (without treating) group has obvious hydrophobicity, and its static water contact angle exceeds 90°; after plasma activation and collagen coating, the "+" (treated) group has an extremely small contact angle (<30°), indicating a good improvement effect on surface hydrophilicity. Quantitative results also show that all three stiffness groups exhibit enhanced hydrophilicity after being treated (Figure 1C,D). Figure 1E shows the modification process of PDMS surfaces: First, activate the surface of PDMS by plasma; then, use collagen to coat type II collagen, so as to achieve the purpose of enhancing the hydrophilicity of PDMS and promoting cell attachment, thus solving the inherent hydrophobicity defect of PDMS under the condition of reducing cell adhesion and differentiation. In summary, the PDMS substrates constructed have adjustable stiffness and enhance hydrophilicity at their surfaces. Such stiff PDMS substrates will provide favorable physical conditions for us to study the phenotypic changes of hypertrophic chondrocytes in various situations.
3.2. Impact of PDMS Substrate Rigidity on Aging and Survival of Enlarged Chondrocytes
Next, we further explored how PDMS substrate stiffness affects cellular senescence/viability of hypertrophic chondrocytes by performing SA-beta-Gal staining and live/dead cell assays on 78 kPa-, 285 kPa- and 508 kPa-elastic modulus substrates.Figure 2A shows more blue-colored positive areas after being stained with SA-beta-Gal in higher stiffness samples, indicating that increasing the stiffness level induces hypertrophic chondrocyte cells to age more easily. Observing carefully, we find there are more positive cells from cultures grown at stiffnesses of 285 kPa and 508 kPa than 78 kPa; this result suggests that substrate stiffness up-regulates cellular senescence of hypertrophic chondrocytes. Double labeling with Calcein AM/PI proved that cell viabilities remain unchanged after being exposed to different substrate stiffness levels; bright-field (Figure 2B and quantitative pictures present clearly green color in every group, with several scattered red ones along it (Figure 2B-C), respectively. The numbers of dead/hanging cells displayed using quantifying results shown in Figure 2C suggest that those grown at these three stiffnesses have survival ratios above 95%; thus, the viability of hypochondrocytes grown under all three elastic moduli is quite high. Conclusively, although PDMS stiff substrates do not significantly affect cell viability of hypertrophic chondrocytes, substrate stiffness causes mild yet significant cellular senescence of chondrocytes.
3.3. Increased Substrate Stiffness Induces Nuclear Enlargement in Hypertrophic Chondrocytes
Chondrocyte hypertrophy is characterized by a drastic change in cell size and volume, which greatly influences the nucleus size. The study revealed that hypertrophic chondrocytes can increase its volume by over 500% through cytoplasmic and nuclear swelling rather than organelle expansion [12]. During the process of hypertrophy, inhibition of some membrane transporters induced fluid retention to promote cell volumetric growth [31]. Volumetric growth promotes differentiation toward osteoblasts, which are important for endochondral ossification [32], whereas nuclear enlargement enables chromatin rearrangement and gene regulation during hypertrophy [33,34]. However, excessive hypertrophy has been associated with pathologic diseases [12]. In order to elucidate how matrix stiffness influenced the morphology of hypertrophic chondrocytes, we monitored changes in nuclear shape after 7 days on the PDMS substrates at stiffness values of 78 kPa, 258 kPa, and 508 kPa (Figure 3A). Immunofluorescence staining results showed that nuclei became larger as matrix stiffness increased. Quantified data (Figure 3B) showed that cells grown on the softest surface (78 kPa) had smaller nuclei than those cultured on 258 kPa and 508 kPa; however, there was no difference between 258 kPa and 508 kPa. Thus, our observations suggest that the matrix-induced change in nuclear morphology occurs through alteration in intracellular tension generated by cytoskeletal tension-mediated mechanotransduction because the stiffer substratum would result in stronger actomyosin contractility, resulting in enhanced intracellular tension transduced into the nucleus through LINC complexes to deform it, and such mechanical signaling has also been reported to induce chromatin rearrangement and activate transcriptional programs involved in osteogenesis. Therefore, the large-sized nuclei on stiff substrata should reflect hypertrophic chondrocytes undergoing an osteogenic phenotypic shift and deviating away from a chondrogenic one. Contrarywise, the small, rounder-shaped nuclei obtained on 78 kPa suggested less pressure applied to cells, revealing native-like phenotype of chondrocytes.
3.4. Soft Substrates Attenuate Hypertrophic Chondrocyte Phenotype by Modulating Cytoskeletal Architecture and Focal Adhesion Signaling
Soft substrates can regulate the phenotype of hypertrophic chondrocytes. Chondrocytes cultured on compliant matrices have undergone significant changes in cytoskeletal structures and focal adhesion signals related to switching. Cells cultured on soft substrates display a cellular morphology closer to native chondrocytes [35]. Moreover, the viscoelasticity of the matrix is expected to influence the mechanobiology behavior of the chondrocytes. As shown in Figure 4A, after being cultivated on different stiffness (78 kPa, 258 kPa, 508 kPa) PDMS for 7 days, hypertrophic chondrocytes displayed great differences in cell morphology and cytoskeletal organization. With increasing stiffness, cells appeared more extended and their cytoskeletons were stronger; these results were reflected by bigger cell sizes and clearer central arrangement stress fibers. Quantification of single-cell fluorescence area in Figure 4B also demonstrated that cells grown on 258 kPa and 508 kPa presented significantly bigger projected areas than those grown on 78 kPa, suggesting that the stiffer environments could promote cytoskeletal remodeling and stress fiber forming. At the protein level, we further identified the corresponding stiffness-dependent regulatory mechanisms from Figure 4C,D. The proteins of integrin, vinculin, focal adhesion kinase (FAK), and paxillin related to adhesion were upregulated in medium- and high-stiffness groups (258 kPa and 508 kPa). Especially, there was an obvious difference between two subgroups: the FAK expression level in the 508 kPa group was much higher than that in the 78 kPa group. These results suggest that cells increase their adhesive complex and mechanosensing response when exposed to stiff environments to strengthen the cytoskeleton, resulting in persistent or aggravation of hypertrophy-related signaling pathways in this situation. In contrast, cells cultured on the softer substrate still had a relatively compact morphology and expressed fewer stress fibers as well as lower levels of related proteins. This cellular appearance is quite similar to what was seen in healthy cartilage, which is consistent with our goal. In a low-stiffness microenvironment imitating the mechanical environment of the articular cartilage in vivo, hypertrophic chondrocytes experience significantly less mechanotransduction activity; thus, the cell's focal adhesion and cytoskeletal remodeling activities will be inhibited. Consequently, their hypertrophic phenotypes would eventually be suppressed, reversed, or even eliminated. In summary, our study demonstrates that tuning the stiffness of the culture substrate -- especially using softer matrices such as 78 kPa -- effectively inhibits the activation of hypertrophic-signaling pathways, which can sustain or reverse hypertrophy-related disease conditions.
3.5. Substrate Stiffness Modulates YAP Subcellular Localization and Phosphorylation in Hypertrophic Chondrocytes
We speculated that the hypertrophic chondrocytes on different stiff PDMSs could sense the matrix stiffness information and resulted in the stiffness-dependence translocation of YAP from cytoplasm to nucleus. We tested this hypothesis by investigating the effect of substrate stiffness on YAP localization and phosphorylation in cultured hypertrophic chondrocytes. In Figure 5A, we showed immunofluorescence staining for YAP on PDMS substrates with an elastic modulus of 78, 258 and 508 kPa respectively. Our results show that YAP fluorescence mainly located inside the cell body (i.e., the cytoplasm) while barely overlapped on softer 78 kPa; however, it gradually occupied a bigger nuclear area on stiffer matrices (258 and 508 kPa). The single-cell heat map displayed increased nuclear intensity on stiff matrices (Figure 5B); line-scan quantified data confirmed our observation as shown in Figure 5C: there were increased peak nuclei at 258 and 508 kPa compared with those at 78 kPa. Western blots indicated increased total YAP expression but higher phosphorylated-YAP level on soft 78 kPa substrate than on stiffer ones (Figure 5D–E), which corresponded with densitometric analysis revealing that the YAP/β-actin ratio was elevated at 258 and 508 kPa while P-YAP/β-actin ratio was dramatically increased at 78 kPa (Figure 5F). These results suggested that substrate stiffness influenced YAP activation and regulated the fates of hypertrophic chondrocytes through affecting YAP localizing in nucleus and activating its downstream transcription factors. YAP remained phosphorylated and sequestered in the cytoplasmic compartment on 78 kPa so it is possible that this phenomenon might result in suppressing or reversing the hypertrophy process. While, the enhanced nuclear translocation reflects YAP mechanotransduction and promotes chondrocyte hypertrophy on stiffer substrates. Therefore, these results supported the idea that biophysical information (matrix stiffness) affected YAP signalling which would further influence the fates of hypertrophic chondrocytes. Up-regulated levels of phosphorylated-YAP together with decreased nuclear location suggest that a compliant mechanical milieu could dampen the hypertrophic progress and help maintain the stable chondrocyte phenotype.
3.6. Low-Stiffness Substrate Suppresses Osteogenic Differentiation and Preserves the Chondrocyte Phenotype in Hypertrophic Chondrocytes
We cultured hypertrophic chondrocytes on PDMS substrates with stiffness of 78, 258 and 508 kPa for 21 days to investigate the influence of stiffness on osteogenic differentiation of hypertrophic chondrocytes. After Alizarin Red S staining, we found that more calcium deposition appeared in the culture group of 508 kPa than those of 258 and 78 kPa; while the least stain was shown in the 78-kPa group (Figure 6A,B). The contrary result was observed in the 78-kPa group: very little mineralization occurred in the culture group of 78 kPa compared to those of 258 and 508 kPa. These data suggested that stiff substrates could induce osteogenic activity of hypertrophic chondrocytes. Then, to further verify the osteogenic ability of hypertrophic chondrocytes under different mechanical environments, we analyzed the expression of osteogenic markers by western blotting (Figure 6C–I). Type I collagen (COL-1) is an important extracellular matrix during bone formation. Its expression was lower in the 78-kPa group than it was in both the 258- and 508-kPa groups (Figure 6E). Runx2 is a master transcription factor which regulates osteogenic differentiation. It also followed this trend, its expression was significantly lower in the 78-kPa group than it was in the two other stiffness groups (Figure 6G). However, there was no significant difference between the three stiffness groups when examining the expressions of MMP13 involved in matrix remodeling and degradation (Figure 6F), suggesting that the degree of matrix turnover was unchanged. Collectively, these results suggested that elevated stiffness could induce osteogenic transition of hypertrophic chondrocytes but would be inhibited by softer ones like 78 kPa. Western blots were used to measure Smad signal pathway activation, the downsteam effectors activated by TGF-β/BMP signals (Figure 6D–H,I). Interestingly, the expressions of Smad2/3 were significantly lower in the 78-kPa group than they were in both the 258- and 508-kPa groups (Figure 6H); however, the expressions of Smad1/5/8 were higher in the 78-kPa group than they were in the two other stiffness groups (Figure 6I). This suggests that low substrate stiffness might preferentially maintain high levels of Smad1/5/8 signaling related to maintaining the lineage toward cartilage, not bone. Finally, the decreased mineralization, reduced osteogenic markers and maintained Smad1/5/8 signaling in the 78-kPa group suggested that the soft environment might effectively reverse hypertrophic features and retain the chondrocyte phenotype. Therefore, these data indicated that the soft substrates attenuate the terminal osteogenic differentiation of hypertrophic chondrocytes and provided an approach to maintain chondral identity.
3.7. Soft Substrates Promote Redifferentiation of Hypertrophic Chondrocytes
Table 2 (A1) and glycosaminoglycans (GAGs) are two fundamental components of the cartilage extracellular matrix and are widely recognized as hallmark markers of the chondrogenic phenotype. The expression levels of COL2A1 and the deposition of GAGs reflect the biosynthetic activity of chondrocytes and are commonly used indicators for evaluating chondrogenic differentiation and matrix-forming capacity. In hypertrophic chondrocytes, sustaining high levels of COL2A1 and GAG synthesis is critical to preserving their chondrogenic identity and preventing pathological transitions such as fibrosis or ossification [36,37,38] .PDMS substrates with stiffness levels of 78 kPa, 258 kPa, and 508 kPa were employed to study how substrate stiffness influences the phenotype of hypertrophic chondrocytes. COL2A1 immunofluorescence staining results (Figure 7A) and statistical fluorescence intensity (Figure 7B) showed that COL2A1 expression was highest in the 78 kPa group, slightly lower in the 216 kPa group, and obviously weakened in the 508 kPa group; Safranin O staining results confirmed these findings (Figure 7C,E): the red-stained areas of the 78 kPa group and 258 kPa group were relatively large, and there were obvious differences between the groups: the matrix deposited by cells in the culture plate of the 508 kPa group was poor, with a weakly red-stained area and a patchy appearance. There was no significant difference when counted (Figure 7D), but compared with the other two, the formation of the matrix in the 508 kPa group was significantly reduced. At the gene level, qPCR test data also showed that COL2A1 and SOX9 were expressed at the highest levels in the 78 kPa group, and gradually decreased as stiffness increased; the lowest was in the 508 kPa group (Figure 7F). The hypertrophic and fibrotic marker proteins COL10A1 and COL1A1 were strongly up-regulated in the 508 kPa group, indicating that higher stiffness promoted the transition of the hypertrophic or fibrotic phenotype. At the protein level, western blot testing data further proved this conclusion: the quantity of COL2A1's protein expressed was highest in the 78 kPa group and lowest in the 508 kPa group, and after normalization to β-actin, it exhibited statistical significance (Figure 7G–H); the gene expression results were consistent with those obtained from western blots. In summary, softer matrices are beneficial for maintaining the hypertrophic chondrocyte's chondrogenic phenotype, increasing the quantity of COL2A1, and promoting cartilage matrix synthesis. However, stiffer substrates can induce hypertrophic or fibrotic phenotype transitions, thereby suppressing their typical chondrogenic features.
3.8. Matrix Stiffness Regulates Chondrocyte Fate via YAP/Smad and Integrin-Mediated Signaling Pathways
To decipher the hidden mechanism of matrix stiffness controlling chondrocyte fate, we proposed a schematic model coupling mechanotransduction and transcriptional regulation (Figure 8). Under stiff matrix condition, integrin-mediated focal adhesion signal is activated by recruiting FAK, paxillin and vinculin. The activation of this mechanical input subsequently activates YAP translocating into the nucleus after lowering its phosphorylation level. Inside the nucleus, active YAP promotes the expression of RUNX2, a hypertrophic determinant via upregulating the expression of RUNX2 gene. Hence YAP contributes towards promoting the expression of hypertrophy related genes like COL1A1, COL10A1 and MMP13. In addition to YAP, Smad1/5/8 signaling also activates simultaneously with nuclear YAP for boosting the RUNX2 driven program in response to stiff substrate condition. On soft substrate, YAP stays mostly phosphorylated due to low nuclear entry so it doesn't have a great deal of transcriptional capacity.
Cytoplasmic sequestration of YAP shifts the transcriptional balance towards SOX9 promoter and results into promoting COL2A1 expression and blocking hypertrophic transition by suppressing SOX9 mediated program in chondrocytes. Furthermore, activated Smad2/3 also promotes SOX9 mediated gene expression on soft substrate but not under stiff condition. Our data revealed that the phenotype outcome is governed by an interplay between integrin-FAK-YAP and Smad signals. We conclude that PDMS substrates regulate the chondrocytic phenotypes through two different routes.
4. Results, Discussion, and Outlook
Based on our understanding of the relationship between extracellular matrix stiffness and chondrocyte function, we further investigated the molecular mechanisms and the regulatory roles of signaling pathways involved. On one side the YAP signalling controls chondrocyte phenotype and hypertrophic differentiation process while at another side the stiff PDMS substrates control both processes simultaneously.Moreover, we systematically studied how varying the stiffness of PDMS substrates affected hypertrophic status of chondrocytes and delineated the regulatory role of YAP on hypertrophic differentiation process. It was concluded from our results that increasing stiffness of PDMS substrate significantly promoted hypertrophic status of chondrocytes while softer substrates reversed the tendency of hypertrophic differentiation and strongly elevating the expression of specific chondrocyte marker mRNA such as COL2 and SOX9 on day 7 on 78kPa PDMS substrate. Chondrocytes treated on 78 kPa PDMS showed more cytoplasmic phospho YAP level along with highly decreased nuclear accumulation than 258kPa and 508kPa. indicating the retention of YAP in cytosol by softer substrates to promote the dedifferentiation trend of hypertrophic cells, thus facilitating their maintaining a normal chondrocyte state.
ECM regulatory effect on the fate of chondrocytes: Some studies have conflicting opinions. Although most research results show that changing the physical and chemical characteristics of ECM can promote or inhibit the proliferation, differentiation, and apoptosis of chondrocytes, the regulatory mechanism is still not clear. However, some research has found that increasing the stiffness of the extracellular matrix can promote the differentiation and matrix synthesis of chondrocytes through certain ways, which is beneficial to cartilage repair and regeneration. This kind of phenomenon was mainly caused by TGF-β pathway activation, WNT pathway activation, etc., but these two kinds of pathways were essential in chondrogenesis and maintenance of cartilage [39]. The enhanced matrix rigidity enhances the TGF-β signal activity, which up-regulates genes related to chondrocyte maturation, such as SOX9 and COL2A1, which are necessary for cartilage development [40,41]. Also, the enhanced ECM rigidity increases the WNT signaling pathway involved in chondrocyte development, which also regulates proteoglycans and glycosaminoglycans required for cartilage matrix integrity, which improves cartilage strength [40,42]. And a stiffer environment stimulates the proliferation of bone marrow mesenchymal stem cells (BMSCs), promotes BMSCs' differentiation into chondrocytes, so it is conducive to effective cartilage repair.
But another group of researchers concluded that the excessive rigidity of ECM induced senescence and even programmed cell death in chondrocytes, promoting the onset of OA [43]. There may be differences in models, methods, and other aspects among various studies. It has been shown that softening of ECM reduces the histone deacetylase 3 (HDAC3) level of cell membrane, causing high levels of acetylated Parkin and excessive autophagy with mitochondria, which accelerates chondrocyte senescence [8]. Stiff extracellular matrix induces Klotho gene methylation resulting in decreased Klotho expression and accelerating chondrocyte aging [9]. Besides, mechanical stress produced by the stiff matrix leads to an increase in oxidative stress; which increases chondrocyte senescence and chondrocyte apoptosis [10]. The accumulation of chondrocytes senescent secreting more pro-inflammatory cytokines, accelerating cartilage degradation and inflammation - hallmarks feature of OA [11]. Though many researchers have confirmed that ECM rigidity plays an essential role in OA but besides this, there are many other things associated with OA like genetics, lifestyle, and inflammation, which need to be addressed effectively.
In addition, the interaction between ECM components and chondrocyte surface receptors and downstream signaling pathways is still controversial. Integrins are well-known chondrocyte surface receptors, but controversy still exists about the roles of different integrin types under various conditions and how they interact synergistically with each other. In addition, how other matrix molecules (such as proteoglycans and glycosaminoglycans) interact with chondrocyte surface receptors and influence cell fate is also unknown. These controversies should be resolved so that we can have a complete understanding of how the ECM influences chondrocyte fate, which provides us with a solid theoretical foundation for using the ECM as a therapeutic agent for cartilage diseases.
The above studies mainly use some basic experimental techniques to clarify the relationship between the stiffness of the extracellular matrix and OA; however, our work starts from the principles of tissue engineering, constructs an artificial microenvironment simulating the cartilage environment, and focuses on how the stiffness of the extracellular matrix regulates the dedifferentiation of hypertrophic chondrocytes through YAP signaling to facilitate clinical translation.
Many studies have shown that during mechanotransduction, the activity of YAP depends on the rigidity of the extracellular matrix, and its translocation within cells plays a key role in this process. These results demonstrate the close relationship between YAP signaling and rigidity; therefore, regulating the rigidity of the extracellular matrix would significantly affect the activity of YAP signaling, reverse chondrocyte hypertrophy, and maintain the chondrocyte phenotype when appropriate rigidity existed.
Our data confirm the important role of YAP phosphorylation in maintaining the chondrocyte phenotype and reversing hypertrophy. Although our work demonstrates that certain ECMS levels can effectively reverse hypertrophy and maintain the phenotype of chondrocytes, several points deserve further discussion. Our two-dimensional model successfully imitates the inhibitory effect of the varied ECMS levels on the hypertrophic chondrocytes and the maintenance of the phenotype of the chondrocytes. However, it cannot fully substitute for the factors present in the intricate in vivo environment, including the diverse cytokines and biochemical signals that regulate the phenomenon.
We believe that in the future, these works will deepen our understanding by performing experiments under three-dimensional conditions, further mimicking the in vivo environment to study how the various ECMs, stiffness, and multiple signalings regulate the fates of hypertrophic chondrocytes under the 3D condition, deepening our understanding of the mechanism behind the YAP signaling pathway. We suggest that combining in vivo cartilage models and further exploring how exactly YAP signaling acts on the activity of the ECM and physical properties may be used in new ways to treat obesity-related osteoarthritic diseases.
Supplementary Materials
Author Contributions
Conceptualization, D.-L.D. and G.-Z.J.; methodology, D.-L.D. and G.-Z.J.; formal analysis, D.-L.D. and G.-Z.J.; writing—original draft, D.-L.D. and G.-Z.J.; writing—review and editing, G.-Z.J.; supervision, G.-Z.J.; project administration, G.-Z.J. All authors have read and agreed to the published version of the manuscript.
Funding
This work was supported by the National Research Foundation of Korea (RS-2023-00220408).
Institutional Review Board Statement
The animal study protocol was approved by the Institutional Animal Care and Use Committee of Dankook University (Permit No: DKU-22-071).
Informed Consent Statement
Not applicable.
Data Availability Statement
The datasets generated and analyzed during this study are available from the corresponding author upon reasonable request.
Conflicts of Interest
The authors declare no conflict of interest.
References
- Xia, B.; Chen, D.; Zhang, J.; Hu, S.; Jin, H.; Tong, P. Osteoarthritis Pathogenesis: A Review of Molecular Mechanisms. Calcif Tissue Int 2014, 95, 495–505. [Google Scholar] [CrossRef] [PubMed]
- Wang, M.; Shen, J.; Jin, H.; Im, H.-J.; Sandy, J.; Chen, D. Recent Progress in Understanding Molecular Mechanisms of Cartilage Degeneration during Osteoarthritis. Ann N Y Acad Sci 2011, 1240, 61–69. [Google Scholar] [CrossRef] [PubMed]
- Hwang, H.S.; Kim, H.A. Chondrocyte Apoptosis in the Pathogenesis of Osteoarthritis. Int J Mol Sci 2015, 16, 26035–26054. [Google Scholar] [CrossRef] [PubMed]
- Zhu, R.; Wang, Y.; Ouyang, Z.; Hao, W.; Zhou, F.; Lin, Y.; Cheng, Y.; Zhou, R.; Hu, W. Targeting Regulated Chondrocyte Death in Osteoarthritis Therapy. Biochemical Pharmacology 2023, 215, 115707. [Google Scholar] [CrossRef]
- Dreier, R. Hypertrophic Differentiation of Chondrocytes in Osteoarthritis: The Developmental Aspect of Degenerative Joint Disorders. Arthritis Res Ther 2010, 12, 216. [Google Scholar] [CrossRef]
- Pesesse, L.; Sanchez, C.; Delcour, J.-P.; Bellahcène, A.; Baudouin, C.; Msika, P.; Henrotin, Y. Consequences of Chondrocyte Hypertrophy on Osteoarthritic Cartilage: Potential Effect on Angiogenesis. Osteoarthritis Cartilage 2013, 21, 1913–1923. [Google Scholar] [CrossRef]
- Park, S.; Bello, A.; Arai, Y.; Ahn, J.; Kim, D.; Cha, K.-Y.; Baek, I.; Park, H.; Lee, S.-H. Functional Duality of Chondrocyte Hypertrophy and Biomedical Application Trends in Osteoarthritis. Pharmaceutics 2021, 13, 1139. [Google Scholar] [CrossRef]
- Fu, B.; Shen, J.; Zou, X.; Sun, N.; Zhang, Z.; Liu, Z.; Zeng, C.; Liu, H.; Huang, W. Matrix Stiffening Promotes Chondrocyte Senescence and the Osteoarthritis Development through Downregulating HDAC3. Bone Res 2024, 12, 1–15. [Google Scholar] [CrossRef]
- Iijima, H.; Gilmer, G.; Wang, K.; Bean, A.C.; He, Y.; Lin, H.; Tang, W.-Y.; Lamont, D.; Tai, C.; Ito, A.; et al. Age-Related Matrix Stiffening Epigenetically Regulates α-Klotho Expression and Compromises Chondrocyte Integrity. Nat Commun 2023, 14, 18. [Google Scholar] [CrossRef]
- Riegger, J.; Brenner, R.E. Increase of Cell Surface Vimentin Is Associated with Vimentin Network Disruption and Subsequent Stress-Induced Premature Senescence in Human Chondrocytes. Elife 2023, 12, e91453. [Google Scholar] [CrossRef]
- Aigner, T.; Haag, J.; Martin, J.; Buckwalter, J. Osteoarthritis: Aging of Matrix and Cells--Going for a Remedy. Curr Drug Targets 2007, 8, 325–331. [Google Scholar] [CrossRef] [PubMed]
- Buckwalter, J.A.; Mower, D.; Ungar, R.; Schaeffer, J.; Ginsberg, B. Morphometric Analysis of Chondrocyte Hypertrophy. J Bone Joint Surg Am 1986, 68, 243–255. [Google Scholar] [CrossRef] [PubMed]
- Berenbaum, F. Osteoarthritis as an Inflammatory Disease (Osteoarthritis Is Not Osteoarthrosis!). Osteoarthritis Cartilage 2013, 21, 16–21. [Google Scholar] [CrossRef]
- Raman, S.; FitzGerald, U.; Murphy, J.M. Interplay of Inflammatory Mediators with Epigenetics and Cartilage Modifications in Osteoarthritis. Front Bioeng Biotechnol 2018, 6, 22. [Google Scholar] [CrossRef] [PubMed]
- Xiao, Y.; Yue, Z.; Zijing, H.; Yao, Z.; Sui, M.; Xuemin, Z.; Qiang, Z.; Xiao, Y.; Dapeng, R. Mechanical Compression Induces Chondrocyte Hypertrophy by Regulating Runx2 O-GlcNAcylation during Temporomandibular Joint Condyle Degeneration. Bone Joint Res 2025, 14, 209–222. [Google Scholar] [CrossRef]
- Zhang, S.; Zhong, Y.; Li, R.; Wang, W.; Zeng, L.; Wang, Z.; Jia, P.; Wu, R. Experimental Chondrocyte Hypertrophy Is Promoted by the Activation of Discoidin Domain Receptor 2. Mol Med Rep 2014, 10, 1543–1548. [Google Scholar] [CrossRef]
- Han, T.; Zhu, T.; Lu, Y.; Wang, Q.; Bian, H.; Chen, J.; Qiao, L.; He, T.-C.; Zheng, Q. Collagen Type X Expression and Chondrocyte Hypertrophic Differentiation during OA and OS Development. Am J Cancer Res 2024, 14, 1784–1801. [Google Scholar] [CrossRef]
- Lin, L.; Yu, Y.; Liu, K.; Jiang, Y.; Zhou, Z. Downregulation of miR-30b-5p Facilitates Chondrocyte Hypertrophy and Apoptosis via Targeting Runx2 in Steroid-Induced Osteonecrosis of the Femoral Head. Int J Mol Sci 2022, 23, 11275. [Google Scholar] [CrossRef]
- Kronenberg, H.M. Developmental Regulation of the Growth Plate. Nature 2003, 423, 332–336. [Google Scholar] [CrossRef]
- Sekino, J.; Nagao, M.; Kato, S.; Sakai, M.; Abe, K.; Nakayama, E.; Sato, M.; Nagashima, Y.; Hino, H.; Tanabe, N.; et al. Low-Intensity Pulsed Ultrasound Induces Cartilage Matrix Synthesis and Reduced MMP13 Expression in Chondrocytes. Biochemical and Biophysical Research Communications 2018, 506, 290–297. [Google Scholar] [CrossRef]
- Benthien, J.P.; Behrens, P. Autologous Matrix-Induced Chondrogenesis (AMIC): Combining Microfracturing and a Collagen I/III Matrix for Articular Cartilage Resurfacing. Cartilage 2010, 1, 65–68. [Google Scholar] [CrossRef] [PubMed]
- van Donkelaar, C.C.; Wilson, W. Mechanics of Chondrocyte Hypertrophy. Biomech Model Mechanobiol 2012, 11, 655–664. [Google Scholar] [CrossRef] [PubMed]
- Diederichs, S.; Tonnier, V.; März, M.; Dreher, S.I.; Geisbüsch, A.; Richter, W. Regulation of WNT5A and WNT11 during MSC in Vitro Chondrogenesis: WNT Inhibition Lowers BMP and Hedgehog Activity, and Reduces Hypertrophy. Cell Mol Life Sci 2019, 76, 3875–3889. [Google Scholar] [CrossRef] [PubMed]
- Cui, Y.; Miao, M.Z.; Wang, M.; Su, Q.P.; Qiu, K.; Arbeeva, L.; Chubinskaya, S.; Diekman, B.O.; Loeser, R.F. YAP Nuclear Translocation Promotes Anabolic Activity in Human Articular Chondrocytes. Osteoarthritis Cartilage 2023, 31, 1078–1090. [Google Scholar] [CrossRef]
- Zhong, W.; Li, Y.; Li, L.; Zhang, W.; Wang, S.; Zheng, X. YAP-Mediated Regulation of the Chondrogenic Phenotype in Response to Matrix Elasticity. J Mol Histol 2013, 44, 587–595. [Google Scholar] [CrossRef]
- Peng, Y.; Yuan, Q.; Zhou, S.; Gan, J.; Shen, Z.; Xia, X.; Jiang, Y.; Chen, Q.; Yuan, Y.; He, G.; et al. FAK Mediates Mechanical Signaling to Maintain Epithelial Homeostasis through YAP/TAZ-TEADs. Histochem Cell Biol 2025, 163, 31. [Google Scholar] [CrossRef]
- Hallström, G.F.; Jones, D.L.; Locke, R.C.; Bonnevie, E.D.; Kim, S.Y.; Laforest, L.; Garcia, D.C.; Mauck, R.L. Microenvironmental Mechanoactivation through Yap/Taz Suppresses Chondrogenic Gene Expression. Mol Biol Cell 2023, 34, ar73. [Google Scholar] [CrossRef]
- Li, Y.; Wang, J.; Zhong, W. Regulation and Mechanism of YAP/TAZ in the Mechanical Microenvironment of Stem Cells (Review). Mol Med Rep 2021, 24, 506. [Google Scholar] [CrossRef]
- Dasgupta, I.; McCollum, D. Control of Cellular Responses to Mechanical Cues through YAP/TAZ Regulation. J Biol Chem 2019, 294, 17693–17706. [Google Scholar] [CrossRef]
- Liu, X.; Yuan, Y.; Wu, Y.; Zhu, C.; Liu, Y.; Ke, B. Extracellular Matrix Stiffness Modulates Myopia Scleral Remodeling Through Integrin/F-Actin/YAP Axis. Invest Ophthalmol Vis Sci 2025, 66, 22. [Google Scholar] [CrossRef]
- Bush, P.G.; Huntley, J.S.; Macnicol, M.F.; Hall, A.C. VOLUME REGULATION BY IN SITU GROWTH PLATE CHONDROCYTES. Orthopaedic Proceedings. [CrossRef]
- Studer, D.; Millan, C.; Öztürk, E.; Maniura-Weber, K.; Zenobi-Wong, M. Molecular and Biophysical Mechanisms Regulating Hypertrophic Differentiation in Chondrocytes and Mesenchymal Stem Cells. Eur Cell Mater 2012, 24, 118–135. [Google Scholar] [CrossRef] [PubMed]
- Hallett, S.A.; Ono, W.; Ono, N. The Hypertrophic Chondrocyte: To Be or Not to Be. Histol Histopathol 2021, 36, 1021–1036. [Google Scholar] [CrossRef] [PubMed]
- Tsang, K.Y.; Chan, D.; Cheah, K.S.E. Fate of Growth Plate Hypertrophic Chondrocytes: Death or Lineage Extension? Dev Growth Differ 2015, 57, 179–192. [Google Scholar] [CrossRef] [PubMed]
- Zhang, T.; Gong, T.; Xie, J.; Lin, S.; Liu, Y.; Zhou, T.; Lin, Y. Softening Substrates Promote Chondrocytes Phenotype via RhoA/ROCK Pathway. ACS Appl Mater Interfaces 2016, 8, 22884–22891. [Google Scholar] [CrossRef]
- Bay-Jensen, A.C.; Karsdal, M.A.; Engstroem, A.; Port, H.; Groen, S.S.; Thudium, C.S. Chapter 2 - Type II Collagen. In Biochemistry of Collagens, Laminins and Elastin (Third Edition); Karsdal, M.A., Ed.; Academic Press, 2024; pp. 13–22 ISBN 978-0-443-15617-5.
- Gudmann, N.S.; Karsdal, M.A. Chapter 2 - Type II Collagen. In Biochemistry of Collagens, Laminins and Elastin; Karsdal, M.A., Ed.; Academic Press, 2016; pp. 13–20 ISBN 978-0-12-809847-9.
- Bosnakovski, D.; Mizuno, M.; Kim, G.; Takagi, S.; Okumura, M.; Fujinaga, T. Chondrogenic Differentiation of Bovine Bone Marrow Mesenchymal Stem Cells (MSCs) in Different Hydrogels: Influence of Collagen Type II Extracellular Matrix on MSC Chondrogenesis. Biotechnology and Bioengineering 2006, 93, 1152–1163. [Google Scholar] [CrossRef]
- Dong, D.-L.; Jin, G.-Z. Targeting Chondrocyte Hypertrophy as Strategies for the Treatment of Osteoarthritis. Bioengineering (Basel) 2025, 12, 77. [Google Scholar] [CrossRef]
- Allen, J.L.; Cooke, M.E.; Alliston, T. ECM Stiffness Primes the TGFβ Pathway to Promote Chondrocyte Differentiation. Mol Biol Cell 2012, 23, 3731–3742. [Google Scholar] [CrossRef]
- Pfeifer, C.G.; Karl, A.; Kerschbaum, M.; Berner, A.; Lang, S.; Schupfner, R.; Koch, M.; Angele, P.; Nerlich, M.; Mueller, M.B. TGF-β Signalling Is Suppressed under Pro-Hypertrophic Conditions in MSC Chondrogenesis Due to TGF-β Receptor Downregulation. Int J Stem Cells 2019, 12, 139–150. [Google Scholar] [CrossRef]
- Ma, B.; Landman, E.B.M.; Miclea, R.L.; Wit, J.M.; Robanus-Maandag, E.C.; Post, J.N.; Karperien, M. WNT Signaling and Cartilage: Of Mice and Men. Calcif Tissue Int 2013, 92, 399–411. [Google Scholar] [CrossRef]
- Hall, A.C. The Role of Chondrocyte Morphology and Volume in Controlling Phenotype-Implications for Osteoarthritis, Cartilage Repair, and Cartilage Engineering. Curr Rheumatol Rep 2019, 21, 38. [Google Scholar] [CrossRef]
Figure 1.
Fabrication of PDMS substrates with different stiffness and analysis of surface hydrophilicity modification. (A). Schematic illustration of PDMS substrate preparation. (B). Young’s modulus measurements of PDMS substrates prepared under different mixing ratios and curing conditions. The results show that the elastic modulus of the PDMS substrates can be stably maintained at approximately 78 kPa, 216/258 kPa, and 508 kPa, meeting the requirements for varying stiffness levels. (C). Schematic and static water contact angle measurement showing surface hydrophilicity improvement. The images display water droplet morphology on untreated (“–”) and plasma-activated type II collagen-coated (“+”) PDMS surfaces. (D). Quantitative analysis of contact angles before and after surface treatment across PDMS substrates of different stiffness. (E). Schematic diagram of the PDMS surface treatment process.Data are presented as mean ± SD, ***p < 0.001, ****p < 0.0001, ns: not significant.
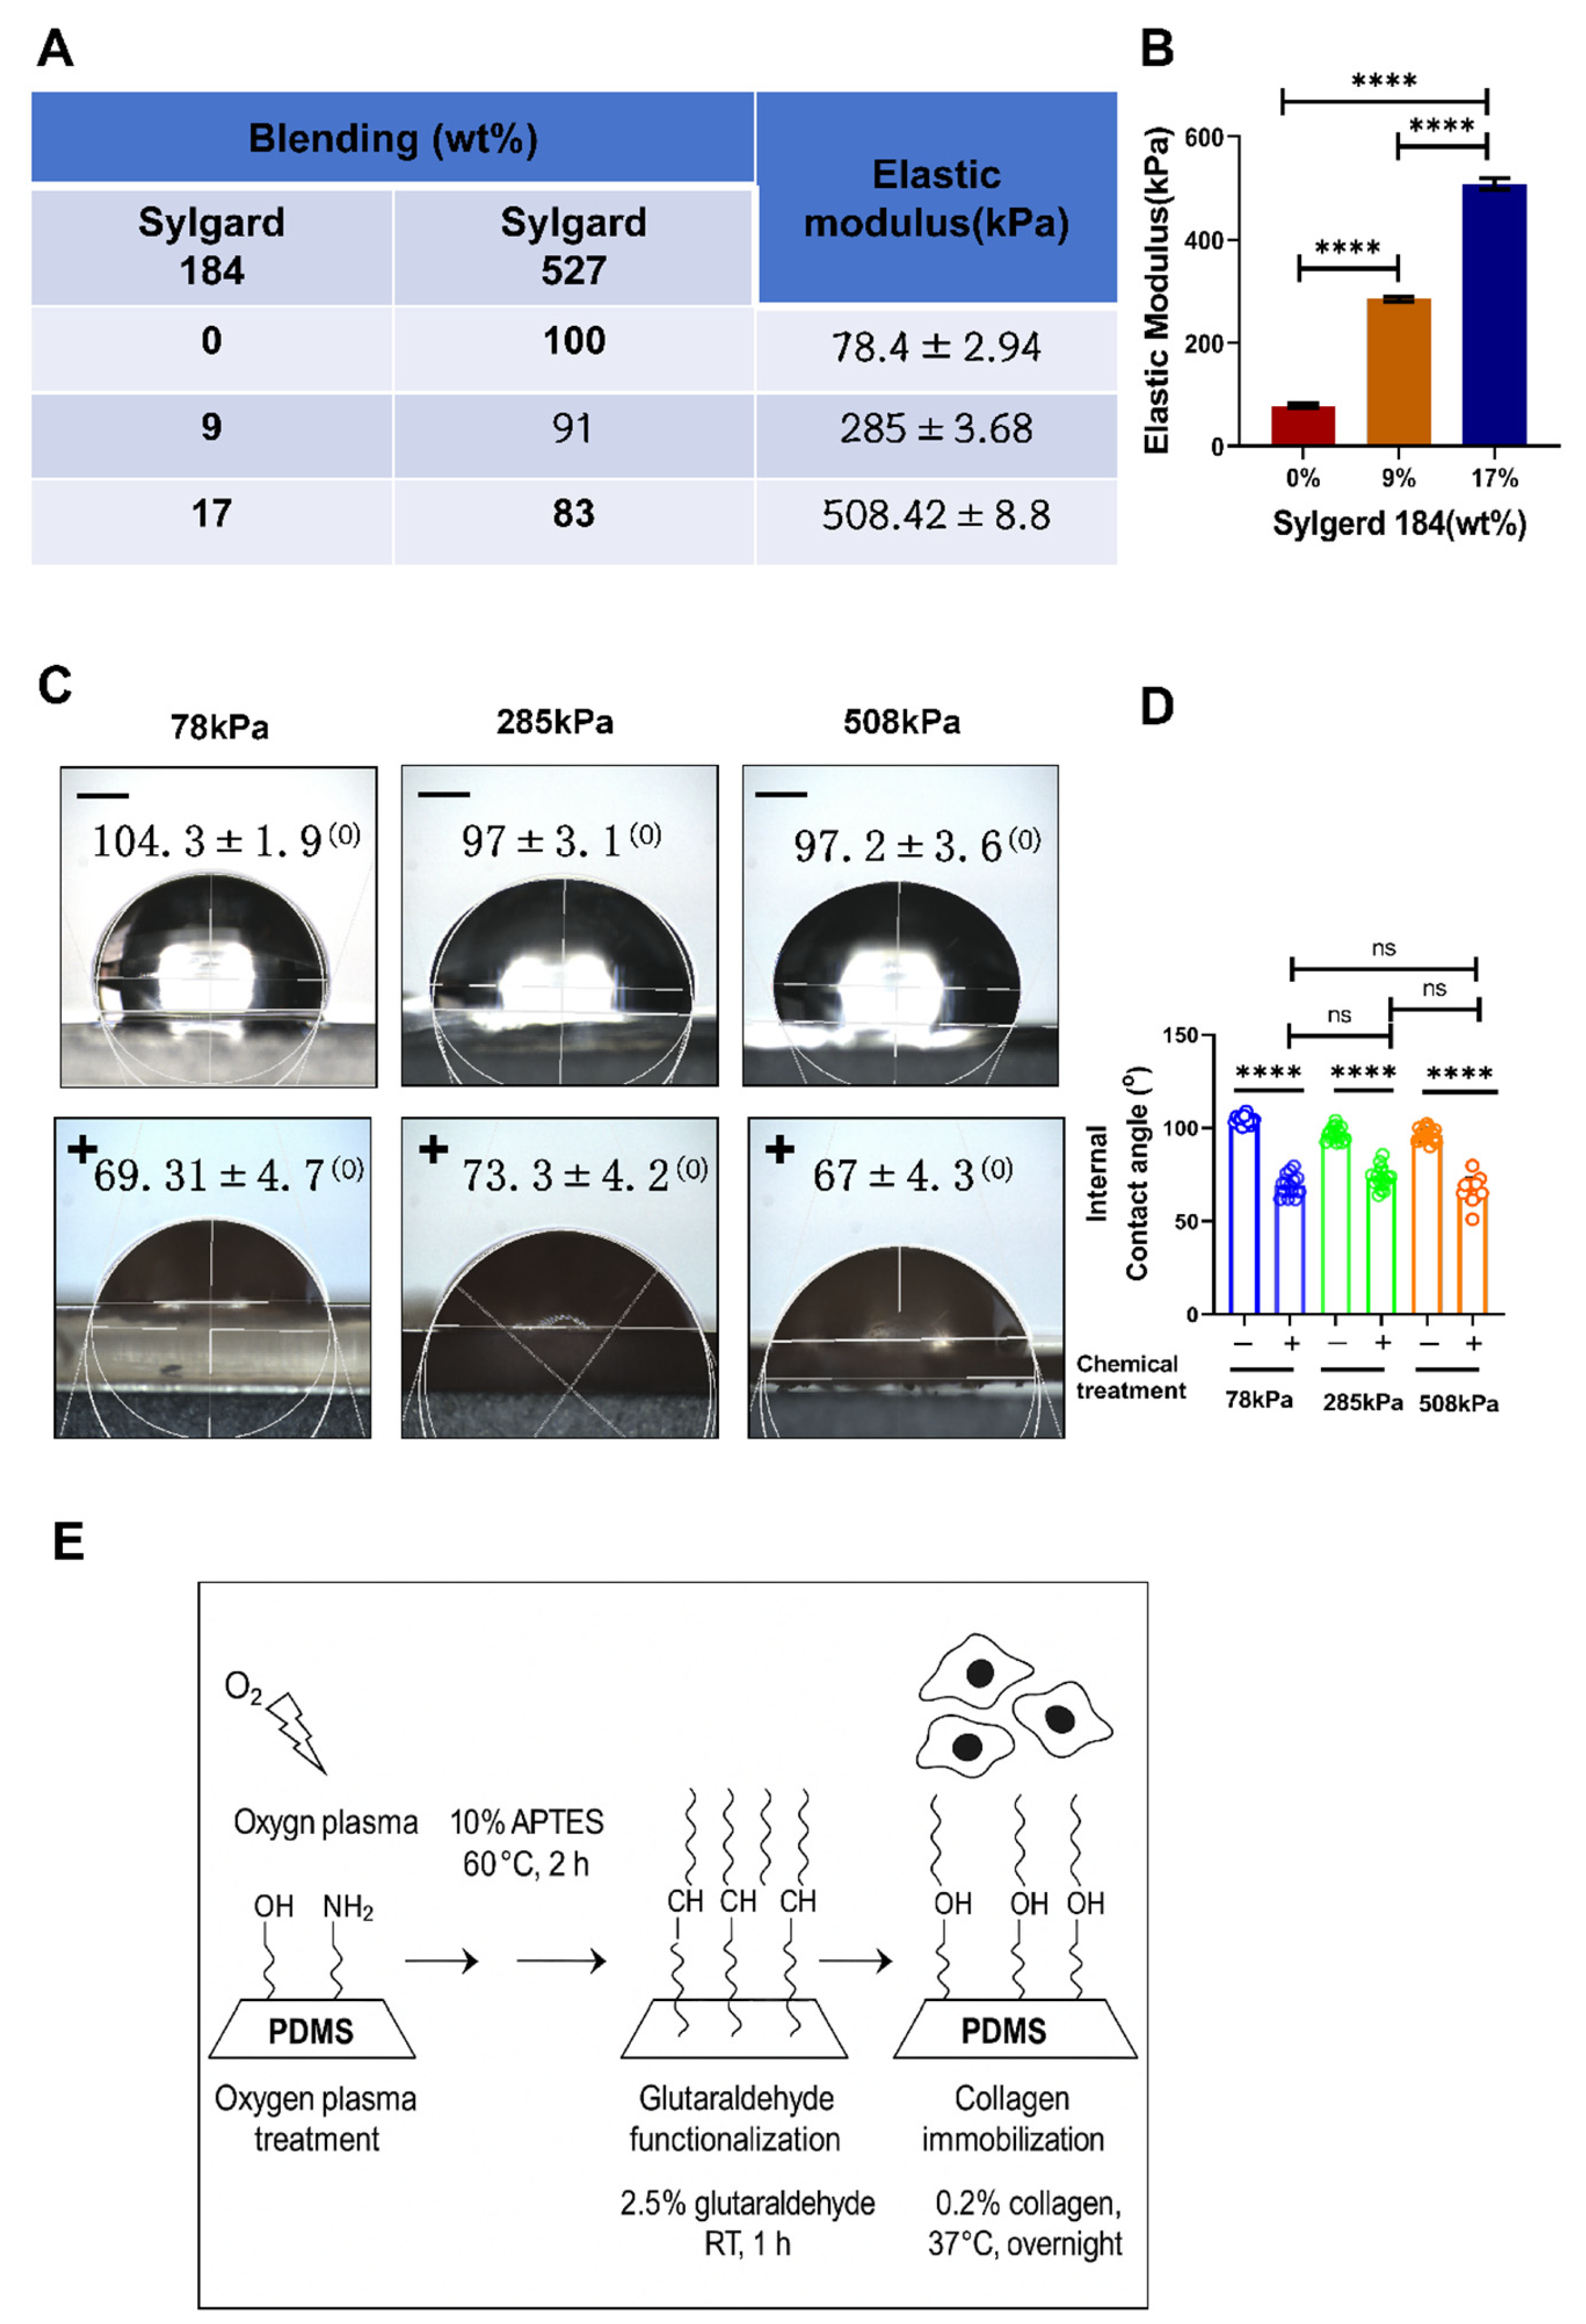
Figure 2.
Impact of PDMS substrate rigidity on the aging and survival of hypertrophic chondrocytes. SA-β-Gal staining of hypertrophic chondrocytes cultured on PDMS substrates with different stiffness. (B). Live/dead staining of cells cultured on PDMS substrates of varying stiffness. Green (Calcein-AM) labels live cells, while red (PI) marks dead cells. Arrows indicate PI-positive dead cells. (C). Quantification of live cell ratio. Data are presented as mean ± SD, ns: not significant.
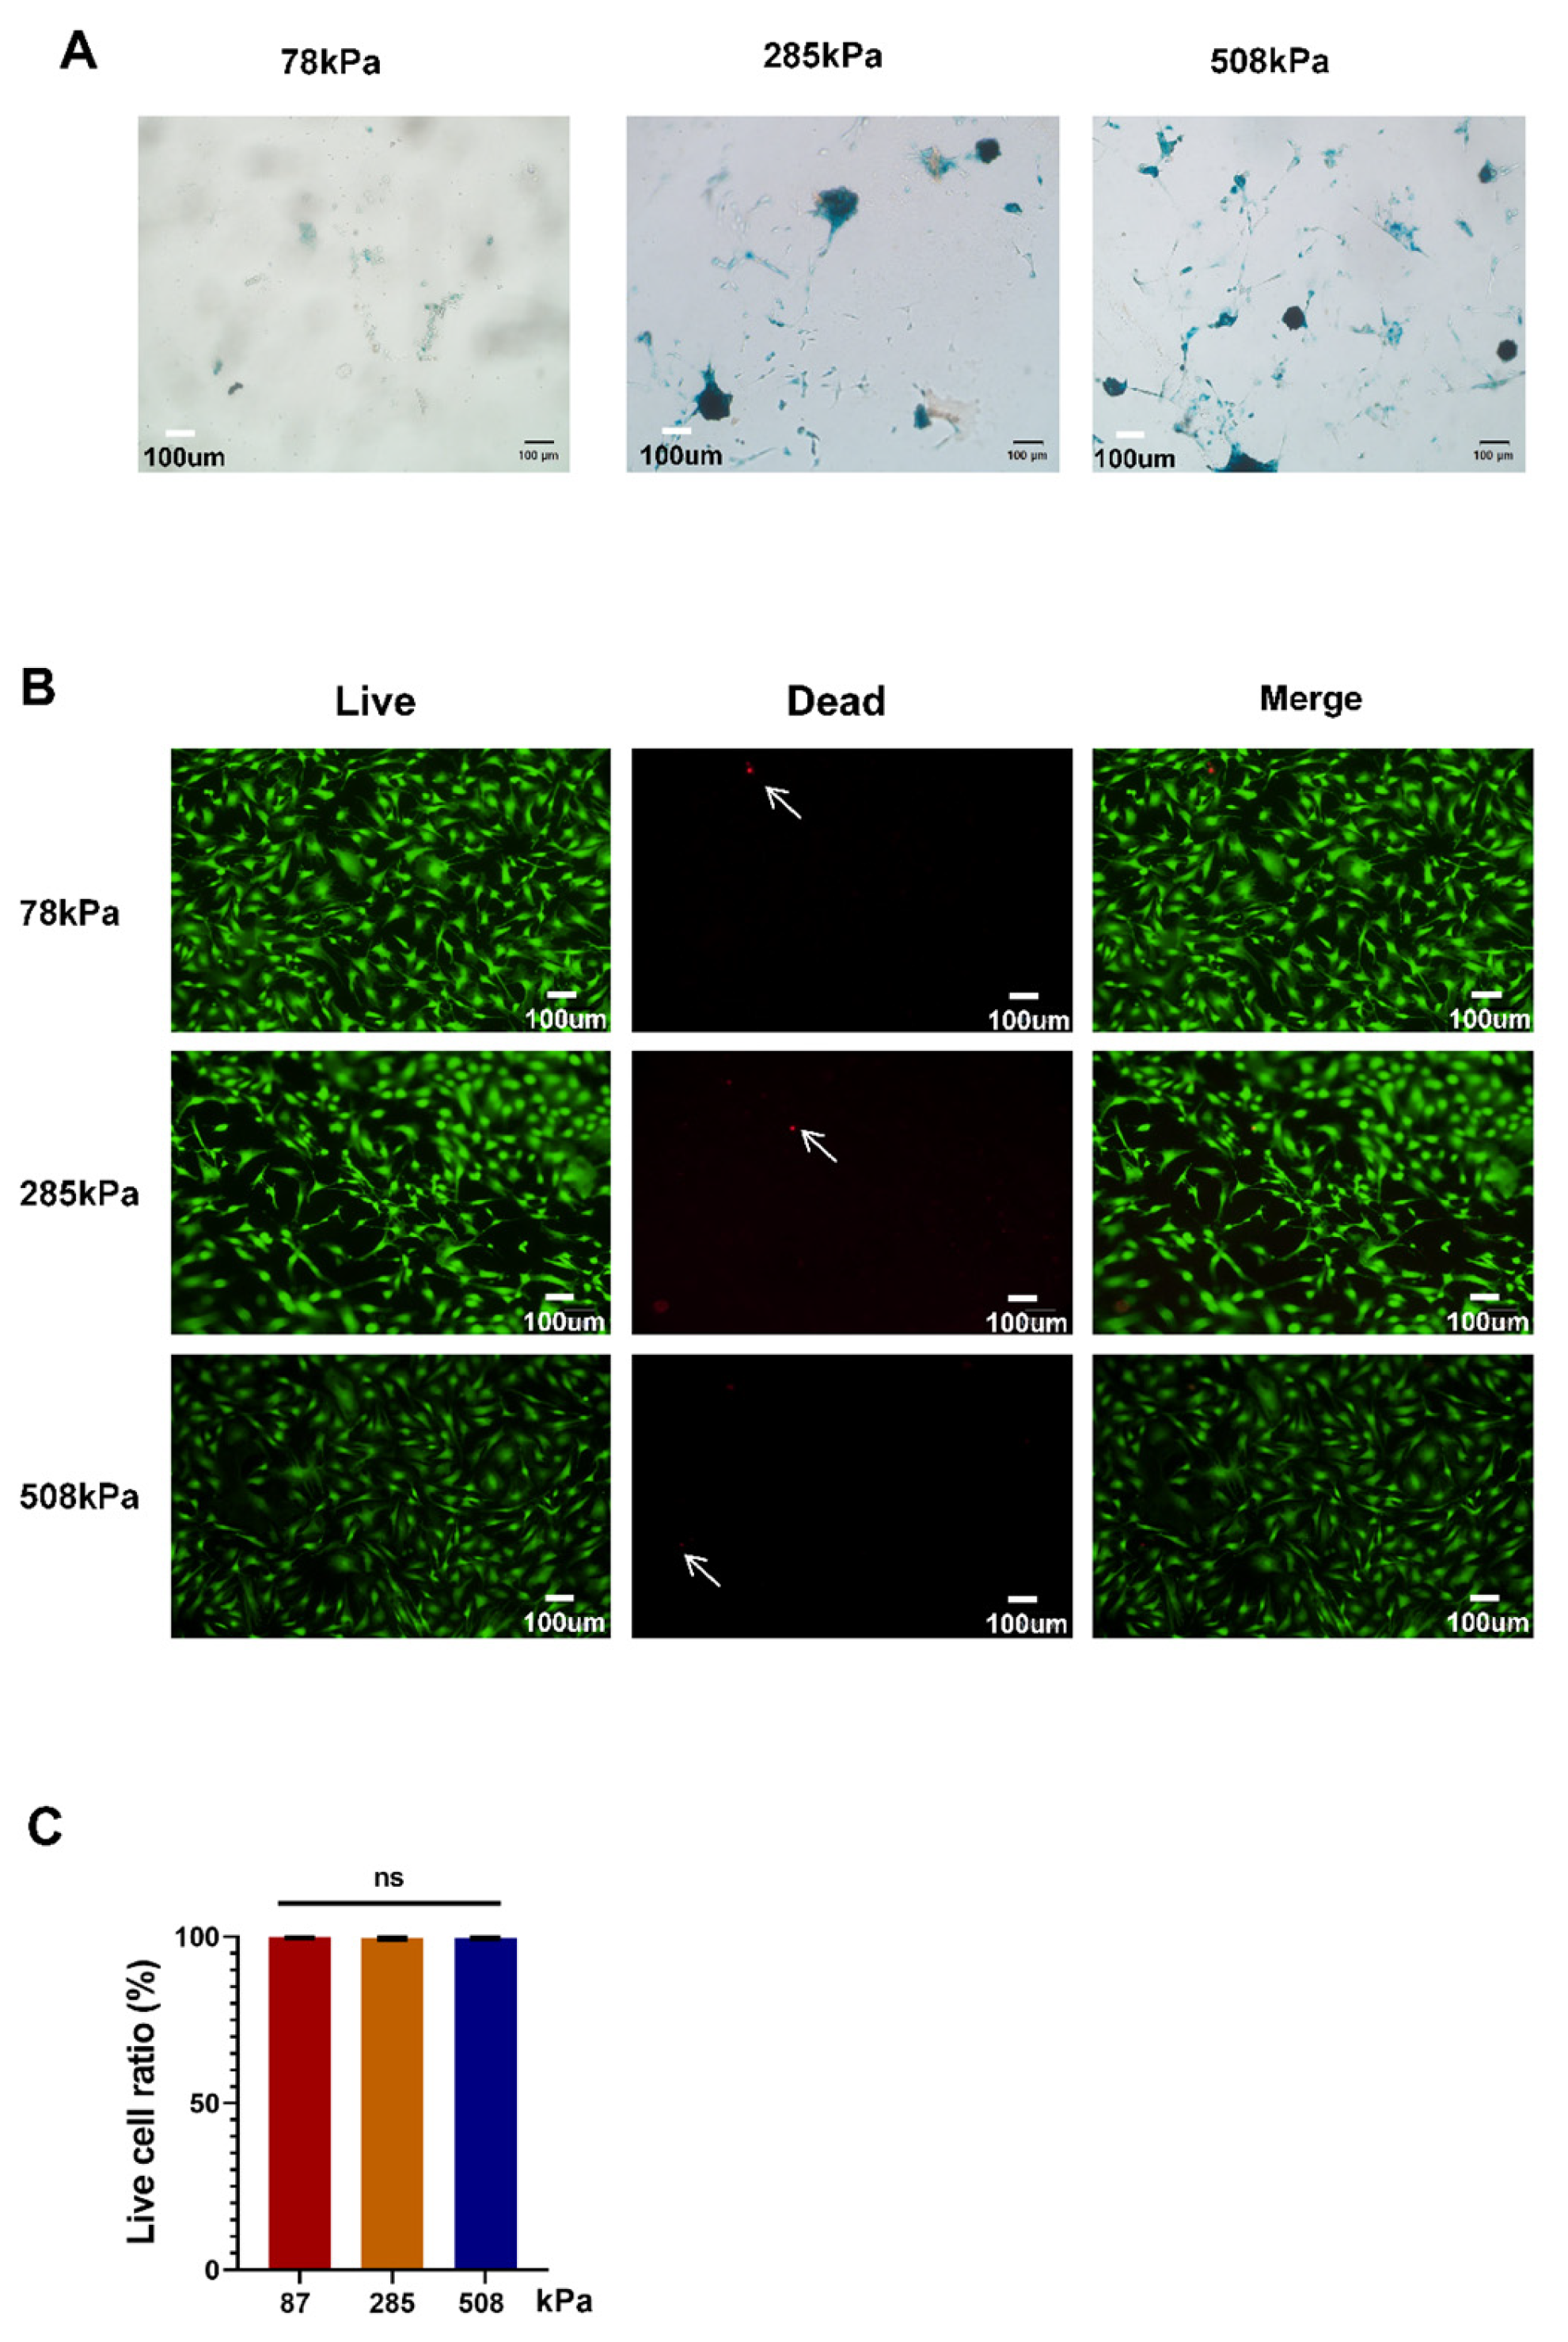
Figure 3.
Nuclear morphology of hypertrophic chondrocytes is modulated by substrate stiffness. (A) Representative immunofluorescence images of hypertrophic chondrocytes cultured on PDMS substrates of different stiffness (78, 258, and 508 kPa) for 21 days. F-actin (red) and nuclei (DAPI, blue) are shown. Insets highlight nuclear morphology. (B) Quantification of nuclear size from image analysis, revealing a significant increase in nuclear area with increasing substrate stiffness.The data are shown as mean ± SD. ****p < 0.0001; ns indicates not significant.
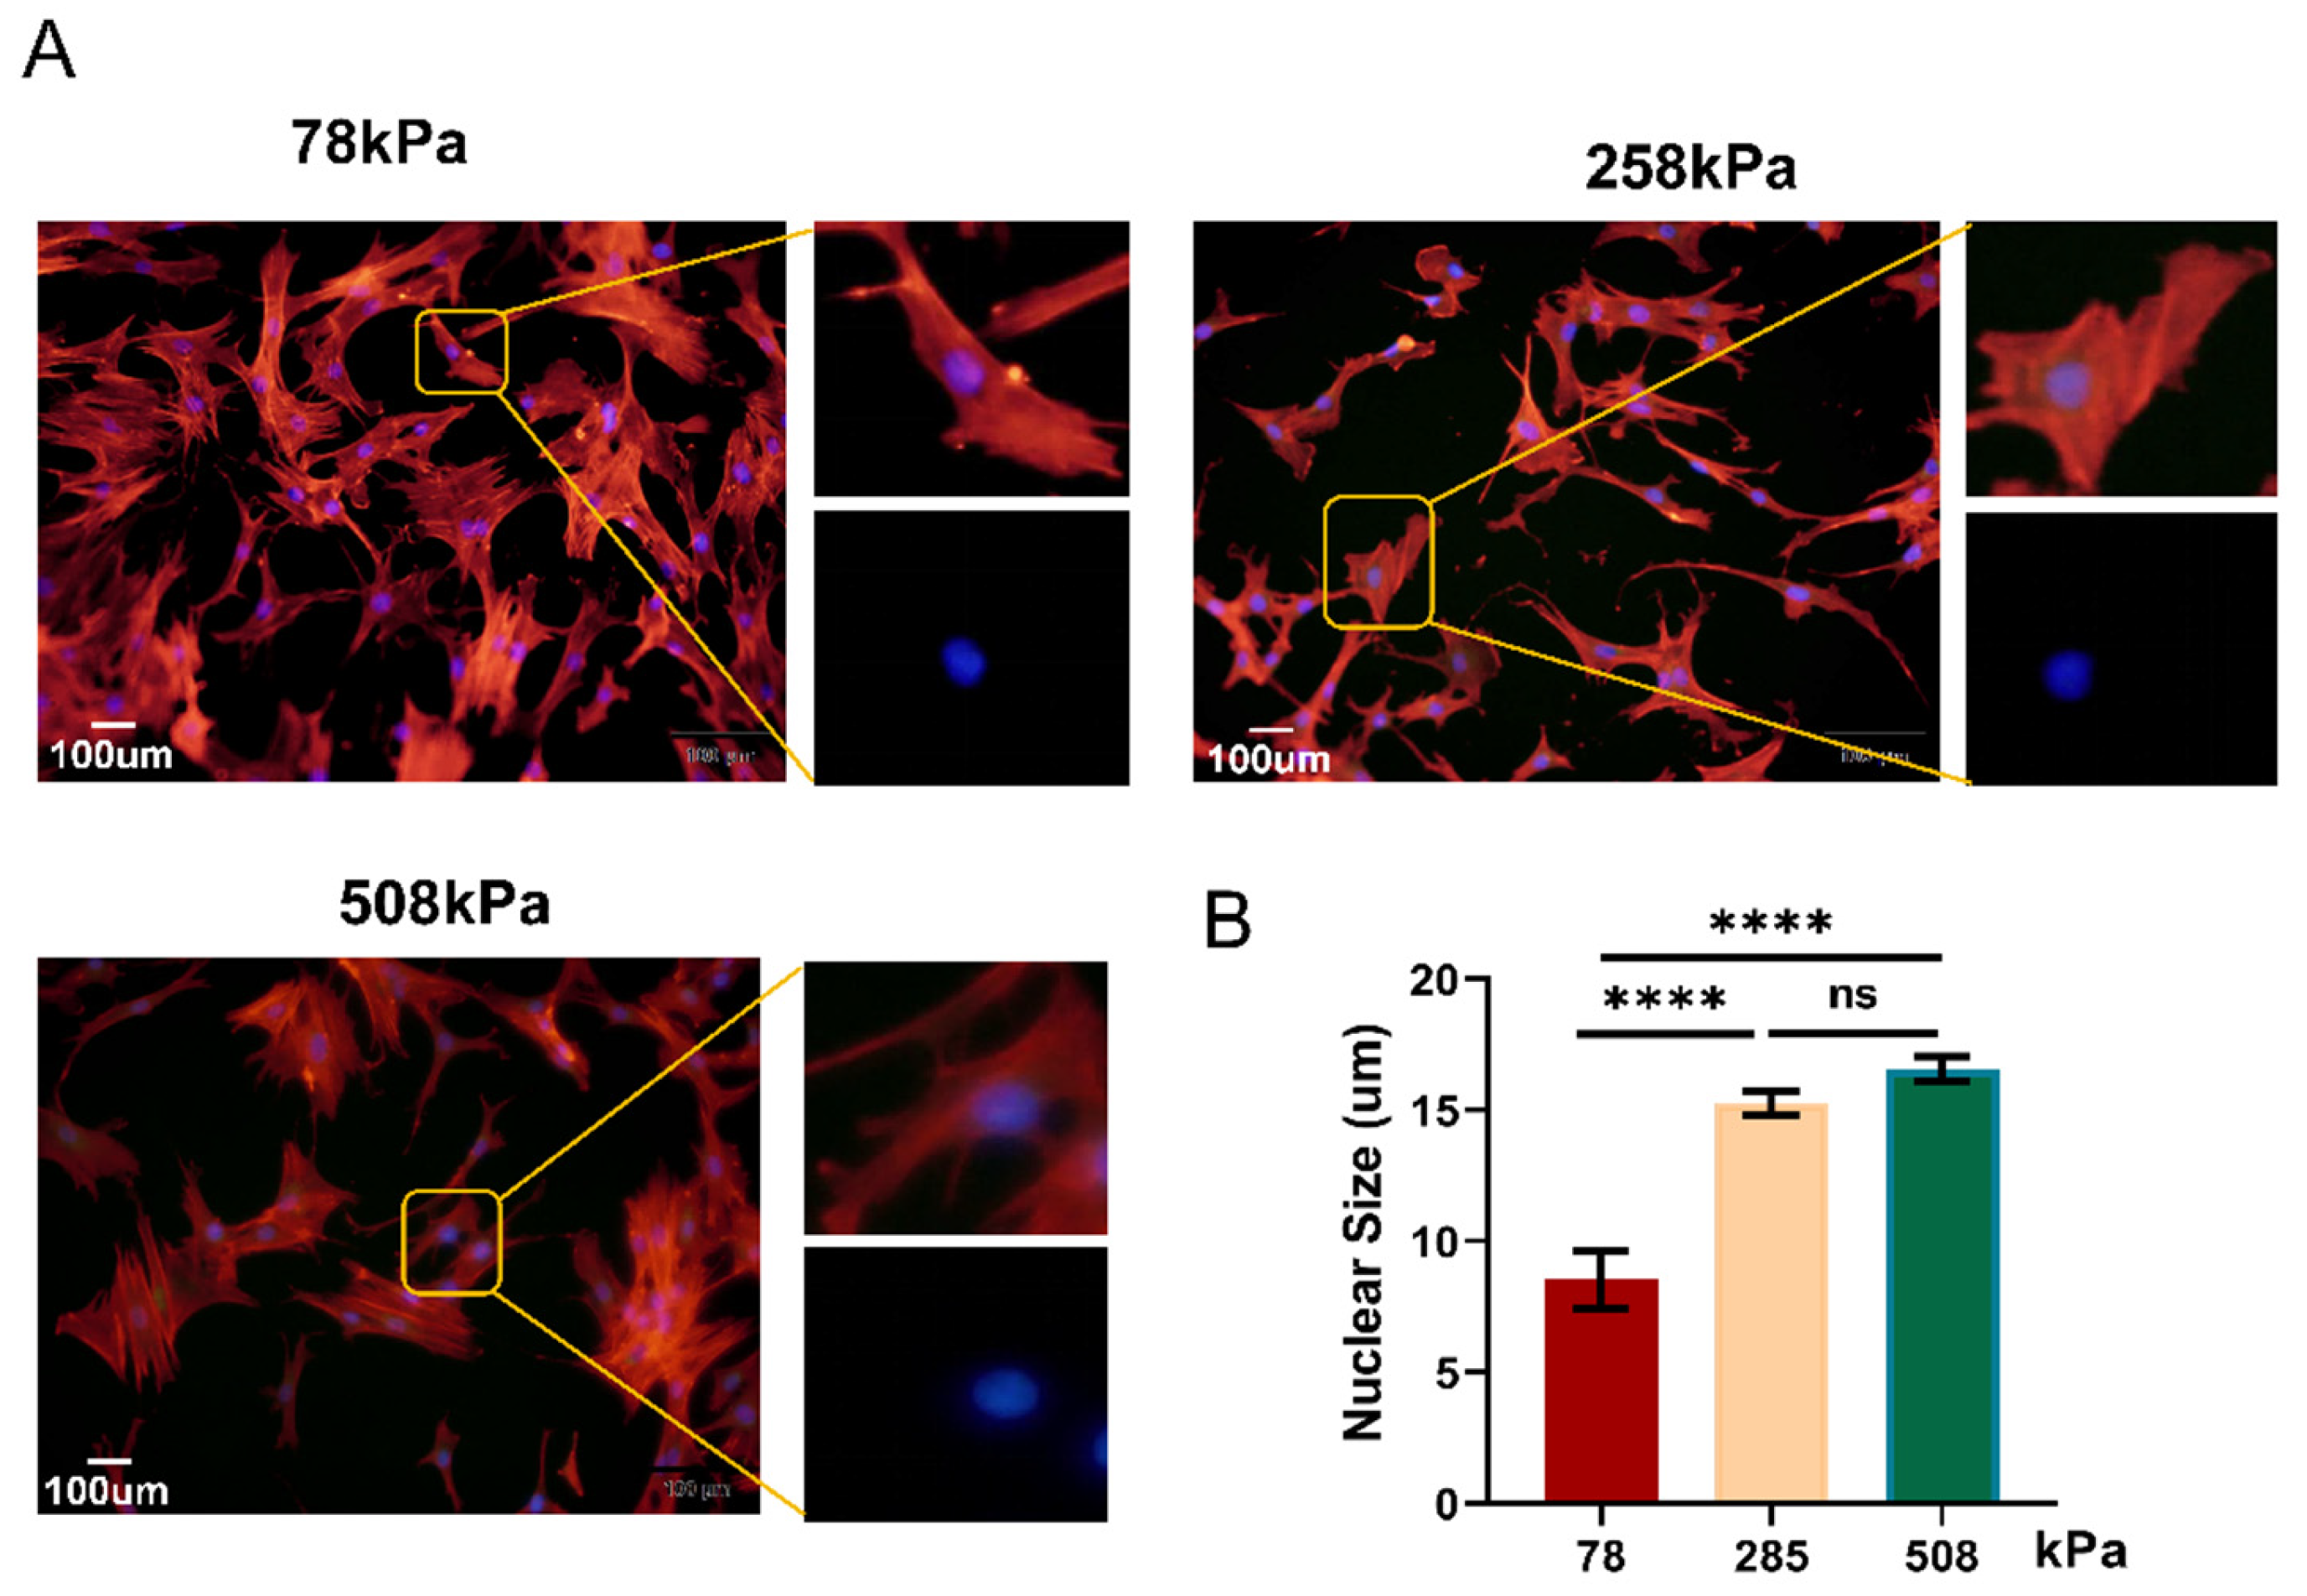
Figure 4.
Substrate stiffness modulates cytoskeletal organization and focal adhesion protein expression in hypertrophic chondrocytes. (A) Representative immunofluorescence images of hypertrophic chondrocytes cultured on PDMS substrates of different stiffness (78 kPa, 258 kPa, and 508 kPa) for 21 days. F-actin was stained in red, while nuclei were stained in blue in the cells. Enlarged views highlight differences in cytoskeletal architecture. (B) Quantification of the average fluorescence area of individual cells, showing significantly increased cell spreading on stiffer substrates. (C) Western blot analysis of focal adhesion-related proteins including Integrin, Vinculin, FAK, and Paxillin in chondrocytes cultured on PDMS substrates of varying stiffness. β-actin served as a loading control. (D) Protein expression was quantified densitometrically and normalized against β-actin. The data are shown as mean ± SD. Statistical significance is indicated as follows: ns = not significant, *p < 0.05, **p < 0.01, ***p < 0.001, ****p < 0.0001.
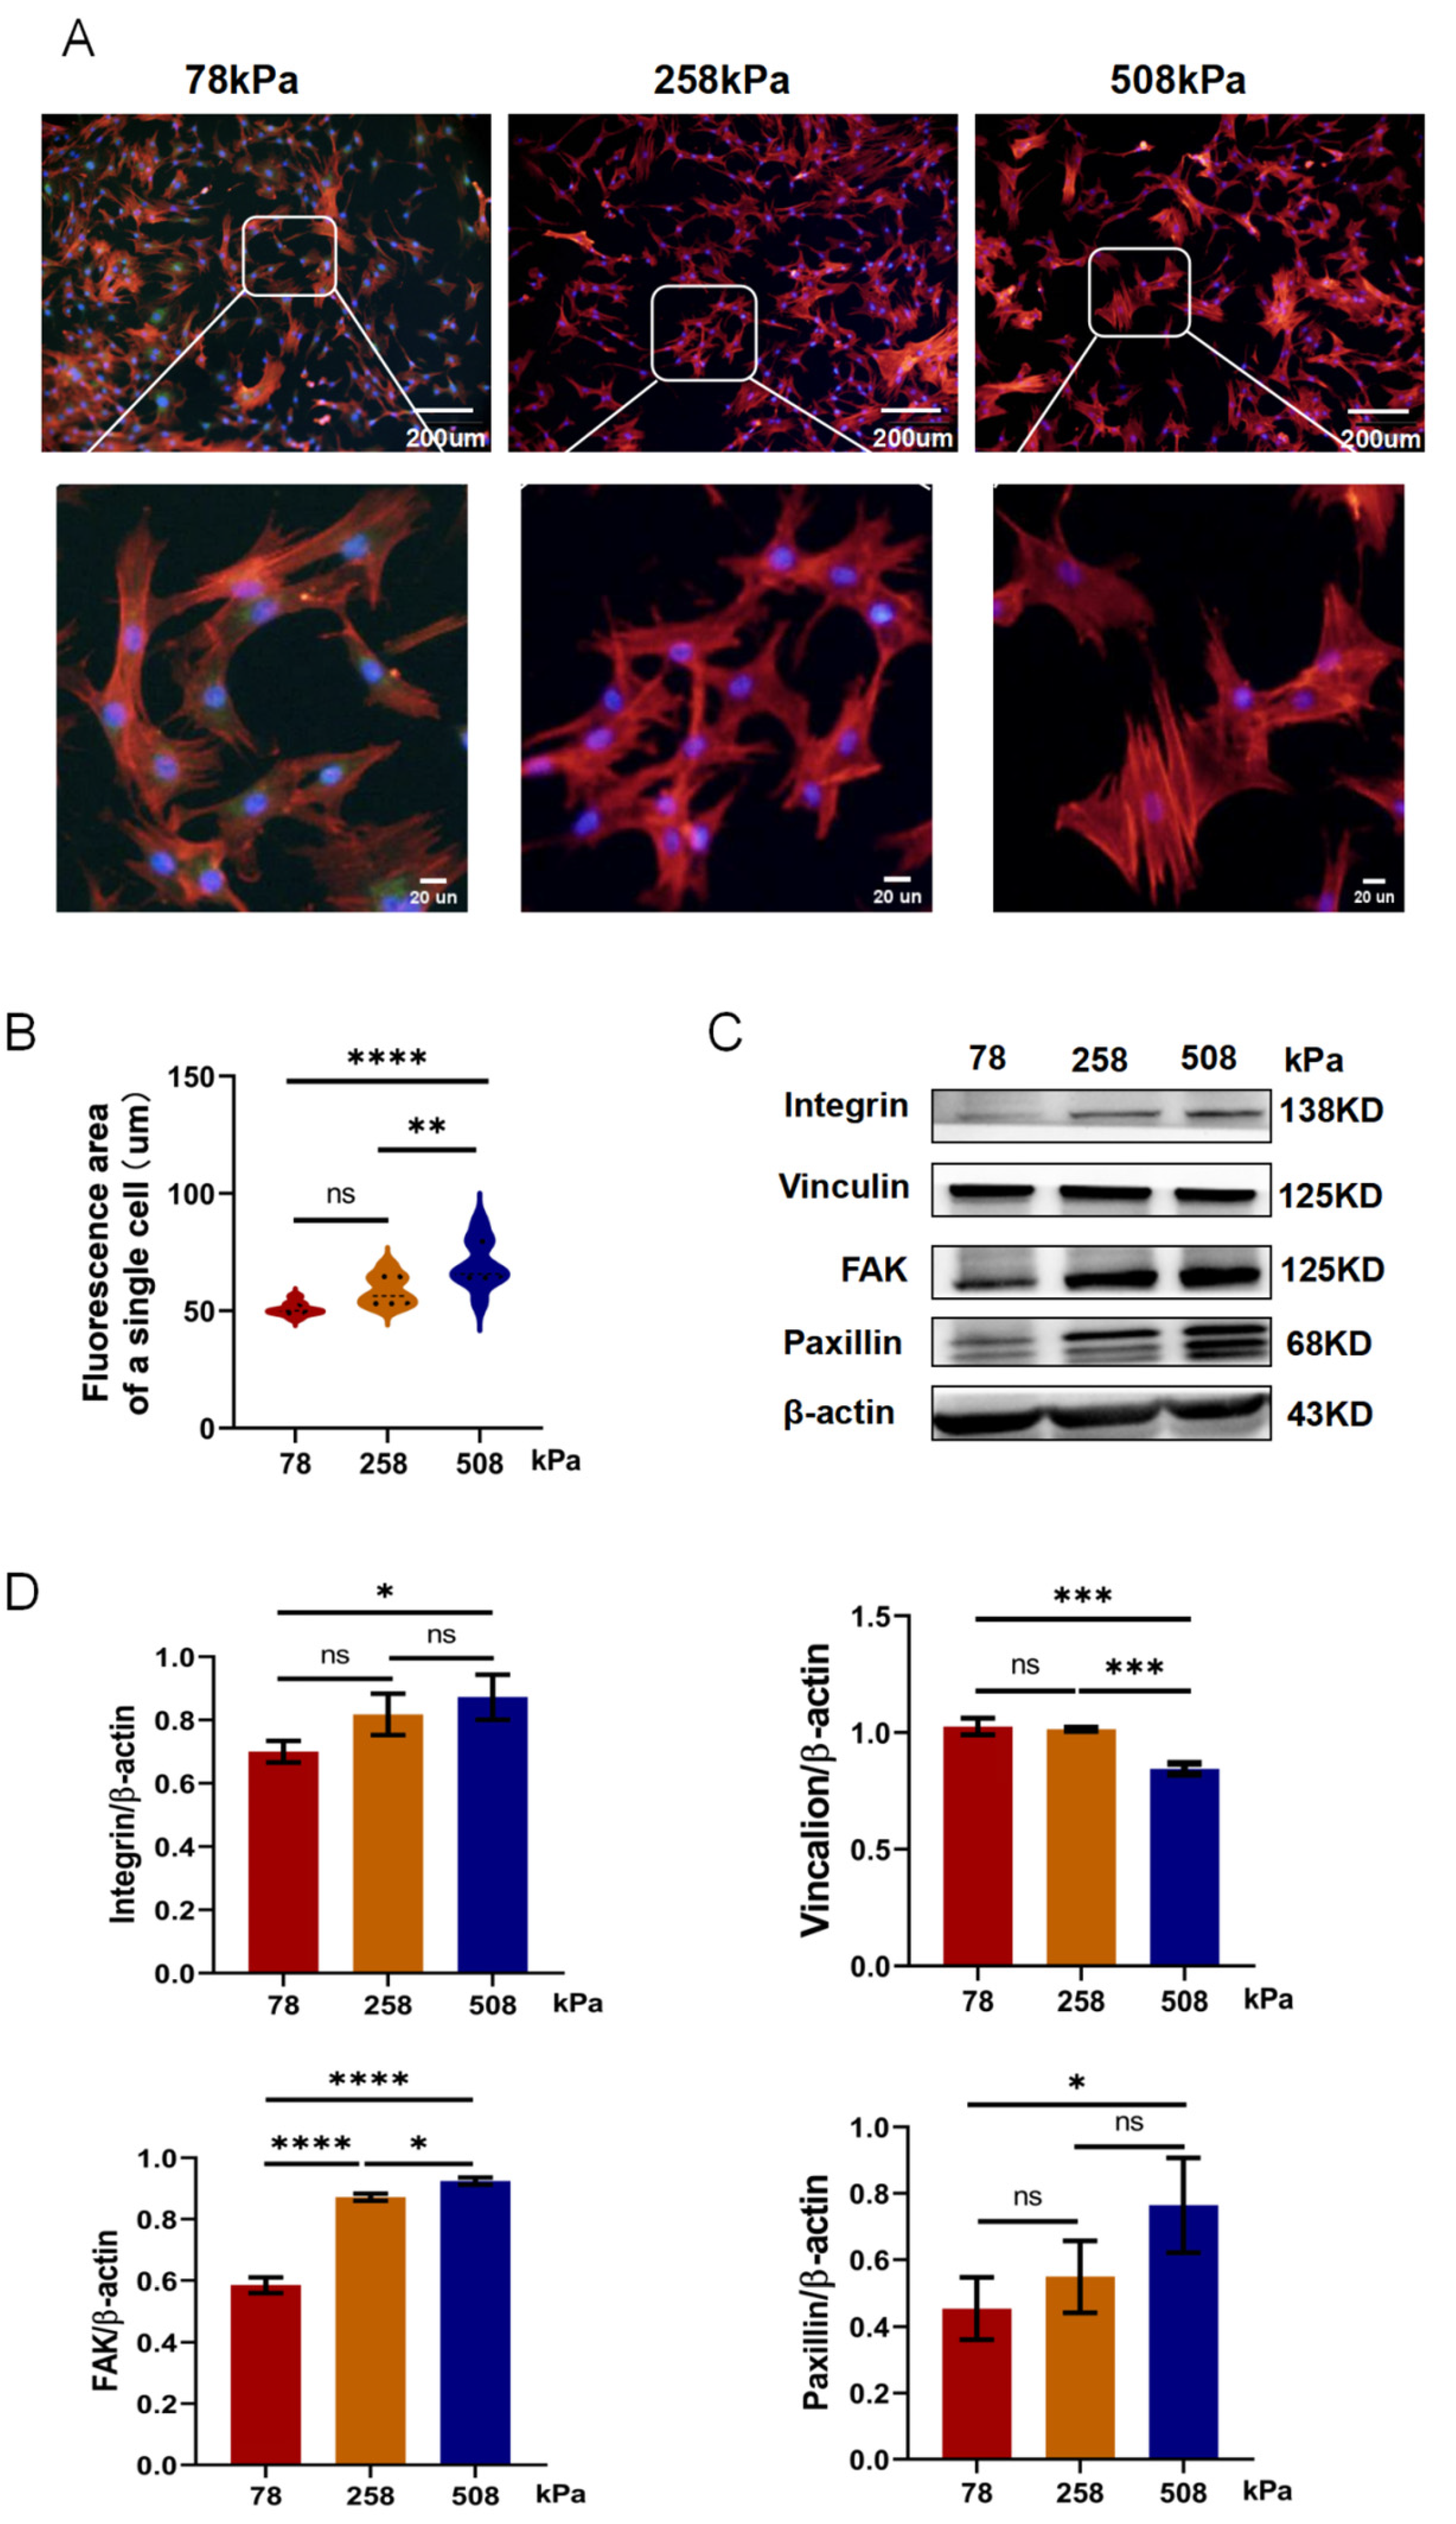
Figure 5.
Substrate stiffness regulates YAP subcellular localization and phosphorylation in hypertrophic chondrocytes. (A) Representative immunofluorescence images of YAP (green) and nuclei (blue) in hypertrophic chondrocytes cultured on PDMS substrates of different stiffness (78 kPa, 258 kPa, and 508 kPa) for 21 days. (B) Heatmap representations of YAP fluorescence intensity in individual cells, revealing differential localization patterns under different substrate stiffness conditions. (C) Quantitative intensity profiles of YAP (green) and DAPI (blue) signals across the cell section analyzed using ImageJ, confirming the extent of YAP nuclear translocation. (D) Analysis of total YAP and phosphorylated YAP (P-YAP) via Western blot in hypertrophic chondrocytes grown on PDMS substrates with different stiffness levels. β-actin served as a loading control. (E,F) Quantification of total YAP and P-YAP expression levels normalized to β-actin. Data represent mean ± SD, n = 3. Statistical significance: *p < 0.05, **p < 0.01, ***p < 0.001; ns = not significant.
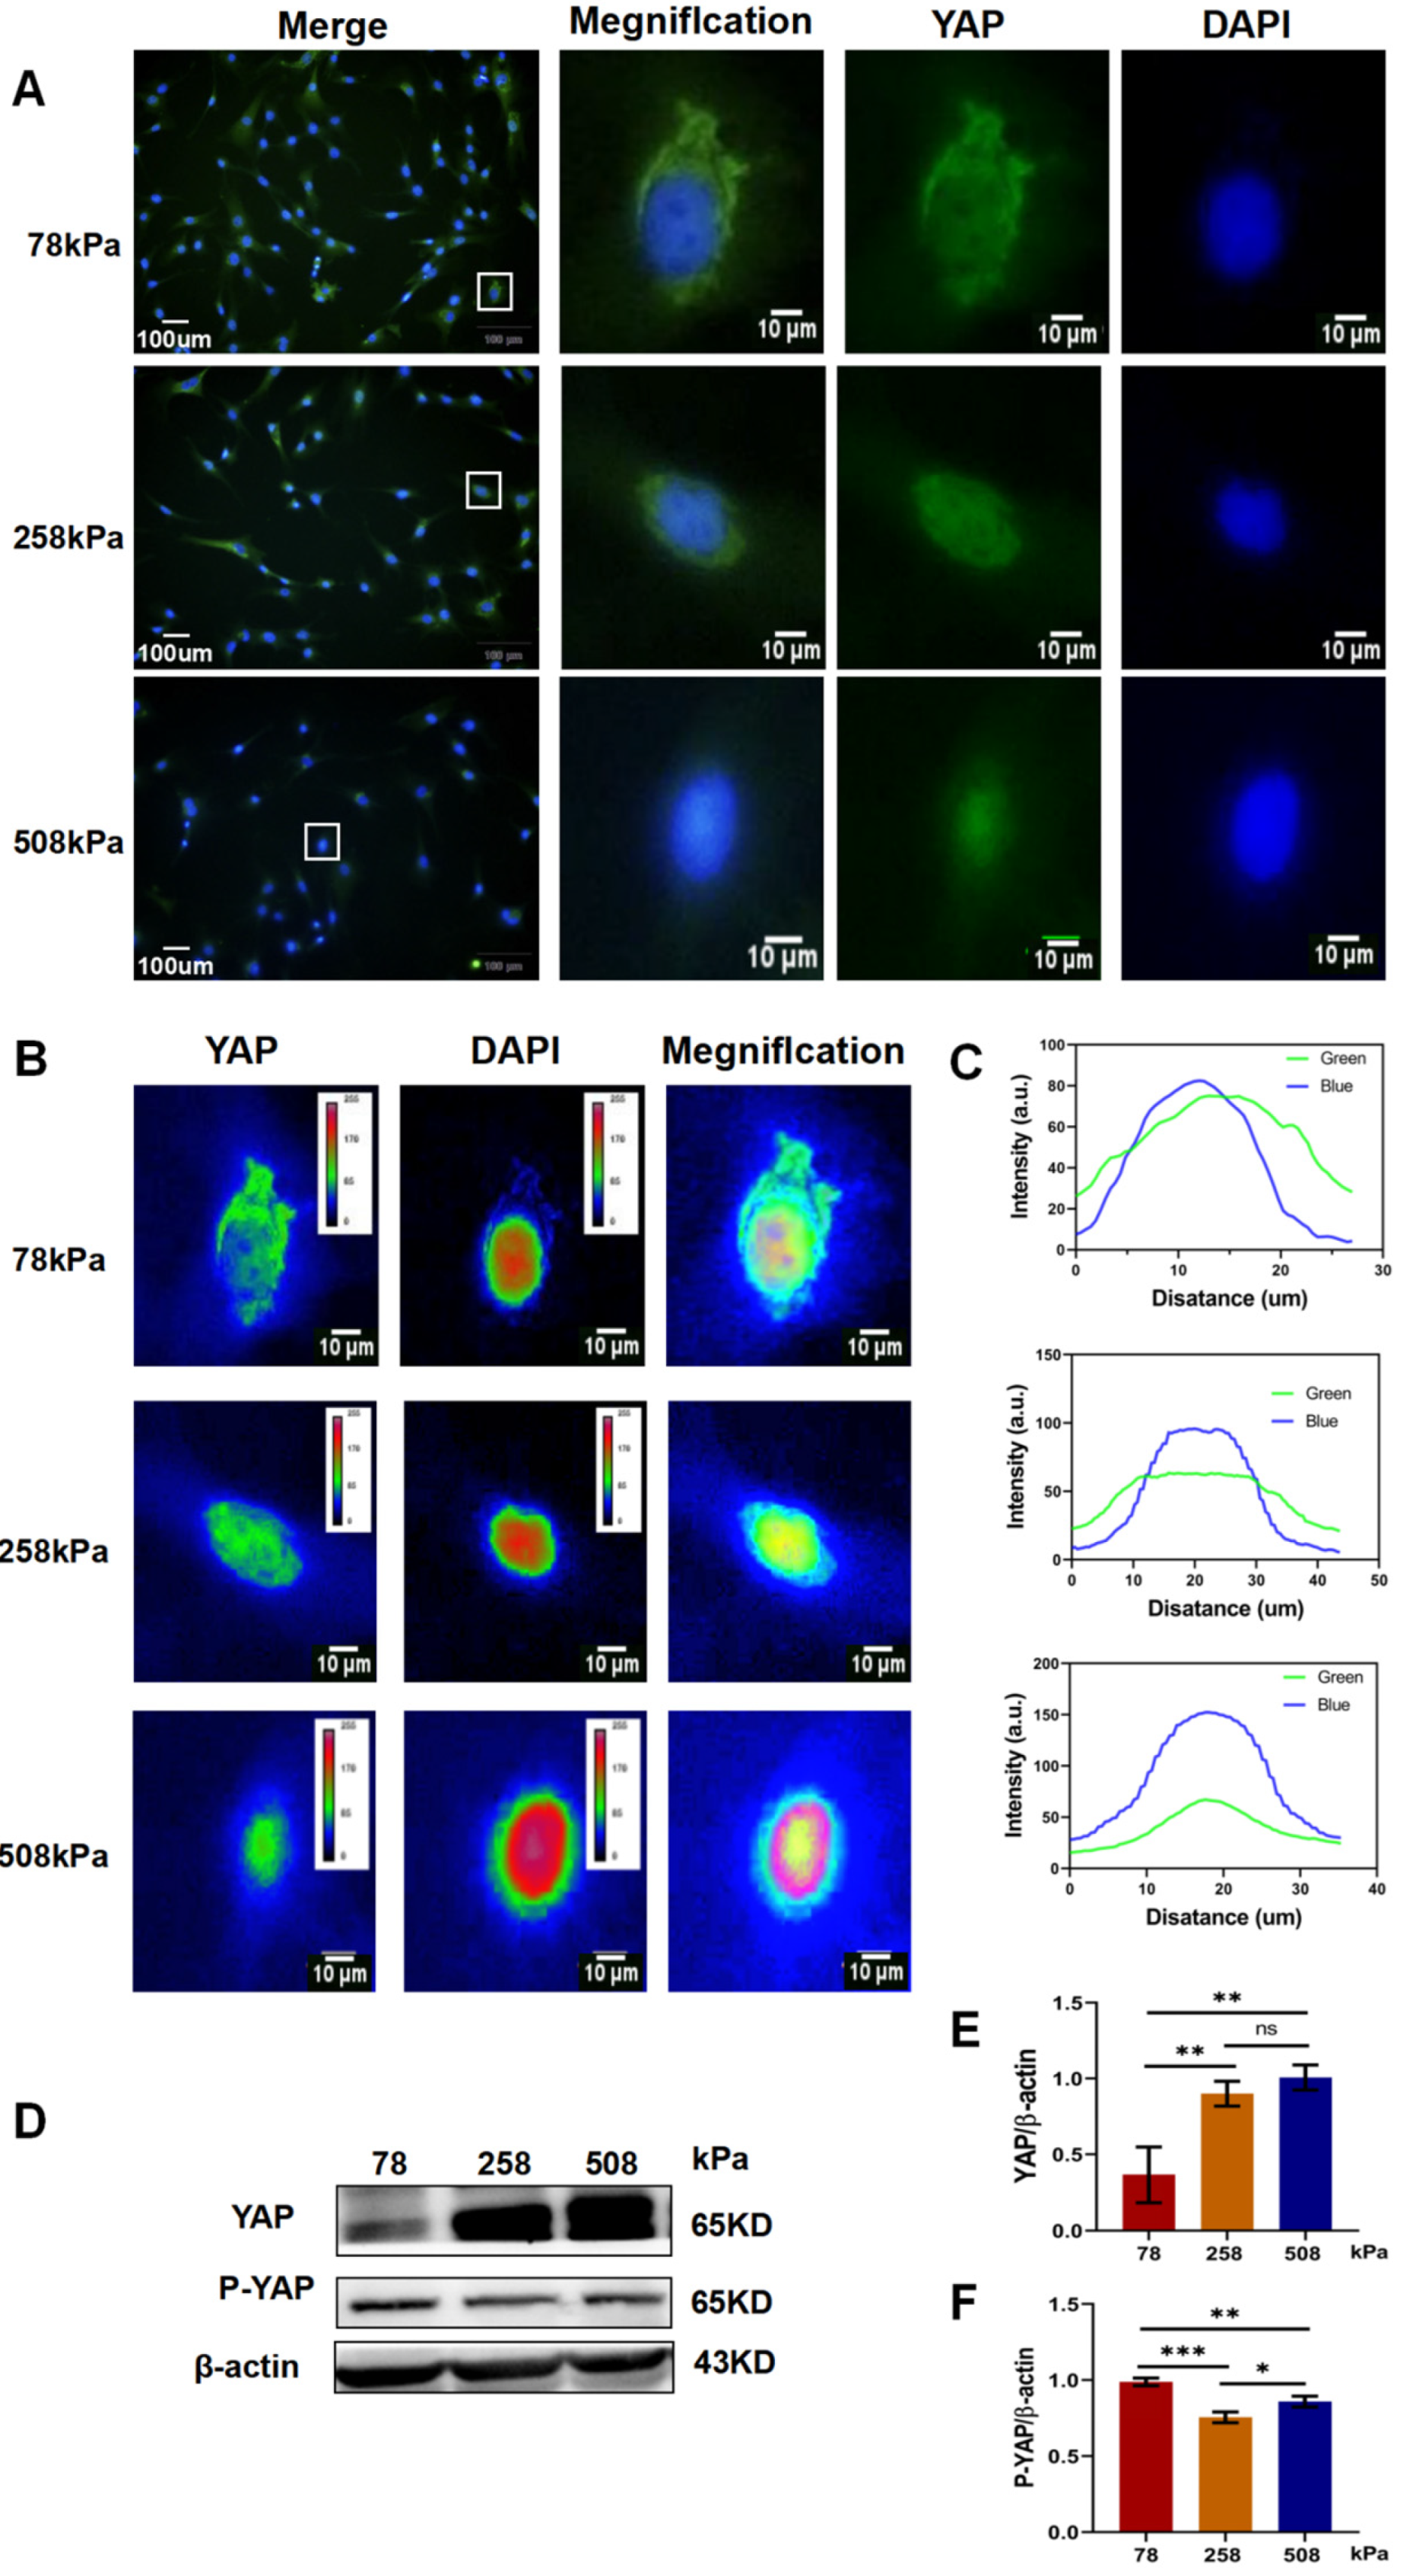
Figure 6.
Soft substrates inhibit osteogenic differentiation and support the maintenance of chondrocyte phenotype in hypertrophic chondrocytes. (A) Representative images of Alizarin Red S staining in 24-well plates showing calcium deposition by hypertrophic chondrocytes cultured on PDMS substrates of different stiffness (78, 258, and 508 kPa) for 21 days. (B) Microscopic images of Alizarin Red S staining showing matrix mineralization at higher magnification. (C) Western blot analysis of osteogenic and hypertrophic markers including COL-1, MMP13, and RUNX2 across different substrate stiffness conditions. (D) Western blot analysis of TGF-β/BMP downstream effectors Smad2/3 and Smad1/5/8 in hypertrophic chondrocytes. (E–G) Quantification of protein levels of COL-1, MMP13, and RUNX2, normalized to β-actin.(H,I) Quantification of Smad2/3 and Smad1/5/8 protein levels.The data are shown as mean ± SD, with *p < 0.05, **p < 0.01, ***p < 0.001, and ****p < 0.0001; ns indicates not significant.
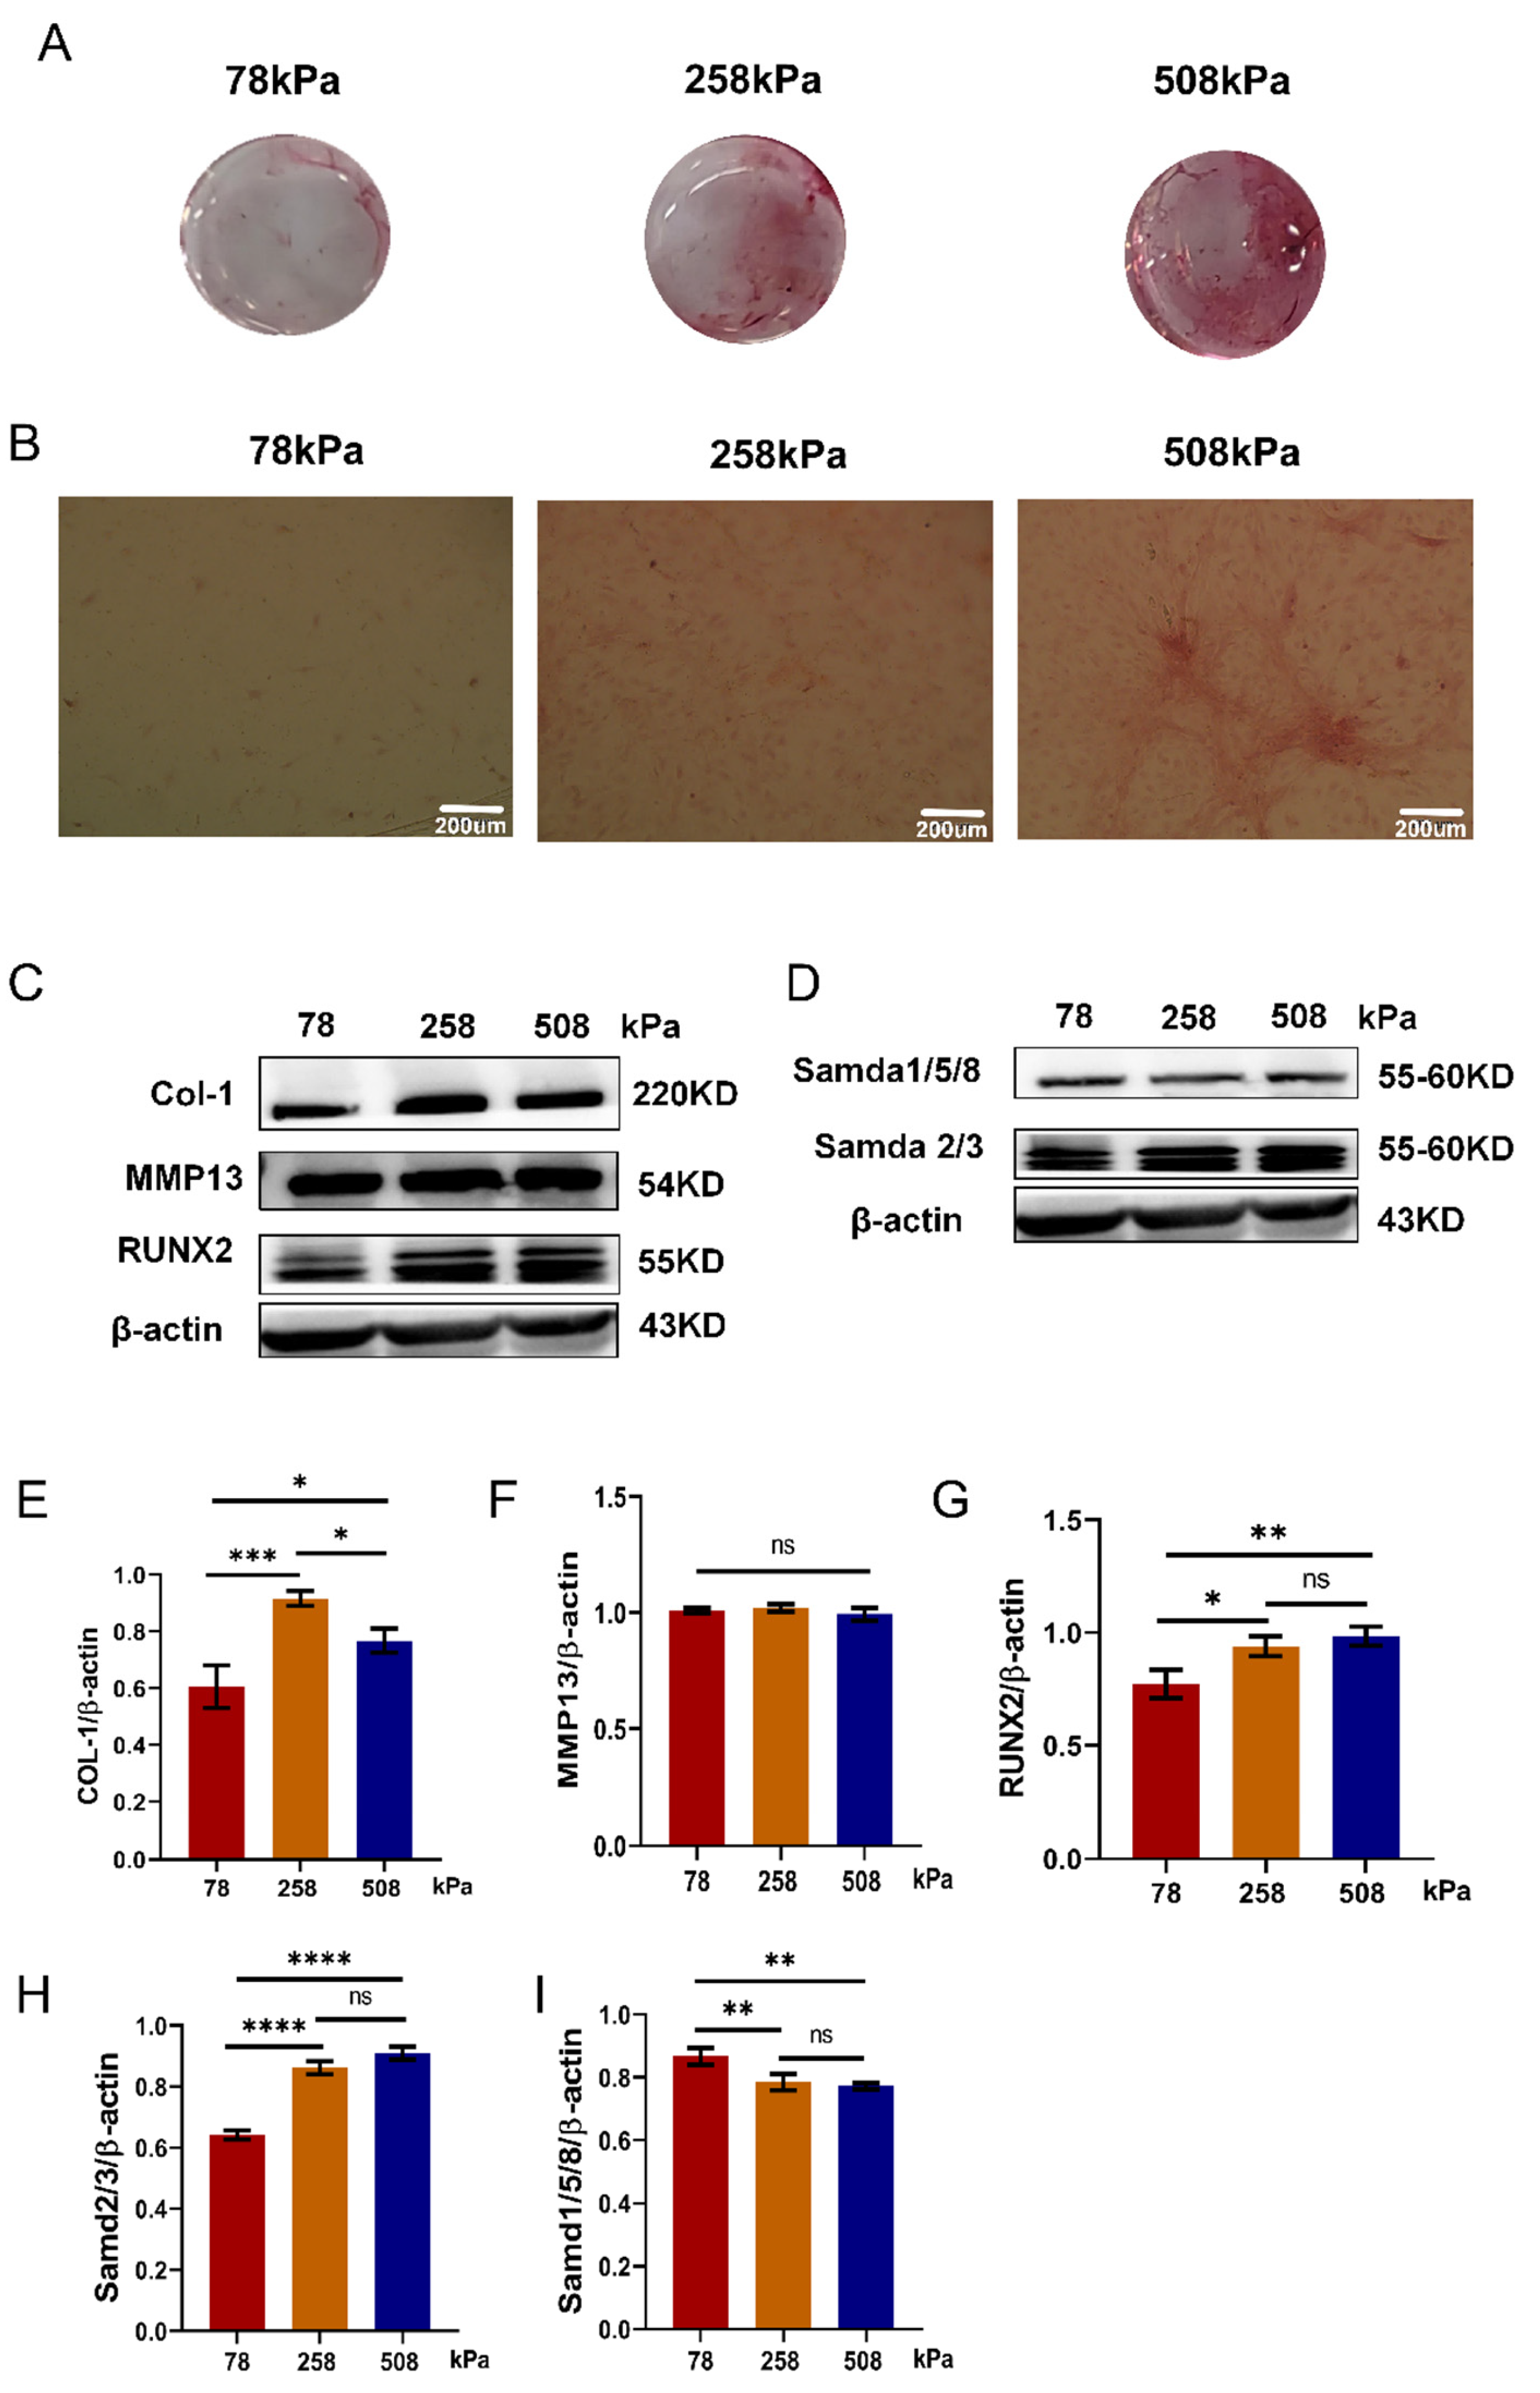
Figure 7.
Substrate stiffness modulates chondrocyte phenotype in hypertrophic chondrocytes. (A) Immunofluorescent staining of type II collagen (COL2A1) in hypertrophic chondrocytes cultured for 21 days on PDMS substrates with stiffness of 78 kPa, 216 kPa, and 508 kPa. Red: COL2A1; blue: nuclei (DAPI). Upper panels have scale bars of 200 μm, while lower panels have 50 μm. (B) Quantification of COL2A1 fluorescence intensity in different stiffness groups. (C) Macroscopic images of Safranin O-stained PDMS surfaces after 21 days of culture. Red staining reflects cartilage matrix deposition. (D) Quantification of Safranin O staining intensity. 508 kPa group shows significantly reduced matrix formation. (E) Microscopic images of Safranin O staining from (C), showing matrix distribution at higher magnification. Scale bars: 200 μm. (F) qPCR analysis of gene expression levels of Col1a1, Col2a1, Col10a1, and Sox9 in cells cultured on PDMS substrates of varying stiffness. Lower stiffness (78 kPa) maintains chondrogenic markers (Col2a1, Sox9), while higher stiffness (508 kPa) upregulates hypertrophic and fibrotic markers (Col10a1, Col1a1). (G) Western blot analysis of COL2A1 protein levels, normalized to β-actin, showing reduced expression on stiffer substrates. (H) Quantification of COL2A1 protein levels (COL2A1/β-actin ratio) from (G). Data are presented as mean ± SD, *p < 0.05, **p < 0.01, ***p < 0.001, ****p < 0.0001, ns: not significant.
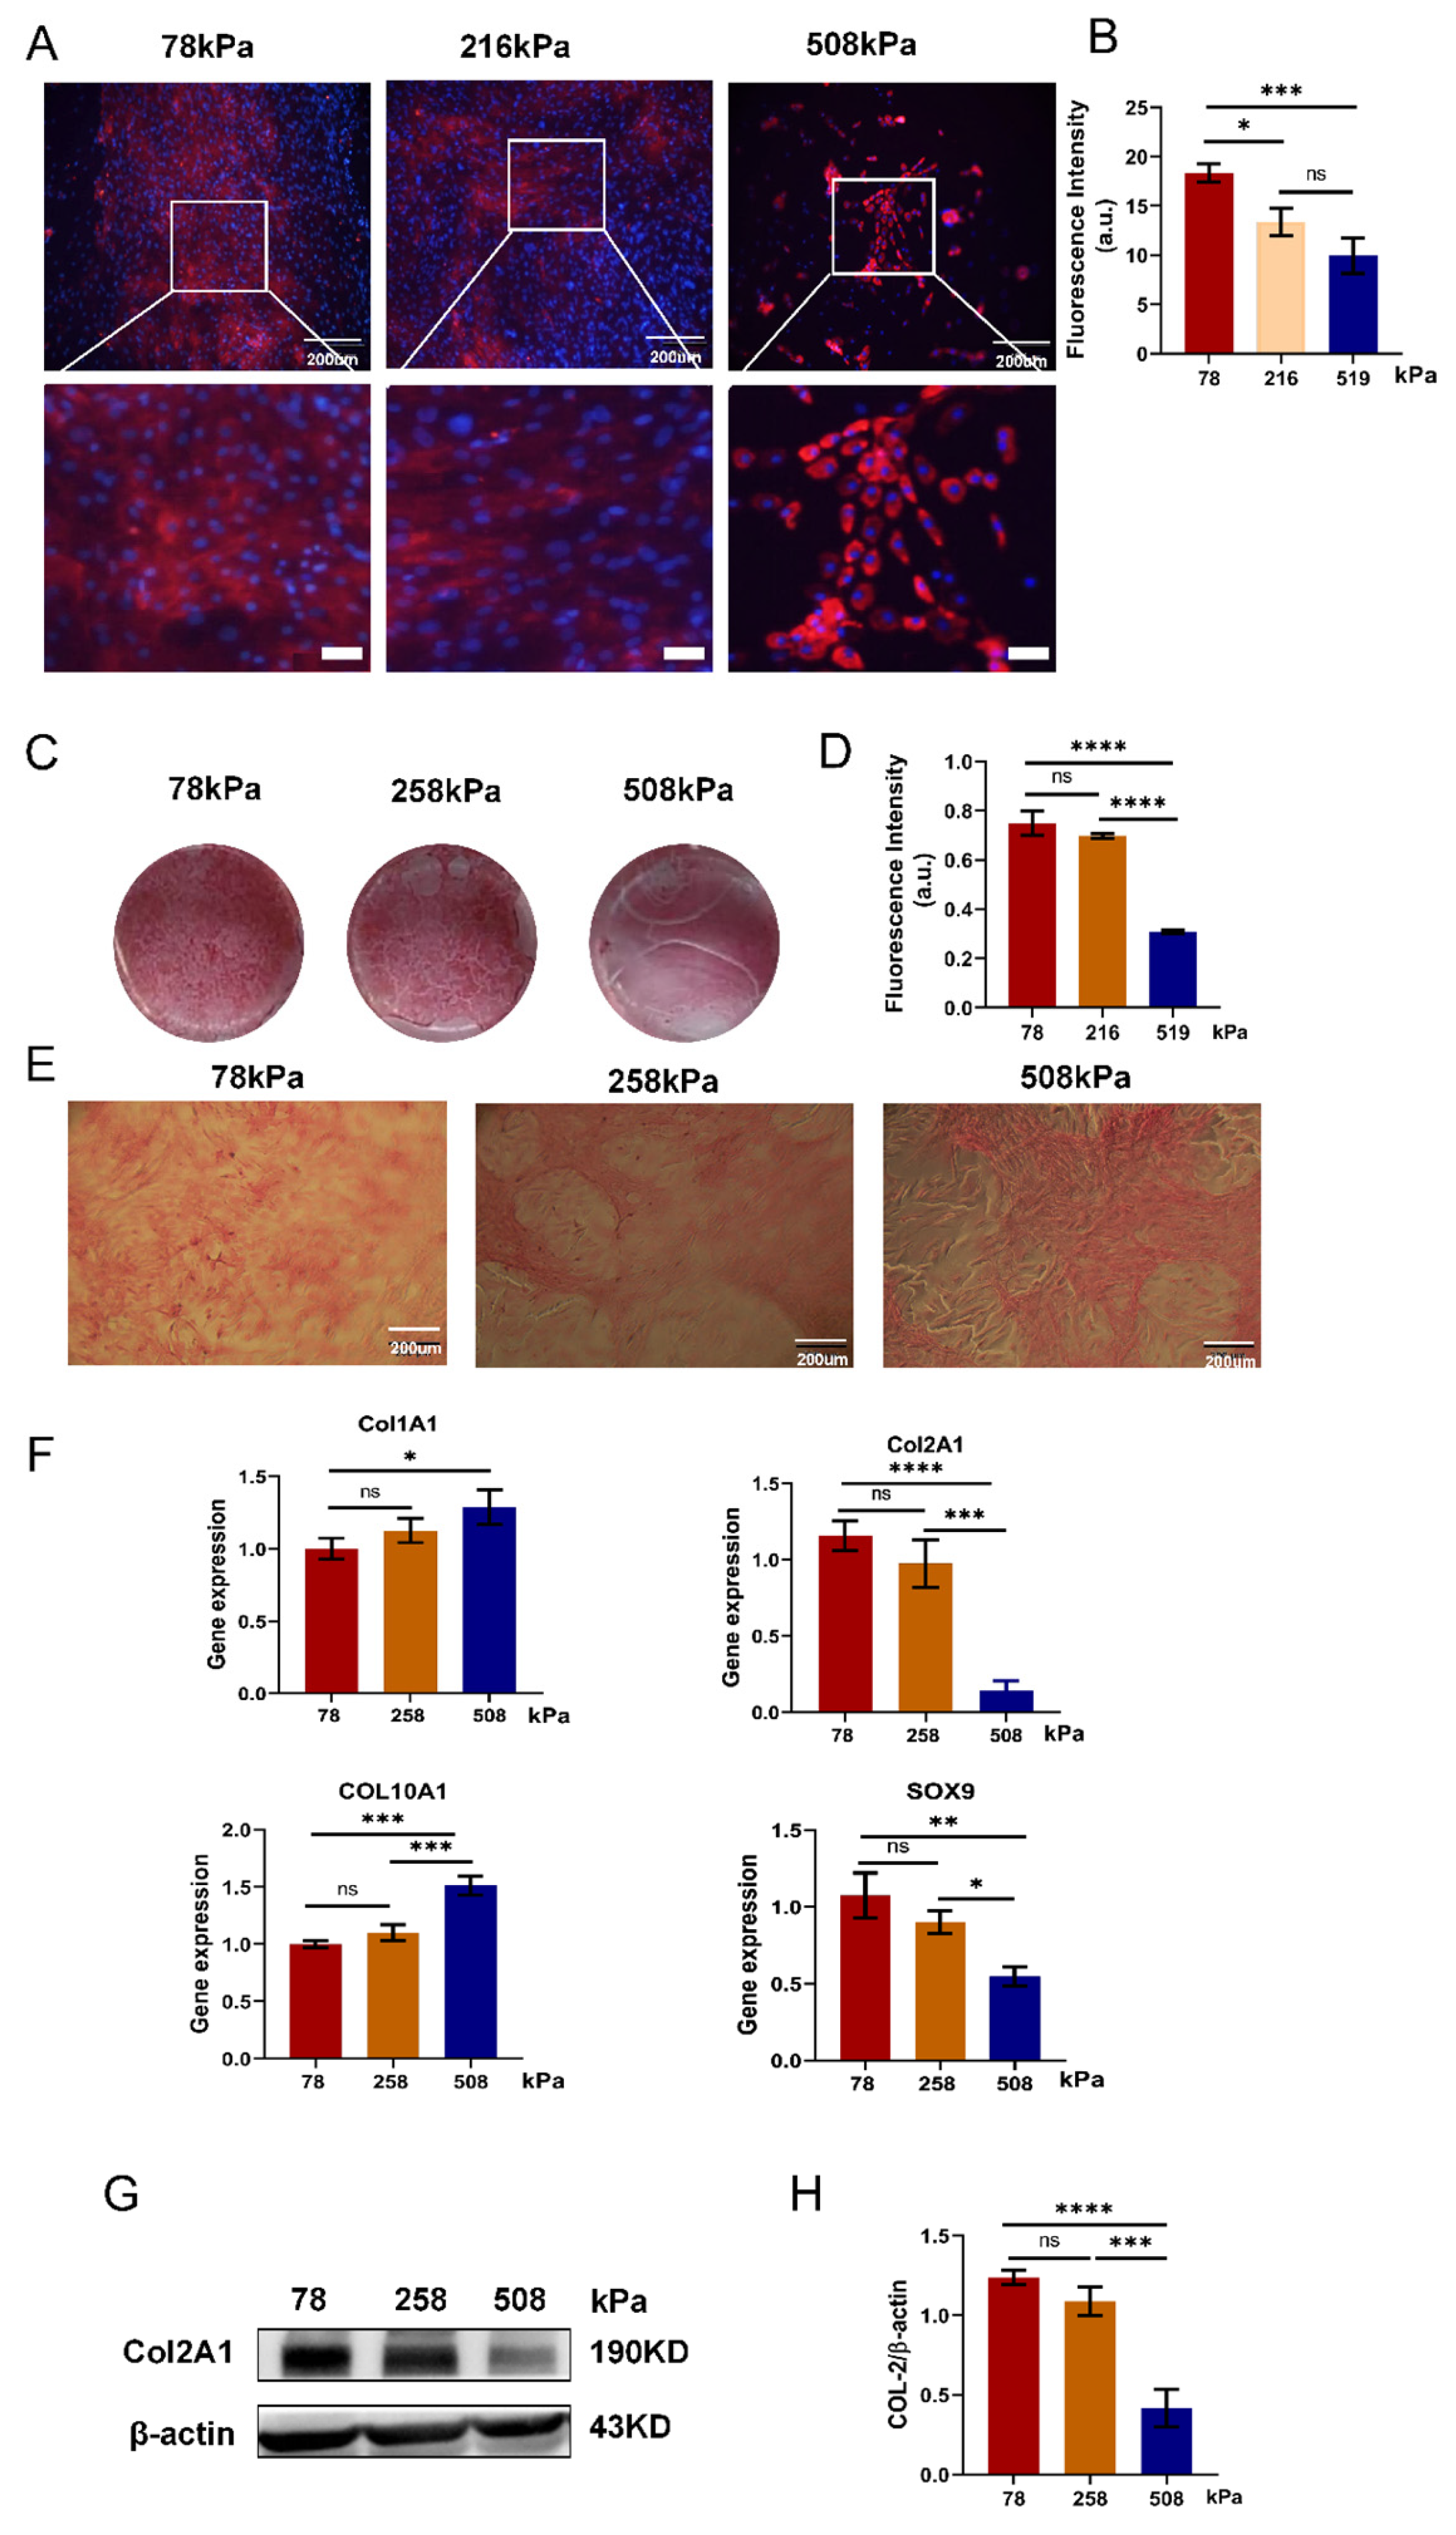
Figure 8.
Matrix stiffness regulates chondrocyte fate via integrin–YAP and Smad signaling pathways. Schematic representation of the molecular mechanisms by which a stiff extracellular matrix (ECM) promotes chondrocyte hypertrophy. Under stiff matrix conditions, integrin signaling activates focal adhesion kinase (FAK), paxillin, and vinculin, enhancing YAP nuclear translocation by reducing its phosphorylation. Nuclear YAP cooperates with Smad1/5/8 to induce RUNX2 expression, thereby promoting hypertrophic markers such as COL1A1, COL10A1, and MMP13. In contrast, on soft matrices, YAP remains phosphorylated and cytoplasmic, allowing Smad2/3 and SOX9 to drive COL2A1 expression, maintaining a normal chondrocyte phenotype. This figure highlights the stiffness-dependent switch between chondrogenic maintenance and hypertrophic differentiation.
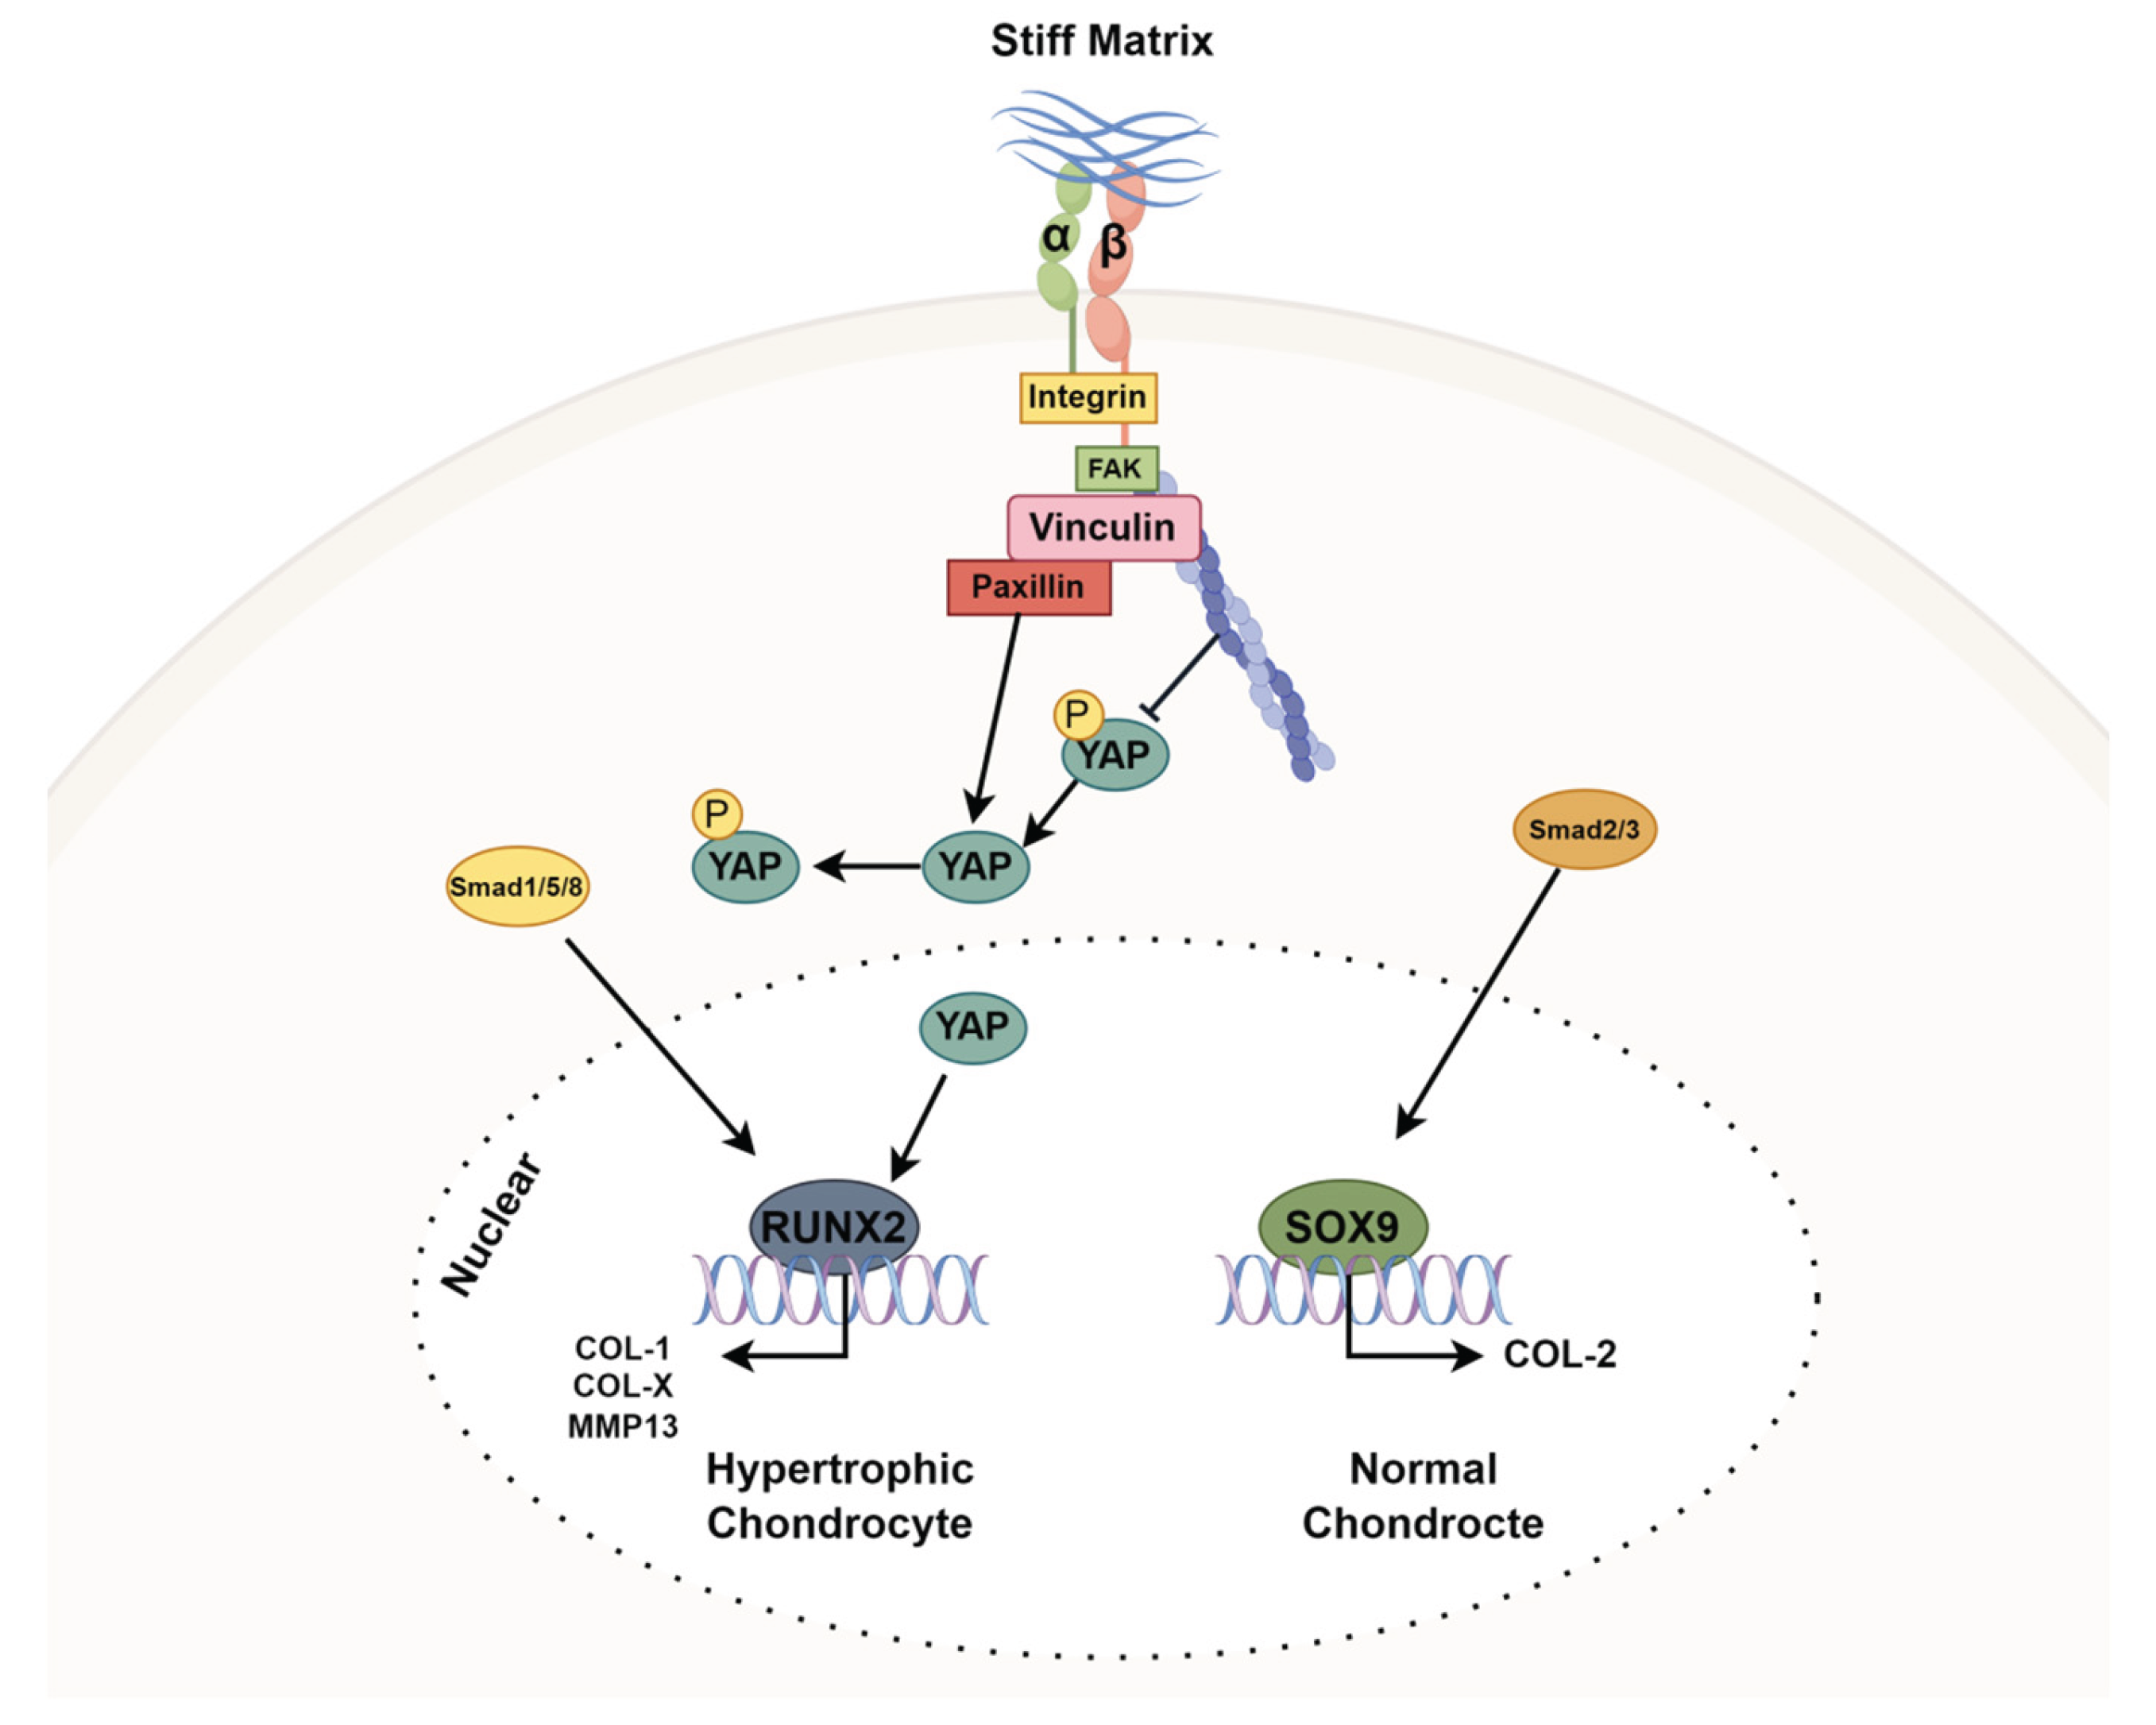

Table 2.
RT-PCR Primers.
| Target | Forward Primer (3 ′ –5 ′ ) | Reverse Primer (5 ′ –3 ′ ) |
| COL-1 | CGTGACCAAAAACCAAAAGT | GGGGTGGAGAAAGGAACAGA |
| COL-2 | GAGTGGAAGAGCGGAGACTACTG | CTCCATGTTGCAGAAGACTTTCA |
| COL-X | GATCATGGAGCTCACGGAAAA | CCGTTCGATTCCGCATTG |
| SOX9 | CTGAAGGGCTACGACTGCAC | TACTGGTCTCCCAGCTTCCT |
| GAPDH | TGAACGGGAAGCTCACTGG | TCCACCACCCTGTTCCGTA |
Disclaimer/Publisher’s Note: The statements, opinions and data contained in all publications are solely those of the individual author(s) and contributor(s) and not of MDPI and/or the editor(s). MDPI and/or the editor(s) disclaim responsibility for any injury to people or property resulting from any ideas, methods, instructions or products referred to in the content. |
© 2025 by the authors. Licensee MDPI, Basel, Switzerland. This article is an open access article distributed under the terms and conditions of the Creative Commons Attribution (CC BY) license (http://creativecommons.org/licenses/by/4.0/).
Copyright: This open access article is published under a Creative Commons CC BY 4.0 license, which permit the free download, distribution, and reuse, provided that the author and preprint are cited in any reuse.


