
Submitted:
13 June 2025
Posted:
13 June 2025
You are already at the latest version
Abstract
We have analysed the parametric changes of the first coordination shell (FCS) of a vitreous metallic Pd42.5Cu30Ni7.5P20 alloy aiming to confirm the identification of glass transition temperature (Tg) via processing of XRD patterns utilising radial and pair distribution functions (RDF and PDF) and their evolution with temperature. The Wendt-Abraham empirical criterion of glass transition and its modifications are being confirmed in line with previous works which utilised the kink of the temperature dependences of minima and maxima of both PDF and maxima of structure factor S(q). We have, however, identified massive fluctuations near Tg of the derivatives of minima and maxima of PDF and maxima of S(q) which adds value to understanding the glass transition in the system as a true second order-like phase transformation in the non-equilibrium system of atoms.
Keywords:
metallic glasses
; glass transition
; fluctuations
; second order phase transition
1. Introduction
Glass transition is a generic phenomenon characteristic for amorphous materials ranging from pure elements and oxides to complex polymeric and biological molecules which exhibit solid-like behaviour below the glass transition temperature (Tg i.e. in the vitreous state, and liquid-like above it. Most often the Tg is determined using differential scanning calorimetry (DSC) which shows a well seen kink in the temperature dependence of heat flow evolution of system at Tg [1,2] although other techniques to determine it are in use such as similar to DSC, simple (TMA) and differential thermal analysis (DTA [3]) which employs various heating and cooling (thermal) cycles, dynamic mechanical analysis in which mechanical stress is applied to the sample and the resultant strain is measured (DMA, [4]), specific heat measurements, thermomechanical analysis, thermal expansion measurement, micro-heat-transfer measurement, isothermal compressibility, heat capacity determination [5]. Structural rearrangements in the non-equilibrium system of species (atoms, molecules) forming a glass are not yet well-understood despite numerous works related to glass forming systems. Wendt and Abraham have first observed that Tg can be detected by analysing the temperature behaviour of maxima and minima of radial and pair (normalized according to the average atomic number density variation with the interatomic distance) distribution functions (RDFs and PDFs, respectively) which result from the processing of X-ray or neutron scattering spectra as well as from computer experiments using molecular dynamics (MD) simulation [6,7]. They have proposed an empirical criterion for finding the Tg from the ratio RWA=PDFmin/PDFmax=0.14 [8]. We have shown that the experimentally found criterion RWA=0.14 is explained in terms of percolation in the system of broken bonds in amorphous materials termed configurons [9]. Indeed, it is known that the rigidity threshold of an elastic percolating network is identical to the percolation threshold [10] therefore we can find the critical temperature Tg when the solid-like behaviour changes to a liquid-like assigning it to the temperature when the percolation via broken bonds occurs [11]. The fraction of broken bonds (configurons) φ(T) as a growing function of temperature equals therefore the temperature of glass transition in amorphous materials is indeed in line with Wend-Abraham empirical rule given by equation . For metallic systems , which is equal to universal Scher–Zallen critical density in the 3-D space θc=0.15±0.01 [12,13]. The presence of kinks at glass transition was later confirmed by directly analysing the temperature dependences of structural factors S(q), where q is the scattering vector [14].
The presence of kinks at Tg in the temperature dependences of radial and pair distribution functions (RDF and PDF), and the structure factor (S(q)) means that their first derivatives have a jump which may be useful to easier detect the glass transition. Moreover, the second derivatives of both RDF, PDF and S(q) shall have a diverging character at Tg which could facilitate identification. We aim to analyse these features which although being present in the temperature behaviours of RDF, PDF and S(q) were found not amenable for practical usage due to the character of glass transition which being a second order phase transformation is accompanied by large and increasing amplitude fluctuations near Tg.
2. Theoretical Considerations
The pair distribution function being also denoted as g(r) gives the probability of finding a particle at the distance R from another i.e. is the probability of finding two particles i and j at particular separation r=|ri-rj| in the system while the structure factor S(q) found from measurements in scattering experiments is essentially the Fourier transform of the PDF (also sometimes denoted as g(r)) being related to each other via:
where ρ0 is the average density, and q is the scattering vector. PDF and S(q) provide structural and thermodynamic information about the system [9,14-16]. For simple substances PDF has a peak at a mean inter-particle distance and with the increase distance r it converges oscillating to unit g(r →∞) = 1 (Figure 1).
Typical investigations analyse the behaviour of the first sharp diffraction peak (FSDP) of the structure factor S(q) [14,15] which reveal features in the reciprocal space whilst the most prominent and intuitively straightforward features in the real space are provided by peaks of RDF and PDF [8,9,14,15,17-19]. As Figure 1 demonstrates, from experiments, it is known that on increase of temperature the first sharp diffraction peak of amorphous materials decreases it amplitude with temperature while the first sharp diffraction minimum (FSDM) of PDF is [9,17-19]:
- increasing its amplitude, and
- shifting its position to larger values reflecting (i) formation of configurons (broken chemical bonds) and (ii) enlarging the size of first coordination shell (FCS), i.e. by this characterising thermal expansion of materials on the increase of temperature.
The position of FSDM is giving the radius of FCS which increases with the increase of temperature following the thermal expansion of materials.
The experiment is explicitly showing that the maximal amplitude of structure factor S(q1), where q1 is the position in scattering vector where the maximum occurs, changes on temperature exhibiting a kink as follows:
The coefficient of proportionality (s) for liquids (melts) is larger compared to solids (glasses) sl > sg. Due to this from (2) we see that the temperature derivative of the structure factor exhibits a stepwise change at Tg:
The second derivative of the structure factor thus has a singularity at the glass transition
Because steps and deltas can be readily detected from available data it would be useful to attempt to use (2) and (3) in detecting the glass transition.
The experiment also explicitly shows that the FSDM of PDF follows the same character of temperature dependence near the glass transition exhibiting at Tg a kink:
The coefficient fl > fg. From (5) we see that the temperature differential of the pair distribution function exhibits a stepwise change at Tg:
The second derivative of the minimum of the FSDM thus also has a singularity at the glass transition:
Utilisation of (4) and (7) along with the Wendt-Abraham empirical criterion would be hence a powerful tool in detecting the glass transition in amorphous materials. Based on these ideas we attempted to process data on vitrifying the metallic alloy Pd-Cu-Ni-P for which data are available for confident analysis.
3. Experimental
The glass formation process of the Pd42.5Cu30Ni7.5P20 alloy was studied in-situ in the previous works [20,21]. In the present work these data were processed using equations (3) and (4) and (6) and (7) aiming to check whether the temperature derivative obeys the expected dependences following these equations. We accounted that although following the laws of second-order phase transformations the glass transition has a dual nature and is kinetically controlled due to relaxation phenomena which occur in parallel to structural rearrangements [22,23].
4. Results
Figure 2 shows: (a) the temperature dependence of the RDFs minima of the Pd42.5Cu30Ni7.5P20 alloy confirming via kinks observed that the vitrification occurs at Tg ~ 300 oC via minima of RDFs and (b) Wendt-Abraham criterion which used the PDF’s minima to maxima ratios.
It is worth comparing data obtained with earlier works by Mattern et al [14] who analysed the temperature dependences of structure factor S(q1) which followed dependences (3) and (4). Figure 3 shows the temperature dependence of structure factor of the Pd42.5Cu30Ni7.5P20 alloy confirming its behaviour in line with previous findings [14].
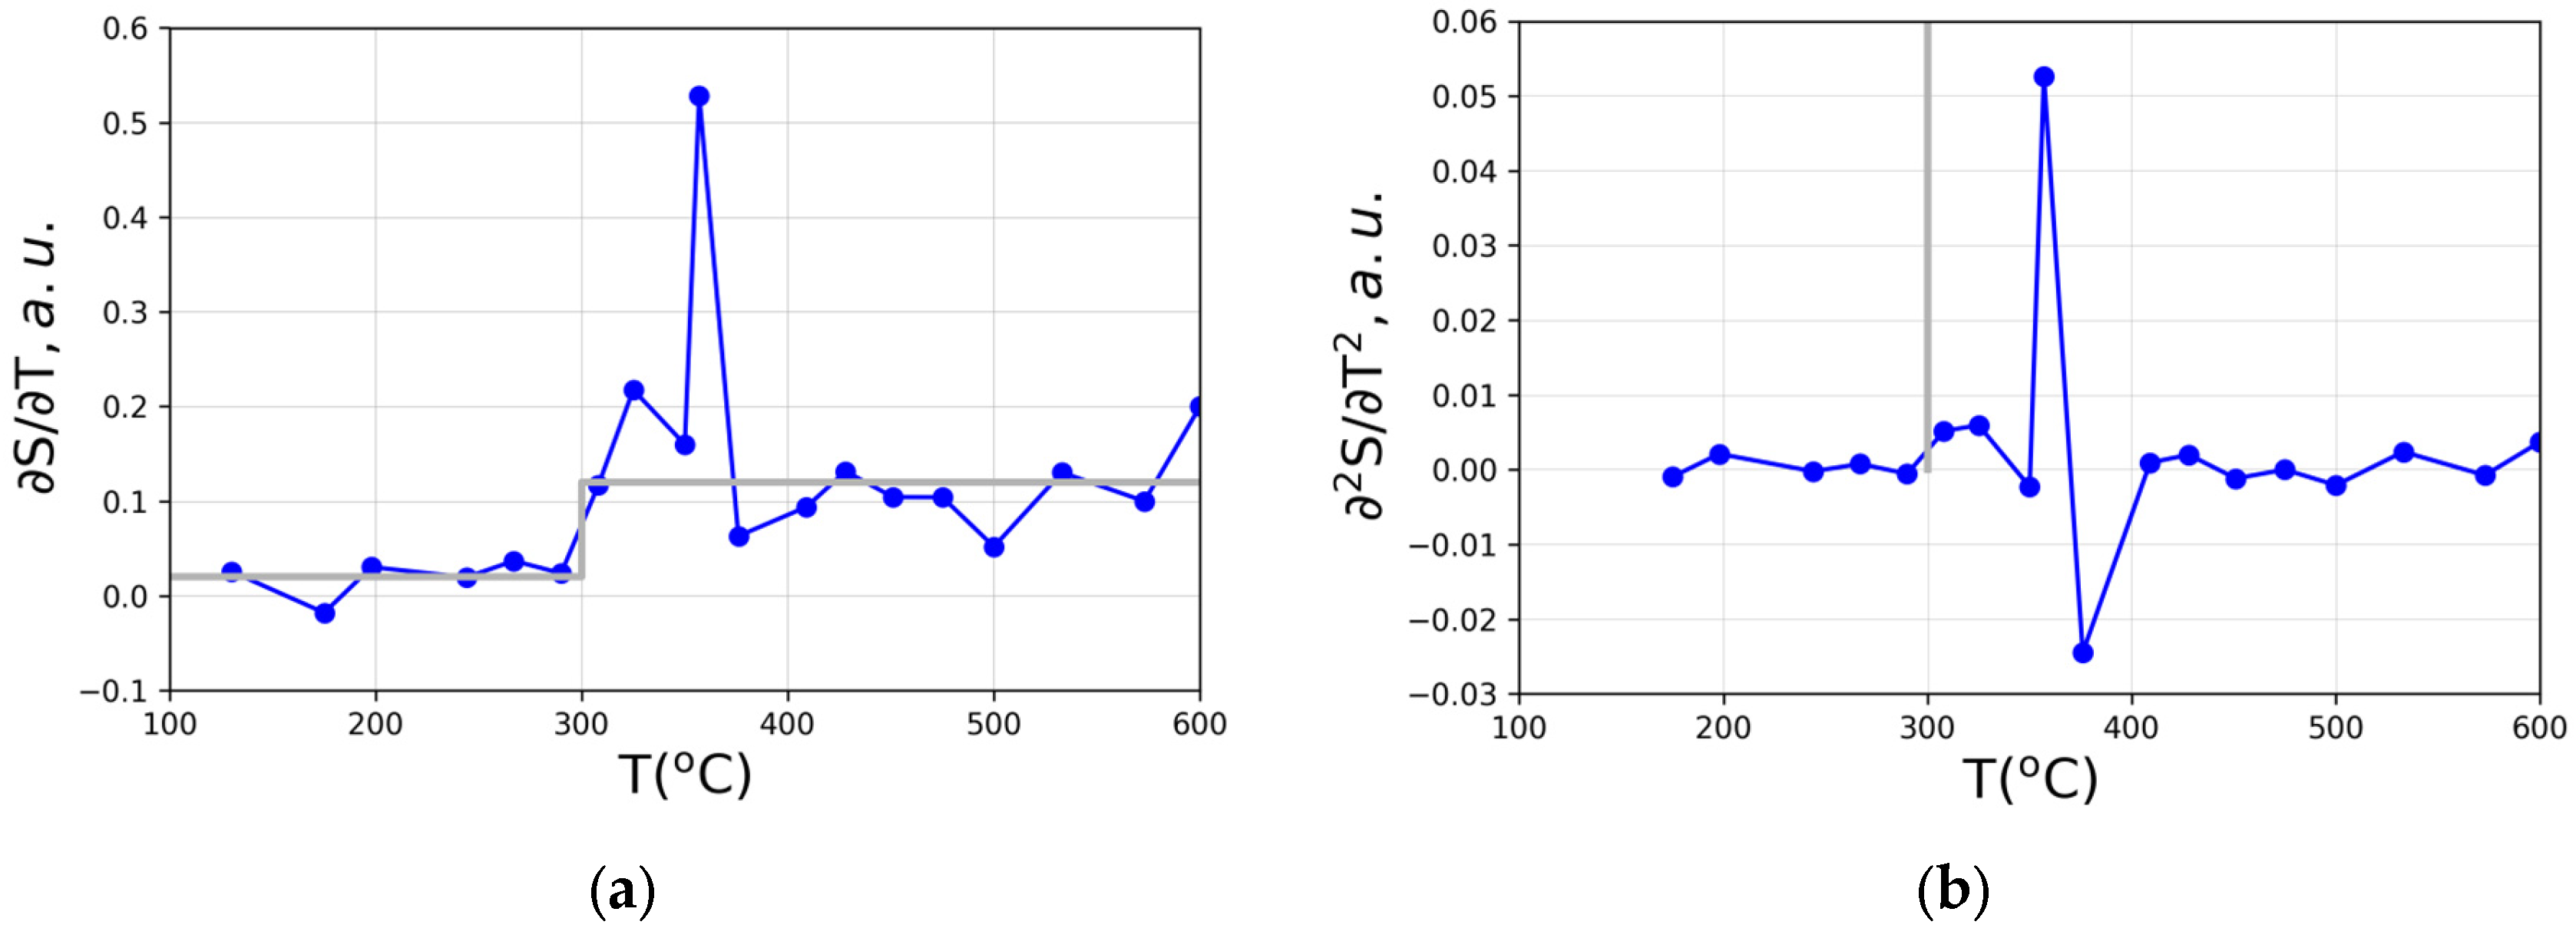
Figure 4 shows the temperature dependences of first and second derivatives of maximal value of the structure factor S(q1) in our case processing data from [20,21].
Similarly, to the above, strongly fluctuating data were obtained for ∂PDF/∂T and ∂2PDF/∂T2 which is expectedly appropriate as the PDF and S(q) are interrelated via equation (1).
5. Discussion
The results obtained conform to previous data on Wendt-Abraham empirical criterion of vitrification of melts while cooled fast enough [8] and its modification for the first minimum of PDF i.e. FSDM’s [9] which through this provide proofs of configuron formation and expansion of FCS, e.g. see Table 1 of [18]. The glass transition temperature found agrees with data previously known – see e.g., Figure 2 for S(q1) of reference [14]. However, the attempts to use the stepwise character of ∂S/∂T and the diverging character of ∂2S/∂T2 clearly failed. The reason behind is in the character of glass transition and massive fluctuations of both ∂S/∂T and ∂2S/∂T2 instead of the idealised dependences via equations (3,4) – (6,7) also shown in Figure 3 by grey colour lines.
The glass transition expresses itself at the calorimetric glass transition temperature [1,24-26] as a second order phase transformation with all its attributes following the Ehrenfest classification of phase transformations [27-29]. Namely – it is a continuous transformation with continuous thermodynamic functions such as Gibbs free energy G(T,P), entropy S(T,P), volume V(T,P) and discontinuities in response functions (susceptibilities) such as heat capacity, compressibility, thermal expansion coefficient – all these are always seen at glass transition [1,24-26,30]. Due to this the International Union of Pure and Applied Chemistry (IUPAC) is defining the glass transition as a second-order transition in which a supercooled melt yields, on cooling, a glassy structure so that below the glass-transition temperature the physical properties vary in a manner similar to those of the crystalline phase [31].
Theoretical analysis of phase transitions is well known, e.g., in the first order phase transitions such as crystallisation the correlation length (e.g. the size of the new phase) remains finite while for continuous phase transitions the correlation length diverges when approaching the phase transition. The configuron percolation theory (CPT) of glass transition [11,17,32] gives for the correlation length a diverging dependence at temperatures approaching Tg:
where ξ0 has the order of interatomic distance and the critical exponent ν in the three-dimensional space is ν = 0.88. ξ(T) diverges at Tg in contrast to the structural coherence length that characterizes the exponential decay of atomic pair-distribution function oscillations beyond the first peak which increases with decreasing temperature and freezes at the glass transition [33]. The amorphous material near the glass transition is dynamically inhomogeneous on length scales smaller than ξ(T) while at temperatures far from the Tg, the correlation length becomes small, and the amorphous material is homogeneous. Fluctuations in the system of disordered species (atoms or molecules) become correlated over all distances and that forces the whole system to be in a unique phase which is critical at phase transition [28,29,34,35].
The phenomenon of increasing fluctuations in the vicinity of a phase transition is best demonstrated with the critical opalescence phenomena and is already known to be present for glass transition [36,37]. Therefore, the massive fluctuations in approaching the glass transition temperature evidently seen in Figure 4 should not be surprising while interpreting the glass transition as a true second order phase transformation although it occurs in a non-equilibrium system of atoms and molecules constituting the amorphous material. It is nowadays recognised that in addition to equilibrium phase transitions [28,37] non-equilibrium phase transitions are rather common across a wide range of scientific disciplines [38-41] manifesting in a rich variety of both static and dynamic patterns including ergodicity breaking, the Mpemba [42-45], Bokov [36] and Kovacs effects [46,47], and asymmetry of heating-cooling [48,49]. It is worth noting that classification of glass transition as a second-order transition in Ehrenfest terms remains debated within the scientific community. Most physicists and materials scientists agree that it does not meet the criteria for a second-order equilibrium transition, mainly due to its non-equilibrium nature and time dependence. In this respect the extension of analysis of glass transition to that belonging to phase transformations in non-equilibrium systems is assisting in unveiling its nature and dual, both kinetic and thermodynamic character [22,32].
Thus, the fluctuations (inherent noises) encountered on analysing the glass transition in the Pd-Cu-Ni-P alloy are well expected within the theory of second order (or second order like) phase transformations and once observed can be considered as an additional argument in favour of the effects associated with a true phase transformation. The proposed delta-like or step wise behaviour in structural derivatives (6) – (7) cannot be revealed from experiment namely due the intrinsic noises-fluctuations which always associate second order transitions.
While the glass transition is traditionally viewed as a kinetic freezing process, strong evidence from modern studies supports its interpretation as a true phase transition [30,50] or a topological phase transition [51]. Unveiling the structural mechanisms behind glass transition enables then practical utilisation in various application [52-55]. The Wendt-Abraham empirical criterion [8] and its analogues [9,56] enable the identification of the glass transition temperature Tg. However, why is the glass transition interval quite wide? We know that glass is not uniform, it has densely packed and loosely packed regions [57]. It can be assumed that the glass transition of these regions occurs at slightly different temperatures, which gives the glass transition interval. Moreover, two relaxation processes competing with each other related to the different diffusion coefficients of the alloying elements were observed [58].
6. Conclusions
The Wendt-Abraham empirical law of glass transition is confirmed valid for the Pd-Cu-Ni-P metallic glass-forming alloy which conforms previous works. Attempts to process derivatives of pair distribution function and structure factor failed because of massive fluctuations on approaching the glass transition which confirms the concept of glass transition as a second order-like phase transformation in the non-equilibrium system of atoms following the Ehrenfest classification scheme.
Author Contributions
Conceptualization, M.I.O. and D.V.L-L; methodology, MI..O.; software, A.K.A.L.; validation, D.V.L-L., A.K.A.L.; writing—original draft preparation, M.I.O., D.V.L-L,., A.K.A. L,; writing—review and editing, M.I.O., D.V.L-L,., A.K.A. L,; funding acquisition, A.K.A.L. All authors have read and agreed to the published version of the manuscript.
Funding
This study was partly supported by JSPS KAKENHI under Grant No. 24K01284.
Data Availability Statement
The dataset used for calculations were obtained from other publications, all of which are cited appropriately in the text.
Conflicts of Interest
The authors declare no conflicts of interest.
Abbreviations
The following abbreviations are used in this manuscript:
| CPT | Configuron percolation theory |
| FCS | First coordination shell |
| FSDM | First sharp diffraction minimum |
References
- Zheng, Q.; Zhang, Y.; Montazerian, M.; Gulbiten, O.; Mauro, J.C.; Zanotto, E.D.; Yue, Y. Understanding Glass through Differential Scanning Calorimetry. Chem. Rev. 2019, 119, 7848–7939. [CrossRef]
- ASTM E1356-08 (2014). Standard Test Method for Assignment of the Glass Transition Temperatures by Differential Scanning Calorimetry. https://www.astm.org/e1356-08r14.html.
- ASTM E794-06(2018) Standard Test Method for Melting And Crystallization Temperatures By Thermal Analysis. https://www.astm.org/e0794-06r18.html.
- ASTM E1640-13. Standard Test Method for Assignment of the Glass Transition Temperature By Dynamic Mechanical Analysis.
- Glass Transition Temperature. Omnexus. https://omnexus.specialchem.com/.
- Louzguine-Luzgin, D.; Belosludov, R.; Ojovan, M. Room-temperature pressure-induced phase separation in glassy alloys. Mater. Today Commun. 2024, 40. [CrossRef]
- Louzguine-Luzgin, D.V. Crystallization of Metallic Glasses and Supercooled Liquids. Materials 2024, 17, 3573. [CrossRef]
- Wendt, H.R.; Abraham, F.F. Empirical Criterion for the Glass Transition Region Based on Monte Carlo Simulations. Phys. Rev. Lett. 1978, 41, 1244–1246. [CrossRef]
- Ojovan, M.I.; Louzguine-Luzgin, D.V. Revealing Structural Changes at Glass Transition via Radial Distribution Functions. J. Phys. Chem. B 2020, 124, 3186–3194. [CrossRef]
- Kantor, Y.; Webman, I. Elastic Properties of Random Percolating Systems. Phys. Rev. Lett. 1984, 52, 1891–1894. [CrossRef]
- Ojovan, M.I. Glass formation in amorphous SiO2 as a percolation phase transition in a system of network defects. JETP Lett. 2004, 79, 632–634. [CrossRef]
- Scher, H.; Zallen, R. Critical Density in Percolation Processes. J. Chem. Phys. 1970, 53, 3759–3761. [CrossRef]
- Isichenko, M.B. Percolation, statistical topography, and transport in random media. Rev. Mod. Phys. 1992, 64, 961–1043. [CrossRef]
- Mattern, N.; Hermann, H.; Roth, S.; Sakowski, J.; Macht, M.-P.; Jovari, P.; Jiang, J. Structural behavior of Pd40Cu30Ni10P20 bulk metallic glass below and above the glass transition. Appl. Phys. Lett. 2003, 82, 2589–2591. [CrossRef]
- Hansen, J.-P.; McDonald, I.R. Theory of simple liquids (Third Edition), Academic Press, 2006, pp.78-108. [CrossRef]
- T. Kitamura. Liquid glass transition. a unified theory from the two band model. Elsevier, Amsterdam (2013). [CrossRef]
- Ojovan, M.I. The Modified Random Network (MRN) Model within the Configuron Percolation Theory (CPT) of Glass Transition. Ceramics 2021, 4, 121–134. [CrossRef]
- Ojovan, M.I.; Tournier, R.F. On Structural Rearrangements Near the Glass Transition Temperature in Amorphous Silica. Materials 2021, 14, 5235. [CrossRef]
- Ojovan, M.I.; Louzguine-Luzgin, D.V. On Structural Rearrangements during the Vitrification of Molten Copper. Materials 2022, 15, 1313. [CrossRef]
- K. Georgarakis, D. V. Louzguine-Luzgin, J. Antonowicz, G. Vaughan, A. R. Yavari, T. Egami and A. Inoue, Variations in atomic structural features of a supercooled Pd–Ni–Cu–P glass forming liquid during in situ vitrification, Acta Materialia, 59, 708–716 (2011).
- Louzguine-Luzgin, D.V.; Belosludov, R.; Yavari, A.R.; Georgarakis, K.; Vaughan, G.; Kawazoe, Y.; Egami, T.; Inoue, A. Structural basis for supercooled liquid fragility established by synchrotron-radiation method and computer simulation. J. Appl. Phys. 2011, 110, 043519. [CrossRef]
- Sanditov, D.S.; I Ojovan, M. Relaxation aspects of the liquid–glass transition. Physics-Uspekhi 2019, 62, 111–130. [CrossRef]
- Gallino, I. Busch, R. Thermodynamic and kinetic aspects of the glass transition. in: physical metallurgy of bulk metallic glass-forming liquids. Springer Series in Materials Science, vol 341. Springer, (2024).
- Yue, Y.-Z. Characteristic temperatures of enthalpy relaxation in glass. J. Non-Crystalline Solids 2008, 354, 1112–1118. [CrossRef]
- A.K. Varshneya, Fundamentals of inorganic glasses. Sheffield: Society of Glass Technology, 2006 (2006).
- J. Zarzycki, Glasses and the vitreous state. Cambridge: Cambridge University Press. (1982).
- P. Ehrenfest, Phasenumwandlungen im ueblichen und erweiterten Sinn, classifiziert nach den entsprechenden Singularitaeten des thermodynamischen Potentiales. Bd. 36. Proc. Royal Acad. Amsterdam, 153–157 S (1933).
- L.D. Landau, E.M. Lifshitz, Course of Theoretical Physics Volume 5: Statistical Physics Part 1 (Elsevier, Amsterdam, 2012).
- Stanley, H.E.; Wong, V.K. Introduction to Phase Transitions and Critical Phenomena. Am. J. Phys. 1972, 40, 927–928. [CrossRef]
- Albert, S.; Bauer, T.; Michl, M.; Biroli, G.; Bouchaud, J.-P.; Loidl, A.; Lunkenheimer, P.; Tourbot, R.; Wiertel-Gasquet, C.; Ladieu, F. Fifth-order susceptibility unveils growth of thermodynamic amorphous order in glass-formers. Science 2016, 352, 1308–1311. [CrossRef]
- IUPAC. Compendium of chemical terminology; Royal Society of Chemistry: Cambridge. U.K., 1997; Vol. 66, p 583.
- M. Ojovan. Glass formation., Chapter 3.1 in P. Richet, R. Conradt, A. Takada, J. Dyon. Encyclopedia of Glass Science, Technology, History, and Culture. Wiley, Hoboken, NJ,. 1568 , 249-259 (2021).
- Egami, T.; Ryu, C.W. Origin of medium-range atomic correlation in simple liquids: Density wave theory. AIP Adv. 2023, 13. [CrossRef]
- Z. Patas̆inskij, V. L. Pokrovskiĭ, Fluctuation Theory of Phase Transitions. Pergamon Press, Oxford, 1979, 321 pages. Patashinsky, A.Z; Pokrovsky, V.L. (1982) Fluctuation theory of phase transition. “Nauka”., Moscow, 382 p. (in Russian).
- C.L. Kuhner. Phase transitions and critical phenomena. statistical physics seminar SS2023. Seminar talk summary for the seminar of statistical physics held by Prof. Wolschin. Department of Physics, Heidelberg University, Germany, 25, (2023).
- Bokov, N. Non-equilibrium fluctuations as a plausible reason of the light scattered intensity peak in the glass transition region. J. Non-Crystalline Solids 2008, 354, 1119–1122. [CrossRef]
- N. Goldenfeld, Lectures on phase transitions and the renormalization group (CRC Press, Boca Raton, FL, 2018).
- H. Haken, Synergetics: An introduction: nonequilibrium phase transitions and self-organization in physics, Chemistry and Biology (Springer, Berlin, 2004).
- M. Henkel and M. Pleimling, Non-Equilibrium Phase Transitions: Volume 2: Ageing and Dynamical Scaling Far from Equilibrium (Springer Science & Business Media, Dordrecht, 2011).
- Vadakkayil, N.; Esposito, M.; Meibohm, J. Critical fluctuations at a finite-time dynamical phase transition. Phys. Rev. E 2024, 110, 064156. [CrossRef]
- Bray, A.J. Theory of phase-ordering kinetics. Adv. Phys. 2002, 51, 481–587. [CrossRef]
- Lu, Z.; Raz, O. Nonequilibrium thermodynamics of the Markovian Mpemba effect and its inverse. Proc. Natl. Acad. Sci. 2017, 114, 5083–5088. [CrossRef]
- Vadakkayil, N.; Das, S.K. Should a hotter paramagnet transform quicker to a ferromagnet? Monte Carlo simulation results for Ising model. Phys. Chem. Chem. Phys. 2021, 23, 11186–11190. [CrossRef]
- Tournier, R.F.; Ojovan, M.I. Building and Breaking Bonds by Homogenous Nucleation in Glass-Forming Melts Leading to Transitions in Three Liquid States. Materials 2021, 14, 2287. [CrossRef]
- Holtzman, R.; Raz, O. Landau theory for the Mpemba effect through phase transitions. Commun. Phys. 2022, 5, 1–9. [CrossRef]
- Kovacs, A.J.; Aklonis, J.J.; Hutchinson, J.M.; Ramos, A.R. Isobaric volume and enthalpy recovery of glasses. II. A transparent multiparameter theory. J. Polym. Sci. Polym. Phys. Ed. 1979, 17, 1097–1162. [CrossRef]
- Bertin, E.M.; Bouchaud, J.-P.; Drouffe, J.-M.; Godrèche, C. The Kovacs effect in model glasses. J. Phys. A: Math. Gen. 2003, 36, 10701–10719. [CrossRef]
- Meibohm, J.; Forastiere, D.; Adeleke-Larodo, T.; Proesmans, K. Relaxation-speed crossover in anharmonic potentials. Phys. Rev. E 2021, 104, L032105. [CrossRef]
- Ibáñez, M.; Dieball, C.; Lasanta, A.; Godec, A.; Rica, R.A. Heating and cooling are fundamentally asymmetric and evolve along distinct pathways. Nat. Phys. 2024, 20, 135–141. [CrossRef]
- Tanaka, H.; Kawasaki, T.; Shintani, H.; Watanabe, K. Critical-like behaviour of glass-forming liquids. Nat. Mater. 2010, 9, 324–331. [CrossRef]
- M. G. Vasin, Glass transition as a topological phase transition, Phys. Rev. E 106, (2022) 044124.
- Ojovan, M.I. The Flow of Glasses and Glass–Liquid Transition under Electron Irradiation. Int. J. Mol. Sci. 2023, 24, 12120. [CrossRef]
- Rusinowicz, M.; Sao-Joao, S.; Bourguignon, M.; Rosales-Sosa, G.; Kato, Y.; Volpi, F.; Barthel, E.; Kermouche, G. Electric charges as an apparent governing parameter for electron induced stress relaxation in amorphous silica micropillars. Scr. Mater. 2025, 261. [CrossRef]
- Bruns, S.; Kang, S.-G.; Choi, I.-S.; Durst, K. The role of electron-beam irradiation on small-scale deformation: Challenges and benefits in in situ SEM indentation tests. MRS Bull. 2025, 50, 735–748. [CrossRef]
- Ulitin, N.V.; Shadrina, G.R.; Anisimova, V.I.; Rodionov, I.S.; Baldinov, A.A.; Lyulinskaya, Y.L.; Tereshchenko, K.A.; Shiyan, D.A. Interpretation of the Structure–Glass Transition Temperature Relationship for Organic Homopolymers with the Use of Increment, Random Forest, and Density Functional Theory Methods. J. Struct. Chem. 2025, 66, 1095–1109. [CrossRef]
- Stoch, P.; Krakowiak, I. Thermal properties of Sr-containing iron-phosphate glasses experimental and theoretical approach. J. Therm. Anal. Calorim. 2025, 1–13. [CrossRef]
- Qiao, J.; Wang, Q.; Pelletier, J.; Kato, H.; Casalini, R.; Crespo, D.; Pineda, E.; Yao, Y.; Yang, Y. Structural heterogeneities and mechanical behavior of amorphous alloys. Prog. Mater. Sci. 2019, 104, 250–329. [CrossRef]
- Louzguine-Luzgin, D.V.; Seki, I.; Yamamoto, T.; Kawaji, H.; Suryanarayana, C.; Inoue, A. Double-stage glass transition in a metallic glass. Phys. Rev. B 2010, 81, 144202. [CrossRef]
Figure 1.
Pair-distribution function PDF = g(r) of amorphous Ti2Ni (Ti67Ni33) alloy obtained via molecular dynamic (MD) simulation at a cooling rate of ≈1012 K/s (modified after [9]).
Figure 1.
Pair-distribution function PDF = g(r) of amorphous Ti2Ni (Ti67Ni33) alloy obtained via molecular dynamic (MD) simulation at a cooling rate of ≈1012 K/s (modified after [9]).
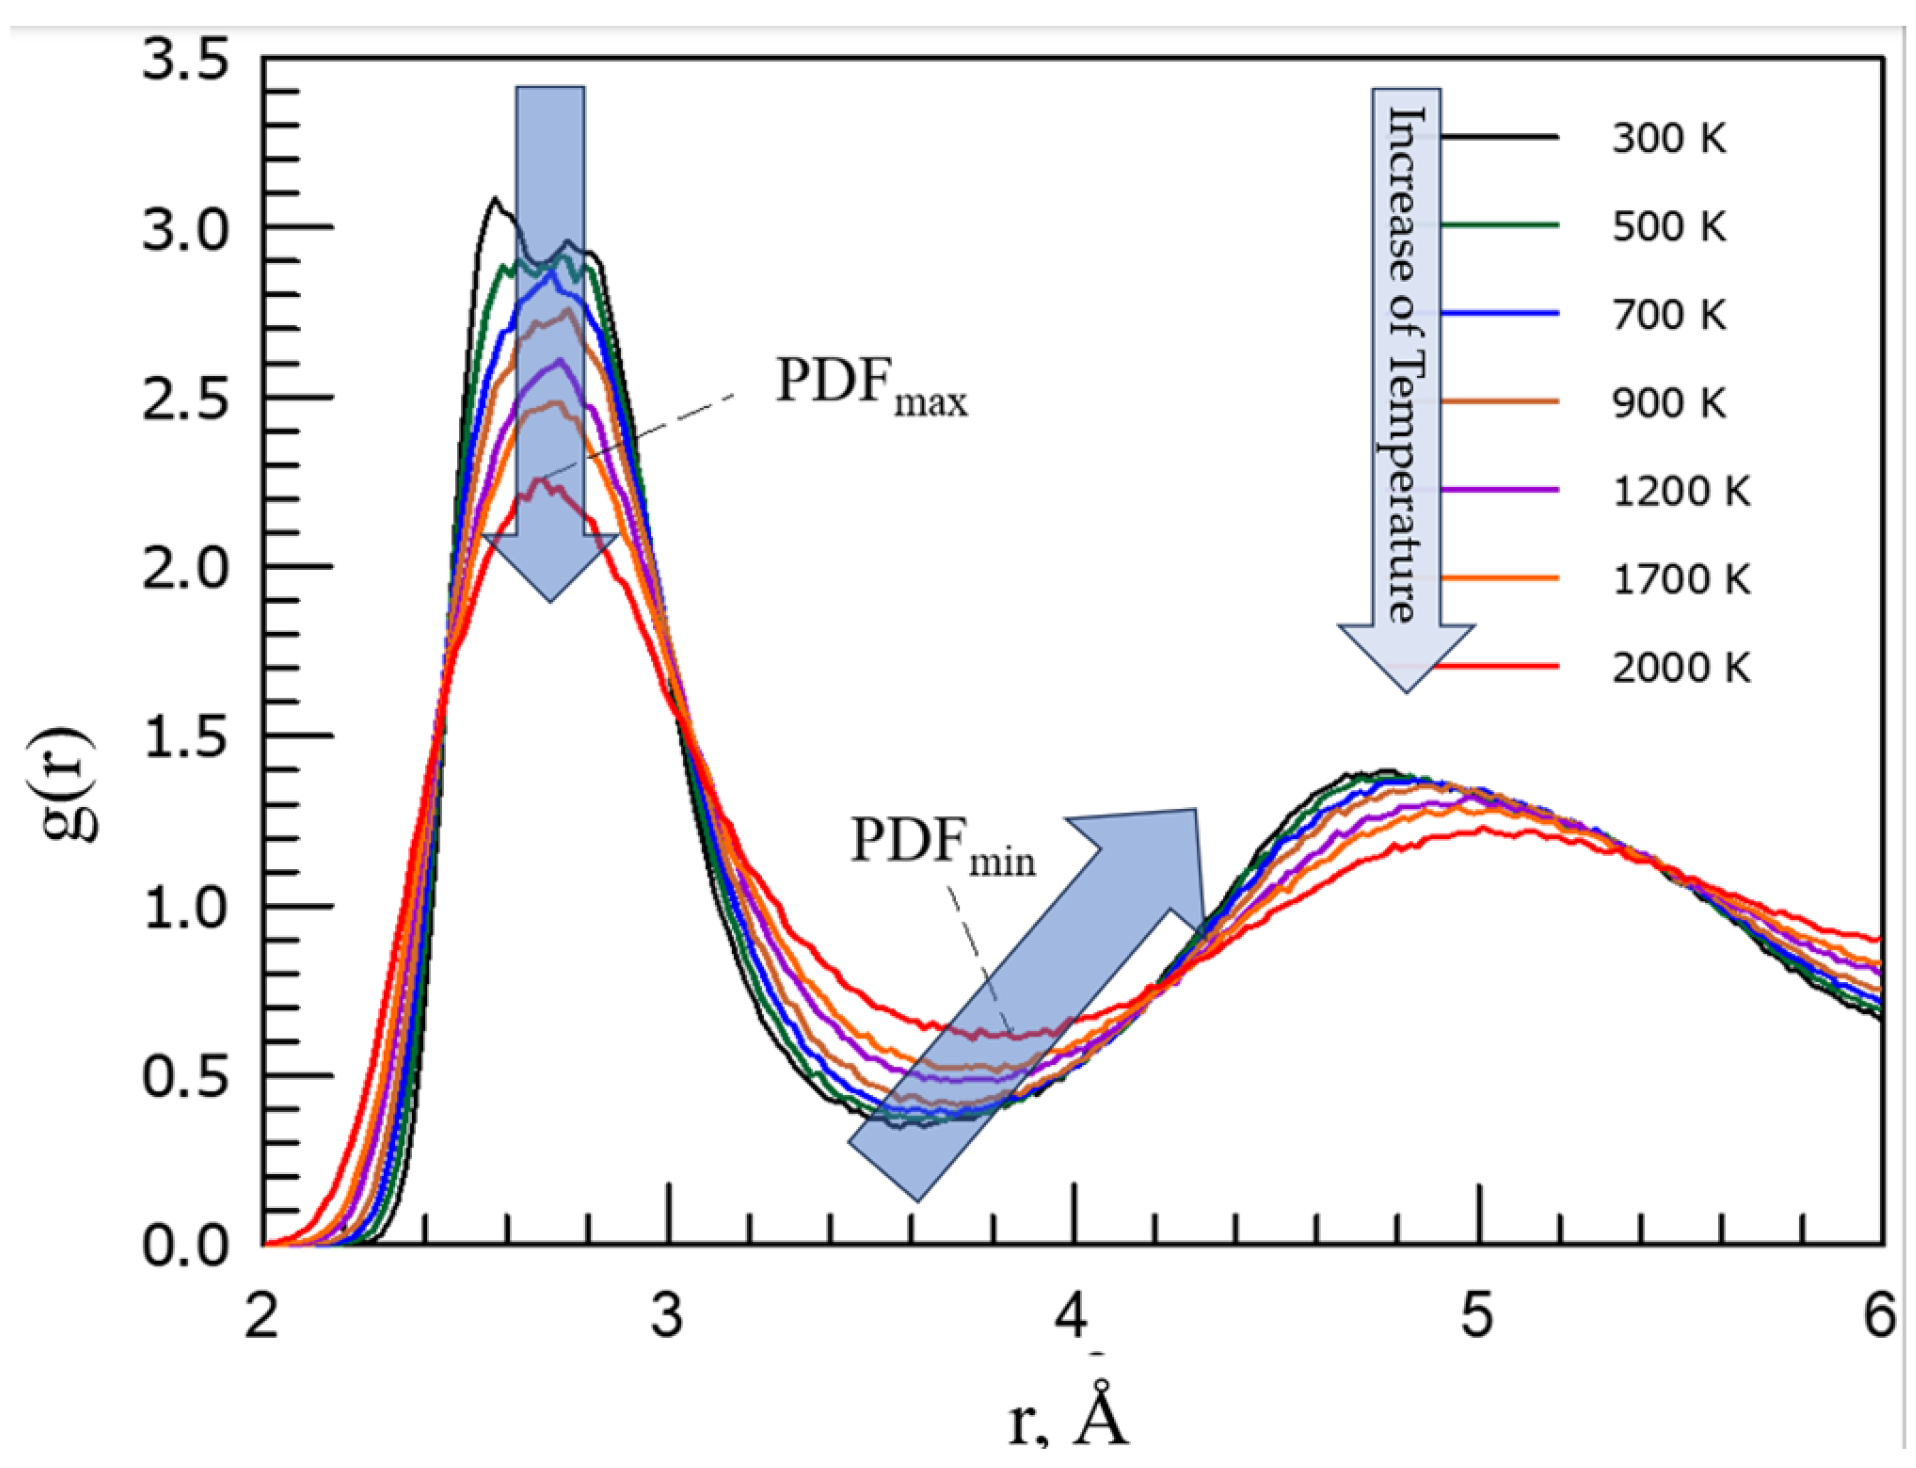
Figure 2.
Variation with temperature of: (a) Minima of RDF’s; (b) Ratios of minima to maxima of PDF following Wendt-Abraham [6]. The glass transition temperature is identified as Tg ≈ 300 oC.
Figure 2.
Variation with temperature of: (a) Minima of RDF’s; (b) Ratios of minima to maxima of PDF following Wendt-Abraham [6]. The glass transition temperature is identified as Tg ≈ 300 oC.
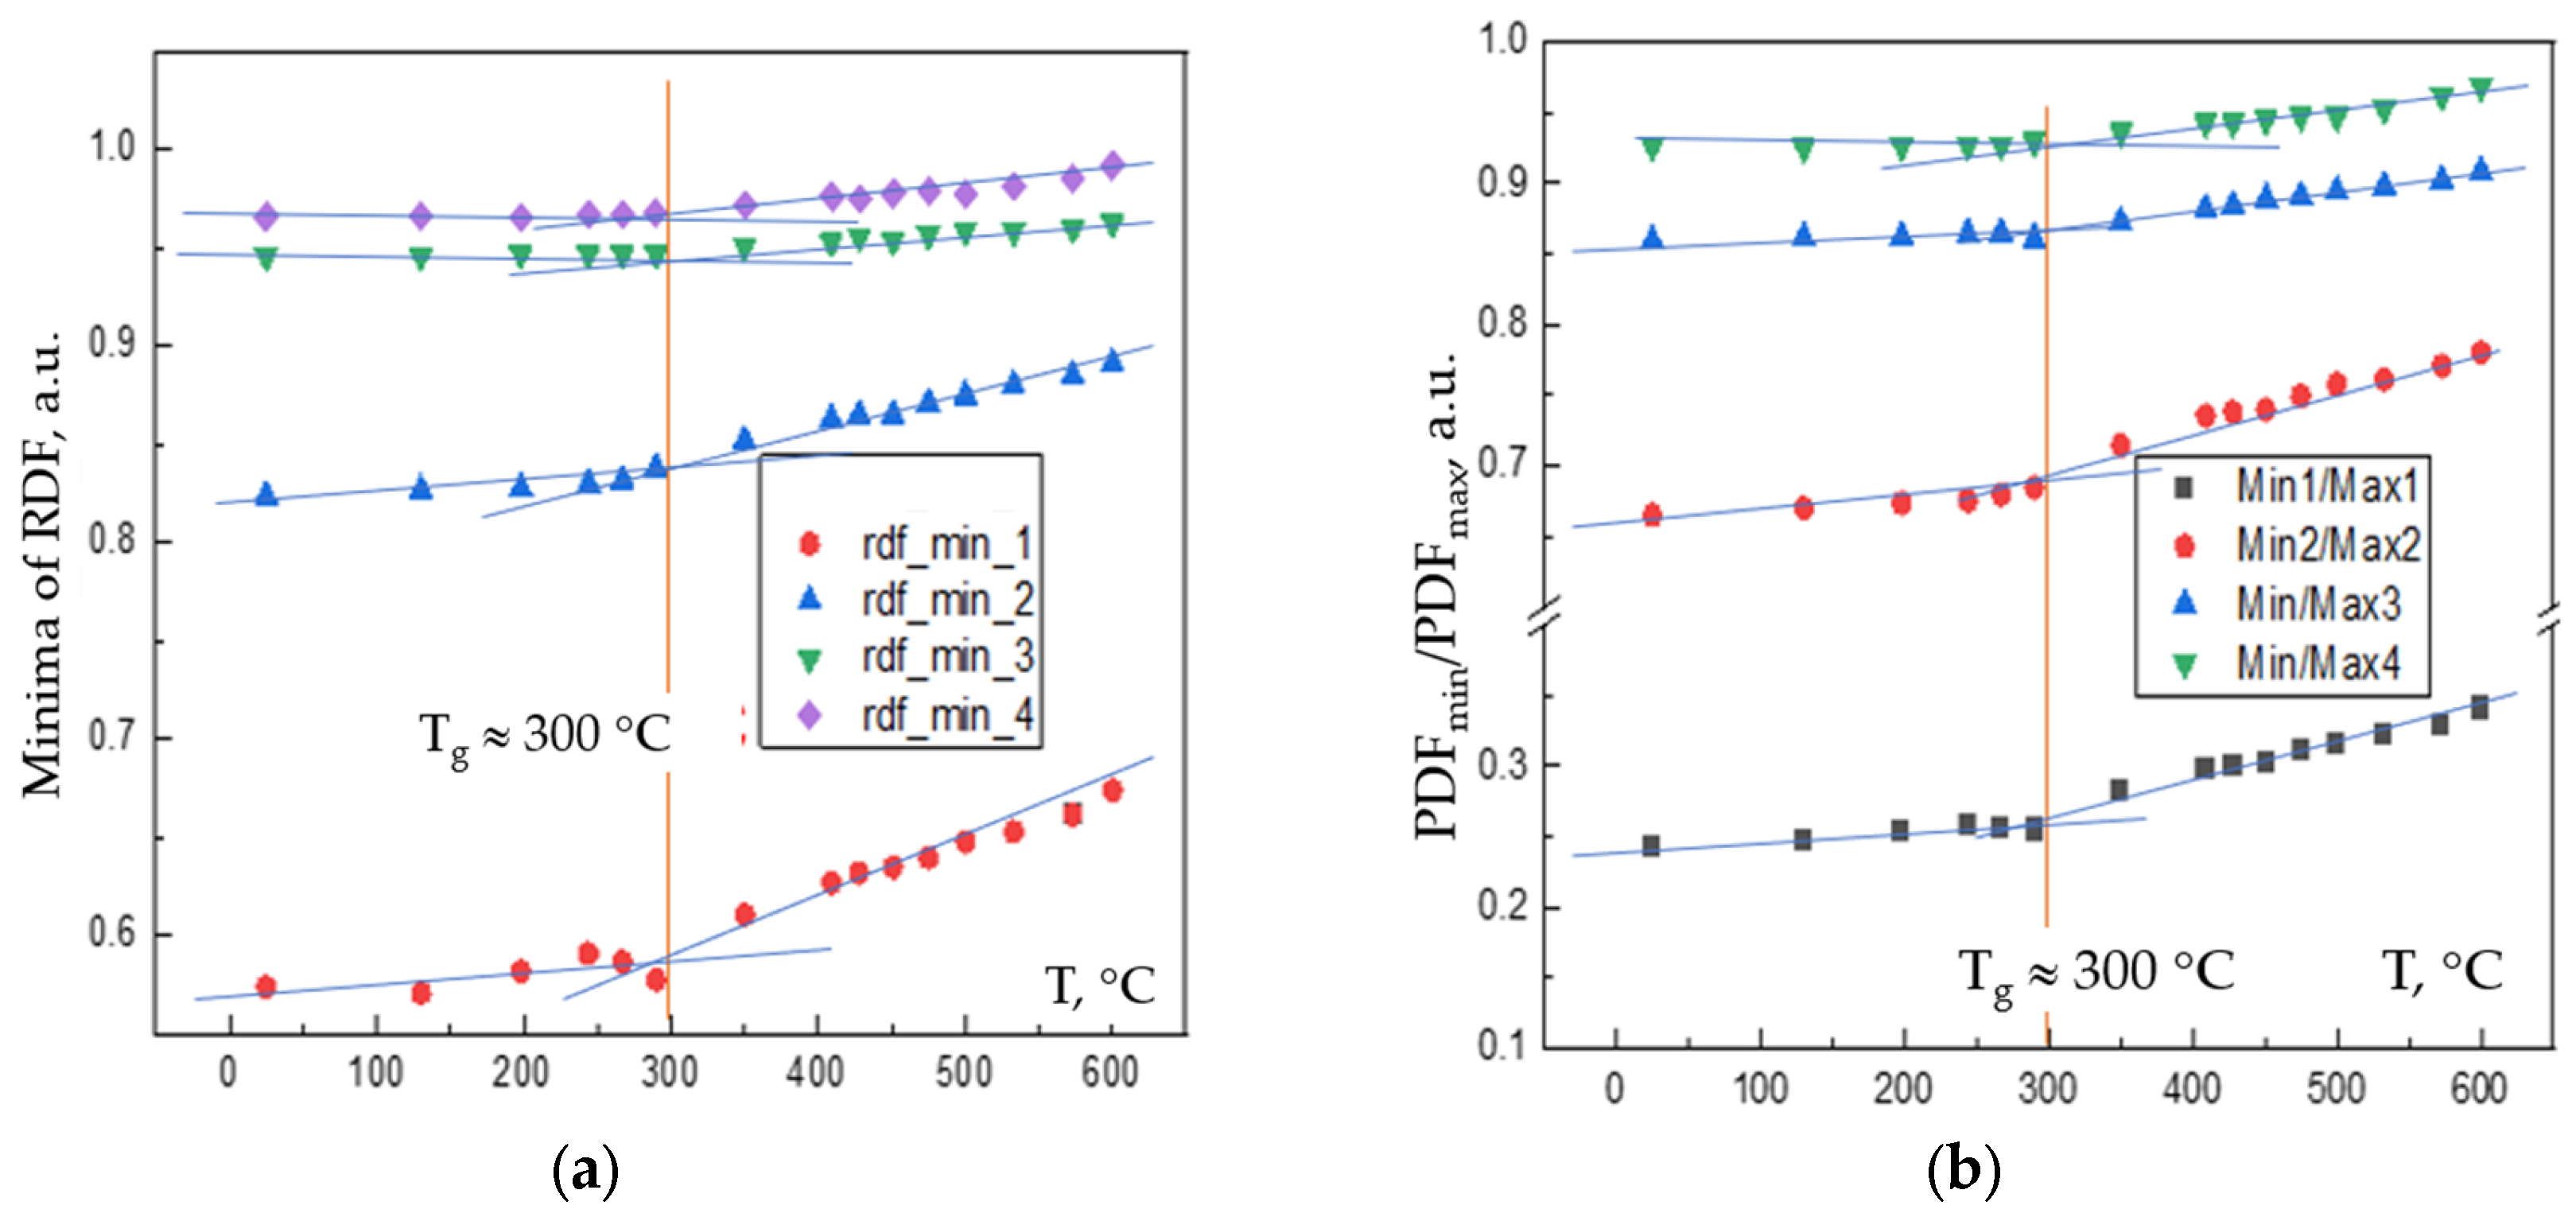
Figure 3.
Variation of the first maximum and minimum of the structure factor S(q) with temperature.
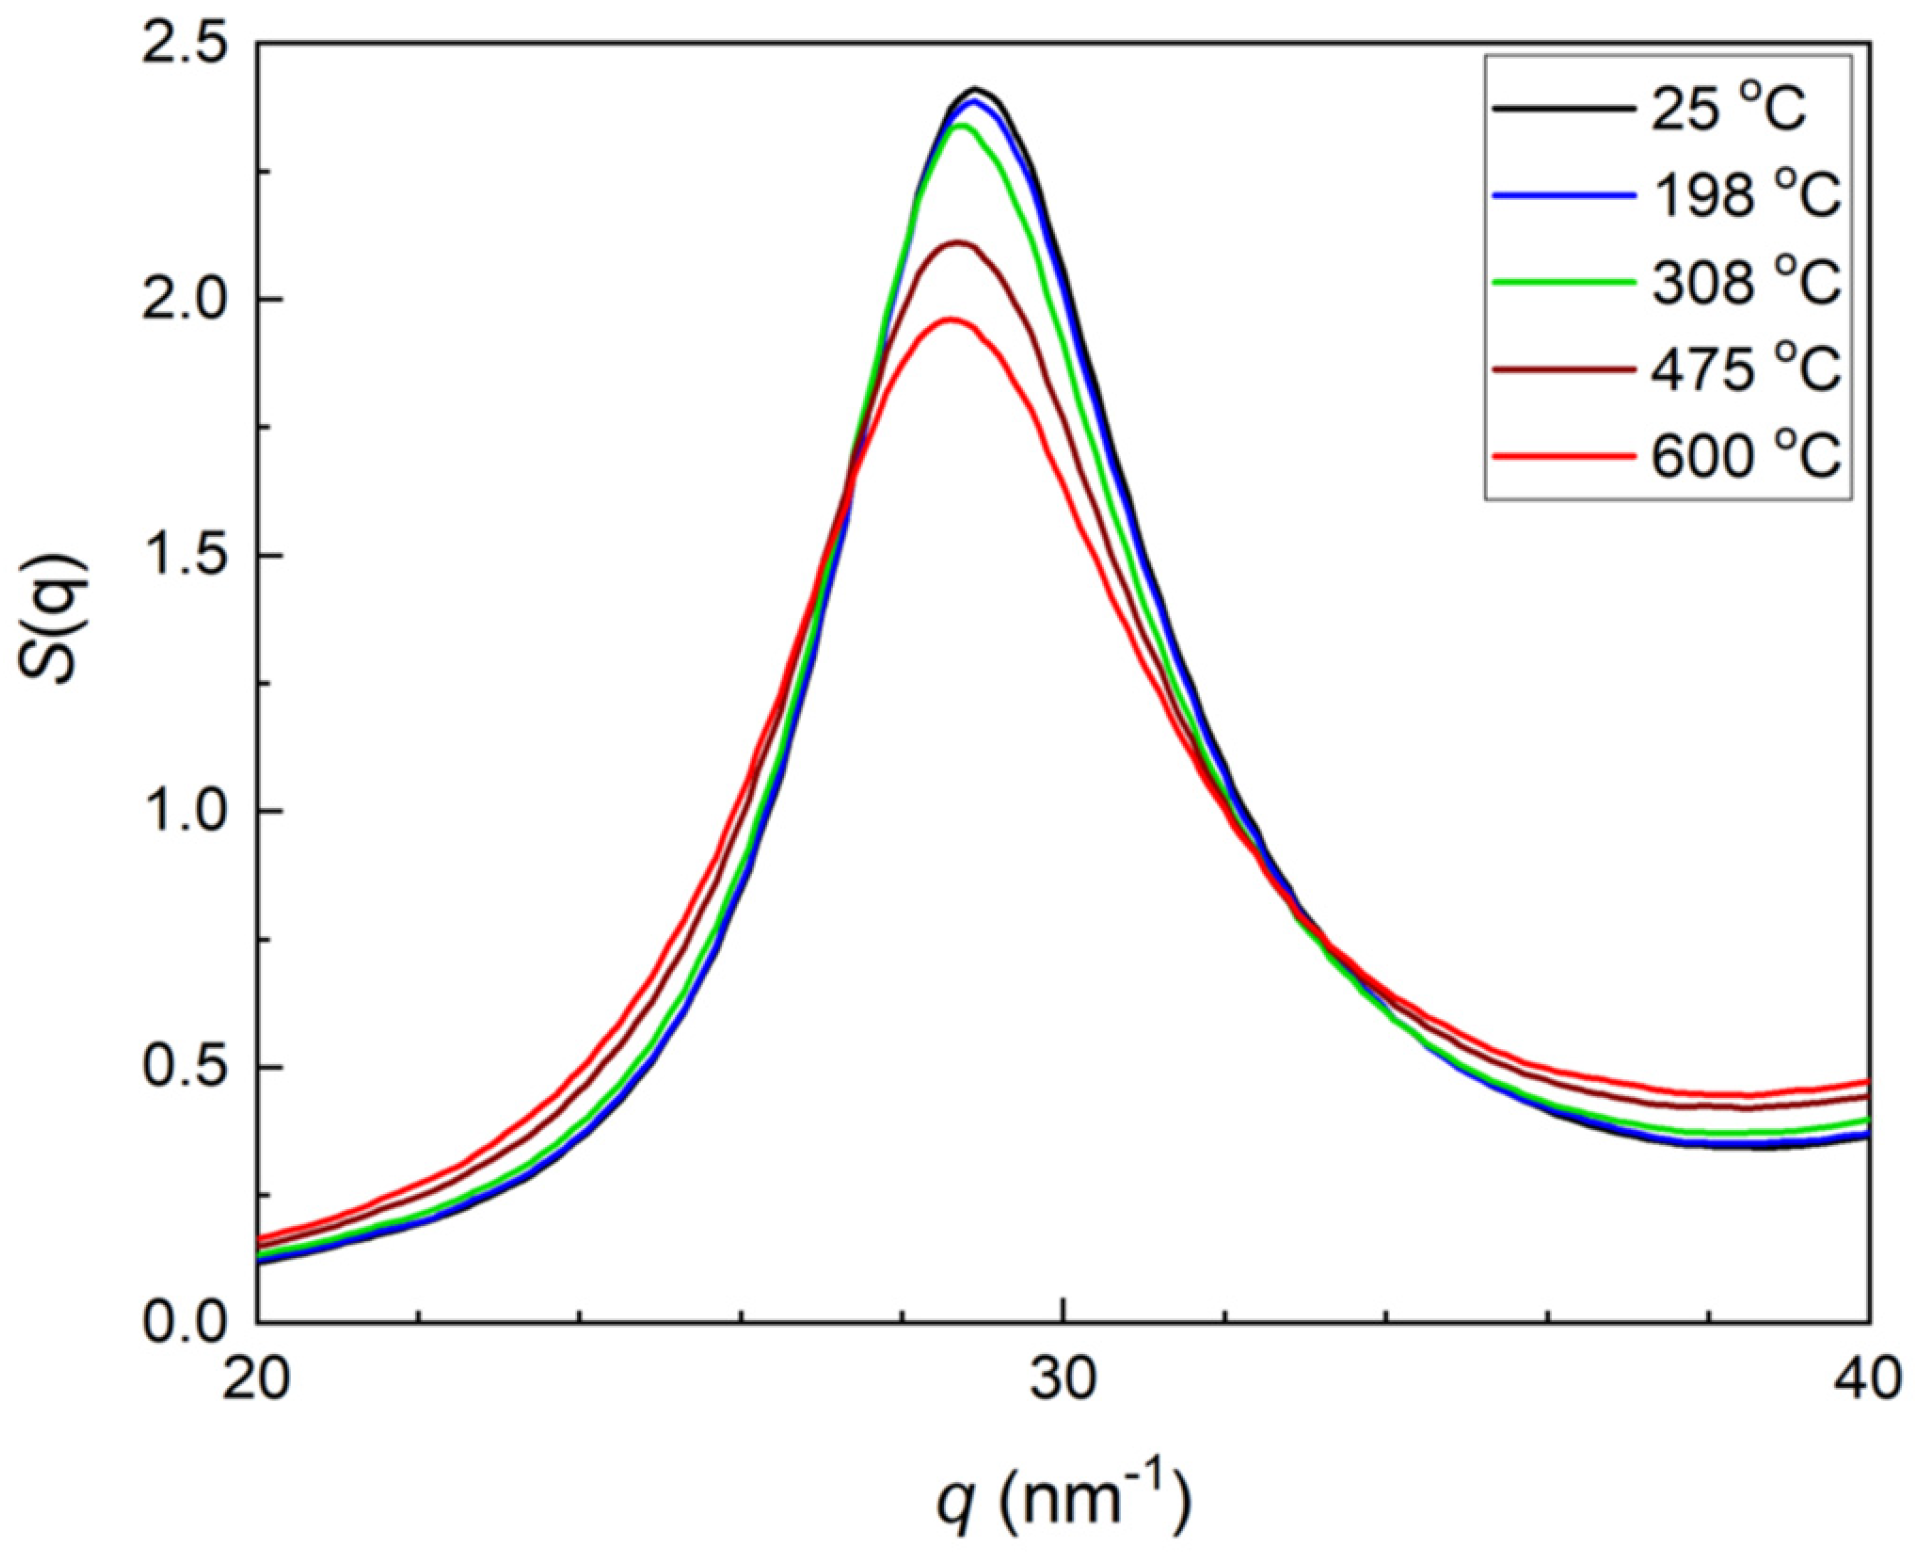
Figure 4.
Variation with temperature of: (a) The temperature derivatives of the first maximum value of the structure factor ∂S(q1)/∂T and (b) the second temperature derivative ∂2S(q1)∂T2. The idealised stepwise (in (a)) and delta-function-wise (in (b)) behaviours expected without account of fluctuations are shown by grey colour. The glass transition temperature previously identified as Tg ≈ 300 oC.
Disclaimer/Publisher’s Note: The statements, opinions and data contained in all publications are solely those of the individual author(s) and contributor(s) and not of MDPI and/or the editor(s). MDPI and/or the editor(s) disclaim responsibility for any injury to people or property resulting from any ideas, methods, instructions or products referred to in the content. |
© 2025 by the authors. Licensee MDPI, Basel, Switzerland. This article is an open access article distributed under the terms and conditions of the Creative Commons Attribution (CC BY) license (http://creativecommons.org/licenses/by/4.0/).
Copyright: This open access article is published under a Creative Commons CC BY 4.0 license, which permit the free download, distribution, and reuse, provided that the author and preprint are cited in any reuse.


