Submitted:
13 June 2025
Posted:
13 June 2025
Read the latest preprint version here
Abstract
This article introduces the Index of Distributive and Developmental Outlook (IDDO), a composite indicator designed to jointly assess economic performance and income inequality across EU-27 Member States. While GDP per capita is widely used to evaluate national prosperity, and the Gini coefficient captures income distribution, their separate use often obscures the interaction between growth and equity - an essential dimension of sustainable development. To address this gap, the IDDO integrates normalized values of both indicators using arithmetic and geometric means. The study applies the IDDO to a longitudinal dataset covering the years 2005, 2014, and 2024, allowing for comparative and temporal analysis. Based on IDDO scores, countries are classified into four development types: balanced development, growth with inequality, equity with stagnation, and dual vulnerability. Results show that while some Member States, such as Luxembourg, Czechia, and Slovenia, maintain consistently high IDDO levels, others - including Bulgaria, Romania, and Latvia -exhibit persistent challenges in aligning growth with equitable outcomes. The findings underscore the need for cohesion policies that prioritize not only economic convergence but also distributive fairness. The IDDO provides a practical and adaptable tool for diagnosing development patterns, benchmarking performance, and informing policy design within the EU framework.
Keywords:
sustainable development
; inequality
; composite indicators
; IDDO
; EU-27
1. Introduction
In recent decades, economic growth and income inequality have emerged as two of the most closely monitored—yet analytically separated—dimensions of sustainable development. Gross Domestic Product (GDP) is commonly used to assess national prosperity and the degree of macroeconomic development (Miladinov, 2020; Ediev, 2011). GDP can also be interpreted as a robust indicator of the intensity of value creation efforts (Dynan & Sheiner, 2018), regardless of whether the output takes the form of socially useful goods and services or generates negative externalities. Over time, GDP has acquired the status of a general proxy for societal advancement and overall progress (Marcus & Kane, 2007).
However, due to its intrinsic nature and primary function, this indicator exhibits well-known limitations. It fails to capture key aspects at the core of public policy debates (Mitu, 2024). Most notably, it does not reflect the extent to which growth is distributed fairly across the population (Kakwani & Son, 2016), thereby hindering an adequate evaluation of distributive justice (Alvaredo et al., 2022).
Conversely, inequality indicators such as the Gini coefficient offer valuable insights into social cohesion but often at the cost of overlooking the broader context of economic performance (Goubin, 2018; Aruqaj, 2023). The link between economic hardship and social cohesion is particularly relevant, as material deprivation tends to correlate strongly with eroded social trust and diminished solidarity (Goubin, 2018).
As the international policy agenda increasingly converges on the goal of “inclusive and sustainable economic growth” (see SDG 8: Decent Work and Economic Growth; SDG 10: Reduced Inequalities; and SDG 17: Partnerships for the Goals), there is a growing need for analytical tools capable of integrating both equity and prosperity into a unified assessment framework (Johnson & Eccleston, 2023).
Within this context, the European Union (EU-27) offers a unique empirical laboratory for examining distributive-developmental dynamics over time. Despite a shared economic architecture and regulatory framework, the EU Member States display considerable divergence in both GDP per capita and income inequality. While some countries have succeeded in coupling high economic performance with relatively low inequality, others have struggled to translate growth into distributive outcomes.
Understanding these patterns and trade-offs is essential not only for assessing the developmental trajectories of individual countries but also for designing public policies that foster what may be termed equitable prosperity.
This study introduces and applies a new synthetic indicator: the Index of Distributive and Developmental Outlook (IDDO). The IDDO is specifically designed to capture a country’s combined performance in terms of economic output and income distribution. In contrast to existing composite indices such as the Human Development Index (HDI) or the OECD Better Life Index, the IDDO focuses explicitly on the tension—and potential synergy—between growth and equity. It thus offers a more targeted lens for assessing sustainable development in both economic and social dimensions.
This article makes three main contributions. First, it develops a theoretical rationale and an empirical formula for the IDDO, based on normalized GDP per capita and the Gini coefficient. Second, it applies the indicator to a longitudinal dataset covering the years 2005, 2014, and 2024 across all 27 current EU Member States. Third, it proposes a typology of distributive-developmental models within the EU, enabling cross-national comparison and interpretative policy framing.
The guiding research questions of this study are as follows:
- RQ1
- RQ1: How do EU countries compare in terms of their combined performance on equity and growth?
- RQ1
- RQ2: What patterns emerge over time, and what types of developmental configurations can be identified?
- RQ1
- RQ3: To what extent can a composite indicator such as the IDDO serve as a useful diagnostic and policy tool?
By addressing these questions, the article aims to enrich the methodological toolkit for analyzing sustainable development and to offer a new perspective on the intersection of equity and prosperity.
2. Theoretical Background and Literature Review
The relationship between economic growth and income inequality has long been a topic of interest in both economic theory and empirical policy analysis. While economic growth is often regarded as a driver of prosperity, it does not always lead to a fair distribution of wealth and may therefore exacerbate income inequality. The well-known Kuznets curve hypothesis (Kuznets, 1955) posits that inequality tends to rise in the early stages of economic development and then gradually decreases as societies mature and wealth is redistributed. However, more recent empirical studies have challenged the universality of this trajectory, particularly in the context of unbalanced economies, where growth has often been accompanied by increasing inequality—especially when driven by sectors that do not benefit lower-income groups (Dorofeev, 2024; Bello et al., 2024). According to Saipudin (2024), in developing economies, high inequality may impede growth by restricting access to essential services, thereby limiting human capital development. In contrast, in advanced economies, certain forms of inequality may actually stimulate investment and innovation—provided that strong institutions are in place. Conversely, other studies suggest that specific mechanisms such as industrialization and technological progress can reduce income inequality by enhancing productivity and wages (Wang, 2019; Zhang & Cao, 2024). Although technological advancement generally contributes to economic growth, it may have diverse effects on inequality, depending on how technology adoption impacts labor markets and wage distribution (Urraca-Ruiz & Lima, 2024).
2.1. Growth and Distribution: Parallel or Divergent Trajectories?
GDP growth does not uniformly translate into reductions in income inequality. The relationship is mediated by factors such as fiscal policy, institutional strength, sector-specific growth patterns, and technological change (Aktaş, 2024; Halili & Rodriguez Gonzalez, 2025). Effective policy interventions and equitable growth strategies are essential for addressing income disparities. Nevertheless, while GDP per capita remains the most widely used benchmark of economic progress, its limitations in capturing the multidimensional nature of social well-being are well documented and have been critically discussed in several reports and evaluations (Stiglitz, Sen & Fitoussi, 2009; Mitu, 2024). Meanwhile, the Gini coefficient and other inequality measures are often treated as secondary or complementary indicators, which contributes to a fragmented conceptual understanding of sustainable development (Davies, 2017; Martín-Legendre, 2018). In the European Union, this disjunction is evident in many cases where economic growth has not resulted in reduced inequality; on the contrary, it has led to its deepening—thus highlighting a decoupling between economic progress and social equity (OECD, 2020).
Furthermore, the disconnection between economic growth and equitable outcomes has intensified in several EU Member States, where increases in GDP have not consistently translated into reductions in income disparities (Dudzevičiūtė & Prakapienė, 2018; Domonkos, 2020; Lee & Lee, 2024). This phenomenon underscores the need for integrated measurement tools that capture not only the quantity of economic growth but also its quality—particularly from a distributive perspective (Fixler et al., 2019; Alvaredo et al., 2022; Filauro et al., 2025).
2.2. Composite Indices in Sustainable Development Monitoring
In response to the inadequacy of unidimensional indicators, numerous composite index frameworks have been proposed. The Human Development Index (HDI) combines life expectancy, educational attainment, and per capita income, while the OECD Better Life Index includes multidimensional indicators such as housing, employment, and work-life balance. Similarly, the Social Progress Index (SPI) and the Multidimensional Poverty Index (MPI) aim to quantify aspects of well-being that go beyond income metrics (OECD, 2008; De Muro et al., 2011; Otoiu et al., 2014).
However, few of these indices directly synthesize income inequality and GDP per capita in a way that allows for comparative and temporal assessments of distributive development outcomes. Most composite frameworks treat economic and social indicators separately or use weighting schemes that dilute the interpretive value of trade-offs between equity and economic performance (Sachs et al., 2018).
2.3. The Need for a Mixed Indicator of Development and Distribution
Against this backdrop, we argue that there is both a theoretical and empirical rationale for developing a composite indicator that explicitly reflects the interaction between economic prosperity and income distribution. Such an index would serve not only as a more nuanced diagnostic tool but also as a means to identify countries where development has proceeded in a socially sustainable manner - i.e., where the benefits of growth have been broadly shared.
The proposed indicator - the Index of Distributive and Developmental Outlook (IDDO) - seeks to fill this gap by combining normalized GDP per capita with the Gini coefficient into a single synthetic measure. Through this approach, the IDDO enables a typological classification of countries based on their distributive-developmental configuration and allows for the dynamic tracking of their trajectories over time. Unlike existing indices, this tool aims to place the tension between growth and equity at the center of analysis, thereby offering what we believe to be an innovative perspective in sustainable development research.
3. Data and Methodology
This section outlines the construction of the Index of Distributive and Developmental Outlook (IDDO), the data sources used, the normalization procedures applied to the base indicators, and the typological framework elaborated for interpreting the results.
3.1. Data Sources and Geographical Coverage
To support the longitudinal analysis of economic inequality across the European Union (current EU-27 Member States), this study focuses on three reference years: 2005, 2014, and 2024. This selection enables the tracking of distributive-developmental trajectories over two decades, in the context of EU enlargement, post-crisis recovery, and post-pandemic socio-economic restructuring. The choice is methodologically and practically justified as follows:
- 2005 marks the first year when harmonized data on the Gini coefficient before social transfers (excluding pensions) became available for most EU-27 countries, due to expanded coverage of the EU-SILC survey and indicator standardization within Eurostat.
- 2014 serves as a midpoint of the 2005–2024 interval, capturing a relatively stable fiscal and social policy context prior to the systemic shock of the COVID-19 pandemic.
- 2024 is used as the final reference point, representing the most recent year for which aggregated or pre-aggregated data on income inequality are available at the EU level.
The primary sources used in this study are summarized in Table 1:
This selection enables a long-term analysis of the dynamics of economic inequality, avoiding the limitations associated with data gaps or methodological inconsistency during the statistical transition of the early 2000s.
For some Member States, 2005 values for the Gini coefficient before social transfers (pensions excluded from social transfers) are missing from the Eurostat database. In such cases, the missing value was replaced with the one from the immediately following year, based on temporal proximity. This methodological option is supported by the literature on cross-sectional studies, which recommends this solution when annual variations in the indicator are relatively small (Atkinson & Marlier, 2010), the pointwise substitution does not distort the overall distribution of the sample, and the research objective is comparative rather than predictive.
Thus, in the event of missing data for a particular country in 2005, the value from 2006, or the closest available year, was used. Although this approach entails a minor degree of temporal approximation, the relative position of the indicator (i.e., rankings and typological classifications among countries) remains sufficiently robust for longitudinal analysis. Moreover, this approach allows for the preservation of a balanced two-decade time horizon and captures the evolution of disparities in sustainable development across the EU-27. Each such substitution is clearly marked in the centralized dataset.
The same logic was used the year 2005, GDP per capita (PPS) data were retrieved from a compatible source provided by the same primary data supplier—Eurostat.
3.2. Constructing the IDDO Indicator
The construction of the Index of Distributive and Developmental Outlook (IDDO) addresses the identified need for a composite indicator capable of capturing, in a single synthetic measure, both the scale of economic output and the equity of its distribution. As argued in the theoretical section, GDP per capita and the Gini coefficient each offer valuable but partial information. IDDO seeks to integrate these two dimensions in a way that allows for both cross-sectional (between countries) and longitudinal (over time) comparisons. Accordingly, IDDO is designed as a bidimensional indicator intended to reflect, on the one hand, economic performance, operationalized through GDP per capita expressed in purchasing power standard (PPS) and normalized across countries; and on the other hand, income inequality, represented by the Gini coefficient of equivalized disposable income before social transfers (excluding pensions).
The normative logic of IDDO assumes that sustainable and inclusive development is characterized by a high level of income per capita combined with a relatively low level of inequality. Therefore, countries performing well on both indicators should receive higher IDDO scores, while those marked by economic stagnation or high inequality (or both) will score lower.
3.2.1. Normalization Procedure
Given the differing scales and orientations of the two indicators (a higher GDP per capita is desirable, while a higher Gini coefficient reflects higher inequality), a two-step normalization is applied. We use min-max normalization so that GDP and Gini values fall within the same interval: 0 (minimum) to 1 (maximum).
For GDP per capita, the normalization formula is:
where
- represents the normalized GDP per capita value for a given country;
- reprezintă the raw GDP per capita (in PPS) value for the country "i" under analysis;
- represents the lowest GDP per capita value in the dataset;
- represents the highest GDP per capita value in the dataset.
For the Gini coefficient, we apply an inverted min–max normalization (to reflect the favorable nature of lower inequality):
where
- represents the inverted normalized value of the Gini coefficient for a given country;
- represents the raw Gini coefficient value for the country "i" under analysis;
- represents the lowest Gini coefficient in the sample (i.e., the most egalitarian society);
- represents the highest Gini coefficient (i.e., the most unequal society).
This approach ensures that higher normalized values reflect better performance in terms of both economic development and social equity.
3.2.2. Composite Score Calculation
After the two components (GDP per capita and the inverted Gini coefficient) are normalized to a common [0,1] scale, they are integrated into a single composite score representing the IDDO. The basic version of the IDDO score is constructed using a simple arithmetic mean, assuming equal importance for economic performance and income distribution:
where
- represents the normalized GDP per capita for country "i" at time "t", calculated using min-max normalization;
- represents the normalized (and inverted) Gini coefficient for country "i" at time "t", such that lower inequality yields higher values.
This approach reflects the normative assumption that both prosperity and equity are equally important pillars of sustainable development. Using an unweighted average avoids imposing implicit value judgments about the relative priority of economic versus social performance. Thus, it facilitates comparability across countries and over time, as well as interpretability for researchers and policymakers. However, the arithmetic mean implies a fully compensatory structure, meaning that strong performance in one dimension can offset poor performance in the other.
To address this potential limitation, reduce compensability, and test the robustness of the composite score, an alternative version of the IDDO is constructed using a weighted geometric mean as an alternative aggregation method:
where
- α∈[0,1] represents a weighting parameter dependent on policy preferences, reflecting the emphasis placed by the analyst or policymaker on the economic versus the social dimension;
- și as previously defined.
In this study, we set α=0.5, implying equal weights. However, the model allows for flexibility: a higher α emphasizes economic performance, while a lower α prioritizes equity. Unlike the arithmetic mean, the geometric mean penalizes imbalances - strong GDP performance cannot fully compensate for low equity and vice versa. This makes the composite measure more stringent and more appropriate for identifying asymmetric development patterns.
3.2.3. Interpretation and Typological Classification
To provide practically applicable insights, IDDO scores can be grouped into four analytical categories based on each country's relative position in the value distribution. This typological scheme is derived from the two normalized components and can be interpreted according to Table 2:
This typology enhances the analytical value of the IDDO index, allowing for a multidimensional interpretation of performance and guiding both benchmarking activities and targeted policy interventions. It functions as a diagnostic tool for identifying policy trade-offs, measuring trends in convergence or divergence, and highlighting situations where economic growth without equity or equity without growth undermines sustainability. The typology also supports the visualization of spatial patterns through comparative maps and bar charts, offering intuitive representations of multidimensional inequality across the EU-27.
4. Results and Discussion
The evolution of the IDDO across the 2005–2024 period for EU-27 countries reveals significant transformations in terms of the convergence between economic development and social equity among Member States. Constructed as a simple average of normalized GDP per capita and the inverted normalized Gini coefficient, IDDO provides a synthetic overview of development sustainability by simultaneously incorporating economic performance and income distribution. The analysis follows the spatio-temporal dynamics of this index, offering insight into the convergence of development and distribution within the EU-27. In this regard, Table 3 summarizes the results obtained for the 27 EU Member States regarding the evolution of GDP per capita, income inequality, and the IDDO score for the years 2005, 2014, and 2024. These data provide an empirical basis for subsequent graphical interpretations and typological classification.
4.1. General Trends in the EU-27
The longitudinal analysis of IDDO across the EU-27 for the years 2005, 2014, and 2024 reveals a trajectory marked by discontinuities. Following a modest improvement in the average IDDO between 2005 (0.40) and 2014 (0.41), the year 2024 records a significant decline to 0.34, indicating a possible erosion of progress in distributive equity (Figure 1).
This regression occurs despite positive economic developments in certain states and is associated with the cumulative effects of the sovereign debt crisis, the COVID-19 pandemic, and the military conflict in Ukraine.
At the national level, Luxembourg consistently maintains its leading IDDO position, registering high values in all three reference years (0.92 in 2005, 0.81 in 2014, and 0.76 in 2024), confirming a durable combination of very high GDP per capita and relatively equitable income distribution. Countries such as the Netherlands and Austria also maintain high scores, indicating a robust combination of economic development and distributive equity.
Ireland, however, presents an interesting case. In 2005, its IDDO was only 0.28, affected by a high Gini coefficient (41.8). In 2024, although income inequality remains relatively high, the increase in GDP per capita to 211% of the EU average propelled its IDDO to 0.66, suggesting a model of accelerated development that nonetheless raises questions about distributive sustainability.
Central and Eastern European countries (many of which are former members of the Eastern bloc) generally showed positive development, particularly between 2005 and 2014. For example, Czechia and Slovakia recorded high IDDO values in 2014 (0.59 and 0.55, respectively), maintained through 2024 (0.56 and 0.53). These countries demonstrate the capacity to combine economic growth with effective inequality-reduction policies. In contrast, Romania and Bulgaria, despite improvements in GDP per capita, remain in the lower tier of the ranking. Notably, Bulgaria reached an IDDO of 0.00 in 2024—a critical signal of increasing inequality in the context of a still-low economic level (66% of the EU average) and deeply unbalanced income distribution (Gini: 41.7).
Another relevant case is Poland, which advanced significantly from 2005 (IDDO: 0.10) to 2024 (0.41), reflecting both increasing economic convergence and improvements in distributive equity. Slovenia and Malta also succeeded in maintaining consistently high IDDO values, suggesting coherent and effective public policies that achieve a balance between economic efficiency and social cohesion.
The data suggest that improvements in the standard of living (GDP per capita) do not automatically translate into reduced inequality. For instance, Lithuania and Latvia have grown economically, but their IDDOs remain low (0.12 and 0.17 in 2024), indicating persistent problems in income distribution. Similarly, France, while maintaining a GDP per capita near the EU average, recorded a continuous decline in IDDO—from 0.50 in 2005 and 0.46 in 2014 to just 0.25 in 2024—reflecting increasing inequality amid relative stagnation.
4.2. Typological Classification of Member States
To better understand developmental trajectories, EU-27 countries have been classified into four types based on their average IDDO score during 2005–2024 and the consistency of their evolution (according to the interpretative typology outlined in Table 2) (Figure 2):
- Type I – High Balanced Development (IDDO ≥ 0.55): Luxembourg, Czechia, Netherlands, Slovenia.
- Type II – Moderate and Stable Progress (0.45 ≤ IDDO < 0.54): Austria, Malta, Slovakia, Sweden, Belgium, Germany.
- Type III – Convergence with Inequality (0.30 ≤ IDDO < 0.44): France, Finland, Hungary, Spain, Ireland, Italy, Denmark, Cyprus, Croatia, Poland, Greece.
- Type IV – High Distributive Imbalance (IDDO < 0.29): Romania, Bulgaria, Latvia, Lithuania, Portugal, Estonia.
This typology highlights that not only the level of GDP per capita matters, but also the coherence of redistributive policies. Countries with relatively low GDP, but effective equity policies, may achieve higher IDDO scores than more developed states with high structural inequality (Figure 3).
Therefore, the analysis of average IDDO over the period 2005–2024 reveals increasing polarization within the EU-27, where some countries succeed in advancing on both dimensions of sustainable development, while others face difficulties in ensuring equity even amid economic growth. These results underscore the importance of continuing cohesion and redistribution policies within the European Union and the need to integrate social and distributive components into economic progress assessments.
5. Conclusions and Policy Implications
The analysis presented in this study aims to provide an integrated view of how EU-27 countries perform in terms of the combination of economic prosperity and income distribution equity. By constructing and applying a composite indicator, the Index of Distributive and Developmental Outlook (IDDO), this paper seeks to go beyond the limitations of one-dimensional assessments and address essential questions regarding the nature and dynamics of sustainable development within the European context.
In relation to the research questions formulated (RQ1, RQ2, and RQ3), the comparative results demonstrate that differences between Member States remain substantial in terms of the balance between economic development and redistributive equity.
Countries such as Luxembourg, the Netherlands, Slovenia, and Czechia have consistently achieved high IDDO scores, indicating strong performance across both dimensions. In contrast, other states—such as Bulgaria, Romania, and Latvia—remain in the lower tier of the ranking, either due to low levels of economic development, persistent inequality, or both. This finding provides a documented answer to RQ1, regarding the comparative standing of Member States in terms of balancing growth and equity, and highlights the importance of integrated monitoring of both dimensions.
Regarding RQ2, based on data from 2005, 2014, and 2024, the study identifies several distinct developmental trajectories. Some Central and Eastern European economies, such as Czechia, Poland, and Slovenia, have moved toward more balanced development, improving both their living standards and equity indicators. In contrast, other countries, while experiencing robust increases in GDP per capita, have failed to reduce structural inequalities, thus reinforcing what can be characterized as "polarized growth" patterns. This diversity of trajectories allows for the development of a distributive-developmental typology, classifying countries into four types: balanced development (Type I), unbalanced growth (Type II), equity with economic stagnation (Type III), and dual vulnerability (Type IV). We argue that this typology offers important interpretive value, serving as an analytical framework for diagnosing structural risks and for highlighting institutional best practices. The IDDO’s capacity to generate clear typological classifications supports the identification of reform priorities and strengthens benchmarking within the EU’s cohesion policy framework.
From the perspective of RQ3, the IDDO serves not merely as a ranking tool but also has practical utility for policy formulation. Its simple structure makes it suitable as a complementary instrument within the European Semester’s monitoring mechanisms or for the strategic allocation of EU funds, as it captures not only the absolute level of development but also its social quality. Its application could help identify structural imbalances and monitor progress or setbacks in equity-related outcomes. In an era marked by redistributive tensions and rising demands for social justice, such an indicator can enhance decision-making by highlighting disparities and offering a robust comparative framework. The use of a simple arithmetic mean facilitates the communication of results, while the proposed alternative geometric version provides a more rigorous method for analyses sensitive to imbalances. This methodological flexibility reinforces the IDDO’s potential as an informed governance tool and underlines its relevance for both ex-ante and ex-post evaluations of public interventions. Cohesion policy funds should be more tightly linked to dual performance parameters—not just economic convergence. For instance, countries with improving IDDO scores could be rewarded for structural reforms that align growth with social equity.
This study seeks to convey a clear message: economic growth alone is insufficient unless it is accompanied by equity. Countries that perform well on the IDDO are those that have successfully combined effective fiscal reforms, well-designed social protection systems, and investment in human capital. Conversely, in countries with low IDDO scores, national strategies must be reoriented toward stronger redistributive mechanisms, the reduction of tax evasion, and the promotion of inclusive growth models.
We emphasize the need to reinforce policy coherence between economic and social objectives. GDP growth strategies must be paired with fiscal policies that have genuine redistributive capacity and with inclusive labor market reforms, in order to prevent inequality from neutralizing development gains. In this regard, the IDDO may offer a simplified yet insightful lens through which to monitor how growth and equity evolve in tandem.
In conclusion, the study demonstrates that despite partial economic convergence across the EU-27, income inequality continues to fragment the sustainable development landscape. The IDDO, as proposed here, may serve as an integrative and analytically valuable solution, enabling not only the measurement of progress but also the promotion of critical reflection on the development model we collectively shape within the European Union - particularly in light of the multiple challenges of the coming decade: accelerated digitalization, the green transition, demographic shifts, and geopolitical pressures.
6. Limitations and Future Research
While this study proposes an innovative approach to analyzing sustainable development through the lens of the relationship between economic growth and income distribution equity, it is important to acknowledge several methodological and analytical limitations that may influence the interpretation of results.
First, the construction of the IDDO indicator relies on the availability and quality of statistical data reported by Eurostat for GDP per capita and the Gini coefficient before social transfers. For some Member States—particularly during the early stage of the series analyzed (2005)—methodological substitutions were necessary, using the closest available values. Although this approach is supported by existing cross-sectional literature, it introduces a degree of uncertainty regarding the fidelity of cross-country comparability.
Second, the normalization of raw values using the min–max method, while intuitive and easy to interpret, implies a dependence on the extreme values of the distribution, which may affect robustness in the presence of outliers. Similarly, the choice of equal weighting in the IDDO base formula assumes a normative neutrality between the economic and distributive dimensions—an assumption that may be challenged depending on the institutional context or public policy priorities of individual Member States. In this regard, the proposed geometric version, with adjustable weights, offers greater flexibility, but requires further validation in future research.
Additionally, IDDO remains a two-dimensional composite indicator, focused exclusively on the interaction between GDP and inequality. This formulation does not capture other relevant dimensions of sustainable development, such as environmental sustainability, civic participation, institutional quality, or equitable access to education and healthcare. Therefore, its applicability to a holistic assessment of socio-economic progress is limited and should be complemented by broader frameworks such as the Sustainable Development Goals (SDGs) Index, Social Progress Index (SPI), or Green Growth Indicators.
With regard to future research directions, this study opens the possibility of extending the application of the IDDO beyond the EU, by including candidate countries or states from other regions, in order to test the international validity of the model. Another promising direction lies in the integration of a more sophisticated temporal dimension, through the construction of a dynamic IDDO capable of capturing not only the current state but also the structural trends of each economy. Furthermore, it would be useful to explore correlations between the IDDO and other indicators of subjective well-being or institutional resilience, to better understand the role of balancing growth and equity in sustaining long-term democratic stability and social cohesion.
Author Contributions
Conceptualization, N.E.M. and G.T.M.; methodology, N.E.M. and G.T.M.; software, N.E.M. and G.T.M.; validation, N.E.M. and G.T.M.; formal analysis, N.E.M. and G.T.M.; investigation, N.E.M. and G.T.M.; resources, N.E.M. and G.T.M.; data curation, N.E.M. and G.T.M.; writing—original draft preparation, N.E.M. and G.T.M.; writing—review and editing, N.E.M. and G.T.M.; visualization, G.T.M.; supervision, N.E.M.; project administration, N.E.M. and G.T.M.; funding acquisition, N.E.M. and G.T.M.. All authors have read and agreed to the published version of the manuscript.
Funding
This research received no external funding.
Data Availability Statement
The raw data supporting the conclusions of this article will be made available by the authors on request.
Conflicts of Interest
The authors declare no conflicts of interest.
References
- Miladinov, G. Socioeconomic Development and Life Expectancy Relationship: Evidence from the EU Accession Candidate Countries. Genus 2020, 76, 1–20. [Google Scholar] [CrossRef]
- Ediev, D.M. Life Expectancy in Developed Countries Is Higher than Conventionally Estimated. Implications from Improved Measurement of Human Longevity. Journal of Population Ageing 2011, 4, 5–32. [Google Scholar] [CrossRef]
- Dynan, K.; Sheiner, L. GDP as a Measure of Economic Well-Being; Hutchins Center.
- Working Paper no. 43, Brookings Institution, Washington, DC, USA, 2018. Available online: https://www.brookings.edu/wp-content/uploads/2018/08/WP43-8.23.18.pdf (accessed on 5 June 2025).
- Marcuss, R.; Kane, R. U.S. National Income and Product Statistics Born of the Great Depression and World War II, 2007; 87, 32–46. Available online: https://apps.bea.gov/scb/pdf/2007/02%20February/0207_history_article.pdf (accessed on 5 June 2025).
- Mitu, N.E. Limits of the Relevance of the GDP Indicator. Social Science Research Network 2024. [Google Scholar] [CrossRef]
- Kakwani, N.; Son, H.H. Growth and Shared Prosperity. Palgrave Macmillan UK eBooks 2016, 111–137. [Google Scholar] [CrossRef]
- Alvaredo, F.; De Rosa, M.; Flores, I.; Morgan, M. The Inequality (or the Growth) We Measure: Data Gaps and the Distribution of Incomes, March 2022. [CrossRef]
- Goubin, S. Is Inequality a Latent Construct? An Assessment of Economic Inequality Indicators and Their Relation with Social Cohesion in Europe. Social Indicators Research 2018, 136, 21–40. [Google Scholar] [CrossRef]
- Aruqaj, B. An Integrated Approach to the Conceptualisation and Measurement of Social Cohesion. Social Indicators Research 2023, 168, 227–263. [Google Scholar] [CrossRef] [PubMed]
- Johnson, L.; Eccleston, R. Interrogating Inclusive Growth: Implications for Conceptualisation, Measurement and Policy Practice. Australian Economic Papers 2023, 62. [Google Scholar] [CrossRef]
- Kuznets, S. Economic Growth and Income Inequality. The American Economic Review 1955, 45, 1–28. Available online: http://www.jstor.org/stable/1811581 (accessed on 5 June 2025).
- Dorofeev, M.L. Fiscal Multipliers and Income Inequality (the Case of OECD Countries, Russia and China). Voprosy Ekonomiki 2024, 4, 111–126. [Google Scholar] [CrossRef]
- Bello, A.A.; Hassan, A.; Akadiri, S.S. Income Inequality: Economic Growth Nexus in Sub-Saharan Africa—Can the Increasing Prominence of ICT Make a Difference? Environment, Development and Sustainability, 2024. [Google Scholar] [CrossRef]
- Saipudin, S. The Relationship between Income Inequality and Economic Growth. The Journal of Academic Science 2024, 1, 439–450. [Google Scholar] [CrossRef]
- Wang, Y. A Model of Industrialization and Rural Income Distribution. China Agricultural Economic Review 2019, 11, 507–535. [Google Scholar] [CrossRef]
- Zhang, Q.; Cao, X. Delaying Retirement, Income Distribution and Economic Growth. International Review of Economics & Finance 2024, 95, 103481–103481. [Google Scholar] [CrossRef]
- Urraca-Ruiz, A.; Lima, S. Coevolution of Technical Change and Income Inequality in Developed and Developing Countries. Economics of Innovation and New Technology 2024, 1–25. [Google Scholar] [CrossRef]
- Aktaş, E.E. The Moderating Effect of Income Inequality in Fiscal Policy Efficiency: The Case of Central and Eastern Europe. Acta Oeconomica 2024, 74, 65–83. [Google Scholar] [CrossRef]
- Halili, B.L.; Rodriguez Gonzalez, C. The Contingent Effects of Economic Growth and Institutions on Income Inequality: An Empirical Study. The Journal of International Trade & Economic Development, 2025; 1–32. [Google Scholar] [CrossRef]
- Stiglitz, J.; Sen, A.; Fitoussi, J.-P. Report by the Commission on the Measurement of Economic Performance and Social Progress; 2009. Available online: https://ec.europa.eu/eurostat/documents/8131721/8131772/Stiglitz-Sen-Fitoussi-Commission-report.pdf (accessed on 5 June 2025).
- Davies, J. The Gini Coefficient and Personal Inequality Measurement. SSRN Electronic Journal 2017. [Google Scholar] [CrossRef]
- Martín-Legendre, J.I. The Challenge of Measuring Poverty and Inequality: A Comparative Analysis of the Main Indicators. European Journal of Government and Economics 2018, 7, 24. [Google Scholar] [CrossRef]
- OECD How’s Life? 2020; Organisation for Economic Co-operation and Development, 2020; ISBN 9789264976719. [CrossRef]
- Dudzevičiūtė, G.; Prakapienė, D. Investigation of the Economic Growth, Poverty and Inequality Inter-Linkages in the European Union Countries. Journal of Security and Sustainability Issues 2018, 7, 839–854. [Google Scholar] [CrossRef] [PubMed]
- Domonkos, T. Inequalities and Economic Growth in EU Countries. Politická ekonomie 2020, 68, 405–422. [Google Scholar] [CrossRef]
- Lee, J.; Lee, K. Decoupling of Functional and Household Income Distribution by Economic Growth: New Findings from Analysing the Three-Way Growth-Equity Nexus. Journal of International Development 2024, 36, 2270–2299. [Google Scholar] [CrossRef]
- Fixler, D.; Gindelsky, M.; Johnson, D. Improving the Measure of the Distribution of Personal Income. AEA Papers and Proceedings 2019, 109, 302–306. [Google Scholar] [CrossRef]
- Filauro, S.; Parolin, Z.; Valetto, P. What Explains Recent Trends in Income Inequality in the European Union? The Journal of Economic Inequality 2025. [Google Scholar] [CrossRef]
- OECD Publishing Handbook on Constructing Composite Indicators: Methodology and User Guide; Organization for Economic Co-operation and Development (OECD): Paris Cedex, France, 2008; ISBN 9789264043459. [CrossRef]
- De Muro, P.; Mazziotta, M.; Pareto, A. Composite Indices of Development and Poverty: An Application to MDGs. Soc. Indic. Res. 2011, 104, 1–18. [Google Scholar] [CrossRef]
- Otoiu, A.; Titan, E.; Dumitrescu, R. Are the Variables Used in Building Composite Indicators of Well-Being Relevant? Validating Composite Indexes of Well-Being. Ecol. Indic. 2014, 46, 575–585. [Google Scholar] [CrossRef]
- Mitu, N.E.; Stanciu, C. Public Sector Performance and Public Sector Efficiency: An Analysis for CEE Countries. Eastern European Economics 2023, 61, 700–722. [Google Scholar] [CrossRef]
- Sachs, J.; Schmidt-Traub, G.; Kroll, C.; Lafortune, G.; Fuller, G. SDG Index and Dashboards Report 2018; Bertelsmann Stiftung and Sustainable Development Solutions Network (SDSN): New York, NY, USA, 2018; Available online: https://s3.amazonaws.com/sustainabledevelopment.report/2018/2018_sdg_index_and_dashboards_report.pdf (accessed on 8 June 2025).
- Atkinson, A.B.; Marlier, E. Income and Living Conditions in Europe; 2010; ISBN 9789279163517. Available online: https://ec.europa.eu/eurostat/en/web/products-statistical-books/-/KS-31-10-555 (accessed on 8 June 2025).
Figure 1.
Longitudinal evolution of EU-27 IDDO values (2005–2024).
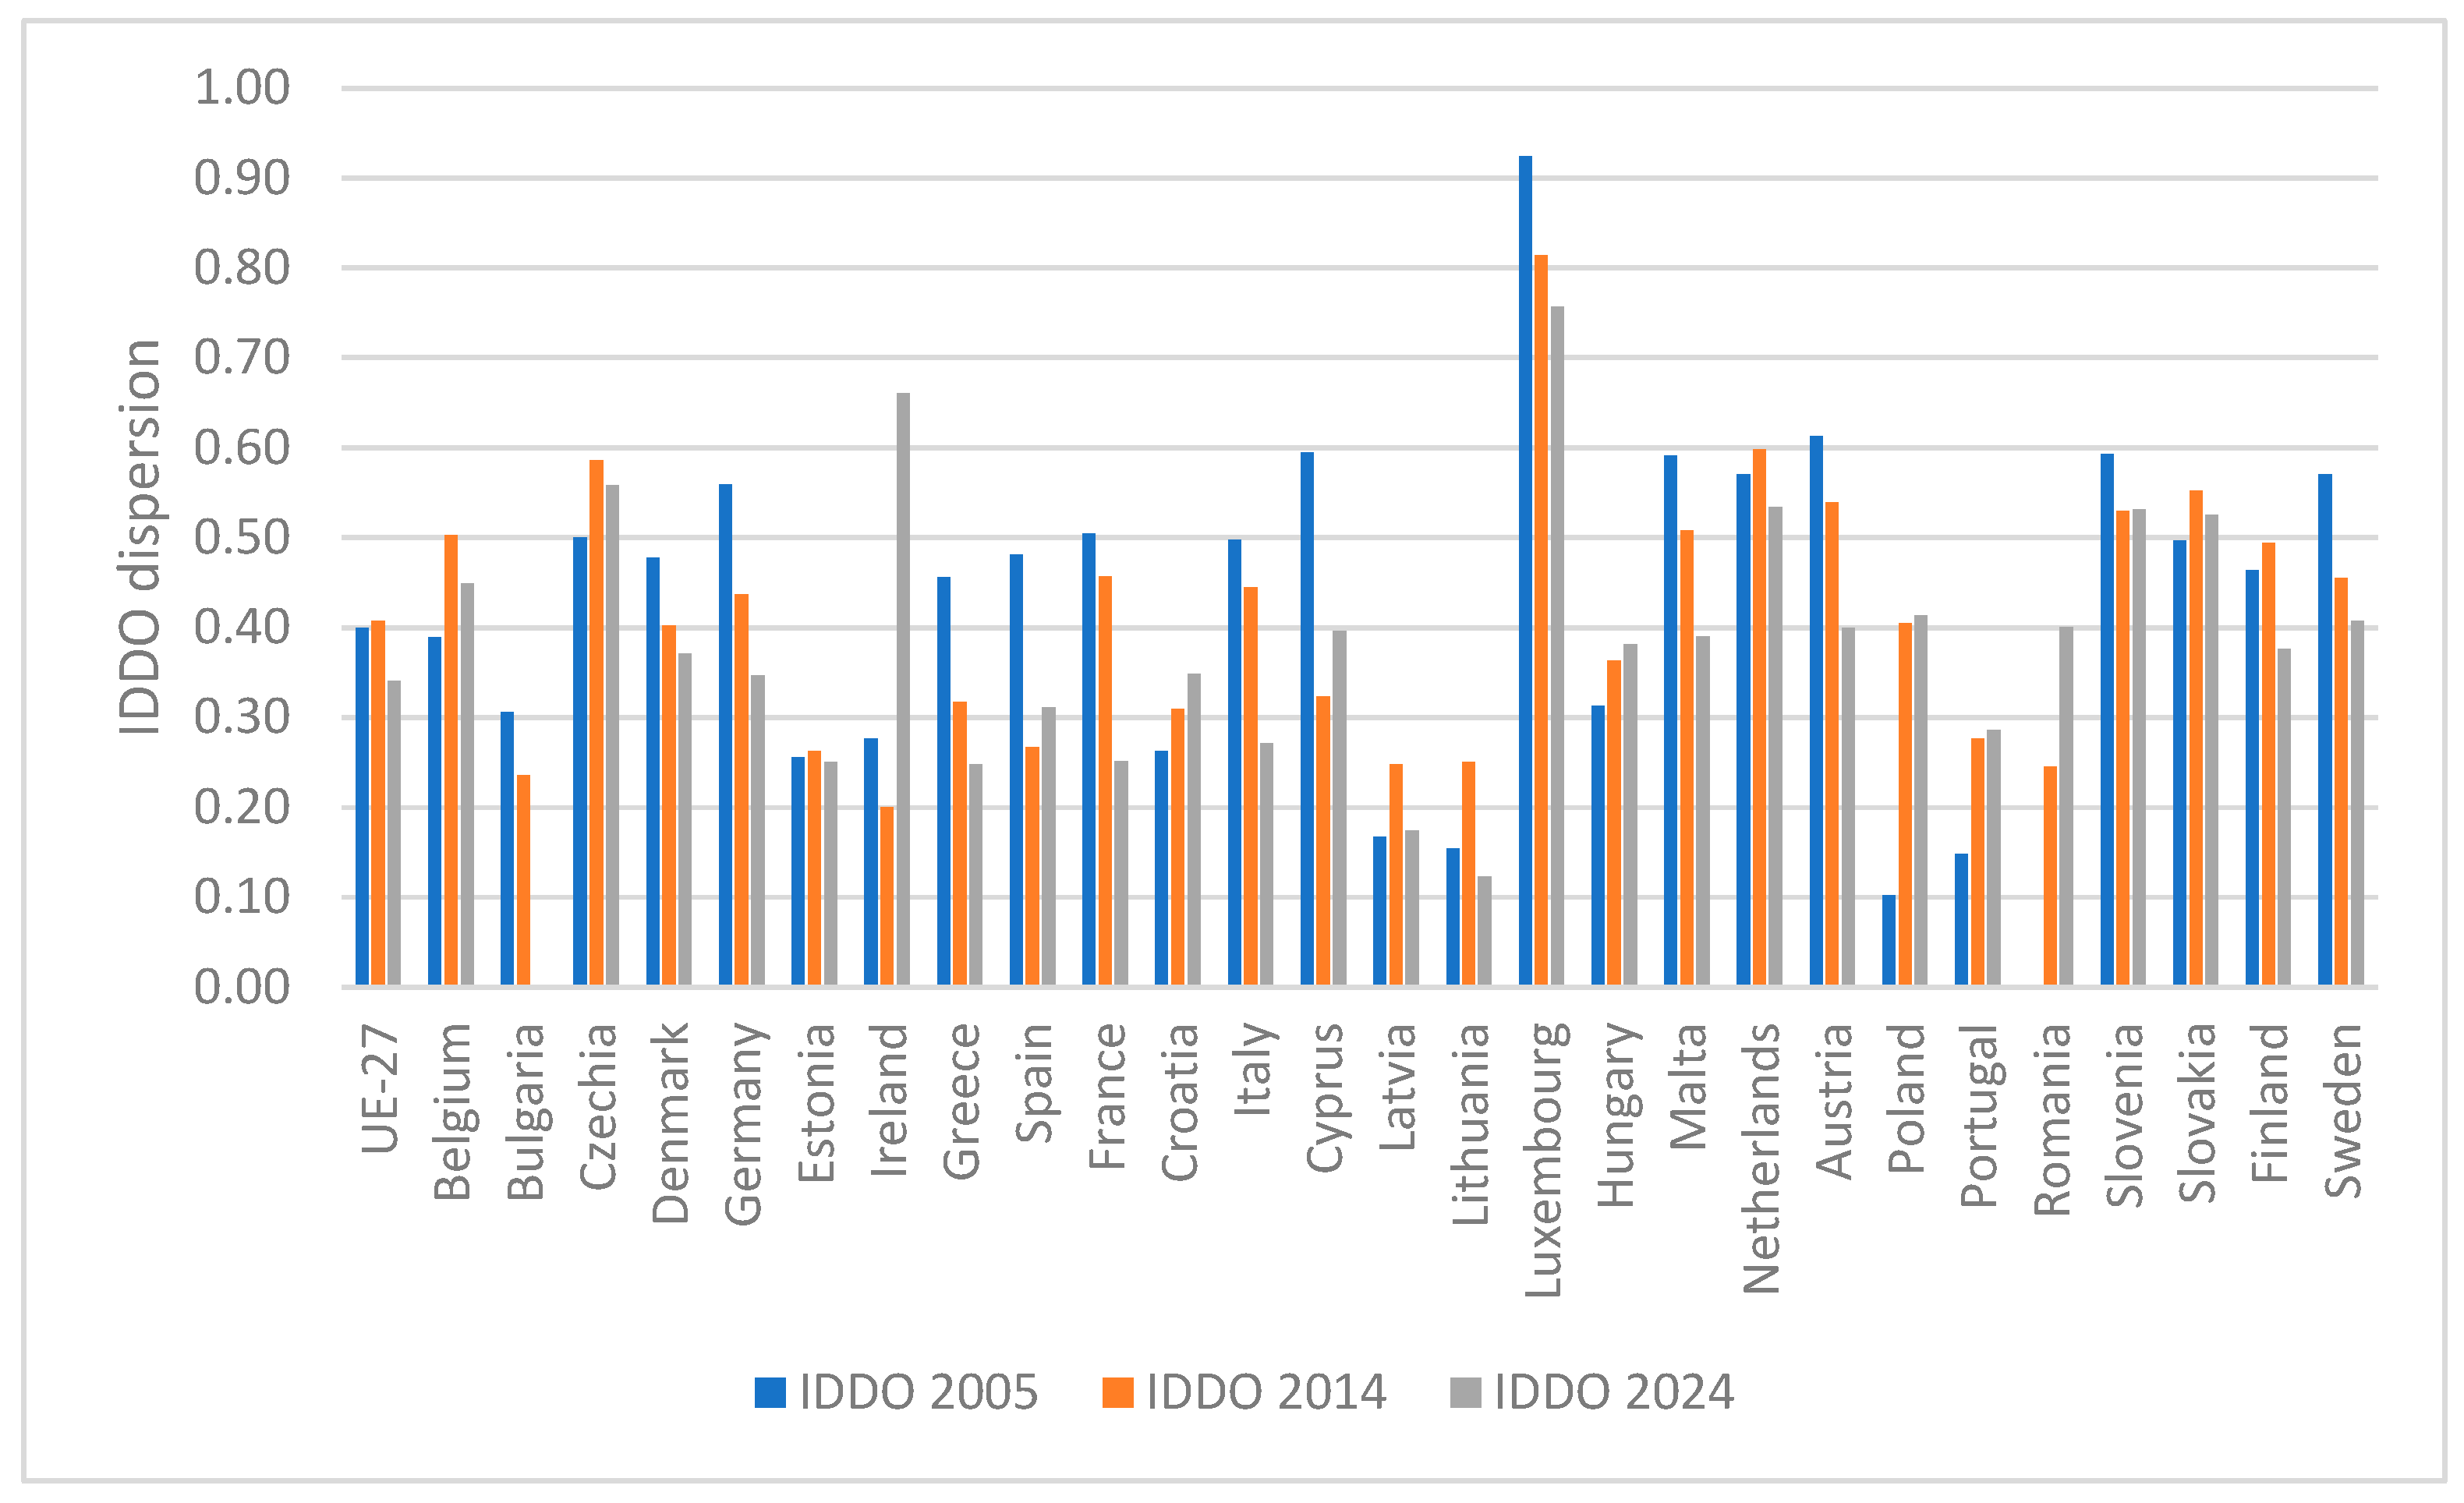
Figure 2.
Typological matrix of the average IDDO (2005-2024).
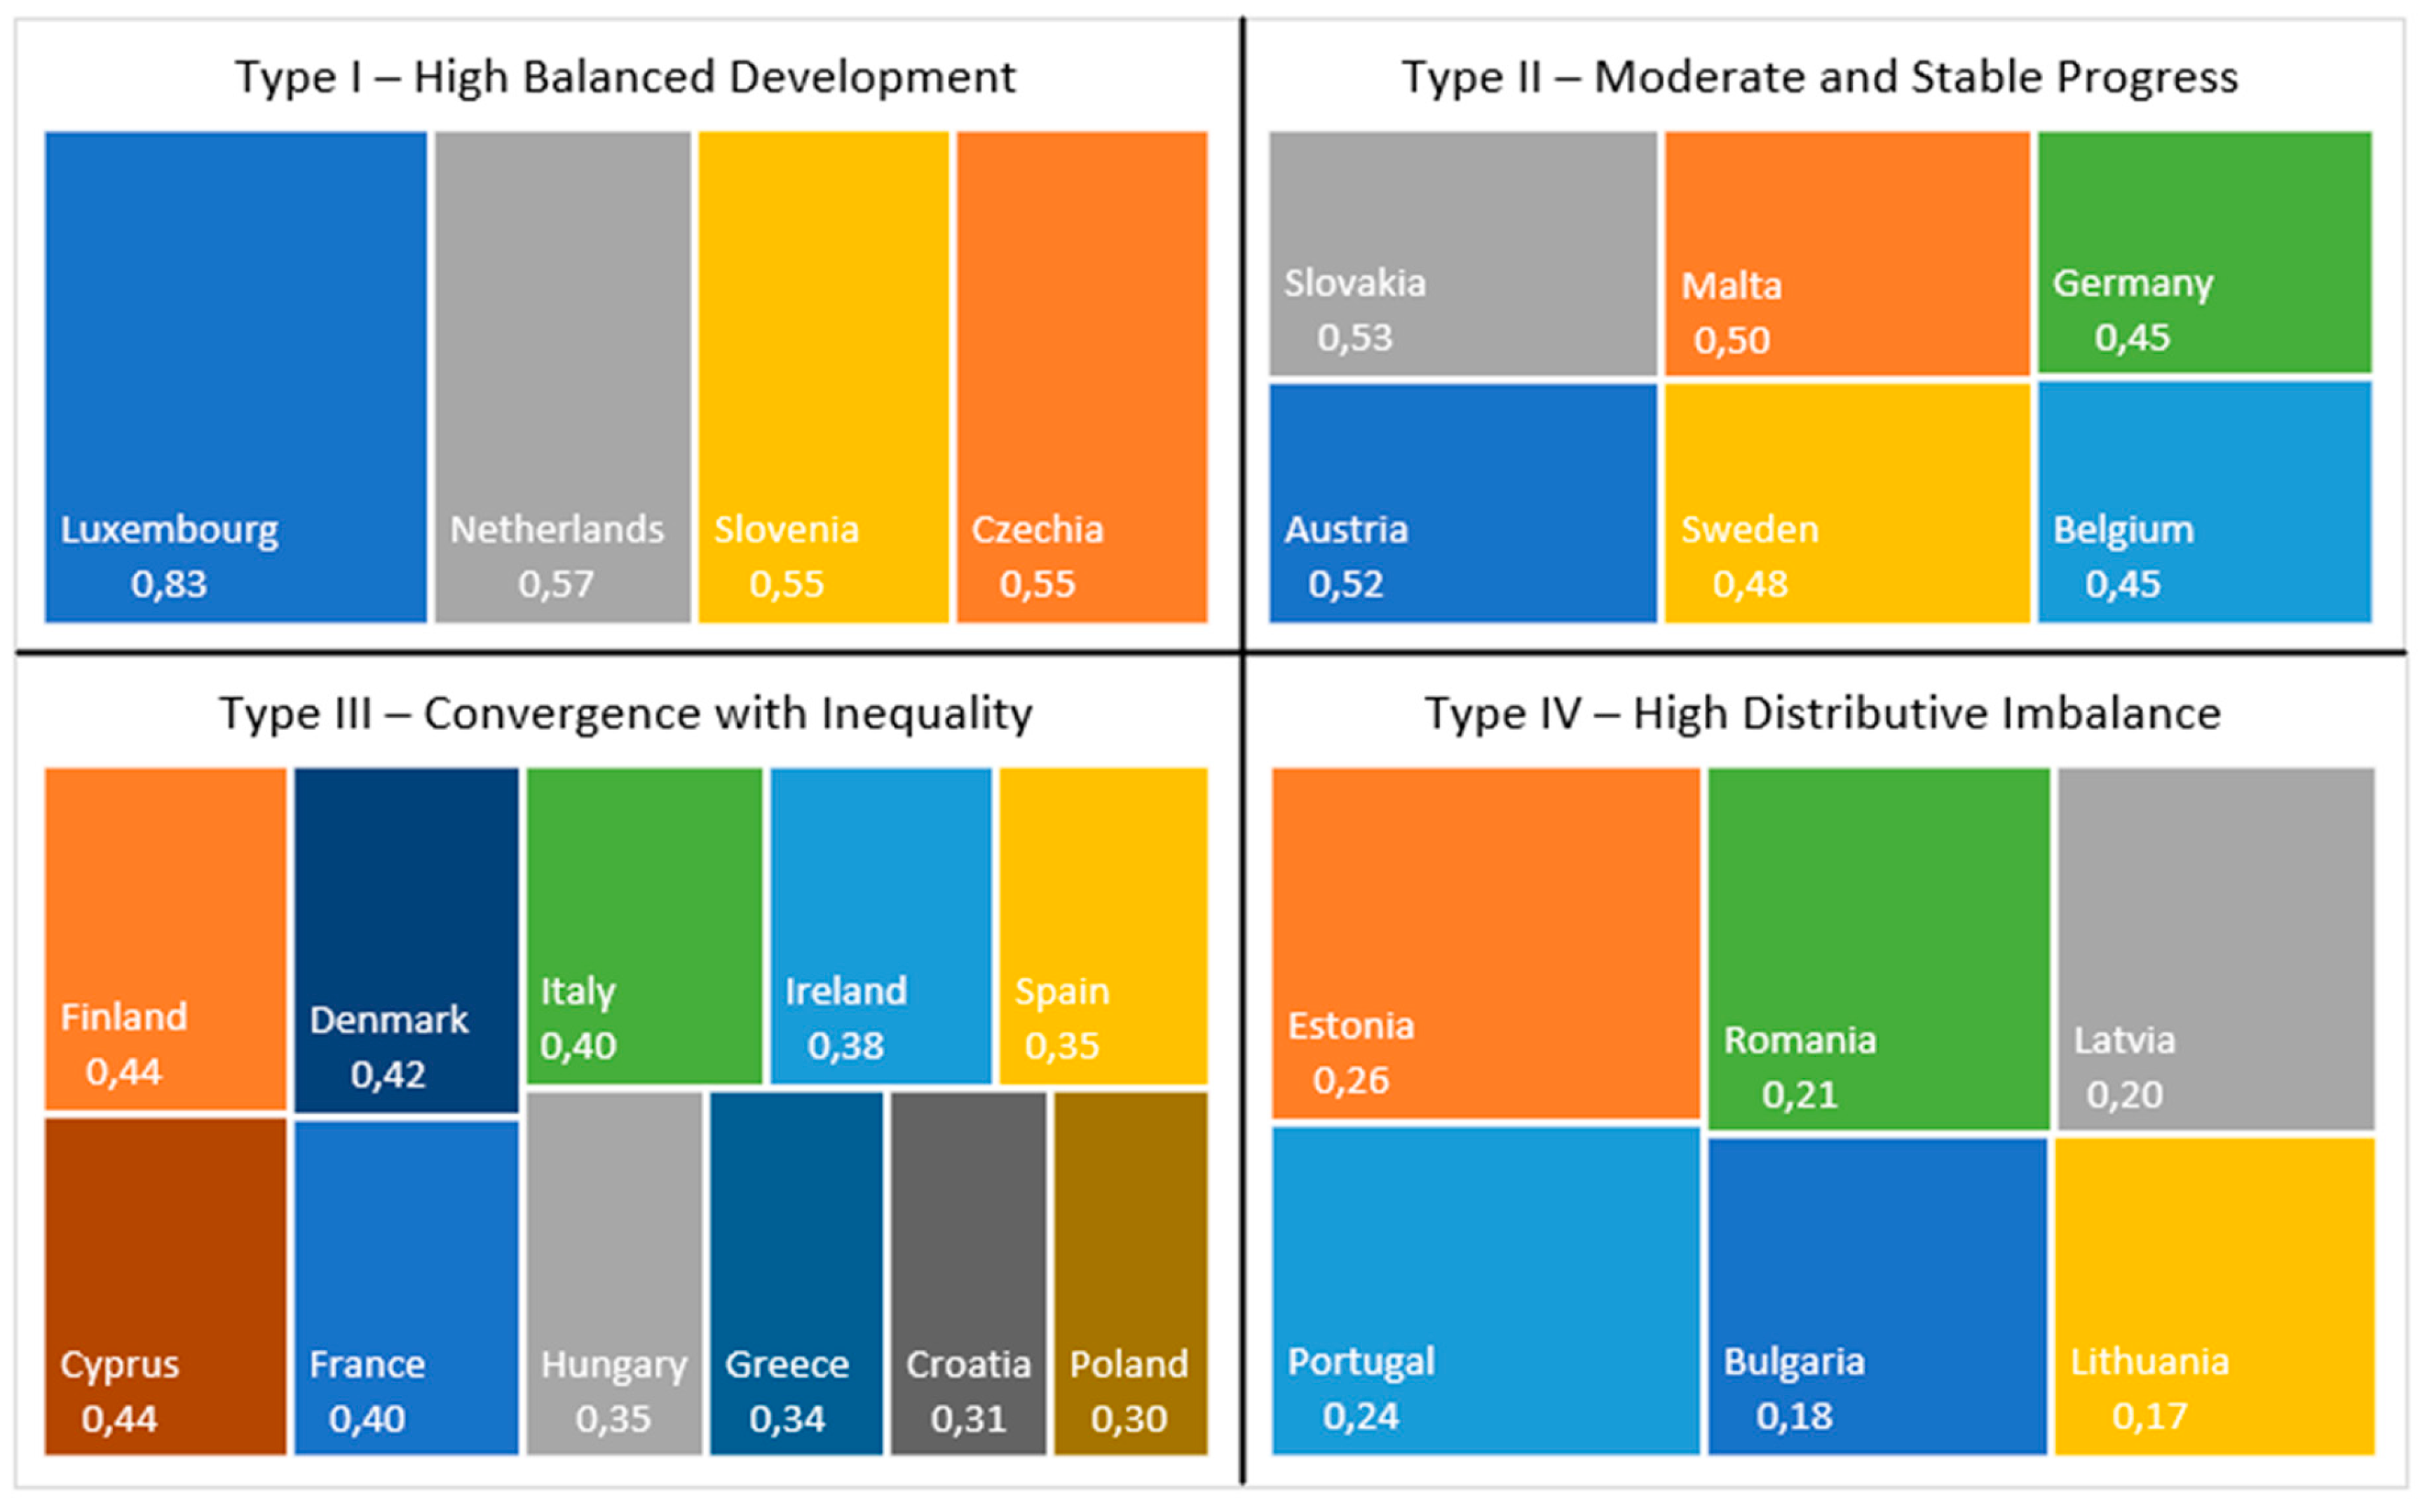
Figure 3.
Map of the dispersion of average IDDO (2005-2024) in EU-27 countries.
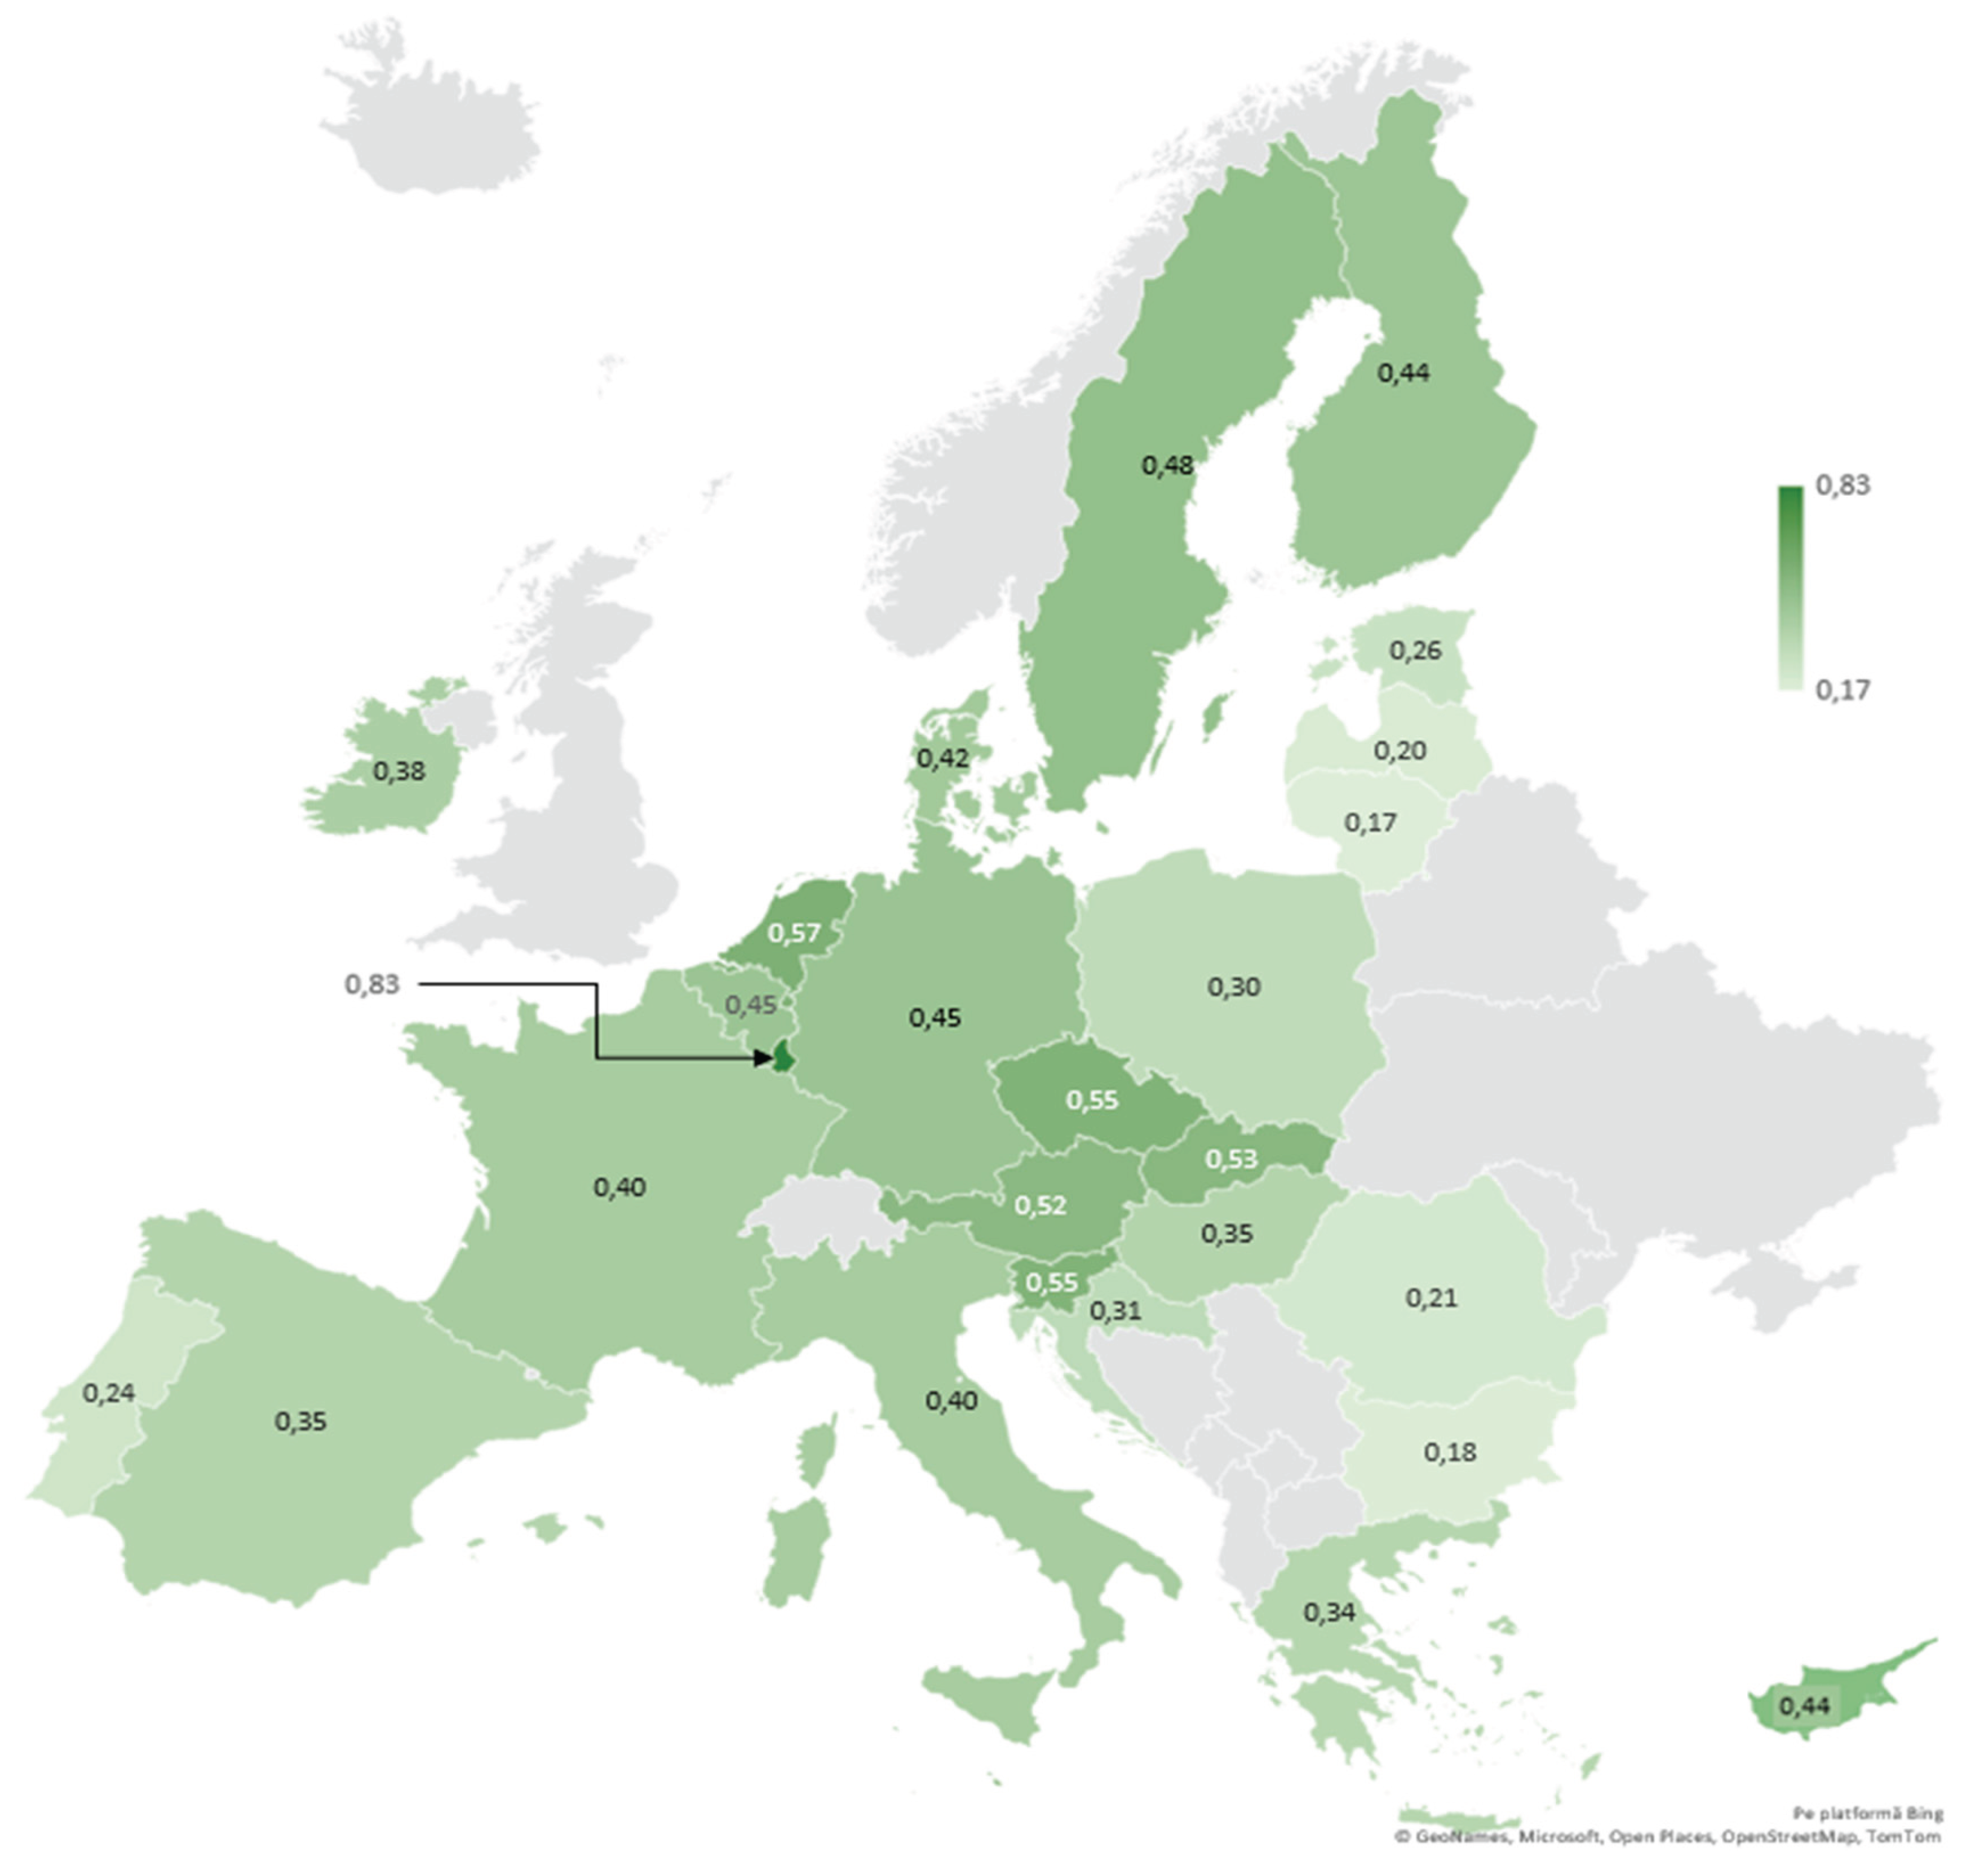

Table 1.
Primary Data Sources.
| Component | Primary Source | Measurement | Notes |
|---|---|---|---|
| GDP per capita (PPS) | Eurostat – TEC00114* and STAT/07/179**$(accessed on 5 June 2025) | Volume indices of real expenditure per capita (PPS_EU27=100) | Purchasing Power Standard (PPS) facilitates meaningful cross-country comparisons. Values in PPS are derived by adjusting current-price national currency aggregates using the Purchasing Power Parity (PPP) index. |
| Gini coefficient of equivalized disposable income before social transfers (pensions excluded) | Eurostat – ILC_DI12C$(accessed on 5 June 2025) | Scale from 0 to 100 | Demographically adjusted and excludes pensions. This specific measure reflects pre-transfer income inequality, capturing disparities based on market incomes (e.g., wages, private investments). It is the official Eurostat indicator for income inequality under the Europe 2020 strategy and SDG monitoring. |
Note: indicate data sources * for 2014 and 2024, and ** for 2005.
Table 2.
Typological Interpretation of the IDDO.
| Type | IDDO Range | Characteristics |
|---|---|---|
| Type I– High Equity & High Growth | IDDO ≥ 0.55 | Balanced development: high prosperity and social inclusion – the ideal scenario |
| Type II– High Growth & Low Equity | 0.45 ≤ IDDO < 0.54 | Growth-oriented trajectory with polarization – growth-biased configuration |
| Type III– Low Growth & Moderate Equity | 0.30 ≤ IDDO < 0.44 | Resilient equity amid weak economic performance – residual welfare scenario |
| Type IV – Low Growth & Low Equity | IDDO < 0.29 | Dual vulnerability: economic and social fragility – polarized underdevelopment |
Table 3.
Evolution of GDP per capita (PPS), Gini coefficient (before social transfers), and IDDO score in EU-27 countries: 2005–2024.
Table 3.
Evolution of GDP per capita (PPS), Gini coefficient (before social transfers), and IDDO score in EU-27 countries: 2005–2024.
| Country | GDP/capita (PPS) | Gini | Normalized GDP | Inverse Normalized Gini | IDDO | Average IDDO | ||||||||||
| 2005 | 2014 | 2024● | 2005 | 2014 | 2024 | 2005 | 2014 | 2024 | 2005 | 2014 | 2024 | 2005 | 2014 | 2024 | 2005-2024 | |
| EU - 27 | 100 | 100 | 100 | 36.3 | 36.1 | 34.4 | 0.28 | 0.22 | 0.19 | 0.52 | 0.59 | 0.49 | 0.40 | 0.41 | 0.34 | 0.38 |
| Belgium | 121 | 121 | 117 | 37.7 | 34.5 | 32.6 | 0.37 | 0.31 | 0.29 | 0.40 | 0.69 | 0.61 | 0.39 | 0.50 | 0.45 | 0.45 |
| Bulgaria | 35 | 48 | 66 | 35.1# | 38 | 41.7 | 0.00 | 0.00 | 0.00 | 0.61 | 0.47 | 0.00 | 0.31 | 0.24 | 0.00 | 0.18 |
| Czechia | 77 | 88 | 91 | 32.5 | 29.6 | 27.1 | 0.18 | 0.17 | 0.14 | 0.82 | 1.00 | 0.97 | 0.50 | 0.59 | 0.56 | 0.55 |
| Denmark | 127 | 128 | 128 | 35.8 | 38.2 | 35.9 | 0.40 | 0.34 | 0.35 | 0.56 | 0.46 | 0.39 | 0.48 | 0.40 | 0.37 | 0.42 |
| Germany | 115 | 128 | 115 | 33.1 | 37.1 | 35.5 | 0.35 | 0.34 | 0.28 | 0.77 | 0.53 | 0.41 | 0.56 | 0.44 | 0.35 | 0.45 |
| Estonia | 63 | 78 | 79 | 37.9 | 39.2 | 35.3 | 0.12 | 0.13 | 0.07 | 0.39 | 0.40 | 0.43 | 0.26 | 0.26 | 0.25 | 0.26 |
| Ireland | 144 | 141 | 211 | 41.8 | 45.5 | 34.3 | 0.47 | 0.40 | 0.83 | 0.08 | 0.00 | 0.49 | 0.28 | 0.20 | 0.66 | 0.38 |
| Greece | 97 | 71 | 70 | 34.7 | 37 | 34.6 | 0.27 | 0.10 | 0.02 | 0.64 | 0.53 | 0.47 | 0.46 | 0.32 | 0.25 | 0.34 |
| Spain | 103 | 90 | 92 | 34.4 | 39.9 | 34.6 | 0.30 | 0.18 | 0.15 | 0.67 | 0.35 | 0.47 | 0.48 | 0.27 | 0.31 | 0.35 |
| France | 112 | 108 | 99 | 34.3 | 35.1 | 37 | 0.33 | 0.26 | 0.19 | 0.67 | 0.65 | 0.31 | 0.50 | 0.46 | 0.25 | 0.40 |
| Croatia | 50 | 60 | 77 | 37### | 36.5 | 32.2 | 0.07 | 0.05 | 0.06 | 0.46 | 0.57 | 0.63 | 0.26 | 0.31 | 0.35 | 0.31 |
| Italy | 105 | 98 | 98 | 34.1 | 34.8 | 36.3 | 0.30 | 0.22 | 0.18 | 0.69 | 0.67 | 0.36 | 0.50 | 0.44 | 0.27 | 0.40 |
| Cyprus | 93 | 81 | 95 | 31 | 37.5 | 32.3 | 0.25 | 0.14 | 0.17 | 0.94 | 0.50 | 0.63 | 0.59 | 0.32 | 0.40 | 0.44 |
| Latvia | 50 | 61 | 71 | 39.4 | 38.5 | 36.9 | 0.07 | 0.06 | 0.03 | 0.27 | 0.44 | 0.32 | 0.17 | 0.25 | 0.17 | 0.20 |
| Lithuania | 53 | 75 | 87 | 39.9 | 39.4 | 39.8 | 0.08 | 0.12 | 0.12 | 0.23 | 0.38 | 0.13 | 0.15 | 0.25 | 0.12 | 0.17 |
| Luxembourg | 265 | 280 | 241 | 32.1 | 35.5 | 34 | 1.00 | 1.00 | 1.00 | 0.85 | 0.63 | 0.51 | 0.92 | 0.81 | 0.76 | 0.83 |
| Hungary | 64 | 69 | 77 | 36.5 | 35.4 | 31.2 | 0.13 | 0.09 | 0.06 | 0.50 | 0.64 | 0.70 | 0.31 | 0.36 | 0.38 | 0.35 |
| Malta | 77 | 94 | 109 | 30.2 | 32.5 | 33.7 | 0.18 | 0.20 | 0.25 | 1.00 | 0.82 | 0.53 | 0.59 | 0.51 | 0.39 | 0.50 |
| Netherlands | 131 | 133 | 135 | 33.7 | 32.3 | 31.6 | 0.42 | 0.37 | 0.39 | 0.72 | 0.83 | 0.67 | 0.57 | 0.60 | 0.53 | 0.57 |
| Austria | 129 | 129 | 115 | 32.5 | 33.9 | 33.9 | 0.41 | 0.35 | 0.28 | 0.82 | 0.73 | 0.52 | 0.61 | 0.54 | 0.40 | 0.52 |
| Poland | 51 | 68 | 79 | 41.1 | 34 | 30.4 | 0.07 | 0.09 | 0.07 | 0.13 | 0.72 | 0.75 | 0.10 | 0.40 | 0.41 | 0.30 |
| Portugal | 76 | 77 | 82 | 41.3 | 38.7 | 34.5 | 0.18 | 0.13 | 0.09 | 0.12 | 0.43 | 0.48 | 0.15 | 0.28 | 0.29 | 0.24 |
| Romania | 35 | 55 | 79 | 42.8## | 38.2 | 30.8 | 0.00 | 0.03 | 0.07 | 0.00 | 0.46 | 0.73 | 0.00 | 0.24 | 0.40 | 0.21 |
| Slovenia | 87 | 82 | 91 | 30.7 | 31 | 27.9 | 0.23 | 0.15 | 0.14 | 0.96 | 0.91 | 0.92 | 0.59 | 0.53 | 0.53 | 0.55 |
| Slovakia | 61 | 78 | 75 | 31.7 | 30 | 26.7 | 0.11 | 0.13 | 0.05 | 0.88 | 0.97 | 1.00 | 0.50 | 0.55 | 0.53 | 0.53 |
| Finland | 115 | 111 | 103 | 35.5 | 34.1 | 33.6 | 0.35 | 0.27 | 0.21 | 0.58 | 0.72 | 0.54 | 0.46 | 0.49 | 0.38 | 0.44 |
| Sweden | 124 | 125 | 114 | 33.3 | 36.3 | 33.6 | 0.39 | 0.33 | 0.27 | 0.75 | 0.58 | 0.54 | 0.57 | 0.46 | 0.41 | 0.48 |
Note: ●provisional; # data related to 2006; ## data related to 2007; ### data related to 2010.
Disclaimer/Publisher’s Note: The statements, opinions and data contained in all publications are solely those of the individual author(s) and contributor(s) and not of MDPI and/or the editor(s). MDPI and/or the editor(s) disclaim responsibility for any injury to people or property resulting from any ideas, methods, instructions or products referred to in the content. |
© 2025 by the authors. Licensee MDPI, Basel, Switzerland. This article is an open access article distributed under the terms and conditions of the Creative Commons Attribution (CC BY) license (http://creativecommons.org/licenses/by/4.0/).
Copyright: This open access article is published under a Creative Commons CC BY 4.0 license, which permit the free download, distribution, and reuse, provided that the author and preprint are cited in any reuse.


