
Submitted:
12 June 2025
Posted:
13 June 2025
You are already at the latest version
Abstract
Identifying immunologic predictors of clinical response remains an unmet need in the era of biologic therapy for psoriasis. Super responders (SRs), defined as patients achieving complete skin clearance within weeks of treatment initiation, represent an emerging clinical endotype; however, their immunological underpinnings are poorly understood. We conducted a prospective observational study to characterize serum cytokine profiles associated with SR status in biologic-naïve patients with moderate-to-severe plaque psoriasis treated with secukinumab, an IL-17A inhibitor. Twenty-eight patients were enrolled and stratified at week 12 into SR (PASI = 0; n = 9) and non-super responder (NSR; PASI > 0; n = 19) groups. Serum concentrations of 19 cytokines were analyzed at baseline and after 12 weeks of treatment. SRs displayed a distinct immunological signature characterized by significantly higher IL-13 and lower IL-18 baseline levels compared to NSRs (p = 0.002 and p = 0.007, respectively), alongside reduced baseline monocyte counts. L1-regularized logistic regression confirmed IL-13 and IL-18 as strong independent predictors of SR status (AUC = 0.91). Moreover, the IL-18/IL-13 ratio emerged as a highly discriminative biomarker (p = 0.00001, AUC = 0.86). Notably, SRs exhibited a more pronounced decline in IL-18 and IL-23 during treatment. Our findings provide novel insights into the immunopathogenesis of super response and suggest that an immunological milieu favoring Th2 polarization may promote superior outcomes with IL-17A blockade. Incorporating IL-13, IL-18, and their ratio into clinical algorithms may facilitate precision-guided biologic therapy in psoriasis.
Keywords:
psoriasis
; super responders
; IL-18
; IL-13
; biomarkers
; precision medicine
; biologic therapy
; secukinumab
Introduction
Psoriasis is a chronic, immune-mediated inflammatory dermatosis affecting approximately 2–3% of the global population. In recent years, a growing body of evidence has established the central role of the interleukin (IL)-23/Th17 axis in its pathogenesis. IL-23 was first characterized in 2000 as a heterodimer composed of a shared IL-12/23p40 subunit and a unique p19 subunit that is exclusive to IL-23 [1]. Functionally, IL-23 acts as a pivotal cytokine that bridges the innate and adaptive arms of the immune system. It exerts pleiotropic effects by acting on T lymphocytes and innate immune cells, including natural killer cells, macrophages, dendritic cells, and innate lymphoid cells. It plays a crucial role in the development, maintenance, and expansion of Th17 cells—key effectors in psoriatic inflammation—by promoting the production of IL-17A, IL-17F, and tumor necrosis factor (TNF). These cytokines are instrumental in sustaining epidermal hyperplasia and dermal inflammation [2,3]
Therapeutic strategies targeting this immunological cascade, particularly monoclonal antibodies directed against IL-17 and IL-23, have dramatically improved the management of moderate-to-severe plaque psoriasis. Clinical trials and real-world studies have demonstrated that a substantial proportion of patients achieve complete (PASI 100) or near-complete (PASI 90) skin clearance within the first months of treatment [4,5]. However, treatment efficacy is not universal. It is estimated that up to 15% of patients receiving IL-17 inhibitors may require a therapeutic switch within one year due to inadequate response or secondary loss of efficacy [6].
Despite the availability of multiple biologic classes, treatment decisions remain largely empirical. To date, no validated biomarkers or immunological predictors are available to guide the selection of the most effective biologic for a given patient. In clinical practice, drug choice is typically influenced by logistical, regulatory, or economic considerations rather than mechanistic precision. Consequently, therapeutic decisions often follow a trial-and-error approach, which increases healthcare costs and can delay optimal disease control, contributing to patient dissatisfaction [5,6].
In this context, increasing attention has been devoted to a distinct subgroup of patients termed super responders (SRs). These individuals achieve complete disease remission (PASI = 0) within a short period of initiating biologic therapy—typically within 12 to 16 weeks [7]. Several reports suggest that SRs may represent a discrete clinical endotype with unique phenotypic and potentially immunologic characteristics. Importantly, achieving SR status is not only associated with superior short-term outcomes, but also with prolonged drug survival and the potential for reduced dosing frequency or even treatment discontinuation without relapse, which may translate into substantial cost savings [7,8,9].
Previous studies have identified certain clinical predictors of SR status, including younger age, shorter disease duration, lower body mass index (BMI), and bio-naïve treatment history [10,11,12,13]. However, the immunological profile associated with this highly favorable response remains largely unexplored.
The aim of the present study is to perform an in-depth immunological characterization of patients with moderate-to-severe psoriasis treated with secukinumab, an IL-17A inhibitor, stratified by super responder (SR) and non-super responder (NSR) status. By analyzing serum cytokine profiles before and after treatment, we seek to identify immunologic signatures and potential predictive biomarkers associated with rapid and complete clinical response.
Materials and Methods
Study Design and Participants
This prospective observational study enrolled adult patients with moderate-to-severe plaque psoriasis who initiated their first biological therapy with secukinumab. Eligibility criteria included a Psoriasis Area and Severity Index (PASI) score ≥10 and a documented lack of response, contraindication, or intolerance to at least two prior conventional systemic therapies (i.e., cyclosporine, acitretin, or methotrexate). Importantly, only patients in whom the interval between discontinuation of prior conventional systemic therapy and initiation of biologic treatment was at least 12 weeks were eligible for inclusion, to minimize potential confounding effects of previous treatments on immunologic parameters. The study was approved by the Bioethics Committee of the Medical University of Silesia in Katowice (approval number: BNW/NWN/0052/KB1/31/II/24), and written informed consent was obtained from all participants.
The following exclusion criteria were applied: age <18 years, erythrodermic psoriasis, pustular psoriasis, psoriatic arthritis, isolated nail psoriasis, genital involvement, active infections including HIV, HCV, HBV, a positive QuantiFERON-TB Gold test, and coexisting autoimmune or inflammatory disorders, including inflammatory bowel disease, rheumatoid arthritis, or spondyloarthropathies.
Treatment Regimen
Secukinumab was administered according to the Summary of Product Characteristics (SmPC): 300 mg subcutaneously at weeks 0, 1, 2, 3, and 4, followed by 300 mg every four weeks thereafter.
Data Collection and Sample Handling
At baseline (prior to treatment initiation), peripheral blood samples were collected for routine laboratory analysis and cytokine measurements. Plasma samples were stored at –80 °C until analysis. Clinical and demographic data were also collected, including age, sex, body mass index (BMI), psoriasis duration, PASI score, Dermatology Life Quality Index (DLQI), and type of previous conventional therapy. At week 12 of treatment, response to secukinumab was assessed using the PASI score. Based on this assessment, patients were stratified into two subgroups: (1) Super responders (SR) – PASI = 0 at week 12; (2) Non-super responders (NSR) – PASI > 0 at week 12. Blood samples were recollected at this time point for repeated cytokine quantification. Statistical analysis was subsequently conducted between the SR and NSR subgroups.
Cytokine Quantification
Serum concentrations of the following cytokines were measured both at baseline and after 12 weeks of treatment: IL-2, IL-4, IL-5, IL-6, IL-9, IL-10, IL-12, IL-13, IL-15, IL-17, IL-18, IL-22, IL-23, TNF-α, IFN-α, IFN-γ, IL-1α, and IL-1β. Measurements were performed using a Luminex® High Performance Assay (R&D Systems, Bio-Techne). The lower limits of detection (LOD) for each analyte were as follows:
0.1 pg/mL for IL-2, IL-4, IL-5, IL-6, IL-9, IL-10, IL-12, IL-13, IL-18, IL-22, TNF-α, IFN-α, , IL-1α, and IL-1β; 0.5 pg/mL for IL-15 and IL-17; 7 pg/mL for IFN-γ and 34 pg/mL for IL-23.
Statistical Analysis
Statistical analyses were conducted using R software (version 4.3.2; R Foundation for Statistical Computing, Vienna, Austria). Categorical variables were expressed as absolute numbers and percentages and compared between groups using Fisher’s exact test. Continuous variables were summarized as medians with interquartile ranges (IQR) and compared using the Mann–Whitney U test. Changes in cytokine concentrations between baseline and post-treatment were analyzed by calculating delta values (post-treatment minus baseline). Between-group comparisons of delta values were performed using the Mann–Whitney U test.
Associations between clinical parameters (including PASI and DLQI scores) and cytokine concentrations were evaluated using Spearman’s rank correlation coefficient. Correlation matrices were visualized with heatmaps. Statistical significance was set at p < 0.05.
To identify cytokines predictive of super response (PASI = 0 at week 12), univariate and multivariate logistic regression models were fitted. Additionally, L1-regularized logistic regression (Lasso) was applied for variable selection using the glmnet package. The discriminative performance of models was assessed by the area under the receiver operating characteristic curve (AUC), computed with the pROC package. Optimal cut-off values for individual cytokines and cytokine ratios were determined based on maximization of Youden’s index.All statistical analyses and visualizations were performed using the stats, glmnet, pROC, and ggplot2 (or pheatmap) packages in R. Two-tailed p-values < 0.05 were considered statistically significant.
Results
Patient Stratification and Baseline Characteristics
Among the 28 patients enrolled in the study, nine achieved complete clinical clearance (PASI = 0) three months after initiating secukinumab treatment and were classified as the super responder group (SR). The remaining patients, who did not reach complete clearance (PASI > 0), were classified as non-super responders (NSR). Patients in the SR group had significantly lower baseline peripheral blood monocyte counts compared to the NSR group (p = 0.03). No significant differences in other clinical or demographic parameters were observed between the two groups (Table 1).
Baseline and Post-Treatment Cytokine Profiles
Prior to treatment, the SR group exhibited significantly higher serum IL-13 levels and significantly lower IL-18 levels compared to the NSR group (p = 0.007 and p = 0.002, respectively; Table 2). After three months of treatment, no statistically significant differences in cytokine concentrations were observed between the groups. Treatment with secukinumab led to a general reduction in serum levels of most analyzed cytokines in both SR and NSR groups. Notably, IL-2 and IL-5 levels decreased following treatment in SR patients, while they increased in NSR patients. In contrast, IL-10 and IL-15 levels increased post-treatment in both groups. A significant reduction in IL-23 was observed exclusively in the SR group.
Comparison of Cytokine Dynamics Between Groups
To determine whether cytokine changes differed significantly between groups, we calculated delta values (post-treatment minus baseline) and compared them between SR and NSR. Among all cytokines, IL-18 showed a statistically significant difference in delta values (p = 0.023), with a more pronounced decrease in the SR group. Although IL-2, IL-5, IL-10, IL-15, and IL-23 did not show statistically significant differences in delta values between groups, their changes followed the same group-specific trends as described above — with reductions primarily observed in the SR group and stable or increasing levels in NSR. In particular, IL-23 levels declined only in the SR group (p = 0.28 for between-group delta comparison; Figure 1).
Predictive Value of Baseline Cytokines
To assess the predictive value of baseline cytokine levels for super response to secukinumab, we performed logistic regression and stratification analysis for IL-13 and IL-18. L1-regularized logistic regression (Lasso) identified both cytokines as relevant predictors, with IL-13 showing a strong positive coefficient (+20.23) and IL-18 a strong negative coefficient (–31.13). The model showed excellent discriminative power, with an area under the ROC curve (AUC) of 0.91. Dichotomization of IL-13 and IL-18 at their respective medians further supported their predictive value. Patients with IL-13 > 0.75 pg/mL had an OR of 28.0 (95% CI: 2.07–379.27) for achieving PASI = 0. Conversely, none of the patients with IL-18 > 0.4 pg/mL achieved complete clearance, resulting in an OR of 0.0 and an undefined confidence interval.
Cytokine-Based Thresholds for Predicting Super Response
We used the fitted Lasso logistic regression model to estimate probabilities of response across observed cytokine values. According to the model, IL-13 ≥ 0.39 pg/mL and IL-18 ≤ 3.90 pg/mL were the optimal thresholds beyond which the likelihood of achieving PASI = 0 exceeded 50%. This combined immunological profile may aid in stratifying patients more likely to benefit from secukinumab.
Correlation Between PASI and Cytokine Concentrations
Baseline PASI scores were positively and significantly correlated with pre-treatment levels of several pro-inflammatory cytokines, including IL-12, IL-9, IL-2, IFN-α, and IL-17 (Figure 1A), suggesting broad immune activation. In contrast, no significant correlations were observed between baseline PASI and Th2-related cytokines such as IL-4, IL-5, or IL-13.
Post-treatment PASI scores were weakly but significantly correlated with post-treatment IL-5 levels (Figure 1B). Additionally, baseline PASI showed significant positive correlations with post-treatment IL-2, IL-9, and IL-23 levels (Figure 2A), while post-treatment PASI correlated positively with baseline IL-18 and IL-13 levels (Figure 2B).
Cytokine Ratios as Predictors of Treatment Response
We also investigated whether cytokine ratios at baseline could predict treatment outcome (Table 3). The IL-18/IL-13 ratio was significantly lower in SR patients than in NSR patients (median 0.49 vs. 3.69, p = 0.00001). Logistic regression modeling confirmed its high discriminative power (AUC = 0.86), with the optimal cut-off at 0.56. Patients with ratios below this value were significantly more likely to achieve PASI = 0. The ratio also showed a moderate inverse correlation with the extent of PASI improvement (r = –0.25). A similar trend was observed for the IL-17/IL-13 ratio, which was also significantly lower in SR than NSR patients at baseline (median 2.47 vs. 13.27, p = 0.0044). This ratio yielded an AUC of 0.89 and an optimal cut-off of 0.44. However, its correlation with PASI improvement was weaker (r = –0.13), suggesting its utility as a binary predictor of response rather than a continuous outcome measure.
Discussion
Super responders (SRs) to biologic therapy in psoriasis are typically defined as patients who achieve complete or nearly complete skin clearance, most commonly operationalized as achieving a Psoriasis Area and Severity Index (PASI) of 0 at a defined timepoint, such as 12 or 16 weeks after treatment initiation [7,8]. In the present study, SRs were defined as patients reaching PASI = 0 at 12 weeks of secukinumab therapy. This phenotype is of high clinical relevance, as SRs not only experience maximal symptomatic relief but also often demonstrate prolonged disease control, improved quality of life, and may require less frequent long-term dosing or treatment switching [9,10,11,12]
Previous studies have identified several clinical and demographic predictors associated with super response to biologic therapies in psoriasis. Younger age, lower body mass index (BMI), shorter disease duration, and non-smoking status have been reported as favorable clinical characteristics linked to a higher likelihood of achieving PASI 0 [12,13,14]. Additionally, patients without psoriatic arthritis and those with lower baseline disease severity or less prior biologic exposure are more likely to exhibit super response [6]. These findings suggest that a less complex or less treatment-refractory disease phenotype may predispose patients to full clinical clearance in response to targeted immunotherapy.
While clinical predictors provide valuable insights into patient stratification, they do not fully capture the underlying immunopathological mechanisms that drive differential treatment responses. To address this gap, we aimed to identify specific immunologic processes associated with the SR phenotype by characterizing cytokine profiles before and after treatment with secukinumab. This approach offers a deeper understanding of the immune signatures that may predict or accompany complete disease resolution and supports the advancement of precision-guided therapeutic strategies in psoriasis.
It is important to note that relatively few studies to date have specifically explored immunologic biomarkers of treatment response in psoriasis. Most available studies have focused on analyzing serum cytokine levels and their changes following various biologic therapies [5,15]. The smallest patient cohorts investigated in this context have predominantly involved anti-IL-17 therapies [16]. Even fewer studies have examined immunologic biomarkers specifically associated with the super response phenotype [10]. Our study therefore contributes valuable and novel data to this evolving field.
The relevance of our findings becomes particularly apparent when considering the role of IFN-γ in the pathogenesis of psoriasis and the response to biologic therapy. IFN-γ is a key cytokine implicated in driving neutrophil chemotaxis to the skin, promoting vascular proliferation, and inducing keratinocyte hyperproliferation within psoriatic lesions [17]. Moreover, IFN-γ enhances the function of Th17 cells and acts synergistically with IL-17 to amplify cutaneous inflammation [18]. In a recent study, Hsieh et al. demonstrated that serum IFN-γ levels positively correlated with PASI scores and that reductions in IFN-γ were associated with clinical improvement in biologically treated patients [15]. Thus, both IFN-γ levels and their dynamic changes appear to represent meaningful biomarkers for predicting biologic therapy outcomes.
In contrast to these prior findings, we did not observe significant correlations between IFN-γ levels and PASI scores, either at baseline or post-treatment. We can only speculate that this discrepancy may reflect the prior immunosuppressive exposure to cyclosporine and/or methotrexate in our patient cohort, which may have modulated the IFN-γ axis prior to biologic therapy initiation.
Interestingly, we also observed a significant negative correlation between baseline IFN-γ and baseline IL-4 levels—a cytokine central to the Th2 response. This finding may suggest that imbalances between Th1 and Th2 pathways contribute to psoriasis pathogenesis and disease severity. Further studies are warranted to explore how this immunological balance influences therapeutic outcomes.
In this context, IL-18 emerges as another cytokine of particular interest. IL-18 is produced by various cell types, including dendritic cells, macrophages, and keratinocytes [19]. This cytokine stimulates the production of IFN-γ and, in cooperation with IL-12, IL-15, and IL-23, promotes the differentiation of naïve T lymphocytes into Th1 and Th17 effector cells [20]. Elevated serum IL-18 levels have been reported in patients with psoriasis compared to healthy individuals [21]. Notably, these levels show a positive correlation with disease severity, as measured by the PASI. Animal model studies have demonstrated that IL-18 is a key mediator driving psoriatic epidermal hyperplasia and sustaining chronic psoriatic inflammation [19]. Of particular interest, IL-18 production by keratinocytes occurs constitutively, independent of active inflammation [19]. However, increased secretion of this cytokine is triggered by inflammasome activation.
Recent studies have shown that IL-18 levels remain significantly elevated in psoriasis patients even after clinically effective therapy [5]. This observation suggests that, in contrast to IL-17, IL-23, or TNF-α, IL-18 may serve as a more stable marker of the chronic inflammatory phenotype in psoriasis.
In our study, we demonstrate for the first time that lower baseline serum IL-18 levels in patients with psoriasis may predict an excellent clinical response to biologic therapy with secukinumab, defined as complete skin clearance (PASI = 0) at three months. This finding raises the hypothesis that higher baseline IL-18 levels and persistent IL-18 activity may reflect a deeper inflammatory phenotype or ongoing inflammasome activation in patients with suboptimal treatment responses. Further research is warranted to validate these observations. In particular, it would be valuable to determine whether elevated baseline IL-18 activity might predict future secondary loss of response to biologic therapy in psoriasis.
Our findings also align with the emerging understanding that psoriasis is not solely driven by Th1 and Th17 responses, but also involves the Th2 axis. Similar to the findings reported by Hsieh et al. [15], we observed that an imbalance between Th1 and Th2 responses may exacerbate psoriatic symptoms. As proposed previously, an effective therapeutic strategy in psoriasis may not only involve suppression of Th1 and Th17 responses, but also aim to restore immune balance by enhancing Th2-mediated pathways, particularly through cytokines such as IL-4 and IL-13 [22,23].
Supporting this concept, we observed that super responders (SR) exhibited significantly higher baseline serum levels of IL-13 compared to non-super responders (NSR). Moreover, the IL-18/IL-13 ratio demonstrated greater discriminatory power between SR and NSR than the individual cytokine levels alone. This finding further underscores the potential importance of achieving immune balance between Th1 and Th2 responses in determining super responder status.
This study has certain limitations that should be acknowledged. First, although the patient cohort was relatively small, it represents one of the larger prospective cohorts to date focusing exclusively on patients treated with a single biologic agent—secukinumab—thus ensuring a high level of treatment homogeneity and methodological consistency. Second, all patients were recruited from a single clinical center. While this provided uniform clinical management and data collection, future multicenter studies would be valuable to confirm the generalizability of our findings across broader and more diverse patient populations.
Third, differences in national treatment guidelines and eligibility criteria for initiating biologic therapy should be considered when comparing results across studies. In Poland, the initiation of biologic treatment requires documented failure of at least three months of at least two conventional systemic therapies. Although an appropriate wash-out period was implemented, prior exposure to agents such as cyclosporine or methotrexate may have influenced immune pathways and cytokine profiles at baseline and during therapy.
Finally, our analysis focused on treatment with secukinumab, an IL-17A inhibitor. While the insights gained provide valuable information on the immunologic correlates of response to this agent, further comparative studies evaluating immunologic predictors of response across different biologic classes will be important to determine the broader applicability of our findings.
Conclusions
This study identified distinct immunologic signatures that may predict super response to secukinumab in patients with moderate-to-severe psoriasis. Lower baseline IL-18 levels, higher IL-13 levels, and a favorable IL-18/IL-13 ratio emerged as promising biomarkers associated with complete skin clearance. Our findings also highlight the relevance of immune balance between Th1 and Th2 pathways in modulating treatment outcomes.
Importantly, these results expand the current understanding of cytokine dynamics in biologic therapy and offer a foundation for developing precision-guided treatment strategies. Although further validation in larger, multicenter cohorts and across different biologic classes is required, integrating such immunologic markers into clinical practice holds the potential to improve patient stratification, optimize therapeutic decision-making, and ultimately enhance long-term disease control in psoriasis.
Author Contributions
Conceptualization, DBZ, MP; Methodology, DZB, MP, AB; Formal analysis, DBZ, MP, KZH; Investigation, DBZ, EH, AB; Data curation, DBZ, MP, AB, EH; Writing—original draft preparation, DBZ, MP, KZH; Writing—review and editing, DBZ, MP, EH, AB; Supervision, MP, AB; Project administration, MP, AB.
Funding
This research received no external funding.
Institutional Review Board Statement
The study was conducted in accordance with the Declaration of Helsinki, and approved by the Ethics Committee of the Medical University of Silesia, Katowice, Poland (approval number: BNW/NWN/0052/KB1/31/II/24).
Informed Consent Statement
Informed consent was obtained from all subjects involved in the study.
Data Availability Statement
The data that support the findings of this study are available from the corresponding author upon reasonable request.
Conflicts of Interest
The authors declare no conflict of interest.
References
- Oppmann, B.; Lesley, R.; Blom, B.; Timans, J.C.; Xu, Y.; Hunte, B.; Vega, F.; Yu, N.; Wang, J.; Singh, K.; Zonin, F.; Hakimi, J.; Moore, K.W.; Rennick, D.; de Waal-Malefyt, R.; Bazan, J.F.; Kastelein, R.A. Novel p19 protein engages IL-12p40 to form a cytokine, IL-23, with biological activities similar to and distinct from IL-12. Immunity 2000, 13, 715–725. [Google Scholar] [CrossRef] [PubMed]
- Gaffen, S.L.; Jain, R.; Garg, A.V.; Cua, D.J. The IL-23–IL-17 immune axis: From mechanisms to therapeutic testing. Nat. Rev. Immunol. 2014, 14, 585–600. [Google Scholar] [CrossRef] [PubMed]
- Blauvelt, A.; Chiricozzi, A. The immunologic role of IL-17 in psoriasis and psoriatic arthritis pathogenesis. Clin. Rev. Allergy Immunol. 2018, 55, 379–390. [Google Scholar] [CrossRef]
- Wu, L.T.; Qiao, Z.H.; Tian, J.B.; Lin, J.L.; Hou, S.C.; Liu, X.M. The effect of secukinumab treatment for psoriasis on serum cytokines and correlation with disease severity. Front. Immunol. 2023, 14, 1229516. [Google Scholar] [CrossRef]
- Solberg, S.M.; de Boer, J.; Langholz, E.; Dyrhol-Riise, A.M.; Skov, L. Serum cytokine measurements and biological therapy of psoriasis—Prospects for individualized therapy. Scand J Immunol 2018, 87, e12662. [Google Scholar] [CrossRef]
- Gargiulo, L.; Ibba, L.; Malagoli, P.; Balato, A.; Bardazzi, F.; Burlando, M.; Carrera, C.G.; Damiani, G.; Dapavo, P.; Dini, V.; Esposito, M.; Fabbrocini, G.; Fargnoli, M.C.; Filippi, F.; Fortuna, M.C.; Giunta, A.; Grassi, S.; Malara, G.; Micali, G.; Pacifico, A.; Paolino, G.; Pattavina, F.; Pellacani, G.; Peris, K.; Picerno, G.; Prignano, F.; Prurici, M.; Rescigno, A.; Rizzoli, L.; Ruggiero, A.; Russo, T.; Saraceno, R.; Talamonti, M.; Tedeschi, A.; Pellacani, G.; Calzavara-Pinton, P.; Naldi, L.; Gisondi, P. Drug survival of IL-12/23, IL-17 and IL-23 inhibitors for moderate-to-severe plaque psoriasis: A retrospective multicenter real-world experience on 5932 treatment courses—IL PSO (Italian landscape psoriasis). Front. Immunol. 2024, 14, 1341708. [Google Scholar] [CrossRef]
- Thomas, S.E.; van den Reek, J.M.P.A.; Seyger, M.M.B.; de Jong, E.M.G.J. How to define a ‘super-responder’ to biologics in psoriasis studies. Br. J. Dermatol. 2023, 189, 621–622. [Google Scholar] [CrossRef]
- Mason, K.J.; Alabas, O.A.; Dand, N.; Mason, B.; Lunt, M.; Warren, R.B.; Griffiths, C.E.M.; Ashcroft, D.M.; Smith, C.H.; on behalf of the BADBIR Study Group. Characteristics of ‘super responders’ and ‘super non-responders’ to first biologic monotherapy for psoriasis: A nested case-control study. Br. J. Dermatol. 2024, 190, 441–444. [Google Scholar] [CrossRef]
- Loft, N.; Egeberg, A.; Rasmussen, M.K.; Bryld, L.E.; Skov, L. Prevalence and characterization of treatment-refractory psoriasis and super-responders to biologic treatment: A nationwide study. J. Eur. Acad. Dermatol. Venereol. 2022, 36, 1284–1291. [Google Scholar] [CrossRef]
- Marcelli, L.; Belcastro, A.; Talamonti, M.; Galluzzo, M.; Giunta, A.; Bavetta, M.; Perino, F.; Cortese, C.; Bianchi, L.; Chimenti, S. Characterization of super-responder profile in chronic plaque psoriatic patients under guselkumab treatment: A long-term real-life experience. J. Clin. Med. 2024, 13, 5175. [Google Scholar] [CrossRef]
- Liu, Y.; Hu, K.; Jian, L.; Duan, Y.; Zhang, M.; Kuang, Y. Comparison between super-responders and non-super-responders in psoriasis under adalimumab treatment: A real-life cohort study on the effectiveness and drug survival over one year. J. Dermatolog. Treat. 2024, 35, 2331782. [Google Scholar] [CrossRef] [PubMed]
- Fratton, Z.; Bighetti, S.; Bettolini, L.; Maione, V.; Arisi, M.; Buligan, C.; Stinco, G.; Errichetti, E. Real-world experience of bimekizumab in a cohort of 109 patients over 48 weeks and identification of predictive factors for an early super response and risk of adverse events. Psoriasis 2025, 15, 145–158. [Google Scholar] [CrossRef] [PubMed]
- Mortato, E.; Talamonti, M.; Marcelli, L.; Megna, M.; Raimondo, A.; Caldarola, G.; Bernardini, N.; Balato, A.; Campanati, A.; Esposito, M.; Bonifati, C.; Lora, V.; Potestio, L.; Lembo, S.; Loconsole, F.; De Luca, E.; Skroza, N.; Buononato, D.; Bianchelli, T.; Fargnoli, M.C.; Tommasino, N.; Primavera, F.; De Simone, C.; Bianchi, L.; Galluzzo, M. Predictive factors for super responder status and long-term effectiveness of guselkumab in psoriasis: A multicenter retrospective study. Dermatol. Ther. (Heidelb.) 2025, 15, 1239–1250. [Google Scholar] [CrossRef]
- Pirro, F.; Caldarola, G.; Chiricozzi, A.; Burlando, M.; Mariani, M.; Parodi, A.; Peris, K.; De Simone, C. Impact of Body Mass Index on the Efficacy of Biological Therapies in Patients with Psoriasis: A Real-World Study. Clin. Drug Investig. 2021, 41, 917–925. [Google Scholar] [CrossRef]
- Hsieh, C.L.; Yu, S.J.; Lai, K.L.; Chao, W.T.; Yen, C.Y. IFN-gamma, IL-17A, IL-4, and IL-13: Potential biomarkers for prediction of the effectiveness of biologics in psoriasis patients. Biomedicines 2024, 12, 1115. [Google Scholar] [CrossRef]
- WuL-T-Y, Qiao Z-H, Tian J-B, Lin J-L, Hou S-C, Liu X-M. The effect of secukinumab treatment for psoriasis on serum cytokines and correlation with disease severity. Skin Res Technol. 2023;29:ert13405. [CrossRef]
- Lowes, M.A.; Suárez-Fariñas, M.; Krueger, J.G. Immunology of psoriasis. Annu. Rev. Immunol. 2014, 32, 227–255. [Google Scholar] [CrossRef] [PubMed]
- Johnson-Huang, L.M.; Suárez-Fariñas, M.; Pierson, K.C.; Fuentes-Duculan, J.; Cueto, I.; Lentini, T.; Sullivan-Whalen, M.; Gilleaudeau, P.; Krueger, J.G.; Haider, A.S.; Lowes, M.A. A single intradermal injection of IFN-γ induces an inflammatory state in both non-lesional psoriatic and healthy skin. J. Invest. Dermatol. 2012, 132, 1177–1187. [Google Scholar] [CrossRef]
- Rusiñol, L.; Puig, L. A. Narrative Review of the IL-18 and IL-37 Implications in the Pathogenesis of Atopic Dermatitis and Psoriasis: Prospective Treatment Targets. Int. J. Mol. Sci. 2024, 25, 8437. [Google Scholar] [CrossRef]
- Yasuda, K.; Nakanishi, K.; Tsutsui, H. Interleukin-18 in health and disease. Int. J. Mol. Sci. 2019, 20, 649. [Google Scholar] [CrossRef]
- Pietrzak, A.; Bartosinska, J.; Chodorowska, G.; Juszkiewicz-Borowiec, M.; Wozniacka, A.; Szepietowski, J. Serum levels of IL-18 in patients with psoriasis. Acta Derm Venereol 2003, 83, 262–265. [Google Scholar] [CrossRef]
- Orzan, O.A.; Tutunaru, C.V.; Ianoși, S.L. Understanding the intricate pathophysiology of psoriasis and related skin disorders. Int. J. Mol. Sci. 2025, 26, 749. [Google Scholar] [CrossRef] [PubMed]
- Yousefzadeh, H.; Jabbari Azad, F.; Rastin, M.; Banihashemi, M.; Mahmoudi, M. Expression of Th1 and Th2 cytokine and associated transcription factors in peripheral blood mononuclear cells and correlation with disease severity. Rep. Biochem. Mol. Biol. 2017, 6, 102–111. [Google Scholar] [PubMed] [PubMed Central]
Figure 1.
Changes in serum cytokine levels (Δ, post-treatment minus baseline) for IL-2, IL-5, IL-10, IL-15, IL-18, and IL-23 in patients with psoriasis, stratified by clinical response. Panels A–F show the distribution of cytokine level changes among super responders (green; PASI = 0 at 3 months) and non-super responders (orange; PASI > 0). Horizontal lines indicate medians, boxes represent interquartile ranges, and whiskers show the full data range. p-values were calculated using the Mann–Whitney U test to compare distributions between groups. A significant difference was observed for IL-18 (panel E), with super responders showing a more pronounced decrease in IL-18 levels after treatment.
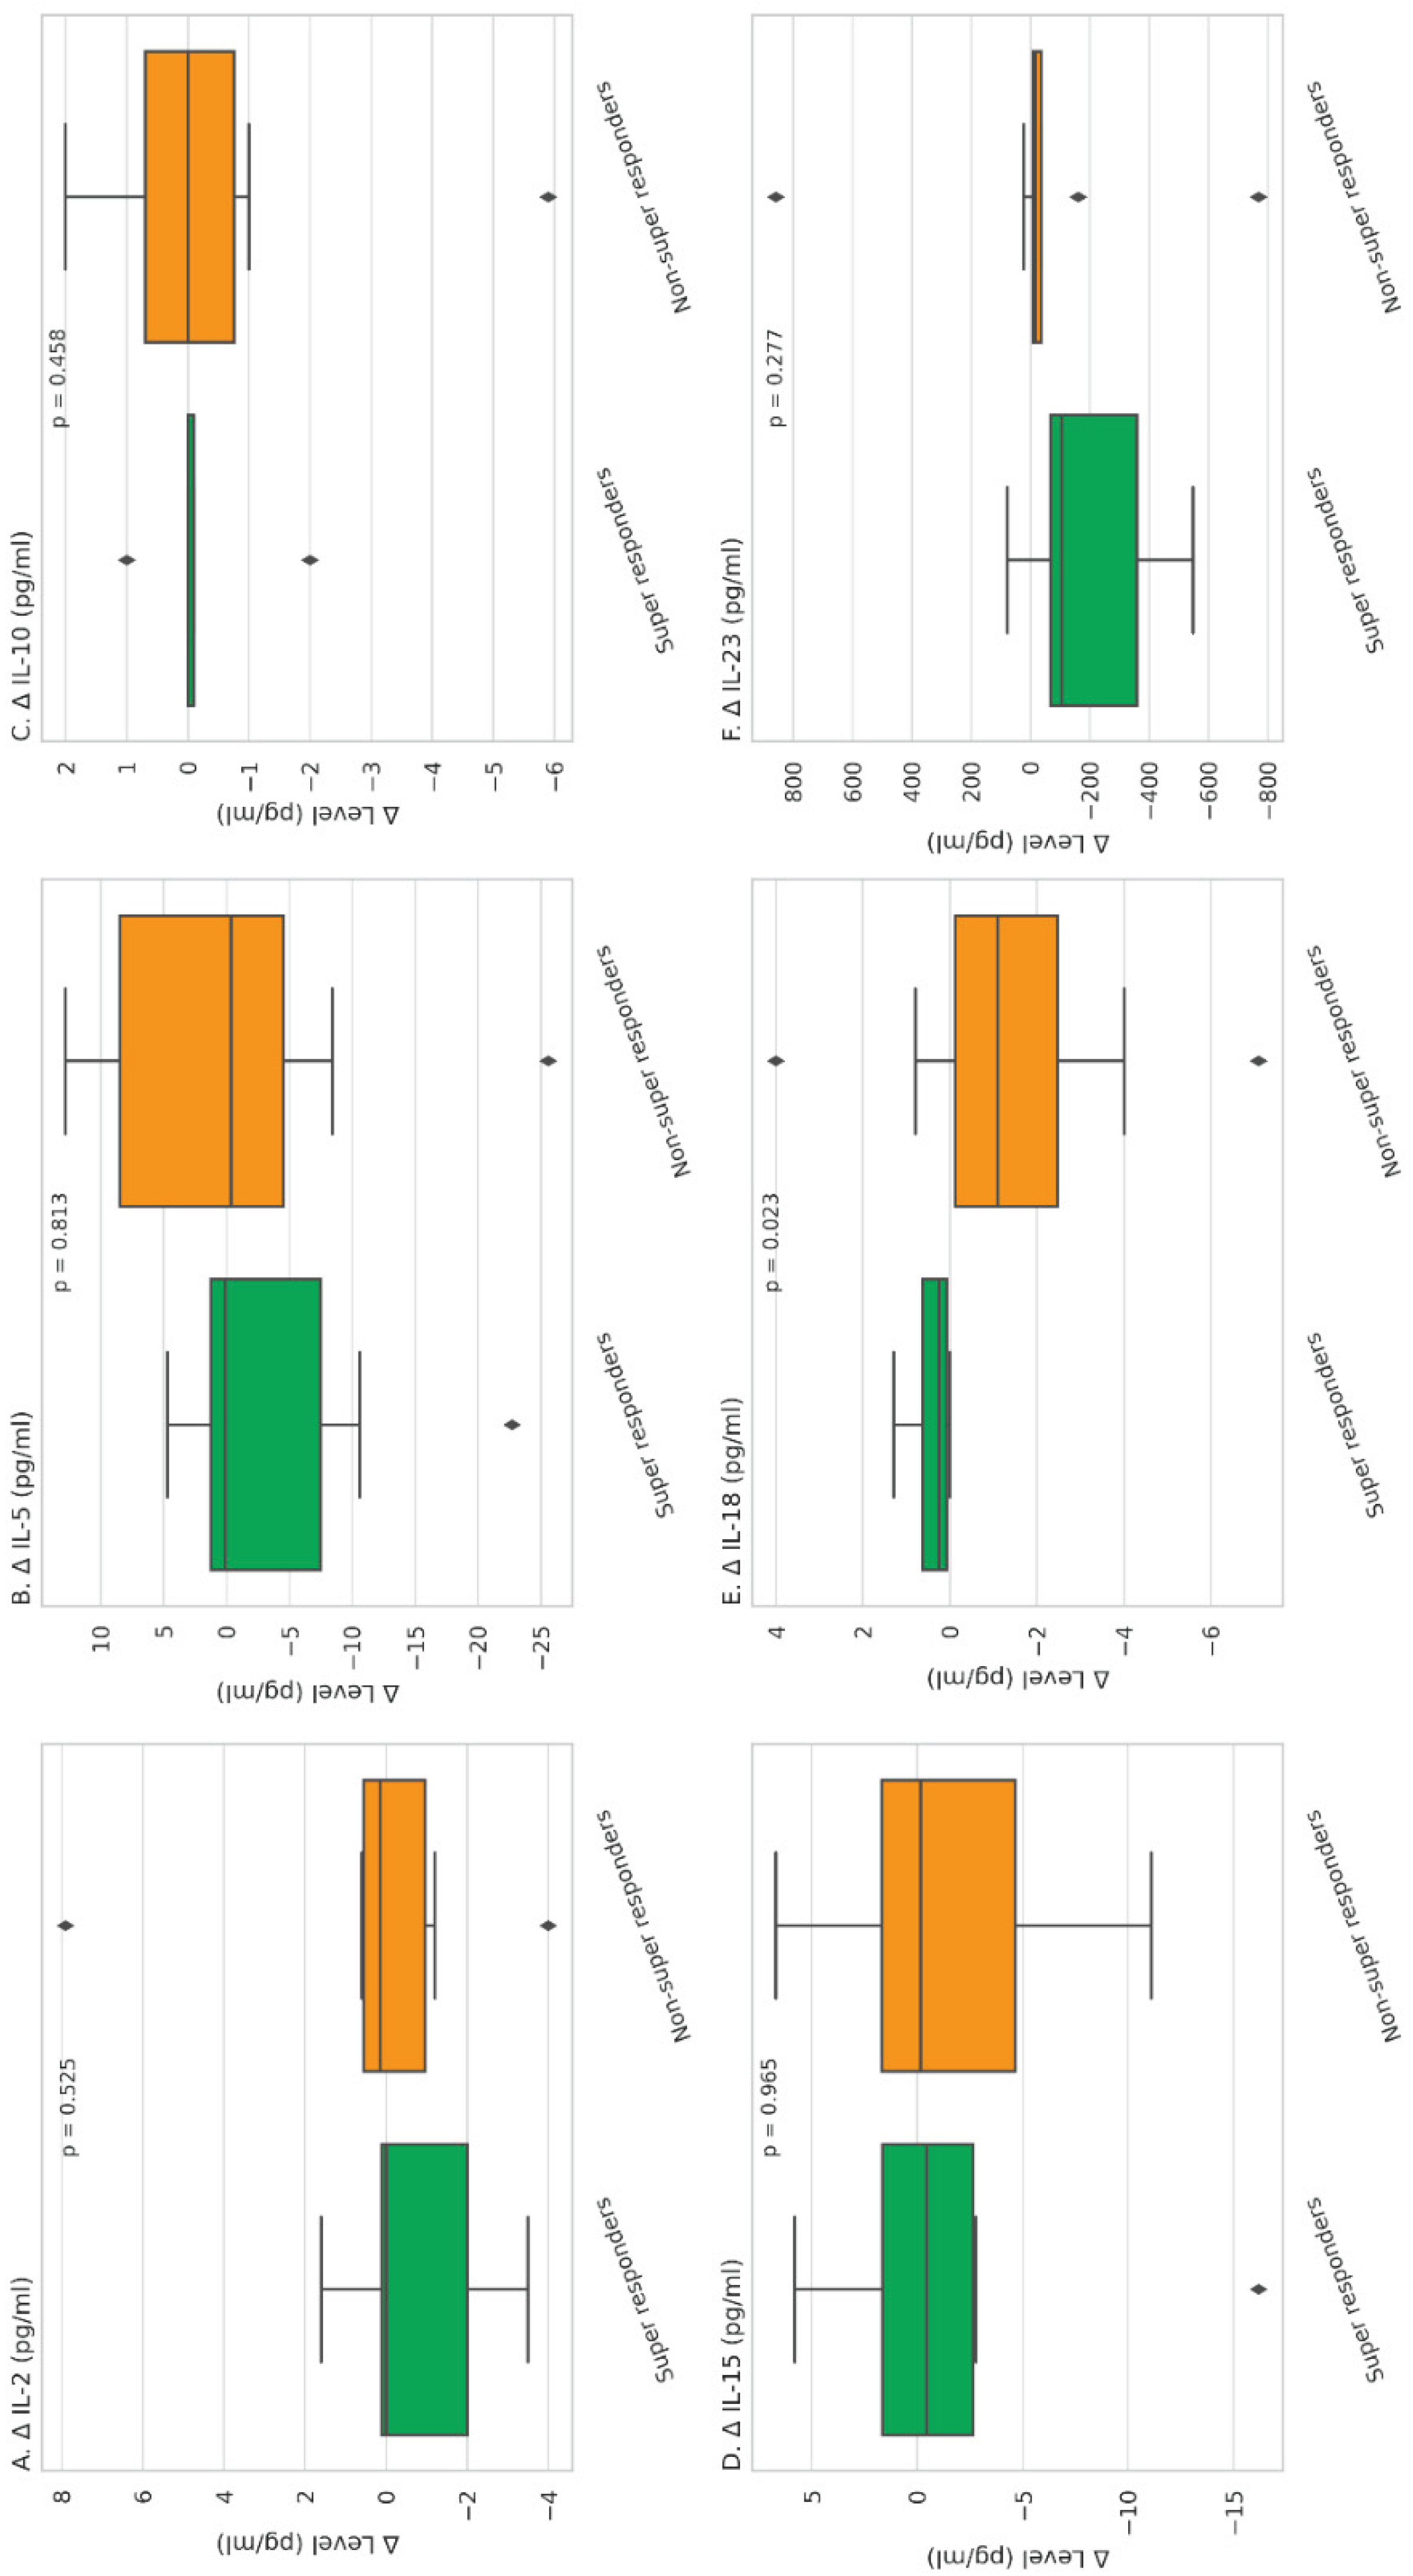
Figure 2.
Spearman correlation matrices between clinical parameters and cytokine concentrations. A. Correlations between baseline clinical and laboratory parameters (including PASI, DLQI, BMI and NLR) and baseline cytokine levels. B. Correlations between post-treatment clinical parameters (including PASI and DLQI) and post-treatment cytokine levels. Significant positive correlations are marked with an asterisk (*, p < 0.05).
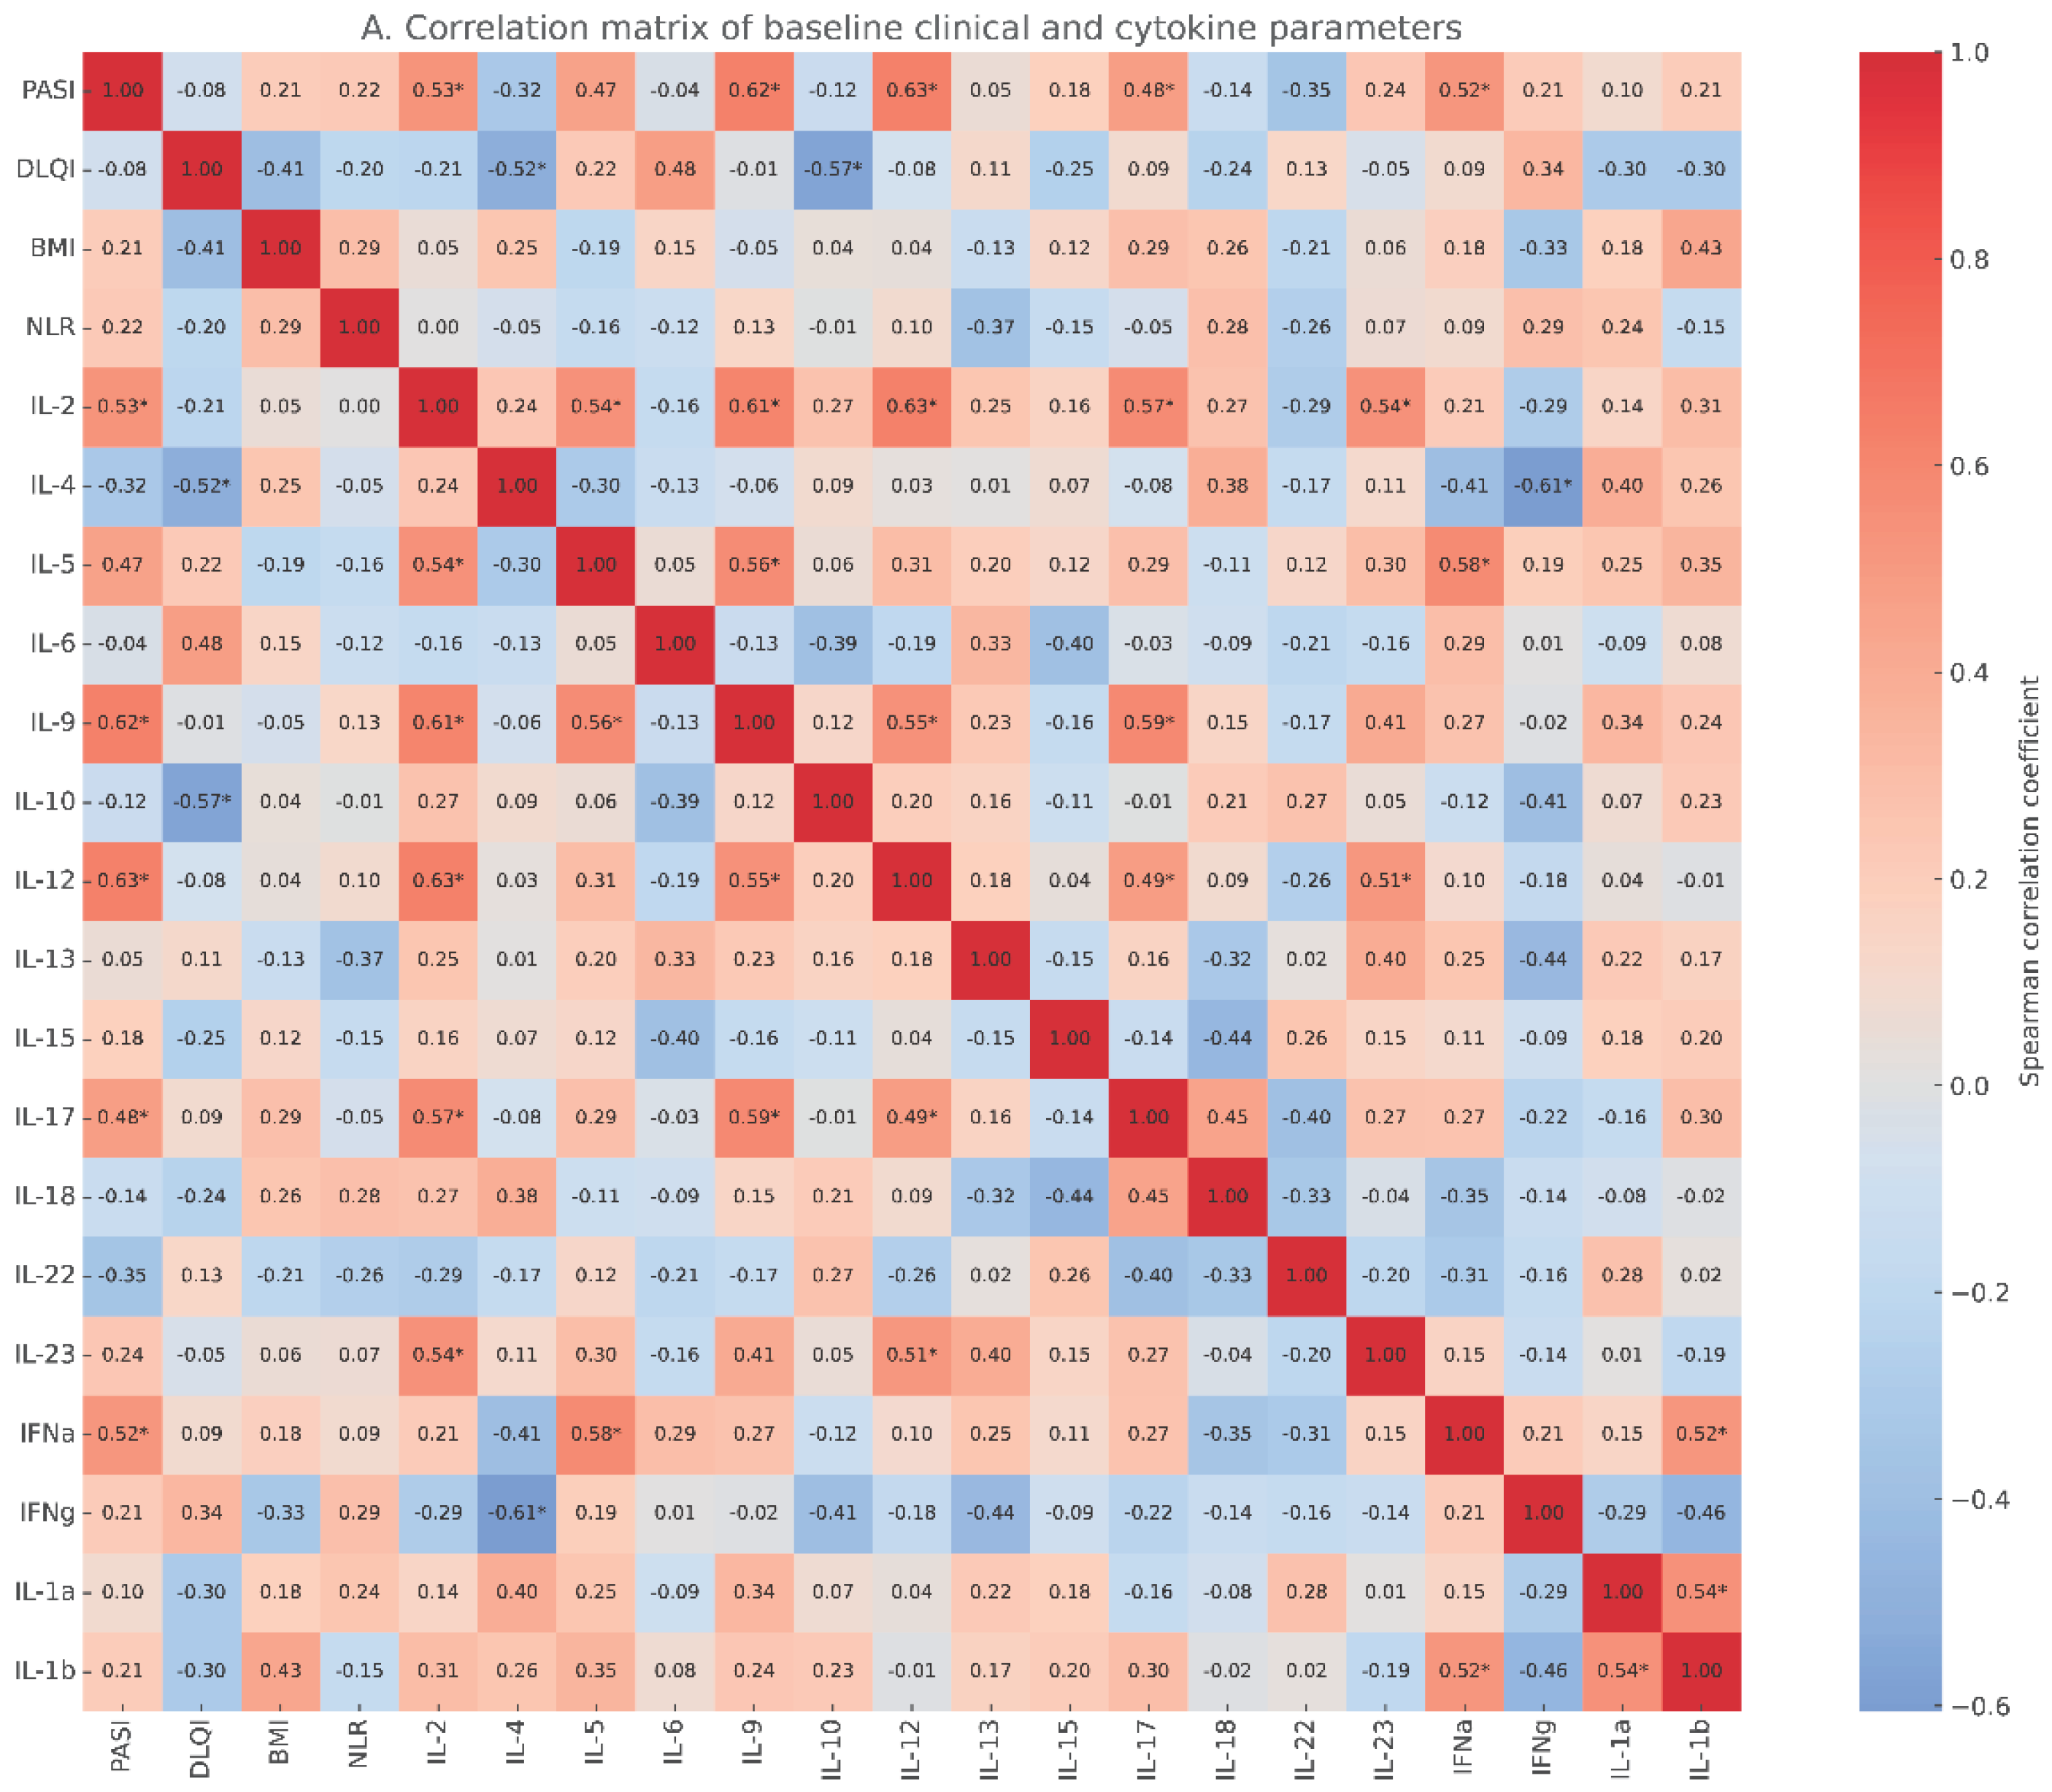
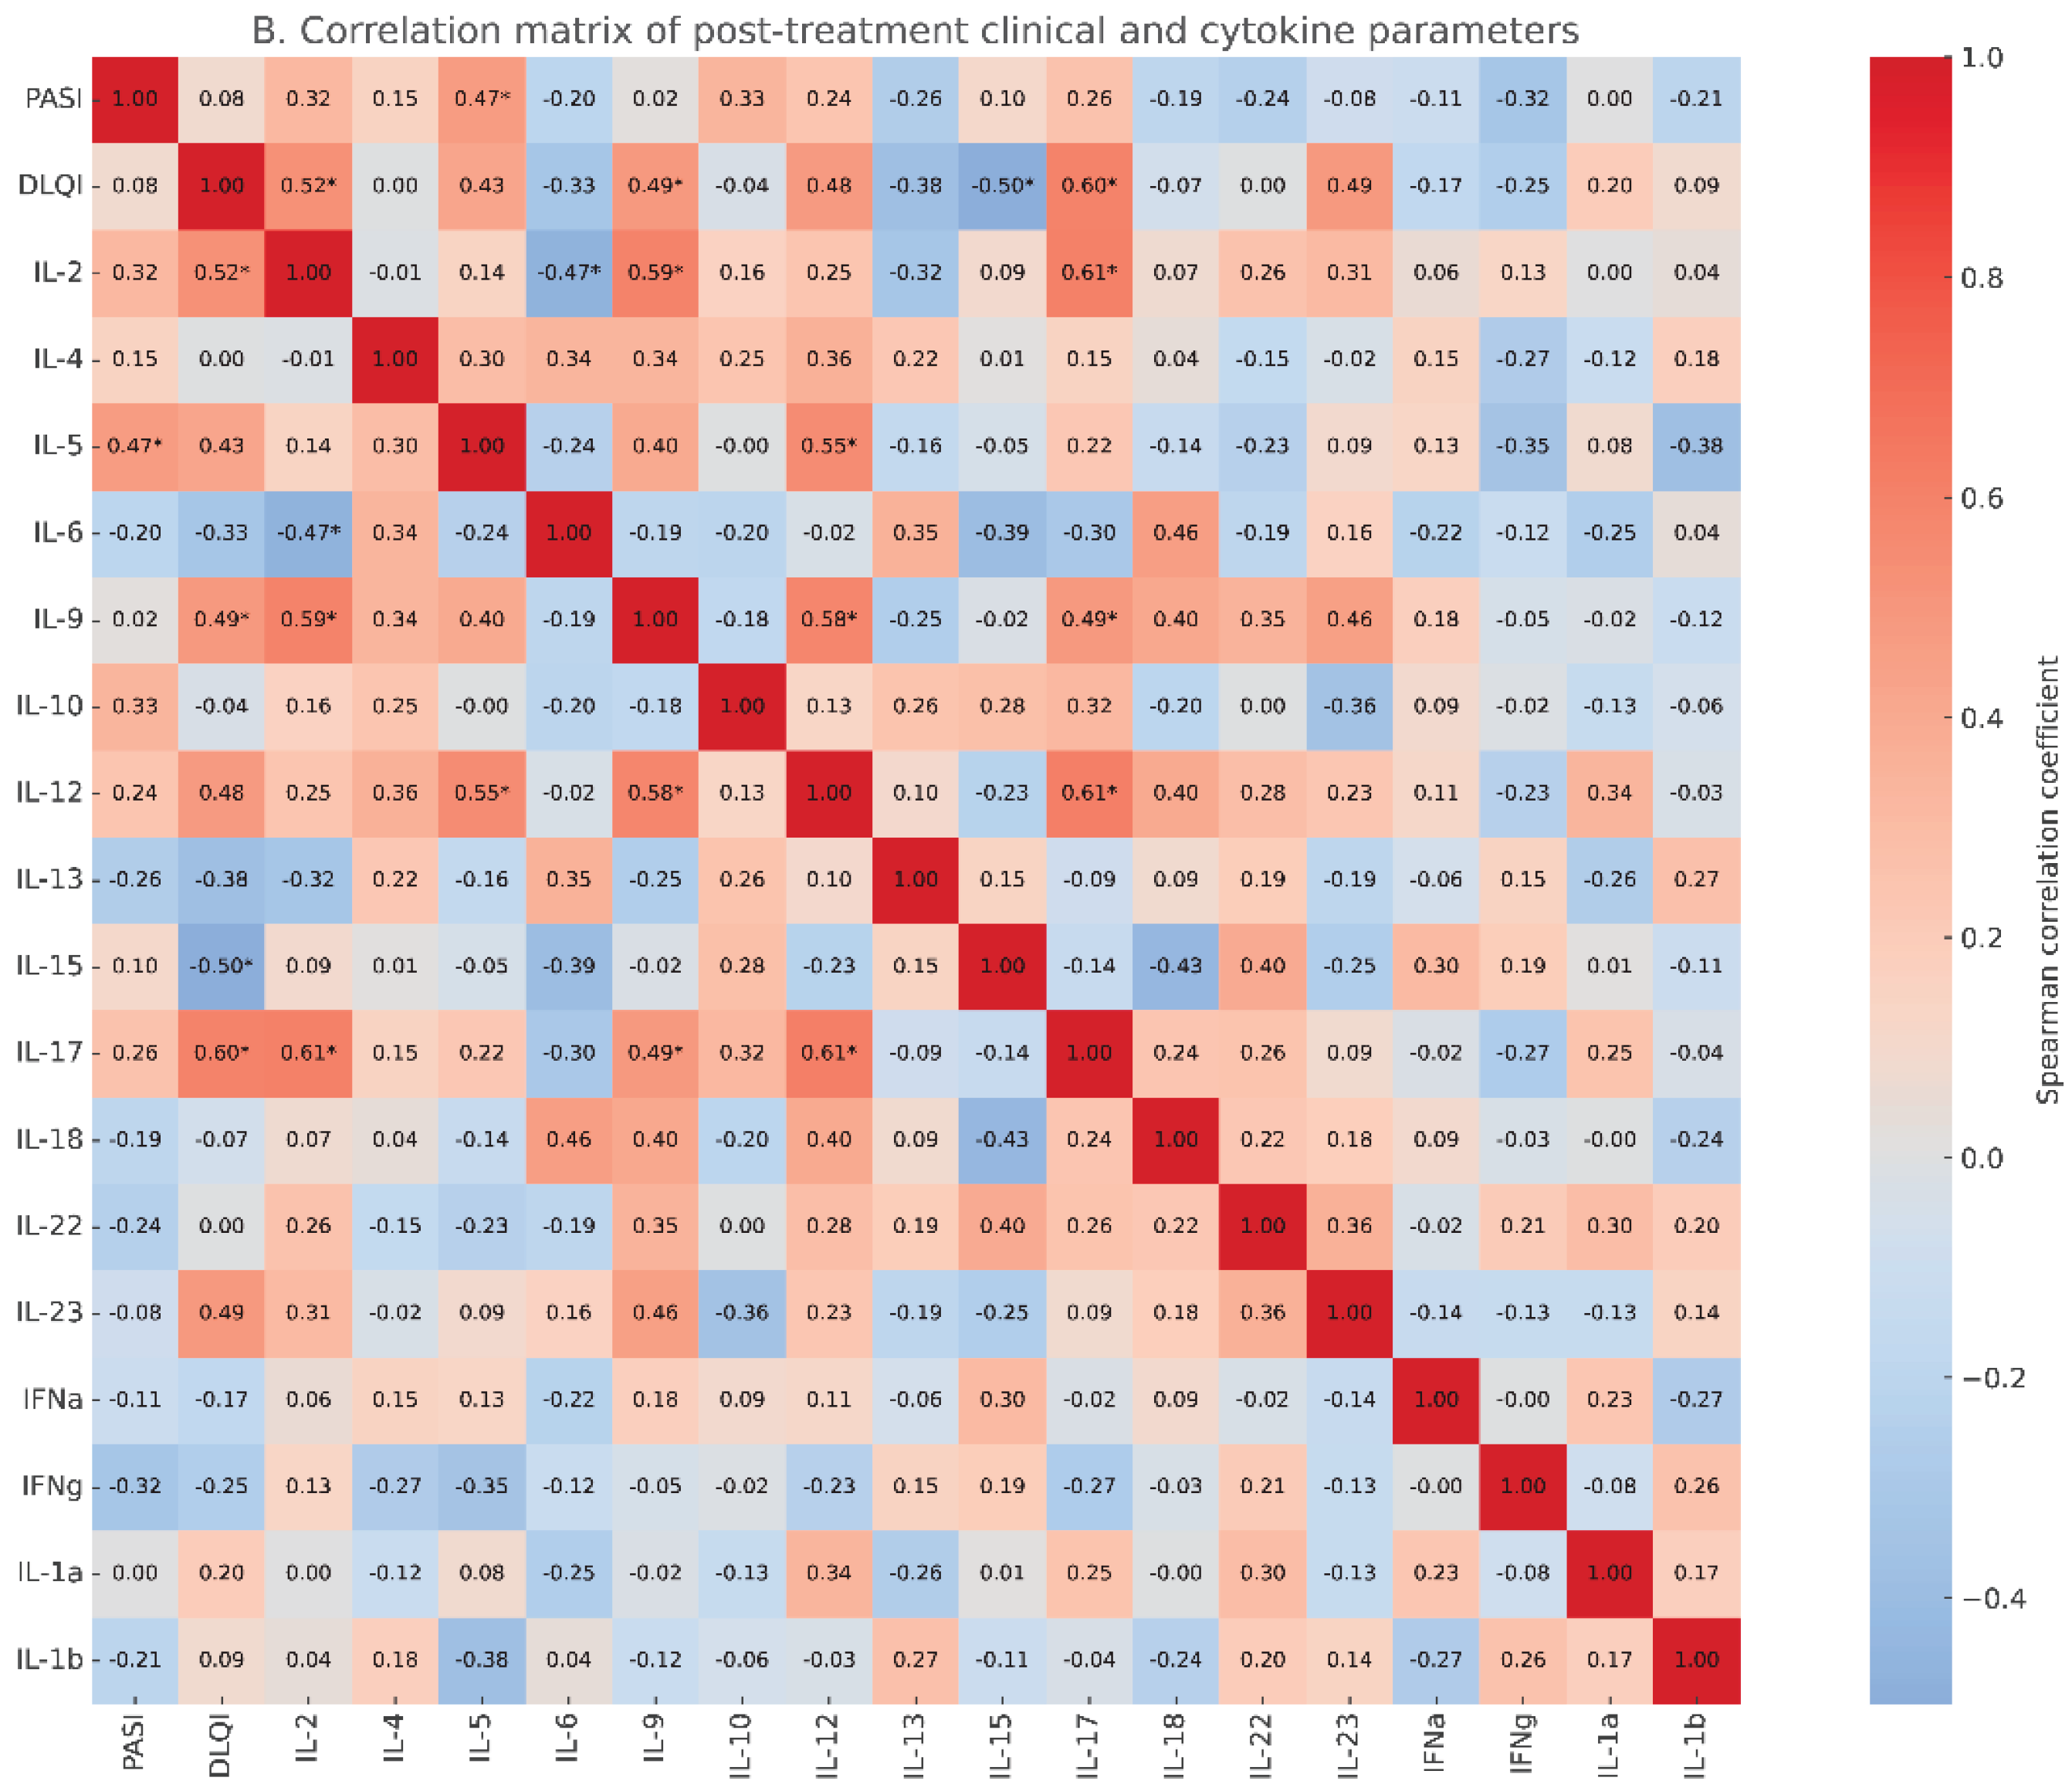
Figure 3.
Correlation matrices illustrating cross-time associations between clinical parameters and cytokine levels. A. Correlations between baseline clinical and laboratory parameters (PASI, DLQI, BMI, NLR) and cytokine levels measured after treatment. B. Correlations between post-treatment clinical parameters (PASI, DLQI) and baseline cytokine levels. Significant correlations are marked with an asterisk (*, p < 0.05).
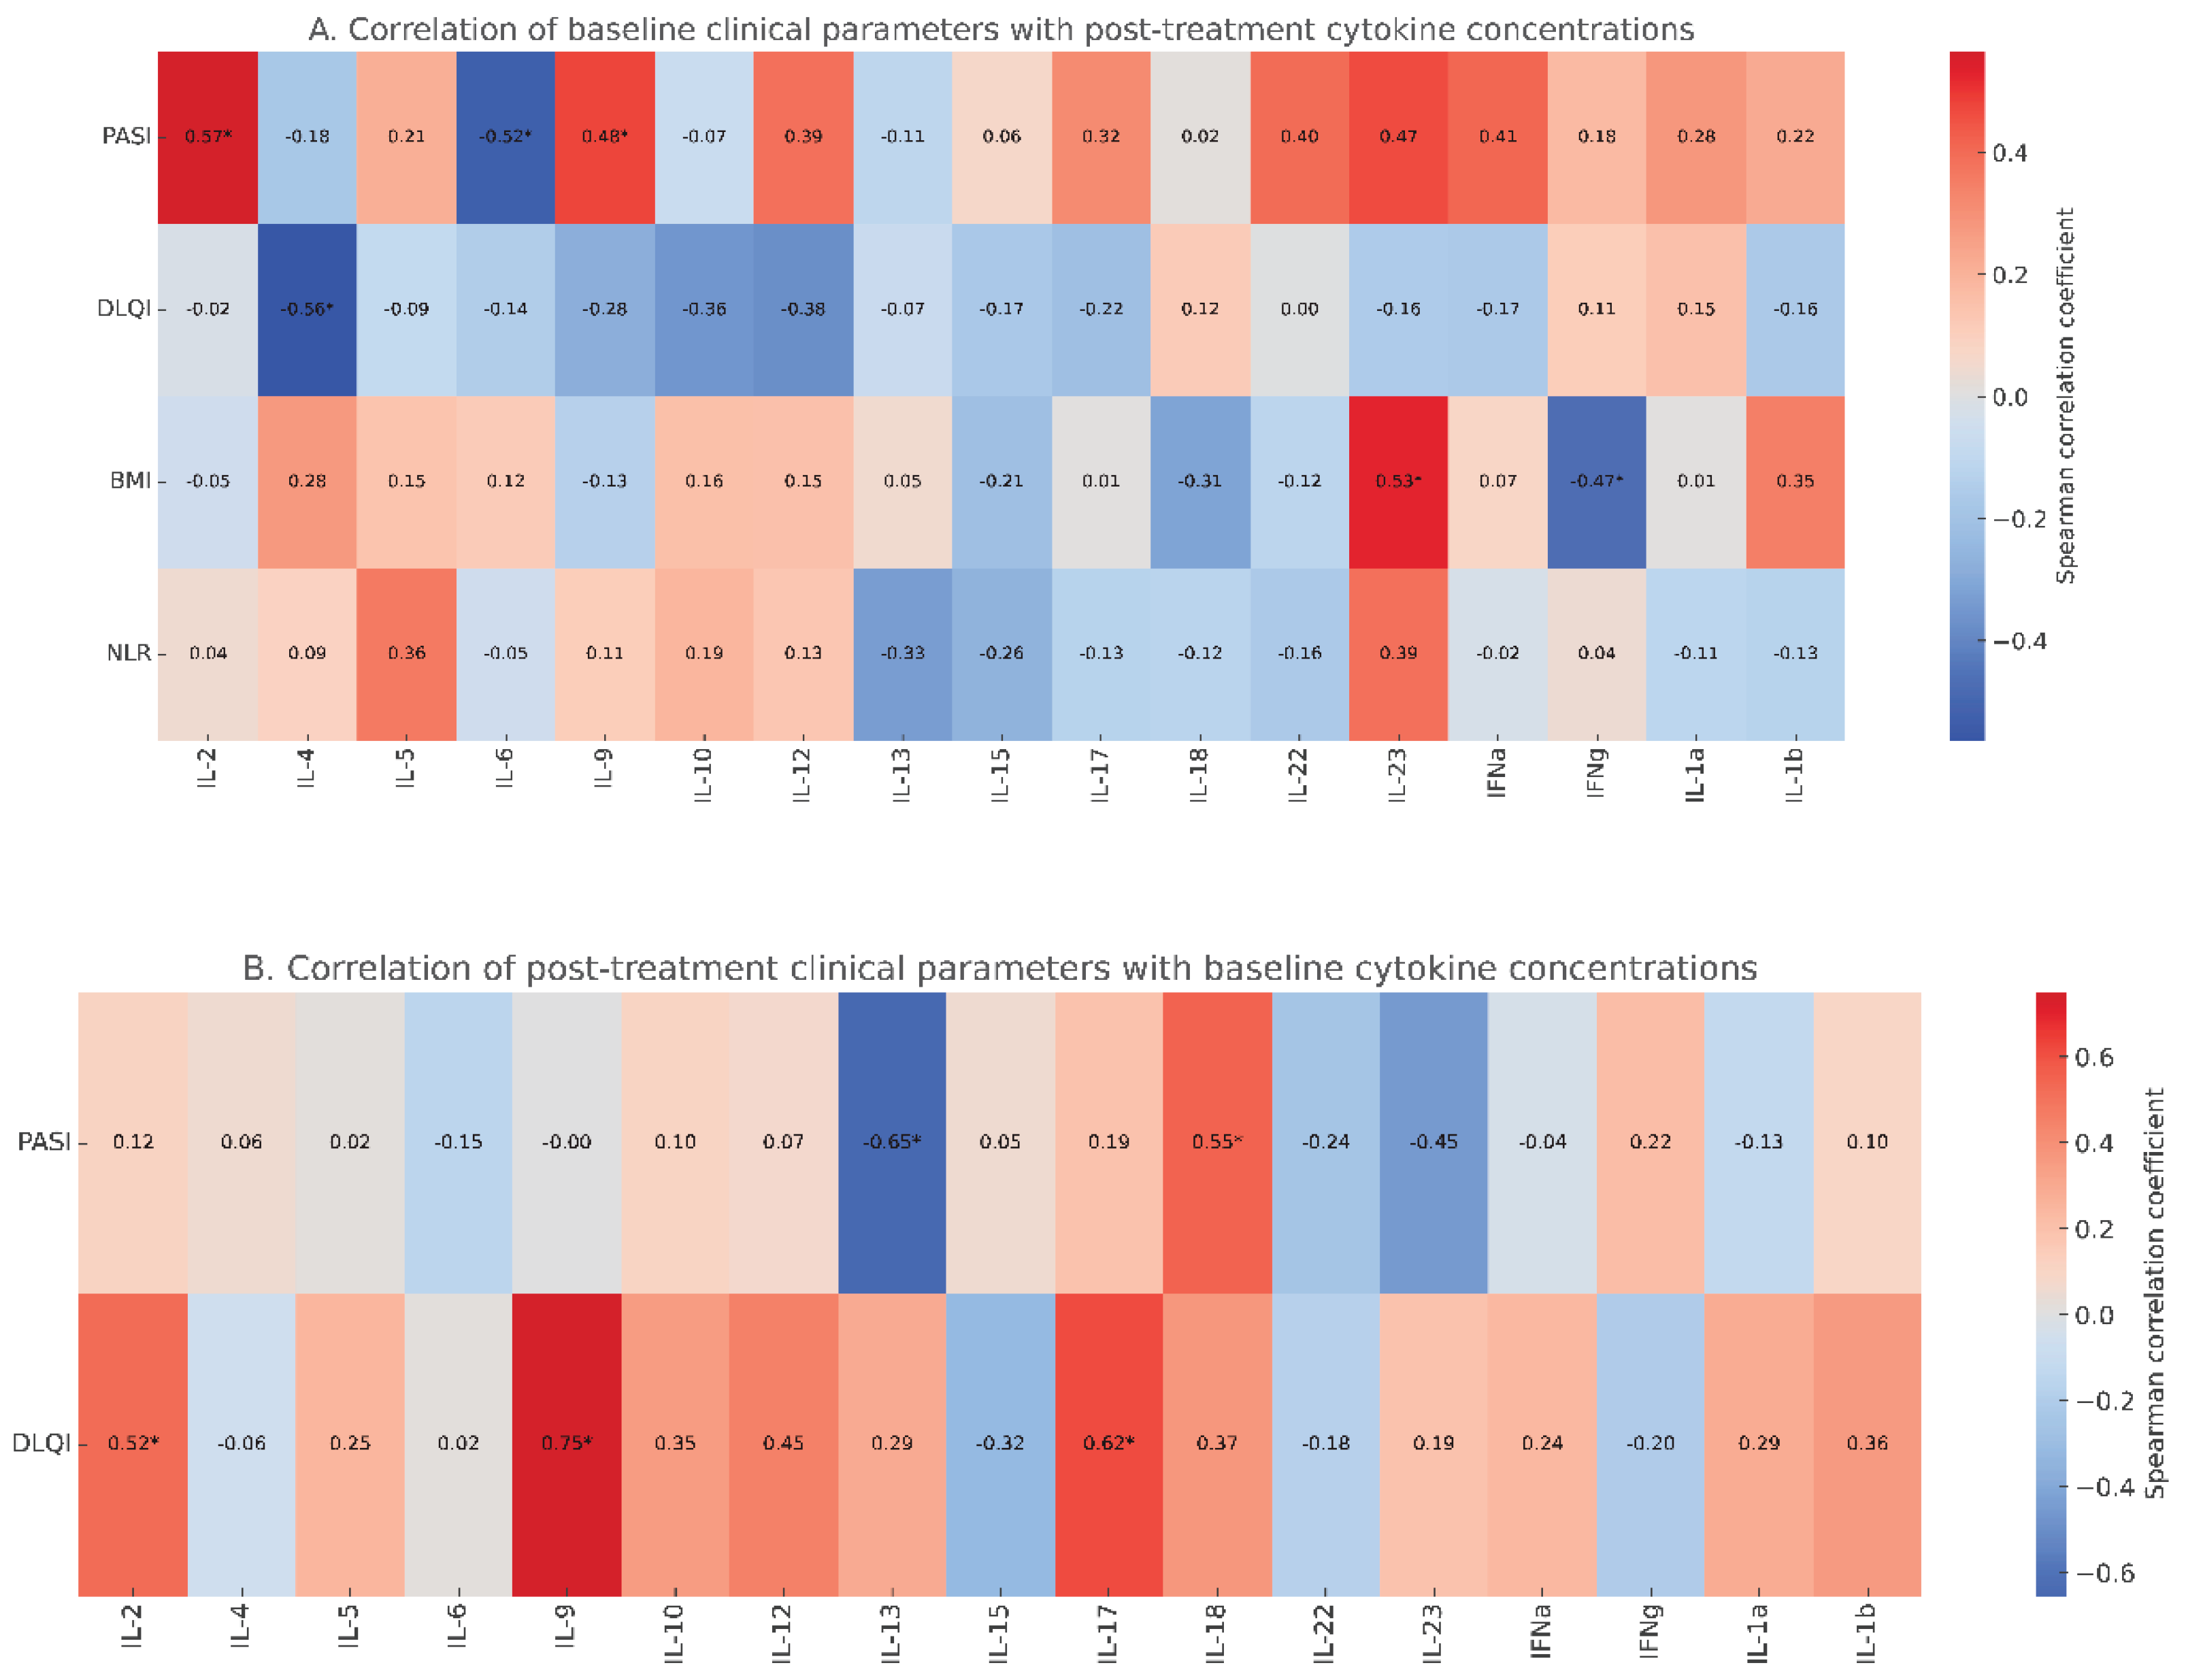

Table 1.
Demographic and clinical characteristics of super responders (SR) and non-super responders (NSR) to secukinumab treatment of psoriasis.
Table 1.
Demographic and clinical characteristics of super responders (SR) and non-super responders (NSR) to secukinumab treatment of psoriasis.
| Super responders (SR), n=9 | Non-super responders (NSR), n=19 | p-value | |
|---|---|---|---|
| females; n (%) | 4 (44.4) | 9 (47.4) | 1.0 |
| age | 30.50 (19.00–57.00) | 45.00 (27.00–57.00) | 0.15 |
| BMI | 23.66 (22.34–27.47) | 26.20 (20.83–29.97) | 0.41 |
| baseline PASI | 35.3 (16.2-50.1) | 24.2 (20-40) | 0.76 |
| post-treatment PASI | 0.0 (0.0-0.0) | 6.6 (2.4-18.0) | 0.0002 |
| disease duration; months | 32.1 (18-108) | 37.9 (12-144) | 0.54 |
| previous treatment with cyclosporine; n (%) | 8 (88.9) | 17 (89.4) | 1.0 |
| previous treatment with methoretxate; n (%) | 9 (100) | 16 (84.2) | 0.53 |
| previous treatment with acitretin; n (%) | 3 (33.3) | 6 (31.6) | 1.0 |
| baseline CRP, mg/dL | 8.25 (3.80–15.90) | 10.40 (4.30–22.10) | 0.63 |
| baseline lymphocytes count; x103/uL | 3.05 (2.02–4.02) | 2.83 (1.56–3.55) | 0.23 |
| baseline monocytes count; x103/uL | 0.41 (0.12–0.81) | 0.67 (0.33–0.78) | 0.03 |
| baseline neutrophils count; x103/uL | 5.22 (2.14–7.05) | 5.44 (4.12–8.77) | 0.59 |
| baseline NLR | 1.7 (0.9-3.1) | 2.1 (1.4-5.6) | 0.31 |
Data are given as median (min-max) or otherwise stated. BMI; body-mass index, PASI; Psoriasis Area Severity Index, CRP; C-reactive protein, NLR; neutrophil to lymphocytes ratio.
Table 2.
Baseline and post-treatment serum cytokine levels in super responders (SR) and non-super responders (NSR) to secukinumab treatment of psoriasis.
Table 2.
Baseline and post-treatment serum cytokine levels in super responders (SR) and non-super responders (NSR) to secukinumab treatment of psoriasis.
| baseline levels | post-treatment levels | |||||
|---|---|---|---|---|---|---|
| Super responders (SR) group (n=9) | Non-super responders (NSR) group (n=19) | P value | Super responders (SR) group (n=9) | Non-super responders (NSR) group (n=19) | P value | |
| IL-2; pg/mL | 2.3 (0.1-17.4) | 3.1 (0.1-16.9) | 1.0 | 0.2 (0.1-20.9) | 4.0 (0.1-13.8) | 0.30 |
| IL-4; pg/mL | 0.1 (0.1-67.9) | 0.1 (0.1-14.8) | 0.6 | 0.1 (0.1-45.2) | 0.1 (0.1-10.3) | 0.34 |
| IL-5; pg/mL | 2.6 (0.1-23.1) | 0.45 (0.1-34.9) | 0.75 | 0.8 (0.1-8.1) | 7.05 (0.1-15.8) | 0.2 |
| IL-6; pg/mL | 0.2 (0.1-11.9) | 0.1 (0.1-0.9) | 0.35 | 0.1 (0.1-0.4) | 0.1 (0.1-0.3) | 1.0 |
| IL-9; pg/mL | 0.1 (0.1-4.5) | 0.1 (0.1-5.2) | 0.75 | 0.1 (0.1-5.9) | 0.1 (0.1-3.1) | 1.0 |
| IL-10; pg/mL | 0.2 (0.1-3.2) | 0.15 (0.1-14.5) | 1.0 | 0.25 (0.1-3.1) | 0.7 (0.1-13.5) | 0.34 |
| IL-12; pg/mL | 1.5 (0.1-3.7) | 1.2 (0.1-4.1) | 0.93 | 0.9 (0.1-2.2) | 1.05 (0.1-3.1) | 0.53 |
| IL-13; pg/mL | 1.2 (0.6-1.6) | 0.35 (0.1-1.1) | 0.002 | 0.8 (0.0-1.7) | 0.35 (0.1-1.1) | 0.17 |
| IL-15; pg/mL | 5.8 (0.5-55.4) | 7.1 (0.1-45.2) | 0.96 | 8.1 (0.1-39.2) | 7.5 (0.4-34.1) | 1.0 |
| IL-17; pg/mL | 3.3 (0.4-11.4) | 4.0 (0.5-14.9) | 0.35 | 2.7 (0.5-10.2) | 3.1 (1.1-19.3) | 0.42 |
| IL-18; pg/mL | 0.15 (0.1-0.4) | 2.05 (0.2-8.1) | 0.007 | 0.5 (0.1-1.7) | 0.25 (0.1-11.2) | 0.82 |
| IL-22; pg/mL | 0.1 (0.1-0.3) | 0.1 (0.1-0.1) | 0.31 | 0.1 (0.1-0.4) | 0.1 (0.1-0.1) | 0.31 |
| IL-23; pg/mL | 345.0 (98.0-1004.0) | 129.0 (34.0-871.0) | 0.12 | 145.0 (6.0-801.0) | 121.0 (32.0-892.0) | 0.92 |
| TNFa; pg/mL | 3.1 (0.1-9.1) | 1.1 (0.1-5.1) | 0.2 | 2.1 (0.1-3.9) | 0.4 (0.1-2.9) | 0.26 |
| IFNa; pg/mL | 0.3 (0.1-1.2) | 0.25 (0.1-0.5) | 0.68 | 0.25 (0.1-1.9) | 0.2 (0.1-2.2) | 0.93 |
| IFNg; pg/mL | 35.5 (7.0-118.0) | 71.5 (7.0-142.0) | 0.37 | 52.0 (28.0-145.0) | 28.0 (7.0-88.0) | 0.04 |
| IL-1a; pg/mL | 0.25 (0.1-1.8) | 0.1 (0.1-4.3) | 0.51 | 0.1 (0.1-0.9) | 0.1 (0.1-0.4) | 0.91 |
| IL-1b; pg/mL | 0.2 (0.1-1.1) | 0.3 (0.1-1.6) | 0.70 | 0.2 (0.1-1.4) | 0.1 (0.1-1.1) | 0.37 |
Data are given as median (min-max) or otherwise stated.
Table 3.
Cytokine ratios at baseline and after treatment in super responders (SR) and non-super responders (NSR) to secukinumab treatment of psoriasis.
Table 3.
Cytokine ratios at baseline and after treatment in super responders (SR) and non-super responders (NSR) to secukinumab treatment of psoriasis.
| baseline levels | post-treatment levels | |||||
|---|---|---|---|---|---|---|
| Super responders (SR) group (n=9) | Non-super responders (NSR) group (n=19) | P value | Super responders (SR) group (n=9) | Non-super responders (NSR) group (n=19) | P value | |
| IL-17/IL-4; pg/mL | 27.5 (0.01-114.0) |
22.3 (0.05-128.0) |
1.0 | 21.5 (0.1-102.0) |
20.5 (0.2-147.0) |
0.76 |
| IL-17/IL-13; pg/mL | 2.5 (0.36-10.36) |
13.3 (1.7-53.0) |
0.004 | 3.1 (0.56-inf) |
14.9 (1-96.3) | 0.17 |
| IL-23/IL-4; pg/mL | 1965.0 (8.3-10040) |
650.0 (2.3-5610.0) |
0.11 | 1450.0 (0.62-8010.0) |
430.0 (20.9-3990.0) |
0.39 |
| IL-23/IL-13; pg/mL | 337.5 (80.6-912.7) |
231.0 (90-5620.0) |
0.74 | 270.8 (12-inf) |
356.7 (80.0-3990.0) |
0.54 |
| IL-18/IL-13; pg/mL | 0.18 (0.06-0.33) |
3.46 (1.5-30.0) |
0.00001 | 0.76 (0.2-inf) |
2.0 (0.09-37.3) |
0.62 |
Data are given as median (min-max) or otherwise stated.
Disclaimer/Publisher’s Note: The statements, opinions and data contained in all publications are solely those of the individual author(s) and contributor(s) and not of MDPI and/or the editor(s). MDPI and/or the editor(s) disclaim responsibility for any injury to people or property resulting from any ideas, methods, instructions or products referred to in the content. |
© 2025 by the authors. Licensee MDPI, Basel, Switzerland. This article is an open access article distributed under the terms and conditions of the Creative Commons Attribution (CC BY) license (http://creativecommons.org/licenses/by/4.0/).
Copyright: This open access article is published under a Creative Commons CC BY 4.0 license, which permit the free download, distribution, and reuse, provided that the author and preprint are cited in any reuse.


