
Submitted:
13 June 2025
Posted:
13 June 2025
You are already at the latest version
Abstract
Extracting the irregular and complex shapes of individual tree crowns from high-resolution imagery can play a crucial role in many applications, including precision agriculture. We evaluated three CNN models - MASK R-CNN, YOLOv3, and SAM - and compared their tree crown results with OBIA-based reference datasets from UAV imagery for seven dates across one growing season. We found that YOLOv3 performed poorly across all dates; both MASK R-CNN and SAM performed well in May, June, September, and November (Precision, Recall and F1 scores over 0.79). All models struggled in the early season imagery (e.g., March). MASK R-CNN outperformed other models in August (when there was smoke haze) and December (showing end of season red leaf senescence). SAM was the fastest model, and as it required no training, it could cover more area in less time; MASK R-CNN was very accurate and customizable. In this paper, we aimed to contribute insight into which CNN model offers the best balance of accuracy and ease of implementation for orchard management tasks. We also evaluated their applicability within one software ecosystem, ESRI ArcGIS Pro, and showed how such an approach offers users a streamlined, efficient way to detect objects in high resolution UAV imagery.
Keywords:
smart agriculture
; tree crown detection
; UAV
; OBIA
; CNN
; orchard
1. Introduction
Smart agriculture encompasses a broad range of technological innovations aimed at improving agricultural productivity and efficiency through data-driven decision-making, including the use of remote sensing, imaging, and cloud processing [1,2]. A key challenge within smart agriculture is the accurate, near real-time mapping of crop features and conditions, which can provide crucial insights into plant characteristics like size, volume, structure, and health. These metrics are essential for optimizing farming practices by helping to reduce production costs while maximizing yield and quality [3,4]. In the context of orchard management, individual tree crown characteristics—such as tree size, canopy architecture and health are pivotal. These metrics correlate closely with tree productivity and vigor, making them useful for tasks such as tree training and pruning, irrigation, fertilization and nutrient management, pest and disease management, weed management, thinning, harvesting and tree health monitoring. [4,5,6,7,8]. Traditionally, these characteristics are measured in the field, but the use of remote sensing technologies is becoming increasingly common to complement or replace manual assessments [3,9,10,11,12].
While satellite imagery (such as from Landsat) often lacks the spatial resolution necessary to detect individual trees [13], Uncrewed Aerial Vehicles (UAVs) or drones provide a compelling alternative. UAVs offer high-resolution imagery (often on the order of centimeters) that is repeatable, on-demand, and effective for capturing detailed crop features [7,11,14]. UAVs are especially useful for detecting intra-field variations in tree crown characteristics [14,15,16,17] on smaller-scale properties (ranging from 10 ha to 10 km²) [15,18], enabling mapping at various times throughout the growing season [10]. The past decade has seen a significant growth in methodologies for extracting individual tree crowns from high-resolution UAV imagery. This has enabled more efficient monitoring of tree development, condition, and yield, advancing smart agriculture by providing data to better manage agricultural resources and improve crop performance.
1.1. Previous Work and Current Objectives
In our previous work [10], we successfully used UAV imagery and an object-based image analysis (UAV-OBIA) approach to map tree crown characteristics at seven dates over the 2018 growing season, attributed each tree with characteristics (e.g., height, crown size, crown shape, compactness and NDVI (Normalized Difference Vegetation Index)) and correlated those data to field measures for pistachio trees. We found the UAV-OBIA method captured seasonal development of tree crowns, and predicted well several of the field measures from May through November, including tree height, trunk caliper, crown height, crown width and crown volume. However, the UAV-OBIA method was cumbersome, and significant advancements in Deep Learning CNN object detection methods have since emerged.
In the current research, we are focusing on evaluating the performance of three types of CNNs—Mask R-CNN (a two-shot detector), YOLOv3 (a one-shot detector), and Segment Anything Model (SAM) (a zero-shot detector)—for extracting individual orchard tree crowns from UAV imagery captured across seven dates in the growing season. By comparing these CNNs using standard validation metrics and leveraging the UAV-OBIA results as the reference dataset, we are seeking to assess how these models perform in terms of crown extraction. Moreover, we are aiming for an efficient workflow that integrates easily with GIS databases, and thus, all the CNNs are implemented in ArcGIS Pro 3.x to streamline the process. We aim to contribute insight into which model offers the best balance of accuracy and ease of implementation for orchard management tasks.
Our main objectives in this paper were to:
- Perform object detection using three CNN methods—Mask R-CNN (a two-shot detector), YOLOv3 (a one-shot detector), and SAM (a zero-shot detector)—to extract individual tree crowns across seven dates during the 2018 growing season;
- Compare the detection results from these CNNs against a reference dataset of tree crowns for the same seven dates which have been segmented using an UAV-OBIA method;
- Analyze the validation results to assess the performance of each CNN method relative to one another and throughout the growing season, focusing on how their accuracy varies over time;
- Contribute to the research field by adding insights into the use of automated object detection methods (specifically CNNs) for improving orchard crop monitoring and management through UAV imagery; and
- Evaluate the implementation of these CNN models in ESRI’s ArcGIS Pro.
This systematic evaluation will provide useful information on the relative strengths and weaknesses of the three CNN models, which can inform future developments in agricultural monitoring.
2. Object Detection Methods
Extracting the irregular and complex shapes of individual tree crowns from high-resolution imagery has become a well-established field, bridging computer vision and machine learning with remote sensing and ecology. This task is commonly referred to as object detection, object extraction, or segmentation. It involves identifying and delineating individual tree crowns from (typically downward-facing) aerial or satellite imagery, and it plays a crucial role in precision agriculture, forestry, and ecological studies [7,10,19,20,21,22,23]. There are several proven methods for individual tree crown detection.
2.1. Manual Digitization
The simplest and earliest method of tree crown detection is manual digitization [17,20,24] where an analyst captures the center of each tree crown and then buffers those points, or traces the outline of each tree visible in imagery from a computer screen using a mouse or digitizing device. While still used (often as a method for capturing reference data or training data), the current abundance of imagery sources makes manual digitization at scale untenable.
2.2. Object-Based-Image-Analysis (OBIA)
Starting around 2000, the delineation and analysis of image-objects, as opposed to individual pixels, became increasingly feasible in certain software platforms for remotely sensed imagery [25]. This marked the emergence of Object-Based-Image-Analysis (OBIA). OBIA groups pixels in high-resolution imagery into non-overlapping clusters or "segments" based on shared characteristics such as color, texture, and shape, using a collection of expert-driven rules [5,22,25,26,27,28,29,30]. These segments represent meaningful objects like individual tree crowns, which are then classified using a variety of algorithms. The OBIA approach has been widely applied in various domains. For instance, studies have shown OBIA’s effectiveness in analyzing mosaiced UAV imagery [22,31], UAV-derived canopy height models (CHMs) [23,32,33], and UAV-derived point clouds [34,35]. These methods can be accurate and provide detailed insights, but they often require significant manual post-processing and the development of complex supervised rule sets [26]. Moreover, OBIA methods are frequently criticized for their low transferability, meaning that the rule sets and classifications developed for one dataset may not generalize well to other datasets or different geographic regions [26]. Due to these challenges, OBIA methods have begun to be surpassed by automated approaches based on Deep Learning, particularly Convolutional Neural Networks (CNNs). CNNs offer a more scalable and transferable solution by automatically learning features from the data, reducing the need for manual rule development, and enhancing accuracy in object detection and classification tasks.
2.3. Convolutional Neural Networks (CNNs)
Convolutional Neural Networks (CNNs) are powerful algorithms designed for object detection that learn to identify and classify various features in an image. CNNs work by using convolutional kernels to detect subtle and obvious features and combining them across a layered network to form objects. The evolution of Convolutional Neural Networks (CNNs) has been rapid and transformative [36]. Starting from early concepts introduced by pioneers like Hinton and Salakhutdinov [37], and the introduction of the first significant deep (8-layer) CNN, AlexNet [38], the field has grown exponentially. This growth has led to the development of increasingly deep and efficient CNNs that feature a wide variety of convolutional backbones. The backbone is the computational core of CNNs, responsible for feature extraction. A major innovation in CNN architecture was the introduction of residual blocks, exemplified by the ResNet family [39], which has become the most popular backbone in modern CNNs [16,40]. These residual networks help overcome challenges in training deeper networks by allowing gradients to flow more easily through the network during backpropagation.
2.3.1. The CNN Workflow
The CNN workflow consists of several steps, illustrated in a generic model in Figure 1. The process begins when an input image (Figure 1a) is used with training data (Figure 1b) either from a training set derived from the input image, or from an external training dataset. Training creates image chips and labeled tiles which are passed to a convolutional backbone (Figure 1c). In the backbone step, a convolutional kernel (e.g., a 3x3 pixel window) moves across the image to find and highlight relevant features (i.e., an edge or a corner) that match those in the training data. These features are weighted according to their likelihood of contributing to object detection. Pooling layers then downsample and summarize these features, reducing the image’s complexity while preserving key information. The CNN backbone typically has multiple layers of neurons, which are interconnected and designed to learn progressively more complex representations of the image. Early layers detect low-level features like edges or corners, while deeper layers capture more abstract patterns like shapes [16,36,41]. Once the feature extraction is complete, the classification step begins. A fully connected layer (Figure 1d) compiles all the extracted features, passing the final output to the classifier for object detection. The classifier can output different types of object representations, such as bounding boxes, points, probability heatmaps, or polygons, depending on the specific task or CNN model. Output objects (Figure 1e) can be post-processed to smooth edges, resolve overlaps, and refine boundaries if necessary, and the output objects are validated (Figure 1f) using standard binary metrics by comparing them to a validation dataset. Many CNNs employ stand-alone software, or are implemented as part of other software suites, and many are fully integrated into ESRI’s ArcGIS Pro. There are even some implemented in ArcGIS Online.
2.3.2. CNN Model Types
CNN-based object detection methods can be categorized by how they require or use training data. Two-shot detectors, which were developed first, rely on extensive training datasets of labeled objects that are used to create examples of the object target as “image chips” to learn object identification and recognition. A key aspect of two-shot models is that they divide an image into regions of interest (ROIs) to focus on areas where objects are likely to be present [43]. These candidate regions are then classified and can be further refined through post-processing. The groundbreaking Region-based Convolutional Neural Network (R-CNN) was the first significant two-shot detector, known for its high accuracy [44]. Building on the success of R-CNN, faster and more efficient two-shot models were developed, such as Fast R-CNN, Faster R-CNN, and the current state-of-the-art, Mask R-CNN. These models typically use the ResNet family of backbones for feature extraction. Mask R-CNN, now widely implemented, including in platforms like ArcGIS Pro 3.x, allows users to choose from various backbones for object detection [45].
A key limitation of two-shot detectors is their reliance on large labeled reference datasets. Often these data are manually annotated, which require significant time and effort to collect, and are prone to human errors. In contrast, one-shot detectors such as Single Shot Detector (SSD) and You Only Look Once (YOLO) streamline the process by training models with fewer examples, often leveraging pre-trained weights from existing datasets. For instance, the YOLOv3 model comes preloaded with weights from the Common Objects in Context (COCO) dataset—a large dataset with 2.5 million labeled instances from over 300,000 images [46]. This pre-training allows YOLO models to generalize well to new tasks with minimal additional data. The YOLO workflow operates by dividing each image into a grid, where each grid cell is responsible for detecting objects whose center falls within it [36]. YOLOv3, in particular, is highly efficient in this process and uses Darknet-53 as its convolutional backbone. This architecture is designed for speed and accuracy, making YOLO models popular for real-time object detection tasks. YOLOv3 is implemented in ArcGIS Pro 3.3.
The Segment Anything Model (SAM), developed by Meta AI Research, represents a significant advancement in object detection and segmentation [47,48]. SAM is a zero-shot detector, which allows it to accurately process and detect objects in images that it has not encountered during training [49]. This is a key feature of zero-shot models—they generalize well to unseen data. SAM achieves this high level of generalization due to extensive pre-training on millions of diverse images, allowing it to learn a wide range of features and patterns [47]. One of SAM's standout features is its promptability—the ability to segment objects using various types of input prompts [48]. These prompts can include feature information like bounding boxes, points on the object, or even text prompts describing what to look for. This flexibility in input modalities makes SAM highly adaptable across different tasks and datasets, and its strong segmentation performance has been demonstrated on a variety of natural image datasets. SAM's zero-shot and promptable capabilities make it a powerful tool for object detection and segmentation, requiring minimal user intervention and manual annotations while maintaining high accuracy. SAM is implemented in ArcGIS Pro 3.x.
The characteristics of the three CNNs evaluated in this paper are summarized in Table 1.
2.4. Validation of CNN Models
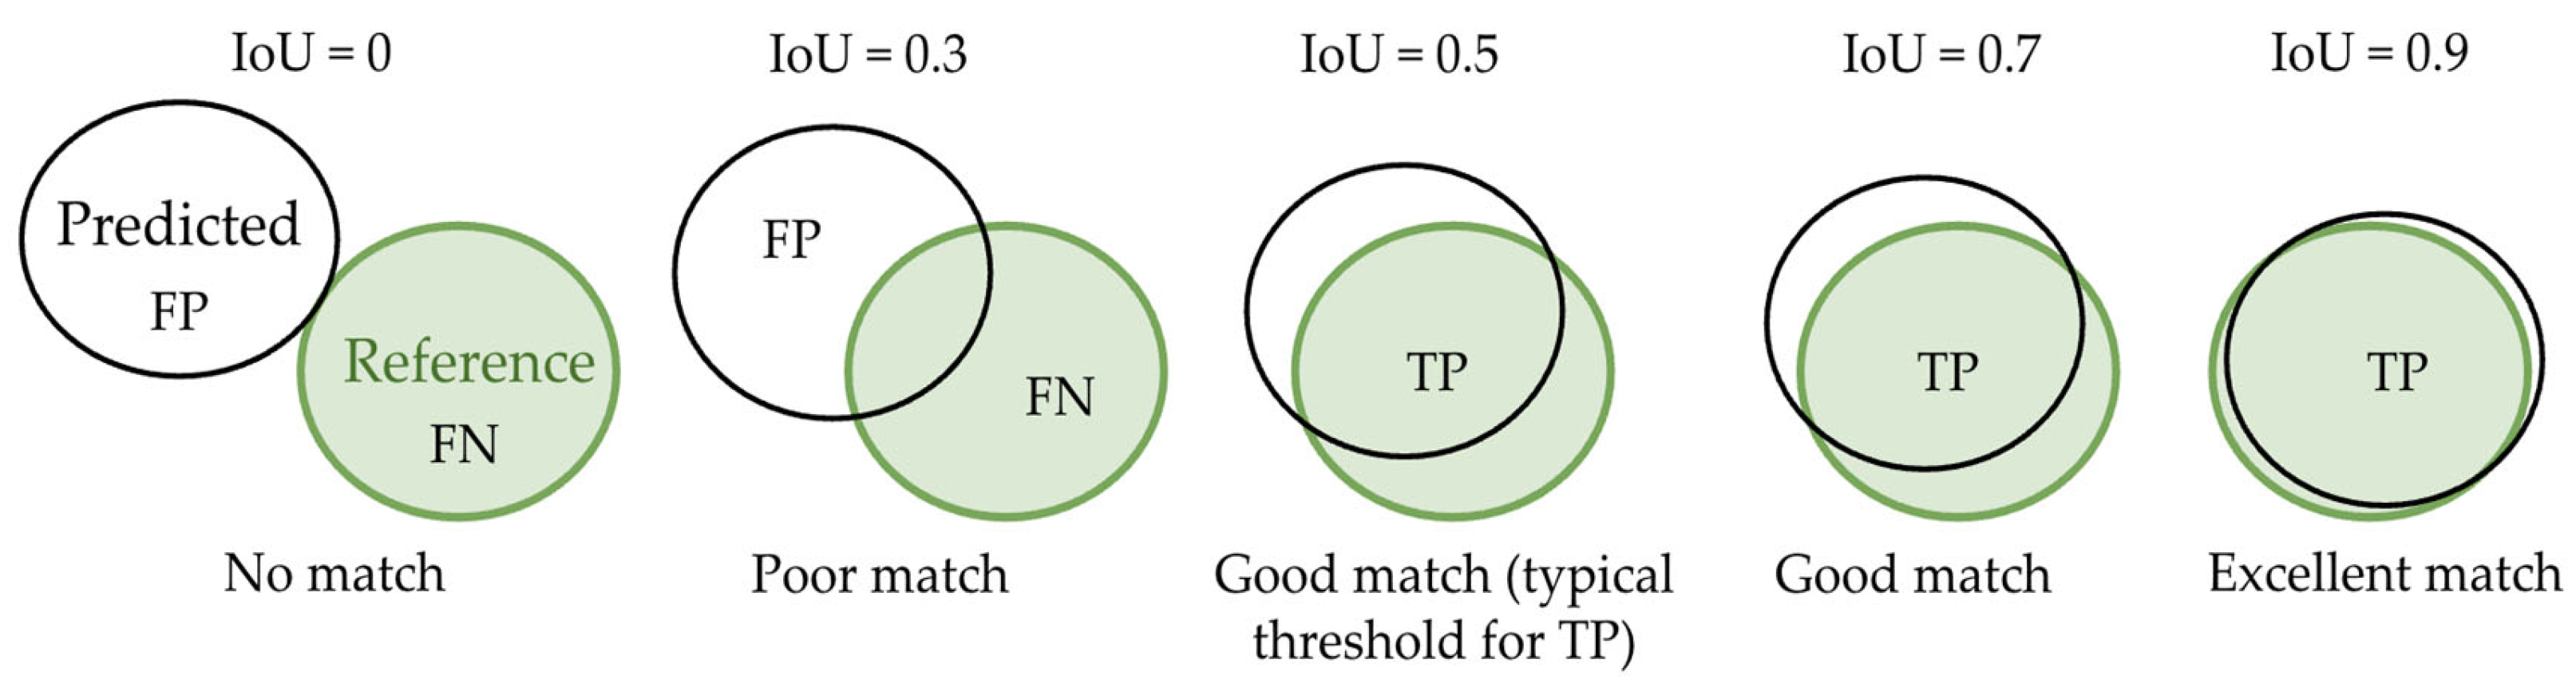
The CNN validation process makes use of the Intersection-over-Union (IoU) metric, which measures how well a predicted object polygon from a CNN model matches a corresponding object from a reference dataset. IoU calculates the ratio of the overlap (i.e., intersection) between a predicted object polygon and a reference object polygon to their combined area (i.e., union) (Figure 3 and Table 3). An IoU score is typically considered a match if it meets or exceeds a set threshold, often 0.5 or 50%, meaning that the predicted object must overlap at least half of combined reference and target object polygons to be considered a valid detection and labeled a True Positive (TP). A False Negative (FN) occurs when a reference object is missed, and a False Positive (FP) occurs when an incorrect object is classified.
Figure 2.
The Intersection over Union (IoU) process visualized. Only IoU ≽ 0.5 results in a True Positive. IoU < 0.5 will result in a false positive and/or false negative.
Figure 2.
The Intersection over Union (IoU) process visualized. Only IoU ≽ 0.5 results in a True Positive. IoU < 0.5 will result in a false positive and/or false negative.
3. Methods and Materials
3.1. Study Area
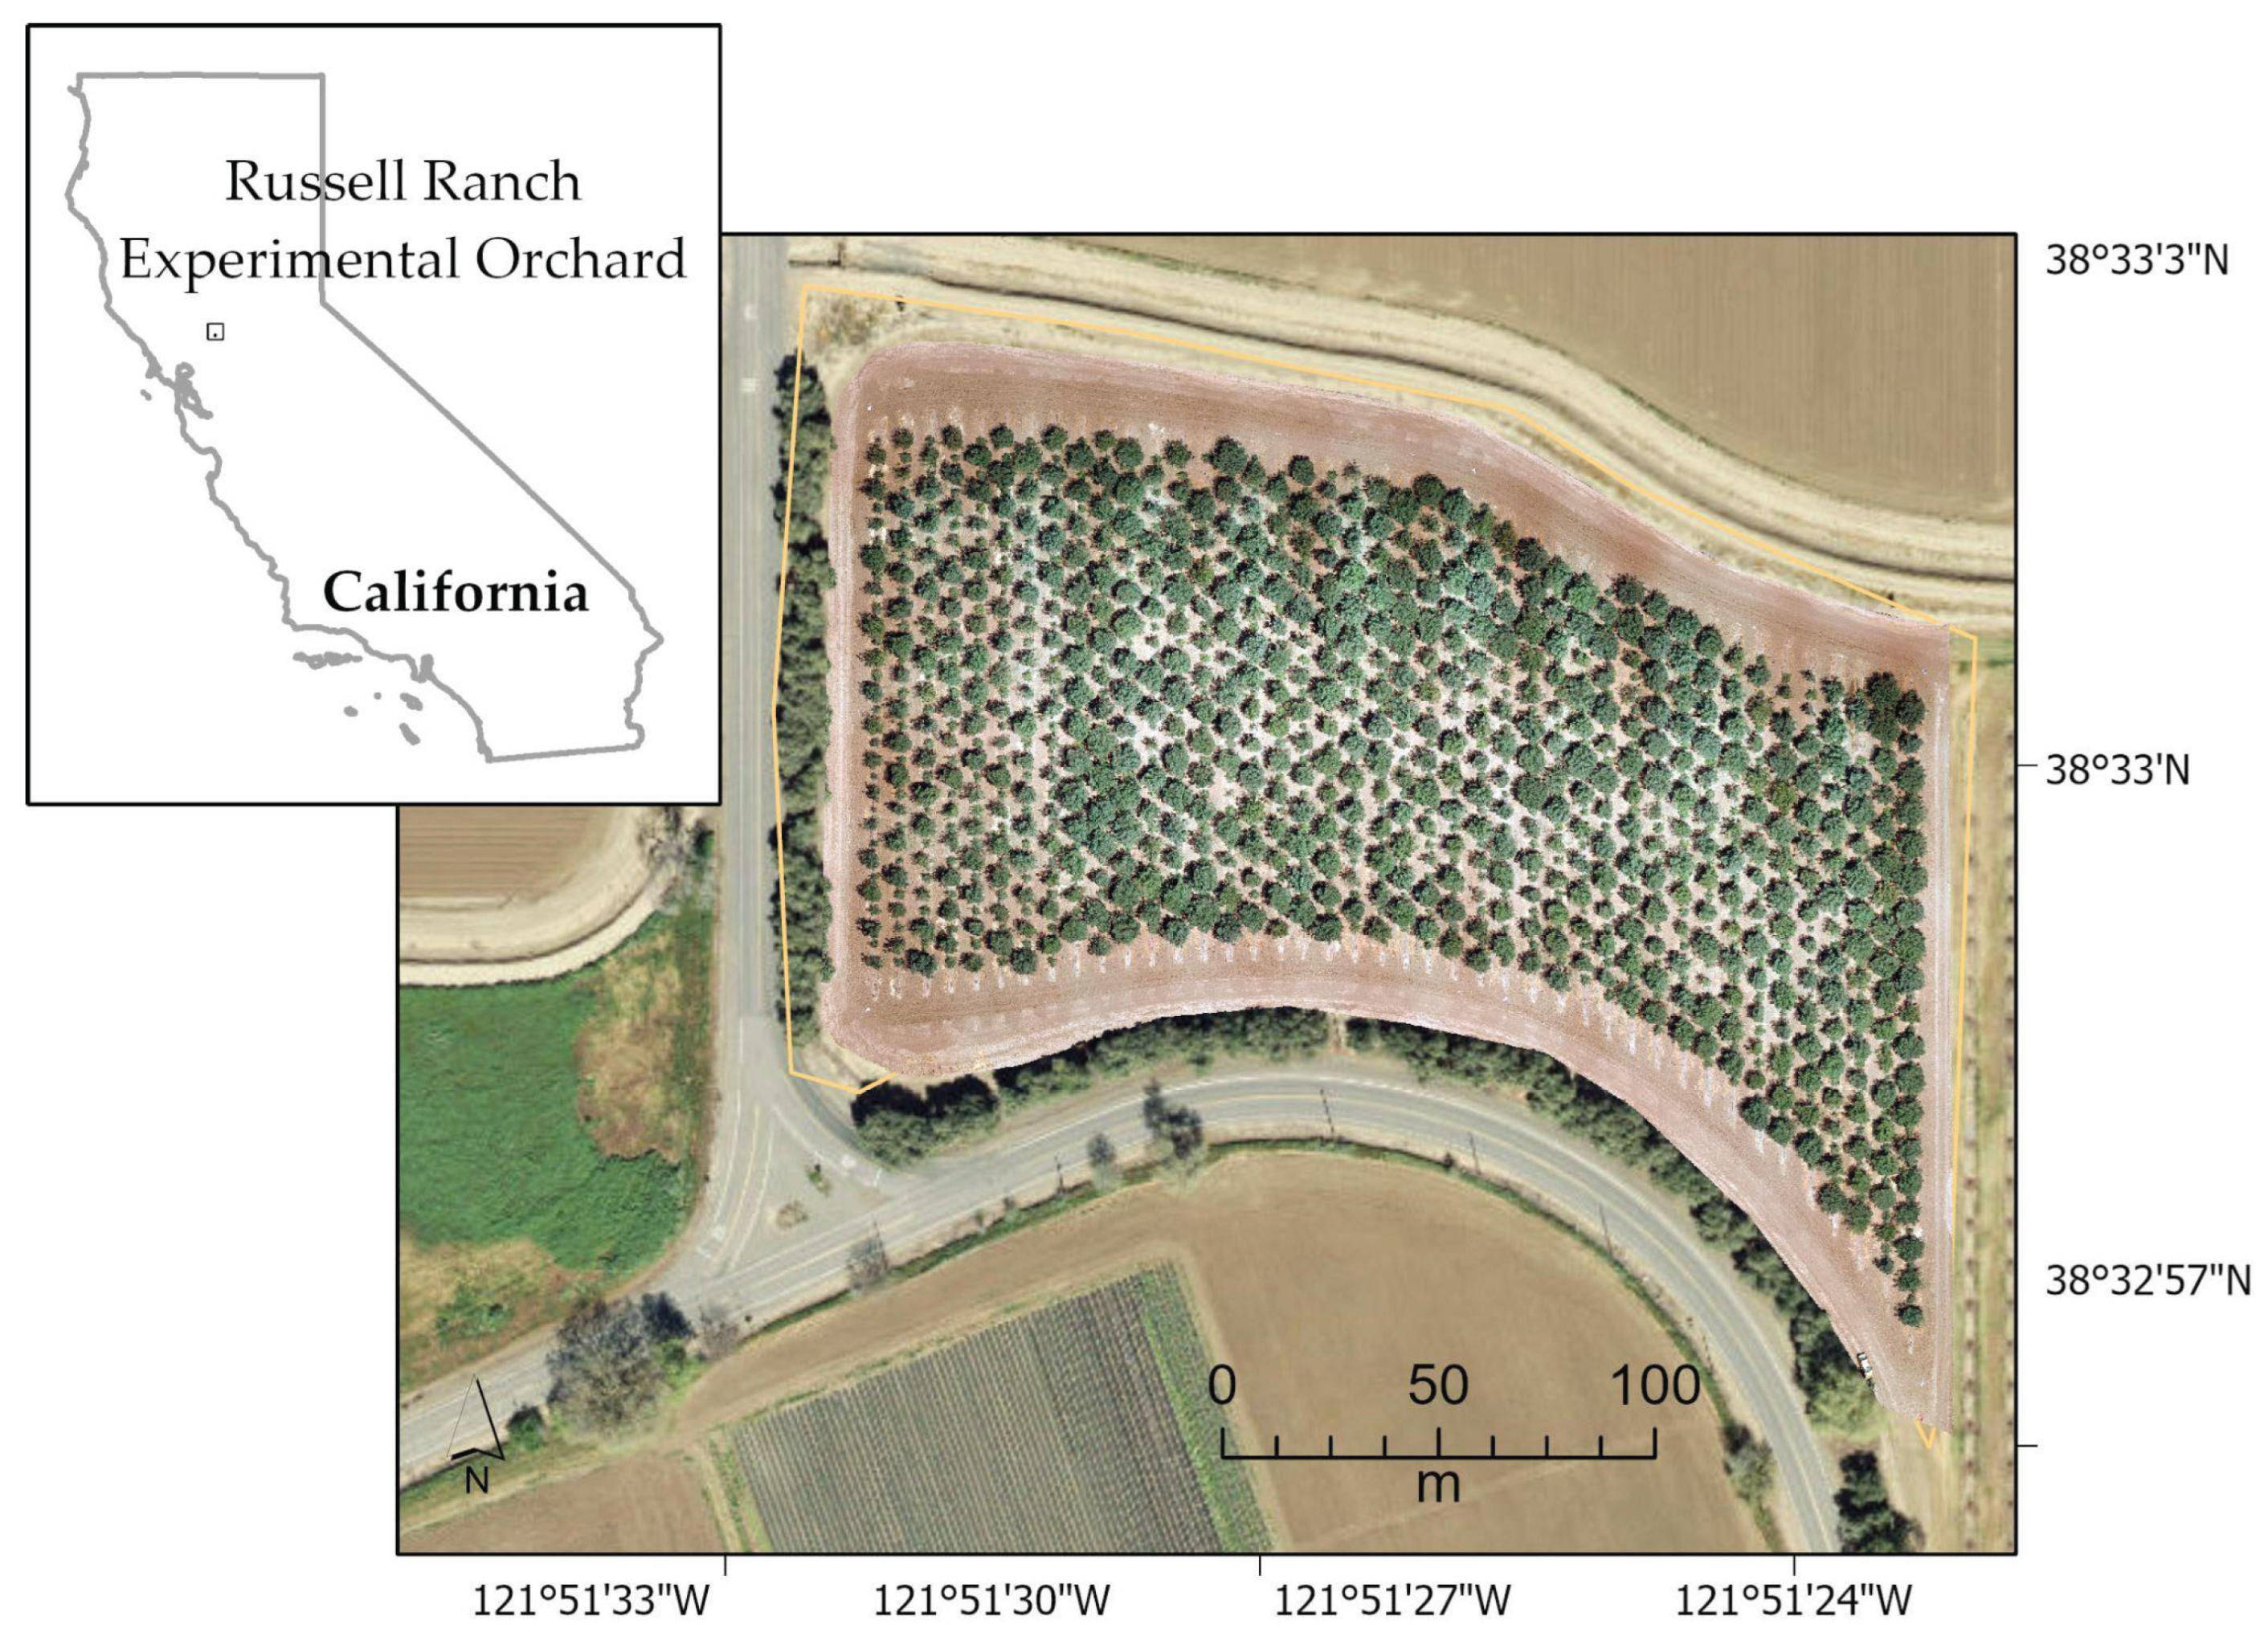
This work took place at the UC Davis Russell Ranch Sustainable Agricultural Facility (-121° 50' 59", 38° 32' 24") west of Davis, California, USA (Figure 3). The site is 120 ha in size and includes a wide variety of row and tree crops dedicated to long-term research on irrigated and dry-land agriculture in a Mediterranean climate. The Facility is 18 m ASL, with an average rainfall of 497.84 mm and a range of temperature of 3.33 - 33.89 ℃. It contains a 2.54 ha experimental orchard where UCB-1 (P. atlantica x P. integerrima) pistachio rootstocks were planted in 2013 [10]. Introduced to California early in the 20th century, the Pistachio crop became economically important in the latter half of the 20th century [50]. In 2018, when the imagery for this work was collected, California had nearly 120,000 ha of Pistachio trees growing on farms, and the total yield was 200B kg [51]. The crop continues to expand in size and yield in the state.
Pistachio trees require cool but mild winters to meet their chilling requirements and hot and dry summers to bear fruit. The trees are generally dormant in the winter (Dec-Feb), begin to leaf out and flower in March. Growth continues throughout April, May and June, and slows in July, August and September. Sometimes there is an additional flush of shoot growth in June. Nut harvest occurs from late August to early October. Most leaves drop in December, and the tree remains dormant through the following spring [51].
Figure 3.
UC Davis Russell Ranch Sustainable Agricultural Facility outside of Davis, CA. Imagery shown is from June 2018.
Figure 3.
UC Davis Russell Ranch Sustainable Agricultural Facility outside of Davis, CA. Imagery shown is from June 2018.
3.2. UAV Imagery Collection and Pre-processing
UAV imagery was collected on seven dates during the 2018 growing season for the Russell Ranch experimental orchard using a DJI Matrice 100, mounted with both X3 (RGB) and MicaSense RedEdge multispectral cameras [10]. Flights occurred on each date in sunny cloudless conditions within two hours of solar noon; however in August 2018 lighting was partly attenuated by residual smoke from nearby wild fires. For each date we flew the UAV at 30 m above ground level (AGL) in an autonomous grid-pattern mission with 90% forward and side overlaps. Standard radiometric correction methods were applied to calibrate the multispectral imagery to reflectance. The RGB camera was set at a 70° angle (slightly off nadir) to optimize 3D photogrammetric processing of the imagery. GPS coordinates for six ground control point (GCP) targets, positioned optimally around the perimeter of the orchard, were recorded with a Trimble Geo 7X and later differentially calibrated to less than 5 cm of absolute horizontal error. The GCP coordinates were incorporated into a customized combination of Pix4D Mapper Pro’s ‘3D Models’ and ‘3D Maps’ templates to create multispectral orthomosaics with 2.01 cm of spatial resolution, and RGB orthomosaics with resolutions varying between 1.4 and 1.6 cm. NDVI layers were simultaneously created during the processing of the multispectral orthomosaics using the standard NDVI formula. Digital Surface Models (DSM) and a Digital Terrain Models (DTM) were simultaneously derived during the generation of the RGB orthomosaic, and digital canopy height models (CHM) were created for each flight date by subtracting the pixel values of the ground level DTM layers from their corresponding top of canopy level DSM layers.
3.3. Reference Dataset Creation: UAV-OBIA Method
The CHM image for each date was imported into the open source SAGA GIS software application [52] to employ a watershed segmentation process using an object-based rule set to threshold the tree height and width from each date into tree crown segmented polygons. The resulting vectorized tree crown polygons for each flight date were imported into ArcGIS Pro and all overlaps and other topological inconsistencies, such as erroneous internal gaps, were manually corrected [10]. For each of the seven UAV image acquisition dates, the image and the corresponding reference polygons (n = 472) were evenly divided into training (236 trees in the eastern portion of the study area) and validation (236 trees in the western half of the study area) subsets to ensure that temporal and phenological variability was consistently represented throughout model development. Additionally, the UAV imagery intended for deep learning-based training and segmentation was similarly partitioned to maintain consistency between image and label datasets.
3.4. CNN Model Runs
All three CNNs were developed and run using ArcGIS Pro (version 3.x) workflows on a Windows Desktop with 128G RAM, a 16G NVIDIA RTX A5500 GPU graphics card, and an Intel I9 CPU. Prior to running any CNN, the ESRI package Install Deep Learning Frameworks was run. Each CNN has different features and we summarize each model's characteristics in Table 3, and definitions of parameters required can be found in Table A1.
3.4.1. Mask R-CNN
Mask R-CNN, a two-shot instance segmentation model, was implemented using ArcGIS Pro’s deep learning tools with a ResNet-18 backbone. The model was trained over 100 epochs with a batch size of six and an adaptive learning rate computed at runtime. Training data were prepared using the Export Training Data for Deep Learning tool (Figure 4), which generated image chips and associated image and labeled tiles (i.e., instance masks) required for the Mask R-CNN schema. Special attention to the initial inputs to the Export Training Data for Deep Learning tool for MASK R-CNN are necessary for efficient processing. In particular, choosing an appropriate chip size, tile size, and stride distance that align with the mean target area (in our case mean canopy size) and the input image resolution are critical. We developed a general guideline for determining optimal chip size, tile size, and stride distance based on the mean canopy polygon area and raster resolution, as well as a Python-based function that calculates the values. This general guideline and its steps are illustrated in Figure 5. This approach aligns with the computational constraints of convolutional neural networks utilized within ArcGIS Pro. From the input training image (Figure 5a), the function first calculates the mean size of the reference objects and then estimates the chip dimension as three times the average object width (in pixels), rounded to the nearest multiple of 32 pixels to conform with deep learning model requirements (Figure 5b). Tile size includes an additional 32-pixel buffer to include contextual information (Figure 5c). Tiles are exported as image tiles (Figure 5d) and labeled tiles (Figure 5e). The stride distance (distance to move in the x direction when creating the next image chip) is defined as one-quarter of the tile width to promote sample diversity through overlap (Figure 5f). The resulting parameters were exported as a DLPK (an ESRI Deep Learning Package) and used in model training and inference with ArcGIS Pro’s Train Deep Learning Model and Detect Objects Using Deep Learning tools (Figure 4).
3.4.2. YOLOv3
YOLOv3, a one-shot object detection model optimized for speed and real-time inference, was configured using ArcGIS Pro’s deep learning interface with a darknet53 backbone. Training labels were prepared as bounding boxes using the Export Training Data for Deep Learning tool with the metadata format set to 'KITTI_rectangles'. The model was trained for 100 epochs with a batch size of six, and the learning rate was determined dynamically by ArcGIS Pro, using the Train Deep Learning Model. Inference was performed on the validation dataset using the Detect Objects Using Deep Learning tool (Figure 4).
3.4.3. SAM
The Segment Anything Model (SAM), a foundation model for zero-shot segmentation, was accessed via Esri’s implementation available (i.e., as a DLPK) found in the ArcGIS Living Atlas of the World (ArcGIS Online). Since the SAM model had been pretrained on lower-resolution imagery from the SA-1B, some resampling of our imagery was required to ensure compatibility. To optimize model performance, input imagery was resampled to a series of coarser spatial resolutions ranging from 0.5 cm to 10 cm in 0.5 cm increments. This resulted in 140 images. For each resolution, the SAM model was applied using ArcGIS Pro’s Detect Objects Using Deep Learning tool (Figure 4). For consistency, we ran inference on the validation imagery in order to truly compare with the other CNN results. In this study, the SAM Text variant was used with the natural language prompts "tree" and "trees" to direct inference. No fine-tuning or retraining of the model was performed.
3.5. Validation
We validated the three sets of CNN-derived tree crown objects using standard evaluation metrics found in Table 1 and comparing the CNN-predicted trees with the reference dataset of trees for the western (validation) portion of the site. All metrics were derived using the ESRI ArcGIS Pro module Compute Accuracy For Object Detection using the UAV-OBIA validation dataset and a 0.5 IoU threshold. It should be noted that at the time of writing, the AP calculation was yielding values > 1.0, and thus, we did not use it. Mask R-CNN and YOLOv3 required standard validation (i.e. each of seven dates were tested); SAM required validation of all resampled imagery runs (i.e., 140 runs). Thus, the segmentation results at each resolution were evaluated independently, and the cell size yielding the highest F1 score was selected for comparison with other deep learning models. We then plotted all evaluation metrics for each method for each date.
4. Results
The ability of each model to find and delimit a specific individual tree crown through the growing season is shown in Figure 6. We have a reference polygon for every tree crown through seven dates, but not all models find all tree crowns at each date. For example, YOLOv3 found the example crown shown in Figure 6 at every date, but results are only provided as a bounding box. MASK R-CNN produced a tree crown polygon in every date but March. SAM had the most difficulty in March and December. The SAM polygons are closer in shape to the UAV-OBIA polygons; the MASK R-CNN polygons are more rounded in shape. While the results of this single tree are not necessarily generalizable across the entire study area, they are useful to see the variety of tree crown object results.
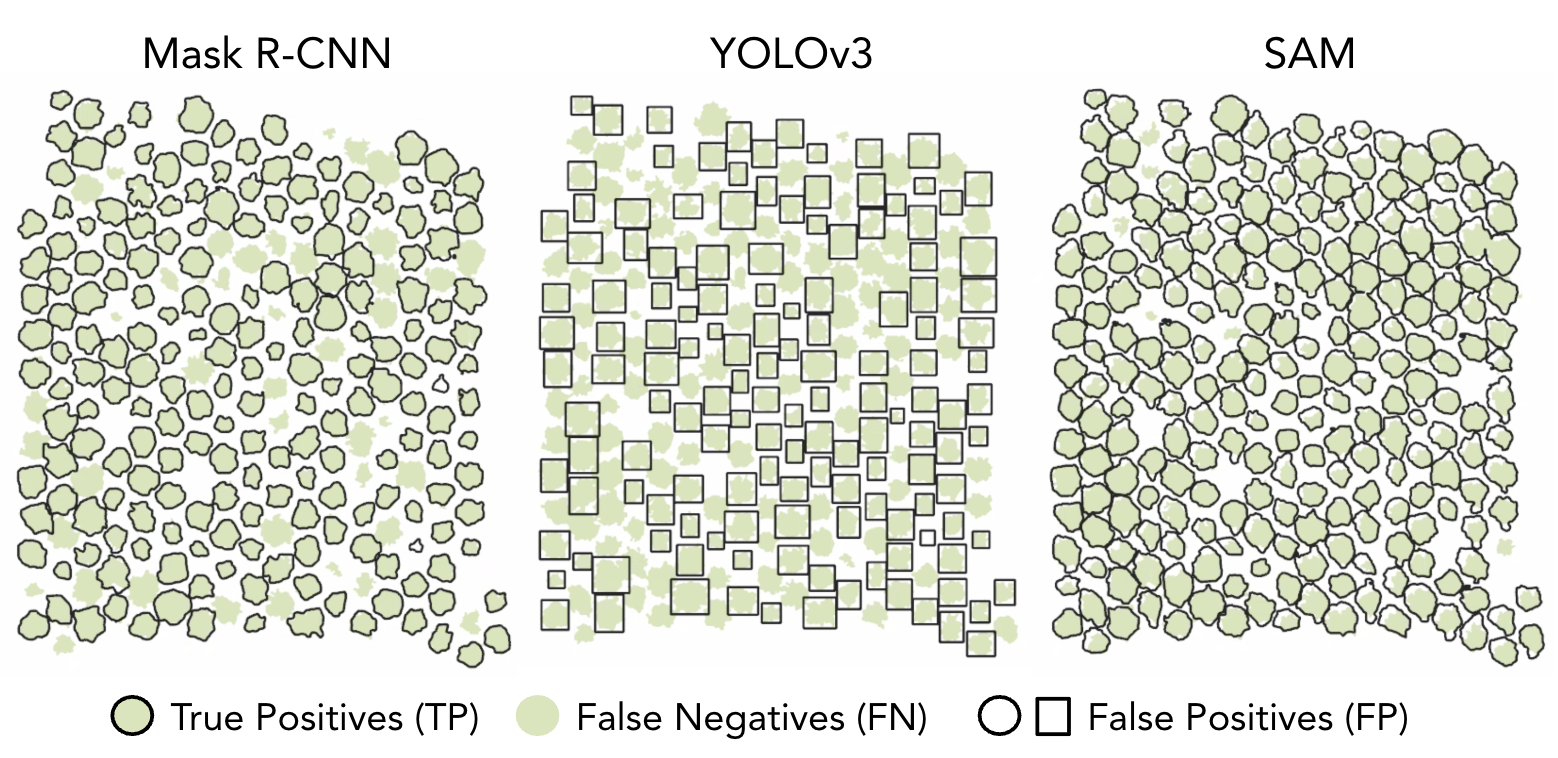
The accuracy of a model is determined by its ability to find tree crowns (true positives), not miss tree crowns (false negatives), all while minimizing erroneous tree crowns (false positives). Figure 7 shows the results from all CNNs for the months of June (Figure 7a-d) and August (Figure 7e-h). June results are useful as a benchmark as the trees are in full growth, the sun is at its highest solar angle at noon resulting in fewer internal crown shadows, and June was one of the months showing the strongest correlations between UAV metrics and field data in our earlier experiment [10]. In June, MASK R-CNN (Figure 7b) and SAM (Figure 7d) showed good results, with many true positives and few false negatives, and YOLOv3 (Figure 7c) had the poorest results, with many false negatives. In August, all models struggled due to smoke haze visible as a smudge in Figure 7e. Although the smoke haze appears minor to the naked eye, all models missed trees in the hazy portion of the image: MASK R-CNN (Figure 7f), YOLOv3 (Figure 7g), and SAM (Figure 7h) resulted in many false negatives.
These specific results are echoed when the full validation results are examined. Each model’s TP, FP, and FN are shown in Figure 8. A good model should maximize TP while minimizing FP and FN. While YOLOv3 found some trees correctly (TP) in every date, it consistently missed trees across all dates and thus performed poorly in comparison to the other two CNNs. Both MASK R-CNN and SAM performed well in May, June, September, and November, with many true positives and few false positives and false negatives. SAM consistently found more TPs than MASK R-CNN in those months. All models struggled in the March and August imagery. MASK R-CNN outperformed other models in December.
Precision (P), Recall (R), and F1 score (F1) provide more cohesive, yet slightly different stories, and these three metrics should be viewed together. Precision reports how well tree crowns are detected and is highest when there are few false positives. A high P score means the model did not mistakenly classify non-tree areas as trees. Recall reports the model’s ability to find the most tree crowns from the imagery and is highest when there are few missing tree crowns. F1 score offers a balanced view by combining P and R. It is valuable when both FP and FN matter equally. As shown in Figure 9, these results echo those discussed above. YOLOv3 was overall the poorest performer. The relatively high YOLOv3 Precision scores are a result of high true positives across the year, but high false positives and false negatives across the year result in low Recall and F1 scores. SAM and MASK R-CNN accuracies were highest in September (F1 of 0.95 and 0.94, respectively) and November (F1 of 0.89 and 0.90, respectively). In May and June their scores were also strong, with F1 of 0.85 - 0.89 for MASK R-CNN and 0.79 - 0.91 for SAM. Early season trees (i.e., March) challenged all models; late season trees (i.e., December) challenged SAM in particular; and August trees challenged all models. There is context that can explain the dips in March, August and December scores. In March, Pistachio trees are leafless, causing challenges for the CNNs. In August 2018, there were several fires burning nearby, and smoke appeared in the imagery, causing some haziness and resulting lack of contrast which SAM struggled with (Figure 7e). In December, the Pistachio leaves were bright red, and SAM struggled finding trees.
5. Discussion
In this paper we have provided a systematic evaluation of three CNN models for object detection of individual orchard tree crowns over a growing season. The work brings up several important applied and technical discussion points.
5.1. Tree Crown Objects
Our paper and many others focusing on individual tree crown detection methods have at their core the assumption that the size and structure of a tree crown is indicative of plant performance, such as productivity and yield [3,4,12]. This is a reasonable assumption, because these characteristics directly influence a tree's capacity to capture sunlight for photosynthesis, which drives primary production. Crown characteristics, including height, width, volume, and shape, are conditioned by several factors, including species-specific branching patterns that influence how efficiently a tree can capture light and allocate resources for growth and fruit production. Environmental conditions also play a role: soil quality, water availability, and climate also affect crown development. Trees in optimal conditions can develop larger and more complex crowns, whereas those in poor or resource-scarce environments may exhibit stunted growth. Resource competition, especially for light, is also important. In densely planted orchards or forests, trees must compete with their neighbors for light. This competition influences crown shape and structure, often leading to taller, narrower crowns in crowded environments as trees grow vertically to access sunlight. In orchards, careful management of tree spacing helps optimize light capture and maximize the productivity of each tree [19,53]. Since the trees discussed in this paper are deliberately planted with optimum spacing, we are operating in the ideal setting for individual tree detection. Others working in orchard or sparsely vegetated natural settings report this [3,5,8,9,18,34,54]; those working in more heterogeneous settings, with closely spaced and heavily overlapping tree crowns will have more challenges extracting individual tree crowns using any object detection method [55].
5.2. Illumination
We also worked across the growing season and must ask about the role of varying illumination on individual tree detection. While critically important, imagery from drones present two related challenges for data analysis in orchard settings: high spatial resolution and illumination effects. Flying low increases imagery spatial resolution, which means that target surfaces exhibit local spatial heterogeneity (e.g., high detail) caused by canopy architecture (i.e., reflectance anisotropy), resulting in complex scattering and shadowing [33,56,57]. Flying throughout the growing season, even at the same hour, compounds these challenges because of changing sun orientation. The sun angle at noon varies throughout the year at the Study Area (e.g., from 28.1° in December to 74.6° in June), resulting in shadows within and adjacent to trees. Our reference dataset, created using the CHM from each date, minimized such impacts, but was not immune to them. One published method to deal with varying illumination is to use strict image capture controls such as repeated flight plans and radiometric calibration, and to work with the NDVI time series which can be consistent even in variable illumination conditions [58]. However, this approach would be complicated in our context, as most of the pre-trained models have been trained primarily using RGB images, and thus may not perform optimally with multispectral or hyperspectral data [48,59].
5.3. OBIA and CNNs for Tree Crown Detection
CNNs are powerful tools for object detection, and since their inception there have been numerous improvements and evolutions in the tools. We provide a cross-section of CNN approaches here - two-shot, one-shot, and zero-shot - and show how they vary in their ability to pick out individual trees in high resolution imagery. Our reference dataset, provided by an OBIA approach using a CHM is an appropriate discussion counter point. In 2010, when the OBIA paradigm was introduced [25], it quickly became the standard for object detection in high resolution imagery. However, since OBIA models are rule-based models without learning capacity, the rule sets can become complex and cumbersome, limiting transferability. In comparison, CNNs have many advantages: adaptability, transferability, objectivity. CNNs have shown marked improvements over OBIA methods when using CNN detectors in both natural and agricultural settings. For example, in a case study evaluating the detection of protected Ziziphus lotus shrubs, CNNs had higher precision, recall and other scores than OBIA methods. Additionally, they were faster, and allowed for transferability across regions [26]. Additionally, Ye et al. found Mask R-CNN to be more accurate and effective than OBIA methods at both extraction and counting of cabbage plants and monitoring cabbage plant growth in planted fields [60]. As has been shown elsewhere, MASK and SAM CNNs can provide strong results. The YOLO CNN we used (YOLOv3) is an older version, with more recent versions available elsewhere; but we wanted to restrict our evaluation to CNNs found in ESRI software.
5.4. Model Training & Transferability
The way in which CNNs use training data depends heavily on the specific model architecture. Two-shot models, such as Mask R-CNN, rely on large volumes of labeled training data to perform object detection and classification accurately. Often, such labeled training data requires significant manual input to distinguish objects from their background and are thus not always available [19]. In contrast, zero-shot models, like the Segment Anything Model (SAM), can be prompted with minimal training data (i.e., text prompts as used in this paper) because they are extensively pre-trained on millions of images [48]. This pre-training enables them to generalize well across a variety of tasks and datasets with little additional data [47]. We found this to be the case with SAM. By just using the word “tree” or “trees” as a prompt, we had very good results. Except for two months: March, when the trees had no leaves, and December, when the trees were bright red in color. MASK R-CNN performed better in August and December, because we were able to train the CNN using those data, hence the better results. It should also be noted that the concept of prompt engineering is a relatively new field of research, particularly in the area of large language models (LLMs) [61]. Designing and refining effective prompts to achieve quality results might yet become more important in the context of CNNs training.
One approach we did not evaluate is transfer learning. This is a key technique for optimizing CNNs across different domains. Transfer learning involves pre-training a CNN’s convolutional backbone on a one dataset, often from a domain different from the target domain, and then fine-tuning the model on a different dataset relevant to the specific task [26,40]. For example, a model pre-trained on an olive orchard tree crowns could be fine-tuned to detect pistachio trees by providing a smaller, domain-specific dataset. In our case, we could have pre-trained using imagery from one month and tested the model’s applicability in another month. Transfer learning can drastically reduce the need for large labeled datasets in the target domain while maintaining high accuracy. Several pre-trained tree crown models, including some from the ESRI Deep Learning pre-trained model library, are available on platforms like ArcGIS Living Atlas (https://livingatlas.arcgis.com).
5.5. Ease of CNN Use
Finally, we would like to discuss the ease of use of these CNN methods. While powerful, these tools are often complex and setting them up can be daunting for non-computer scientists. Frameworks such as PyTorch, TensorFlow, and Keras API offer deep customization for CNNs [40], but are not always immediately intuitive. However, recent developments, such as the new open-source Python SAM package called segment-geospatial (samgeo), developed by Wu and Osco [59], show great promise for improving accessibility. This package has been implemented in Google Colab and has begun to be heavily used [59,62,63], providing an environment that simplifies deployment without requiring extensive hardware resources.
In this study, all the CNNs we evaluated were pre-loaded in ESRI ArcGIS Pro, which offers additional CNNs such as Single Shot Detector (SSD), RetinaNet, FasterRCN, MMDetection, and DETReg. It should be noted that the YOLO CNN evaluated here does have an updated version (e.g., YOLOv9) available elsewhere. ESRI has made CNN integration more user-friendly by creating cloud-based options like the Deep Learning Studio, a web app available in ArcGIS Enterprise. This tool allows users to collect training samples, train models, and use inference tools within integrated workflows for deep learning analysis. Early instances of Deep Learning in ArcGIS Online (AGOL) are also now available in both Map Viewer Classic and Map Viewer for analysis functions. Interestingly, despite these developments in deep learning, ESRI does not yet offer a robust object-based image analysis (OBIA) capability. However, we found that having all the CNN models available in one software package, such as ArcGIS Pro, significantly streamlined our workflow, making it easier to access and apply these methods for our tree crown extraction task, and making it possible to vary the numerous parameters required.
6. Conclusions
Extracting the irregular and complex shapes of individual tree crowns from high-resolution imagery can play a crucial role in many applications, including precision agriculture. Understanding tree crown characteristics through time is essential for managing tree growth and maximizing productivity, particularly in orchard settings. The application of CNN methods to high spatial resolution UAV imagery will continue to provide valuable data for improving orchard management strategies. By collecting tree crown measurements at multiple time points throughout the growing season, researchers can link canopy dynamics to other agronomic metrics such as yield or water stress through Geographic Information System (GIS) operations, enabling comprehensive analysis and monitoring [10].
There are many automated and semi-automated methods to extract individual tree crowns from high resolution imagery. In this paper we aimed to contribute insight into which CNN model offers the best balance of accuracy and ease of implementation for orchard management tasks. We also evaluated their applicability within one software ecosystem, ESRI ArcGIS Pro, and showed how such an approach offers users a streamlined, efficient way to detect objects in geographic imagery. By using these advanced tools, managers can make more informed decisions about tree spacing, irrigation, fertilization, and pest control, ultimately enhancing tree health, yield, and resource efficiency throughout the growing season.
We found that both MASK R-CNN and SAM were very promising tools to extract individual tree crowns from high resolution UAV imagery. MASK R-CNN was more customizable and dealt with some imagery challenges better than SAM, due to training using the original imagery, but SAM was faster and easier to use and produced very good results that in some cases surpassed those from MASK R-CNN. YOLOv3 was the poorest performer. We hope this systematic evaluation will provide useful information on the relative strengths and weaknesses of three CNN models, and provide valuable information for ecological monitoring, precision agriculture, and resource management.
Author Contributions
For research articles with several authors, a short paragraph specifying their individual contributions must be provided. The following statements should be used “Conceptualization, M.K. and S.F.; methodology, M.K., S.F., S.H., F.Z.; software, M.K. and S.F..; validation, M.K., S.F. and F.Z.; formal analysis, M.K., S.F., S.H., and F.Z., investigation, X.X.; resources, A.L. and S.H..; data curation, S.F., S.H., and E.J.; writing—original draft preparation, M.K., S.F..; writing—review and editing, M.K. A.L. and E.J.; visualization, M.K., S.F. and A.L.; supervision, M.K.; project administration, M.K..; funding acquisition, M.K., A.L.. All authors have read and agreed to the published version of the manuscript.” Please turn to the CRediT taxonomy for the term explanation. Authorship must be limited to those who have contributed substantially to the work reported.
Funding
This research received no external funding.
Data Availability Statement
Data available on request.
Acknowledgments
This work was supported by the USDA - National Institute of Food and Agriculture (Hatch Project 7003843; Hales).
Conflicts of Interest
The authors declare no conflict of interest. The funders had no role in the design of the study; in the collection, analyses, or interpretation of data; in the writing of the manuscript, or in the decision to publish the results.
Appendix A
Appendix A.1
There are many parameters called by the three CNNs evaluated here. We list them below (Table A1). The parameters are organized based on their general sequence of use in the CNN workflow.

Table A1.
Parameters called by various ESRI Tools in the CNN workflow in ArcGIS Pro and their definitions.
Table A1.
Parameters called by various ESRI Tools in the CNN workflow in ArcGIS Pro and their definitions.
| Parameter | Definition (from ArcGIS Pro Tools) | ESRI Tool | Model |
| Instance masks | When the image chips and tiles are created, additional chips and tiles are created that include a mask showing a labeled target. | Export Training Data for Deep Learning | MASK R-CNN |
| Metadata Format | Specifies the format that will be used for the output metadata labels. | Export Training Data for Deep Learning | MASK R-CNN YOLOv3 |
| Stride distance | The distance to move in the x direction when creating the next image chips. When stride is equal to tile size, there will be no overlap. When stride is equal to half the tile size, there will be 50 percent overlap. | Export Training Data for Deep Learning | MASK R-CNN YOLOv3 |
| Tile size | The size of the image chips | Export Training Data for Deep Learning Detect Objects Using Deep Learning |
MASK R-CNN YOLOv3 |
| Backbone Model | Specifies the preconfigured neural network that will be used as the architecture for training the new model. This method is known as Transfer Learning. | Train Deep Learning Model | MASK R-CNN YOLOv3 |
| Batch size | The number of training samples that will be processed for training at one time. | Train Deep Learning Model Detect Objects Using Deep Learning |
MASK R-CNN YOLOv3 |
| Chip size | The size of the image that will be used to train the model. Images will be cropped to the specified chip size. | Train Deep Learning Model | MASK R-CNN YOLOv3 |
| Epochs | The maximum number of epochs for which the model will be trained. A maximum epoch of 1 means the dataset will be passed forward and backward through the neural network one time. The default value is 20. | Train Deep Learning Model | MASK R-CNN YOLOv3 |
| Learning rate | The rate at which existing information will be overwritten with newly acquired information throughout the training process. If no value is specified, the optimal learning rate will be extracted from the learning curve during the training process. | Train Deep Learning Model | MASK R-CNN YOLOv3 |
| Non-maximum suppression (Duplicates removed) | Specifies whether non-maximum suppression will be performed in which duplicate objects are identified and duplicate features with lower confidence value are removed. | Detect Objects Using Deep Learning | MASK R-CNN YOLOv3 SAM |
| Padding | The number of pixels at the border of image tiles from which predictions will be blended for adjacent tiles. To smooth the output while reducing artifacts, increase the value. The maximum value of the padding can be half the tile size value. The argument is available for all model architectures. | Detect Objects Using Deep Learning | MASK R-CNN YOLOv3 SAM |
References
- Reddy Maddikunta, P.K.; Hakak, S.; Alazab, M.; Bhattacharya, S.; Gadekallu, T.R.; Khan, W.Z.; Pham, Q.-V. Unmanned Aerial Vehicles in Smart Agriculture: Applications, Requirements, and Challenges. IEEE Sens. J. 2021, 21, 17608–17619. [Google Scholar] [CrossRef]
- Ghazal, S.; Munir, A.; Qureshi, W.S. Computer Vision in Smart Agriculture and Precision Farming: Techniques and Applications. Artificial Intelligence in Agriculture 2024, 13, 64–83. [Google Scholar] [CrossRef]
- Zhang, C.; Valente, J.; Kooistra, L.; Guo, L.; Wang, W. Orchard Management with Small Unmanned Aerial Vehicles: A Survey of Sensing and Analysis Approaches. Precis. Agric. 2021, 22, 2007–2052. [Google Scholar] [CrossRef]
- Jiménez-Brenes, F.M.; López-Granados, F.; de Castro, A.I.; Torres-Sánchez, J.; Serrano, N.; Peña, J.M. Quantifying Pruning Impacts on Olive Tree Architecture and Annual Canopy Growth by Using UAV-Based 3D Modelling. Plant Methods 2017, 13, 55. [Google Scholar] [CrossRef]
- Stateras, D.; Kalivas, D. Assessment of Olive Tree Canopy Characteristics and Yield Forecast Model Using High Resolution UAV Imagery. Collect. FAO Agric. 2020, 10, 385. [Google Scholar] [CrossRef]
- Campos, J.; Llop, J.; Gallart, M.; García-Ruiz, F.; Gras, A.; Salcedo, R.; Gil, E. Development of Canopy Vigour Maps Using UAV for Site-Specific Management during Vineyard Spraying Process. Precis. Agric. 2019, 20, 1136–1156. [Google Scholar] [CrossRef]
- Zhang, J.; Yu, F.; Zhang, Q.; Wang, M.; Yu, J.; Tan, Y. Advancements of UAV and Deep Learning Technologies for Weed Management in Farmland. Agronomy (Basel) 2024, 14, 494. [Google Scholar] [CrossRef]
- Popescu, D.; Ichim, L.; Stoican, F. Orchard Monitoring Based on Unmanned Aerial Vehicles and Image Processing by Artificial Neural Networks: A Systematic Review. Front. Plant Sci. 2023, 14, 1237695. [Google Scholar] [CrossRef]
- Csillik, O.; Cherbini, J.; Johnson, R.; Lyons, A.; Kelly, M. Identification of Citrus Trees from Unmanned Aerial Vehicle Imagery Using Convolutional Neural Networks. Drones 2018, 2, 39. [Google Scholar] [CrossRef]
- Jacygrad, E.; Kelly, M.; Hogan, S.; Preece, J.; Golino, D.; Michelmore, R. Comparison between Field Measured and UAV-Derived Pistachio Tree Crown Characteristics throughout a Growing Season. Drones 2022, 6, 343. [Google Scholar] [CrossRef]
- Hogan, S.D.; Kelly, M.; Stark, B.; Chen, Y. Unmanned Aerial Systems for Agriculture and Natural Resources. Calif. Agric. 2017, 71, 5–14. [Google Scholar] [CrossRef]
- Ameslek, O.; Zahir, H.; Latifi, H.; Bachaoui, E.M. Combining OBIA, CNN, and UAV Imagery for Automated Detection and Mapping of Individual Olive Trees. Smart Agricultural Technology 2024, 9, 100546. [Google Scholar] [CrossRef]
- Cheng, G.; Han, J. A Survey on Object Detection in Optical Remote Sensing Images. ISPRS J. Photogramm. Remote Sens. 2016, 117, 11–28. [Google Scholar] [CrossRef]
- Zhang, C.; Kovacs, J.M. The Application of Small Unmanned Aerial Systems for Precision Agriculture: A Review. Precis. Agric. 2012, 13, 693–712. [Google Scholar] [CrossRef]
- Matese, A.; Toscano, P.; Di Gennaro, S.F.; Genesio, L.; Vaccari, F.P.; Primicerio, J.; Belli, C.; Zaldei, A.; Bianconi, R.; Gioli, B. Intercomparison of UAV, Aircraft and Satellite Remote Sensing Platforms for Precision Viticulture. Remote Sensing 2015, 7, 2971–2990. [Google Scholar] [CrossRef]
- Zhao, H.; Morgenroth, J.; Pearse, G.; Schindler, J. A Systematic Review of Individual Tree Crown Detection and Delineation with Convolutional Neural Networks (CNN). Curr. For. Rep. 2023, 9, 149–170. [Google Scholar] [CrossRef]
- Blanco, V.; Blaya-Ros, P.J.; Castillo, C.; Soto-Vallés, F.; Torres-Sánchez, R.; Domingo, R. Potential of UAS-Based Remote Sensing for Estimating Tree Water Status and Yield in Sweet Cherry Trees. Remote Sensing 2020, 12, 2359. [Google Scholar] [CrossRef]
- Tu, Y.-H.; Phinn, S.; Johansen, K.; Robson, A.; Wu, D. Optimising Drone Flight Planning for Measuring Horticultural Tree Crop Structure. ISPRS J. Photogramm. Remote Sens. 2020, 160, 83–96. [Google Scholar] [CrossRef]
- Freudenberg, M.; Magdon, P.; Nölke, N. Individual Tree Crown Delineation in High-Resolution Remote Sensing Images Based on U-Net. Neural Comput. Appl. 2022, 34, 22197–22207. [Google Scholar] [CrossRef]
- Fawcett, D.; Bennie, J.; Anderson, K. Monitoring Spring Phenology of Individual Tree Crowns Using Drone-acquired NDVI Data. Remote Sens. Ecol. Conserv. 2021, 7, 227–244. [Google Scholar] [CrossRef]
- Ball, J.G.C.; Hickman, S.H.M.; Jackson, T.D.; Koay, X.J.; Hirst, J.; Jay, W.; Archer, M.; Aubry-Kientz, M.; Vincent, G.; Coomes, D.A. Accurate Delineation of Individual Tree Crowns in Tropical Forests from Aerial RGB Imagery Using Mask R-CNN. Remote Sens. Ecol. Conserv. 2023. [Google Scholar] [CrossRef]
- Modica, G.; Messina, G.; De Luca, G.; Fiozzo, V.; Praticò, S. Monitoring the Vegetation Vigor in Heterogeneous Citrus and Olive Orchards. A Multiscale Object-Based Approach to Extract Trees’ Crowns from UAV Multispectral Imagery. Comput. Electron. Agric. 2020, 175, 105500. [Google Scholar] [CrossRef]
- Yang, K.; Zhang, H.; Wang, F.; Lai, R. Extraction of Broad-Leaved Tree Crown Based on UAV Visible Images and OBIA-RF Model: A Case Study for Chinese Olive Trees. Remote Sens. (Basel) 2022, 14, 2469. [Google Scholar] [CrossRef]
- Park, J.Y.; Muller-Landau, H.C.; Lichstein, J.W.; Rifai, S.W.; Dandois, J.P.; Bohlman, S.A. Quantifying Leaf Phenology of Individual Trees and Species in a Tropical Forest Using Unmanned Aerial Vehicle (UAV) Images. Remote Sensing 2019, 11, 1534. [Google Scholar] [CrossRef]
- Blaschke, T.; Hay, G.J.; Kelly, M.; Lang, S.; Hofmann, P. Geographic Object-Based Image Analysis–towards a New Paradigm. ISPRS J. Photogramm. Remote Sens. 2014. [Google Scholar] [CrossRef]
- Guirado, E.; Tabik, S.; Alcaraz-Segura, D.; Cabello, J.; Herrera, F. Deep-Learning Versus OBIA for Scattered Shrub Detection with Google Earth Imagery: Ziziphus Lotus as Case Study. Remote Sensing 2017, 9, 1220. [Google Scholar] [CrossRef]
- Peña, J.M.; Torres-Sánchez, J.; de Castro, A.I.; Kelly, M.; López-Granados, F. Weed Mapping in Early-Season Maize Fields Using Object-Based Analysis of Unmanned Aerial Vehicle (UAV) Images. PLoS One 2013, 8, e77151. [Google Scholar] [CrossRef] [PubMed]
- Huang, H.; Lan, Y.; Yang, A.; Zhang, Y.; Wen, S.; Deng, J. Deep Learning versus Object-Based Image Analysis (OBIA) in Weed Mapping of UAV Imagery. Int. J. Remote Sens. 2020, 41, 3446–3479. [Google Scholar] [CrossRef]
- Guo, Q.; Kelly, M.; Gong, P.; Liu, D. An Object-Based Classification Approach in Mapping Tree Mortality Using High Spatial Resolution Imagery. GISci. Remote Sens. 2007, 44, 24–47. [Google Scholar] [CrossRef]
- Ke, Y.; Quackenbush, L.J. A Review of Methods for Automatic Individual Tree-Crown Detection and Delineation from Passive Remote Sensing. Int. J. Remote Sens. 2011, 32, 4725–4747. [Google Scholar] [CrossRef]
- Baena, S.; Moat, J.; Whaley, O.; Boyd, D.S. Identifying Species from the Air: UAVs and the Very High Resolution Challenge for Plant Conservation. PLoS One 2017, 12, e0188714. [Google Scholar] [CrossRef] [PubMed]
- Yurtseven, H.; Akgul, M.; Coban, S.; Gulci, S. Determination and Accuracy Analysis of Individual Tree Crown Parameters Using UAV Based Imagery and OBIA Techniques. Measurement 2019, 145, 651–664. [Google Scholar] [CrossRef]
- Tu, Y.-H.; Johansen, K.; Phinn, S.; Robson, A. Measuring Canopy Structure and Condition Using Multi-Spectral UAS Imagery in a Horticultural Environment. Remote Sensing 2019, 11, 269. [Google Scholar] [CrossRef]
- Torres-Sánchez, J.; de Castro, A.I.; Peña, J.M.; Jiménez-Brenes, F.M.; Arquero, O.; Lovera, M.; López-Granados, F. Mapping the 3D Structure of Almond Trees Using UAV Acquired Photogrammetric Point Clouds and Object-Based Image Analysis. Biosystems Eng. 2018, 176, 172–184. [Google Scholar] [CrossRef]
- Marques, P.; Pádua, L.; Adão, T.; Hruška, J.; Peres, E.; Sousa, A.; Sousa, J.J. UAV-Based Automatic Detection and Monitoring of Chestnut Trees. Remote Sensing 2019, 11, 855. [Google Scholar] [CrossRef]
- Sun, Y.; Sun, Z.; Chen, W. The Evolution of Object Detection Methods. Eng. Appl. Artif. Intell. 2024, 133, 108458. [Google Scholar] [CrossRef]
- Hinton, G.E.; Salakhutdinov, R.R. Reducing the Dimensionality of Data with Neural Networks. Science 2006, 313, 504–507. [Google Scholar] [CrossRef] [PubMed]
- Hinton, G.; Deng, L.; Yu, D.; Dahl, G.; Mohamed, A.-R.; Jaitly, N.; Senior, A.; Vanhoucke, V.; Nguyen, P.; Sainath, T.; et al. Deep Neural Networks for Acoustic Modeling in Speech Recognition: The Shared Views of Four Research Groups. IEEE Signal Process. Mag. 2012, 29, 82–97. [Google Scholar] [CrossRef]
- He, K.; Zhang, X.; Ren, S.; Sun, J. Deep Residual Learning for Image Recognition. In Proceedings of the 2016 IEEE Conference on Computer Vision and Pattern Recognition (CVPR); IEEE, June 2016; pp. 770–778. [Google Scholar]
- Hoeser, T.; Bachofer, F.; Kuenzer, C. Object Detection and Image Segmentation with Deep Learning on Earth Observation Data: A Review—Part II: Applications. Remote Sensing 2020, 12, 3053. [Google Scholar] [CrossRef]
- Hoeser, T.; Kuenzer, C. Object Detection and Image Segmentation with Deep Learning on Earth Observation Data: A Review-Part I: Evolution and Recent Trends. Remote Sens. (Basel) 2020, 12, 1667. [Google Scholar] [CrossRef]
- Ren, Y.; Yang, J.; Zhang, Q.; Guo, Z. Multi-Feature Fusion with Convolutional Neural Network for Ship Classification in Optical Images. NATO Adv. Sci. Inst. Ser. E Appl. Sci. 2019, 9, 4209. [Google Scholar] [CrossRef]
- Carranza-García, M.; Torres-Mateo, J.; Lara-Benítez, P.; García-Gutiérrez, J. On the Performance of One-Stage and Two-Stage Object Detectors in Autonomous Vehicles Using Camera Data. Remote Sens. (Basel) 2020, 13, 89. [Google Scholar] [CrossRef]
- Girshick, R.; Donahue, J.; Darrell, T.; Malik, J. Rich Feature Hierarchies for Accurate Object Detection and Semantic Segmentation. In Proceedings of the 2014 IEEE Conference on Computer Vision and Pattern Recognition; 2014. [Google Scholar]
- He, K.; Gkioxari, G.; Dollar, P.; Girshick, R. Mask R-CNN. IEEE Trans. Pattern Anal. Mach. Intell. 2020, 42, 386–397. [Google Scholar] [CrossRef] [PubMed]
- Lin, T.-Y.; Maire, M.; Belongie, S.; Hays, J.; Perona, P.; Ramanan, D.; Dollár, P.; Zitnick, C.L. Microsoft COCO: Common Objects in Context. In Computer Vision – ECCV 2014; Lecture notes in computer science; Springer International Publishing: Cham, 2014; pp. 740–755. ISBN 9783319106014. [Google Scholar]
- Kirillov, A.; Mintun, E.; Ravi, N.; Mao, H.; Rolland, C.; Gustafson, L.; Xiao, T.; Whitehead, S.; Berg, A.C.; Lo, W.-Y.; et al. Segment Anything. In Proceedings of the Proceedings of the IEEE/CVF International Conference on Computer Vision; 2023; pp. 4015–4026. [Google Scholar]
- Osco, L.P.; Wu, Q.; de Lemos, E.L.; Gonçalves, W.N.; Ramos, A.P.M.; Li, J.; Marcato, J. , Junior The Segment Anything Model (SAM) for Remote Sensing Applications: From Zero to One Shot. Int. J. Appl. Earth Obs. Geoinf. 2023, 124, 103540. [Google Scholar]
- Sun, X.; Wang, B.; Wang, Z.; Li, H.; Li, H.; Fu, K. Research Progress on Few-Shot Learning for Remote Sensing Image Interpretation. IEEE J. Sel. Top. Appl. Earth Obs. Remote Sens. 2021, 14, 2387–2402. [Google Scholar] [CrossRef]
- Ferguson, L.; Haviland, D. Pistachio Production Manual; UCANR Publications, 2016; ISBN 9781601078773. [Google Scholar]
- Ferguson, L.; Polito, V.; Kallsen, C. The Pistachio Tree; Botany and Physiology and Factors That Affect Yield; University of California Fruit & Nut Research Information Center, 2005. [Google Scholar]
- Conrad, O.; Bechtel, B.; Bock, M.; Dietrich, H.; Fischer, E.; Gerlitz, L.; Wehberg, J.; Wichmann, V.; Boehner, J. System for Automated Geoscientific Analyses (SAGA); 2015. [Google Scholar]
- Anthony, B.M.; Minas, I.S. Optimizing Peach Tree Canopy Architecture for Efficient Light Use, Increased Productivity and Improved Fruit Quality. Agronomy (Basel) 2021, 11, 1961. [Google Scholar] [CrossRef]
- Guirado, E.; Tabik, S.; Alcaraz-Segura, D.; Cabello, J.; Herrera, F. Deep-Learning Convolutional Neural Networks for Scattered Shrub Detection with Google Earth Imagery. arXiv [cs.CV] 2017. [Google Scholar]
- Yang, M.; Mou, Y.; Liu, S.; Meng, Y.; Liu, Z.; Li, P.; Xiang, W.; Zhou, X.; Peng, C. Detecting and Mapping Tree Crowns Based on Convolutional Neural Network and Google Earth Images. Int. J. Appl. Earth Obs. Geoinf. 2022, 108, 102764. [Google Scholar] [CrossRef]
- Damm, A.; Guanter, L.; Verhoef, W.; Schläpfer, D.; Garbari, S.; Schaepman, M.E. Impact of Varying Irradiance on Vegetation Indices and Chlorophyll Fluorescence Derived from Spectroscopy Data. Remote Sens. Environ. 2015, 156, 202–215. [Google Scholar] [CrossRef]
- Guillen-Climent, M.L.; Zarco-Tejada, P.J.; Berni, J.A.J.; North, P.R.J.; Villalobos, F.J. Mapping Radiation Interception in Row-Structured Orchards Using 3D Simulation and High-Resolution Airborne Imagery Acquired from a UAV. Precis. Agric. 2012, 13, 473–500. [Google Scholar] [CrossRef]
- Berra, E.F.; Gaulton, R.; Barr, S. Commercial Off-the-Shelf Digital Cameras on Unmanned Aerial Vehicles for Multitemporal Monitoring of Vegetation Reflectance and NDVI. IEEE Trans. Geosci. Remote Sens. 2017, 55, 4878–4886. [Google Scholar] [CrossRef]
- Wu, Q.; Osco, L.P. Samgeo: A Python Package for Segmenting Geospatial Data with the Segment Anything Model (SAM). J. Open Source Softw. 2023, 8, 5663. [Google Scholar] [CrossRef]
- Ye, Z.; Yang, K.; Lin, Y.; Guo, S.; Sun, Y.; Chen, X.; Lai, R.; Zhang, H. A Comparison between Pixel-Based Deep Learning and Object-Based Image Analysis (OBIA) for Individual Detection of Cabbage Plants Based on UAV Visible-Light Images. Comput. Electron. Agric. 2023, 209, 107822. [Google Scholar] [CrossRef]
- Meskó, B. Prompt Engineering as an Important Emerging Skill for Medical Professionals: Tutorial. J. Med. Internet Res. 2023, 25, e50638. [Google Scholar] [CrossRef] [PubMed]
- Baziak, B.; Bodziony, M.; Szczepanek, R. Mountain Streambed Roughness and Flood Extent Estimation from Imagery Using the Segment Anything Model (SAM). Hydrology 2024, 11, 17. [Google Scholar] [CrossRef]
- Carraro, A.; Sozzi, M.; Marinello, F. The Segment Anything Model (SAM) for Accelerating the Smart Farming Revolution. Smart Agricultural Technology 2023, 6, 100367. [Google Scholar] [CrossRef]
Figure 1.
A simplified CNN for object detection (modified from [42]): a) input image; b) training step with training data; c) convolutional backbone; d) fully connected layer; e) output objects; and f) finalization with post-processing if needed and validation using a validation dataset.
Figure 1.
A simplified CNN for object detection (modified from [42]): a) input image; b) training step with training data; c) convolutional backbone; d) fully connected layer; e) output objects; and f) finalization with post-processing if needed and validation using a validation dataset.
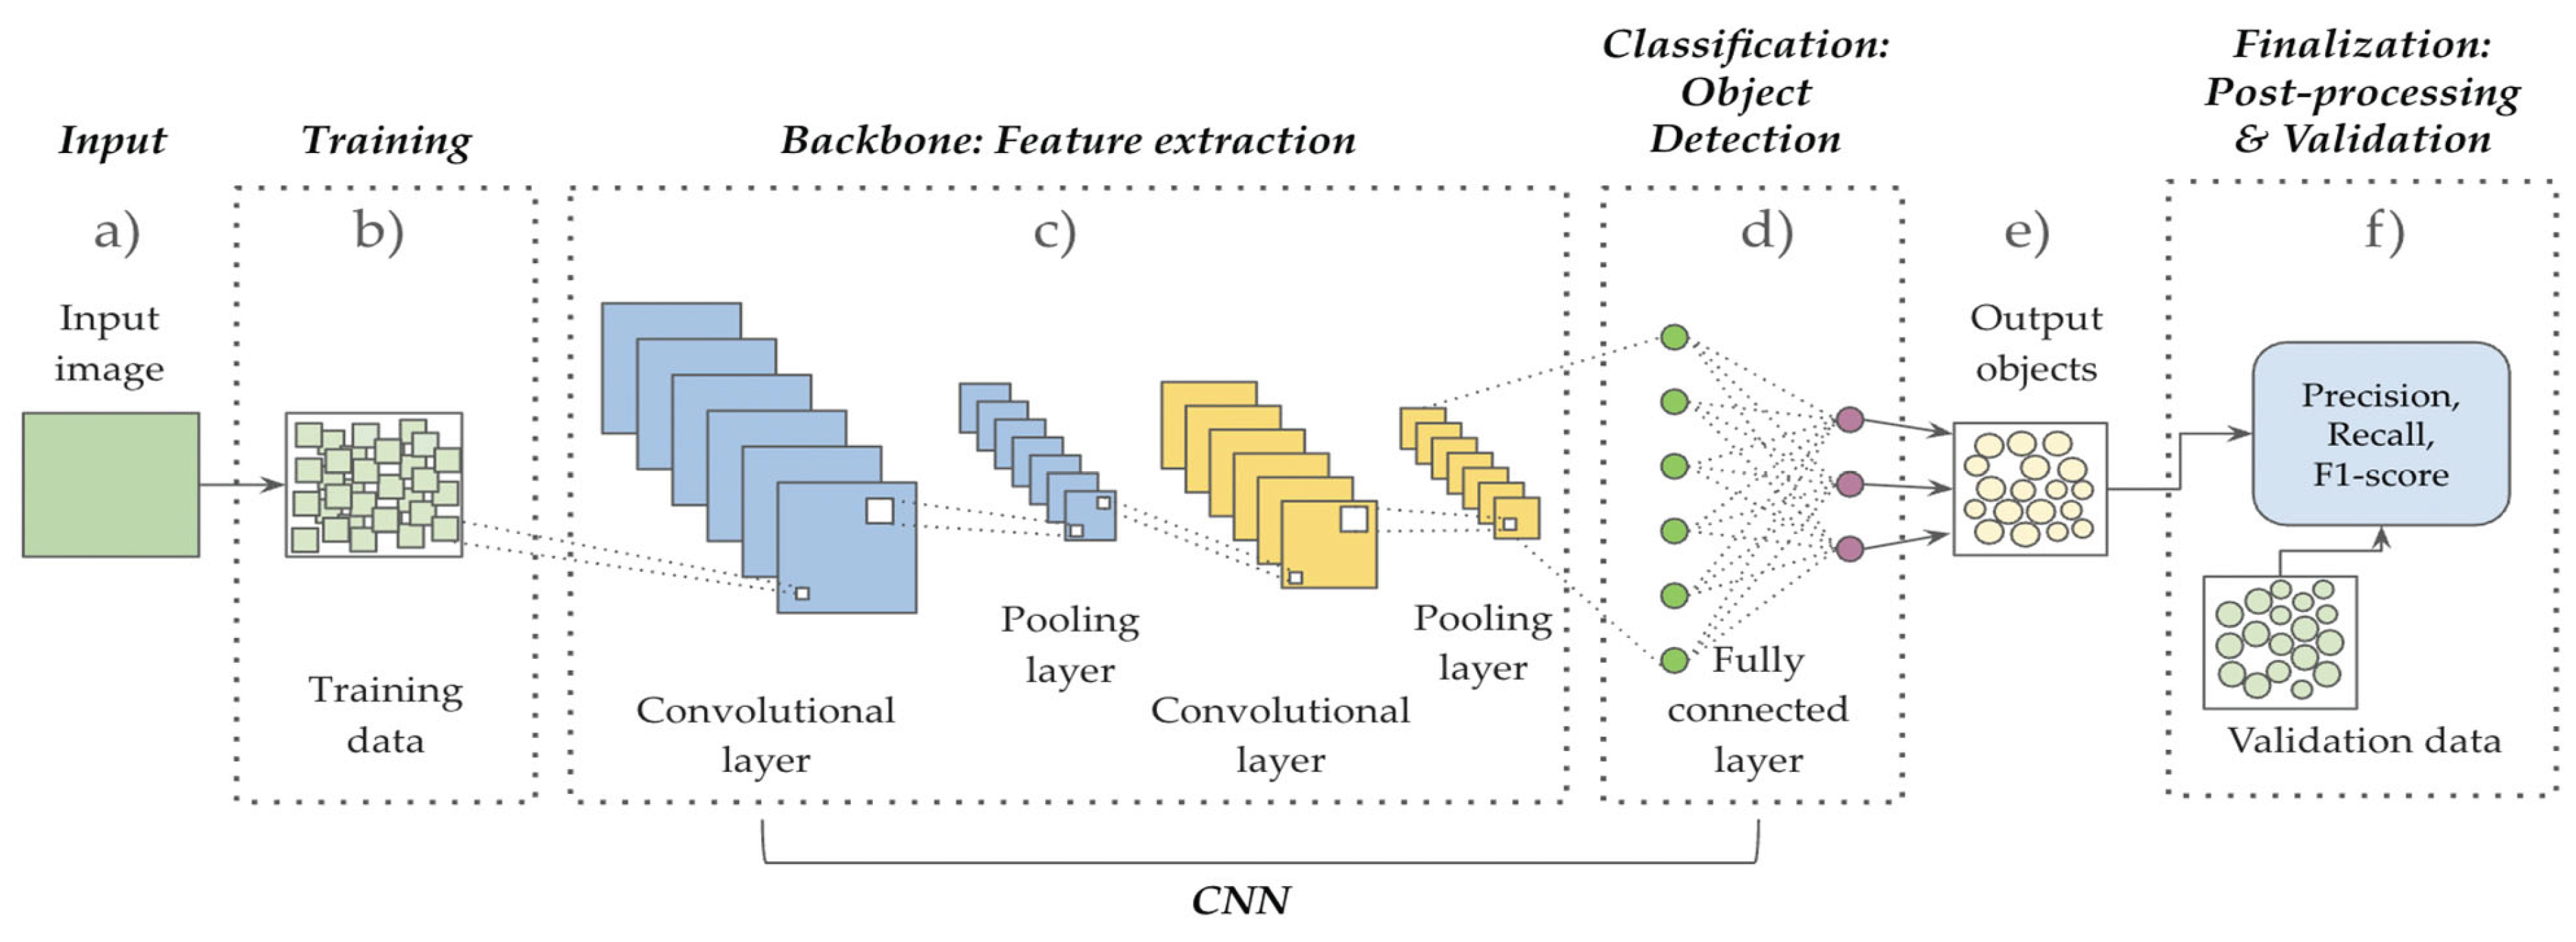
Figure 4.
ESRI workflow showing all key steps for the three CNNs evaluated. YOLOv3 and MASK R-CNN require training using the original training data; SAM does not. All ESRI functions are in green polygons with italicized font.
Figure 4.
ESRI workflow showing all key steps for the three CNNs evaluated. YOLOv3 and MASK R-CNN require training using the original training data; SAM does not. All ESRI functions are in green polygons with italicized font.
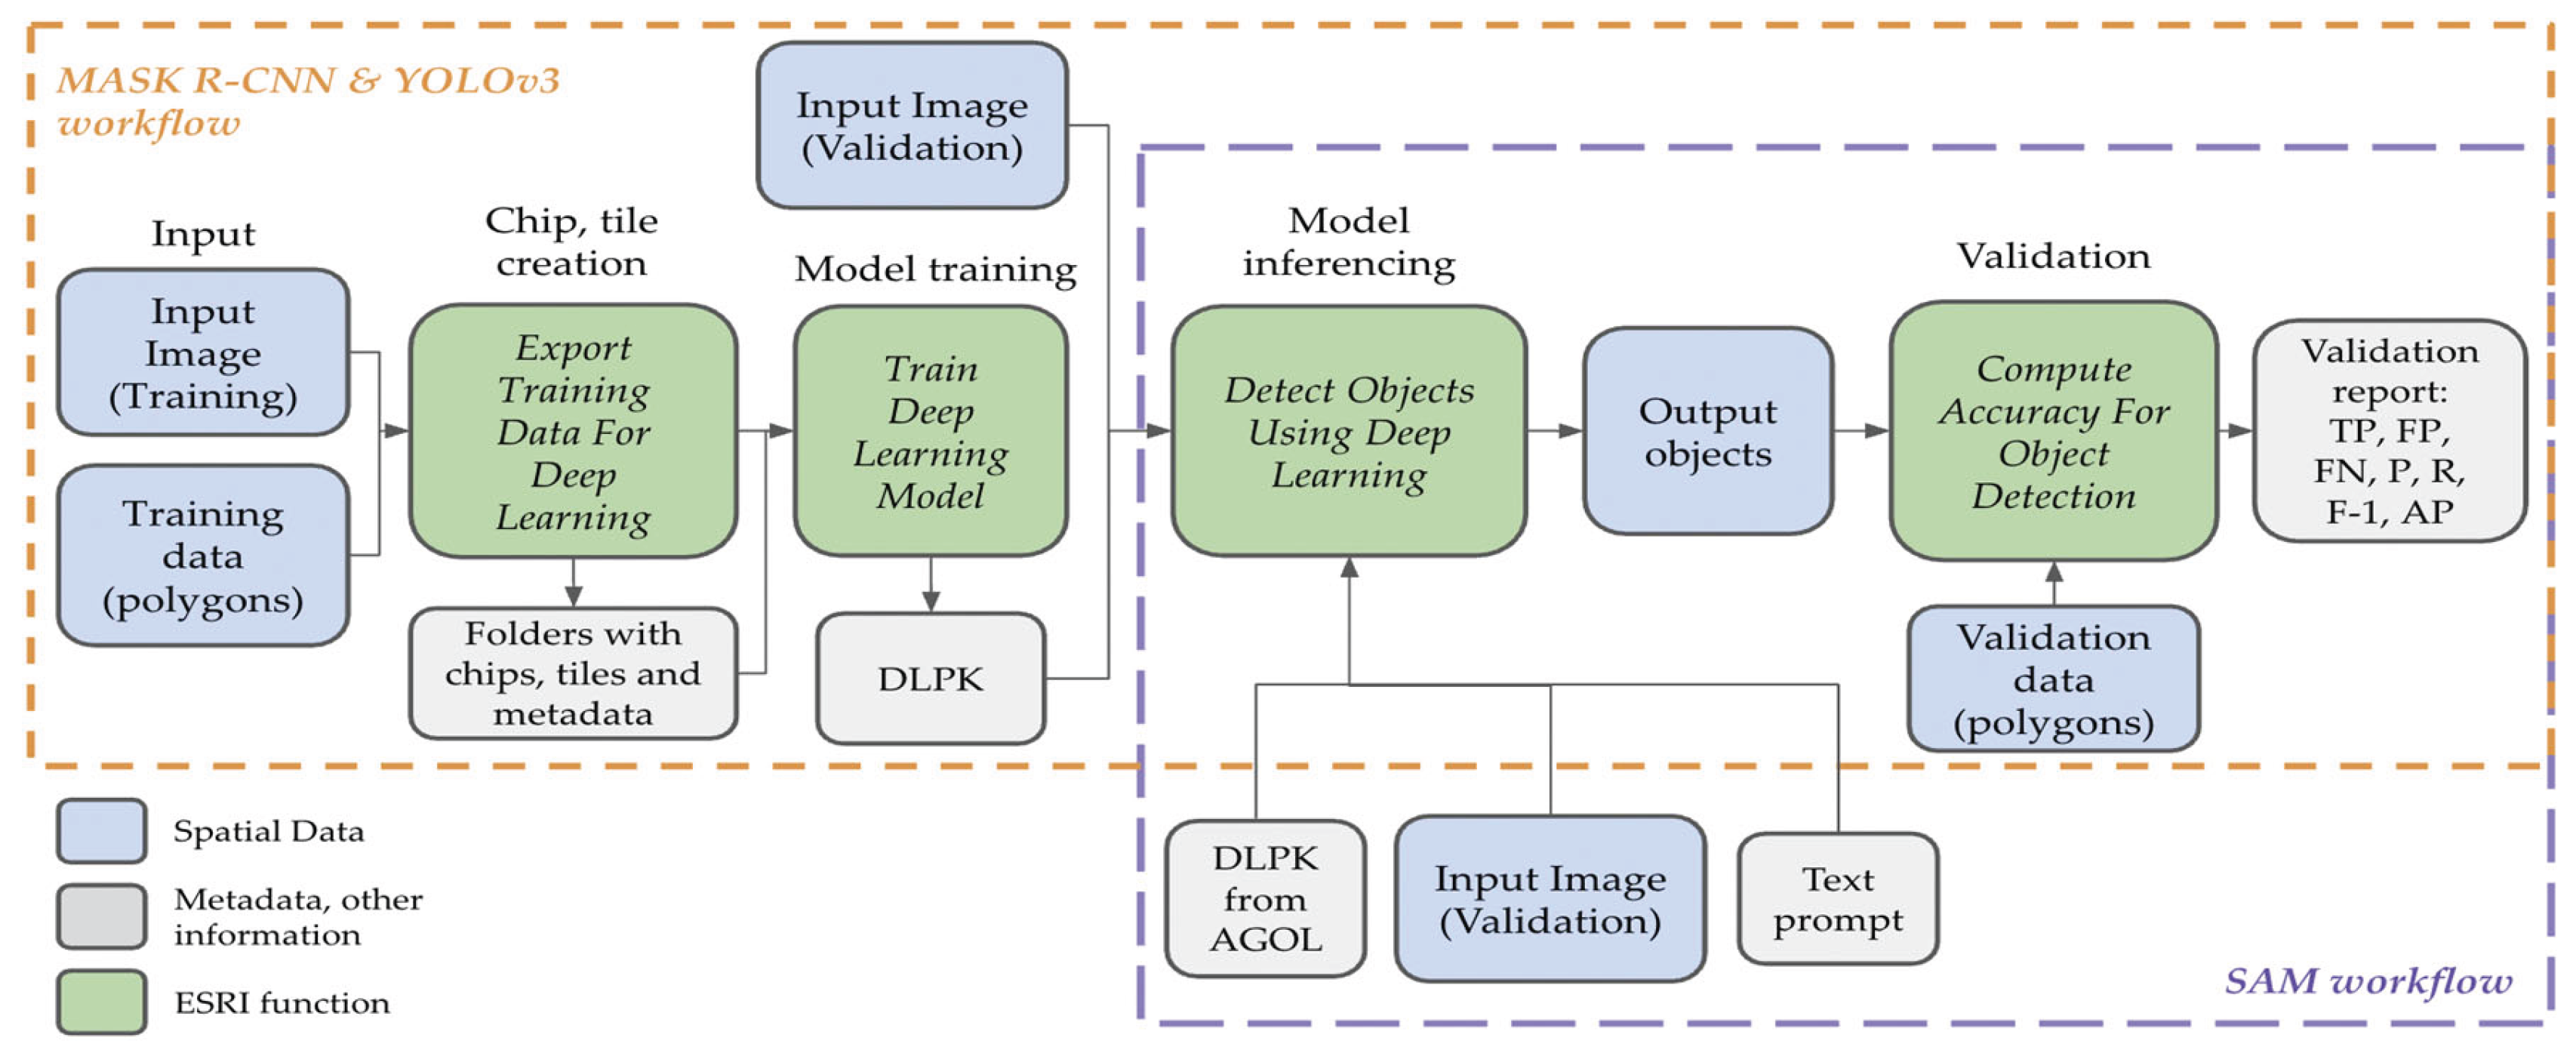
Figure 5.
Graphic illustrating general guidelines for determining parameters that are used in the Export Training Data for Deep Learning tool for MASK R-CNN: a) Input training image; b) Chip size (3 times mean object width); c) Tile size which is chip size plus 32 pixels; d) Image tile; e) Labeled tile; and f) Stride distance, which is ¼ of the tile size.
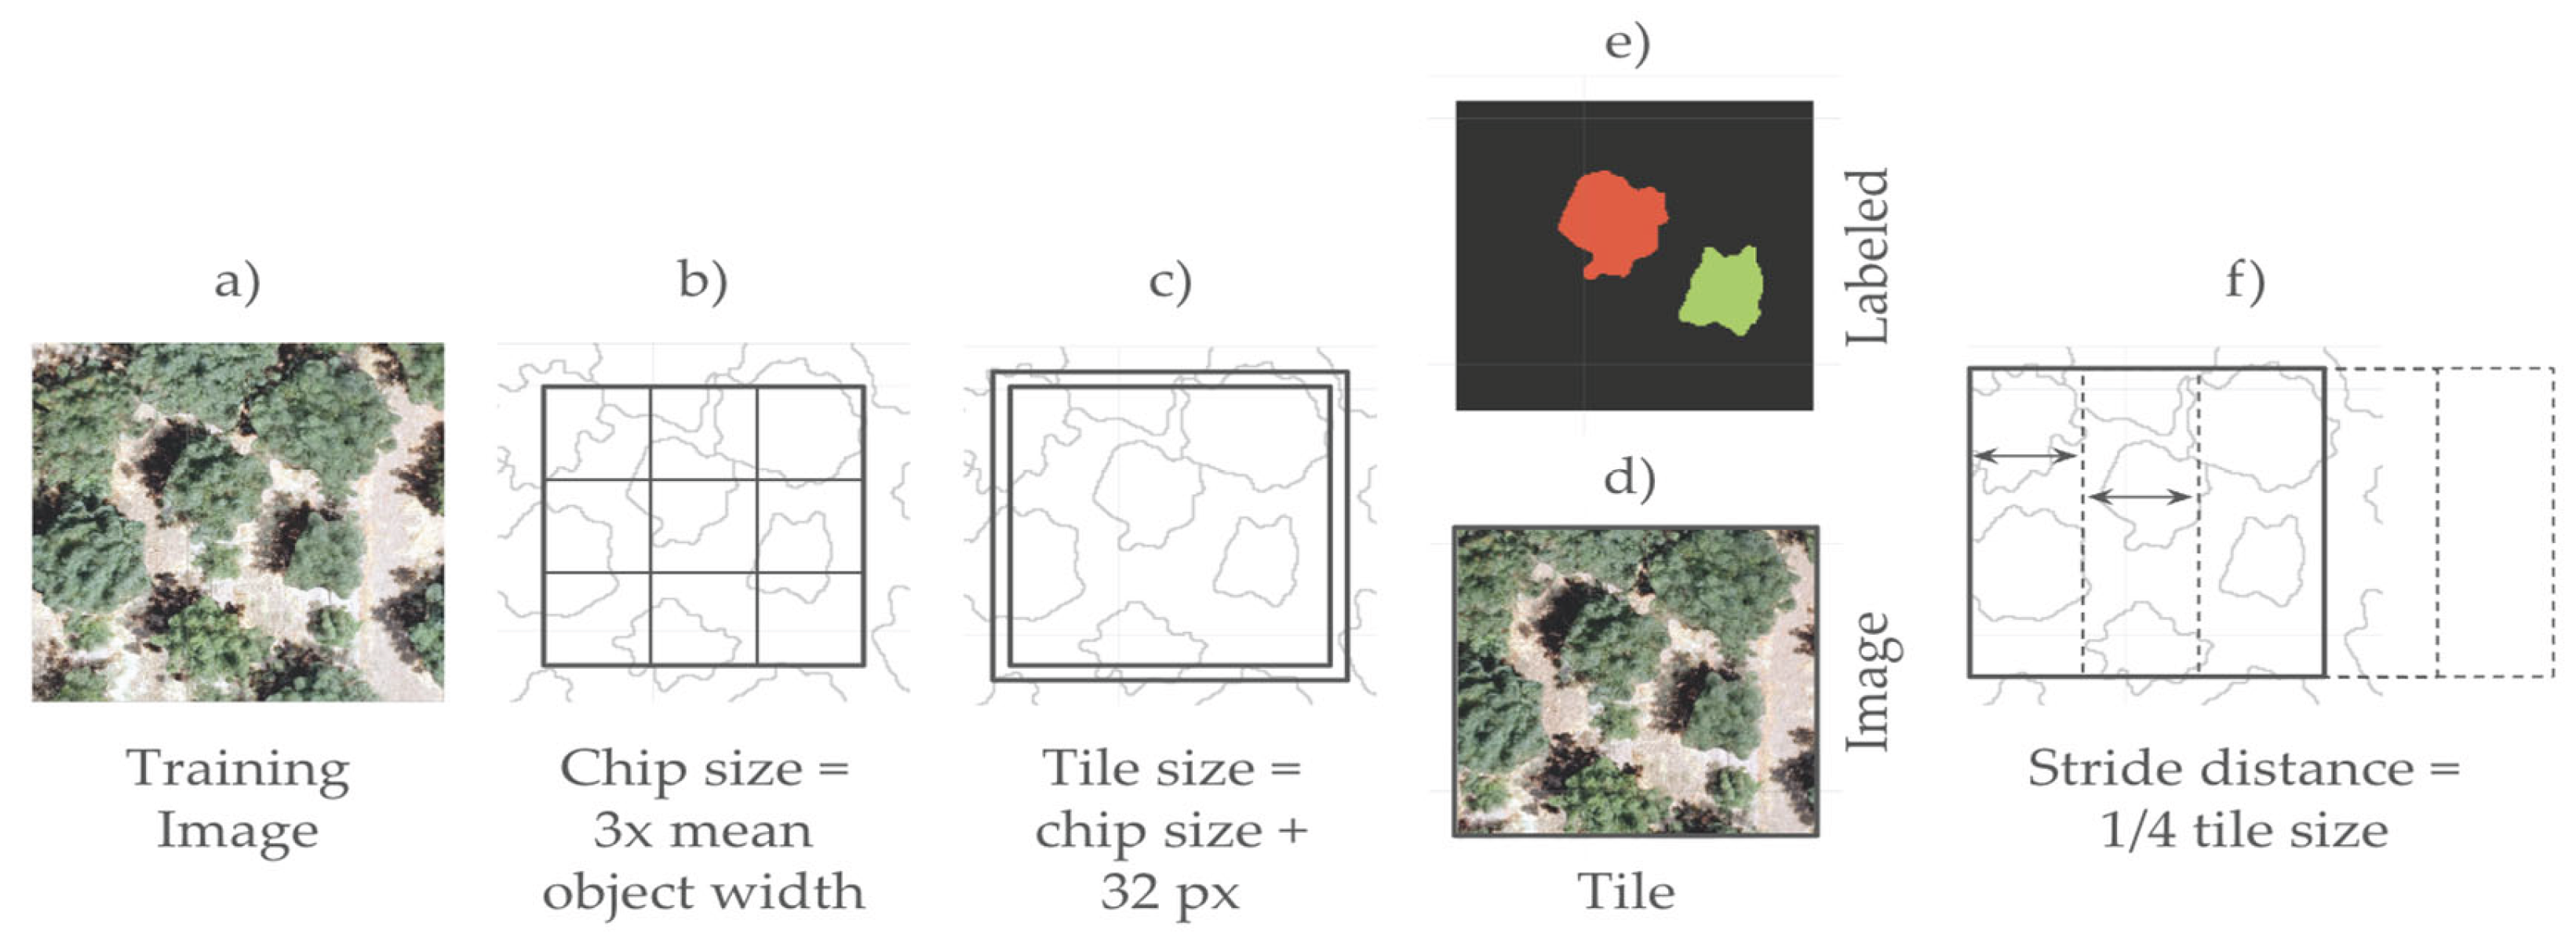
Figure 6.
Results showing one tree crown from each date in 2018: a) Drone-collected RGB imagery; b) UAV-OBIA validation data; c) MASK R-CNN results; d) YOLOv3 results; and d) SAM results.
Figure 6.
Results showing one tree crown from each date in 2018: a) Drone-collected RGB imagery; b) UAV-OBIA validation data; c) MASK R-CNN results; d) YOLOv3 results; and d) SAM results.
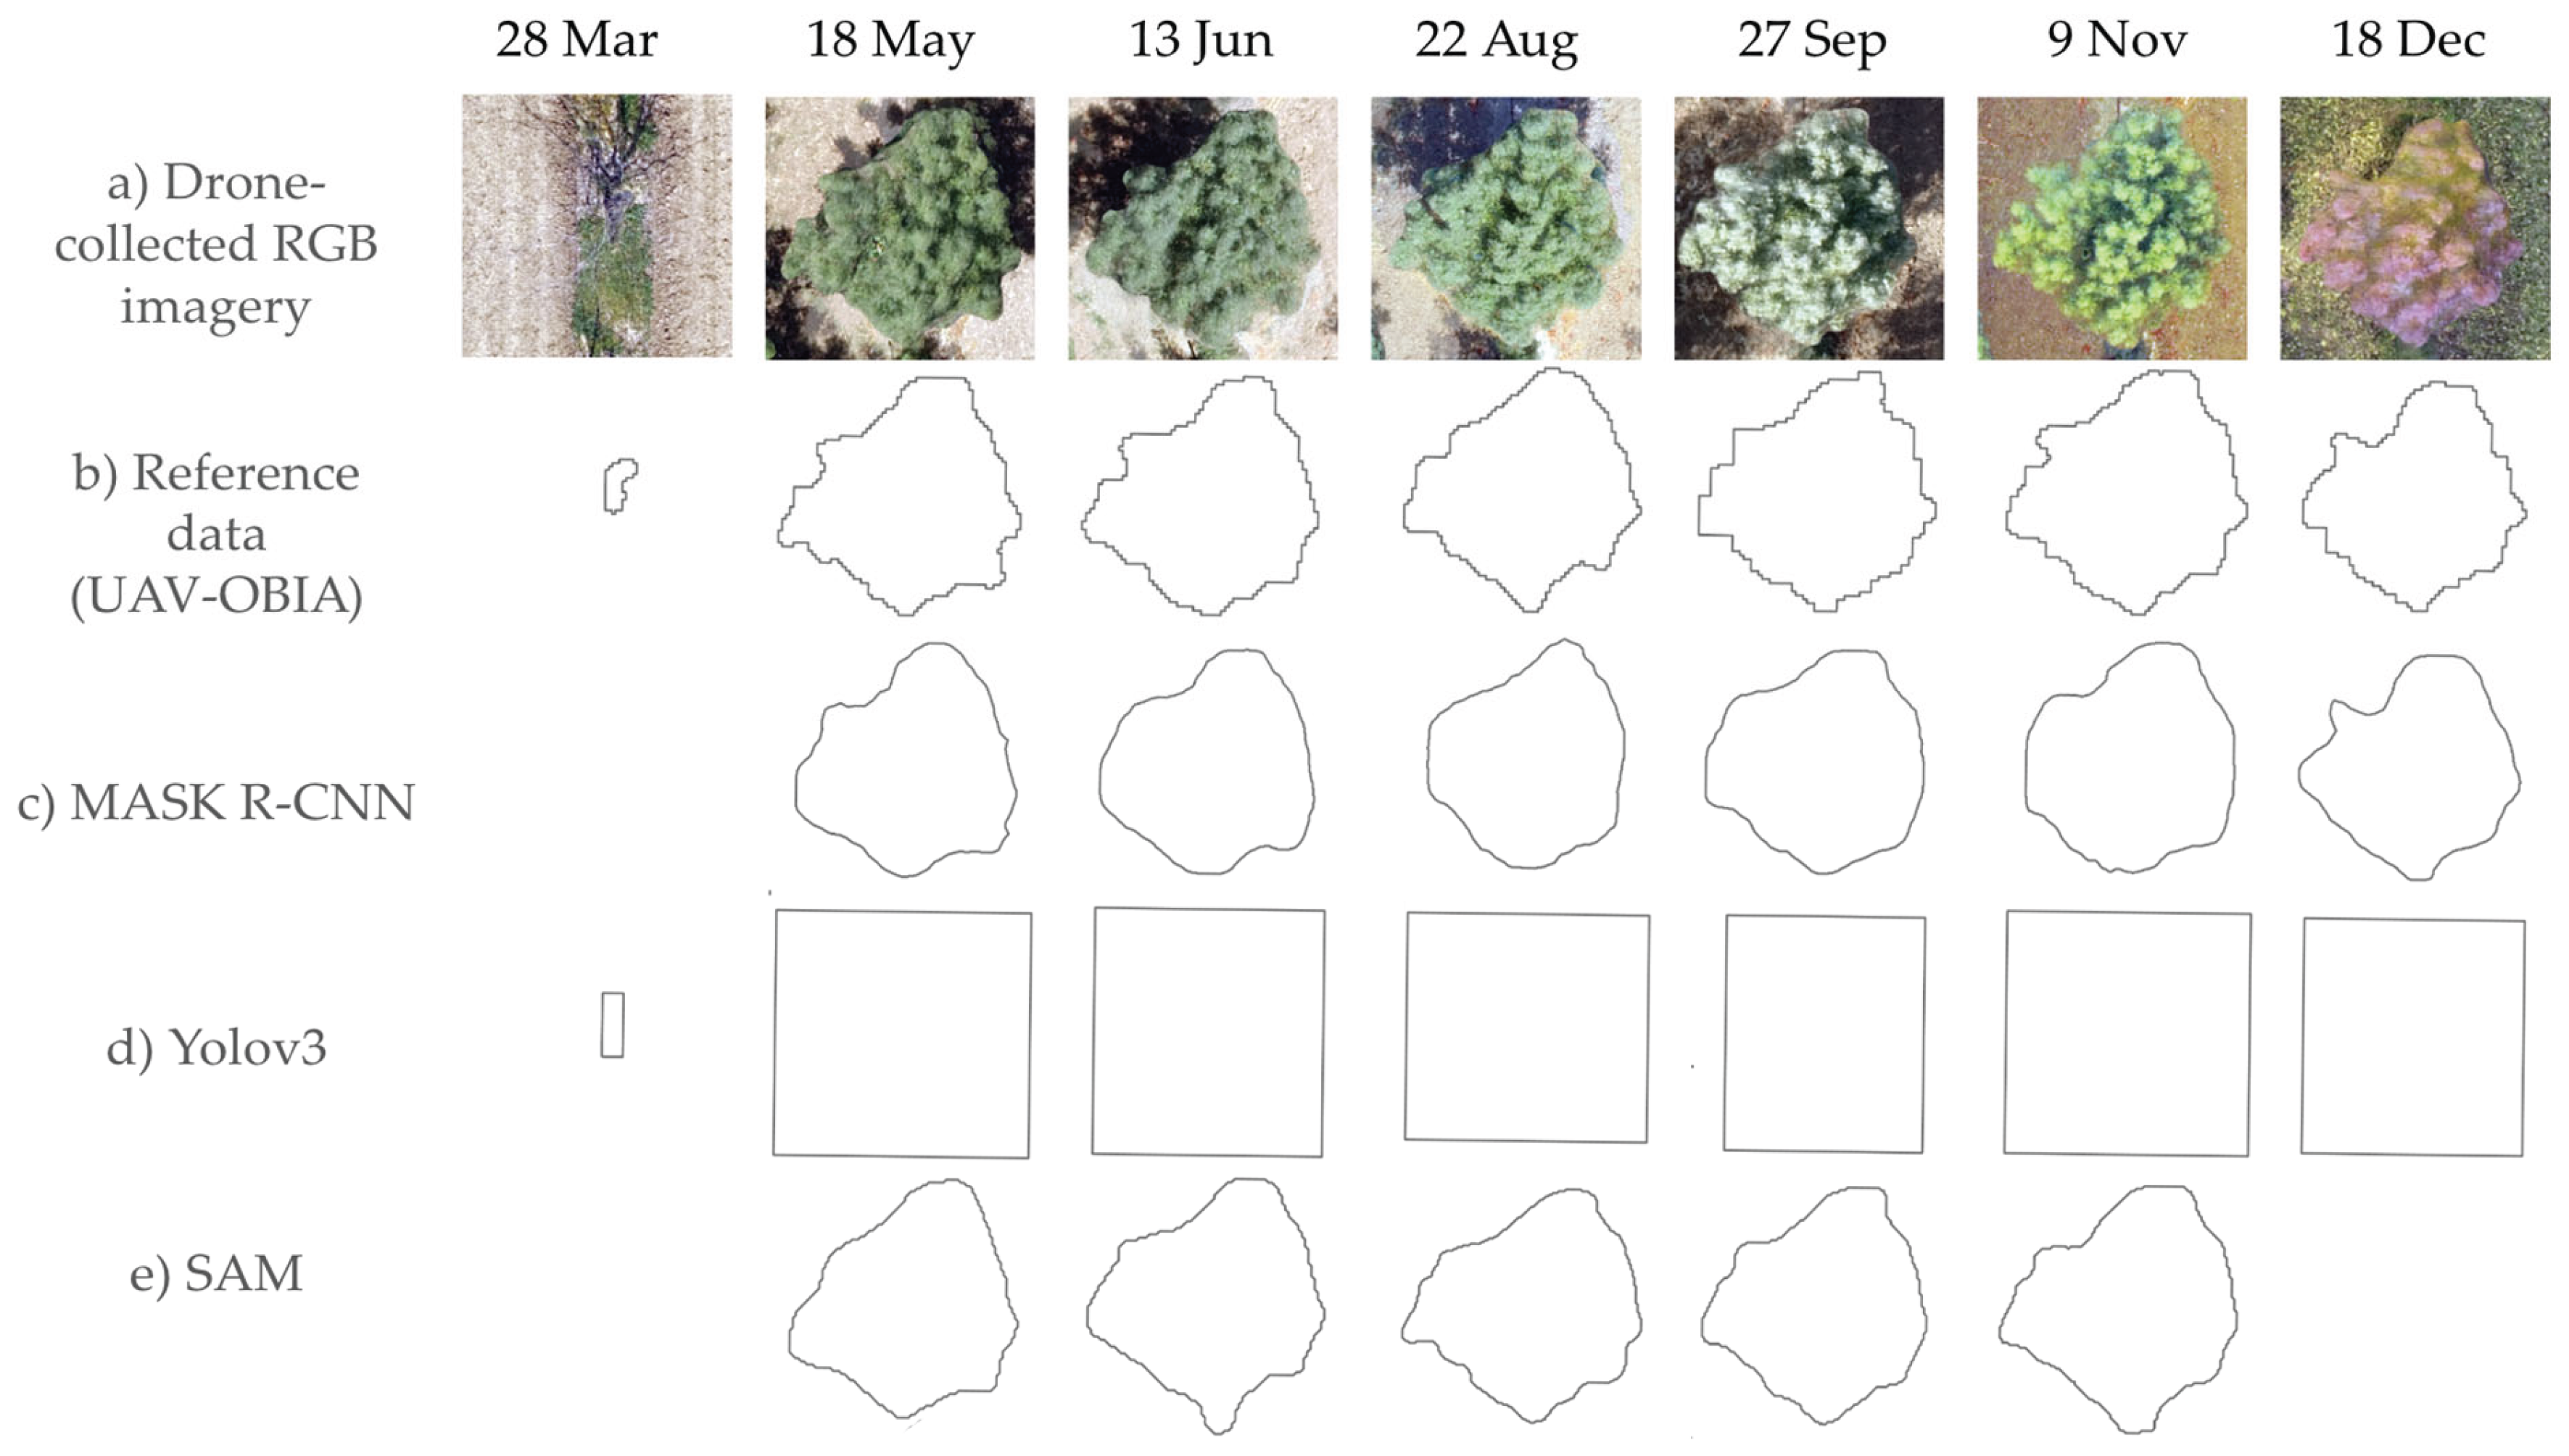
Figure 7.
Results from June and August showing: a) June RGB image; b) MASK R-CNN results; c) YOLOv3 results; d) SAM results; e) August RGB image; f) MASK R-CNN results; g) YOLOv3 results; and h) SAM results.
Figure 7.
Results from June and August showing: a) June RGB image; b) MASK R-CNN results; c) YOLOv3 results; d) SAM results; e) August RGB image; f) MASK R-CNN results; g) YOLOv3 results; and h) SAM results.
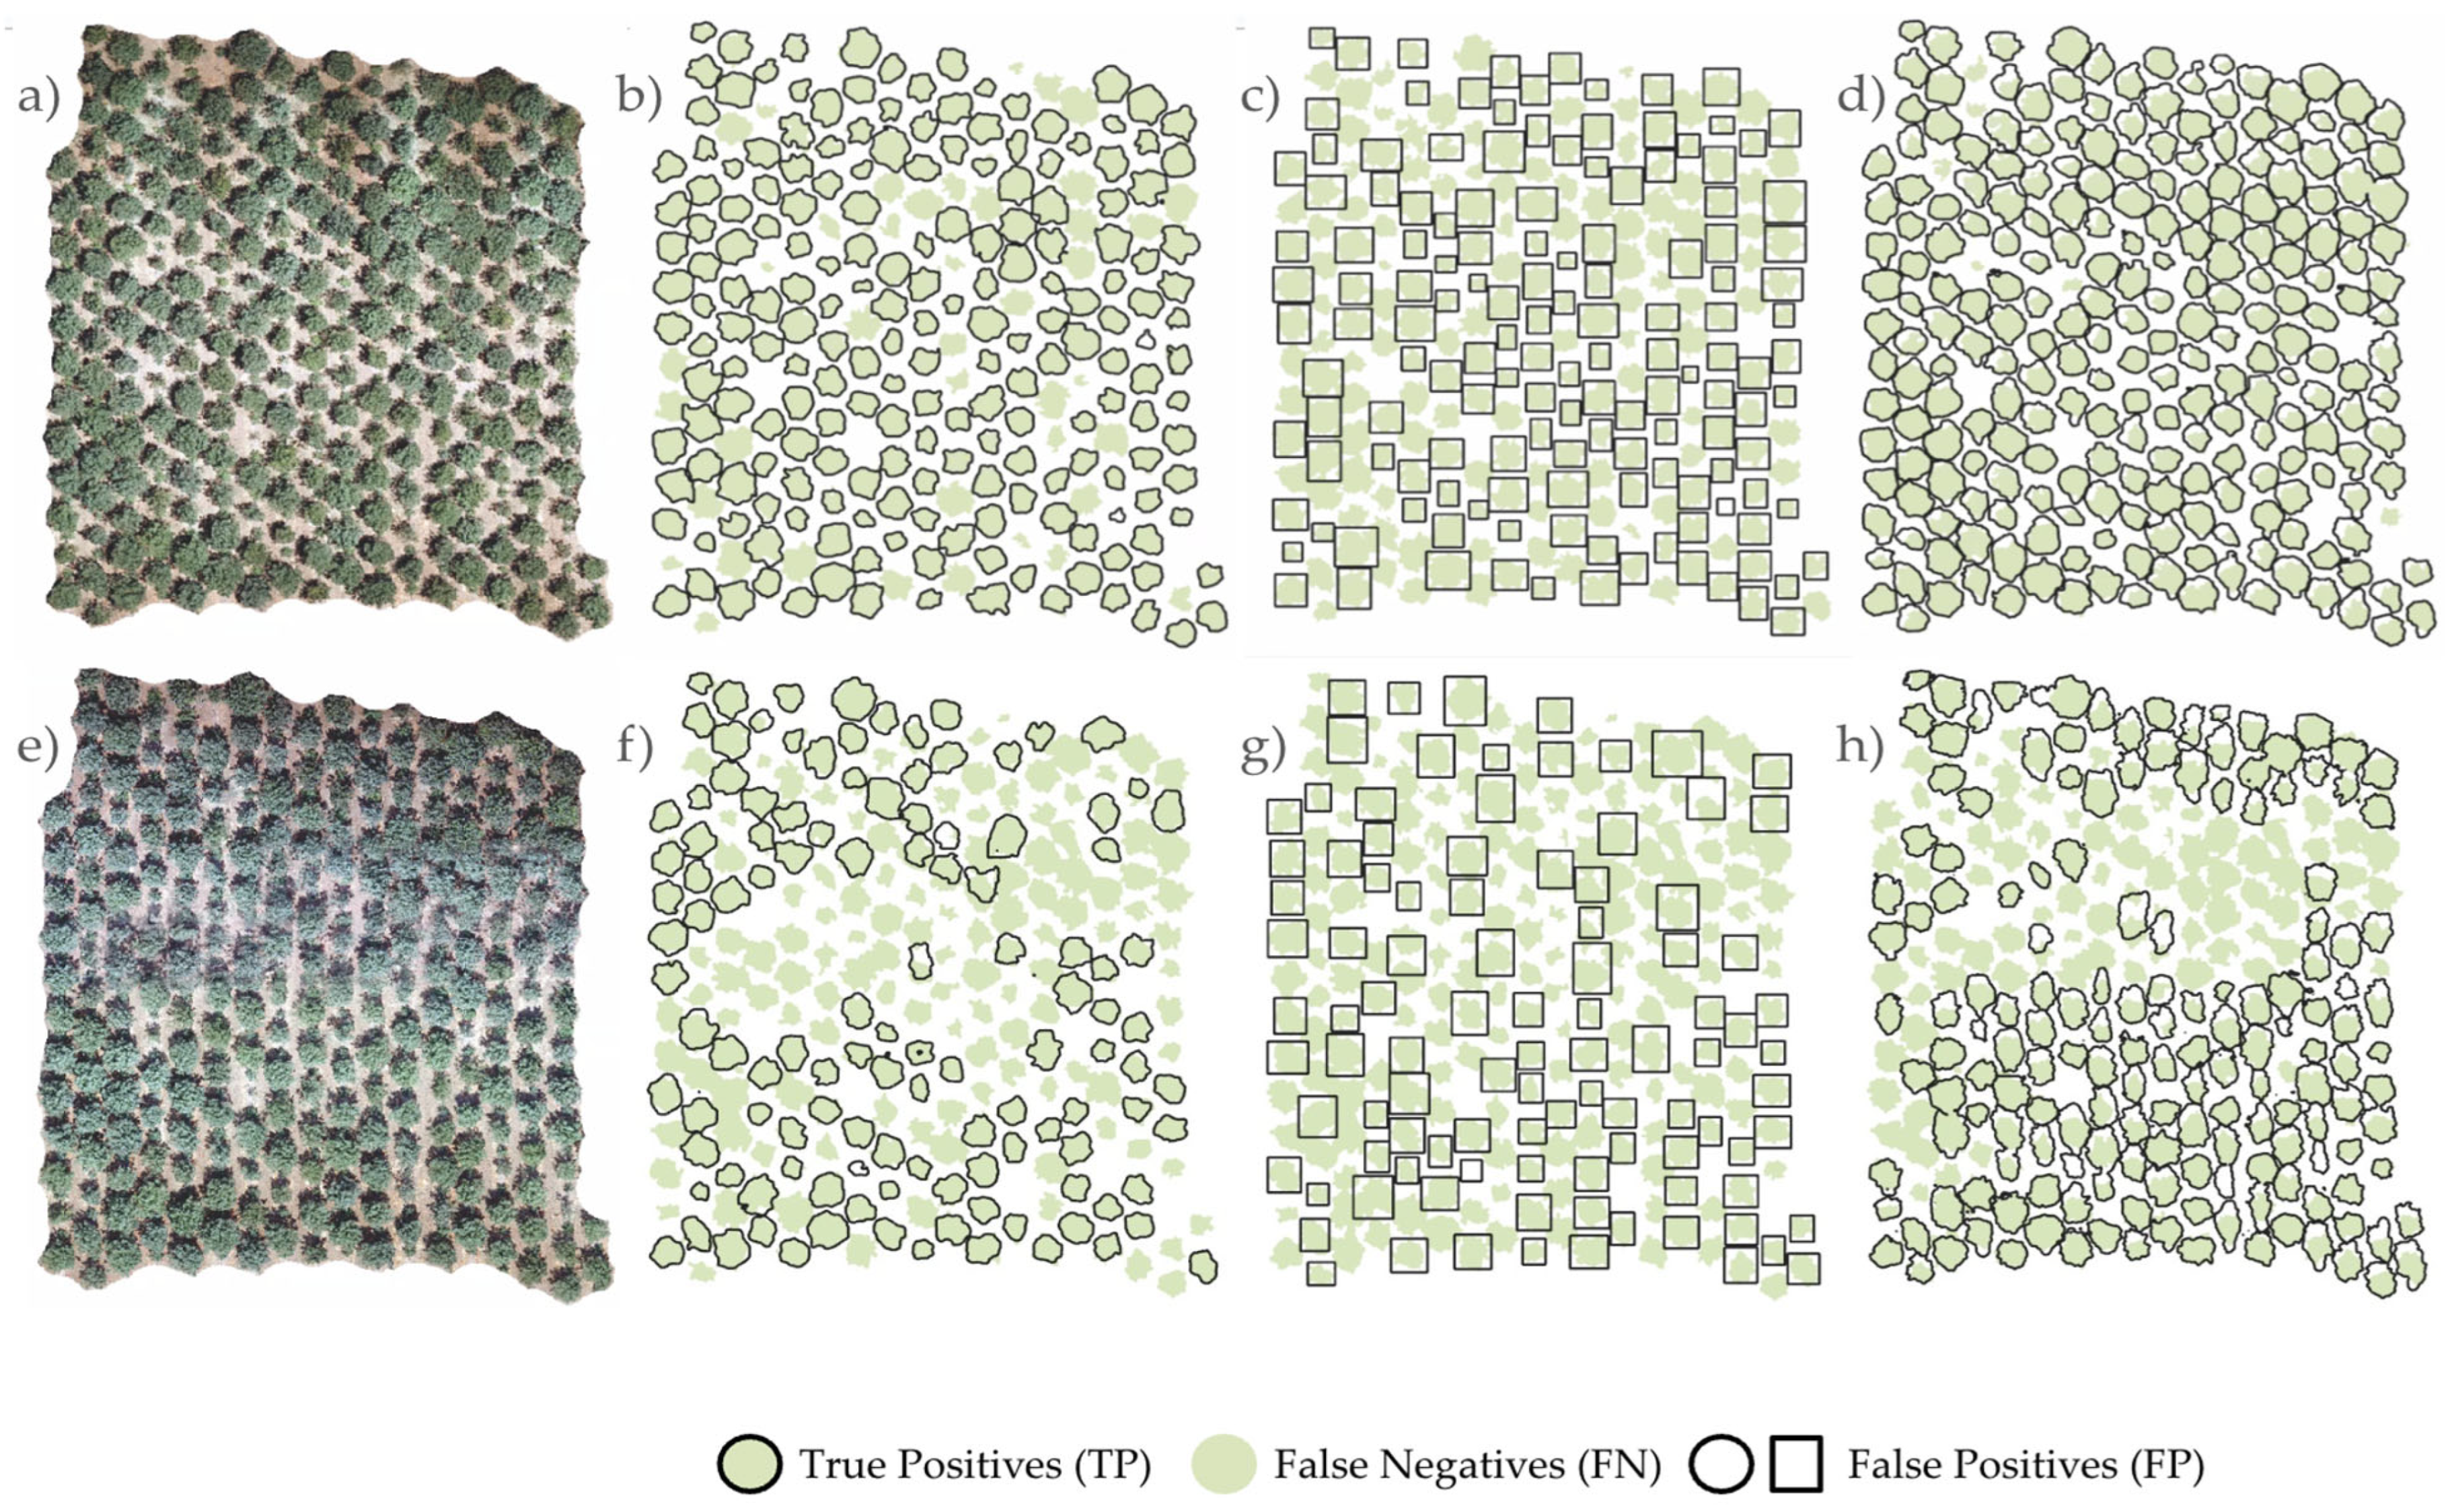
Figure 8.
True positives, False positives, and False negatives for each of the three CNN models over the growing season.
Figure 8.
True positives, False positives, and False negatives for each of the three CNN models over the growing season.
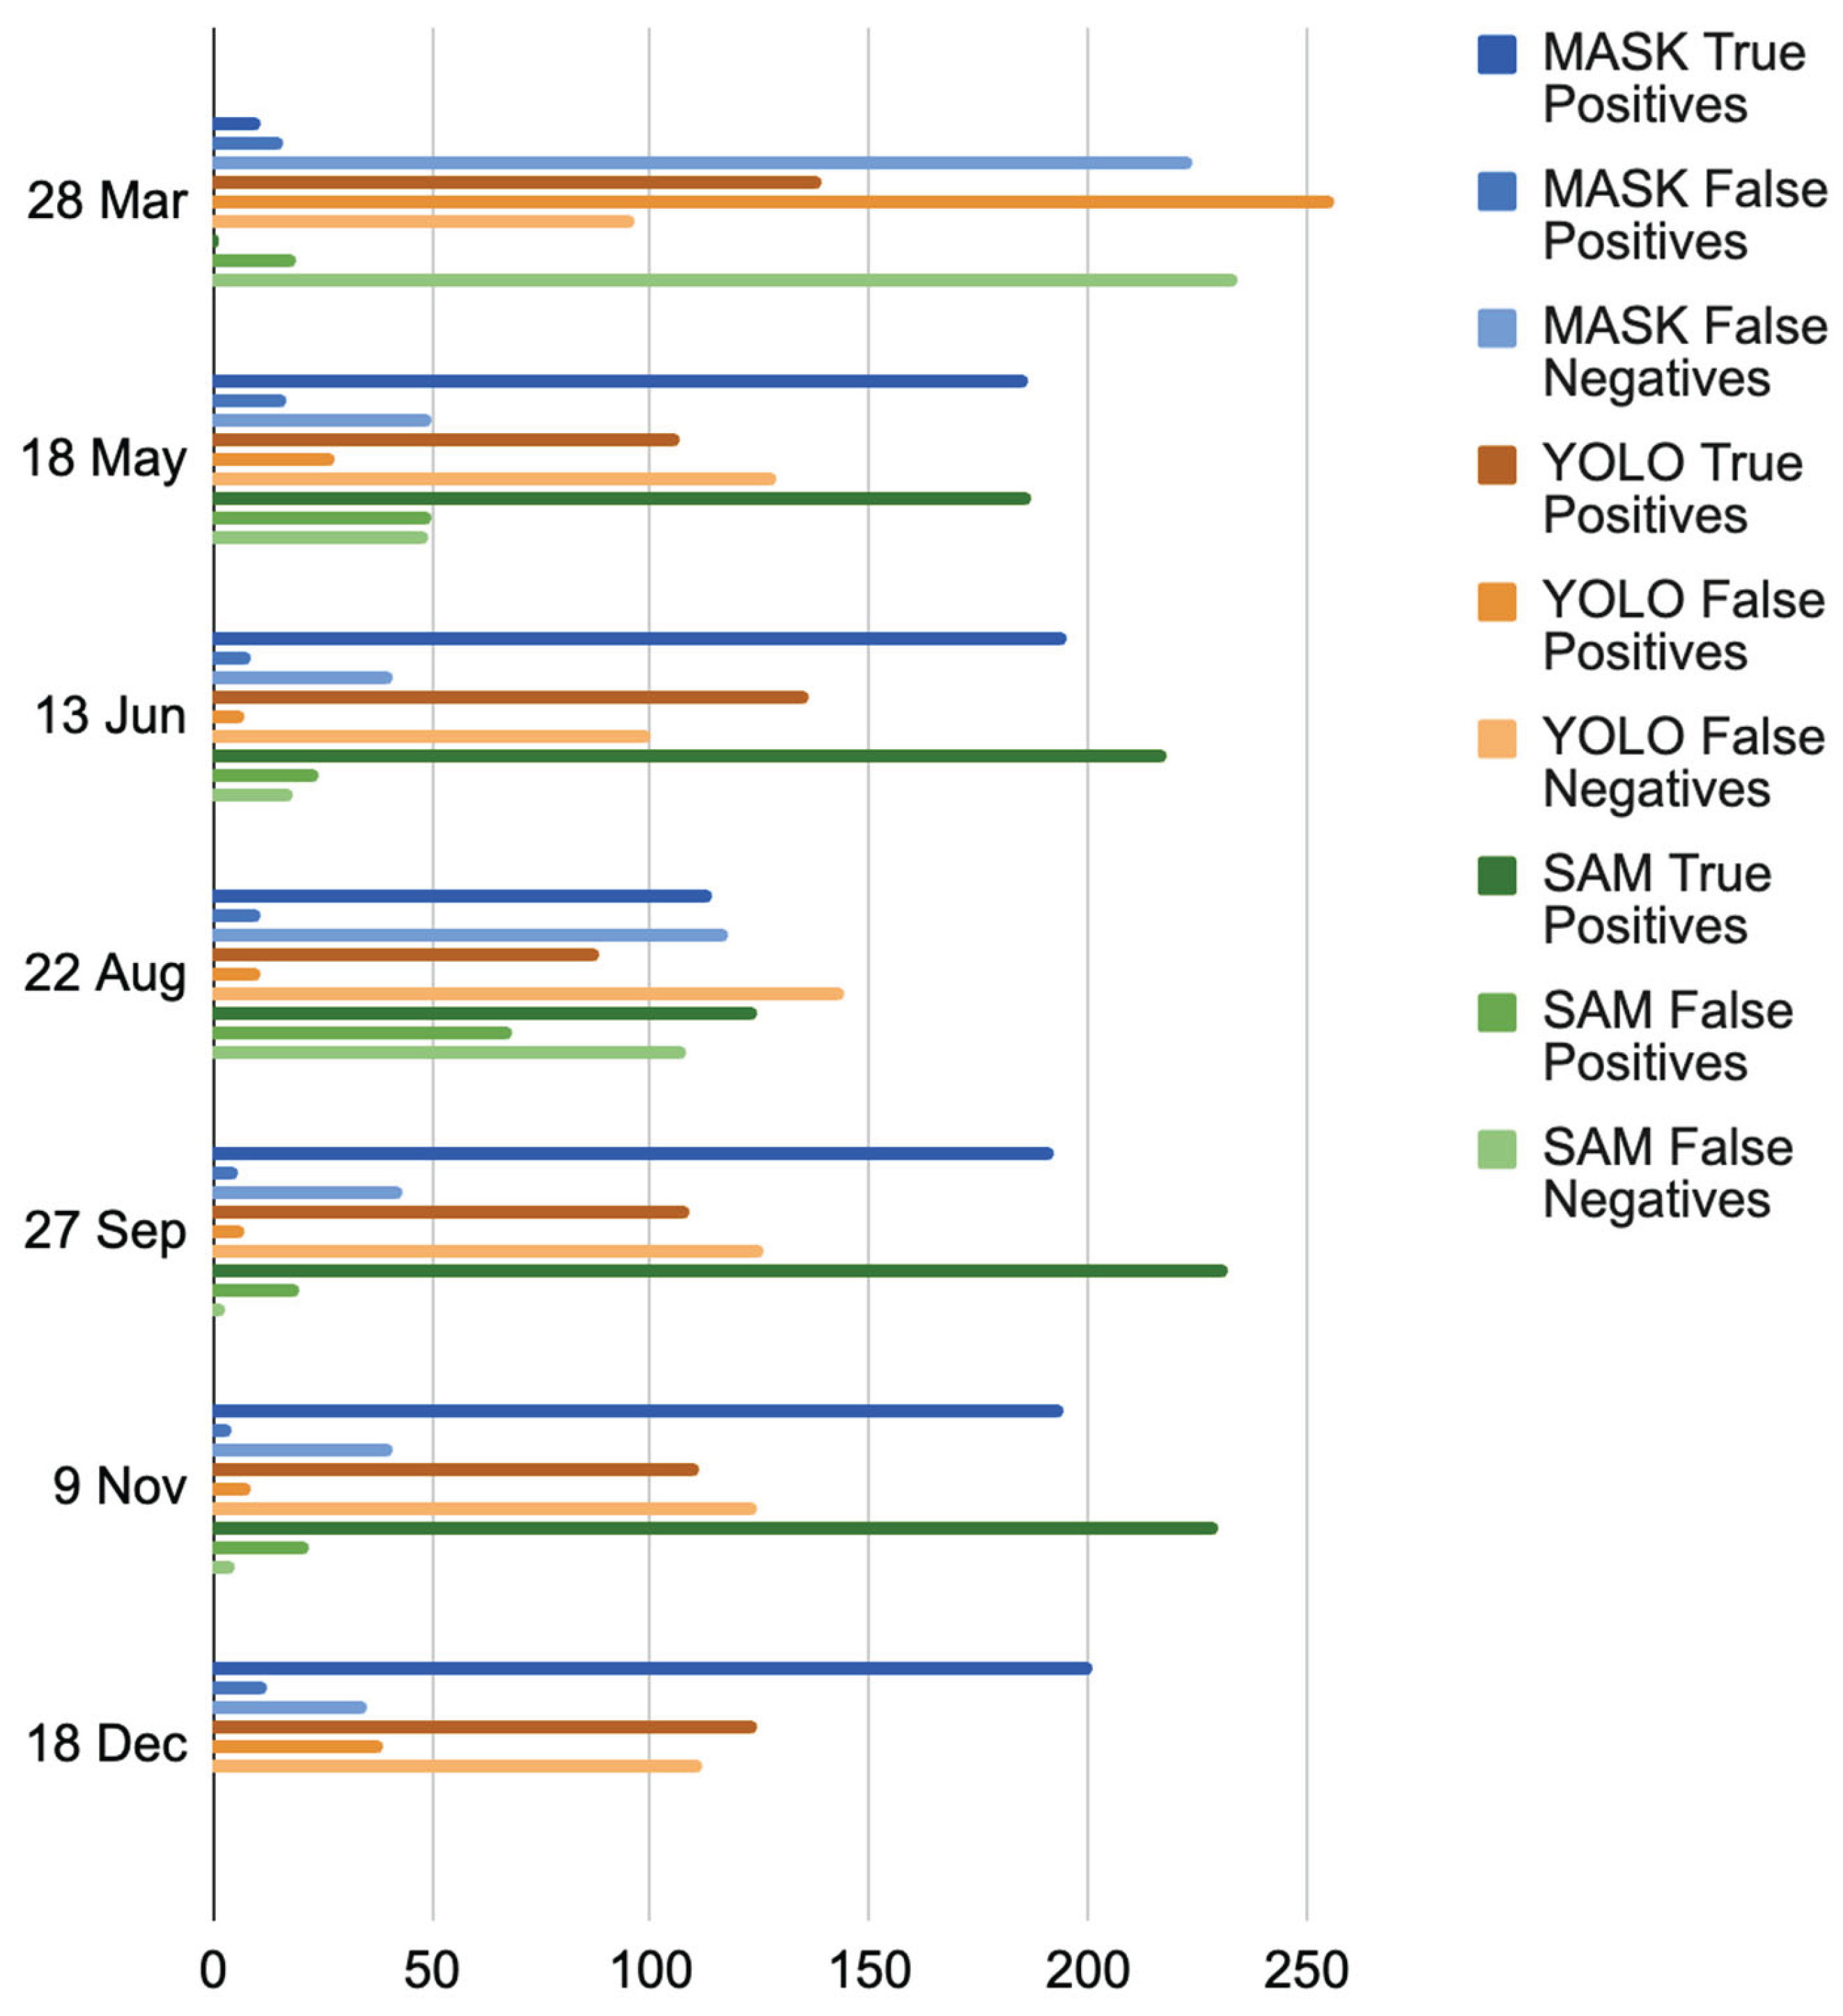
Figure 9.
Precision, Recall, and F1 score for each of the three CNN models through the growing season.
Figure 9.
Precision, Recall, and F1 score for each of the three CNN models through the growing season.
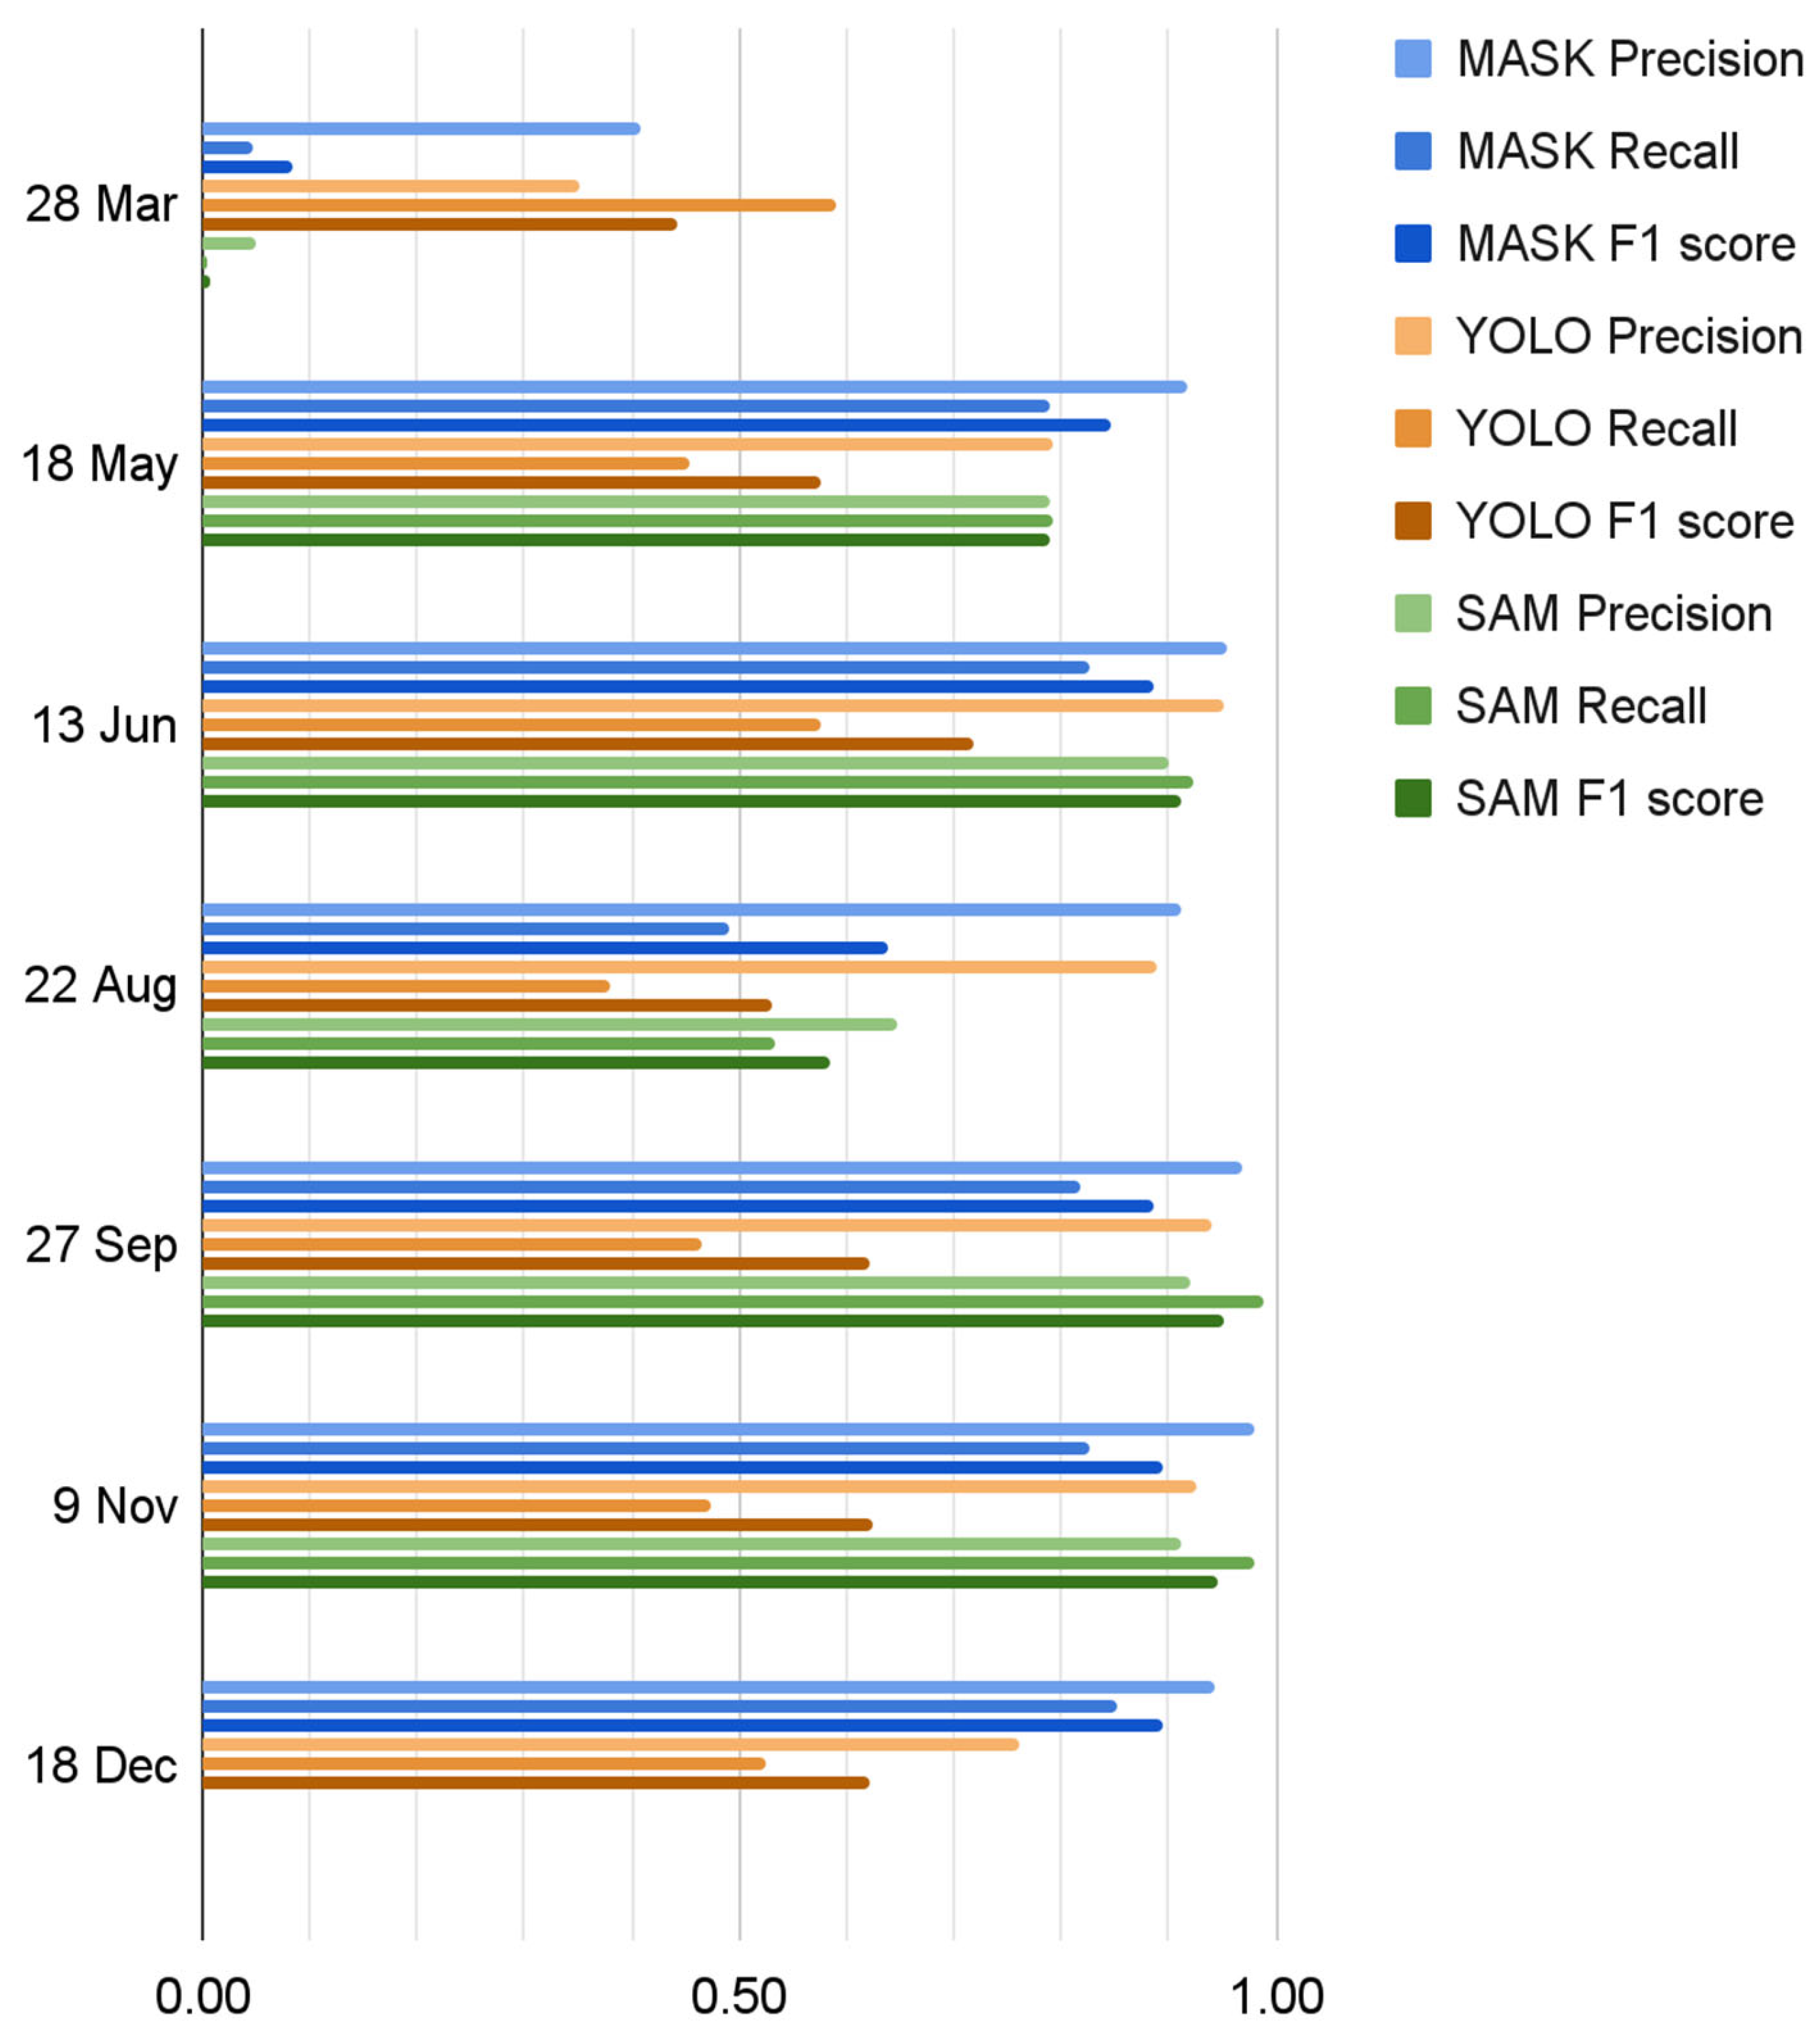
Table 1.
Characteristics of the three CNN models evaluated.
| MASK R-CNN | YOLOv3 | SAM | |
| Model Type | Two-shot | One-shot | Zero-shot |
| Backbone | ResNet family (e.g., 18, 50, 101, 152, etc.) | Darknet-53 | Vision Transformer (ViT) |
| Output | Polygon | Bounding Box | Polygon |
| Training/Validation data split | Training and validation required | Training and validation required | Only validation required |
| Input training data | Image chips | Image chips | Text prompts |
| Pre-training data | Can be pre-trained using Common Objects in Context (COCO) or other, depending on the backbone | Pre-trained using Common Objects in Context (COCO) | Segment Anything 1-Billion mask dataset (SA-1B) |
Table 2.
Evaluation metrics used and their formulae.
| Metric | Formula |
| Intersection over Union (IoU), or Jaccard Index | Predicted ∪ Reference / Predicted ⋂ Reference |
| Precision (P) | TP / (TP + FP) |
| Recall (R) | TP / (TP + FN) |
| F1 score (F1) | 2((P*R)/(P+R)) |
Disclaimer/Publisher’s Note: The statements, opinions and data contained in all publications are solely those of the individual author(s) and contributor(s) and not of MDPI and/or the editor(s). MDPI and/or the editor(s) disclaim responsibility for any injury to people or property resulting from any ideas, methods, instructions or products referred to in the content. |
© 2025 by the authors. Licensee MDPI, Basel, Switzerland. This article is an open access article distributed under the terms and conditions of the Creative Commons Attribution (CC BY) license (http://creativecommons.org/licenses/by/4.0/).
Copyright: This open access article is published under a Creative Commons CC BY 4.0 license, which permit the free download, distribution, and reuse, provided that the author and preprint are cited in any reuse.


