
Submitted:
11 June 2025
Posted:
13 June 2025
You are already at the latest version
Abstract
Global climate crisis shifts the building industry towards ecological use of materials, often based on renewable sources. Properties of such materials, as well as their behavior in structures, need to be constantly verified both theoretically and experimentally. The article focuses on vapor retarder influence on moisture content of timber log peripheral wall structures with sheep wool insulation. Moisture content was verified experimentally during the period of over 2 years via monitoring sensors and insulation samples weighing. Results show vapor retarder has got a positive and statistically significant impact on moisture content of sheep wool insulation and log structure. This case study can help further the knowledge of log structure design and provide insight into hygrothermal properties of sandwich structures.
Keywords:
vapor transfer
; hygrothermal properties
; bio-based insulation
; in-situ
; timber
; log structure
1. Introduction
Wood and especially log structures can be considered sustainable buildings for their renewability, low embodied energy, and carbon–sequestration benefits. Modern log-built homes reflect these advantages: wood framing can store several times more carbon than a conventional frame house while requiring less process energy. Life-cycle studies underscore these benefits: one comparison of a typical log home vs. a conventional timber-frame house found approximately 40 % lower greenhouse gas emissions and three to four times greater carbon storage in the log structure, even before crediting biomass [1].
Log structures encompass a wide variety of construction based on used materials, like lumber or glue laminated timber, joints in corner, shape of logs and other criteria. Thanks to its thickness and thermal properties of the wood, the log structure acts both as loadbearing and thermally insulating without additional thermal insulation [2]. Due to high demand for insulating properties of structures, additional thermal insulation is necessary, thus creating sandwich structures.
The insulation layer in sustainable buildings is increasingly sourced from bio-based fibers rather than petrochemical foams. Natural fibers (cellulose, hemp, wool, straw, etc.) are renewable, low-density, and often locally available, avoiding the high embodied energy, like that of mineral wool or polystyrene [3].
While Simões [4] studied cork boards for facades, Nunes [5] reviewed several bio-based insulations and their properties, namely flax, hemp, straw, bamboo and rattan, reed, wool, peat, grass and several pith plants. Koh [6] investigated hygrothermal properties and mold growth on bio-based composites of mycelium, hemp, grass and cork, Mawardi [7] investigates the thermal conductivity of oil palm trunks fibers reinforced biopolymer hybrid composites, Badouard [8] investigated hygric properties of wine byproducts: stalks, grape pomace, crushed stalks and skins, Fedorik [9] investigated insulation based on peat, moss, wood shavings, recycled paper and feathers. Mesa [10] investigated straw bale walls, their heat transfer coefficient in static borer conditions, then simulated hygrothermal behavior for 5 years in dynamic conditions.
Sheep wool has attracted attention due to its naturally hygroscopic fibers and ability to improve indoor air quality by adsorbing formaldehyde and other pollutants from the air [3]. Sheep-wool mats have thermal conductivity comparable to glass wool of similar density [11], further investigation on thermal conductivity, tensile strength, water absorption and flammability was done by Vėjelis [12], results showing dependence of thermal conductivity on thickness of insulation, yet comparable to insulations already used on market, reduced flammability using specified flame retardant amounts and safe use in structure even after short-term submersion in water. Zach [13] investigated acoustic and thermal conductivity properties. Results show thermal properties of researched sheep wool insulation match commercial insulations.
The aim of this research is to verify hygrothermal performance of sheep wool insulation in-situ and describe the impact of vapor retarder on moisture content of insulation and wood in sandwich log structure assembly. Verification of possible water vapor condensation in critical place in structure will be done. The impact of vapor retarder is described statistically at a significance level of 5%. This research can add to knowledge in designing safe timber structures with bio-based insulations.
2. Materials and Methods
2.1. Materials
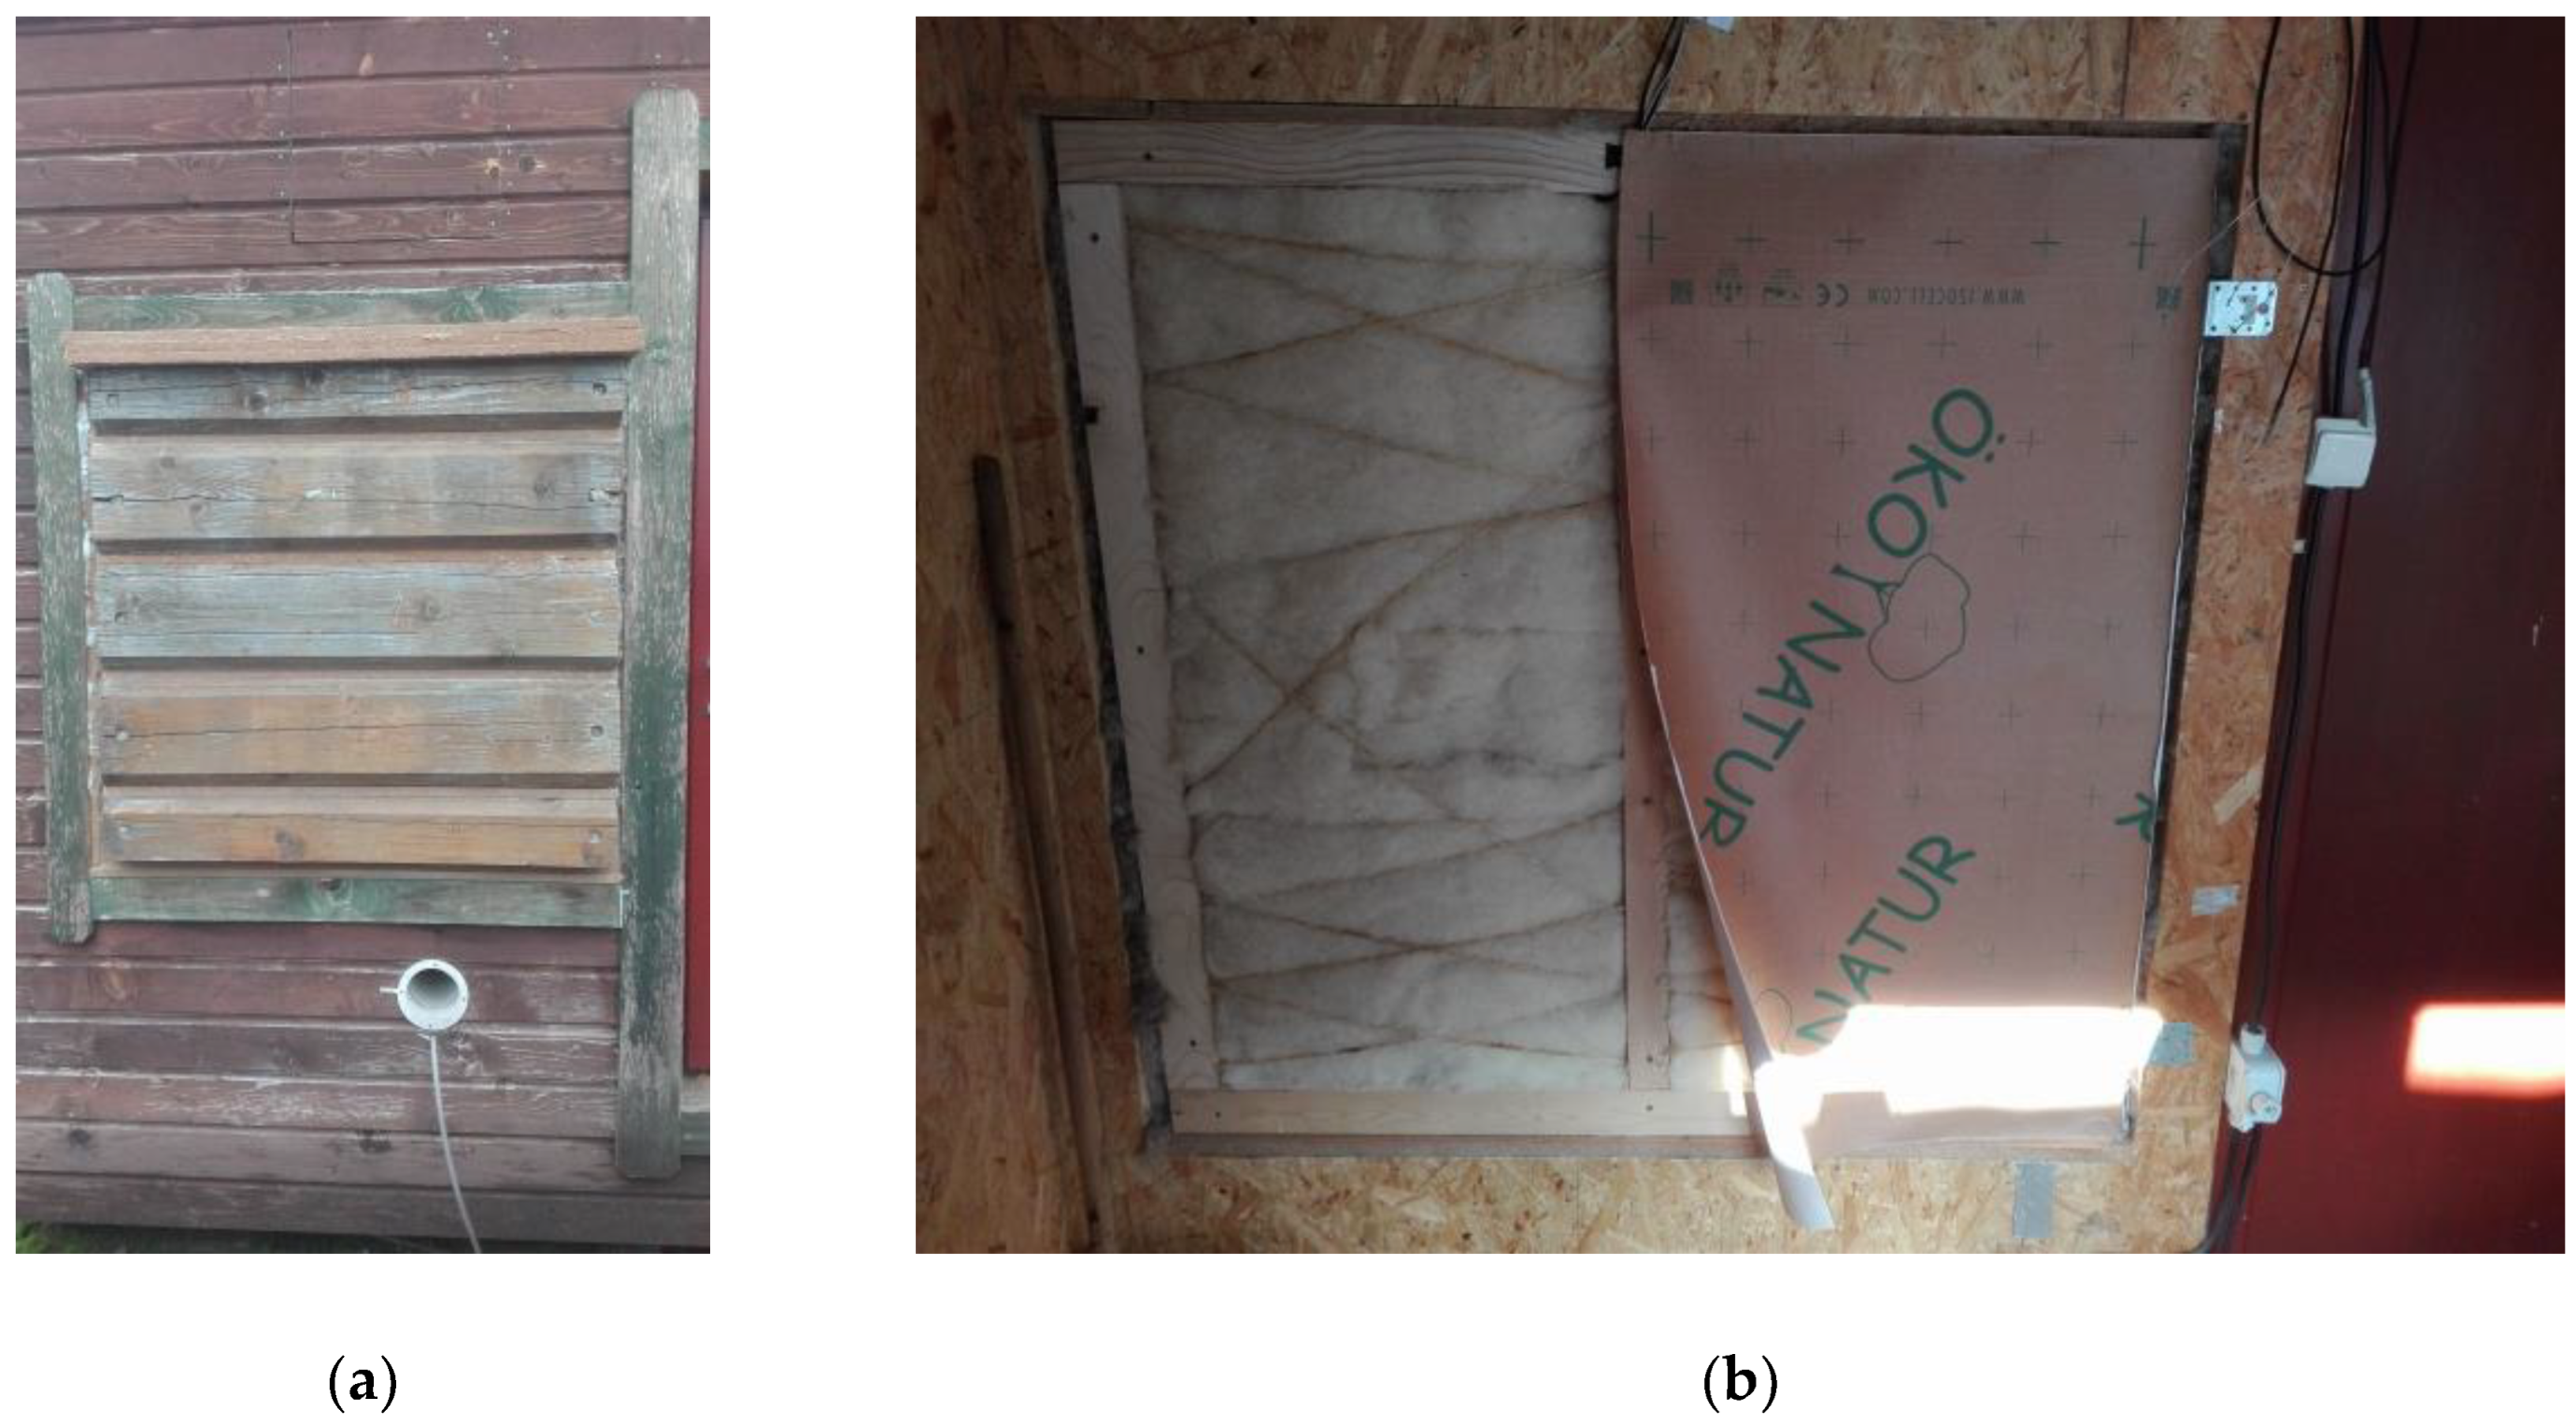
Two fragments of sandwich loadbearing peripheral log walls were designed for experimental in-situ moisture content verification. First log wall, labeled LW1, was designed with a fabric reinforced paper-based vapor retarder ISOCELL ÖKO Natur (Isocell, Zuzwill, Switzerland) and a diffusive underlay ISOCELL OMEGA 180 (Isocell, Zuzwill, Switzerland) installed directly on insulation. The second log wall was designed without vapor retarder and underlay, labeled LW2. Both walls were part of one wall assembly. Heat and mass flow between them was interrupted, as to not affect measured data.
Loadbearing layer was designed as log structure of rectangular cross section, made of air-dry spruce wood (Picea abies (L.) Karst).
Sheep wool, used as thermal insulation in service cavity and between studs, was the Gold isolation Silver (Wool Style, Terchová, Slovakia).
Respective material properties are shown in Table 1.
Figure 1.
Log wall LW1 with vapor retarder. (1) Spruce log structure, (2) Diffusive underlay, (3) Sheep wool insulation, (4) Vapor retarder, (5) Sheep wool insulation in service cavity, (6) Spruce interior cladding, (7) Air temperature and relative humidity sensor. (a) Floor plan; (b) Cross-section.
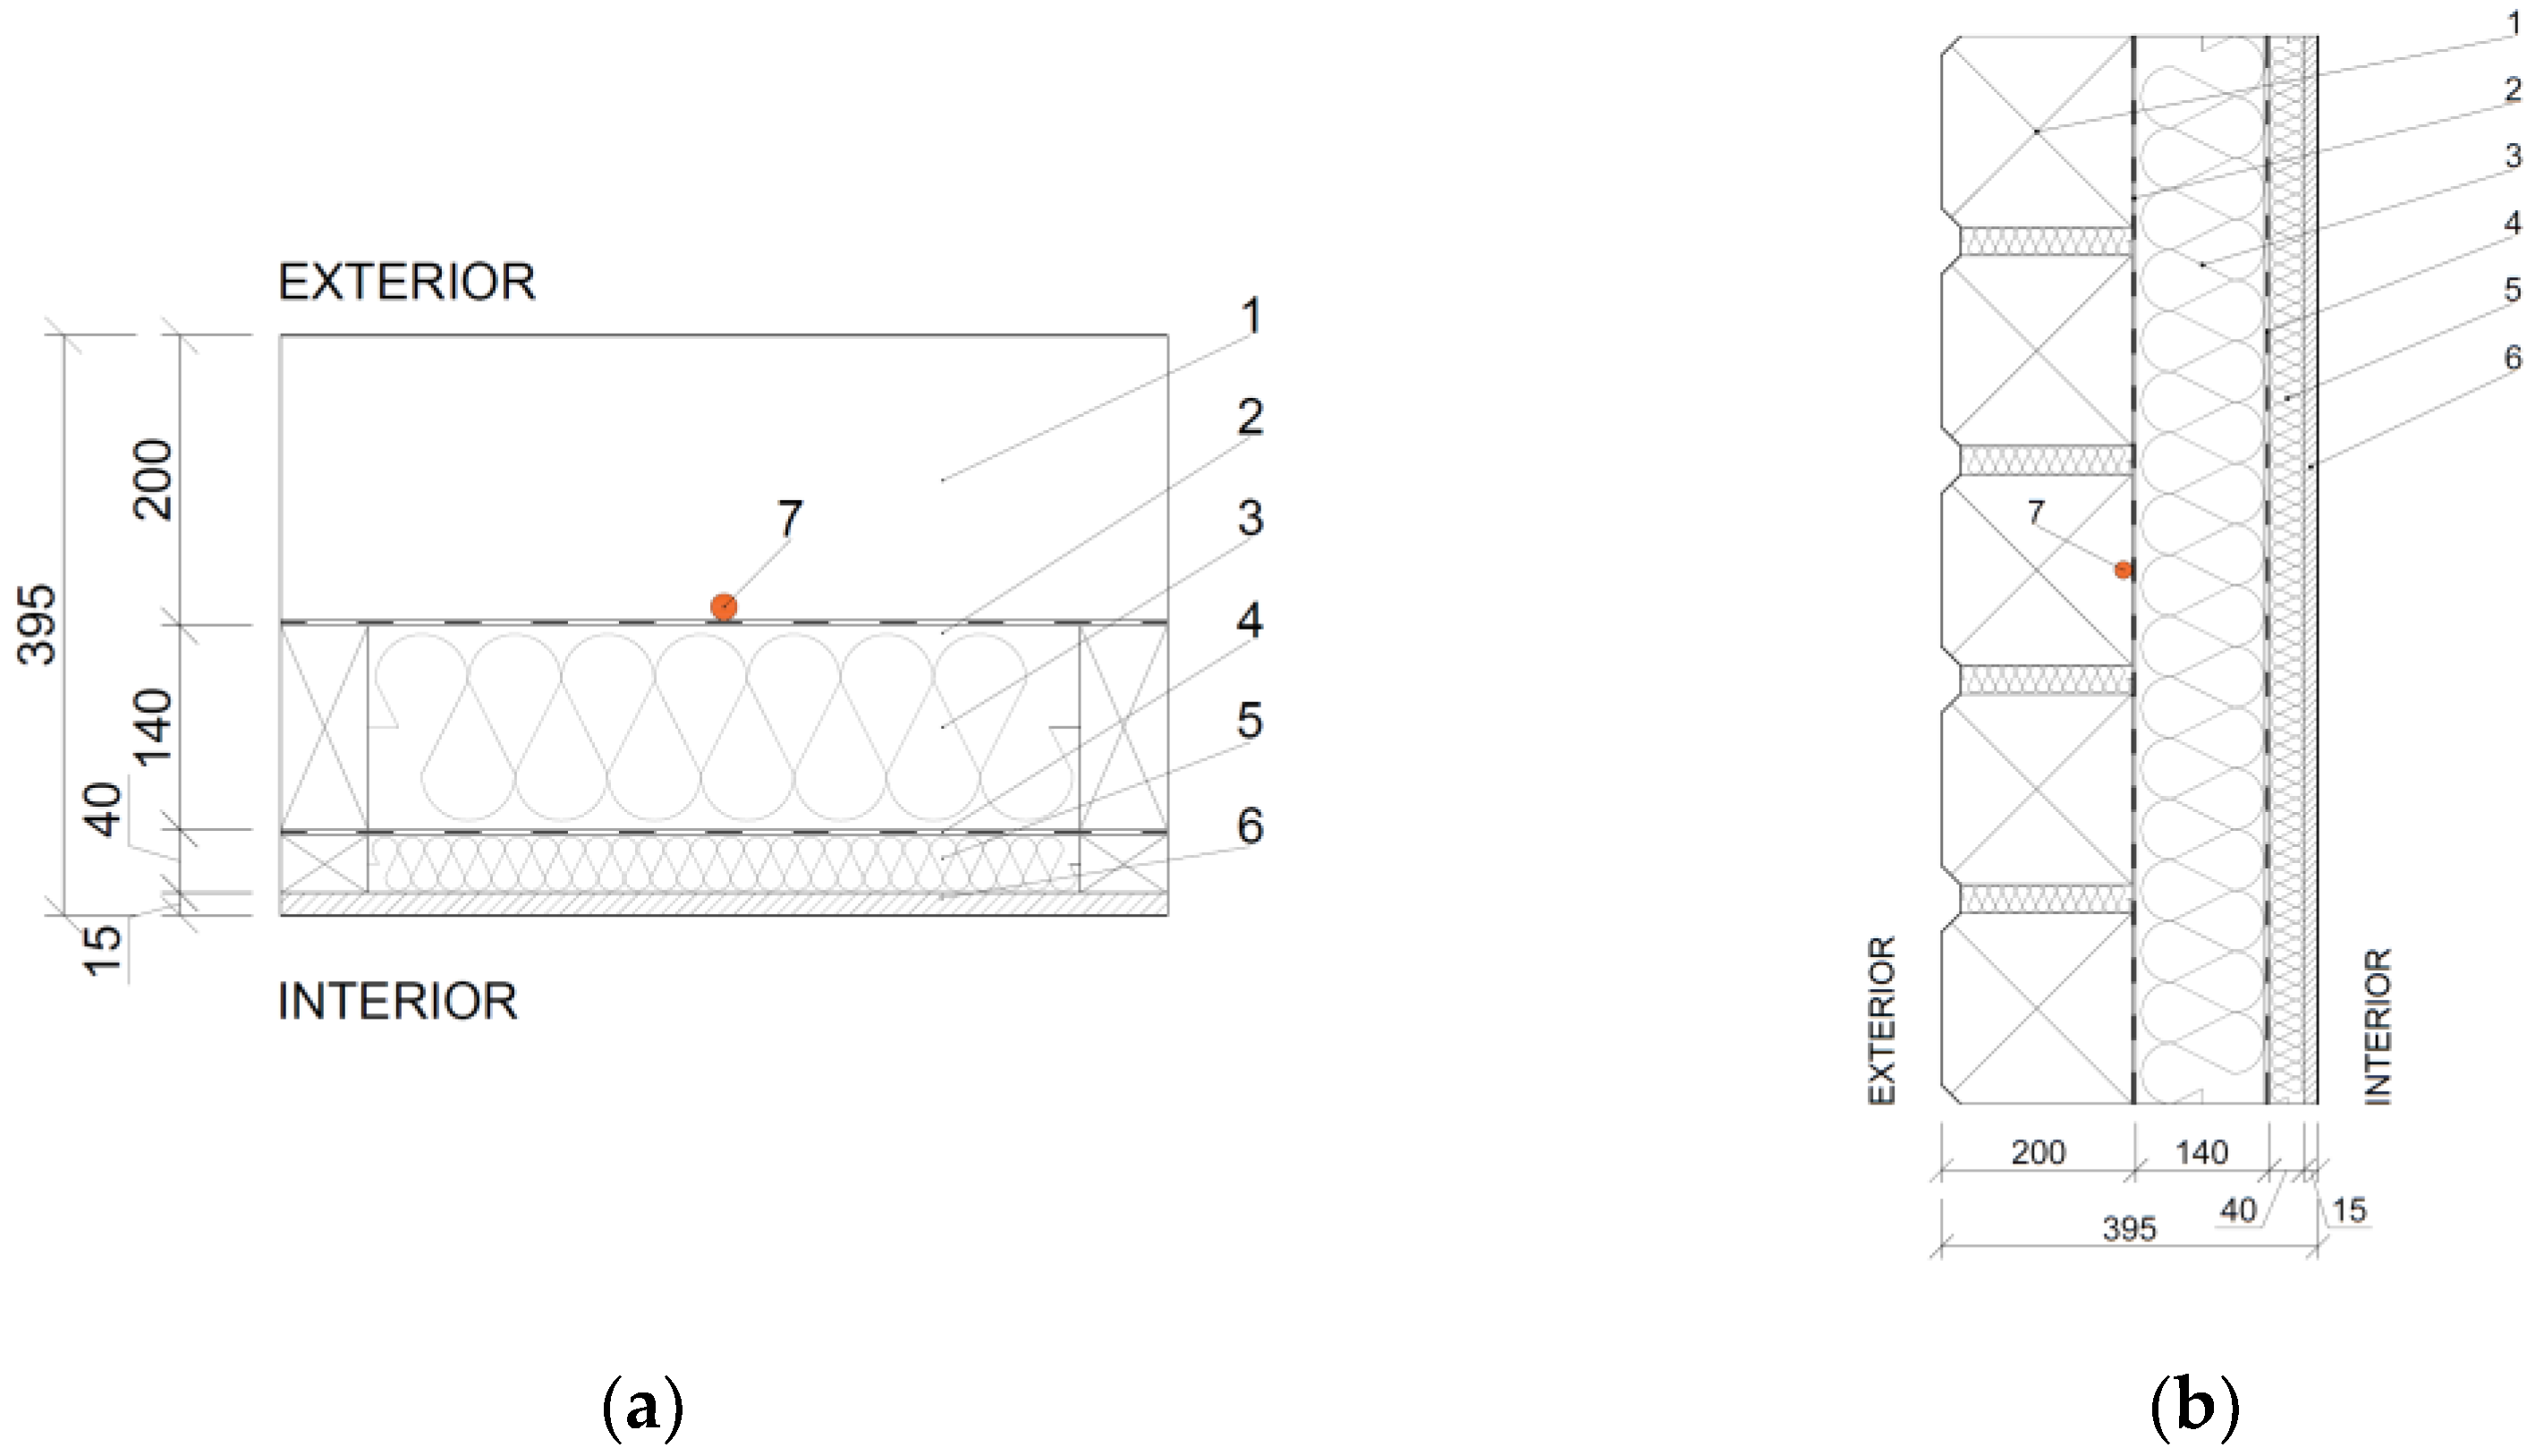
Figure 2.
Log wall LW2 without vapor retarder. (1) Spruce log structure, (3) Sheep wool insulation, (5) Sheep wool insulation in service cavity, (6) Spruce interior cladding, (7) Air temperature and relative humidity sensor. (a) Floor plan; (b) Cross-section.
Figure 2.
Log wall LW2 without vapor retarder. (1) Spruce log structure, (3) Sheep wool insulation, (5) Sheep wool insulation in service cavity, (6) Spruce interior cladding, (7) Air temperature and relative humidity sensor. (a) Floor plan; (b) Cross-section.
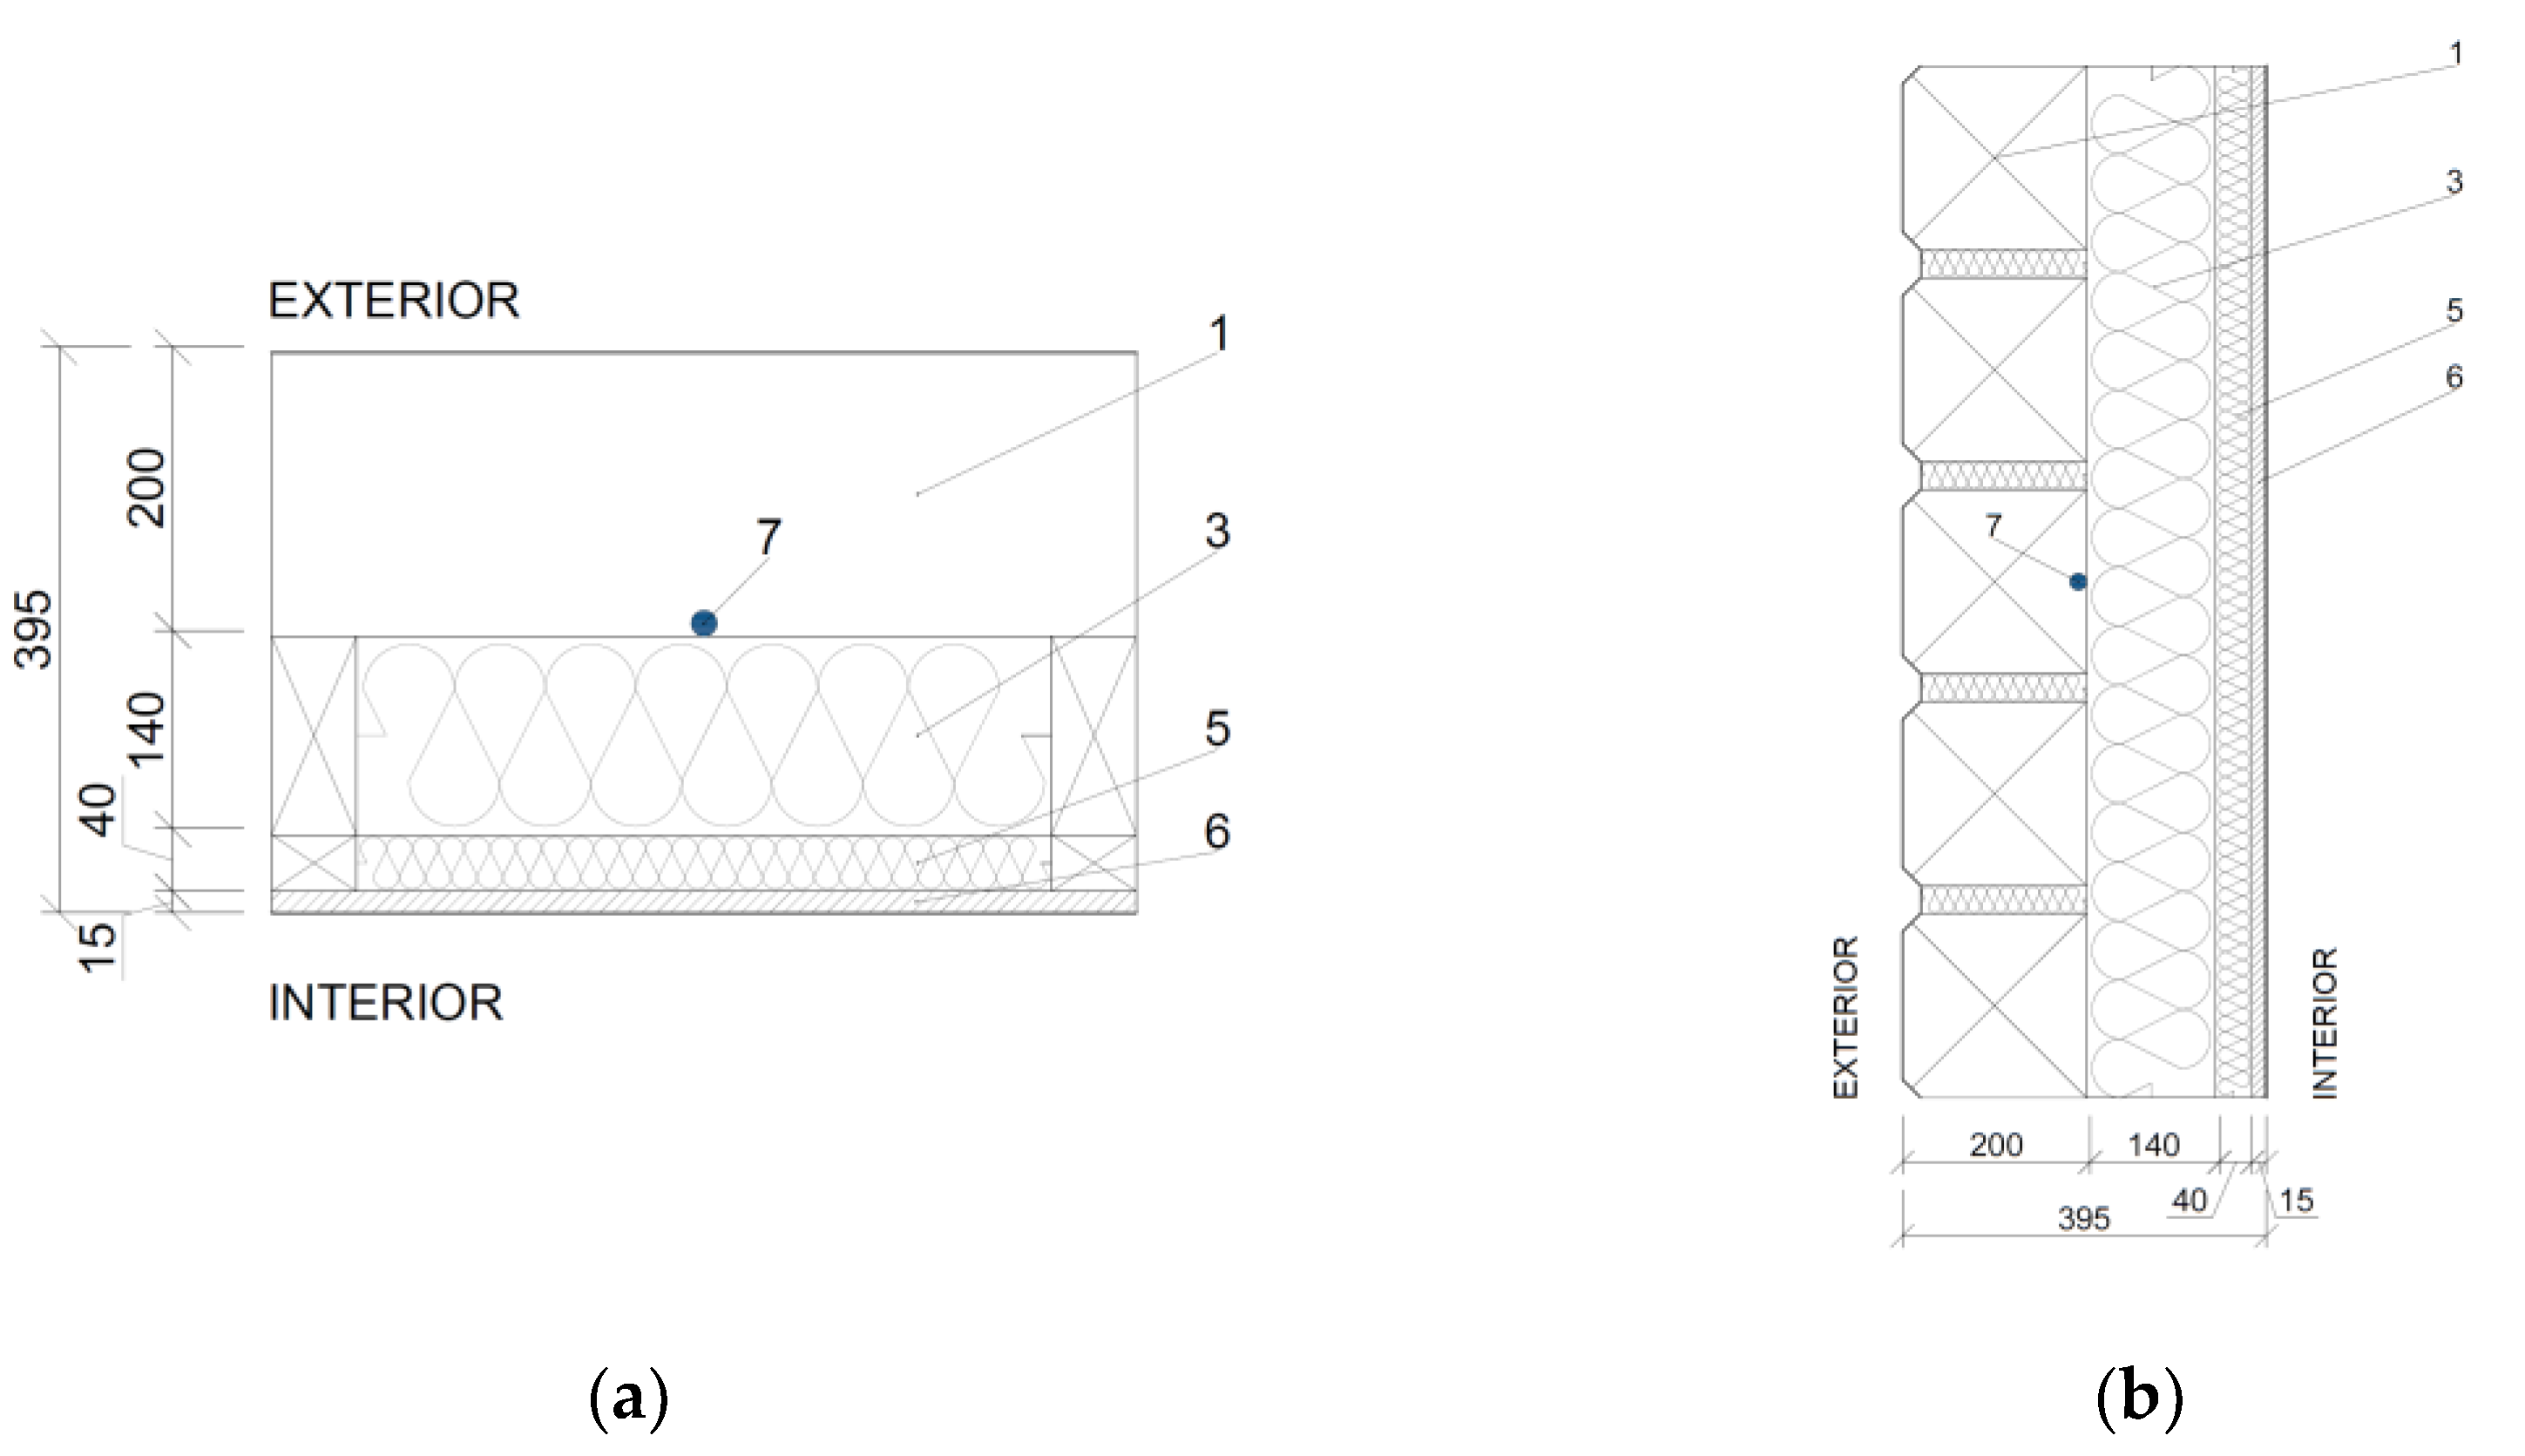
Figure 3.
Log wall assembly. (a) Exterior log structure; (b) Interior view, insulation between studs, without service cavity and cladding.
Figure 3.
Log wall assembly. (a) Exterior log structure; (b) Interior view, insulation between studs, without service cavity and cladding.
2.2. Thermal Performance
Thermal performance of the proposed structures was computed in accordance with one-dimensional, steady-state method described in [15]. Software ISOVER Fragment (Saint-Gobain, Bratislava, Slovakia) was used to evaluate heat transfer and vapor diffusion through the structure.
2.2. In-Situ Conditions
Both walls were installed in research timber structure at Technical university in Zvolen (48.571719 N; 19.118268 E; roughly 300 meters above mean sea level), facing North side. While log lumber was exposed to exterior weather conditions, which includes change of air temperature and humidity, rain, wind and snow, interior climate was maintained at almost constant air temperature, as shown in Table 3. During heating season, the structure was heated, while in non-heating season, it was cooled with air conditioner FUJITSU ASYG07LLCE (Fujitsu General, Suenaga, Japan).
Air temperature, relative air humidity and air pressure, both in exterior and interior, as well as in critical locations in the structures, shown in Figure 1. and Figure 2., were recorded by sensors AHLBORN FHAD46C2 (AHLBORN, Holzkirchen, Deutschland) and stored via data logger AHLBORN ALMEMO 5690 (AHLBORN, Holzkirchen, Deutschland) in 1-hour intervals. Verification period lasted from 30th January 2019 to 3rd May 2021. Critical location was identified as border of sheep wool insulation between studs and log structure due to the increase in diffusion resistance between these materials. This increase might cause condensation of water vapor in structure, resulting in risk of biodegradation.
An unexpected power outage occurred, which caused data from 7th May 2019 to 12th December 2019, April 16th to 30th and May 19th to June 5th, 2019, which caused some data to be deleted. Experimental verification continued and recorded data are shown in chapter 3.
2.3. Measurement Methods
To verify moisture content of the wool insulation, an oven-dry method was used [16] on weights RADWAG WLC 2/A2 (RADWAG, Radom, Poland). Weighing intervals were from 2 to 4 weeks. Samples of sheep wool insulation in service cavity and between studs were weighed periodically, and at the end of experiment were dried in an oven. Periodic weighing during drying was noted and after the difference between the two measurements were settled, sheep wool insulation was considered dry. This weight was then compared to measurements during the observed period and moisture content of the insulation was determined.
To verify the moisture content of log structure, a resistance multipurpose meter with wood temperature compensation HYDROMETTE HT 85T (GANN, Gerlingen, Deutschland) was used. Measurements were done with electrode pins 30 mm long, effectively measuring moisture content below the interior surface of log structure.
2.4. Evaluation Methods
Firstly, the categorical factors were defined. One factor was structure, with and without water vapor retarder, labeled LW1 and LW2, and the other was season, namely heating seasons of 2019 – 2021 and non-heating seasons of 2019 – 2020. The effect on moisture content of insulations and log structure was then verified. To evaluate the results and determine, whether the measurements are impacted by these factors, two-way ANOVA (analysis of variance) method in software STATISTICA 12 (DataBon, Prague, Czech Republic) was used. A significance level of 5% was used. Two-way ANOVA determined p – value and partial eta squared, which describes the effect size. If the significance of each factor was proven, the post hoc Tukey HSD test (Tukey’s honestly significant difference test) was done.
Then, Student’s t-test was done for every variable – monitored season, while grouping measurements by structure. Results would confirm or deny statistical significance of difference in mean values of measurements, proving or disproving the impact of vapor retarder on analyzed moisture content. The significance level was set at 5%.
Tdew,a = T – Tdew (°C)
Secondly, the risk of water vapor condensation was evaluated by dew point analysis. Subtracting the air temperature of a dew point from measured air temperature in the critical place in the structure can determine whether conditions for condensation and risk of biodegrading agents, such as mold would be met. Equation for dew point analysis is:
If the result of dew point analysis reaches 0 or lower, air temperature in structure reaches dew point temperature and conditions for condensation are met. Dew point analysis is compared to measured moisture content of log structure on interior side, to determine response of wood.
3. Results
3.1. Simulated Thermal Performance
Results of one-dimensional, steady-state simulation of thermal conduction coefficient are shown in Table 4.
Results show both assemblies satisfy normalized heat transfer coefficient and thermal resistance value. Simulation suggests water vapor condensation in both assemblies during the year, however, all-year balance of condensed and evaporated water in structure is favorable, given negative value. Superficial temperature remained well above dew point, therefore no condensation on surface of wall would occur. In summary, both LW1 and LW2 are safe for design from the point of view of required hygrothermal properties [15].
3.2. In-Situ Measurements
During the monitored period, the following exterior and interior conditions were recorded.
Exterior conditions, shown in Figure 4, match the expected periodic increase and decrease in temperatures throughout the year, given the climate in the location in-situ measurements took place. According to Köppen Climate Classification Map [17], location Zvolen, Slovakia is categorized Dfb – Humid Continental Mild Summer, Wet All Year.
Interior air temperature, shown in Figure 5., was maintained stable to simulate normal use of living quarters. A power outage caused reset in measuring tools and thus measurements between May 7th and December 12th, 2019, were not recorded. Another power outage occurred on April 16th to 30th and May 19th to June 5th, 2019, causing reset in measuring tool and air conditioning, resulting in loss of data and presumably increase of interior temperature, causing notable decrease in moisture content of sheep wool insulation in service cavity, as shown in Figure 5.
Higher interior relative air humidity during non-heating season of 2020 was caused by less frequent ventilation of interior of research building during warm days, where the heat flow was reversed from exterior to interior, thus accumulating air humidity in the structure.
During the monitored period, moisture content of the sheep wool insulation in service cavity, between studs and moisture content of log structure on the interior side, both LW1 with vapor retarder and LW2 without vapor retarder, was measured and is shown in following graphs. Following graphs, results of statistic evaluation are shown and described.
3.2. Sheep Wool Insulation in Service Cavity
Measured moisture content of sheep wool insulation in service cavity during the whole observation period is shown in Figure 6.
During the observed period, the mean moisture content in the sheep wool insulation in the service cavity was overall higher for the structure with a vapor barrier (LW1), than the structure without a vapor barrier (LW2), as shown in Table 5.
Two-way ANOVA was used to determine whether the vapor barrier, the heating or non-heating season, and their interaction had significant impact on mean values of moisture content measurements. Results are shown in Table 6., highlighting red confirmed significance of factors on mean measurements, where p < 0.05, and the effect size, described by eta squared.
Figure 7.
95% confidence intervals for mean moisture contents of sheep wool insulation in service cavity.
Figure 7.
95% confidence intervals for mean moisture contents of sheep wool insulation in service cavity.
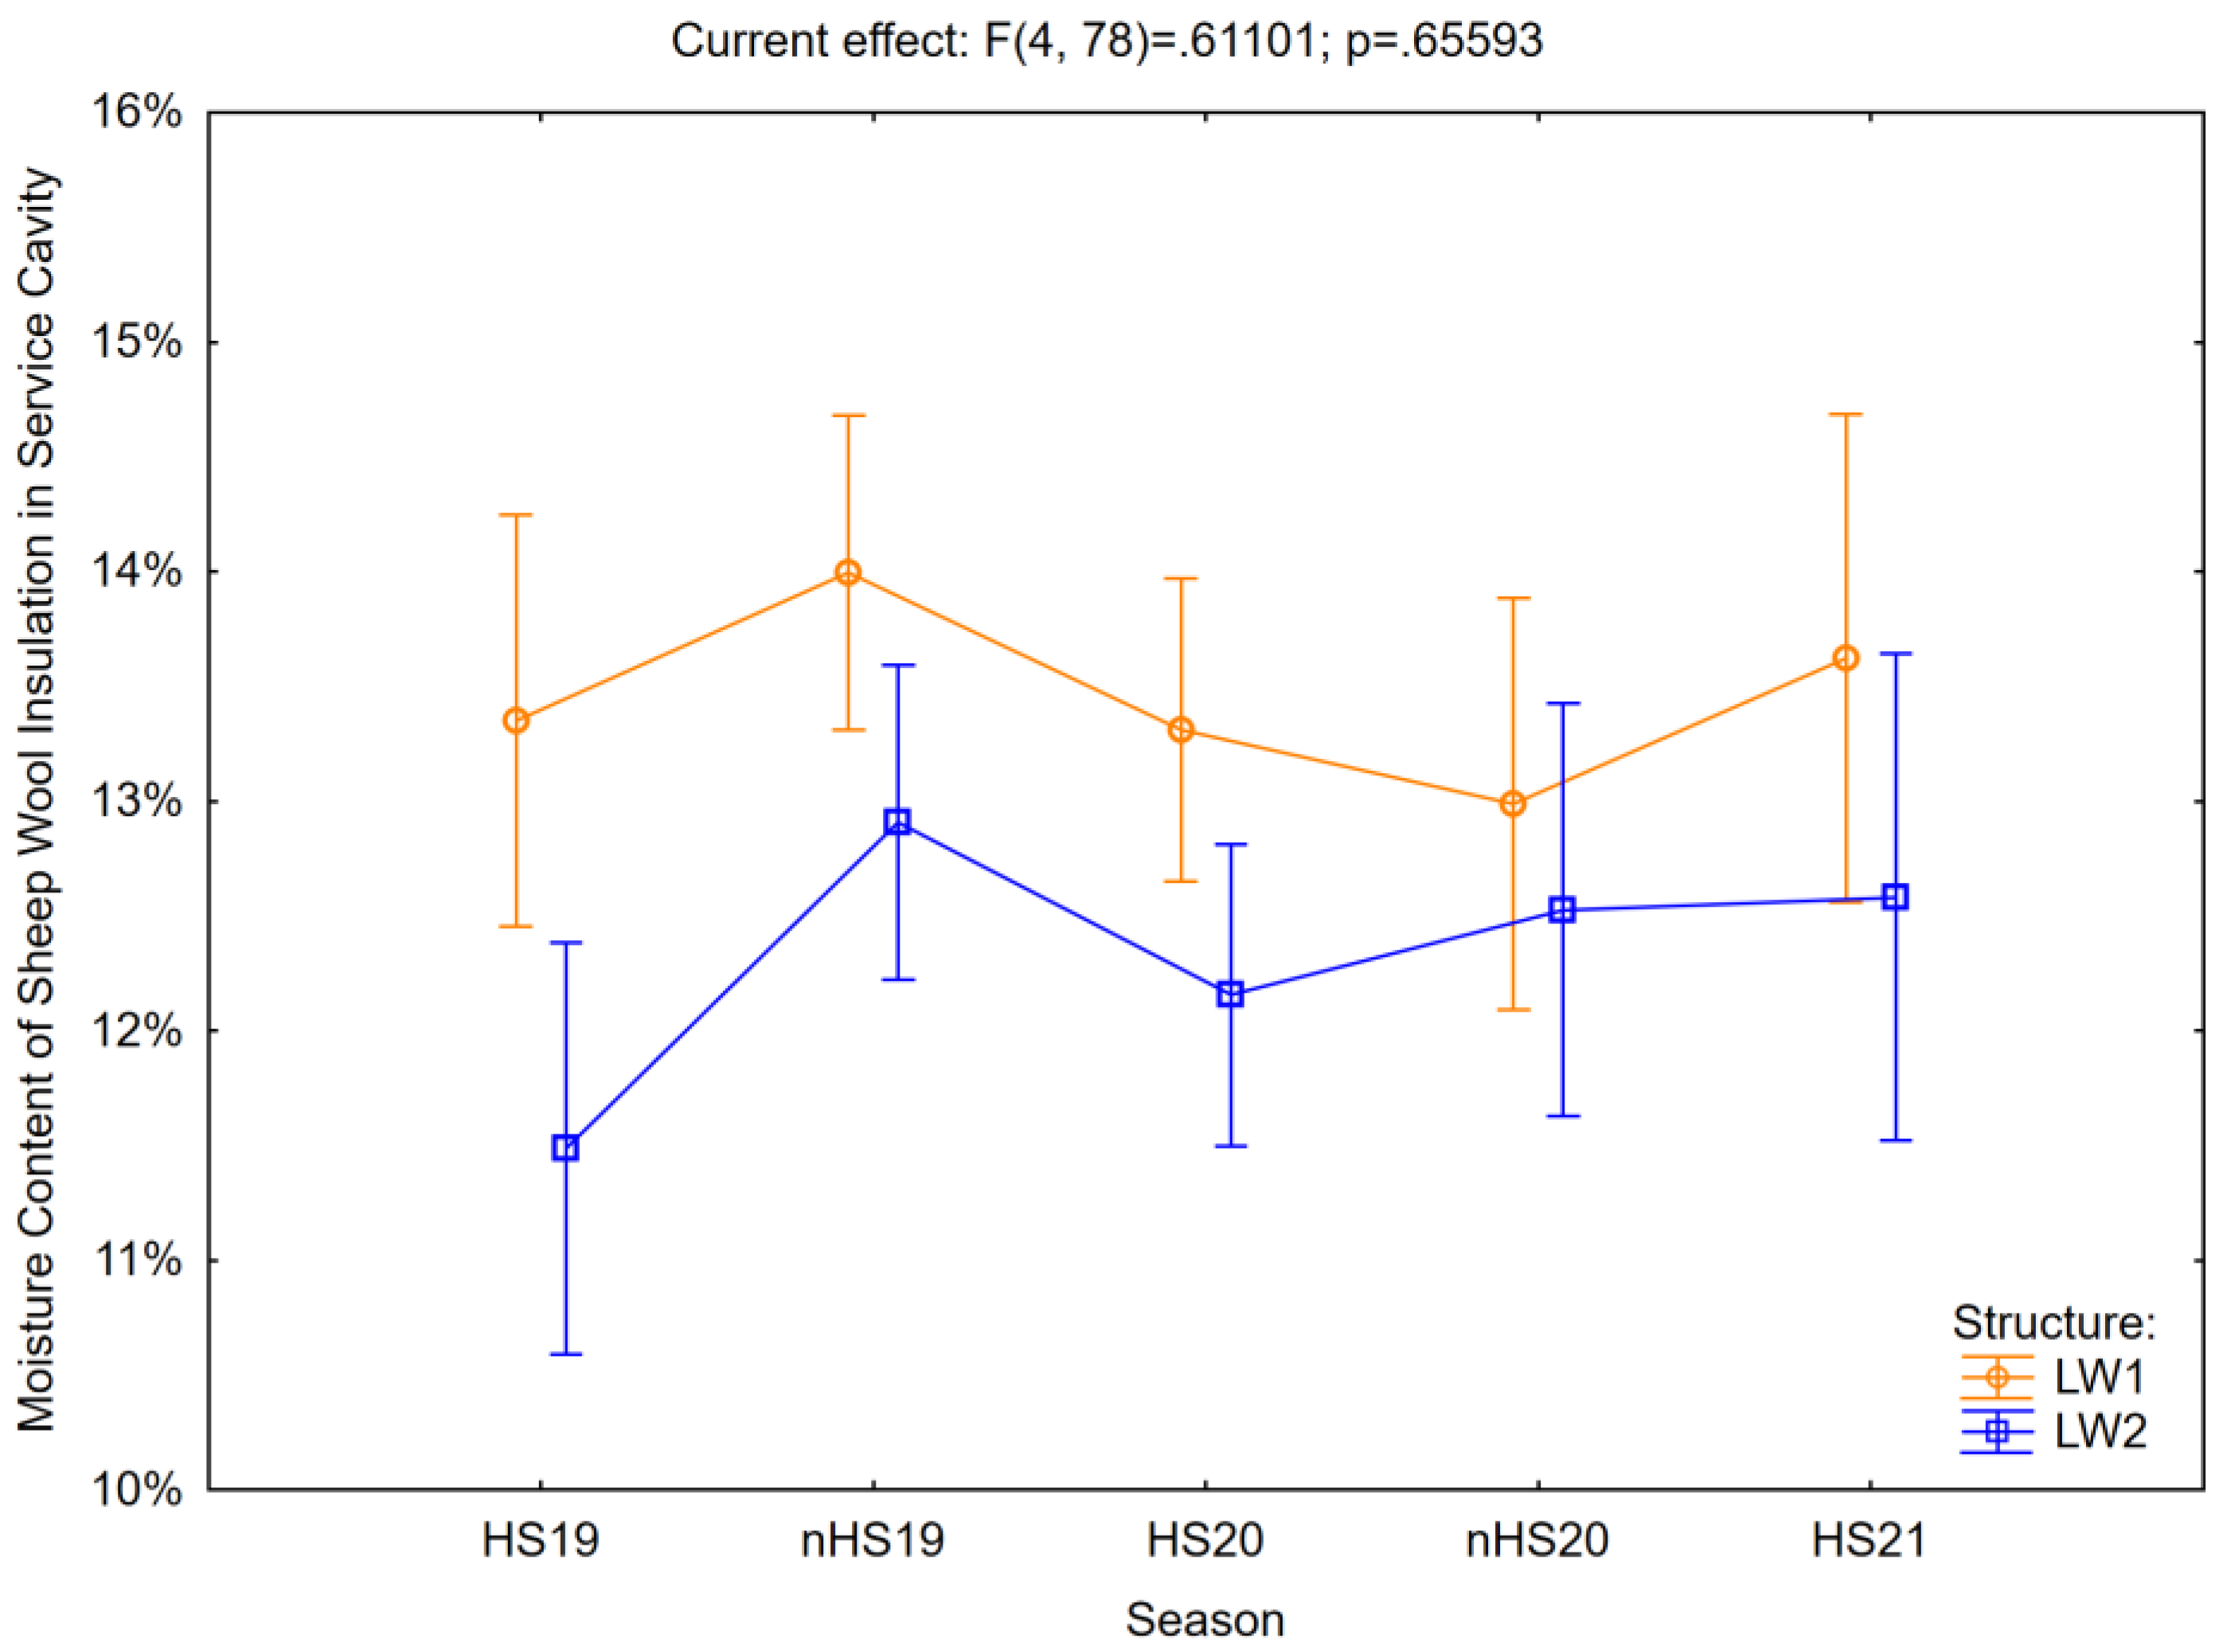
Results of two-way ANOVA confirmed null hypothesis for season and interaction of structure and season, however, rejected null hypothesis and confirmed alternative hypothesis for structure factor, that is, there is significant difference in mean moisture content between LW1 and LW2. Therefore, significant impact of vapor retarder on mean moisture content of the insulation during measured period was proven.
Two-way ANOVA was followed by Student’s t-test for independent groups, testing equality in means during individual season. Results are shown in Table 7.
Results of the t-test confirmed null hypothesis, the means in the two groups LW1 and LW2 have no significant differences during non-heating seasons of 2019 and 2020 and rejected null hypothesis during all heating seasons. These results indicate significant impact of water vapor retarder on moisture content of sheep wool insulation in service cavity during heating seasons. Increased mean moisture content in LW1 during heating seasons, shown in Table 5., can be explained by accumulation of water vapor before vapor retarder.
Measured moisture content in the insulation keeps below 16%, which, considering biodegrading agents, can be considered safe for the structure.
3.3. Sheep Wool Insulation Between Studs
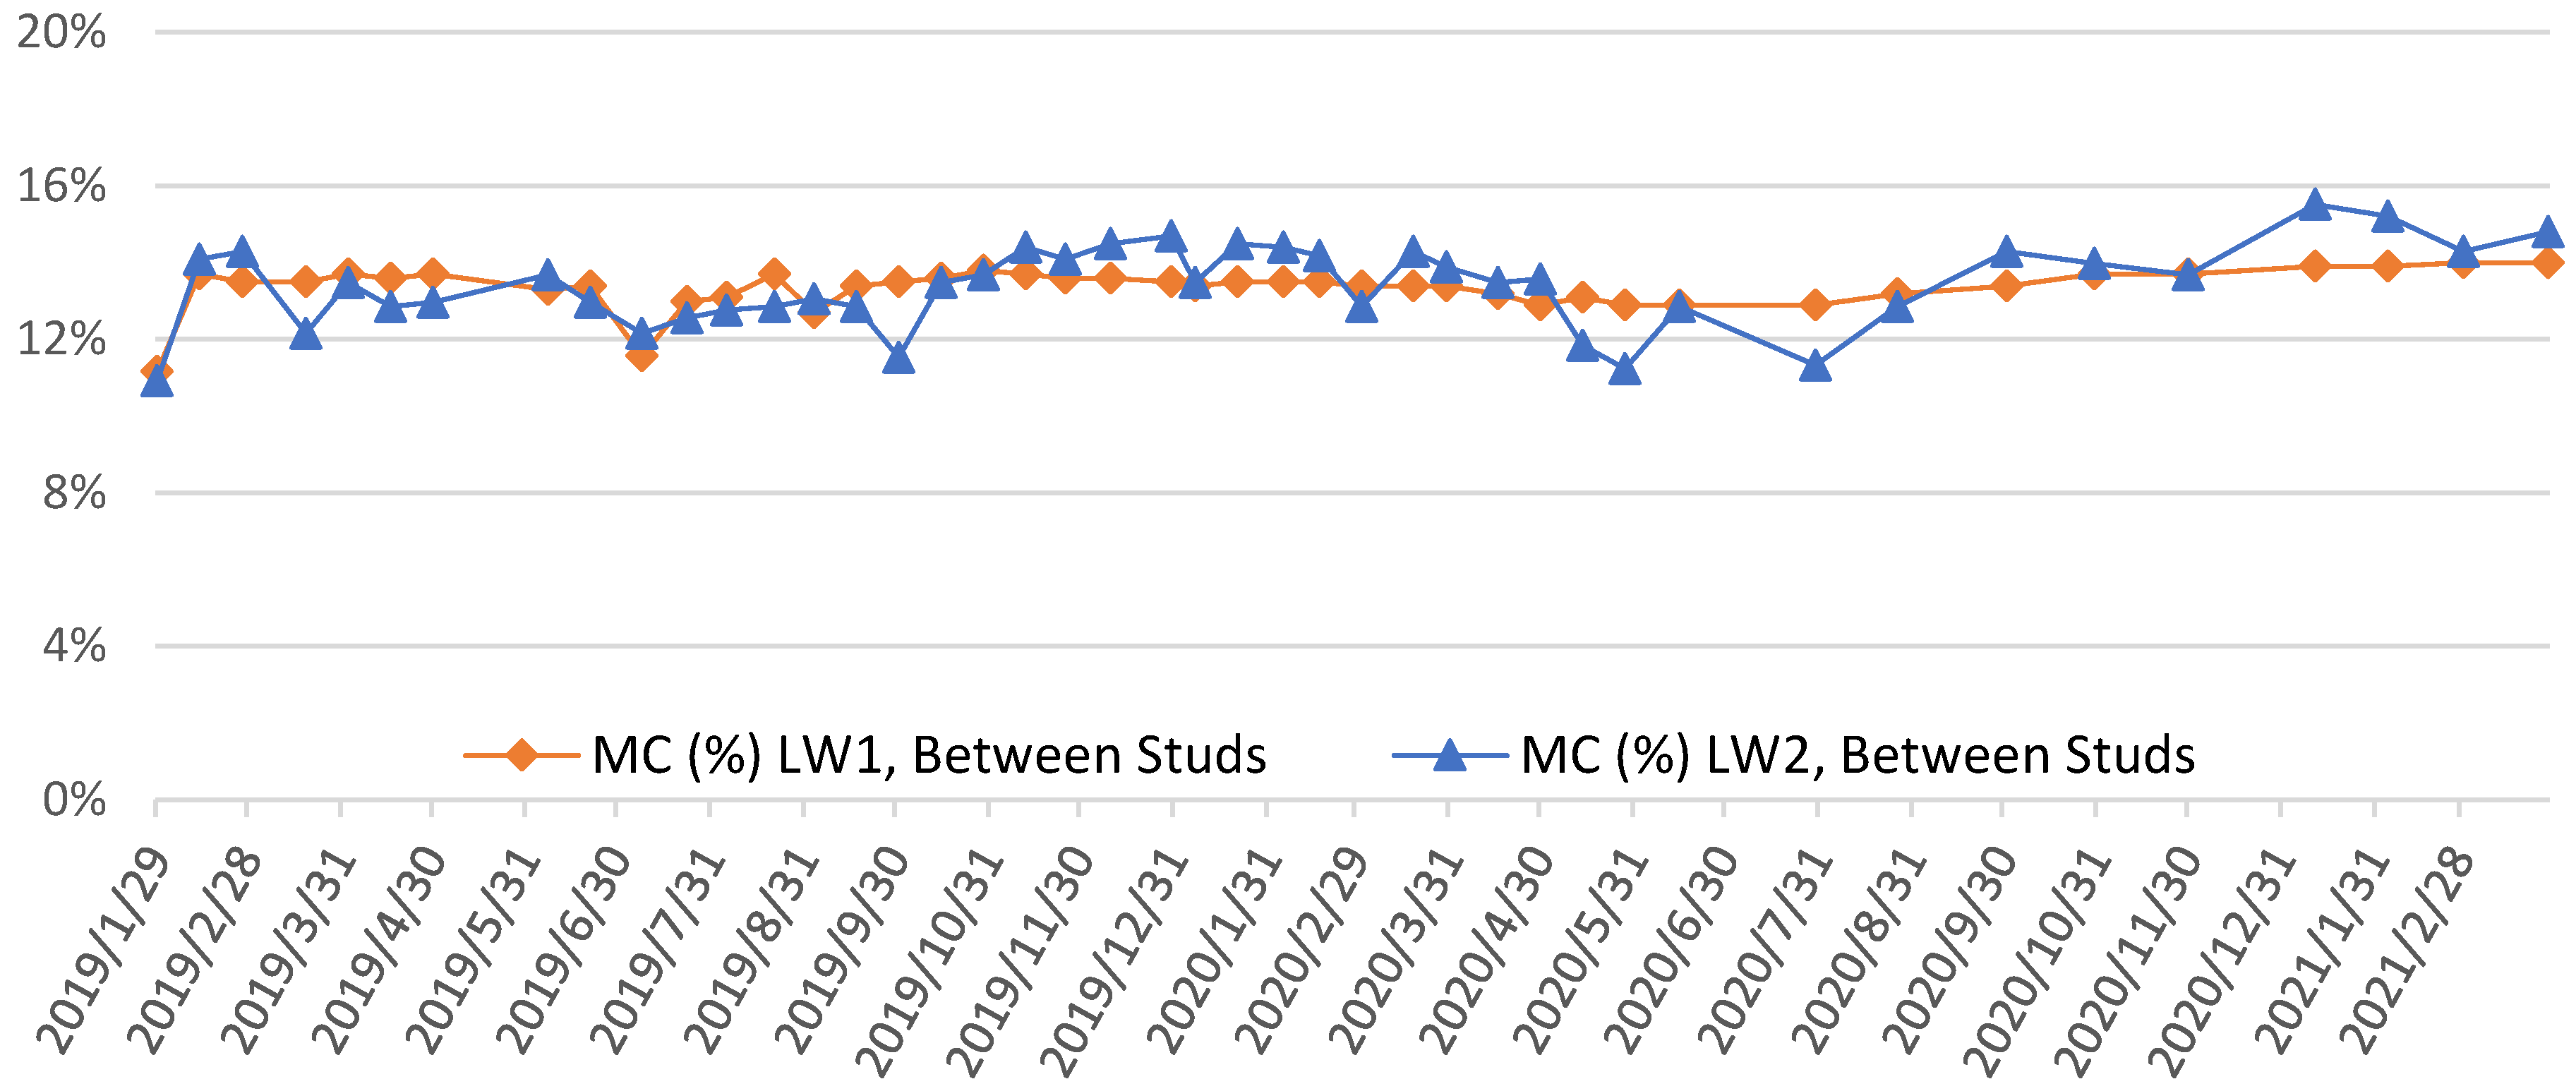
During the observed period, the mean moisture content in the sheep wool insulation between studs was overall higher for the structure without a vapor barrier LW2, than the structure with a vapor barrier LW1, as shown in Table 8. Moisture content of LW2 shows higher variability.
Figure 8.
Measured moisture content of sheep wool insulation between studs.
Two-way ANOVA was used to determine whether the vapor barrier, the heating or non-heating season, and their interaction had significant impact on mean values of moisture content measurements. Results are shown in Table 9., highlighting red confirmed significance of factors on mean measurements, where p < 0.05, and the effect size, described by eta squared.
Figure 9.
95% confidence intervals for mean moisture contents of sheep wool insulation between studs.
Figure 9.
95% confidence intervals for mean moisture contents of sheep wool insulation between studs.
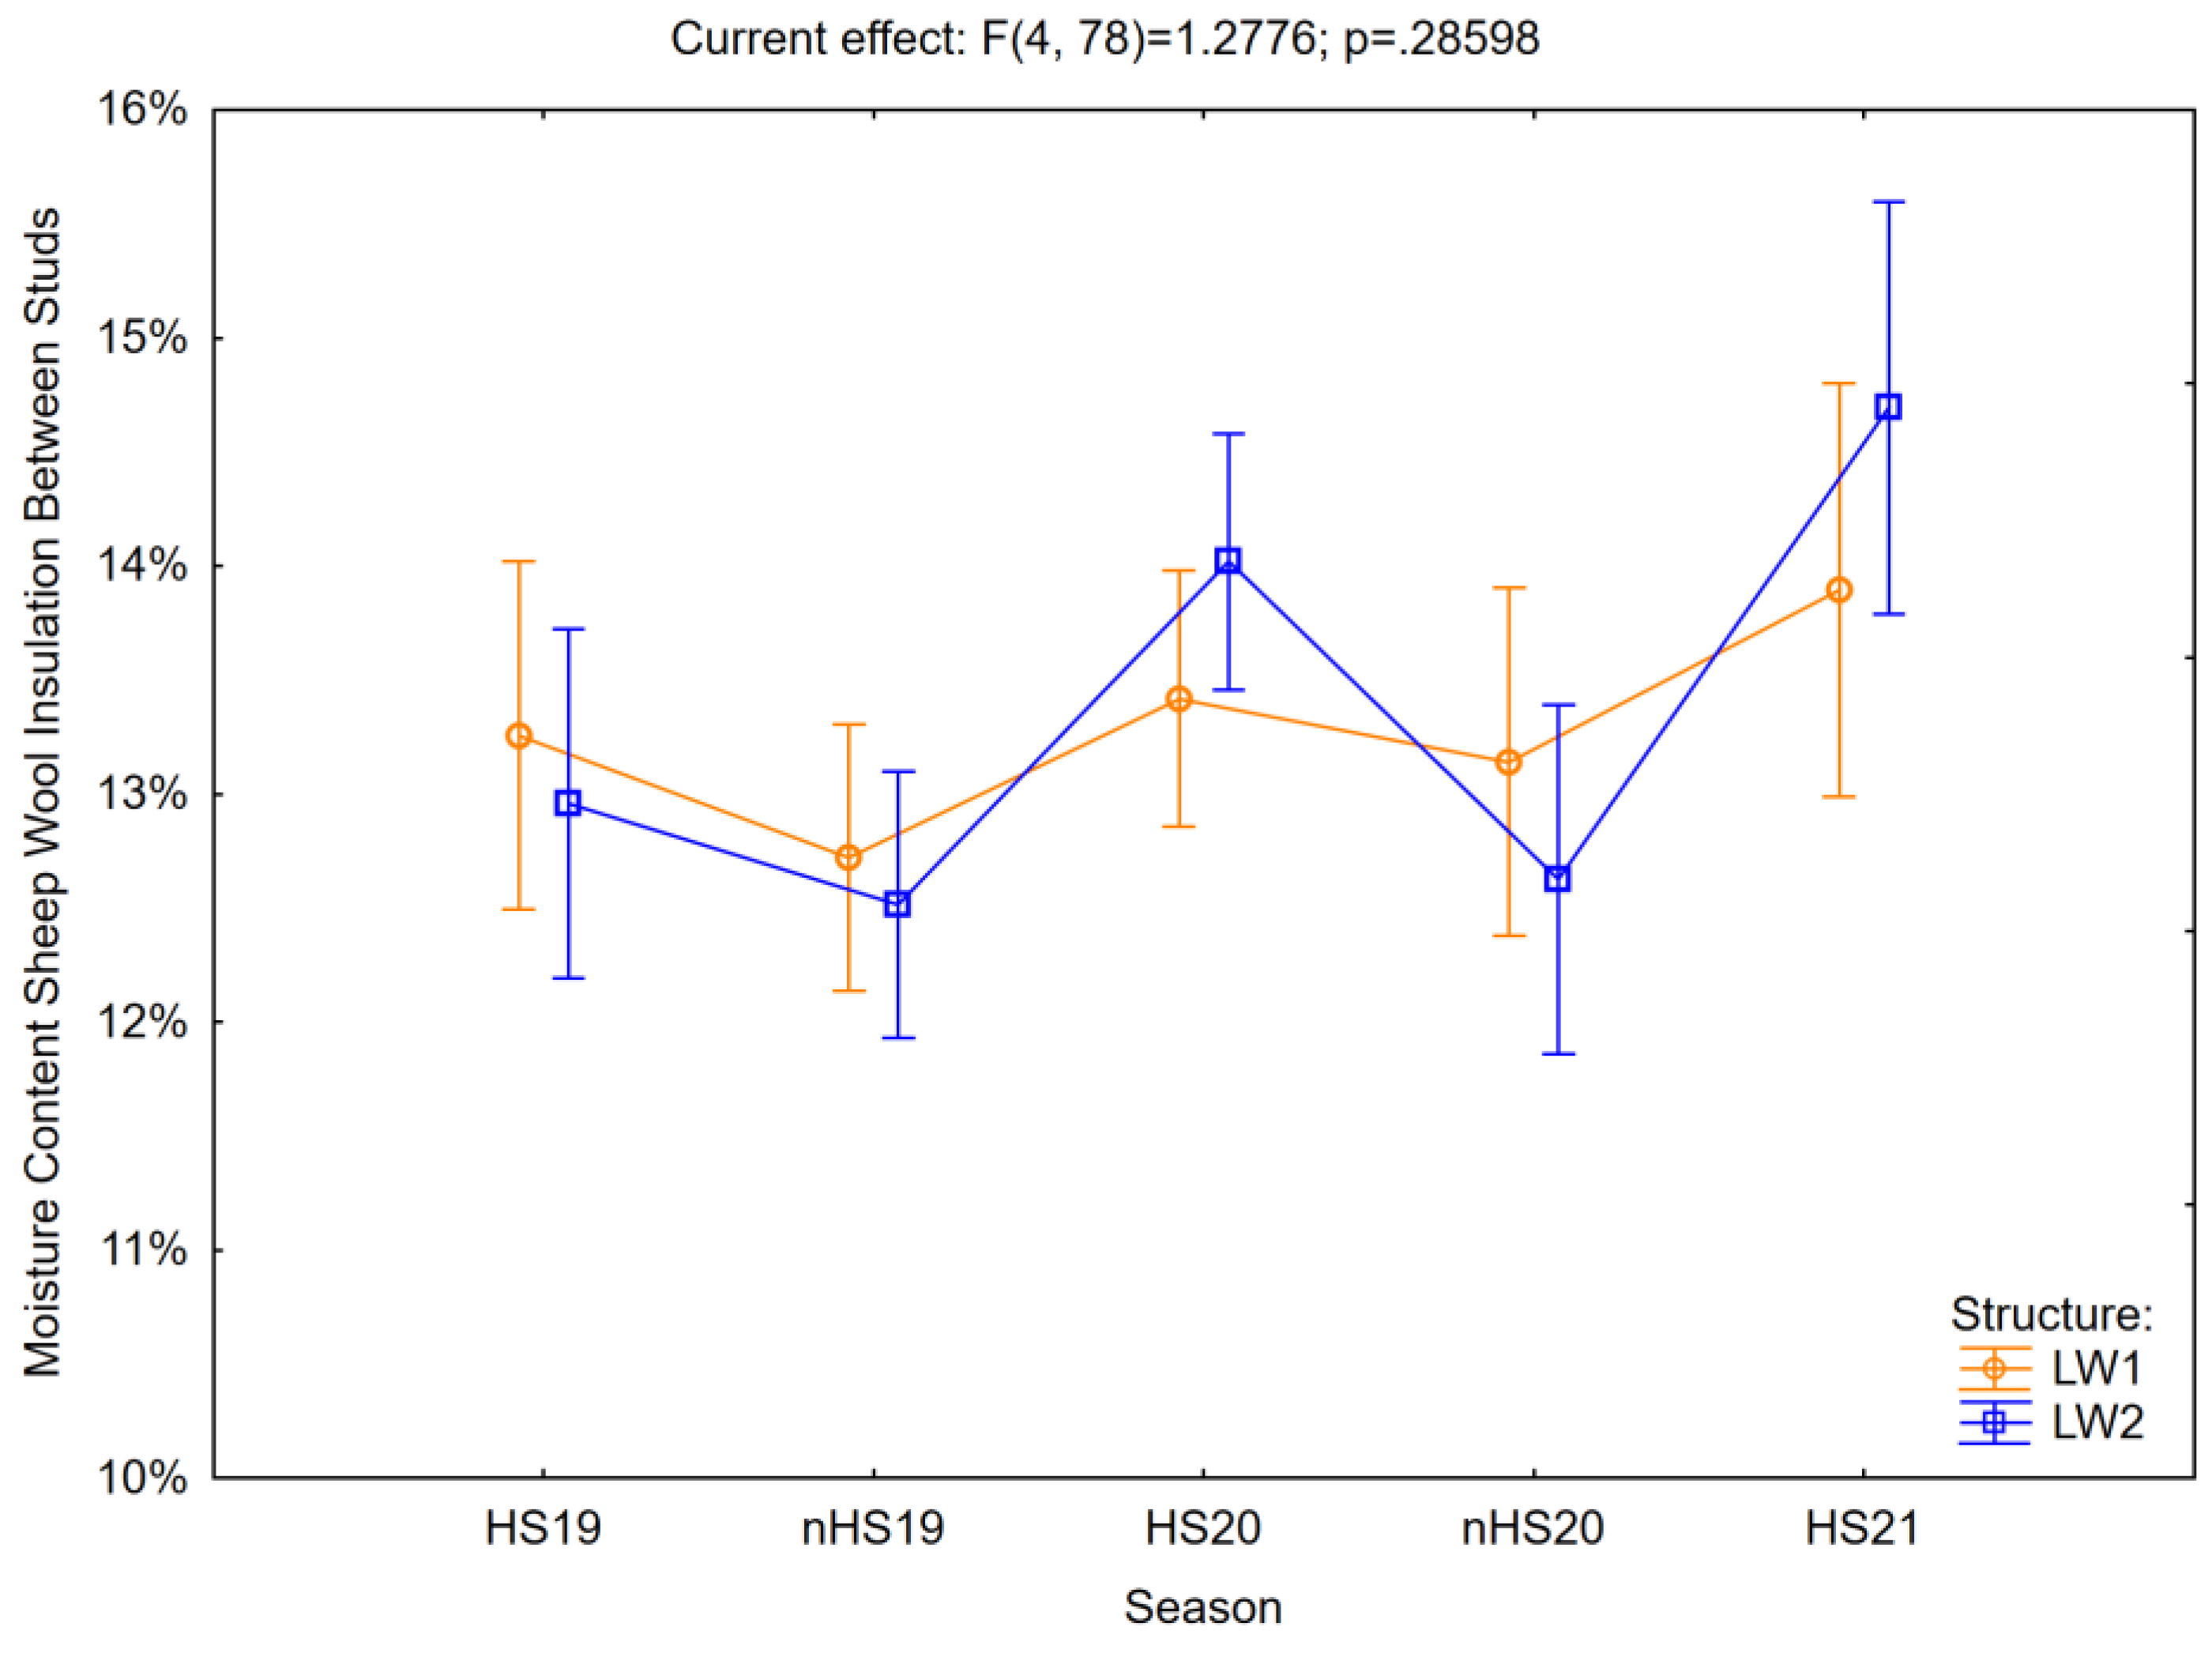
Results of two-way ANOVA confirmed null hypothesis for structure and interaction of structure and season, however, rejected null hypothesis and confirmed alternative hypothesis for season factor, that is, there is significant difference in mean moisture content between LW1 and LW2. Therefore, significant impact of heating and non-heating season on mean moisture content of the insulation during measured period was proven.
Two-way ANOVA was followed by Student’s t-test for independent groups, testing equality in means during individual season. Results are shown in Table 10.
Results of the t-test confirmed null hypothesis, the means in the two groups LW1 and LW2 have no significant differences during heating season 2019 and non-heating seasons of 2019 and 2020 and rejected null hypothesis during heating seasons 2020 and 2021. These results indicate significant impact of water vapor retarder on moisture content of sheep wool insulation in service cavity during. Values of mean moisture content, shown in Table 8., can be explained:
- HS19: effects of initial assembly of the log sandwich wall and stabilization of moisture content in sheep wool insulation, with higher variation of measurements in LW2, explained by lesser airtightness of the assembly;
- nHS19: higher mean moisture content of insulation in LW1, explained by reversed heat and mass flow through structure during warm period of the year, accumulating water vapor before vapor retarder (in insulation between studs), however, no significant difference in mean moisture content was proven;
- HS20: higher mean moisture content in LW2 compared to LW1, explained by vapor retarders effectiveness in partially stopping water vapor from entering the structure, confirmed significance of vapor retarder impact
- nHS20: same as non-heating season of 2019, higher mean moisture content of insulation in LW1 compared to LW2, explained by reversed heat and mass flow through structure during warm period of the year, accumulating water vapor before vapor retarder and no significant difference in mean moisture content was proven by t-test;
- HS21: similarly as heating season 2020, higher mean moisture content in LW2 compared to LW1, explained by vapor retarders effectiveness in slowing the transfer of water vapor through the structure from interior to exterior, confirmed significance of vapor retarder impact
3.4. Interior Side of Log Structure
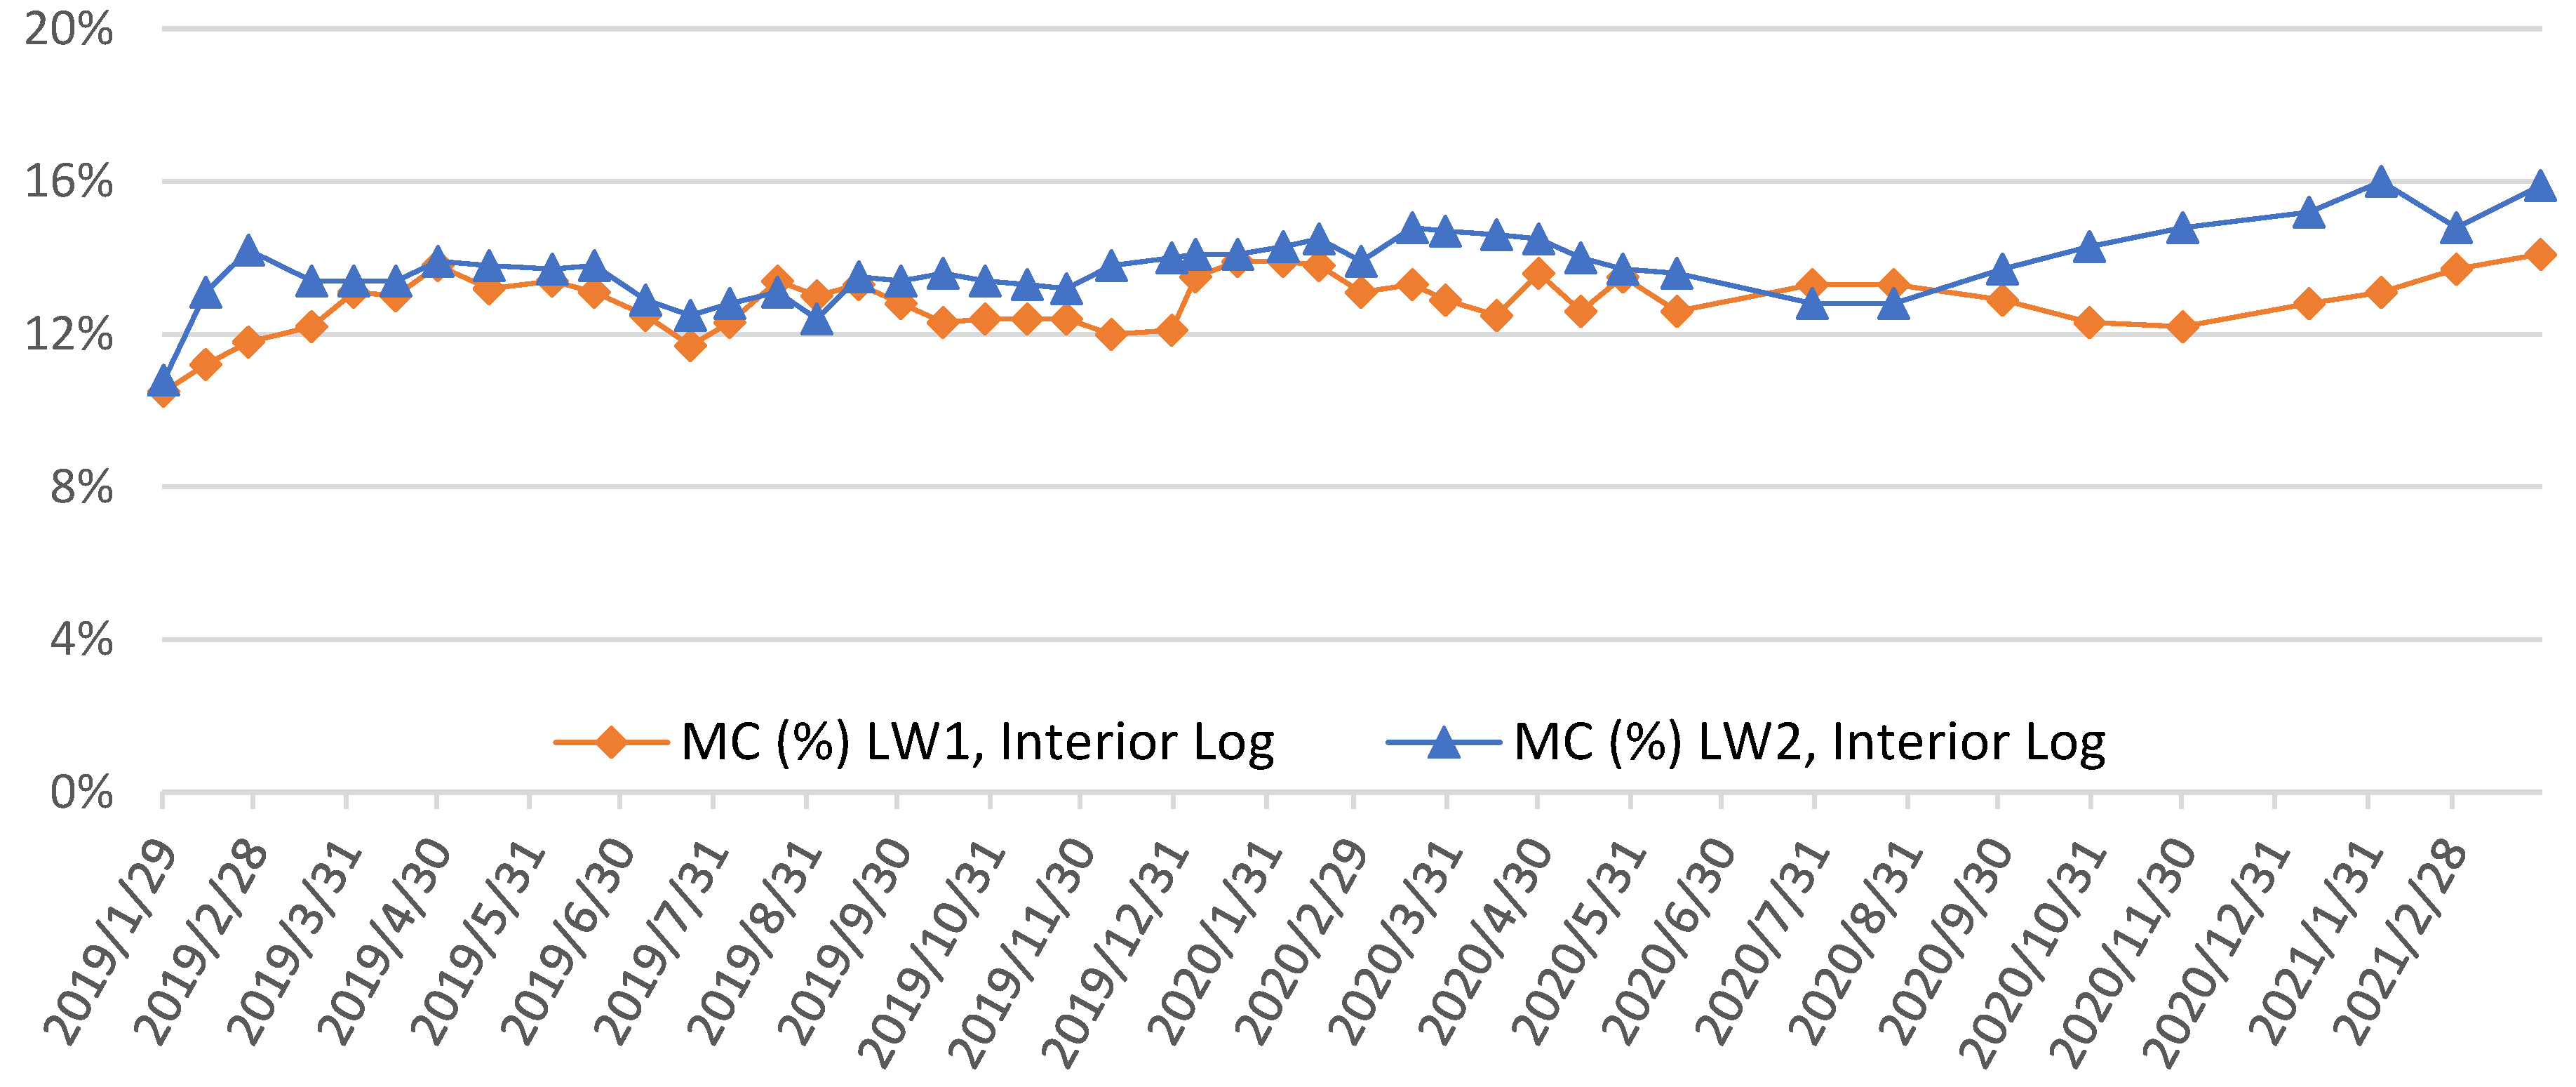
During the observed period, the mean moisture content on the interior side of log structure was overall higher for the structure without a vapor barrier LW2, than the structure with a vapor barrier LW1, as shown in Table 11.
Figure 10.
Measured moisture content of log structure on interior side.
Two-way ANOVA was used to determine whether the vapor barrier, the heating or non-heating season, and their interaction had significant impact on mean values of moisture content measurements. Results are shown in Table 12., highlighting red confirmed significance of factors on mean measurements, where p < 0.05, and the effect size, described by eta squared.
Results of two-way ANOVA rejected null hypothesis and confirmed alternative hypothesis for both factors and their interaction. Tukey HSD test was done to determine the statistical significance of mean measurements differences, results shown in Table 13. Content of table is made of p-values, comparing statistical significance of means.
Figure 11.
95% confidence intervals mean moisture contents of log structure on interior side.
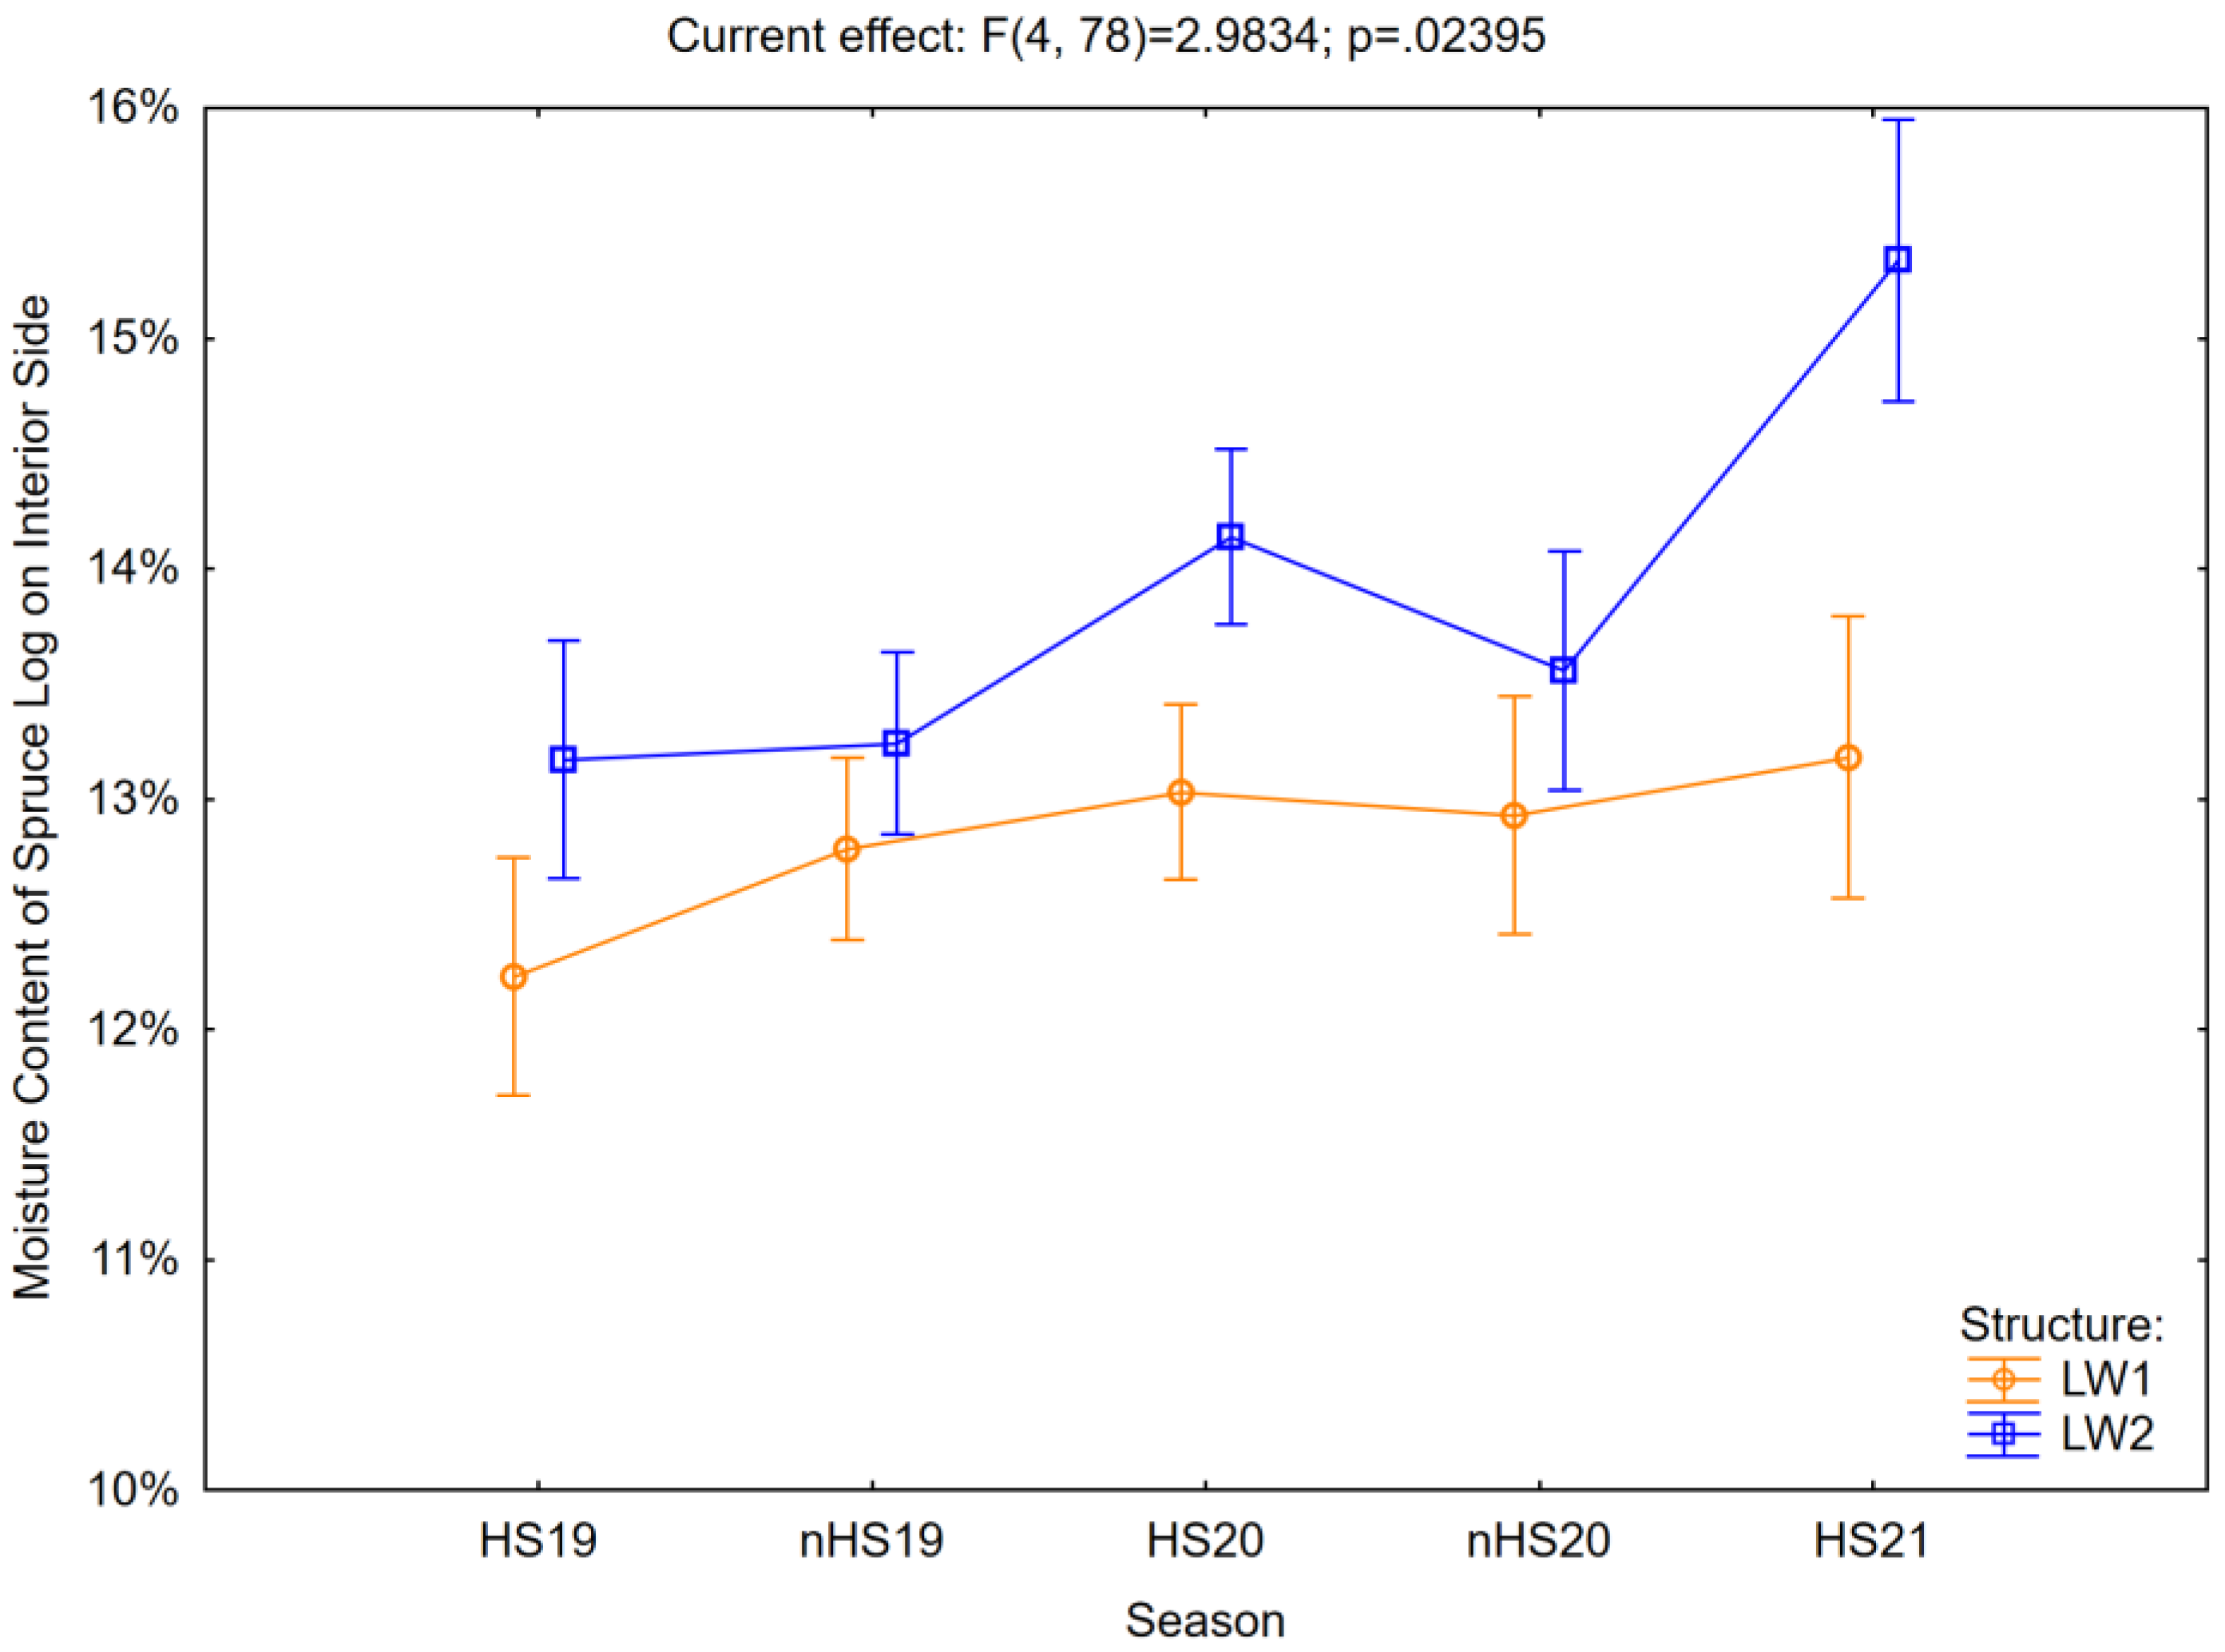
Results of Tukey HSD show significant difference of:
- LW2 in HS20 from LW1 in HS19, nHS19, HS20, nHS20, as well as LW2 nHS19 and HS21;
- LW2 in nHS20 from LW1 in HS19;
- LW2 in HS21 from every other structure and season.
Student’s t-test for independent groups, testing equality in means during individual season, was further used, results shown in Table 14.
Results of the t-test confirmed null hypothesis in heating season 2019, the means in the two groups LW1 and LW2 have no significant difference, while rejecting null hypothesis for the rest of the observation period.
These results indicate significance of difference and impact of water vapor retarder on moisture content of log structure from the point of view of airtightness. Vapor retarder in LW1 was preventing water vapor from entering the assembly during heating seasons from interior to exterior, resulting in lower moisture content during this season, and during non-heating season, it was preventing vapor transport from exterior to interior, accumulating vapor and increasing moisture content of insulation and log structure on interior side.
3.5. Risk of Water Vapor Condensation
Moreover, to analyze condensation in structure, measured moisture content of log structure on the interior side was compared to dew point temperature on the interior side of log structure. Results are shown in Figure 12.
Dew point analysis was done by subtracting computed dew point temperature from measured air temperature on the interior side of log structure, as shown in equation (1).
The condensation of water vapor in the structure would occur when the dew point analysis would reach value zero. This would increase the moisture content of log structure.
As shown in Figure 12., condensation hasn’t occurred during monitored period, which is supported by moisture content of log structure LW1 and LW2 staying below 18%. Structure is therefore safe for use from the biodegradation point of view.
4. Discussion
Summary of findings are:
- The effect of vapor retarder was proved to be significant by t-test during heating seasons on moisture content of sheep wool insulation in service cavity, however, no significance was proved during non-heating season.
- Explanation is high diffusion resistance of vapor retarder, causing accumulation of water vapors in layer before the retarder, which is sheep wool insulation in service cavity during heating season, when heat flows from interior to exterior due to heat gradient
- The effect of vapor retarder was proven to be significant during heating seasons 2020 and 2021 on moisture content of sheep wool insulation between studs, no significance was proved other seasons.
- The effect of vapor retarder on moisture content of interior side log structure wasn’t proven to be significant during heating seasons 2019 only, significance was then proven for all other seasons.
- Explanation in greater airtightness in assembly with vapor retarder, preventing vapor transfer from interior in heating seasons and accumulating vapor in structure during non-heating seasons, while the structure without vapor retarder is more diffusive for water vapor, increasing moisture content during heating seasons and drying insulation and log structure during non-heating seasons
- Water vapor condensation was verified, and no condensation was confirmed in both structures
This research was done in parallel with research on the impact of vapor barrier on moisture content in wood fiber insulation, published by authors [18]. During the same observation period of over 2 years, the experimental study on a multi-layer log structure with wood-fiber insulation boards and mats, moisture probes and gravimetric samples were taken from structures with and without a vapor barrier. Measured insulation moisture contents remained low and converged after initial bedding. Seasonal moisture fluctuations were mild, and no mold was observed.
Latif [19] investigated wood-hemp insulation in timber frame panels with and without vapor barrier in-situ for 16 days, comparing heat transfer properties, the likelihood of water vapor condensation in the panels and resulting mold growth. Results supported insignificant difference in average equivalent thermal transmittance value of both timber frame panels, as well as no mold growth was visually detected after disassembly of the panels. Comparison in hygrothermal properties was also done between hemp insulation and stone wool [20], making step changes in internal relative air humidity to explore effect of normal and high relative air humidity on moisture content on wall panels. No significant difference between thermal conductivity of the two samples was observed, however, frequency and likelihood of the water vapor condensation was higher in the interface of stone wool insulation and the oriented strand board.
Rahim [21] researched in-situ hygrothermal performance of timber frame assembly with wood fibre insulation, oriented to the south, in a research cottage. Measured were interior and exterior air temperature and relative humidity, as well as air temperature and humidity in the assembly. Measurements lasted from January to August 2018. Although findings suggest high relative air humidity between cladding and oriented strand board may result in water vapor condensation, wood fibre insulation wasn’t affected by this high humidity and risk of condensation wasn’t confirmed.
Fischer [22] investigated for 18 months hygrothermal performance of chopped straw, sheep’s wool, cellulose and mineral wool insulated timber frame external wall assemblies, with defects like air leakage and high indoor relative humidity. Relative air humidity in the insulations was compared, then the measured and calculated U-value of the assemblies was compared. Their findings support that sheep wool and cellulose insulations tolerated faults, like air leaks and increased water vapor flux without excessive moisture rise or mold growth, with moisture content remaining below critical levels.
Korjenic [23] investigated various renewable materials such as straw, sheep’s wool, cellulose, hemp and tested thermal conductivity of these insulations. Results show excellent thermal conductivity as well as hygrothermal properties, maintaining low moisture content during use in structure, therefore suitable for multi-story construction.
Georgescu [24] studied experimental 175 mm timber-frame walls insulated with various bio-based materials, like sheep wool, wood fiber, recycled paper, reed, and wool. Thermal tests were performed in the laboratory and short-term in-situ measurements during winters. Water vapor flow was calculated by partial water vapor pressure and saturation pressure, showing no risk of water vapor condensation in the walls.
Hietikko [25] investigated 5 wall assemblies with wood shavings thermal insulation with and without clay coating and 3 reference wall assemblies with mineral wool. Results indicate favorable conditions for mold grown were never met, even in harsh conditions of the experiment.
Borodinecs [26] investigated hygrothermal performance of wood-frame walls under varying moisture loads in experimental climate chamber testing with simulations, comparing bio-based and conventional insulation materials to assess moisture risk mitigation, energy efficiency and mold growth resistance. Results show wood fiber insulation to be more suitable for climatic conditions of the experiment, not reaching critical relative air humidity during observed period, advocating for diffusion open structures with this bio-based insulation.
Moujalled [27] analyzed the hygrothermal behavior of a hemp-lime concrete house for 4 years. Measured data were compared with simulations. Hemp-lime concrete shows excellent temperature dampening abilities close to 12 hours, as well as excellent moisture buffering.
Tlaiji [28] assessed the hygrothermal performance of five different multi-layered straw-based wall assemblies with different boundary conditions under a continental, tropical, temperate, Mediterranean climate and a cold desert climate. Numerical models were validated through experimental results from the literature. The total water content, the drying rate, the condensation risk, the mold growth, the moisture quantity, the time lag, and the decrement factor were evaluated. Results show that straw walls with cement and wood covering can be used in tropical and temperate climates, coated straw walls with additional air layers in dry climates, while insulated straw walls are best fitted in continental climates, where low water vapor condensation risk occurred.
Geving [29] measured relative air humidity in 15 test cells of timber frame assembly with different vapor barriers, bat and loose fill wood fiber insulation and glass wool in between two climatic chambers, simulating interior and exterior climatic conditions of a Nordic climate. All the tested constructions stayed below the relative humidity of 85%, even for a winter period with very high indoor air humidity and vapor retarder with low diffusion coefficient used.
Given the findings of the forementioned authors, timber structures with bio-based insulations can be considered safe upon correct design, mainly vapor barriers / retarders and thickness of insulations.
5. Conclusions
The aim of the research was to firstly verify the vapor retarder impact on moisture content of sheep wool insulation in service cavity and between studs, as well as moisture content of wood on the interior side of log structure, secondly to verify risk of biodegradation in critical place – border of sheep wool insulation between studs and the interior side of log structure.
Results show that vapor retarder has got a statistically significant impact on moisture content of sheep wool insulation in service cavity during heating season, effectively preventing water vapor from entering further into the assembly, increasing moisture content of this insulation. Furthermore, statistically significant impact on moisture content of sheep wool insulation between studs was proven during second and third heating seasons.
Dew point analysis was also done to verify risk of water vapor condensation and propagation of biodegradation agents. Results show that no water vapor condensation occurred and moisture content of log structure on the interior side never reached more than 16%. Thus, no biodegrading agents would affect the log structure.
The observation and measurement period in this research was done for 27 months. To better describe the behavior hygric properties of structures and insulations in them, longer measurement period is recommended. This way, processes of humidification and drying out of the wood-based structures and bio-based insulations can be better described and presence of biodegrading agents can be thoroughly investigated.
Author Contributions
Conceptualization, D.B.; methodology, S.J.; software, P.S.; validation, R.U.; formal analysis, M.P.; investigation, R.U.; resources, K.S.; data curation, R.U.; writing—original draft preparation, S.J.; writing—review and editing, R.U.; visualization, R.U.; supervision, V.B. All authors have read and agreed to the published version of the manuscript.
Funding
This research was funded by the Slovak Research and Development Agency, grant number APVV-17-0206 „Ultra-low Energy Green Building Based on Renewable Wood Material”, Department of Timber Structures, Faculty ofWood Sciences and Technology, Technical University in Zvolen, Slovakia.
Data Availability Statement
Raw data available for view at this link: Uhrin_Impact.xlsx.
Conflicts of Interest
The authors declare no conflicts of interest.
References
- Ruuska, A. Life-cycle environmental impacts of a standard house and three log house cases: A comparison of a typical Finnish house and three ecological log house designs with alternative external wall thicknesses; VTT Technical Research Centre of Finland: Espoo, 2013; p. 61. ISBN 978-951-38-8085-9. [Google Scholar]
- Lehtonen, J.; Ilgın, H.E.; Karjalainen, M. Log Construction Practices and Future Outlook: Perspectives of Finnish Experts. Forests 2022, 13, 1741. [Google Scholar] [CrossRef]
- Ranefjärd, O.; Strandberg-de Bruijn, P.B.; Wadsö, L. Hygrothermal Properties and Performance of Bio-Based Insulation Materials Locally Sourced in Sweden. Materials 2024, 17, 2021. [Google Scholar] [CrossRef] [PubMed]
- Simões, N.; Fino, R.; Tadeu, A. Uncoated medium density expanded cork boards for building façades and roofs: mechanical, hygrothermal and durability characterization. Constr. Build. Mater. 2019, 200, 447–464. [Google Scholar] [CrossRef]
- Nunes, L. Nonwood bio-based materials. Performance of Bio-Based Building Materials 2017, 97–186. [Google Scholar] [CrossRef]
- Koh, C.H.; Gauvin, F.; Schollbach, K.; Brouwers, H.J.H. Investigation of material characteristics and hygrothermal performances of different bio-based insulation composites. Construction and Building Materials 2022, 346, 128440. [Google Scholar] [CrossRef]
- Mawardi, I.; Aprilia, S.; Faisal, M.; Rizal, S. Investigation of thermal conductivity and physical properties of oil palm trunks/ramie fiber reinforced biopolymer hybrid composites as building bio-insulation. Materials Today: Proceedings 2022, 60, 373–377. [Google Scholar] [CrossRef]
- Badouard, C.; Maalouf, C.; Bliard, C.; Polidori, G.; Bogard, F. Hygric Behavior of Viticulture By-Product Composites for Building Insulation. Materials 2022, 15, 815. [Google Scholar] [CrossRef]
- Fedorik, F.; Zach, J.; Lehto, M.; Kymäläinen, H.R.; Kuisma, R.; Jallinoja, M.; Illikainen, K.; Alitalo, S. Hygrothermal properties of advanced bio-based insulation materials. Energy and Buildings 2021, 253, 111528. [Google Scholar] [CrossRef]
- Mesa, A.; Arenghi, A. Hygrothermal behaviour of straw bale walls: experimental tests and numerical analyses. Sustainable Building 2019, 4, 3. [Google Scholar] [CrossRef]
- Hegyi, A.; Bulacu, C.; Szilagyi, H.; Lăzărescu, A.-V.; Meiţă, V.; Vizureanu, P.; Sandu, M. Improving Indoor Air Quality by Using Sheep Wool Thermal Insulation. Materials 2021, 14, 2443. [Google Scholar] [CrossRef]
- Vėjelis, S.; Skulskis, V.; Kremensas, A.; Vaitkus, S.; Kairytė, A. Performance of Thermal Insulation Material Produced from Lithuanian Sheep Wool. Journal of Natural Fibers 2023, 20. [Google Scholar] [CrossRef]
- Zach, J.; Korjenic, A.; Petránek, V.; Hroudová, J.; Bednar, T. Performance evaluation and research of alternative thermal insulations based on sheep wool. Energy and Buildings 2012, 49, 246–253. [Google Scholar] [CrossRef]
- STN EN 6946 (73 0559); Building components and building elements - Thermal resistance and thermal transmittance - Calculation methods. Bratislava: Slovak Office of Standards, Metrology and Testing, 2019, 44 Pages.
- STN 73 0540-2+Z1+Z2; Thermal protection of buildings. Thermal performance of buildings and components. Part 2: Functional requirements. Bratislava: Slovak Office of Standards, Metrology and Testing, 2019, 35 Pages.
- STN EN 322 (49 0143); Wood-based panels. Determination of moisture content. Bratislava: Slovak Office of Standards, Metrology and Testing, 1995, 8 Pages.
- Kottek, M.; Grieser, J.; Beck, C.; Rudolf, B.; Rubel, F. World Map of the Köppen-Geiger climate classification updated. Meteorologische Zeitschrift 2006, 15, 259–263. [Google Scholar] [CrossRef]
- Jochim, S.; Uhrín, R.; Schmidtová, J.; Sedlák, P.; Búryová, D.; Střelcová, K. Impact of Vapor Barrier on Moisture Content of Fiberboard Insulation in Log Structure. Polymers 2021, 13, 4282. [Google Scholar] [CrossRef] [PubMed]
- Latif, E.; Ciupala, M.A.; Tucker, S.; Wijeyesekera, D.C.; Newport, D.J. Hygrothermal performance of wood-hemp insulation in timber frame wall panels with and without a vapour barrier. Building and Environment 2015, 92, 122–134. [Google Scholar] [CrossRef]
- Latif, E.; Ciupala, M.A.; Wijeyesekera, D.C. The comparative in situ hygrothermal performance of Hemp and Stone Wool insulations in vapour open timber frame wall panels. Construction and Building Materials 2014, 73, 205–213. [Google Scholar] [CrossRef]
- Rahim, M.; Djedjig, R.; Wu, D.; Bennacer, R.; Ganaoui, M.E. Experimental investigation of hygrothermal behavior of wooden-frame house under real climate conditions. Energy and Built Environment 2023, 4, 122–129. [Google Scholar] [CrossRef]
- Fischer, H.; Korjenic, A. Hygrothermal Performance of Bio-Based Exterior Wall Constructions and Their Resilience under Air Leakage and Moisture Load. Buildings 2023, 13, 2650. [Google Scholar] [CrossRef]
- Korjenic, A.; Teichmann, F. Building with Renewable Materials. Automatisierungstechnik 2024, 72, 679–686. [Google Scholar] [CrossRef]
- Georgescu, S.-V.; Șova, D.; Campean, M.; Coșereanu, C. A Sustainable Approach to Build Insulated External Timber Frame Walls for Passive Houses Using Natural and Waste Materials. Forests 2022, 13, 522. [Google Scholar] [CrossRef]
- Hietikko, J.; Tuominen, E.; Valovirta, I.; Vinha, J. Timber-framed exterior walls insulated with wood shavings: A field study in a nordic climate. Building and Environment 2024, 254, 111371. [Google Scholar] [CrossRef]
- Borodinecs, A.; Jacnevs, V.; Ákos, L.; Gendelis, S. Hygrothermal performance of well-insulated wood-frame walls in Baltic climatic condition. Case Studies in Thermal Engineering 2025, 66, 105772. [Google Scholar] [CrossRef]
- Moujalled, B.; Ouméziane, Y.A.; Moissette, S.; Bart, M.; Lanos, C.; Samri, D. Experimental and numerical evaluation of the hygrothermal performance of a hemp lime concrete building: A long term case study. Building and Environment 2018, 136, 11–27. [Google Scholar] [CrossRef]
- Tlaiji, G.; Pennec, F.; Ouldboukhitine, S.; Ibrahim, M.; Biwole, P. Hygrothermal performance of multilayer straw walls in different climates. Construction and Building Materials 2022, 326, 126873. [Google Scholar] [CrossRef]
- Geving, S.; Lunde, E.; Holme, J. Laboratory Investigations of Moisture Conditions in Wood Frame Walls with Wood Fiber Insulation. Energy Procedia 2015, 78, 1455–1460. [Google Scholar] [CrossRef]
Figure 4.
Exterior air temperature and relative air humidity during monitored period.
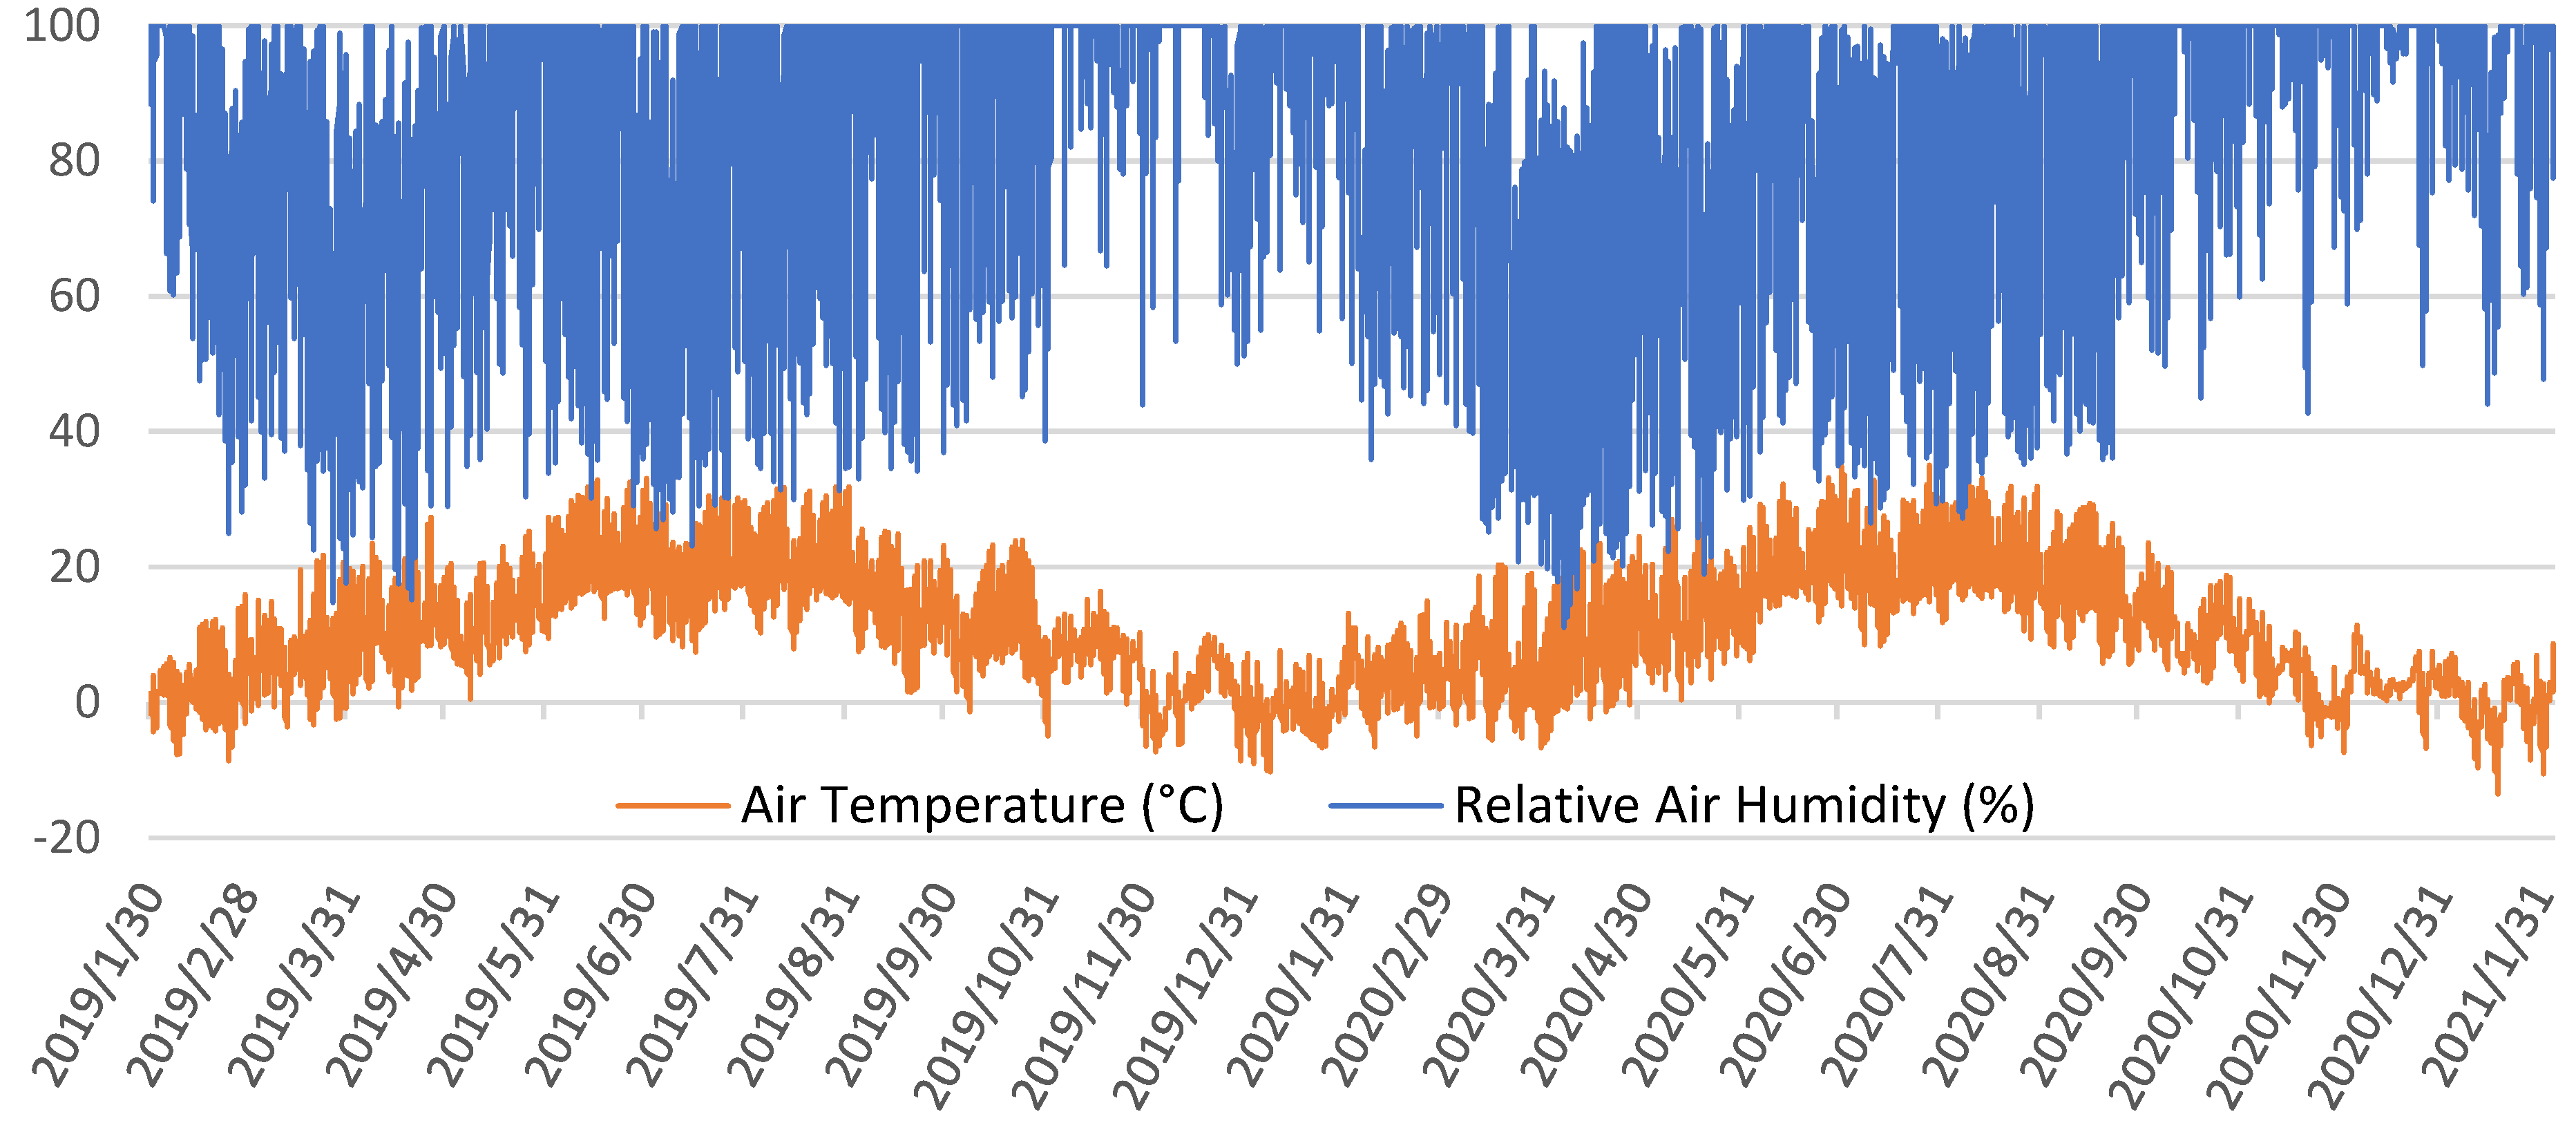
Figure 5.
Interior air temperature and relative air humidity during monitored period.
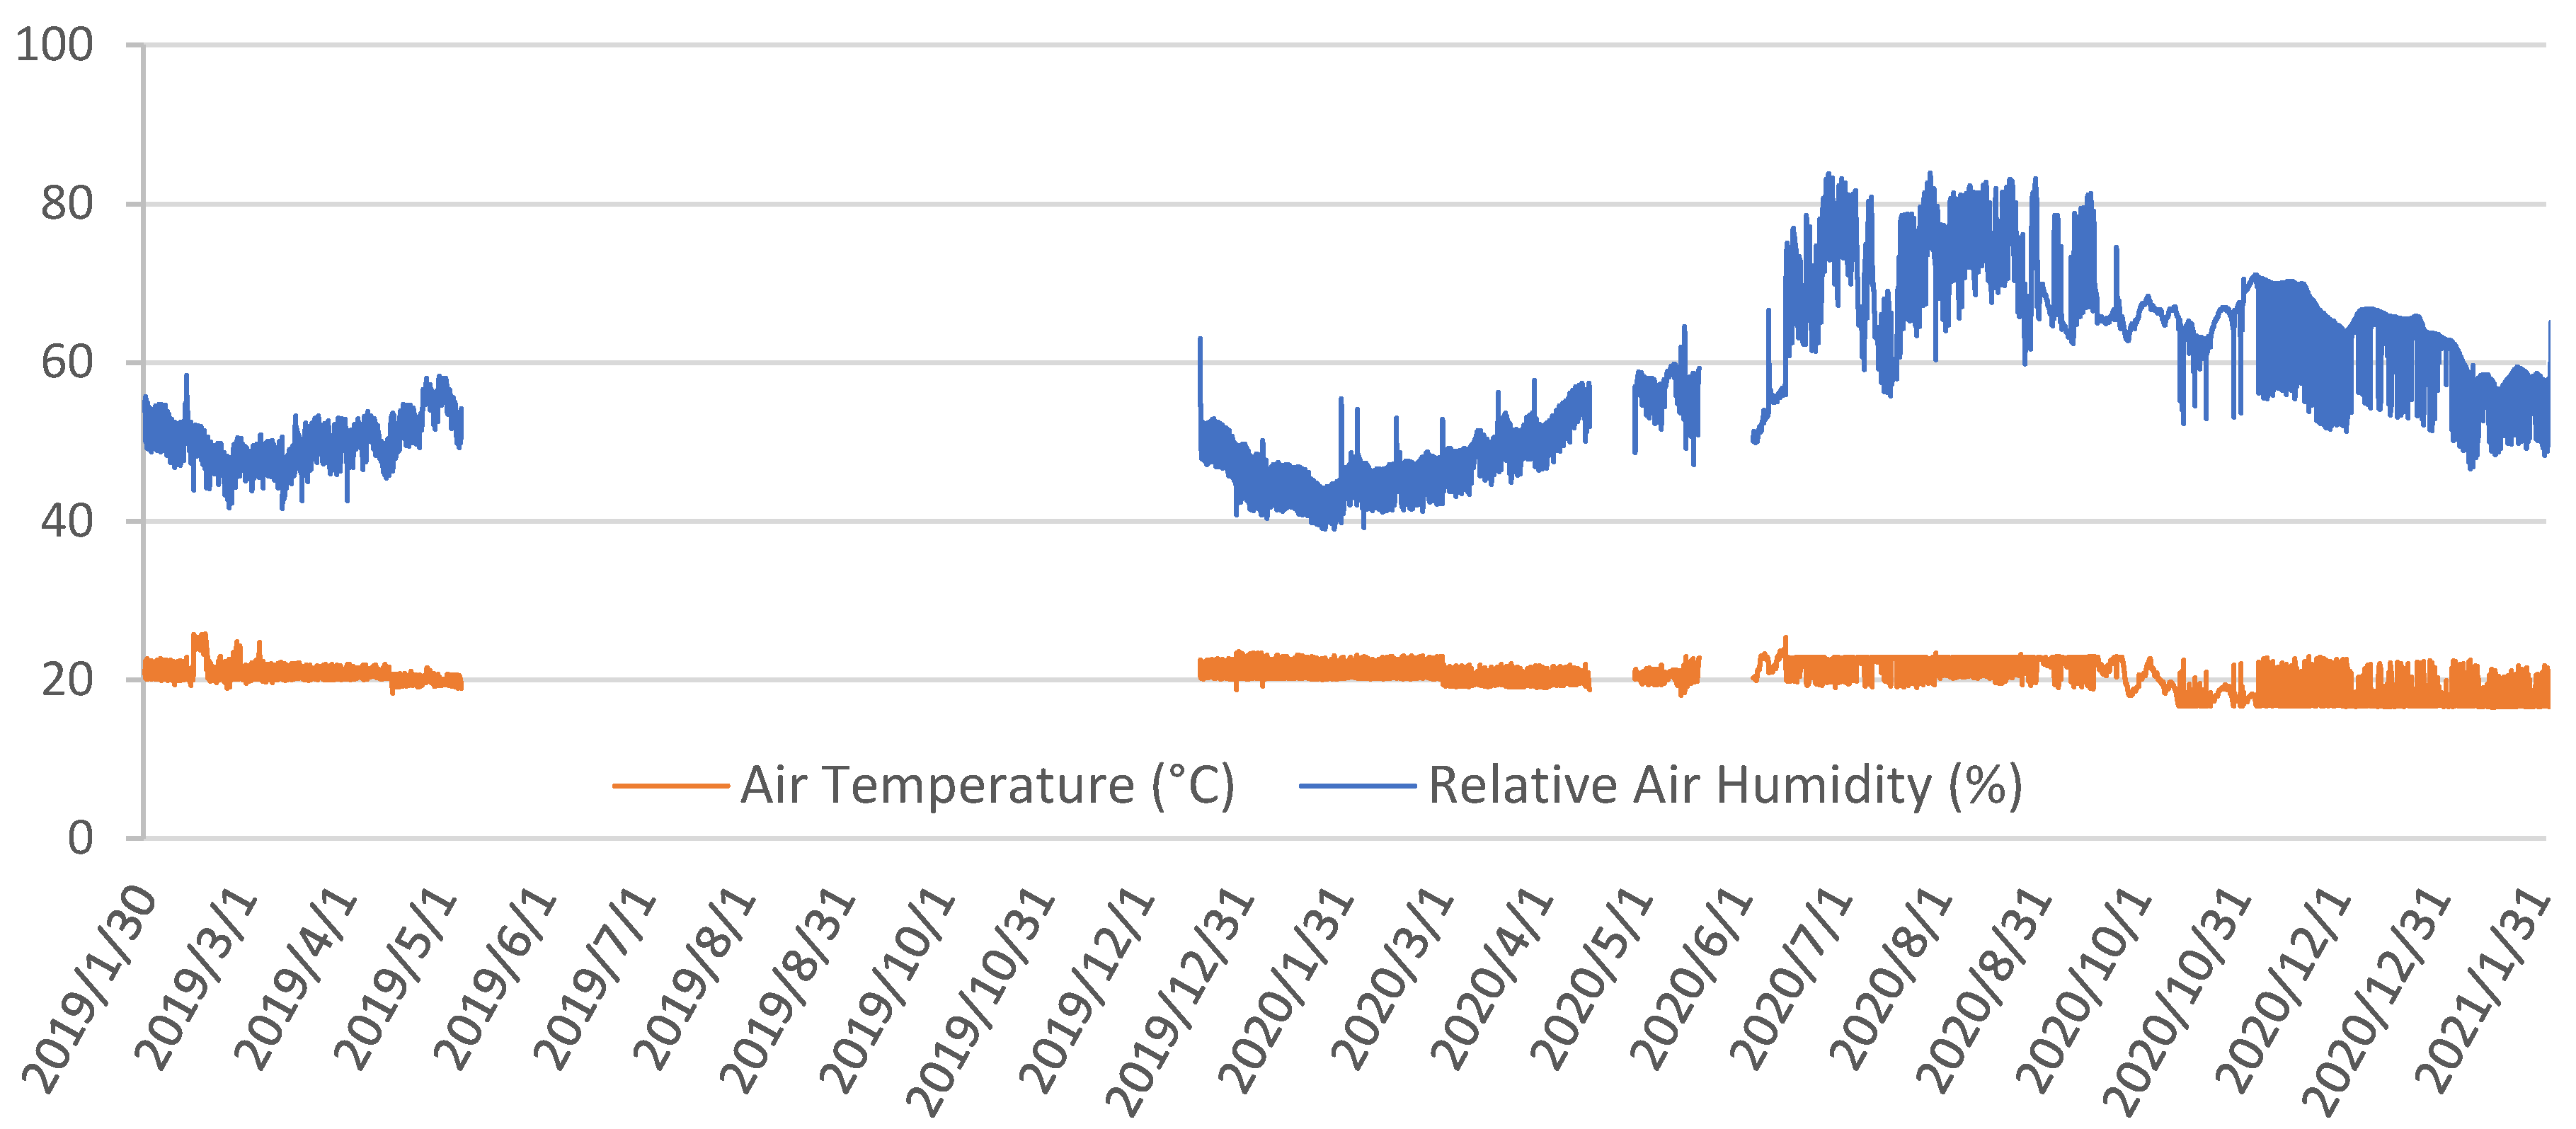
Figure 6.
Moisture content of sheep wool insulation in service cavity.
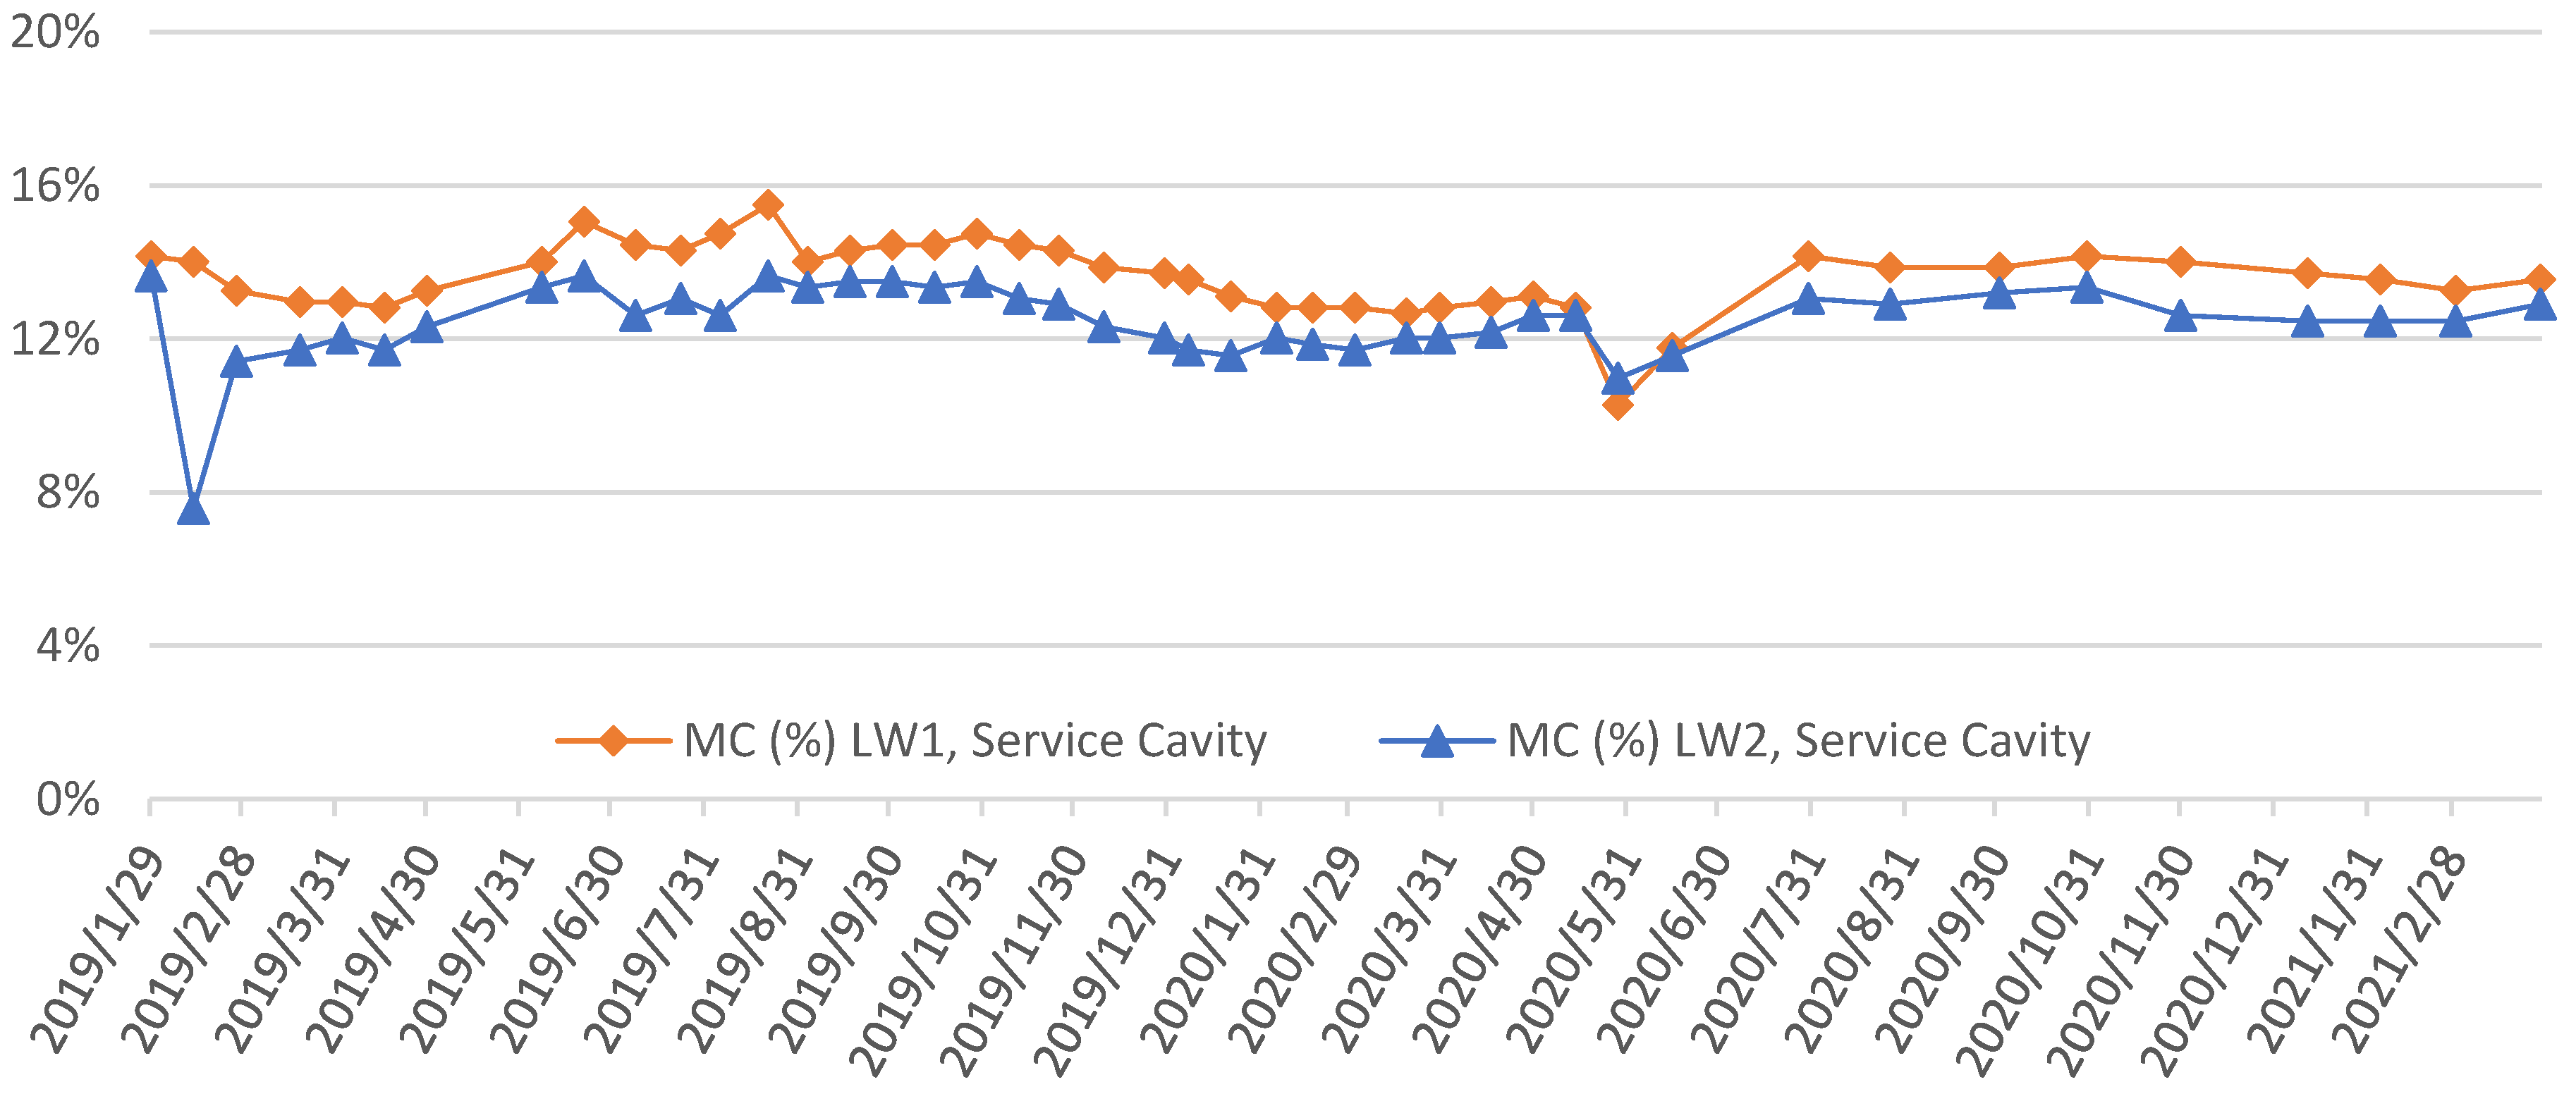
Figure 12.
Moisture content of log on interior side and dew point analysis.
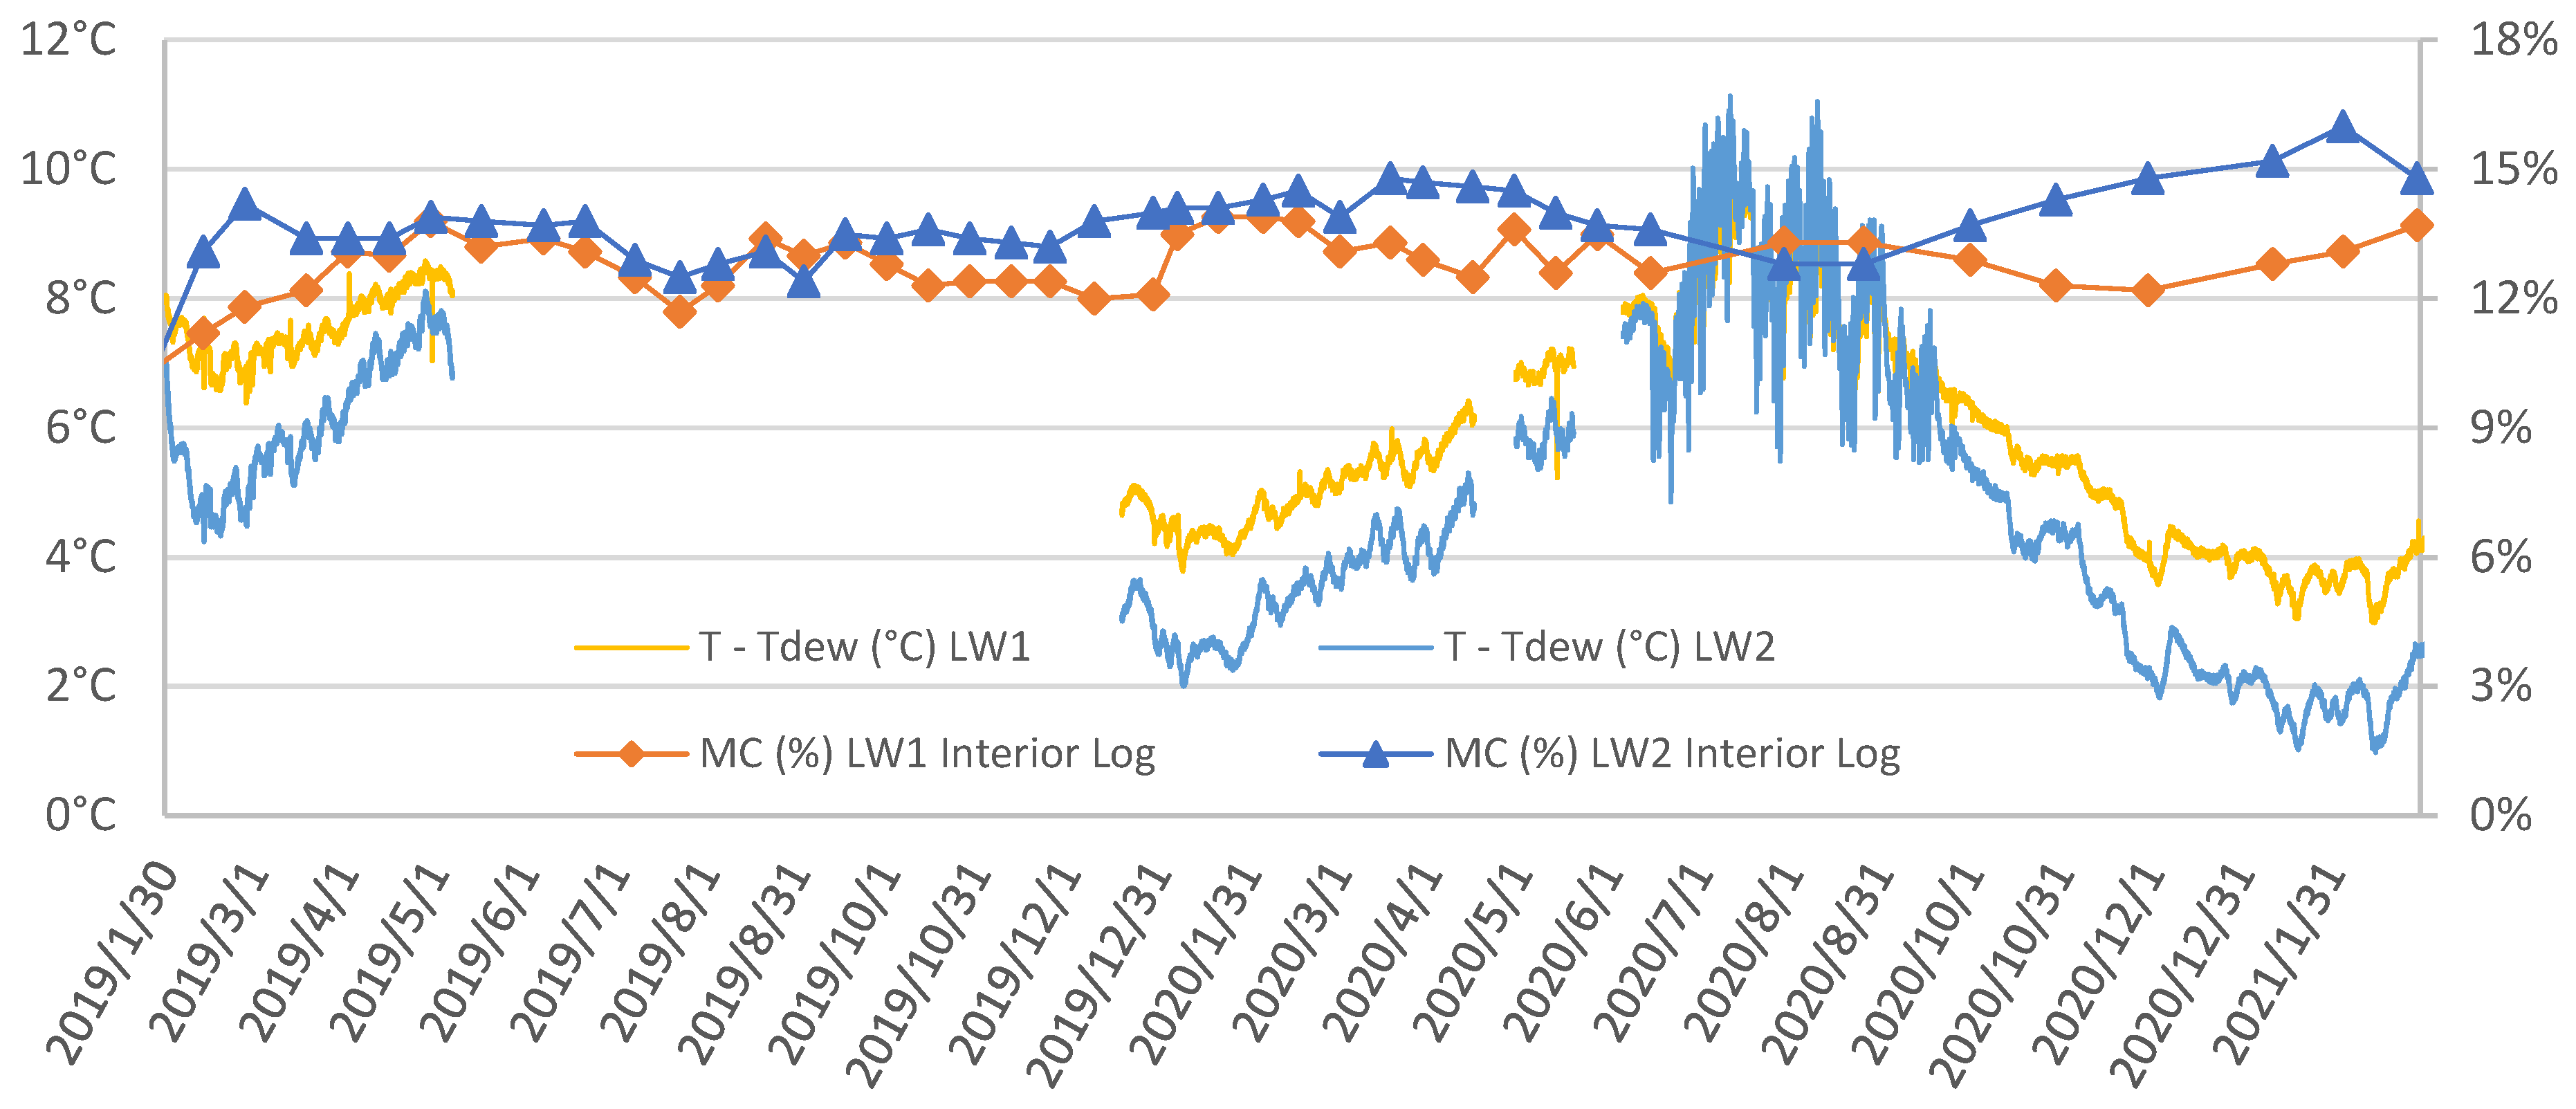

Table 1.
Properties of used materials.
| Material Properties | Spruce Log1 | Sheep wool2 | Vapor retarder2 |
Diff. wrap2 |
|---|---|---|---|---|
| Density ρ [kg/m3] | 400 | 18 | 900 | 250 |
| Thermal Conductivity Coefficient λe [W/m.K] | 0.18 | 0.042 | 0.35 | 0.35 |
| Thermal Conductivity Coefficient λi [W/m.K] | 0.15 | 0.039 | 0.35 | 0.35 |
| Specific Heat Capacity C [J/kg.K] | 2510 | 1800 | 1500 | 1500 |
| Water Vapor Diffusion Resistance factor μ [-] | 157 | 1 | 32250 | 28 |
1 In accordance with STN EN 73 0540-3, 2 In accordance with product technical documentation.
Table 2.
Boundary conditions for stationary hygrothermal performance simulation.
| Results | Interior | Exterior |
|---|---|---|
| Air temperature T [°C] | 20 | -15 |
| Relative air humidity RH [%] | 50 | 84 |
| Thermal resistance at interior Rsi [m2.K/W] | 0.13 | - |
| Thermal resistance at exterior Rse [m2.K/W] | - | 0.04 |
Table 3.
Interior and exterior air temperature and relative humidity.
| Results | Interior | Exterior |
|---|---|---|
| Air temperature T [°C] | 20±3 | Variating |
| Relative air humidity RH [%] | 50±10 | Variating |
Table 4.
Results of stationary hygrothermal performance simulation.
| Results | LW1 | LW2 |
|---|---|---|
| Heat Transfer Coefficient U (W/m2.K) | 0.177 | 0.177 |
| Thermal Resistance R0 (m2.K/W) | 5.481 | 5.480 |
| Superficial Temperature θsi (°C) | 19.195 | 19.195 |
| Thermal Damping Factor v (-) | 1 742.220 | 104.248 |
| Phase Shift of Thermal Oscillation ψ (hours) | 15.345 | 15.332 |
| All-Year Amount of Condensed Water Vapor gk (kg/m2.year) | 0.093 | 0.360 |
| All-Year Amount of Evaporated Water Vapor gv (kg/m2.year) | 0.284 | 0.852 |
| Balance of Condensed and Evaporated Water Vapor gk-gv (kg/m2.year) | -0.191 | -0.492 |
Table 5.
Description statistics for moisture content of sheep wool insulation in service cavity.
| Structure | Des. Stat. | HS19 | nHS19 | HS20 | nHS20 | HS21 |
|---|---|---|---|---|---|---|
| Mean | 13.3% | 14.0% | 13.3% | 13.0% | 13.6% | |
| Std. Dev. | 0.5% | 2.0% | 0.6% | 1.5% | 0.3% | |
| LW1 | Max | 14.2% | 15.5% | 14.5% | 14.2% | 14.0% |
| Min | 12.8% | 7.9% | 12.7% | 10.3% | 13.3% | |
| Valid N | 7 | 12 | 13 | 7 | 5 | |
| Mean | 11.5% | 12.9% | 12.2% | 12.5% | 12.6% | |
| Std. Dev. | 1.9% | 1.4% | 0.5% | 0.9% | 0.2% | |
| LW2 | Max | 13.6% | 13.6% | 13.1% | 13.4% | 12.9% |
| Min | 7.6% | 8.8% | 11.6% | 11.0% | 12.5% | |
| Valid N | 7 | 12 | 13 | 7 | 5 |
Des. Stat. – description statistics; Std. Dev. – standard deviation.
Table 6.
Two-way ANOVA for moisture content of sheep wool insulation in service cavity.
| Effect | df | SS | MS | F - test | p - value | η2 |
|---|---|---|---|---|---|---|
| Structure | 0.0024 | 1 | 0.0024 | 17.110 | 0.0001 | 0.18 |
| Season | 0.0012 | 4 | 0.0003 | 2.100 | 0.0887 | 0.10 |
| Structure*Season | 0.0003 | 4 | 0.0001 | 0.611 | 0.6559 | 0.03 |
| Error | 0.0111 | 78 | 0.0001 |
df – degrees of freedom; SS – sum of squares; MS – mean square; η2 – partial eta squared.
Table 7.
Student’s t-test results for moisture contents of sheep wool insulation in service cavity.
| Season | t-value | p | t-test significance |
|---|---|---|---|
| HS19 | 2.5254 | 0.0266 | Confirmed |
| nHS19 | 1.5789 | 0.1286 | Denied |
| HS20 | 5.4911 | 0.0000 | Confirmed |
| nHS20 | 0.7043 | 0.4947 | Denied |
| HS21 | 6.9880 | 0.0001 | Confirmed |
Table 8.
Description statistics for moisture content of sheep wool insulation between studs.
| Structure | Des. Stat. | HS19 | nHS19 | HS20 | nHS20 | HS21 |
|---|---|---|---|---|---|---|
| Mean | 13.3% | 12.7% | 13.4% | 13.1% | 13.9% | |
| Std. Dev. | 0.9% | 1.7% | 0.2% | 0.3% | 0.1% | |
| LW1 | Max | 13.7% | 13.8% | 13.7% | 13.7% | 14.0% |
| Min | 11.2% | 7.7% | 12.9% | 12.9% | 13.7% | |
| Valid N | 7 | 12 | 13 | 7 | 5 | |
| Mean | 13.0% | 12.5% | 14.0% | 12.6% | 14.7% | |
| Std. Dev. | 1.2% | 1.4% | 0.5% | 1.2% | 0.7% | |
| LW2 | Max | 14.3% | 13.7% | 14.7% | 14.3% | 15.5% |
| Min | 10.9% | 8.7% | 12.9% | 11.2% | 13.7% | |
| Valid N | 7 | 12 | 13 | 7 | 5 |
Des. Stat. – description statistics; Std. Dev. – standard deviation.
Table 9.
Two-way ANOVA for moisture content of sheep wool insulation between studs.
| Effect | df | SS | MS | F - test | p - value | η2 |
|---|---|---|---|---|---|---|
| Structure | 0.0000 | 1 | 0.0000 | 0.11 | 0.7420 | 0.00 |
| Season | 0.0028 | 4 | 0.0007 | 6.86 | 0.0001 | 0.26 |
| Structure*Season | 0.0005 | 4 | 0.0001 | 1.28 | 0.2860 | 0.06 |
| Error | 0.0081 | 78 | 0.0001 |
df – degrees of freedom; SS – sum of squares; MS – mean square; η2 – partial eta squared.
Table 10.
Student’s t-test results for moisture contents of sheep wool insulation between studs.
| Season | t-value | p | t-test significance |
|---|---|---|---|
| HS19 | 0.5289 | 0.6065 | Denied |
| nHS19 | 0.3243 | 0.7487 | Denied |
| HS20 | -3.7724 | 0.0009 | Confirmed |
| nHS20 | 1.0851 | 0.2992 | Denied |
| HS21 | -2.4065 | 0.0427 | Confirmed |
Table 11.
Description statistics for moisture content of log structure on interior side.
| Structure | Des. Stat. | HS19 | nHS19 | HS20 | nHS20 | HS21 |
|---|---|---|---|---|---|---|
| Mean | 12.2% | 12.8% | 13.0% | 12.9% | 13.2% | |
| Std. Dev. | 1.2% | 0.5% | 0.7% | 0.4% | 0.7% | |
| LW1 | Max | 13.8% | 13.4% | 13.9% | 13.5% | 14.1% |
| Min | 10.5% | 11.7% | 12.0% | 12.3% | 12.2% | |
| Valid N | 7 | 12 | 13 | 7 | 5 | |
| Mean | 13.2% | 13.2% | 14.1% | 13.6% | 15.3% | |
| Std. Dev. | 1.1% | 0.5% | 0.5% | 0.6% | 0.6% | |
| LW2 | Max | 14.2% | 13.8% | 14.8% | 14.3% | 16.0% |
| Min | 10.8% | 12.4% | 13.2% | 12.8% | 14.8% | |
| Valid N | 7 | 12 | 13 | 7 | 5 |
Des. Stat. – description statistics; Std. Dev. – standard deviation.
Table 12.
Two-way ANOVA for moisture content of log structure on interior side.
| Effect | df | SS | MS | F - test | p - value | η2 |
|---|---|---|---|---|---|---|
| Structure | 0.0022 | 1 | 0.0022 | 46.01 | 0.0000 | 0.37 |
| Season | 0.0018 | 4 | 0.0005 | 9.73 | 0.0000 | 0.33 |
| Structure*Season | 0.0006 | 4 | 0.0001 | 2.98 | 0.0240 | 0.13 |
| Error | 0.0037 | 78 | 0.0000 |
df – degrees of freedom; SS – sum of squares; MS – mean square; η2 – partial eta squared.
Table 13.
Tukey HSD test for interaction Season*Structure of log structure on interior side.
| Structure | LW1 | LW2 | |||||||||
| Season | HS19 | nHS19 | HS20 | nHS20 | HS21 | HS19 | nHS19 | HS20 | nHS20 | HS21 | |
| HS19 | 0.7934 | 0.2900 | 0.6651 | 0.3611 | 0.2510 | 0.0756 | 0.0002 | 0.0178 | 0.0002 | ||
| nHS19 | 0.7934 | 0.9961 | 0.9999 | 0.9849 | 0.9722 | 0.8274 | 0.0003 | 0.3592 | 0.0002 | ||
| LW1 | HS20 | 0.2900 | 0.9961 | 0.9999 | 0.9999 | 0.9999 | 0.9989 | 0.0037 | 0.823 | 0.0002 | |
| nHS20 | 0.6651 | 0.9999 | 0.9999 | 0.9998 | 0.9997 | 0.9938 | 0.0117 | 0.7857 | 0.0002 | ||
| HS21 | 0.3611 | 0.9849 | 0.9999 | 0.9998 | 1.0000 | 1.0000 | 0.2127 | 0.9947 | 0.0003 | ||
| HS19 | 0.2510 | 0.9722 | 0.9999 | 0.9997 | 1.0000 | 1.0000 | 0.0966 | 0.9879 | 0.0002 | ||
| nHS19 | 0.0756 | 0.8274 | 0.9989 | 0.9938 | 1.0000 | 1.0000 | 0.0496 | 0.9934 | 0.0002 | ||
| LW2 | HS20 | 0.0002 | 0.0003 | 0.0037 | 0.0117 | 0.2127 | 0.0966 | 0.0496 | 0.7303 | 0.0418 | |
| nHS20 | 0.0178 | 0.3592 | 0.8273 | 0.7857 | 0.9947 | 0.9879 | 0.9934 | 0.7303 | 0.0013 | ||
| HS21 | 0.0002 | 0.0002 | 0.0002 | 0.0002 | 0.0003 | 0.0002 | 0.0002 | 0.0418 | 0.0013 |
Table 14.
Student’s t-test results for moisture contents of log structure on interior side.
| Season | t-value | p | t-test significance |
|---|---|---|---|
| HS19 | -1.5556 | 0.1458 | Denied |
| nHS19 | -2.1705 | 0.0410 | Confirmed |
| HS20 | -4.6695 | 0.0001 | Confirmed |
| nHS20 | -2.2947 | 0.0406 | Confirmed |
| HS21 | -5.1054 | 0.0009 | Confirmed |
Disclaimer/Publisher’s Note: The statements, opinions and data contained in all publications are solely those of the individual author(s) and contributor(s) and not of MDPI and/or the editor(s). MDPI and/or the editor(s) disclaim responsibility for any injury to people or property resulting from any ideas, methods, instructions or products referred to in the content. |
© 2025 by the authors. Licensee MDPI, Basel, Switzerland. This article is an open access article distributed under the terms and conditions of the Creative Commons Attribution (CC BY) license (http://creativecommons.org/licenses/by/4.0/).
Copyright: This open access article is published under a Creative Commons CC BY 4.0 license, which permit the free download, distribution, and reuse, provided that the author and preprint are cited in any reuse.


