
Submitted:
12 June 2025
Posted:
13 June 2025
You are already at the latest version
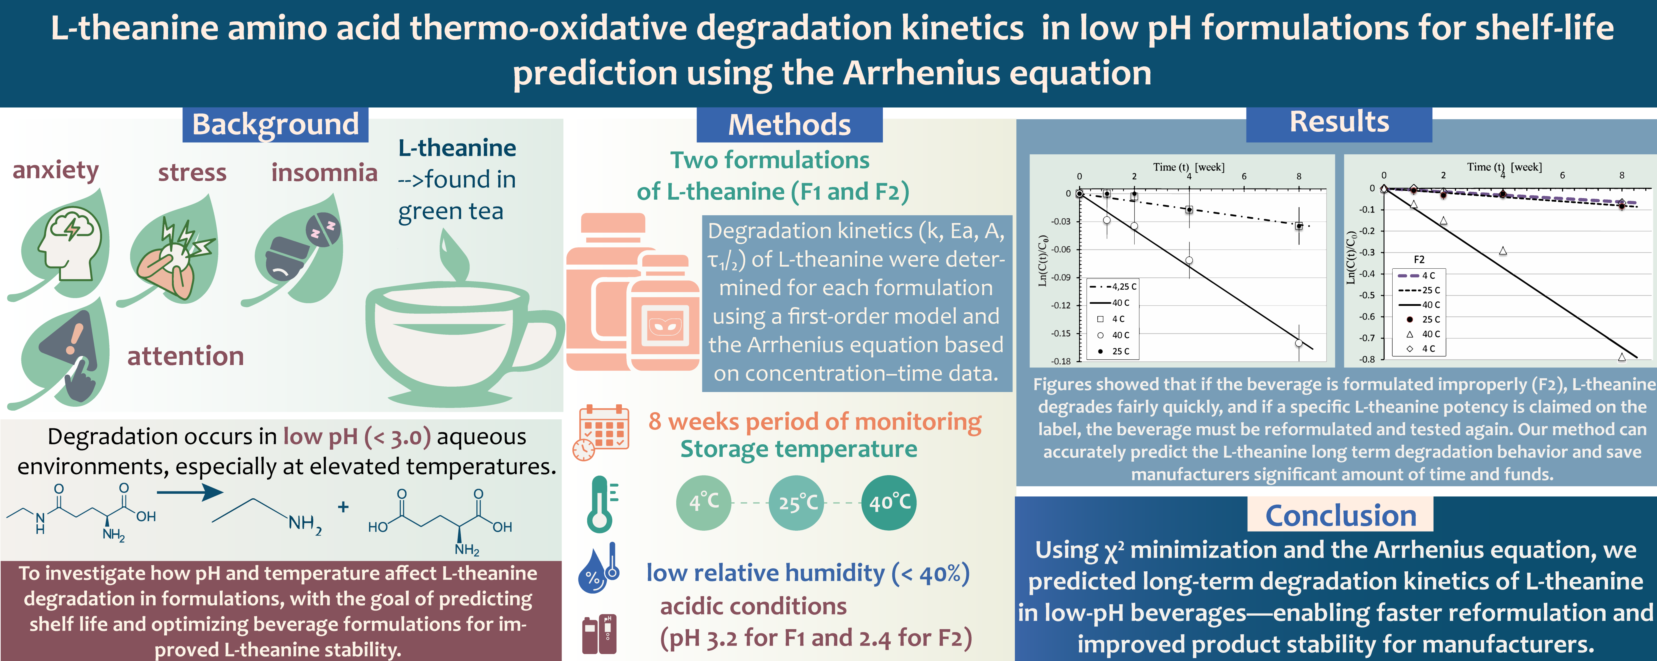
Abstract
The amino acid L-theanine is frequently used in dietary supplements and nutraceutical foods and beverages for its ability to modulate brain activity and neurotransmitter levels. The instability of this compound in acidic formulations (pH 2-3) is concerning and impactful for both product efficacy and shelf-life. This study investigates the thermo-oxidative degradation kinetics of L-theanine over 8 weeks in two formulations (F1 and F2) stored at 4, 25, and 40℃ under low relative humidity (< 40%) and acidic conditions (pH 3.2 for F1 and 2.4 for F2). The degradation rate constant (k), activation energy (E_a), molecular vibration frequency factor (A), and half-life (τ_(1/2)) for each formulation were estimated from concentration-time data using a first-order kinetic model and the Arrhenius equation. Kinetic constants were derived by χ^2minimization, taking into account the measurement errors. The activation energies for L-theanine degradation were 72.5 ± 21.9 kJ/mol for F1 and 105.3 ± 8.6 kJ/mol for F2. The findings provide a mathematical model for predicting the shelf-life of L-theanine-containing formulations under varying storage conditions relatively quickly and cost-effectively, while still in the R&D stage. These insights are valuable for the development of more stable products and can assist in the optimization of manufacturing processes to ensure product efficacy over its intended lifespan.
Keywords:
Degradation kinetics
; Arrhenius equation
; Shelf-Life
; Activation energy
; Degradation rate
; Half-Life
; Acidic beverages
; L-theanine
1. Introduction
The water-soluble amino acid L-theanine (γ-glutamyl-ethylamide) appears mainly in green tea [1]. Research demonstrates that L-theanine benefits humans through its anti-anxiety and anti-stress properties while also helping combat insomnia by altering brain activity [2,3,4,5]. Research also indicates that L-theanine administration at 200mg/day produces these effects [6,7], but improving attention requires a dosage of 100mg/day [8]. Presently L-theanine is ingested as a dietary supplement which is mostly added to drinks or nutrient beverages to address daily stress. Scientific research remains scarce regarding the thermo-oxidative degradation of L-theanine especially in acidic environment. Manufacturers of commercial beverages seldom specify L-theanine concentration because research on its stability and shelf-life in acidic (pH 2-3) aqueous drinks remains incomplete.
In the 75-day pre-market FDA notification [9], degradation of L-theanine aqueous solution was tested at room temperature (25) under various pH levels. The data showed nearly 5% degradation of L-theanine within 24 hours at pH 2, indicating that highly acidic aqueous environment (pH 2-3) increases the degradation rate. To date, this remains the only published data on L-theanine degradation at pH below 3.0. Reports showing good stability of L-theanine at pH of (3-7) were either conducted for a short period of time, or under cold storage conditions of <25 [10,11].
Understanding L-theanine degradation kinetics in formulations across a range of pH (2-3) and temperature conditions (up to 40) could provide valuable insight into predicting its shelf-life and aid beverage manufacturers in critical formulation enhancements that can prolong the L-theanine shelf life in finished products while still in the R&D stage.
L-Theanine is an amide formed from L-glutamic acid and Ethylamine, and it slowly degrades into these exact compounds under thermo-oxidative stress likely undergoing acid-catalyzed amide bond hydrolysis [12] as seen in Figure 1.
Numerous notable studies have used the Arrhenius equation to describe the thermo-oxidative degradation kinetics of pharmaceutical and nutraceutical compounds [13,14,15,16,17,18,19,20,21], but none have investigated its application to L-theanine, particularly under pH < 3 and up to 40 temperature.
Section 2 of the manuscript details the materials and methods used to test the potency of L-theanine in two beverage formulations (F1 with pH 3.2 and F2 with pH 2.4). Section 3 presents the measured concentration vs time data. Section 4 contains data processing and results. Section 5 discusses findings relevant to the dietary supplement beverage industry, followed by the conclusion in Section 6.
2. Materials and Methods
2.1. Materials
L-theanine analytical standard (purity >98%), caffeine analytical standard (1mg/ml), acetonitrile, and citric acid were purchased from Sigma-Aldrich (St. Louis, MO, USA), purified water was dispensed from an in-house Mili-Q filtration system, L-theanine for formulation was purchased from Bulk Supplements, PURTEA 95% pure natural caffeine was obtained from Applied Food Sciences (AFS).
2.2. Equipment
Agilent Infinity 1290 High Performance Liquid Chromatographer (HPLC), with Diode Array Detector and stationary phase C18 Proshell 120, (2.7 µm, 4.6 ×100 mm), Mettler-Toledo pH meter, Across International temperature controlled storage chambers set at (25 and 40), and LABRepCo Futura refrigerator set at (4), aluminum sample incubation bottles with internal Polyethylene coating as well as plastic stoppers and screwcaps were purchased from Elemental Containers.
2.3. HPLC Analytical Test Method
An HPLC method was developed and validated to simultaneously detect and quantify L-theanine and caffeine in solvents and beverages, ensuring specificity, linearity, accuracy, precision, and system suitability per ICH Q2(R1) guidelines [22].
2.3.1. Method Parameters
- Detection wavelength: 200nm
- Mobile phase: Water : Acetonitrile (gradient program - see Table 1)
- Solvent: 100% Water
- Flow rate: 0.5mL/min
- Injection volume: 1μL
- Run Time: 15 minutes
- L-Theanine RT: 2.978 minutes
- Caffeine RT: 8.831 minutes
- Column Temperature: 35°C
- Column:C18 Proshell 120, (2.7µm, 4.6 x 100mm)
3. Measurements of Concentration vs. Time
Normalized L-theanine concentrations at various time intervals are shown in Table 2.
Caffeine remained stable in all conditions, so subsequent results focus solely on L-theanine. All formulations maintained their pH values throughout the study.
4. Data Processing and Results
4.1. Degradation Kinetics
L-theanine degradation is assumed to follow first-order kinetics [16]:
where is the initial concentration (mg/ml), is the residual concentration (mg/ml) at time t (week), is the degradation rate constant (1/week) which depends on the temperature T according to the Arrhenius equation [16,17]:
where is the reaction rate constant (1/week), is the frequency factor (1/week), is the reaction activation energy (J/mol), R is the universal gas constant (8.314J∙mol-1∙K-1), T is the temperature (K).
Half-life of L-theanine is calculated from the following formula [17]:
4.2.. Determination of Kinetic Constants
Thermo-oxidative degradation kinetic constants were determined based on measuring the L-theanine concentrations using HPLC for formulations (F1 and F2), five time points (0, 1, 2, 4, and 8 weeks) and three temperatures (4, 25, 40). Kinetic constants and were found from minimization of the function (Pearson’stest) [23]
where the measured values with corresponding errors are approximated by the function , where is an unknown parameter (a kinetic constant in our case). The peculiarity of Person’s test is in the reliable estimation of the error () of the parameters in the minimum of the function [24,25].
The values of the degradation rate constants for a given are obtained from minimization for and according to equation (1) at the relative concentration measurement error of = 2%. The results for as a function of time for all three temperatures are shown in Figure 2 for formulations F1 and F2.
The values of the reaction rate constants and the corresponding half-lives for both formulations (F1, F2) are shown in Table 3.
Two-parameter minimization function for given and , which is used to evaluate the reaction kinetic constants and from the Arrhenius equation (2), turned out to be ineffective due to a small measured dataset. This lead to large cross- correlations between the parameters and and therefore large parameter errors.
To improve the accuracy of the activation energy evaluation we applied a one-parameter minimization function from expression (4) for measured and expected , where .
Coresponding errors in expression (4) were calculated using the “Propagation of Error” method [26]. Evaluation of the activation energy for the given allowed us to estimate the frequency factor and its error using the minimization expression (4). Kinetic constants , and along with their corresponding errors , are shown in Table 4.
4.3. Data Consistency Test
Evaluated vales of kinetic constants and allowed us to compare the behavior of the reaction rate constant calculated from the Eq. (1) with the analogical reaction rate constant ) found by minimization of from the Arrhenius equation. (2). The results of this comparison are presented in Figure 3.
As can be seen, there is an agreement between the reaction rate constant obtained from the concentration versus time measurement (Table 2) and Arrhenius equation (2) for both formulations.
The conventional method for evaluating the activation energy is the analytical solution of the Arrhenius equation:
where are the estimations of the reaction rate constants obtained from the concentration measurements approximated by equation (1) at temperatures and correspondingly. By default, this method assumes that the equations (1) and (2) perfectly describe the measurements. Even if this was true, the measurement errors would inevitably lead to biased estimates. In our case, the results depend on the choice of temperatures and . The minimization method we employed to estimate the kinetic constants and from equations (1) and (2) is free from these limitations and utilizes the entire experimental dataset, taking measurement errors into account. Table 5 presents the ratios of the kinetic constants and for formulation F2, obtained using the analytical method (5) at temperatures , where 1,2 and 2,3.
It can be seen that the conventional method depends on the choice of temperatures and and is in agreement with our results only for α = 2 and β = 3.
5. Discussion
Under the investigated pH and temperature conditions, the degradation of L-theanine in both formulations is consistent with the acid-catalyzed hydrolysis of its amide group [27]. Under strongly acidic conditions, the carbonyl oxygen of the amide group of L-theanine becomes protonated, increasing its electrophilicity and making it more susceptible to nucleophilic attack by water molecules, which results in cleavage of the amide bond and formation of L-glutamic acid and ethylamine [28,29]. The combination of elevated temperature, low pH and extended exposure significantly increases the rate of the hydrolytic degradation reaction as predicted by the Arrhenius equation.
Although L-theanine degraded faster in formulation F2 than F1 (see Table 3), the activation energy barrier of the reaction for F2 was larger than that of F1 considering measurement errors (see Table 4). This is explained by a large frequency factor for F2 compared to that of F1 (see Table 4).
The shelf-life of the active ingredient in the dietary supplement beverage is one of the most important specifications that must be established and followed by the manufacturers to comply with the FDA code of federal regulation (21CFR111.75(c)) [30]. It mandates that the product must contain at least 100% of the declared amount of each dietary ingredient listed on the “Supplement Facts” panel through the shelf life. Knowing the degradation rate behaviors and half-life of the L-theanine in a beverage stored at various temperatures (see Table 3), it is easy to estimate the amount of L-theanine overage needed for its concentration to still be at 100% of the label claim at the end of the shelf-life. The shelf-life prediction based on the Arrhenius model can also guide the manufacturers towards formulation adjustments necessary to improve the shelf-life of the products if faster than expected degradation is predicted. This is important since stability studies are excessively expensive, especially for smaller manufacturers.
Our method can accurately predict the L-theanine long term degradation behavior and save manufacturers significant amount of time and testing expenses.
6. Conclusions
In this study we investigated degradation of L-theanine over time in two aqueous formulations (F1 with pH = 3.2 and F2 with pH = 2.4) incubated at three temperatures (4, 25, and 40). Using the minimization method and Arrhenius equation we predicted the behavior of L-theanine degradation rate constant over time (Fig 2 and 3), as well as found the reaction activation energies and frequency factors (Table 4) taking into account the measurement errors. L-theanine degradation rate correlated with formulation acidity indicating that at pH 2.4 the oxidative degradation plaid a larger role in degradation kinetics than at pH 3.2. The conventional method for evaluating the activation energy via expression (5) led to temperature-biased estimates due to measurement errors, so we used the minimization method, which utilized the entire experimental dataset and accounted for the measurement errors to more accurately estimate the degradation kinetics. The results underscore the critical impact of pH and temperature on the stability of L-theanine, providing a robust predictive framework for shelf-life estimation. These findings offer valuable insights for the rational design and optimization of dietary supplement, nutraceutical and compounded products containing L-theanine, ensuring efficacy over the product’s intended lifespan.
Author Contributions
Conceptualization, V.T.; methodology, V.T.; software, V.T.; validation, V.T., and C.K.; formal analysis, V.T. and C.K.; investigation, V.T.; resources, J.D.; data curation, V.T. and C.K.; writing—original draft preparation, V.T.; writing—review and editing, V.T. and C.H.; visualization, V.T.; supervision, V.T. and J.D.; project administration, V.T. and J.D. All authors have read and agreed to the published version of the manuscript.
Funding
This research received no external funding.
Data Availability Statement
Dataset available on request from the authors.
Acknowledgments
The authors wish to extend their appreciation to Dr. Graham Haug for his help and support of the work in this manuscript. All presented work in this manuscript was performed internally and supported by Mile High Labs Inc.
Conflicts of Interest
The authors declare no conflicts of interest.
References
- Hidese S; Ogawa S; Ota M; Ishida I; Yasukawa Z; Ozeki M; Kunugi H. Effects of L-Theanine Administration on Stress-Related Symptoms and Cognitive Functions in Healthy Adults: A Randomized Controlled Trial. Nutrients. 2019; 3;11(10):2362. [CrossRef]
- Roderick Dashwood; Francesco Visioli, l-theanine: From tea leaf to trending supplement – does the science match the hype for brain health and relaxation? 2025; Nutrition Research Volume 134, pp. 39-48.
- Nobre AC; Rao A; Owen GN. L-theanine, a natural constituent in tea, and its effect on mental state. 2008; Asia Pac J Clin Nutr. 17 Suppl 1:167-8. [PubMed]
- Gomez-Ramirez M.; Kelly S.P.; Montesi J.L.; Foxe J.J. The effects of l-theanine on alpha-band oscillatory brain activity during a visuo-spatial attention task. 2009; Brain Topogr. 22:44–51. [CrossRef]
- Rao T.P.; Ozeki M.; Juneja L.R. In search of a safe natural sleep aid. 2015; J. Am. Coll. Nutr. 34: pp. 436–447. [CrossRef]
- Kimura K.; Ozeki M.; Juneja L.R.; Ohira H. l-theanine reduces psychological and physiological stress responses. 2007; Biol. Psychol. 74: pp. 39–45. [CrossRef]
- White D.J.; de Klerk S.; Woods W.; Gondalia S.; Noonan C.; Scholey A.B. Anti-stress, behavioral and magnetoencephalography effects of an l-theanine-based nutrient drink: A randomised, double-blind, placebo-controlled, crossover trial. 2016; Nutrients. 8:53. [CrossRef]
- Foxe J.J.; Morie K.P.; Laud P.J.; Rowson M.J.; de Bruin E.A.; Kelly S.P. Assessing the effects of caffeine and theanine on the maintenance of vigilance during a sustained attention task. 2012; Neuropharmacology. 62: pp. 2320–2327. [CrossRef]
- Flora R. 75-day pre-market notification, documentation supporting the safe use of L-theanine in dietary supplements at levels up to and including 250mg per serving, 2014. Available online: https://www.regulations.gov.
- Lekh Raj Juneja; Djong-Chi Chu; Tsutomu Okubo; Yukiko Nagato; Hidehiko Yokogoshi. L-theanine-a unique amino acid of green tea and its relaxation effects in humans. 1999; Trends in Food Science & Technology 10 pp. 199-204. [CrossRef]
- Helen Ekborg-Ott K.; Andre Taylor; Daniel W. Armstrong. Varietal Differences in the Total and Enantiomeric Composition of Theanine in Tea. 1997; Journal of Agricultural and Food Chemistry, vol. 45, no. 2, pp. 353 – 363, American Chemical Society. [CrossRef]
- Dirk Zahn. Theoretical Study of the Mechanisms of Acid-Catalyzed Amide Hydrolysis in Aqueous Solution, 2003, Phys. Chem. B 107, 44, pp. 12303–12306. [CrossRef]
- Soceanu, A.; Matei, N.; Dobrinas, S.; Popescu, V. Degradation Kinetic Modelling of Ascorbic Acid from Orange Juice. 2021; Proceedings 70, 55. [CrossRef]
- Biagini, A.; Refrigeri, N.; Caglioti, C.; Sabbatini, P.; Ticconi, S.; Ceccarelli, G.; Iannitti, R.G.; Palazzetti, F.; Fioretti, B. Accelerated Stability Testing in Food Supplements Underestimates Shelf Life Prediction of Resveratrol with Super-Arrhenius Behavior. 2024; Symmetry 16, 493. [CrossRef]
- Vanuchawan Wisuitiprot; Kornkanok Ingkaninan; Panlop Chakkavittumrong; Wudtichai Wisuitiprot; Eakkaluk Wongwad; Neti Waranuch. Thermal Degradation Kinetics and pH–Rate Profile of Verbascoside and Stability Improvement by Solid Lipid Nanoparticles. 2022; ACS Medicinal Chemistry Letters, Vol. 13/Issue 7, pp. 1191–1197. [CrossRef]
- Sernikli C.; Kadakal C. Thermal Degradation Kinetics of Ascorbic Acid and Some B-Complex Vitamins in Black Mulberry (Morus nigra) Juice. 2020; Celal Bayar University Journal of Science, Volume 16, Issue 4, pp. [CrossRef]
- Yang H; Hou L; Sun H; Ye S. Degradation kinetics of vitamins in different enteral feeding formulas during storage at different temperatures. 2024; Heliyon. 13;10(8):e29653. [CrossRef]
- Rui M.S. Cruz, Margarida C. Vieira, Cristina L.M. Silva, Effect of heat and thermosonication treatments on watercress (Nasturtium officinale) vitamin C degradation kinetics. 2008; Innovative Food Science & Emerging Technologies, Volume 9, Issue 4, pp. 483-488.
- Yan Cao; Baofu Zhao; Yougui Li; Haiyan Gao; Qile Xia; Zhongxiang Fang, Investigation of the difference in color enhancement effect on cyanidin-3-O-glucoside by phenolic acids and the interaction mechanism. 2023; Food Chemistry 411, 135409.
- Perrone D; Donangelo R; Donangelo CM; Farah A. Modeling weight loss and chlorogenic acids content in coffee during roasting. 2010; J Agric Food Chem. 8;58(23):pp. 12238-12243. [CrossRef]
- Mariano B.M. Ferraz, Adriana Farah, Beatriz T. Iamanaka, Daniel Perrone, Marina V. Copetti, Viviane X. Marques, Alfredo A. Vitali, Marta H. Taniwaki. Kinetics of ochratoxin A destruction during coffee roasting. 2010; Food Control 21 pp. 872–877.
- ICH Q2(R1), Validation of analytical procedures: text and methodology, 2005; Available online: https://database.ich.org/sites/default/files/Q2%28R1%29%20Guideline.pdf.
- Ulrich Schwickerath; Andrii Verbytskyi. 2023, CERNLIB, status, arXiv:2303.07506. Available online: https://indico.cern.ch/event/801649/attachments/1801273/2955935/cernlib.pdf.
- CERN Program Library, 1995, (D510). Available online: https://cmd.inp.nsk.su/old/cmd2/manuals/cernlib/shortwrups/crnfinal.html.
- FUMILI minimization software package, 2000. Available online: https://root.cern.ch/doc/master/classTFumili.html.
- Mike Peralta. Propagation Of Errors: How To Mathematically Predict Measurement Errors. 1st ed.; CreateSpace Independent Publishing Platform: Arizona, US, 2012.
- Brown, R. S.; Bennet, A. J.; Slebocka-Tilk, H. Recent perspectives concerning the mechanism of H3O+- and hydroxide-promoted amide hydrolysis. 1992; Accounts of Chemical Research, 25(11),pp. 481–488. [CrossRef]
- O’Connor, C. Acidic and basic amide hydrolysis. 1970; Quarterly Reviews, Chemical Society, 24(4), 553. [CrossRef]
- James Ashenhurst. Amide Hydrolysis. 2025; Master Organic Chemistry. Available online: https://www.masterorganicchemistry.com/2019/10/07/amide-hydrolysis/.
- 21 CFR § 111.75(c), Specifications for Identity, Purity, Strength, and Composition. Available online: https://www.ecfr.gov/current/title-21/chapter-I/subchapter-B/part-111#p-111.75(c)(1).
Figure 1.
L-theanine degradation into ethylamine and L-glutamic acid under thermo-oxidative stress.
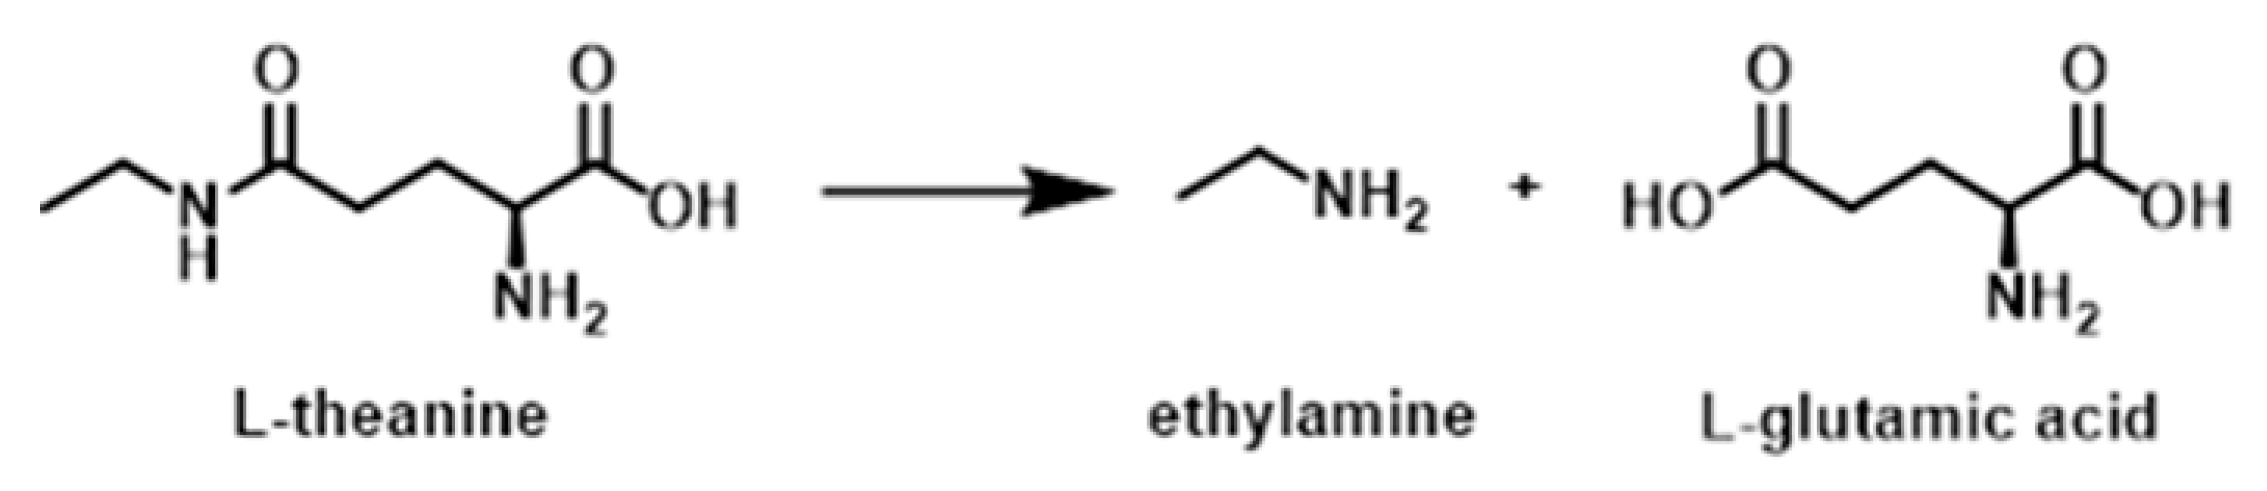
Figure 2.
Concentrations of L-theanine in formulation F1 (a) and F2 (b) versus time interval for three temperatures (= 4, 25 and 40). Symbols represent the measured data () whereas the lines represent the expected values obtained by the minimization using equation (1) for different corresponding temperatures .
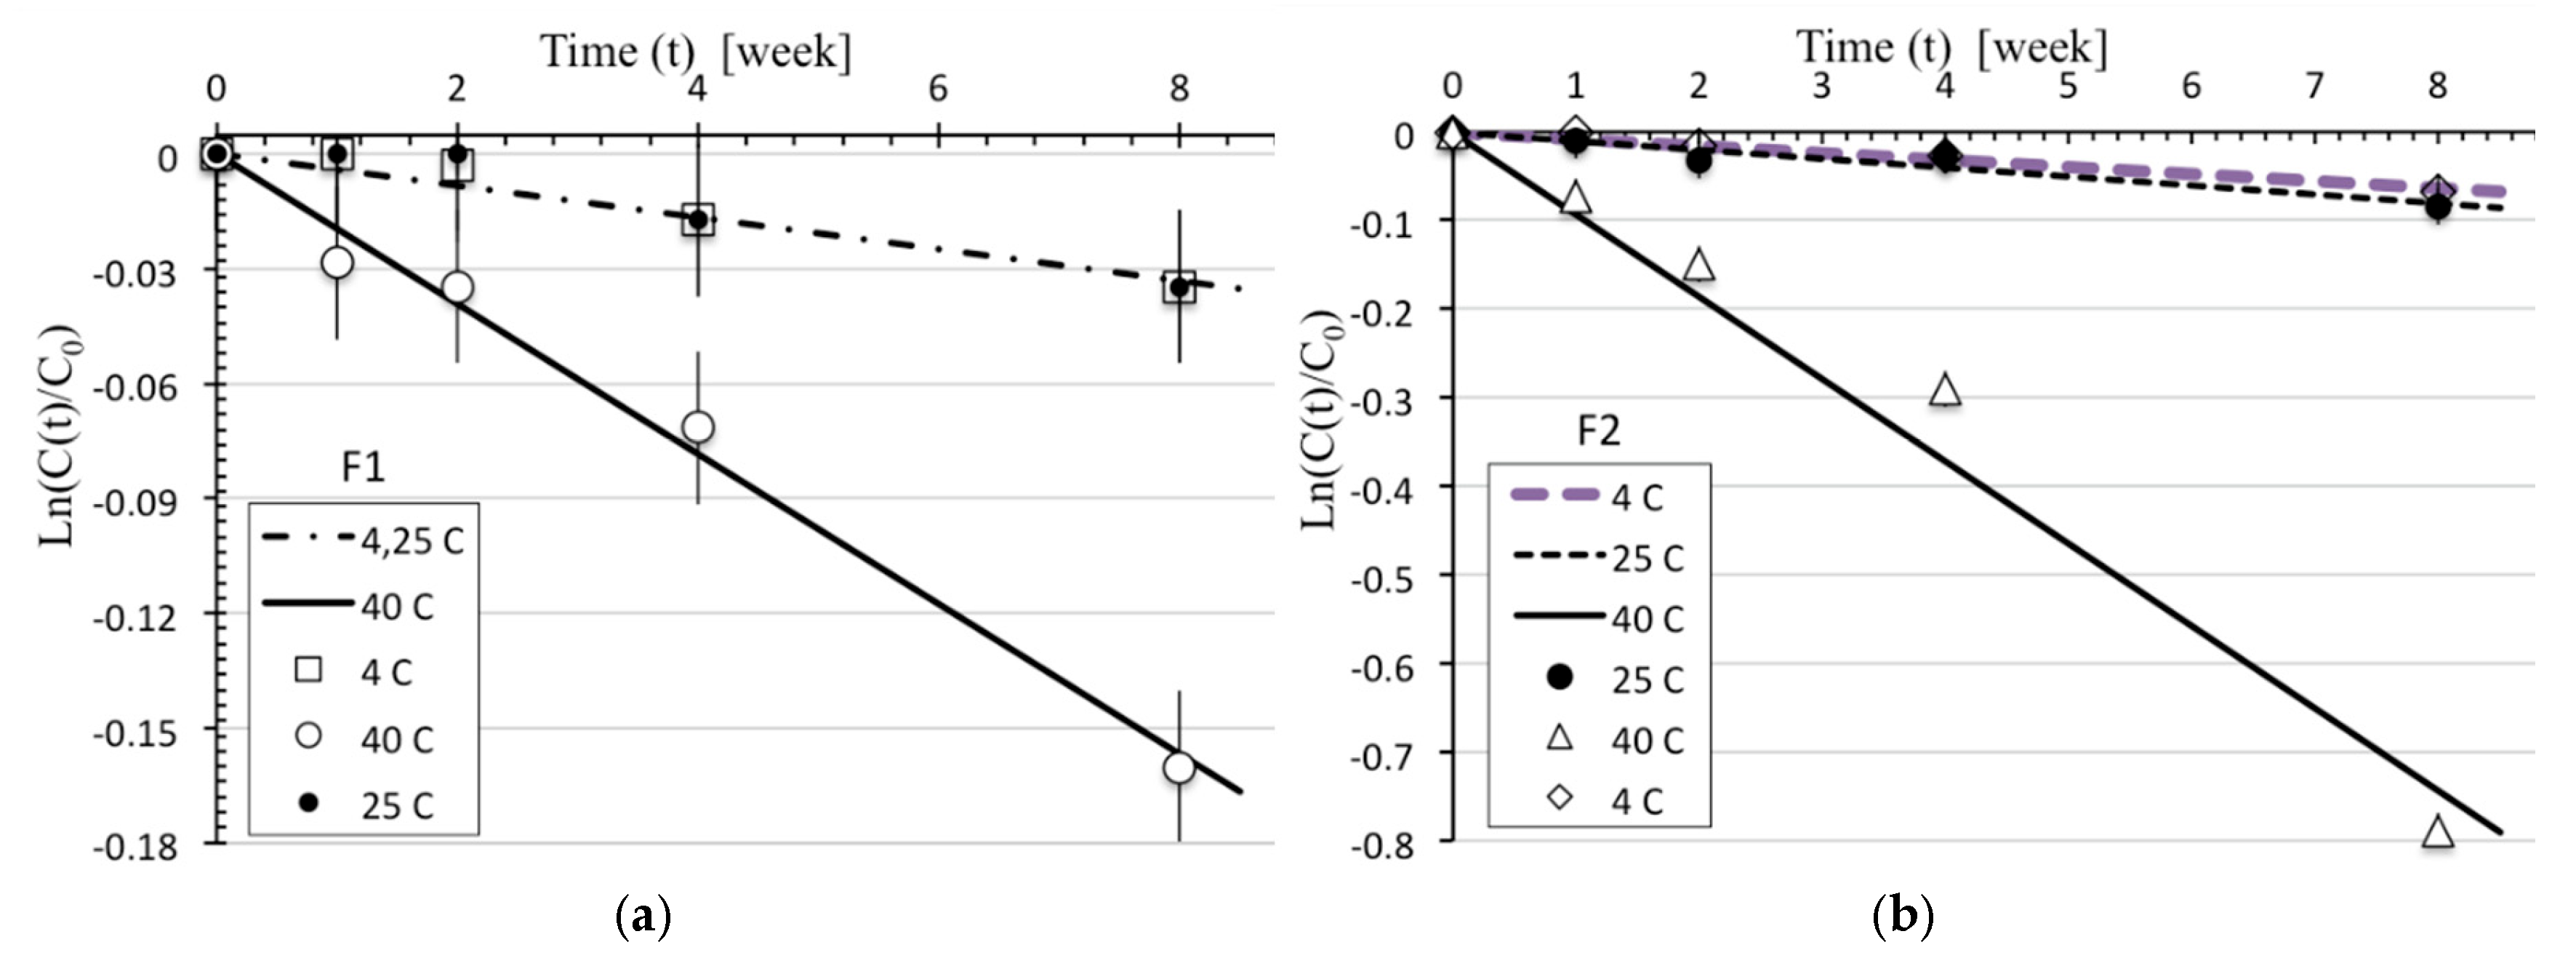
Figure 3.
L-theanine degradation reaction rate constants for two formulations F1 and F2. The symbols represent obtained from equation (1). The lines represent obtained from Arrhenius Eq. (2) for evaluated kinetic constants and .
Figure 3.
L-theanine degradation reaction rate constants for two formulations F1 and F2. The symbols represent obtained from equation (1). The lines represent obtained from Arrhenius Eq. (2) for evaluated kinetic constants and .
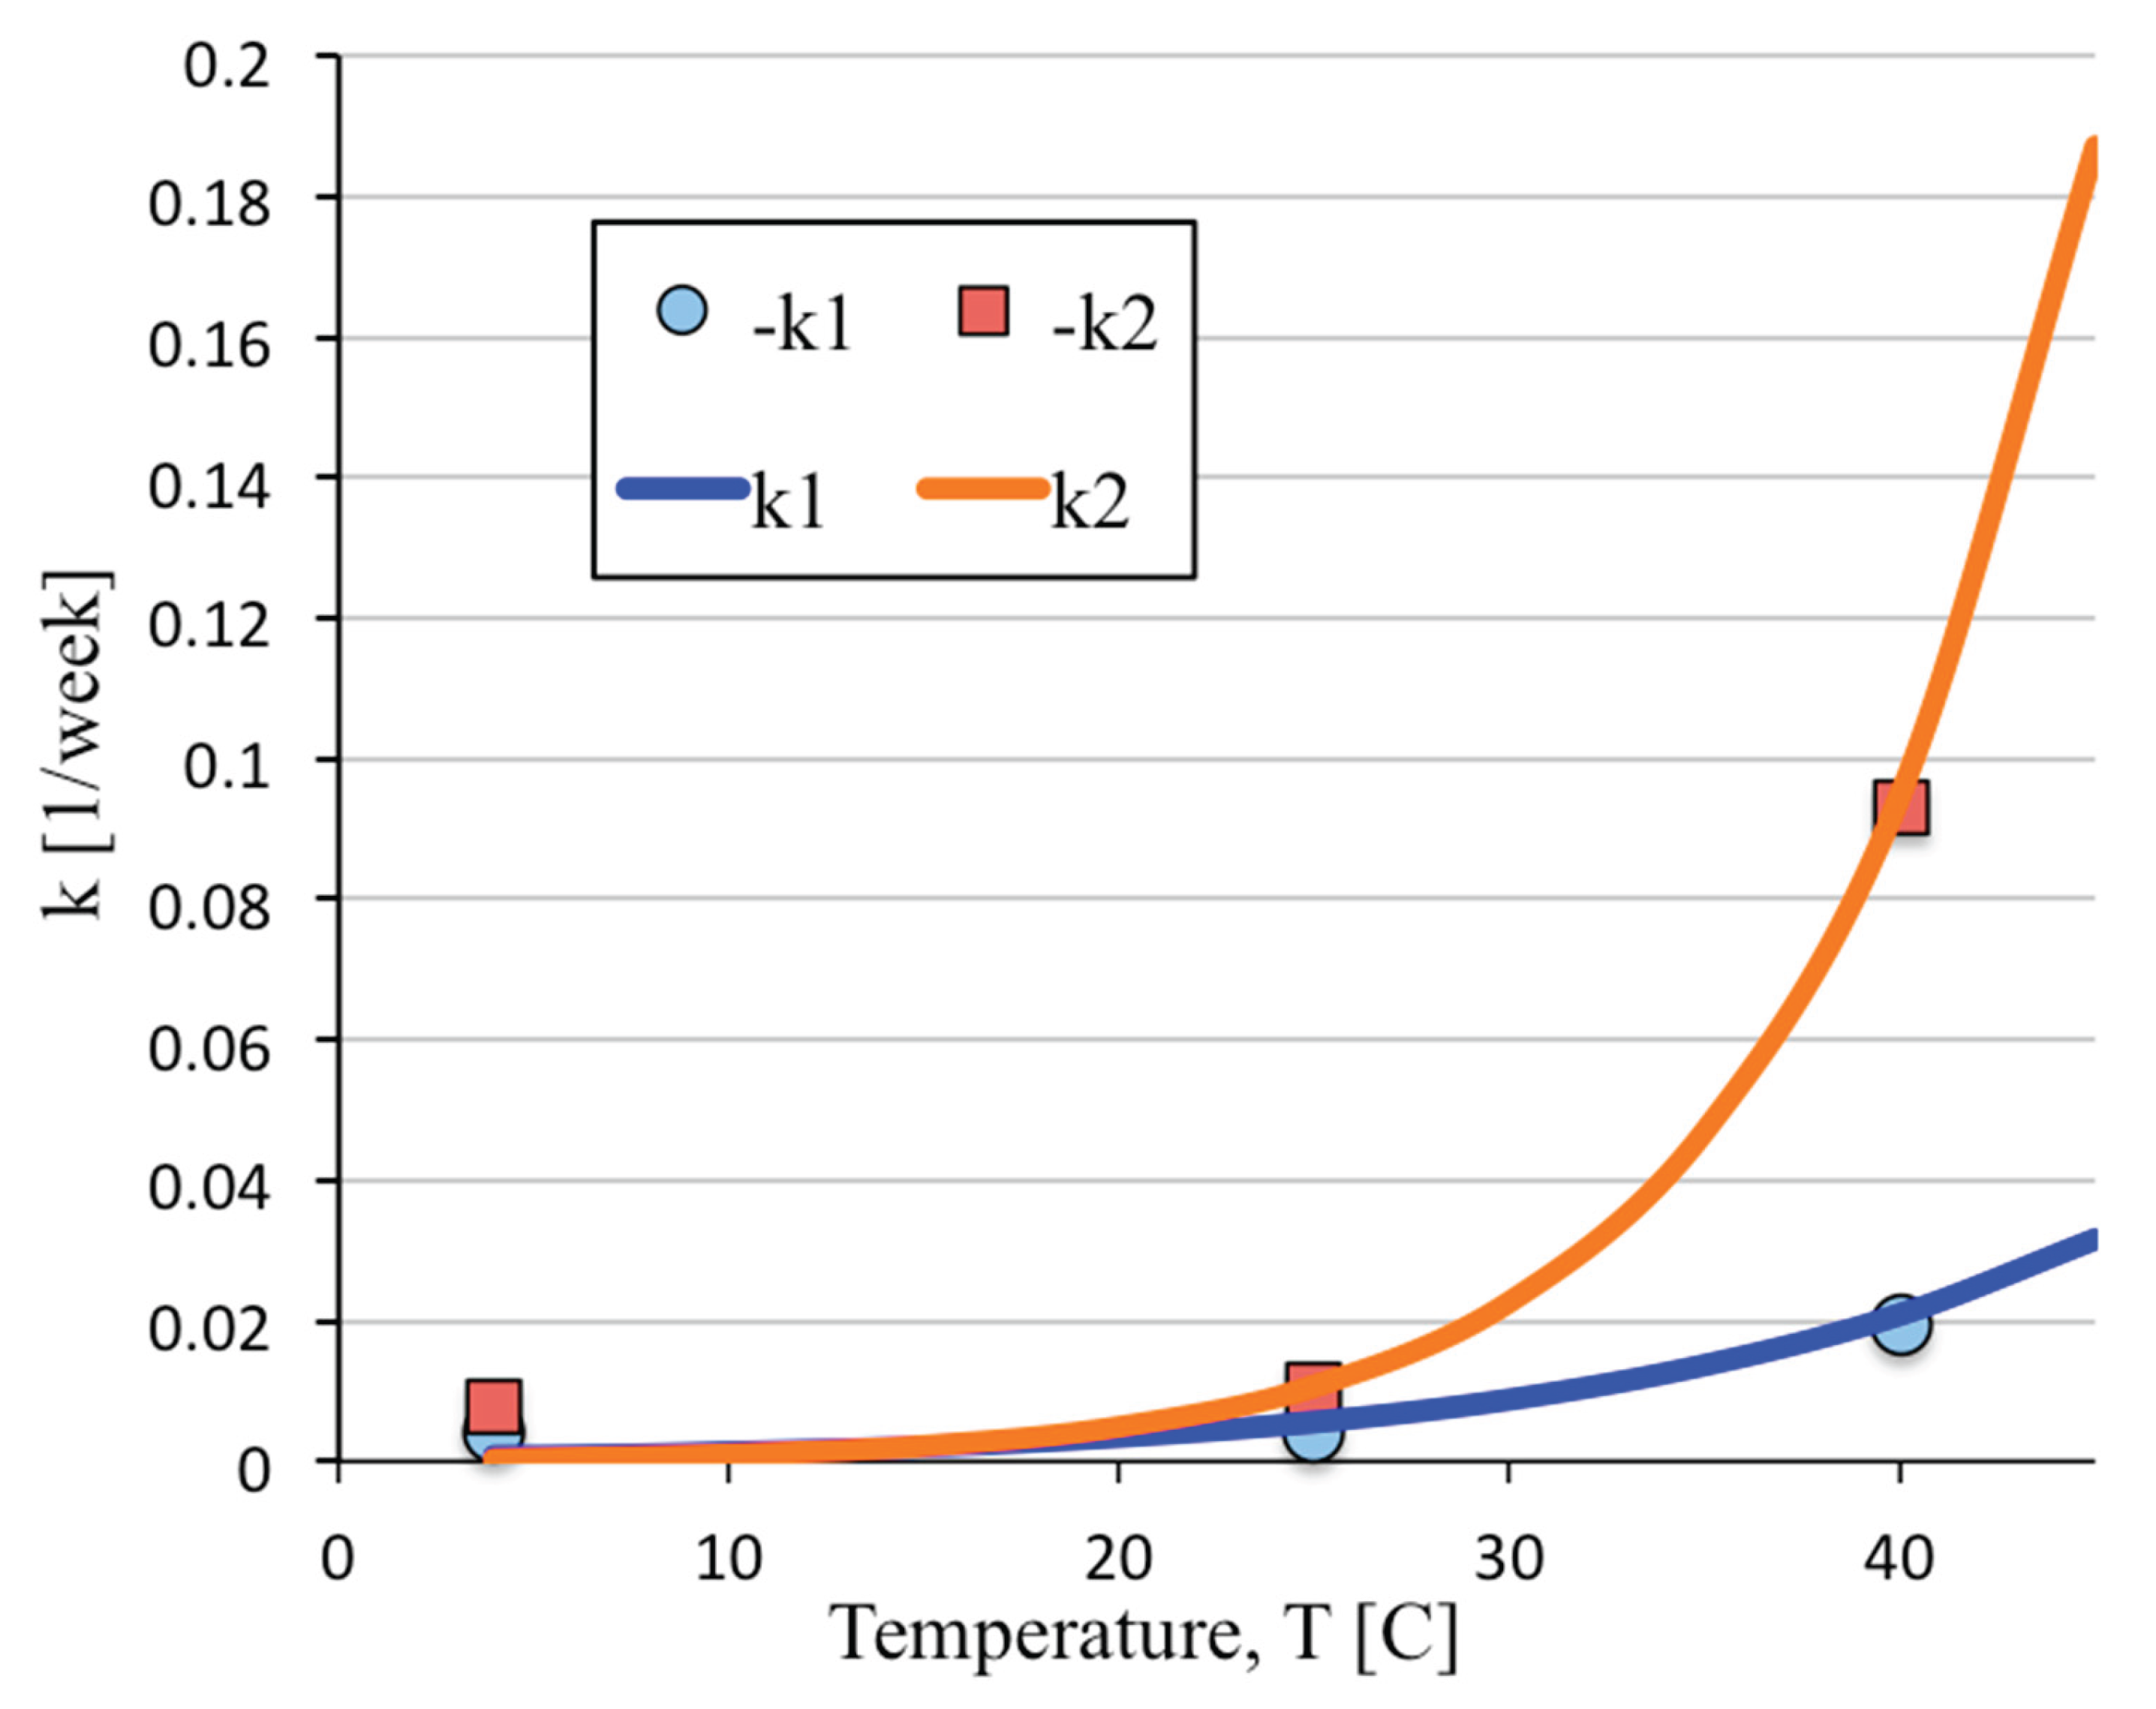

Table 1.
Gradient program of the ratio of Water to Acetonitrile in the mobile phase.
| Time (min) | 100% ACN | 100% Water |
|---|---|---|
| 0 3 10 10.1 15 |
1 1 40 95 95 |
99 99 60 5 5 |
Table 2.
Concentration of L-theanine over time C(t) normalized by the initial concentration for temperatures 4, 25, 40.
Table 2.
Concentration of L-theanine over time C(t) normalized by the initial concentration for temperatures 4, 25, 40.
| time | F1 | F2 | |||||
|---|---|---|---|---|---|---|---|
| (week) | |||||||
| 0 1 2 4 8 |
1.000 1.000 0.997 0.983 0.966 |
1.000 1.000 1.000 0.983 0.966 |
1.000 0.972 0.966 0.931 0.852 |
1.000 1.000 0.984 0.974 0.935 |
1.000 0.990 0.968 0.974 0.919 |
1.000 0.929 0.861 0.748 0.455 |
Table 3.
L-theanine degradation reaction rate constants and corresponding half-lives for formulations F1 and F2.
Table 3.
L-theanine degradation reaction rate constants and corresponding half-lives for formulations F1 and F2.
|
) |
F1 | F2 | ||||
|---|---|---|---|---|---|---|
|
(1/week) |
(years) |
(1/week) |
(years) |
|||
| 4 25 40 |
0.0041 ± 0.0022 0.0041 ± 0.0022 0.0196 ± 0.0022 |
3.25 ± 1.74 3.25 ± 1.75 0.68 ± 0.08 |
0.0079 ± 0.0022 0.0101 ± 0.0022 0.0929 ± 0.0021 |
1.68 ± 0.47 1.32 ± 0.29 0.14 ± 0.01 |
||
Table 4.
Kinetic constants and for both formulations.
| Formulation |
(kJ/mol) |
(1/week) |
|---|---|---|
| F1 F2 |
72.5 21.9 105.3 8.6 |
(2.65 0.29)1010 (3.52 0.10)1016 |
Table 5.
The ratios of the kinetic constants and for Formulation 2.
| 1,2 1,3 2,3 |
0.010.11 0.47 0.05 1.09 0.11 |
0.06 0.01 1.22 0.11 1.02 0.09 |
Disclaimer/Publisher’s Note: The statements, opinions and data contained in all publications are solely those of the individual author(s) and contributor(s) and not of MDPI and/or the editor(s). MDPI and/or the editor(s) disclaim responsibility for any injury to people or property resulting from any ideas, methods, instructions or products referred to in the content. |
© 2025 by the authors. Licensee MDPI, Basel, Switzerland. This article is an open access article distributed under the terms and conditions of the Creative Commons Attribution (CC BY) license (http://creativecommons.org/licenses/by/4.0/).
Copyright: This open access article is published under a Creative Commons CC BY 4.0 license, which permit the free download, distribution, and reuse, provided that the author and preprint are cited in any reuse.


