
Submitted:
12 June 2025
Posted:
13 June 2025
You are already at the latest version
Abstract
Predicting pain in physical rehabilitation remains challenging due to the subjectivity inherent in pain assessment and the high variability among patients. In addition, traditional self-reported scales often introduce bias that complicates objective monitoring. Researchers have explored physiological biomarkers such as heart rate variability (HRV) and photoplethysmography (PPG) for pain assessment, combining these with artificial intelligence to enhance accuracy. Limited datasets and significant inter-individual variability also restrict the practical application of these approaches. This study evaluates the performance of linear regression and random forest models for pain prediction using HRV and oxygenation data. The random forest model was evaluated in several configurations, achieving a classification accuracy of 97.77% for detecting low pain levels. Other configurations yielded overall accuracies of 60.65% and 76.64%, highlighting variations in performance. Notably, the high accuracy in identifying low pain suggests that this approach can reliably detect even mild discomfort at an early stage, which is essential for timely therapeutic interventions. Future work should incorporate advanced models and expanded datasets for improved generalizability.
Keywords:
pain prediction
; physiological data analysis
; machine learning models
1. Introduction
Pain is a key factor in physical rehabilitation, affecting treatment adherence and patients' quality of life [1]. Traditional pain assessment relies on self-reports measures, which can introduce variability and bias that complicates objective quantification in diverse clinical contexts [2].
Recent research has focused on methods based on physiological data to address this issue. Biomarkers such as HRV, PPG, and other biomedical signals have shown potential correlations with pain perception, thus enabling a more automated approach to pain detection and management [3].
The integration of artificial intelligence techniques has facilitated the development of predictive models capable of identifying patterns in physiological data. These models are especially relevant in rehabilitation, where assistive devices (e.g. robotic exoskeletons and automated orthotic systems) can use physiological feedback to improve therapeutic outcomes. The rise of telerehabilitation also opens new opportunities for integrating AI-driven pain assessment into remote therapy, allowing continuous monitoring and personalized treatment adjustments. For instance, systems like MoveLeg [4] have been designed to enhance mobility in patients with musculoskeletal disorders, serving as a reference for incorporating these technologies in both in-person and remote rehabilitation. Nevertheless, applying these models clinically remains challenging due to the need for large, labeled datasets and the variability in pain perception among individuals [5].
This study empirically compares traditional predictive models (specifically linear regression and random forest) with the goal of assessing their effectiveness in pain prediction and exploring their clinical feasibility.
2. Related Works
A recent literature review [19] examined data analysis methods for pain prediction in physical rehabilitation, focusing on physiological signals combined with machine learning and artificial intelligence techniques. This review discussed various approaches using signals such as HRV, electrocardiography, and photoplethysmography, and analyzed their effectiveness in predicting pain outcomes as well as their clinical implications.
The filtering process involved several stages: title screening, abstract assessment, and full-text review. Only studies employing physiological monitoring and machine learning techniques for pain assessment were included. The extracted data were analyzed to compare methodological approaches, signal-processing techniques, and the performance of predictive models.
This review categorizes the literature into key areas, which are discussed in the following subsections along with recommendations for future research.
2.1. Pain Monitoring Methods
Researchers have explored several physiological signals as indicators for pain monitoring in physical rehabilitation. Heart rate variability (HRV), photoplethysmography (PPG), and electrocardiography (ECG) are recognized as valuable markers for pain assessment [2,5]. Studies indicate that HRV is a reliable marker for evaluating musculoskeletal pain [9]. Moreover, combining multiple signals can enhance the accuracy of pain assessment [10].
However, individual variability in these responses poses challenges. For example, although changes in HRV correlate with autonomic responses to pain, their relation to pain intensity remains inconclusive [1].
2.2. Pain Prediction Models
Advanced machine learning models have significantly improved pain prediction by extracting patterns from physiological data. Common algorithms include:
2.3. Integration of Multiple Physiological Signals
Combining different physiological signals often improves pain prediction accuracy. For example:
2.4. Clinical Applications and Challenges
Implementing AI models in clinical settings faces several obstacles:
These factors underscore the importance of hybrid approaches that combine multiple signals with interpretable models, thus enhancing clinical applicability.
2.5. Traditional Models as an Alternative
Previous studies have evaluated traditional machine learning models (such as linear regression and random forest) as practical alternatives for pain prediction due to their advantages:
- Lower data requirements: These models can be trained with smaller datasets, making them more viable clinically.
- Higher interpretability: They facilitate the identification of key physiological patterns related to pain, aiding clinical decision-making [3].
- Clinical adaptability: Their ease of integration into existing medical monitoring systems improves real-world applicability [2].
Nonetheless, significant gaps remain. Few studies have assessed pain prediction in real-world rehabilitation scenarios, limiting the clinical relevance of current approaches. Moreover, while traditional models reduce data needs and improve interpretability, their capacity to capture the complexity of pain perception is still uncertain.
2.6. Future Research Directions
The review identifies several areas for future research in pain prediction for rehabilitation:
- Integration of new physiological signals: Incorporation of new physiological signals could enhance model accuracy [10].
- Comprehensive multi-signal integration: More extensive combinations of signals are needed to boost predictive accuracy and clinical relevance [17].
- Application of advanced machine learning models: Sophisticated algorithms (e.g., deep learning) may further improve pain prediction in clinical contexts [5].
- Validation in real-world clinical environments: Testing model performance in actual rehabilitation settings is necessary for practical applicability [1].
Implementing these strategies could substantially improve the development of precise and accessible pain monitoring tools for physical rehabilitation.
3. Methodology
3.1. Objective
This study aims to develop and evaluate predictive models for pain assessment in physical rehabilitation by analyzing physiological signals such as heart rate variability (HRV) and oxygen saturation. It seeks to identify patterns in these signals that correlate with pain perception, thus facilitating automated pain monitoring in clinical settings.
3.2. Variables
The study focuses on the following key variables:
- Self-reported pain intensity: Pain intensity was measured on a continuous scale from 1 (minimal pain) to 10 (maximum pain). For analysis, these values were grouped into three categories: low pain (1–4), medium pain (4–7), and high pain (7–10).
- Heart rate (BPM).
- Heart rate variability (HRV).
- Oxygen saturation (SpO₂).
3.3. Instrumentation (Materials)
The following equipment was used for data collection:
- Heart rate monitor: COOSPO HW807, a wearable arm strap for continuous HR and HRV monitoring.
- Oxygen saturation sensor: FS20F, a Bluetooth-enabled fingertip pulse oximeter for real-time SpO₂ tracking.
- Data collection software: Custom Python scripts for real-time signal acquisition and processing.
- Experimental protocol: A structured procedure was developed for this study to ensure standardized data collection and participant compliance during rehabilitation sessions.
3.4. Operation
3.4.1. Preparation
The experimental setup was designed to capture data in a realistic clinical environment. To achieve this, a continuous monitoring methodology was implemented, equipping patients with physiological devices before, during, and after physical therapy sessions.
The study included 25 participants (14 men and 11 women) aged 20 to 50, selected based on musculoskeletal conditions affecting the lower body. Participants with neurological or cardiovascular disorders were excluded to ensure measurement accuracy. Ethical principles were strictly followed, guaranteeing voluntary participation, data confidentiality, and risk minimization [11,12]. Informed consent was obtained in accordance with established ethical standards. Physiological data were recorded at different phases of the rehabilitation session, capturing both physical exertion and fluctuations in pain perception.
A structured protocol was followed during the sessions:
- Participant introduction: Participants received an overview of the study’s purpose and procedure.
- Device setup: The heart rate band and pulse oximeter were placed on each participant for continuous monitoring.
- Pain reporting instruction: Participants were instructed to report any pain verbally using a numerical scale (0-10), where 0 indicates no pain, and 10 indicates the highest pain.
- Session execution: Participants engaged in rehabilitation activities while their physiological data were recorded.
- Pain reporting: Participants reported their pain level during episodes or when discomfort was evident.
- Session completion: Time was allocated for participants to ask questions or express concerns about the study.
3.4.2. Execution
During rehabilitation sessions, participants wore HR and SpO₂ sensors to ensure continuous data collection. The adaptive approach to pain reporting (triggered by either a pain episode or visible discomfort) provided a more precise correlation between physiological responses and perceived pain. Each session lasted between 15 and 40 minutes, depending on the patient's condition. Proper sensor placement was ensured to avoid inaccuracies caused by movement or poor contact. Therapists supervised sessions to verify the consistency of self-reported pain scores and offer guidance when needed.
3.4.3. Data Collection
Physiological signals were logged every second to track variations throughout the rehabilitation process. Recorded data included heart rate, HRV, oxygen saturation, and self-reported pain intensity (using the Numerical Rating Scale [7]). Data acquisition was managed with custom Python scripts for the COOSPO HW807 and an Android-based application for the FS20F sensor. Pain scores were documented before, during, and after each session, providing structured data points. All signals were time-synchronized to align physiological responses with pain reports, and the dataset was stored in a relational database designed to enhance data consistency and facilitate predictive analysis.
3.4.4. Validation of Data
To ensure data quality and reliability, several preprocessing techniques were applied:
- Data normalization: Min-max scaling was used to standardize the range of physiological variables.
- Handling missing values: Techniques such as linear interpolation, zero imputation, and omission of incomplete records ensured data completeness.
- Noise filtering: Median and low-pass filters were applied to reduce artifacts from movement or signal variability.
- Exploratory analysis: Correlation studies (along with visual tools like histograms, scatter plots, and heat maps) were conducted to identify significant relationships between physiological variables and reported pain.
3.4.5. Predictive Models
To evaluate pain prediction in physical rehabilitation, two supervised learning approaches were implemented:
- Linear Regression: Employed as a baseline to evaluate trends between physiological variables and pain intensity. Although it is simple and interpretable, its ability to model complex relationships is limited.
- Random Forest: A decision tree-based model that captures nonlinear relationships and is robust to noise, making it suitable for physiological prediction.
Model performance was assessed using:
- Mean Absolute Error (MAE): The average difference between predicted and actual pain scores.
- Coefficient of determination (R²): The proportion of pain variability explained by the model.
- Confusion matrix: Used in classification tasks to analyze the distribution of true positives, false positives, and false negatives.
4. Results and Discussion
Data exploration and correlation studies revealed that participants’ pain intensity was mainly concentrated in the low and moderate ranges, with fewer instances of severe pain. Physiological variables such as heart rate and HRV displayed notable inter-individual variability, which complicates the establishment of universal predictive patterns.
Correlation analysis between physiological signals and self-reported pain levels yielded weak associations. For instance, heart rate and HRV exhibited low correlation coefficients with pain scores, suggesting that analyzing single variables in isolation may be insufficient. Oxygen saturation showed a negative correlation with pain levels, although its predictive value remains uncertain. Figure 1 presents heatmaps that illustrate these correlation coefficients, complementing the numerical data summarized in Table 1.
Implementing linear regression as a baseline model revealed its limitations; Table 1 shows a notably low R² and high MAE, underscoring its difficulty in generalizing across different participants. In contrast, the random forest model captured nonlinear relationships more effectively. Table 1 indicates that random forest yielded higher R² values and lower MAE, especially in classification tasks for low pain detection. However, its performance varied with data configuration and hyperparameter settings, and it misclassified moderate pain levels more frequently. This variability suggests that further refinement in feature selection and model tuning is needed.
A key observation is the model’s higher accuracy in detecting low pain levels compared to moderate or high pain. Table 1 highlights this trend, where classification accuracy for low pain states is higher than for moderate and severe pain. This finding has clinical relevance, as early detection of low pain can help in preemptive adjustments to rehabilitation protocols, potentially reducing the likelihood of pain escalation. Identifying low pain states accurately in therapeutic settings allows clinicians to intervene proactively, optimizing treatment plans and improving patient outcomes. These observations, reinforced by the data trends in Figure 1 and Table 1, illustrate the clinical importance of refining predictive models to improve overall performance.
Table 2 presents three representative cases that reflect the wider trends observed in our participant group. Each case shows distinct baseline values for BPM and oxygen saturation under “No pain,” as well as non-linear changes when transitioning to moderate or severe pain levels. Notably, some individuals display an increase in BPM at low to moderate pain intensities, whereas others exhibit more erratic fluctuations, underscoring the inherent variability in pain perception. These examples reinforce the notion that single-parameter analyses often fail to capture the full complexity of pain dynamics, thereby supporting the use of multi-parameter and non-linear models (e.g., random forest) to achieve more reliable pain prediction.
thereby supporting the use of multi-parameter and non-linear models (e.g., random forest) to achieve more reliable pain prediction.
Overall, the results emphasize the complexity of pain prediction and the benefits of nonlinear modeling. While random forest outperformed linear regression, the findings in Table 1 indicate that further improvements (such as optimized feature selection and the inclusion of additional physiological markers) are necessary to achieve reliable predictive performance in clinical settings.
5. Conclusions
This study evaluated the feasibility of using physiological signals such as HRV and oxygen saturation to predict pain levels in rehabilitation settings by comparing linear regression and random forest models. Unlike many studies based on experimentally induced pain, this research used data from real rehabilitation sessions, thereby reflecting actual clinical conditions.
The findings indicate that linear regression provides limited predictive capabilities due to its inability to model complex relationships, whereas random forest demonstrates improved performance by capturing nonlinear interactions.
Despite its superior predictive accuracy, the random forest model still faced challenges in correctly classifying intermediate pain levels. It performed strongly for lower pain levels, but its accuracy at moderate and high pain levels was less consistent, indicating a need for targeted improvements such as refined feature selection and hyperparameter tuning.
This suggests that although traditional machine learning models offer valuable insights, their predictive power is still limited by the inherently variable nature of pain perception. The study highlights the need for further refinement, including optimizing feature selection and exploring additional physiological parameters to enhance prediction accuracy. Moreover, refining classification approaches, balancing data distribution, and exploring ensemble models could improve classification performance for underrepresented pain levels.
Future research should focus on combining multiple models and expanding datasets with diverse, real-world data. Validating these approaches in clinical environments is crucial to ensure their practical applicability, and advanced methods like deep learning or hybrid models may further improve accuracy in pain assessment.
Author Contributions
Conceptualization, A.H.C.D. and G.B.S.; methodology, A.H.C.D. and G.B.S.; software, A.H.C.D.; validation, A.H.C.D., G.B.S., and S.G.L.; formal analysis, A.H.C.D.; investigation, A.H.C.D.; resources, G.B.S. and S.G.L.; data curation, A.H.C.D.; writing—original draft preparation, A.H.C.D.; writing—review and editing, G.B.S. and S.G.L.; visualization, A.H.C.D.; supervision, G.B.S. and S.G.L.; project administration, G.B.S.; funding acquisition, A.H.C.D. All authors have read and agreed to the published version of the manuscript.
Funding
This research was supported by CONAHCYT through scholarship No. 1090799 awarded to the first author. The APC was funded by Programa de Fomento y Apoyo a la Investigación, grant number 2025-0400.
Institutional Review Board Statement
The study was conducted in accordance with the Declaration of Helsinki, and approved by the Institutional Review Board of Instituto Tecnológico de Sonora (protocol code Dictamen No. 425).
Informed Consent Statement
Informed consent was obtained from all subjects involved in the study.
Data Availability Statement
The datasets generated and analyzed during the current study are available from the corresponding author on reasonable request. Data are not publicly available due to privacy restrictions.
Acknowledgments
The authors would like to thank the rehabilitation center personnel for their assistance during participant recruitment and data collection. Special thanks to the therapists who facilitated the sessions and ensured data quality throughout the study.
Conflicts of Interest
The authors declare no conflict of interest.
Abbreviations
The following abbreviations are used in this manuscript:
| AI | Artificial Intelligence |
| ANN | Artificial Neural Network |
| BPM | Beats Per Minute |
| ECG | Electrocardiography |
| EMG | Electromyography |
| GSR | Galvanic Skin Response |
| HR | Heart Rate |
| HRV | Heart Rate Variability |
| LDA | Linear Discriminant Analysis |
| MAE | Mean Absolute Error |
| PPG | Photoplethysmography |
| RF | Random Forest |
| RMSE | Root Mean Square Error |
| RR | Respiratory Rate |
| R² | Coefficient of Determination |
| SpO₂ | Peripheral Capillary Oxygen Saturation |
| SVM | Support Vector Machine |
References
- Tousignant-Laflamme, Y.; Rainville, P.; Marchand, S. Establishing a link between heart rate and pain in healthy subjects: A gender effect. J. Pain 2005, 6(6), 341–347.
- Jhang, D.F.; Chu, Y.S.; Cai, J.H.; Tai, Y.Y.; Chuang, C.C. Pain monitoring using heart rate variability and photoplethysmograph-derived parameters by binary logistic regression. J. Med. Biol. Eng. 2021, 41(5).
- Seok, H.S.; Choi, B.M.; Noh, G.J.; Shin, H. Postoperative pain assessment model based on pulse contour characteristics analysis. IEEE J. Biomed. Health Inform. 2019, 23(6), 2317–2324.
- Castillón Ramírez, G.A. Diseño y desarrollo de un dispositivo de asistencia para la rehabilitación motriz de extremidades inferiores de pacientes con secuela de accidente cerebrovascular (MoveLeg). Bachelor’s Thesis, Instituto Tecnológico de Ensenada, Ensenada, México, 2021.
- Gkikas, S.; Chatzaki, C.; Pavlidou, E.; Verigou, F.; Kalkanis, K.; Tsiknakis, M. Automatic pain intensity estimation based on electrocardiogram and demographic factors. In Proceedings of the 8th International Conference on Information and Communication Technologies for Ageing Well and e-Health, 2022, pp. 155–162.
- Naeini, E.K.; et al. Pain recognition with electrocardiographic features in postoperative patients: Method validation study. J. Med. Internet Res. 2021, 23(5), e25079.
- Vicente Herrero, M.T.; Delgado Bueno, S.; Bandrés Moyá, F.; Ramírez Iñiguez de la Torre, M.V.; Capdevila García, L. Valoración del dolor. Revisión comparativa de escalas y cuestionarios. Rev. Soc. Esp. Dolor 2018.
- Caicedo Gutierrez, E.; María, L.; Calderón, P. Pain detection using EEG signals. Rev. EIA 2022, 19(38).
- Chuang, C.C.; Chung, W.Y.; Shu, C.; Chen, M.W. Pain assessment in musculoskeletal pain patients by heart rate variability. J. Musculoskelet. Pain 2007, 15(4), 67–74.
- Jiang, M.; Walter, S.; Friedrich, M.; Struck, M.; Braun, C. Acute pain intensity monitoring with the classification of multiple physiological parameters. J. Clin. Monit. Comput. 2019, 33(3), 493–507.
- Secretaría de Salud. Norma Oficial Mexicana NOM-012-SSA3-2012. Que establece los criterios para la ejecución de proyectos de investigación en seres humanos. Diario Oficial de la Federación 2012.
- Secretaría de Salud. Reglamento de la Ley General de Salud en Materia de Investigación para la Salud. Diario Oficial de la Federación 1987.
- Walter, S.; Gruss, S.; Ehleiter, H.; Tan, J.; Salomon, R.; Traue, H.C.; Werner, P.; Kappesser, J. Automatic pain quantification using autonomic parameters. Psychol. Neurosci. 2014, 7(3), 363–380. https://doi.org/10.3922/j.psns.2014.041. [CrossRef]
- Koenig, J.; Jarczok, M.N.; Ellis, R.J.; Hillecke, T.K.; Thayer, J.F. Heart rate variability and experimentally induced pain in healthy adults: A systematic review. Eur. J. Pain 2014, 18(3), 301–314. [CrossRef]
- Kobayashi, N.; Shiga, T.; Ikumi, S.; Watanabe, K.; Murakami, H.; Yamauchi, M. Semi-automated tracking of pain in critical care patients using artificial intelligence: A retrospective observational study. Sci. Rep. 2021, 11(1). [CrossRef]
- Mansoor, Z.; Ghazanfar, M.A.; Anwar, S.M.; Alfakeeh, A.S.; Alyoubi, K.H. Pain prediction in humans using human brain activity data. In Companion Proceedings of the Web Conference 2018, 2018, pp. 359–364. [CrossRef]
- Chu, Y.; Zhao, X.; Han, J.; Su, Y. Physiological signal-based method for measurement of pain intensity. Front. Neurosci. 2017, 11, 279. [CrossRef]
- Kasaeyan Naeini, E.; Kalimeri, K.; Poli, A.; Rizzo, G. Pain recognition with electrocardiographic features in postoperative patients: Method validation study. J. Med. Internet Res. 2021, 23(5), e25079. [CrossRef]
- Cital Duarte, A.H.; Borrego Soto, G.; Ruiz Ibarra, E.C.; González López, S. Systematic review of data analysis methods for pain prediction in physical rehabilitation. Abstraction & Application 2024, 47, 56–65.
Figure 1.
Heatmaps for different data variants.
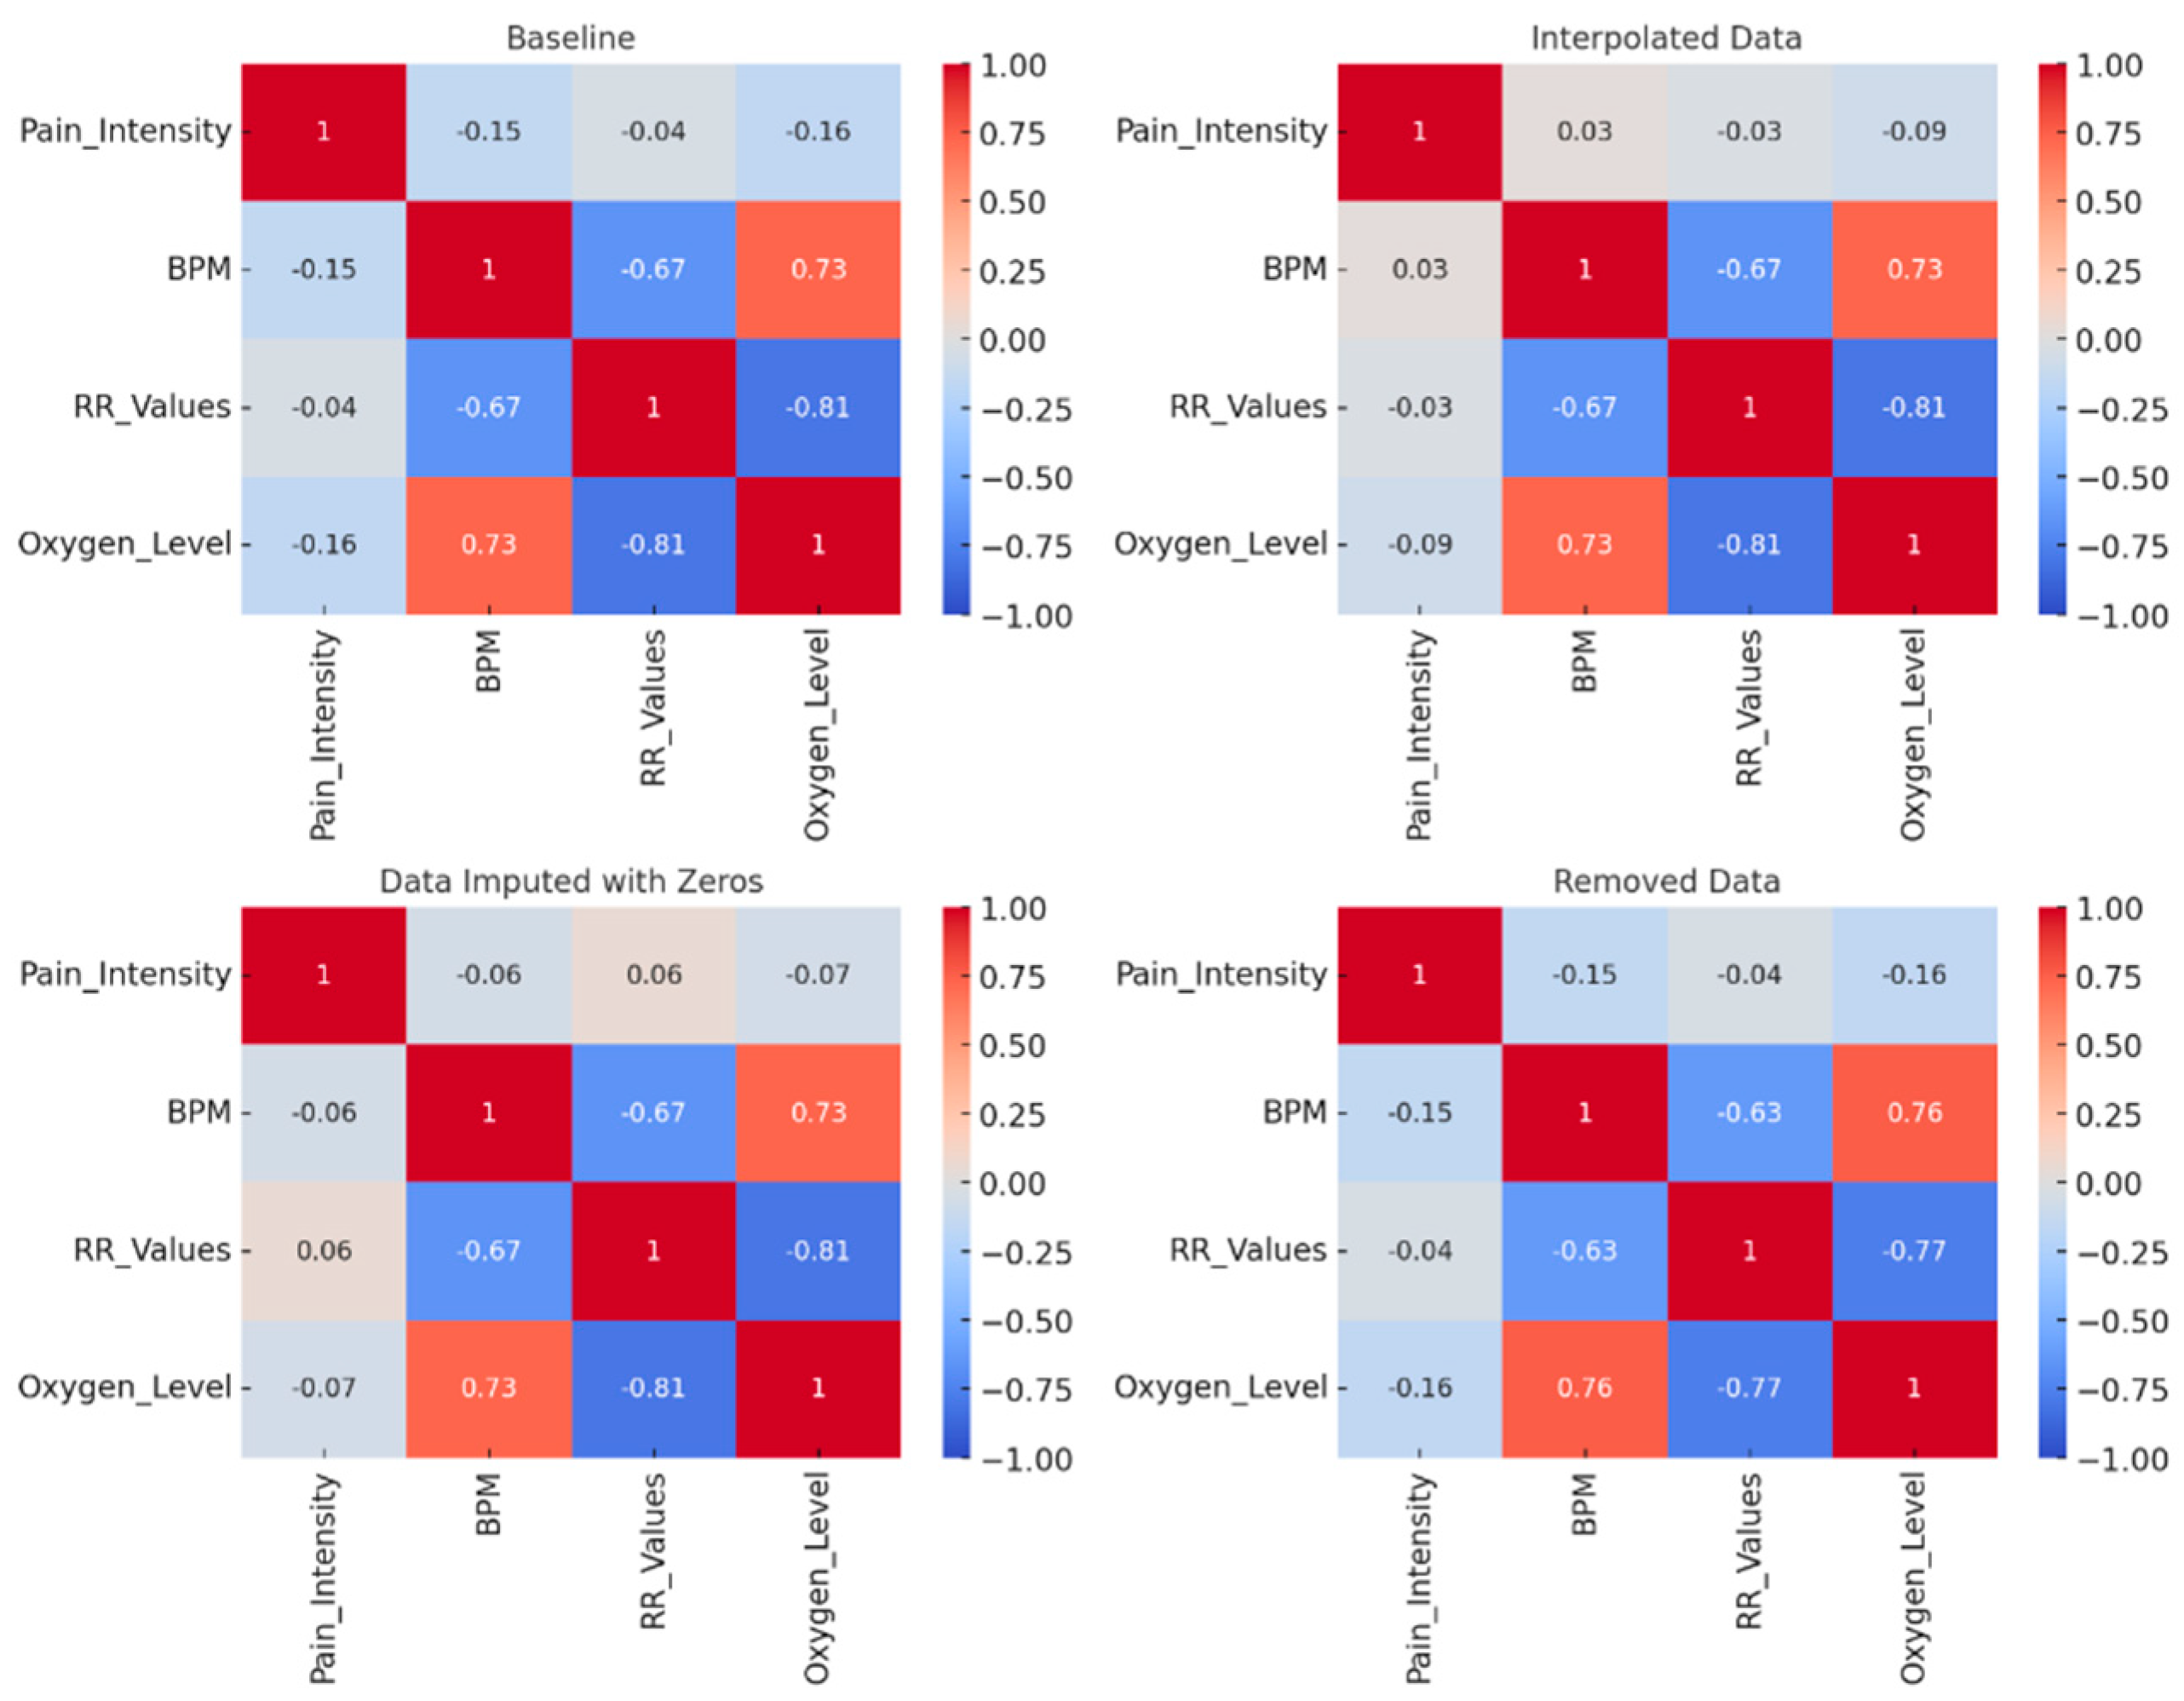

Table 1.
Summary of results: regression and classification models.
| Model | MAE | RMSE | Low pain accuracy | Moderate-High pain accuracy | |
|---|---|---|---|---|---|
| Linear regression | Low (0.1) | High (3.4) | - | N/A | N/A |
| Random forest (data imputed with zeros) | Very Low (0.086) | Low (0.297) | Low (0.948) | High (97.77%) | Low (12.5%) |
| Random forest (interpolated data) | Moderate (0.26) | Moderate (1.027) | High (1.463) | Moderate (60.65%) | |
| Random forest (removed data) | Moderate (0.52) | Moderate (0.93) | Moderate (1.398) | Moderate (76.64%) | |
Table 2.
Representative physiological parameters of patients at varying pain intensities.
| Patients | Pain intensity | Mean BPM | Mean RR intervals | Mean oxygen level |
|---|---|---|---|---|
| P1 | No pain | 71.5895 | 0.8092 | 96.2173 |
| 5 | 74.75 | 0.8844 | 96.4166 | |
| 8 | 70.6428 | 0.7961 | 95.5 | |
| P2 | No pain | 71.7199 | 0.8187 | 96.1968 |
| 3 | 74.2 | 0.8154 | 97 | |
| 5 | 70.24 | 0.8168 | 96.52 | |
| 8 | 70.2857 | 0.7152 | 96 | |
| P3 | No pain | 84.3372 | 0.7001 | 98.4497 |
| 4 | 82 | 0.6726 | 97 | |
| 5 | 84 | 0.6898 | 99 | |
| 6 | 84 | 0.6894 | 99 |
Disclaimer/Publisher’s Note: The statements, opinions and data contained in all publications are solely those of the individual author(s) and contributor(s) and not of MDPI and/or the editor(s). MDPI and/or the editor(s) disclaim responsibility for any injury to people or property resulting from any ideas, methods, instructions or products referred to in the content. |
© 2025 by the authors. Licensee MDPI, Basel, Switzerland. This article is an open access article distributed under the terms and conditions of the Creative Commons Attribution (CC BY) license (http://creativecommons.org/licenses/by/4.0/).
Copyright: This open access article is published under a Creative Commons CC BY 4.0 license, which permit the free download, distribution, and reuse, provided that the author and preprint are cited in any reuse.


