
Submitted:
12 June 2025
Posted:
13 June 2025
You are already at the latest version
Abstract
Three experiments were conducted to evaluate the effects of narasin inclusion on the growth performance of grazing beef cattle under the same availability and quality forage conditions. All three experiments were arranged in a randomized complete block design according to the initial BW of each experiment. Exp 1: Two hundred Nellore calves were allocated in three treatments: 1) CONT: mineral supplement; 2) 1400N: inclusion of 1400 mg of narasin/kg of supplement; and 3) 2100N: inclusion of 2100 mg of narasin/kg of supplement. Narasin inclusion increased (P ≤ 0.01) ADG and final BW, with no effect (P ≥ 0.50) between doses of narasin supplementation. Exp 2: Two hundred and forty Nellore calves were allocated into two treatments: CONT and N1400. The inclusion of narasin increased (P ≤ 0.01) cattle ADG and final BW. Exp 3: One hundred and fifty Nellore yearlings were allocated in two treatments: 1) PROT: protein supplement, and 2) PROT250: inclusion of 250 mg of narasin/kg of supplement. The inclusion of narasin in the protein supplement increased (P ≤ 0.04) cattle ADG and final BW. In conclusion, the inclusion of narasin in mineral and protein supplements increased the growth performance of cattle on tropical pastures without changing supplement intake.
Keywords:
beef cattle
; feed additives
; forage
; grazing
; ionophores
; mineral supplementation
; protein supplementation
; forage availability
; tropical grass
1. Introduction
The beef cattle production systems in tropical countries, the pastures play an important role, representing the main source of nutrients during the breeding and rearing phases [1]. Pasture management and stocking rate adjustment are essential to optimize animal performance in these locations where C4-grasses are predominant and have high production potential [2]. In addition, mineral and protein supplements are adopted strategically to complement nutritional deficiencies like phosphorus levels, trace minerals, and protein availability during the year [3], beyond the possibility of being a carrier for feed additives to improve animal performance and health.
Narasin is an ionophore antibiotic naturally produced by the bacteria Streptomyces aureofaciens, and recent studies have shown the efficiency of using this additive on the fermentation and voluntary intake parameters of ruminant animals [4]. In general, regardless of forage quality, the inclusion of narasin for ruminants fed with forage-based diets increases the molar proportion of ruminal propionate and reduces ruminal acetate:propionate ratio [5,6]. Moreover, narasin has shown greater efficacy in modulating the ruminal fermentation in beef cattle fed forage-based diets when compared to other molecular agents, including lasalocid, virginiamycin, salinomycin, and flavomycin [7,8]. Regarding animal growth performance, previous studies have shown that narasin increased dry matter intake (DMI) and average daily gain (ADG) of beef cattle fed forage-based diets [7,8]. Furthermore, the literature remains limited regarding the evaluation of this molecule's effects in grazing systems, particularly when administered via supplements. The variability in supplement intake in grazing systems [9,10] also introduces a significant challenge in achieving the precise daily dosage required.
In a study evaluating narasin inclusion in mineral and protein supplements for cattle on tropical pastures, supplementation with narasin in the mineral mix increased ADG by approximately 200 g during the initial 28 d, but this effect was not sustained throughout the remainder of the feeding period [9]. However, the authors reported a large variation in supplement consumption and pasture availability and quality throughout the study, which may have compromised the potential effect of this feed additive [9]. Therefore, we hypothesized that under equal conditions of forage availability and quality, including narasin in mineral or protein supplements would increase the performance of grazing beef cattle during a rearing phase. The objective of this study was to evaluate the effects of including narasin in mineral (Exp. 1 and 2; Brazilian rainy season) and protein (Exp. 3; Brazilian dry season) supplements on the performance of grazing beef cattle during the rearing phase.
2. Materials and Methods
2.1. Ethical Statement
All experimental procedures described in the present study were approved by the Animal Care and Use Committee from the University of São Paulo (CEUA/USP, protocol #5165811516) prior to the initiation of the experiments.
2.2. Experimental Location and Overview
The experiments were conducted at the Experimental Station Agrozootécnica Hildegard Georgina Von Pritzelwiltz, situated in Londrina, Paraná, Brazil (23°34'41"S, 50°57'08"W). This facility is owned by the Fundação de Estudos Agrários Luiz de Queiroz (FEALQ, Piracicaba, Brazil), located within a region characterized by a humid subtropical climate (Cfa according to Köppen’s classification), with year-round precipitation [11]. Three experiments were conducted to test the hypotheses of this study.
2.3. Experiment 1: doses of narasin on mineral supplement
Two hundred and forty Nellore calves [initial shrunk body weight (BW) = 177 ± 15 kg; age = 8 ± 0.7 mo] were assigned into 30 groups (experimental unit) of 8 calves each in a randomized complete block design, according to their initial shrunk BW obtained after 16 h of feed and water withdrawal. The pasture area consisted of 60 paddocks of 1 hectare each, covered with Urochloa brizantha cv. Marandu and containing waterers and mineral feeders. Each paddock was continuously grazed by a group for 28 d, followed by a 28 d rest period for that paddock before being reused. The experimental period lasted 84 d, divided into 3 periods of 28 d each during the rainy season (from November 2016 to February 2017).
The groups were randomly assigned to 1 of the 3 following treatments: 1) CONT: mineral supplementation with no fed additives (n = 10); 2) N1400: inclusion of 1400 mg of narasin/kg (Zimprova; Elanco Animal Health, Sao Paulo, Brazil; n = 10) of supplement (Dry matter basis) or; 3) N2100: inclusion of 2100 mg of narasin/kg of supplement (Dry matter basis; n = 10). The inclusion of narasin in the supplement was carried out to achieve the intake of 13 and 20 ppm of narasin in the total diet, considering the forage intake as being 2.2% of calves BW and the mineral supplement average intake of 40 g/animal daily. Target doses of 13 and 20 ppm were selected based on previous studies demonstrating their effectiveness in modulating ruminal fermentation [6], as well as manufacturer recommendations. The mineral supplement (Phos60; Premix, Ribeirao Preto, SP, Brazil) was used for the CONT, N1400, and N2100 treatments. The composition of the mineral supplement is presented in Table 1.
The supplement and feed refusals were measured and provided once weekly, using a 1.0 g accuracy electronic scale (Toledo 9094C/4; Toledo do Brasil, São Bernardo do Campo, SP, Brazil). Supplements were offered in quantities sufficient to ensure at least 10% refusals, thereby permitting ad libitum intake. Samples of the supplement offered and the refusals were collected to determine the DM content [12] for the calculation of the average DM supplement intake.
The animals were weighed at the beginning of the experiment (d 0) and at the end of each period (d 28, 56, and 84) after 16 h of feed and water withdrawal using the idBeck 3.0 electronic scale (Irmãos Beckhauser e Cia Ltda, Paranavaí, PR, Brazil). The ADG (kg/d) was calculated by dividing the gain obtained by the duration of each period (28 d).
Total forage availability in the paddocks was assessed at the entry and exit of the animals on d 1 and 28 of each period, respectively. The quantitative samples were harvested near the ground using 0.25-m2 metallic frames (0.5 × 0.5 m) placed on the representative sites. The samples obtained were sent to the laboratory for subsequent determination of the DM content and calculation of forage availability per hectare. On d 14 of each experimental period, forage samples were collected from each paddock using simulated grazing to assess forage quality.
The forage samples were dried in a forced-air oven at 55 °C for 96 h and subsequently ground in a 1-mm screen using a Willey mill (Marconi Equipaments Laboratories, Piracicaba, SP, Brazil). The DM was determined by drying the samples at 105 °C in an oven for 24 h [13], and the ash content was determined by incinerating the samples in a muffle furnace at 550 °C [13]. The organic matter (OM) was calculated using the equation: OM = 100 – ash. Total nitrogen was determined using a LECO TruMac N (Leco Corporation; Saint Joseph, MI, USA; [13]), and the crude protein (CP) was obtained by multiplying the total N content by 6.25. The neutral detergent fiber (NDF; [14]) and acid detergent fiber (ADF; [15]) were determined using an Ankom 2000 fiber analyzer (Ankom Tech. Corp. Macedon, NY, USA). Sodium sulfite and heat-stable α-amylase were added in the NDF analysis.
All data were analyzed for normality of residuals using the Shapiro-Wilk test, homogeneity of variances using the Levene test, and removal of outliers based on the student's r value. The data were analyzed using Kenward-Roger approximation to determine the denominator df for the test of fixed effects. The block was considered as a random effect. The covariance structure adopted was first-order autoregressive, which provided the smallest Akaike Information Criterion Corrected (AICC) for the variables analyzed. To evaluate the effect of the treatments, 2 orthogonal contrasts were previously proposed: 1) CONT vs. N: supplement with no feed additives versus supplements with narasin (1400 and 2100 mg/kg of supplement); 2) N1400 vs. N2100: comparison between doses of 1400 and 2100 mg/kg of supplement. Significance was set at P ≤ 0.05, and tendencies were determined if P > 0.05 and ≤ 0.10. Results are reported according to the main effects if no interactions were significant.
2.4. Experiment 2: Narasin on Mineral Supplement
Two hundred and forty weaned Nellore calves [initial shrunk BW = 195 ± 19 kg; age = 8 ± 0.5 mo] were assigned into 8 groups (experimental unit) of 6 calves each and 12 groups of 8 calves each in a randomized complete block design, according to their initial shrunk BW obtained after 16 h of feed and water withdrawal. The pasture area consisted of 62 paddocks of 1 hectare each, covered with Urochloa brizantha cv. Marandu and containing waterers and mineral feeders. Each paddock was continuously grazed by a group for 28 d, followed by a 28 d rest period for that paddock before being reused. The experimental period lasted 112 d, divided into 4 periods of 28 d each during the wet season (from November 2017 to March 2018). The rotation of the groups in the paddocks was carried out to ensure that the animals from both treatments passed through the same paddocks, minimizing the location effect.
The groups were randomly assigned to 1 of the 2 following treatments: 1) CONT: mineral supplementation with no feed additives, or 2) N1400: inclusion of 1400 mg of narasin/kg of mineral supplement. The inclusion of narasin in the supplement was carried out to achieve the intake of 13 ppm of narasin in the total diet, considering the forage intake as being 2.2% of BW and mineral supplement intake of 40 g/animal daily. The mineral supplement (Phos60; Premix, Ribeirao Preto, SP, Brazil) was used for the CONT and N1400 treatments. The composition of the supplement is presented in Table 1.
The animals were weighed at the beginning of the experiment (d 0) and at the end of each period (d 28, 56, 84, and 112) after a 16 h of feed and water withdrawal, using the idBeck 3.0 electronic scale (Irmãos Beckhauser e Cia Ltda, Paranavaí, PR, Brazil). The ADG was calculated by dividing the total gain obtained by the duration of each period (28 d). The assessments of pasture availability and quality, as well as the chemical analyses performed, were carried out in the same manner as described in Exp. 01.
All data were analyzed for normality of residuals using the Shapiro-Wilk test, homogeneity of variances using the Levene test, and removal of outliers based on the student's r value. The data were analyzed using Kenward-Roger approximation to determine the denominator df for the test of fixed effects. The block was considered as a random effect. The covariance structure adopted was first-order autoregressive, which provided the smallest Akaike Information Criterion corrected (AICC) for the variables analyzed. The treatment effect was defined by the F test. Significance was set at P ≤ 0.05, and tendencies were determined if P > 0.05 and ≤ 0.10. Results are reported according to the main effects if no interactions were significant.
2.5. Experiment 3: Narasin on Protein Supplement
One hundred and fifty weaned Nellore yearlings [initial shrunk BW = 332 ± 22 kg; age 16 ± 0.9 mo] were assigned into 30 groups of 5 yearlings each in a randomized complete block design, according to their shrunk BW obtained after 16 h of feed and water withdrawal. The pasture area consisted of 62 paddocks of 1 hectare each, covered with Urochloa brizantha cv. Marandu and containing waterers and feeders. Pasture management and group rotation between paddocks were the same as described in Exp. 02. The experimental period lasted 112 d, divided into 4 periods of 28 d each during the dry season (from May 2018 to August 2018).
The groups were randomly assigned to one of the two following treatments: 1) PROT: protein supplementation with no feed additives, or 2) PROT250: inclusion of 250 mg of narasin/kg of protein supplement. The inclusion of narasin in the supplement was carried out with the objective of achieving the intake of 13 ppm of narasin in the total diet, considering the forage intake as being 2.2% of BW and protein supplement intake of 450 g/animal daily. The protein supplement (Campo 30; Premix, Ribeirao Preto, SP, Brazil) was used for the PROT and PROT250 treatments. The composition of the supplement is presented in Table 1.
The assessments of pasture availability and quality, as well as the chemical analyses performed, were carried out in the same manner as described in Exp. 01. Statistical analysis of the data was performed as described in Exp. 02.
3. Results
3.1. Exp. 1
There was no interaction (P ≥ 0.15) between treatment and period for forage availability and chemical composition of the paddocks in this study (Table 2). Forage availability and quality at the beginning and end of the periods were similar (P ≥ 0.45) among treatments. Forage availability at the animals' exit was greater (P < 0.01) in period 3 compared to the other periods. There was a period effect (P ≤ 0.03) on forage availability at exit (Figure 1) and forage CP, NDF, and ADF content (Figure 2). There was no effect of period for DM and OM content (P ≥ 0.39). The CP content was higher in periods 2 and 3 (P < 0.01) compared with period 1. The NDF and ADF content decreased throughout the experimental periods (P < 0.01).
The inclusion of narasin (N1400 or N2100) in the mineral supplement increased (P < 0.01) ADG compared to CONT, with no difference between narasin supplementation treatments (Table 3). Consequently, the inclusion of N1400 or N2100 tended (P = 0.06) to increase the BW of the animals after 28 d of study and increased (P < 0.01) BW on d 56 and 84 compared to CONT (Table 3). The doses of narasin increased the BW changes during the study (P < 0.01) than CONT, with no differences (P = 0.50) between N1400 and N2100 (Table 3). The inclusion of narasin in the mineral supplement did not affect (P ≥ 0.18) supplement intake (Table 3).
Exp. 2.
No treatment × period interaction (P ≥ 0.16; Table 4) was observed for pasture and animal performance data. The availability and chemical composition of the grass were the same between treatments (P ≥ 0.18). There was no period effect (P ≥ 0.10) on forage mass availability and DM content (Figure 5). The greatest forage OM content was observed in period 2, with no difference between the other periods. The least forage CP content occurred in period 1, while the greatest CP forage value was observed in period 3. The NDF and ADF contents were greater in the first period and least in periods 2 and 4 (Figure 6).
The inclusion of 1400 mg of narasin per kg of mineral supplement increased (P < 0.01) ADG during the experiment (Table 5). Thus, the BW of calves fed N1400 tended (P = 0.08) to increase on d 28 of the study and increased (P < 0.01) on d 56, 84, and 112 compared to CONT (Table 5). Consequently, the BW change was greater (P < 0.01) for the N1400 compared to CONT (Table 5). The inclusion of narasin did not affect (P = 0.25) the daily intake of mineral supplements (Table 5).
Exp. 03.
No treatment × period interaction (P ≥ 0.38; Table 6) was observed for pasture and animal performance. The availability of forage at the entrance and exit of the animals from the paddock, as well as the grass quality, were similar between treatments (P ≥ 0.58). There was a period effect (P ≤ 0.03) for all variables related to forage mass and composition. Forage mass availability at entry and exit decreased (P < 0.01) throughout the experiment (Figure 9). The greatest forage DM content occurred in period 2, while the lowest value was in period 4 (Figure 10). Forage OM content was greater in periods 1 and 3, and the lowest value was in period 4. Pasture CP was highest in period 3, while the lowest value was observed in period 4. The lowest NDF content was observed in period 3, with no difference between the other periods. And in relation to ADF, the highest value occurred in period 2 and the lowest value in period 1.
The ADG increased (P < 0.01; Table 7) with the inclusion of narasin in the protein supplement. After 28 d of supplementation, BW was similar (P = 0.29) between treatments. On d 56, however, BW tended to be greater (P = 0.08) in PROT250 vs. PROT (Table 7). From d 84 to 112, PROT250 yearlings were heavier (P ≤ 0.02) compared to yearlings from PROT group. The addition of narasin to the protein supplement did not affect (P = 0.74) supplement intake (Table 7).
There was a period effect for ADG (P < 0.01; Figure 11) and supplement intake (P < 0.01; Figure 12). The greatest ADG was observed for period 3, while the lowest ADG occurred in the last period of the study. Regarding supplement intake, the highest values were observed in period 1, while the lowest were in period 3.
4. Discussion
The benefits of including ionophores in ruminant diets are well documented in the literature, demonstrating positive effects on ruminal fermentation [16], performance [17-19], and coccidiosis control [20]. It is important to highlight that there is a greater number of scientific investigations on the use of these molecules in diets containing a high concentrate content (feedlot cattle), with a less expressive number of studies with grazing cattle. In addition, beef producers need to be aware of the particularities of each ionophore to decide which one to use in their production system [4]. Therefore, the present study raised an important database on the inclusion of narasin in two types of supplementations (mineral and protein) for animals in a tropical pasture system and at different seasons of production (dry and rainy) in tropical countries.
Several studies demonstrated the positive results of narasin on the performance of ruminants in different production systems, such as increased milk production in sheep [21-23], increased ADG and FE of feedlot lambs [24], and in the rearing of cattle fed forage-based diets [7,8]. In the current study, the inclusion of narasin in the supplement increased ADG in the three experiments conducted in a grazing system. The observed improvements in cattle growth performance can be explained by the ability of narasin to modulate ruminal fermentation, increasing the energy efficiency due to the higher molar proportion of propionate and the reduction in the acetate:propionate ratio [6]. Furthermore, studies conducted with feedlot cattle fed forage-based diets [7,8] have shown that narasin supplementation increases dry matter intake (DMI), thereby enhancing total organic matter intake. This increase contributes to greater ruminal fermentation and, consequently, a higher energy supply to support animal performance. [7,8]. Furthermore, studies conducted with feedlot cattle fed forage-based diets [7,8] have shown that narasin supplementation increases DMI, thereby enhancing total organic matter intake. This increase contributes to greater ruminal fermentation and, consequently, a higher energy supply to support animal performance. Therefore, this combination of fermentation manipulation and a possible increase in DMI could justify the increase in animal weight gain, since all treatments were in pasture systems with the same forage availability and quality.
Providing low-intake supplements is a simple and low-cost way to provide additives to animals raised in pasture-based systems [25,26]. However, in order to achieve the recommended intake dose of the additive, supplement intake cannot be affected (positively or negatively) by the inclusion of the additive, as this could result in over- or under-dosage. The ADG increases quadratically with increasing doses of monensin or lasalocid, emphasizing the importance of consuming the correct dose to optimize animal performance [25]. Some additives appear to affect the supplement intake, varying the additive intake. Evaluation of additive inclusion in mineral supplements for cattle on tropical pasture revealed that supplementation with 1,000 mg monensin/kg or 1,111 mg salinomycin/kg reduced supplement intake by 38.4% and 27.5%, respectively, compared with the control [27]. Franco [28] reported that the inclusion of monensin in mineral supplements not only reduced supplement intake but also decreased the frequency of animal visits to the trough. Additionally, aversion to monensin-containing supplements increased over time, suggesting a conditioned response to post-ingestive effects [28]. The first study to evaluate the use of narasin in mineral supplementation was carried out by our research group [29], in which the inclusion of 650 or 1300 mg of narasin/kg of mineral supplement did not affect supplement intake, and the higher dose increased the ADG of feedlot heifers fed high forage content diets. In the three experiments reported in this study, the inclusion of narasin in mineral and protein supplements did not alter supplement intake, thus allowing the expected dose of narasin to be consumed during the study.
It is important to emphasize that the absence of interaction between treatment and experimental period in all experiments carried out in this study demonstrates that, only from the quantitative and qualitative variations measured and presented in the figures of this manuscript, the use of narasin was effective in ensuring an increase in animal performance, with no effect on supplement intake. Limede et al. [7] reported variations in the composition of forage provided to feedlot cattle supplemented with 13 ppm of narasin and also observed that despite this variation, the effect of narasin on performance was maintained, providing additional gains in relation to the control treatment of approximately 110 g/d. Studies demonstrated that narasin is capable of manipulating positively the ruminal fermentation, with an increase in propionate and a reduction in the acetate:propionate ratio even with variations in the nutritional quality of forages for both sheep [24] and cattle [5], which may explain the results in animal performance obtained in the present study.
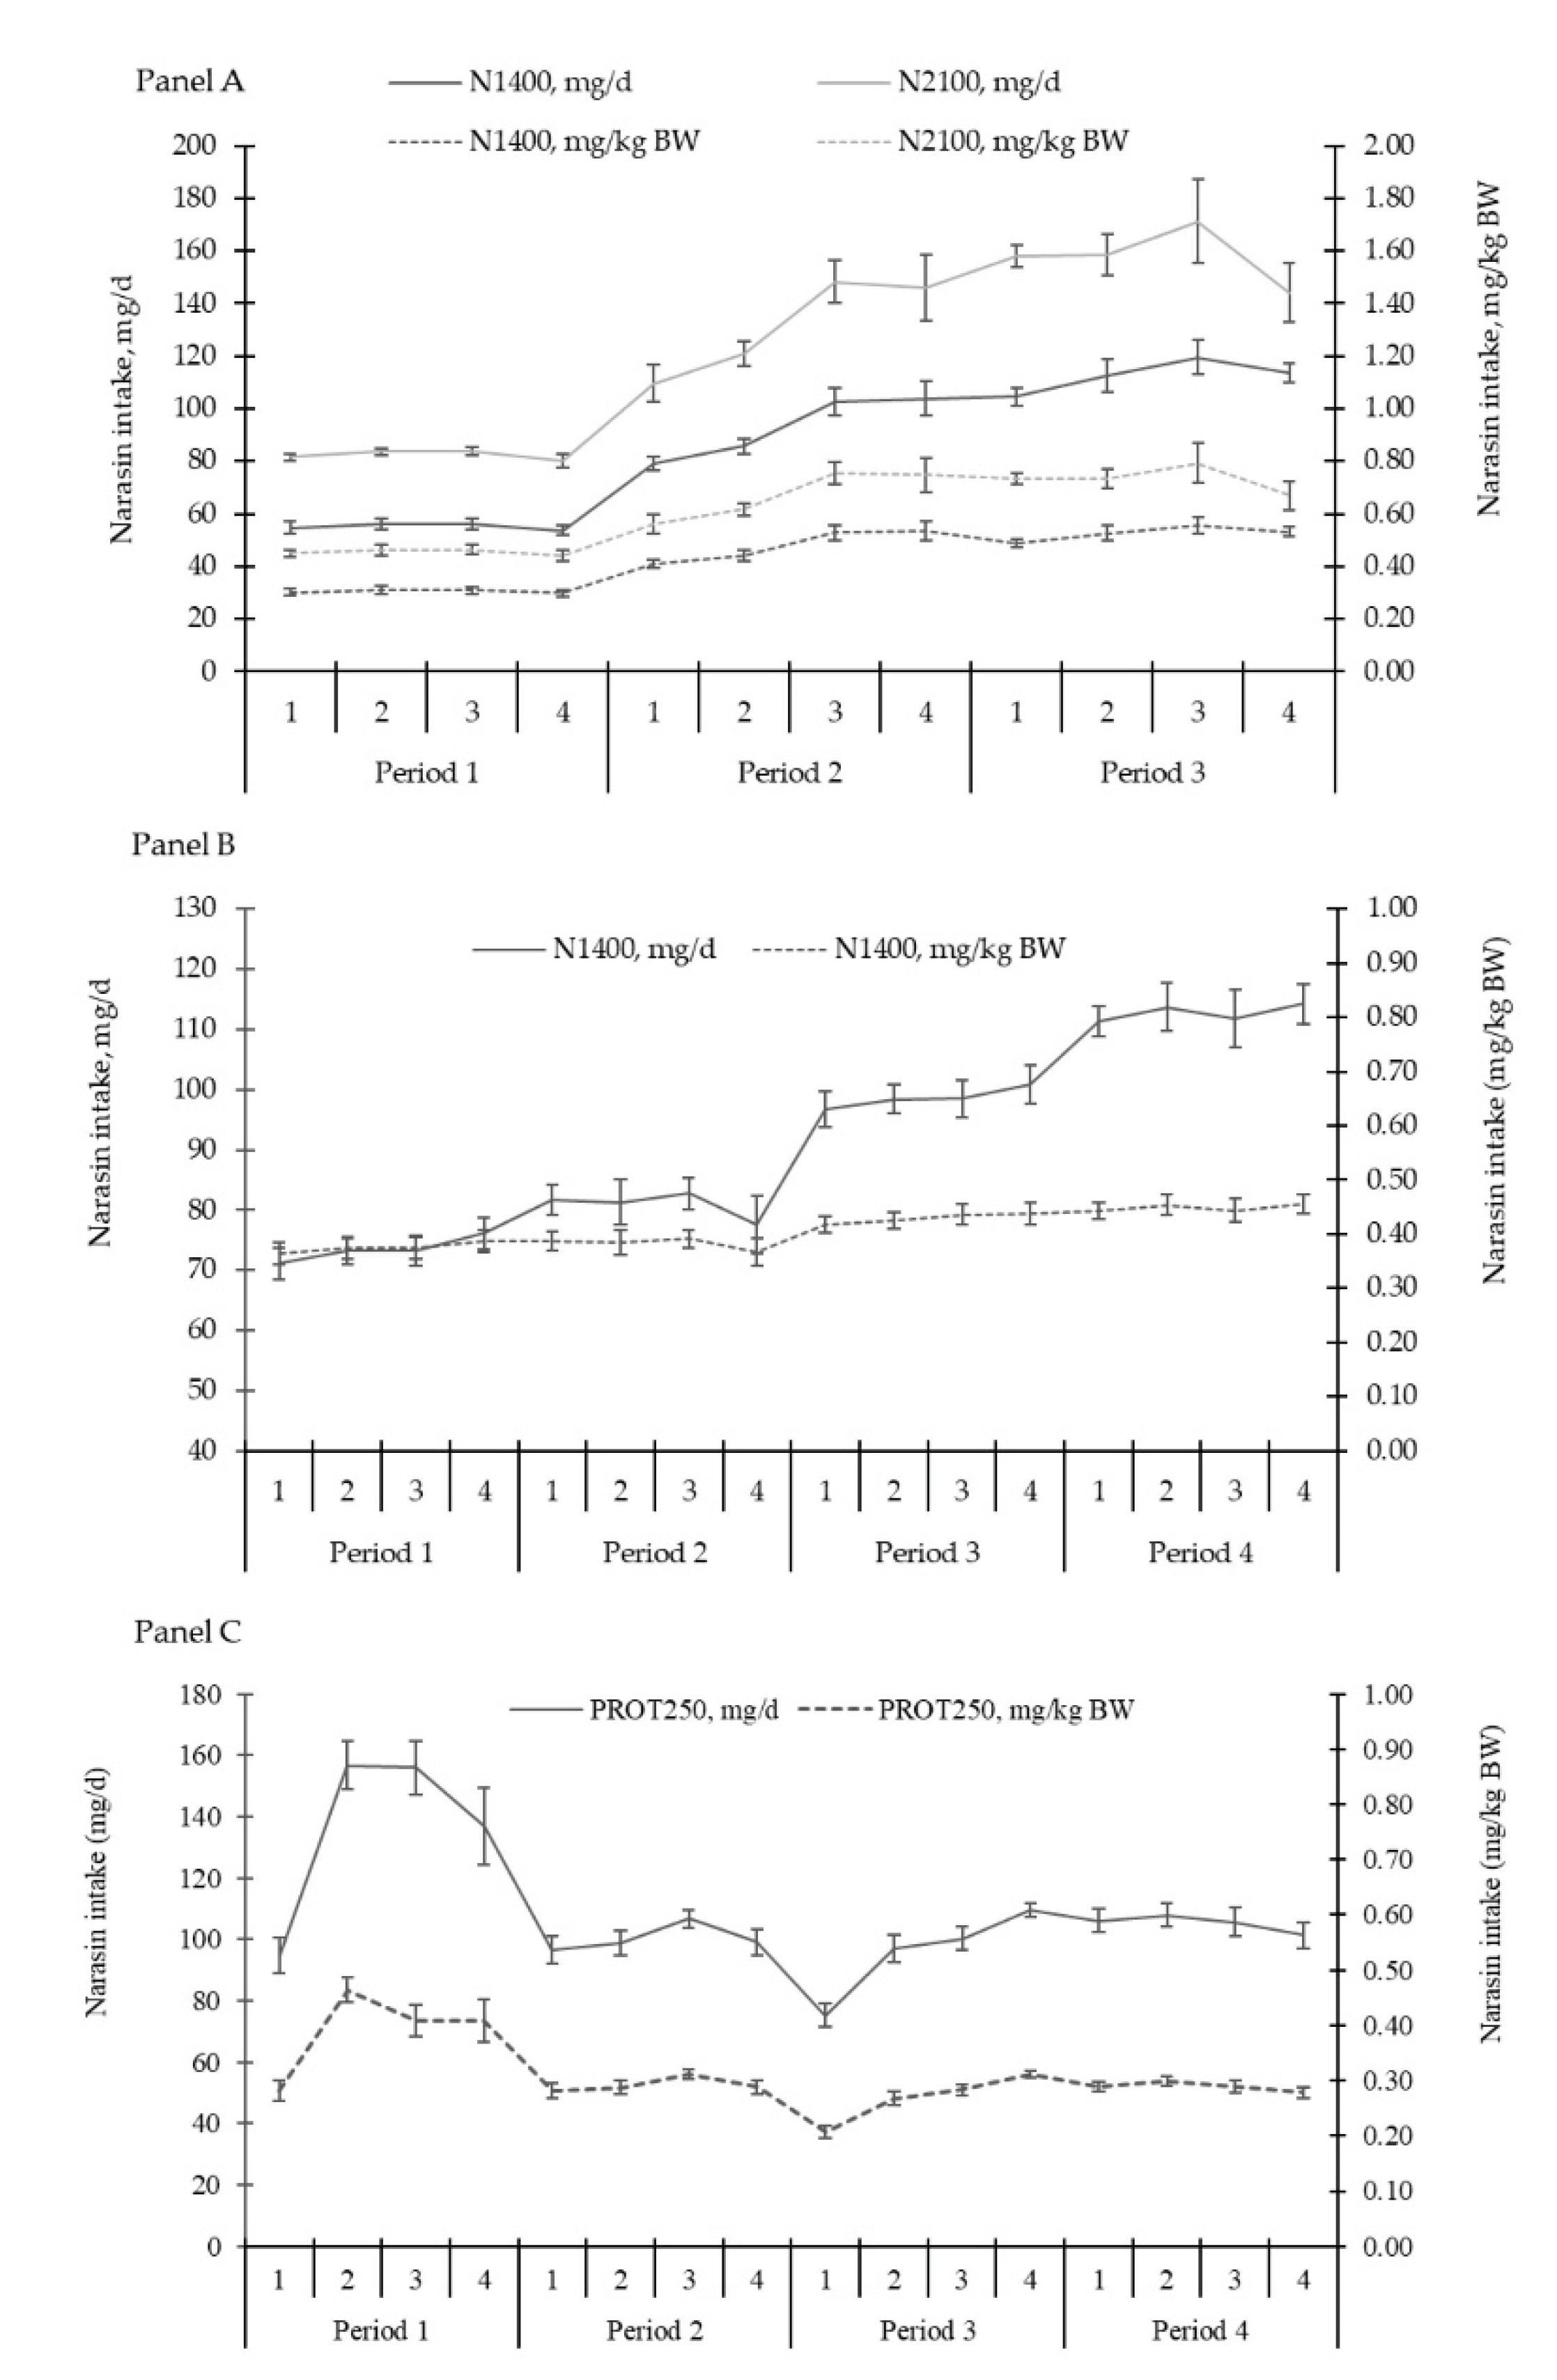
Throughout the three experiments, variation in supplement consumption was also observed. Many factors can affect supplement consumption, such as soil fertility, season, forage quality, protein and energy availability, water quality, palatability of the mineral supplement, and [26]. The variation in consumption may be influenced by the type of supplement, as presented by [30], reporting that 25.8% of the animals visited the feeder daily when fed the mineral supplement; however, when a protein-energetic supplement was offered, the visit increased to 85.1%. The issue to be highlighted is that supplements were the vehicles for supplying narasin, therefore, variations in supplement intake result in variations in additive intake, as shown in figure 13. Despite this, narasin showed a consistent effect on animal performance in all experiments (absence of treatment × period interaction). Previous studies have shown that narasin is capable of manipulating ruminal fermentation even if the frequency of intake of the molecule is reduced, that is, increasing the interval between supplying the molecule [31,32]. Furthermore, it is possible to observe residual effects of the manipulation on ruminal fermentation up to 3 d after the withdrawal of narasin from the diet of animals fed with a high forage content [32,33].
Figure 13.
Panel A – Narasin intake over the experimental periods of Exp. 1, expressed in mg/d and mg/kg of body weight calculated from the supplement consumption and narasin concentration. Panel B – Narasin intake over the experimental periods of Exp. 2, expressed in mg/d and mg/kg of body weight calculated from the supplement consumption. Panel C – Narasin intake over the experimental periods of Exp. 3, expressed in mg/d and mg/kg of body weight calculated from the supplement consumption.
5. Conclusions
In summary, this study demonstrated that, under equivalent forage quality and availability, narasin supplementation enhances animal performance without affecting the intake of protein or mineral supplements. Therefore, narasin represents a valuable strategy for beef cattle production in grazing systems, with potential applications across both the tropical rainy and dry seasons.
Author Contributions
Conceptualization, D.M.P. and A.C.L.; methodology: D.M.P and A.C.L; software, D.M.P., formal analysis, D.M.P. and A.C.L.; investigation, D.M.P. and A.C.L.; resources, A.V.P. and J.R.S.G., data curation, D.M.P., A.C.L., J.R.S.G., and A.V.P.; writing-original draft preparation, D.M.P. and A.V.P.; writing-review and editing, D.M.P., A.C.L., F.A.A.C., P.H.V.C., and R.S.M; visualization, D.M.P. and A.C.L.; supervision, J.R.S.G. and A.V.P.; project administration, D.M.P., A.C.L., J.R.S.G., and A.V.P., funding acquisition, A.V.P. All authors have read and agreed to the published version of the manuscript.
Funding
This research was partially funded by Elanco Animal Health (Elanco Animal Health, Sao Paulo, Brazil).
Institutional Review Board Statement
The animal care and use committee from the University of São Paulo (CEUA/USP) approved all animal procedures by protocol #5165811516.
Informed Consent Statement
Not applicable.
Data Availability Statement
Not applicable
Conflicts of Interest
The authors declare no conflict of interest.
Abbreviations
The following abbreviations are used in this manuscript:
| ADG | Average daily gain |
| BW | Body weight |
| DMI | Dry matter intake |
| OM | Organic matter |
| CP | Crude protein |
| NDF | Neutral detergent fiber |
| ADF | Acid detergent fiber |
References
- McAllister, T.A.; Stanford, K.; Chaves, A.V.; Evans, P.R.; de Souza Figueiredo, E.E.; Ribeiro, G. Nutrition, feeding and management of beef cattle in intensive and extensive production systems. In Animal agriculture; Elsevier: 2020; pp. 75–98.
- Da Silva, S.C.; Sbrissia, A.F.; Pereira, L.E.T. Ecophysiology of C4 forage grasses—understanding plant growth for optimising their use and management. Agriculture 2015, 5, 598–625. [Google Scholar] [CrossRef]
- Fernandes, L.B.; Franzolin, R. Protein-mineral supplementation with and without additive for grazing tropical beef cattle. Archivos Latinoamericanos de Producción Animal 2013, 21. [Google Scholar]
- Marques, R.D.S.; Cooke, R.F. Effects of Ionophores on Ruminal Function of Beef Cattle. Animals (Basel) 2021, 11. [Google Scholar] [CrossRef]
- de Paula, M.; Marques, R.S.; Pires, A.V.; Soares, L.C.B.; Limede, A.C.; Ferreira, E.M.; Polizel, D.M. Effect of forage quality and narasin inclusion on ruminal fermentation, nutrient intake, and total tract digestibility of Nellore steers. Transl Anim Sci 2024, 8, txae107. [Google Scholar] [CrossRef] [PubMed]
- Polizel, D.M.; Cappellozza, B.I.; Hoe, F.; Lopes, C.N.; Barroso, J.P.; Miszura, A.; Oliveira, G.B.; Gobato, L.; Pires, A.V. Effects of narasin supplementation on dry matter intake and rumen fermentation characteristics of Bos indicus steers fed a high-forage diet. Transl Anim Sci 2020, 4, 118–128. [Google Scholar] [CrossRef]
- Limede, A.C.; Marques, R.S.; Polizel, D.M.; Cappellozza, B.I.; Miszura, A.A.; Barroso, J.P.R.; Storti Martins, A.; Sardinha, L.A.; Baggio, M.; Pires, A.V. Effects of supplementation with narasin, salinomycin, or flavomycin on performance and ruminal fermentation characteristics of Bos indicus Nellore cattle fed with forage-based diets. J Anim Sci 2021, 99. [Google Scholar] [CrossRef] [PubMed]
- Miszura, A.A.; Marques, R.S.; Polizel, D.M.; Cappellozza, B.I.; Cruz, V.A.; Ogg, M.A.; Barroso, J.P.R.; Oliveira, G.B.; Martins, A.S.; Limede, A.C.; et al. Effects of lasalocid, narasin, or virginiamycin supplementation on rumen parameters and performance of beef cattle fed forage-based diet. J Anim Sci 2023, 101. [Google Scholar] [CrossRef]
- Gobato, L.G.M.; Polizel, D.M.; Júnior, M.V.d.C.F.; Miszura, A.A.; Barroso, J.P.R.; Martins, A.S.; Gonçalves, J.R.S.; Ferreira, E.M.; Pires, A.V. Suplementação de gado de corte em pastejo com narasina. Pesquisa Agropecuária Brasileira 2020, 55, 01270. [Google Scholar]
- McCarthy, K.L.; Underdahl, S.R.; Undi, M.; Dahlen, C.R. Using precision tools to manage and evaluate the effects of mineral and protein/energy supplements fed to grazing beef heifers. Transl Anim Sci 2023, 7, txad013. [Google Scholar] [CrossRef]
- Alvares, C.A.; Stape, J.L.; Sentelhas, P.C.; Gonçalves, J.d.M.; Sparovek, G. Köppen’s climate classification map for Brazil. Meteorologische zeitschrift 2013, 22, 711–728. [Google Scholar] [CrossRef]
- Howitz, W.; Horwitz, W.; International, A. Official methods of analysis of AOAC International, 17th edition. ed.; AOAC International: Gaithersburg, Md, 2000. [Google Scholar]
- Association of Official Analytical, C. The 111th AOAC international annual meeting & exposition; AOAC: 1997.
- Van Soest, P.J.; Robertson, J.B.; Lewis, B.A. Methods for dietary fiber, neutral detergent fiber, and nonstarch polysaccharides in relation to animal nutrition. J Dairy Sci 1991, 74, 3583–3597. [Google Scholar] [CrossRef]
- Goering, H.K.; Van Soest, P.J. Forage fiber analysis (apparatus reagents, and some applications); United States Department of Agriculture: Washington, DC, 1970. [Google Scholar]
- Ellis, J.L.; Dijkstra, J.; Bannink, A.; Kebreab, E.; Hook, S.E.; Archibeque, S.; France, J. Quantifying the effect of monensin dose on the rumen volatile fatty acid profile in high-grain-fed beef cattle. J Anim Sci 2012, 90, 2717–2726. [Google Scholar] [CrossRef] [PubMed]
- Duffield, T.F.; Merrill, J.K.; Bagg, R.N. Meta-analysis of the effects of monensin in beef cattle on feed efficiency, body weight gain, and dry matter intake. J Anim Sci 2012, 90, 4583–4592. [Google Scholar] [CrossRef]
- Golder, H.M.; Lean, I.J. A meta-analysis of lasalocid effects on rumen measures, beef and dairy performance, and carcass traits in cattle. J Anim Sci 2016, 94, 306–326. [Google Scholar] [CrossRef] [PubMed]
- Goodrich, R.D.; Garrett, J.E.; Gast, D.R.; Kirick, M.A.; Larson, D.A.; Meiske, J.C. Influence of monensin on the performance of cattle. J Anim Sci 1984, 58, 1484–1498. [Google Scholar] [CrossRef]
- Leiva, T.; Cooke, R.F.; Lasmar, P.V.F.; Valarelli, R.L.; De Simas, J.M.C.; Zapa, D.M.B.; Couto, L.F.M.; Heller, L.M.; Lopes, W.D.Z. Supplementing narasin or monensin to control coccidiosis in naturally infected calves. Transl Anim Sci 2024, 8, txae069. [Google Scholar] [CrossRef]
- de Assis, R.G.; Biava, J.S.; Polizel, D.M.; de Souza, T.T.; Sturion, T.U.; Pires, A.V.; Relling, A.E.; Ferreira, E.M. Use of narasin in diets for lactating ewes. Small Ruminant Research 2020, 187, 106108. [Google Scholar] [CrossRef]
- Martins, A.S.; Polizel, D.M.; Oliveira, G.B.; Barroso, J.P.R.; Ferraz Jr, M.V.d.C.; Miszura, A.A.; Baggio, M.; Ferreira, E.M.; Pires, A.V. Narasin improves ewe milk yield efficiency and may affect performance of lambs. Scientia Agricola 2021, 79, e20200334. [Google Scholar] [CrossRef]
- Sardinha, L.A.; Marques, R.S.; Miszura, A.A.; Barroso, J.P.R.; Oliveira, G.B.; Martins, A.S.; Limede, A.C.; Ferraz, M.V.C., Jr.; Ferreira, E.M.; Pires, A.V.; et al. Milk yield and composition from ewes fed diets containing narasin and their lambs' performance. Transl Anim Sci 2020, 4, txaa030. [Google Scholar] [CrossRef]
- Polizel, D.M.; Sardinha, L.A.; Limede, A.C.; Miszura, A.A.; Barroso, J.P.R.; Sturion, T.U.; Soares, L.C.B.; Marques, R.S.; Biava, J.S.; Junior, M.V.d.C.F. Effect of narasin supplementation on performance of lambs fed high-forage diets. Small Ruminant Research 2021, 205, 106549. [Google Scholar] [CrossRef]
- Bretschneider, G.; Elizalde, J.; Pérez, F. The effect of feeding antibiotic growth promoters on the performance of beef cattle consuming forage-based diets: A review. Livestock Science 2008, 114, 135–149. [Google Scholar] [CrossRef]
- McDowell, L.R. Feeding minerals to cattle on pasture. Animal feed science and technology 1996, 60, 247–271. [Google Scholar] [CrossRef]
- Abal, R.T. Desempenho de novilhos Nelore em pastagem suplementados com diferentes aditivos. 2016.
- Franco, F.M.J. Consumo de monensina sódica via suplemento mineral por bovinos de corte em pastagens. 2008.
- da Silva, R.G. Efeito da adição de narasina na mistura mineral sobre o desempenho de novilhas Nelore. 2016.
- Cappellozza, B.I.; Lasmar, P.V.F.; Reis, F.T.; Oliveira, L.; Hoe, F.; Boehler, R.M.; Leibovich, J.; Starkey, R.; Simas, J.; Cooke, R.F. Effects of supplement type and narasin inclusion on supplement intake by Bos indicus beef bulls grazing a warm-season forage. Transl Anim Sci 2019, 3, 263–273. [Google Scholar] [CrossRef] [PubMed]
- Oliveira, G.B.; Polizel, D.M.; Bertoloni, A.V.; Ferraz, M.V.; Miszura, A.A.; Barroso, J.P.; Martins, A.S.; Pasqualino, L.F.; Biava, J.S.; Ferreira, E.M. Frequency of narasin intake affects ruminal metabolism and growth of lambs. Animal Production Science 2022, 62, 844–850. [Google Scholar] [CrossRef]
- Soares, L.C.B.; Marques, R.S.; Vaz Pires, A.; Alves Cruz, V.; Anne Ogg, M.; Cintra Limede, A.; Junior, P.; Dos Santos, I.J.; de Assis, R.G.; Gouvea, V.N.; et al. Residual effect of narasin on feed intake and rumen fermentation characteristics in Nellore steers fed forage-based diet. Transl Anim Sci 2023, 7, txad027. [Google Scholar] [CrossRef]
- Pasqualino, L.F.; Oliveira, G.B.; Miszura, A.A.; Barroso, J.P.R.; Limede, A.C.; Sardinha, L.A.; Biava, J.S.; Ferreira, E.M.; Pires, A.V.; Polizel, D.M. Residual effect of narasin on ruminal fermentation characteristics in lambs. Livestock Science 2020, 240, 104141. [Google Scholar] [CrossRef]
Figure 1.
Forage mass availability at the entrance (d 0) and exit of animals (d 28) during Experiment 1. There was no period effect for the availability at the entrance (P = 0.11; Table 1), however, the availability of mass at the exit was greater in period 3 in relation to the other periods (P < 0.01). Total forage availability in the paddocks was assessed at the entry and exit of the animals, i.e., on d 1 and 28 of each period, respectively. The quantitative samples were harvested close to the ground using 0.25-m2 metallic frames (0.5 × 0.5 m) placed on the representative sites. The samples obtained were sent to the laboratory for subsequent determination of the dry matter content and calculation of forage availability per hectare.
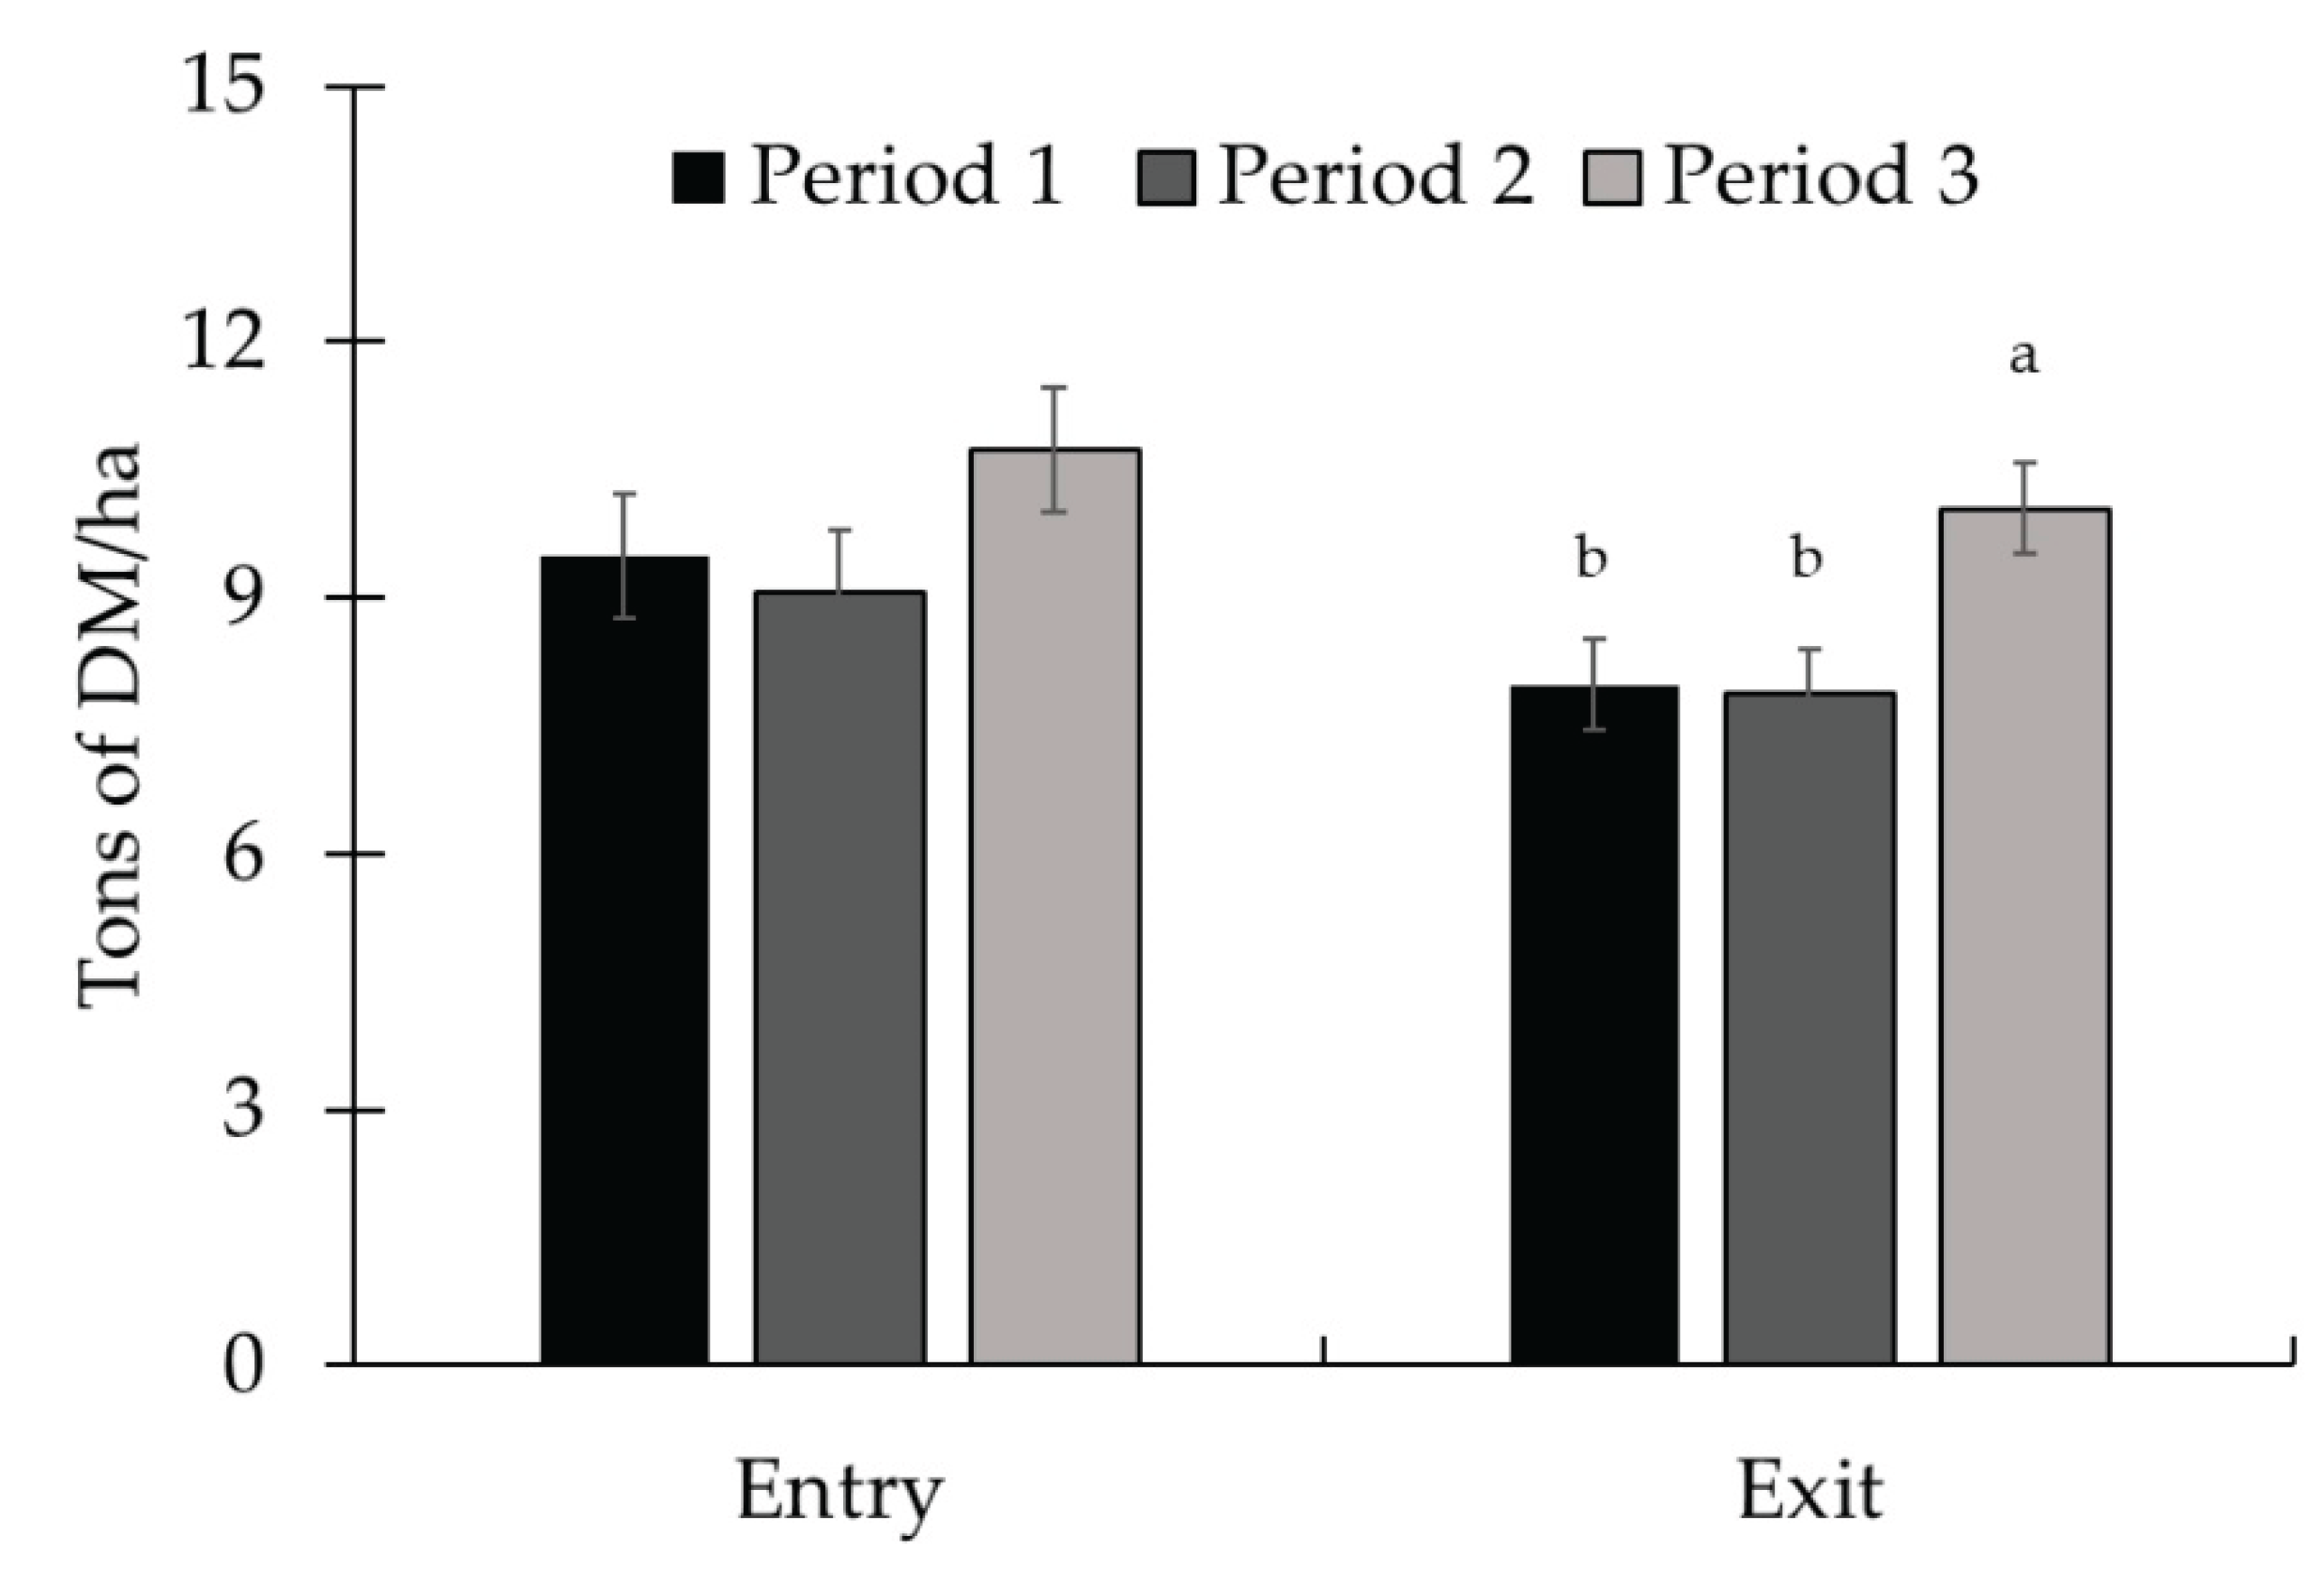
Figure 2.
Chemical composition of pasture throughout Experiment 1. There was no effect of period for dry matter (DM) and organic matter (OM) content (P ≥ 0.39). Crude protein (CP) content was higher in periods 2 and 3 (P < 0.01). Neutral detergent fiber (NDF) and acid detergent fiber (ADF) content decreased throughout the experimental periods (P < 0.01). To assess the quality of the forage available in the paddocks, on d 14 of each experimental period, a sample was obtained per paddock through simulated grazing. The DM was determined by drying the samples at 105 °C in an oven for 24 h (AOAC, 1997), and the ash content was determined by burning the samples in a muffle furnace at 550 °C (AOAC, 1997). The OM was calculated using the equation: OM = 100 – ash. Total nitrogen determination was performed using a LECO TruMac N (Leco Corporation; Saint Joseph, MI, USA; AOAC, 1997) and the CP was obtained by multiplying the total N content by 6.25. The NDF (Van Soest et al., 1991) and ADF (Goering and Van Soest, 1970) were determined using an Ankom 2000 fiber analyzer (Ankom Tech. Corp., Macedon, NY, USA). Sodium sulfite and heat-stable α-amylase were added in the NDF analysis.
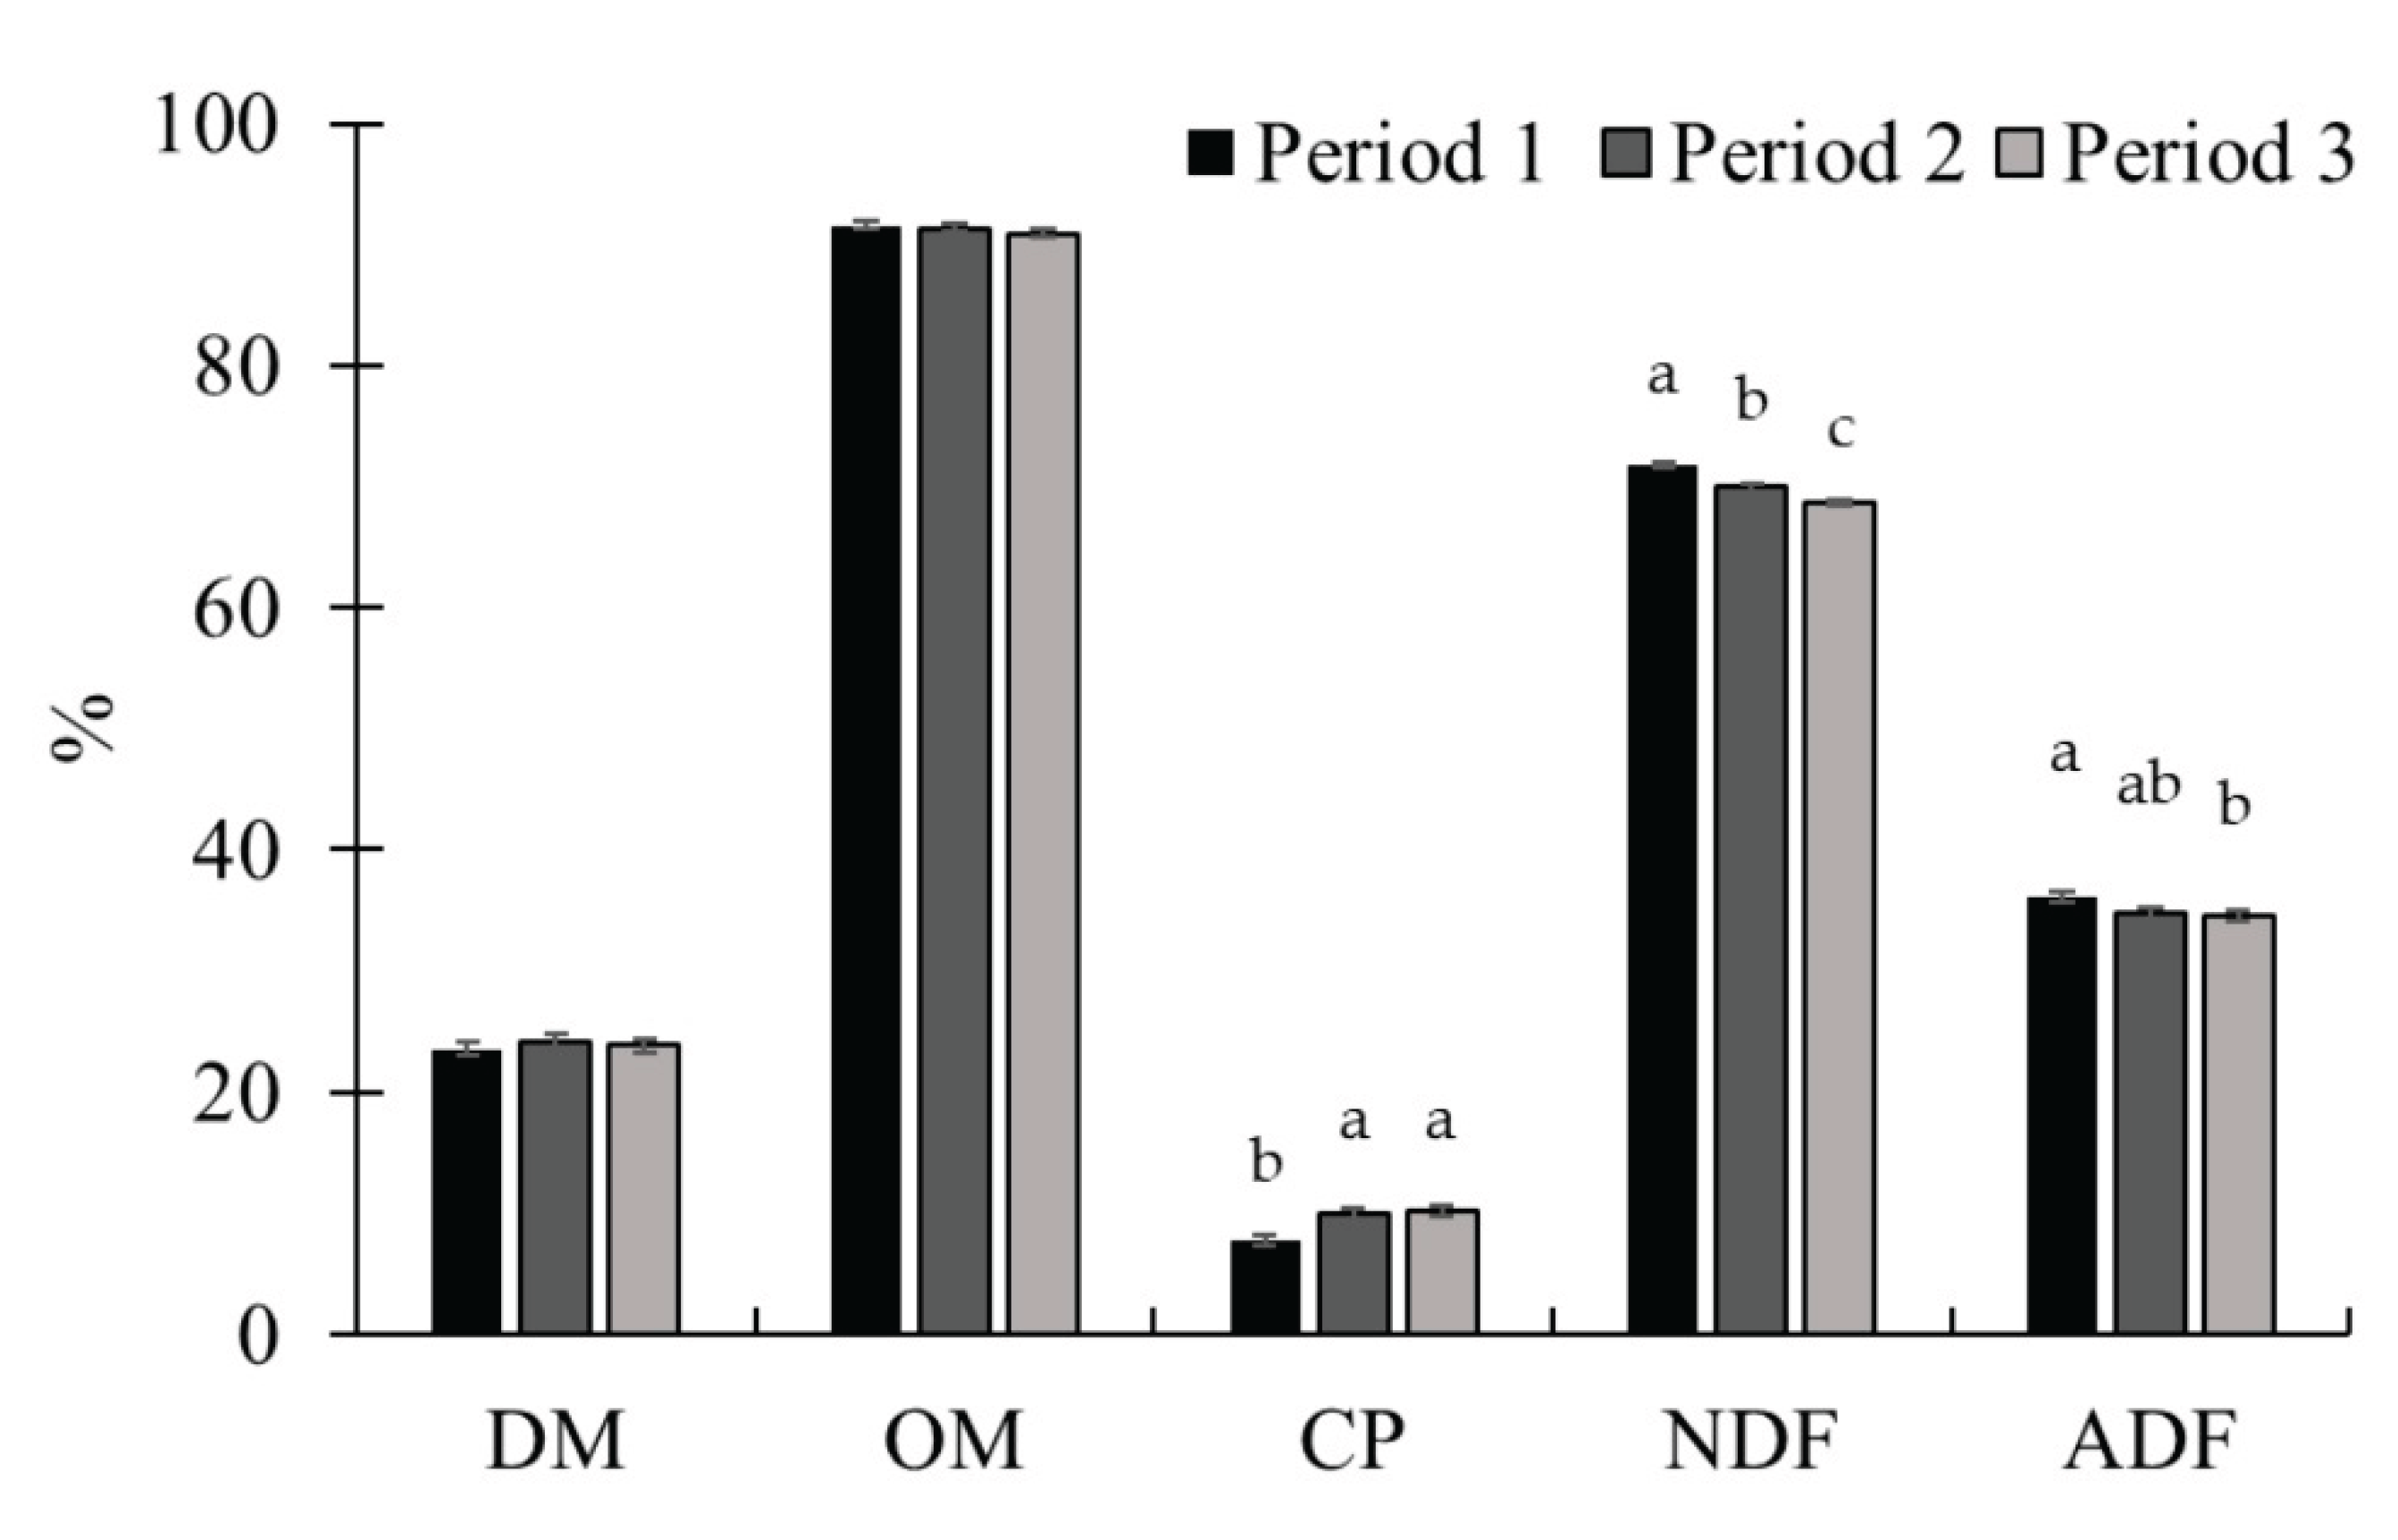
Figure 3.
Average daily gain during the experimental periods (Exp. 01). There was a period effect for average daily gain (ADG), with the largest gains observed in periods 2 and 3 (P < 0.01). The animals were weighed at the beginning of the experiment (d 0) and at the end of each period (d 28, 56, and 84) after a 16-hour of feed and water withdrawal, using the idBeck 3.0 electronic scale (Irmãos Beckhauser e Cia Ltda, Paranavaí, PR, Brazil). The ADG (kg/d) was calculated by dividing the gain obtained by the duration of each period (28 d).
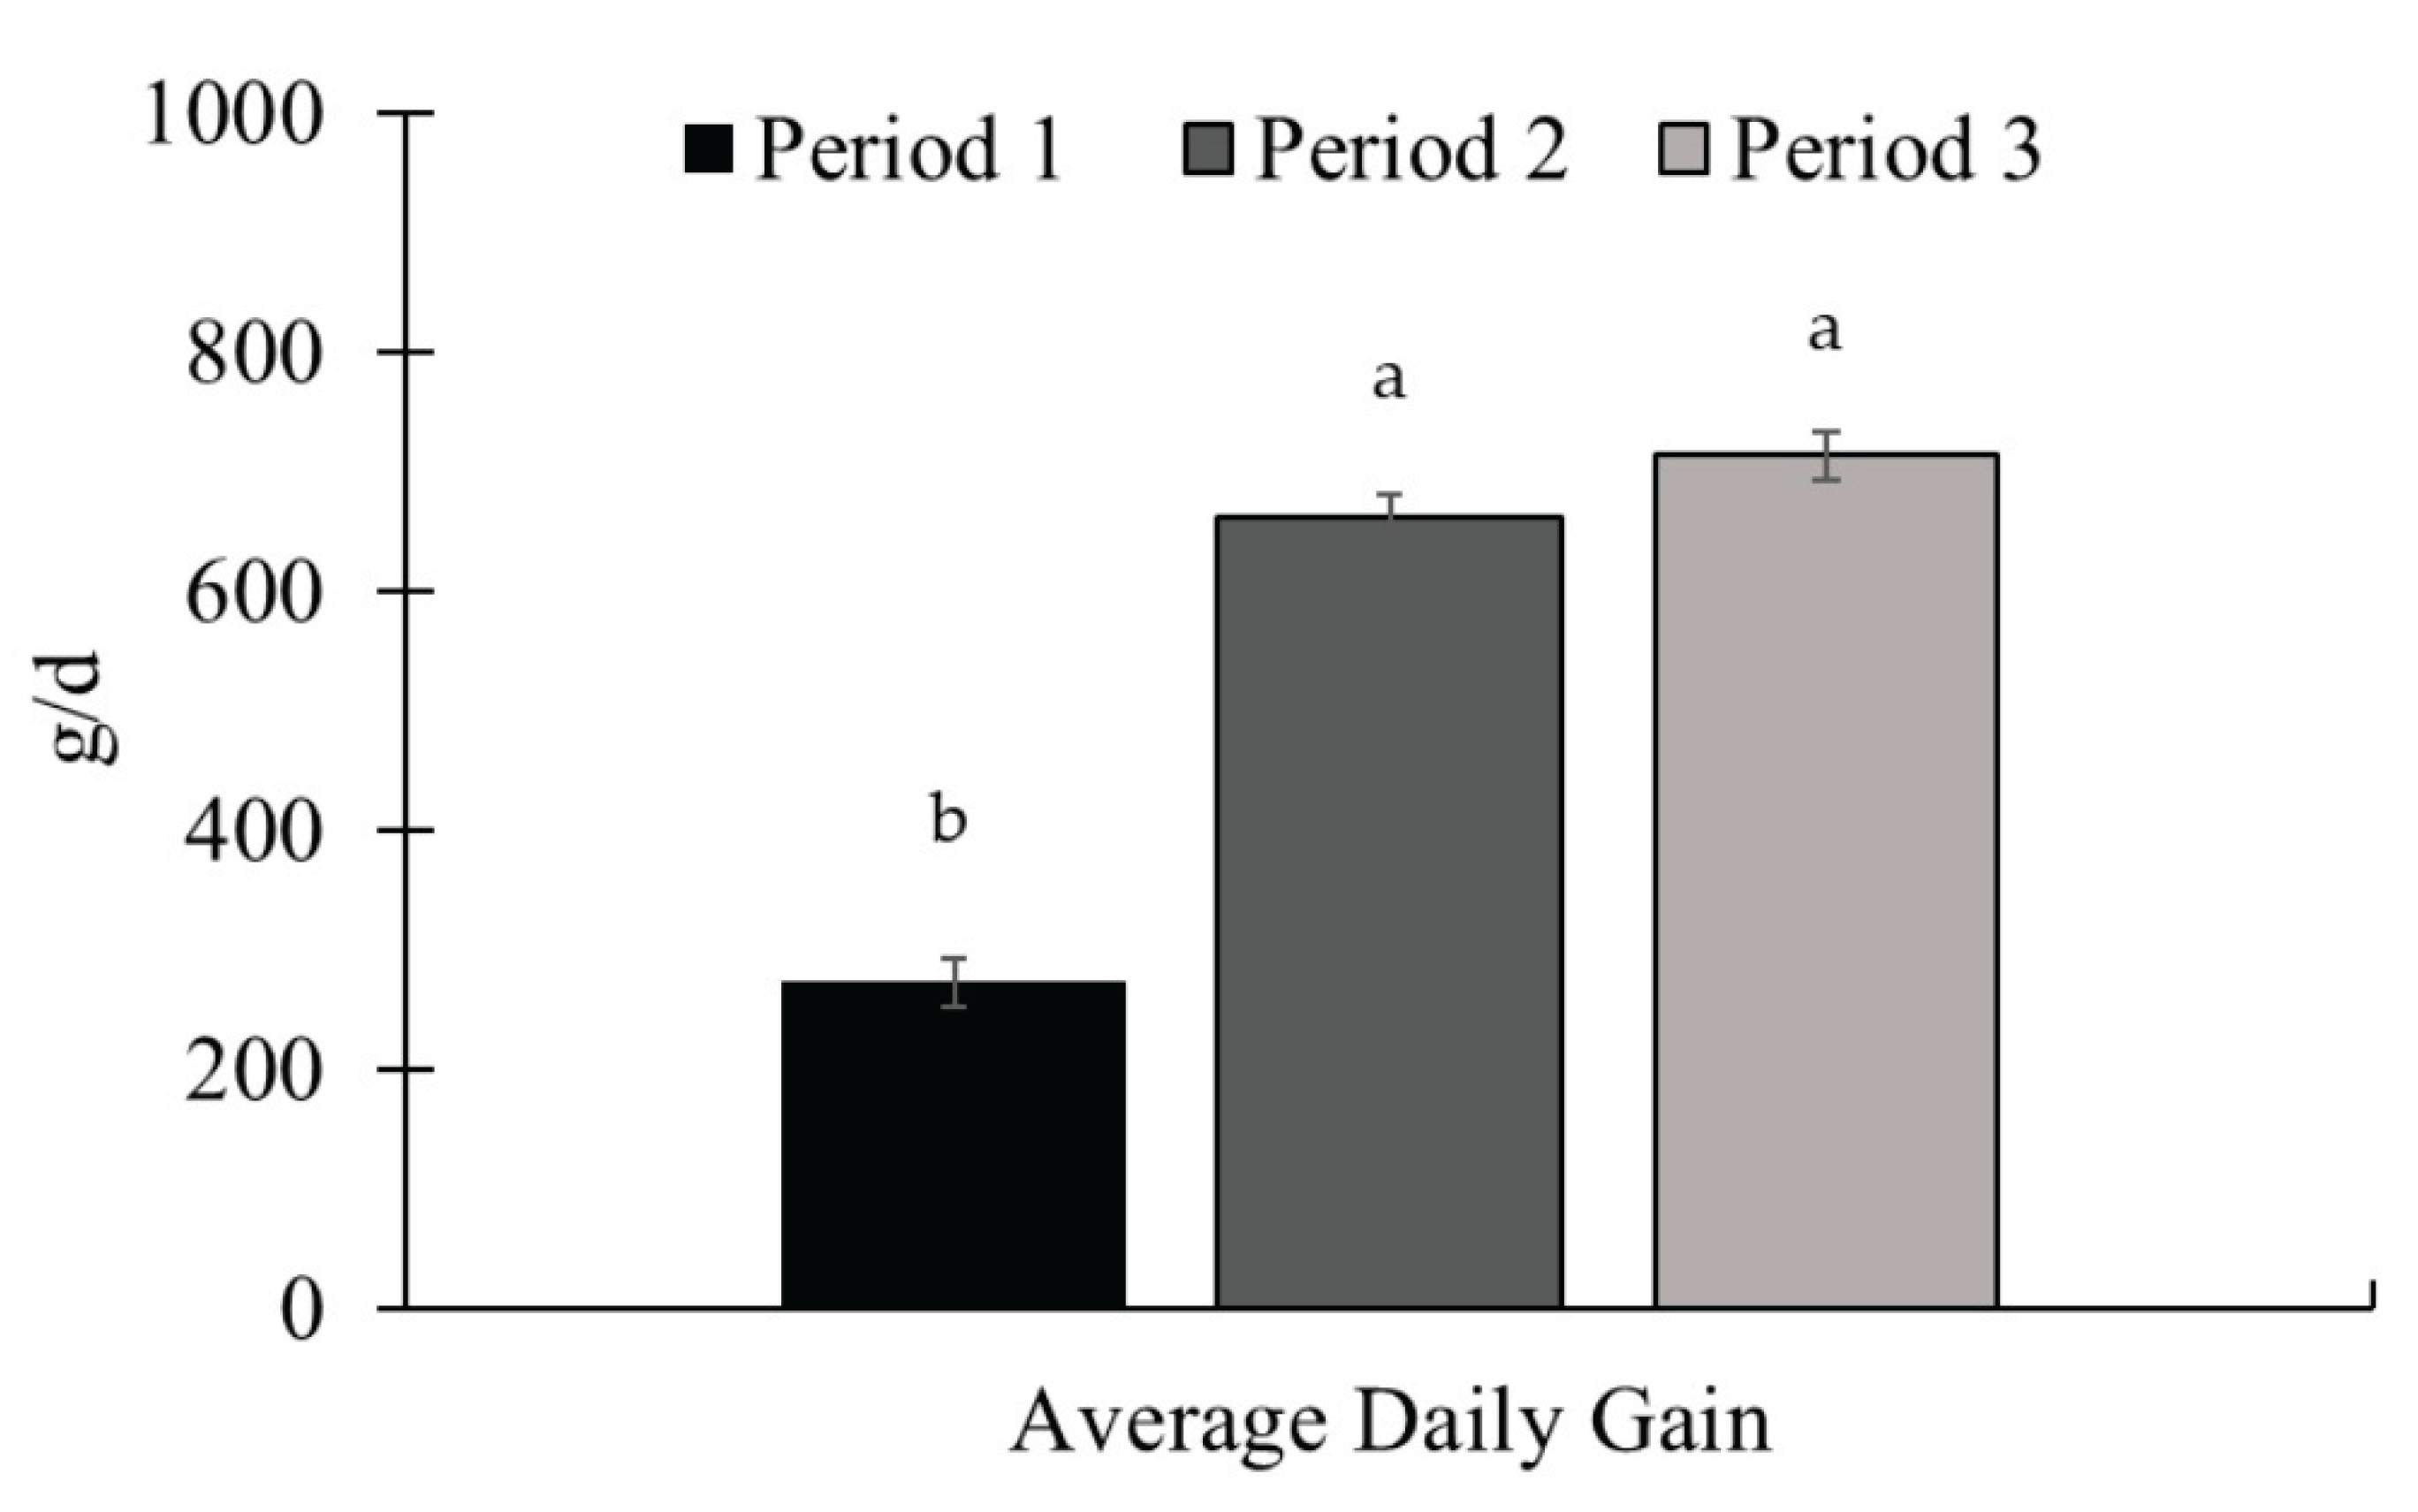
Figure 4.
Mineral supplement intake throughout Exp. 1. There was an increase in supplement intake between the experimental periods (P < 0.01). The supplement was provided once a week, as well as the measurement of the refusal. The amount of supplement offered, and the refusal were quantified on the 1.0-g accuracy Toledo 9094C/4 electronic scale (Toledo do Brasil, São Bernardo do Campo, SP, Brazil). Supplements were offered in quantities sufficient to ensure at least 10% refusals, thereby permitting ad libitum intake. Samples of the supplement offered, and the leftovers were collected to determine the dry matter content (AOAC, 2000) for later calculation of the average supplement intake in the dry matter.
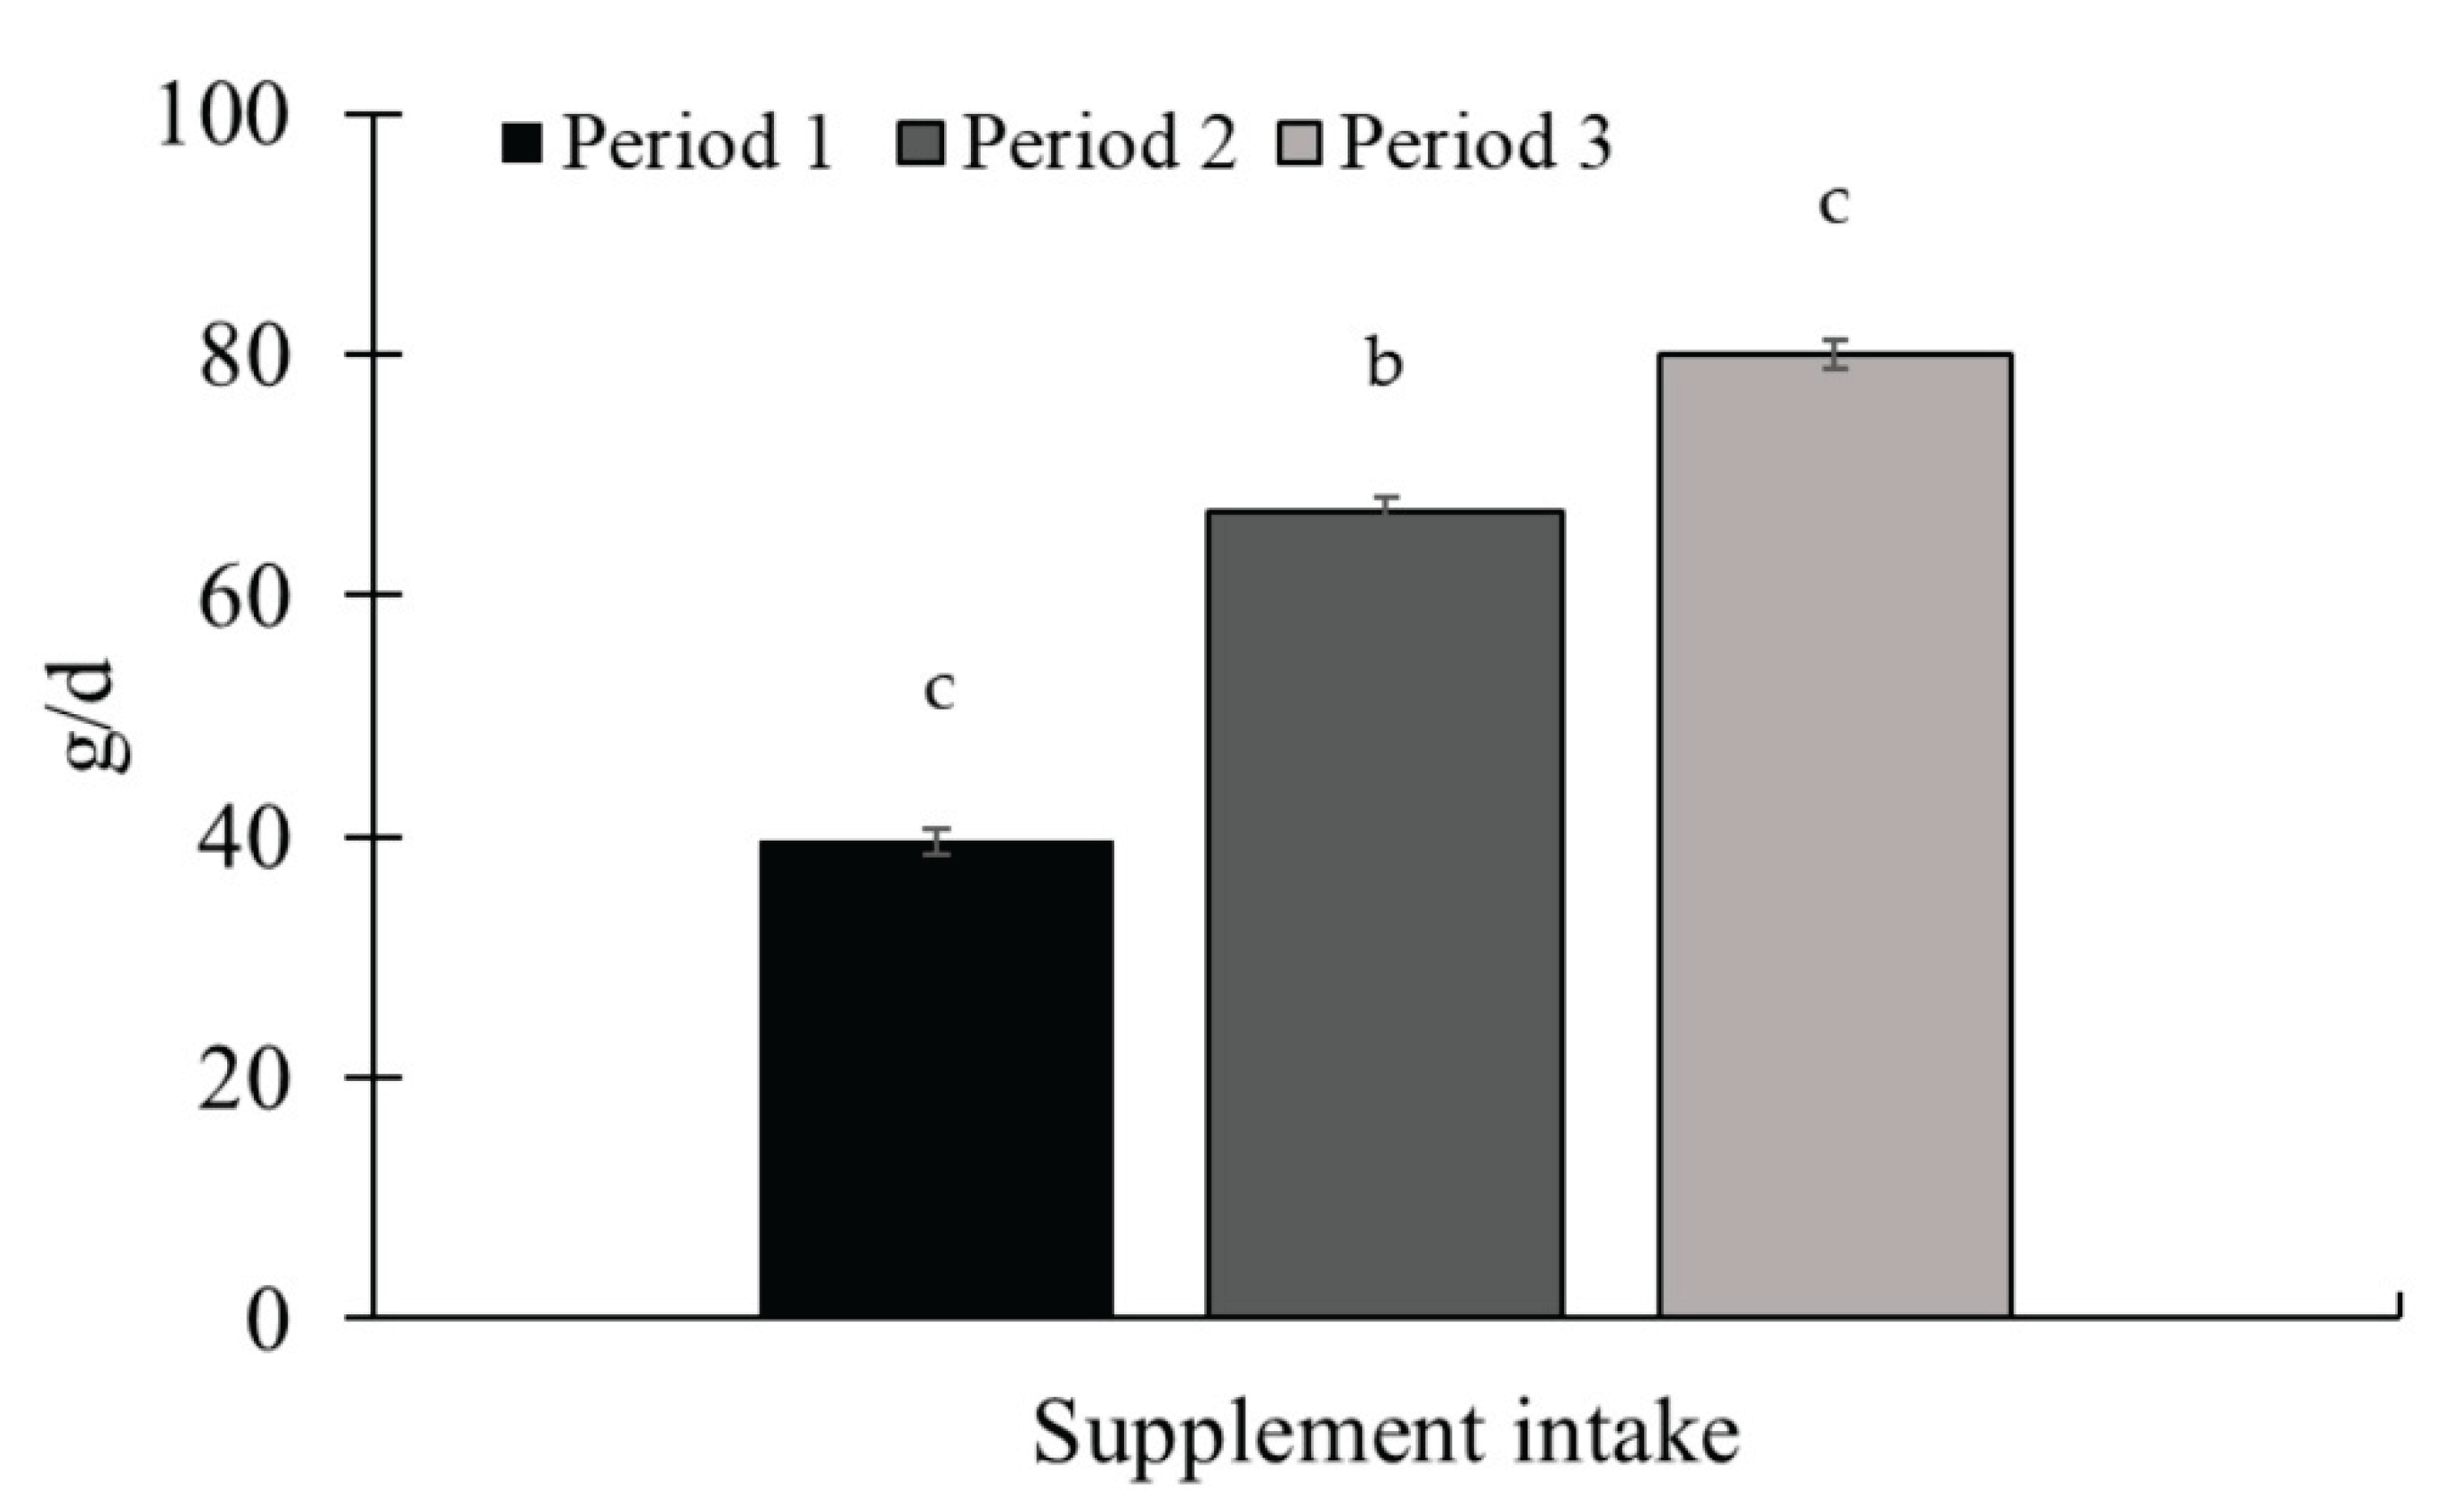
Figure 5.
Availability of forage mass at the entrance (d 0) and exit of the animals of the paddock (d 28) throughout Exp. 2. There was no period effect (P ≥ 0.10) on forage mass availability. Total forage availability in the paddocks was assessed at the entry and exit of the animals, on d 1 and 28 of each period, respectively. The quantitative samples were harvested close to the ground using 0.25-m2 metallic frames (0.5 × 0.5 m) placed on the representative sites. The samples obtained were sent to the laboratory for subsequent determination of the dry matter content and calculation of forage availability per hectare.
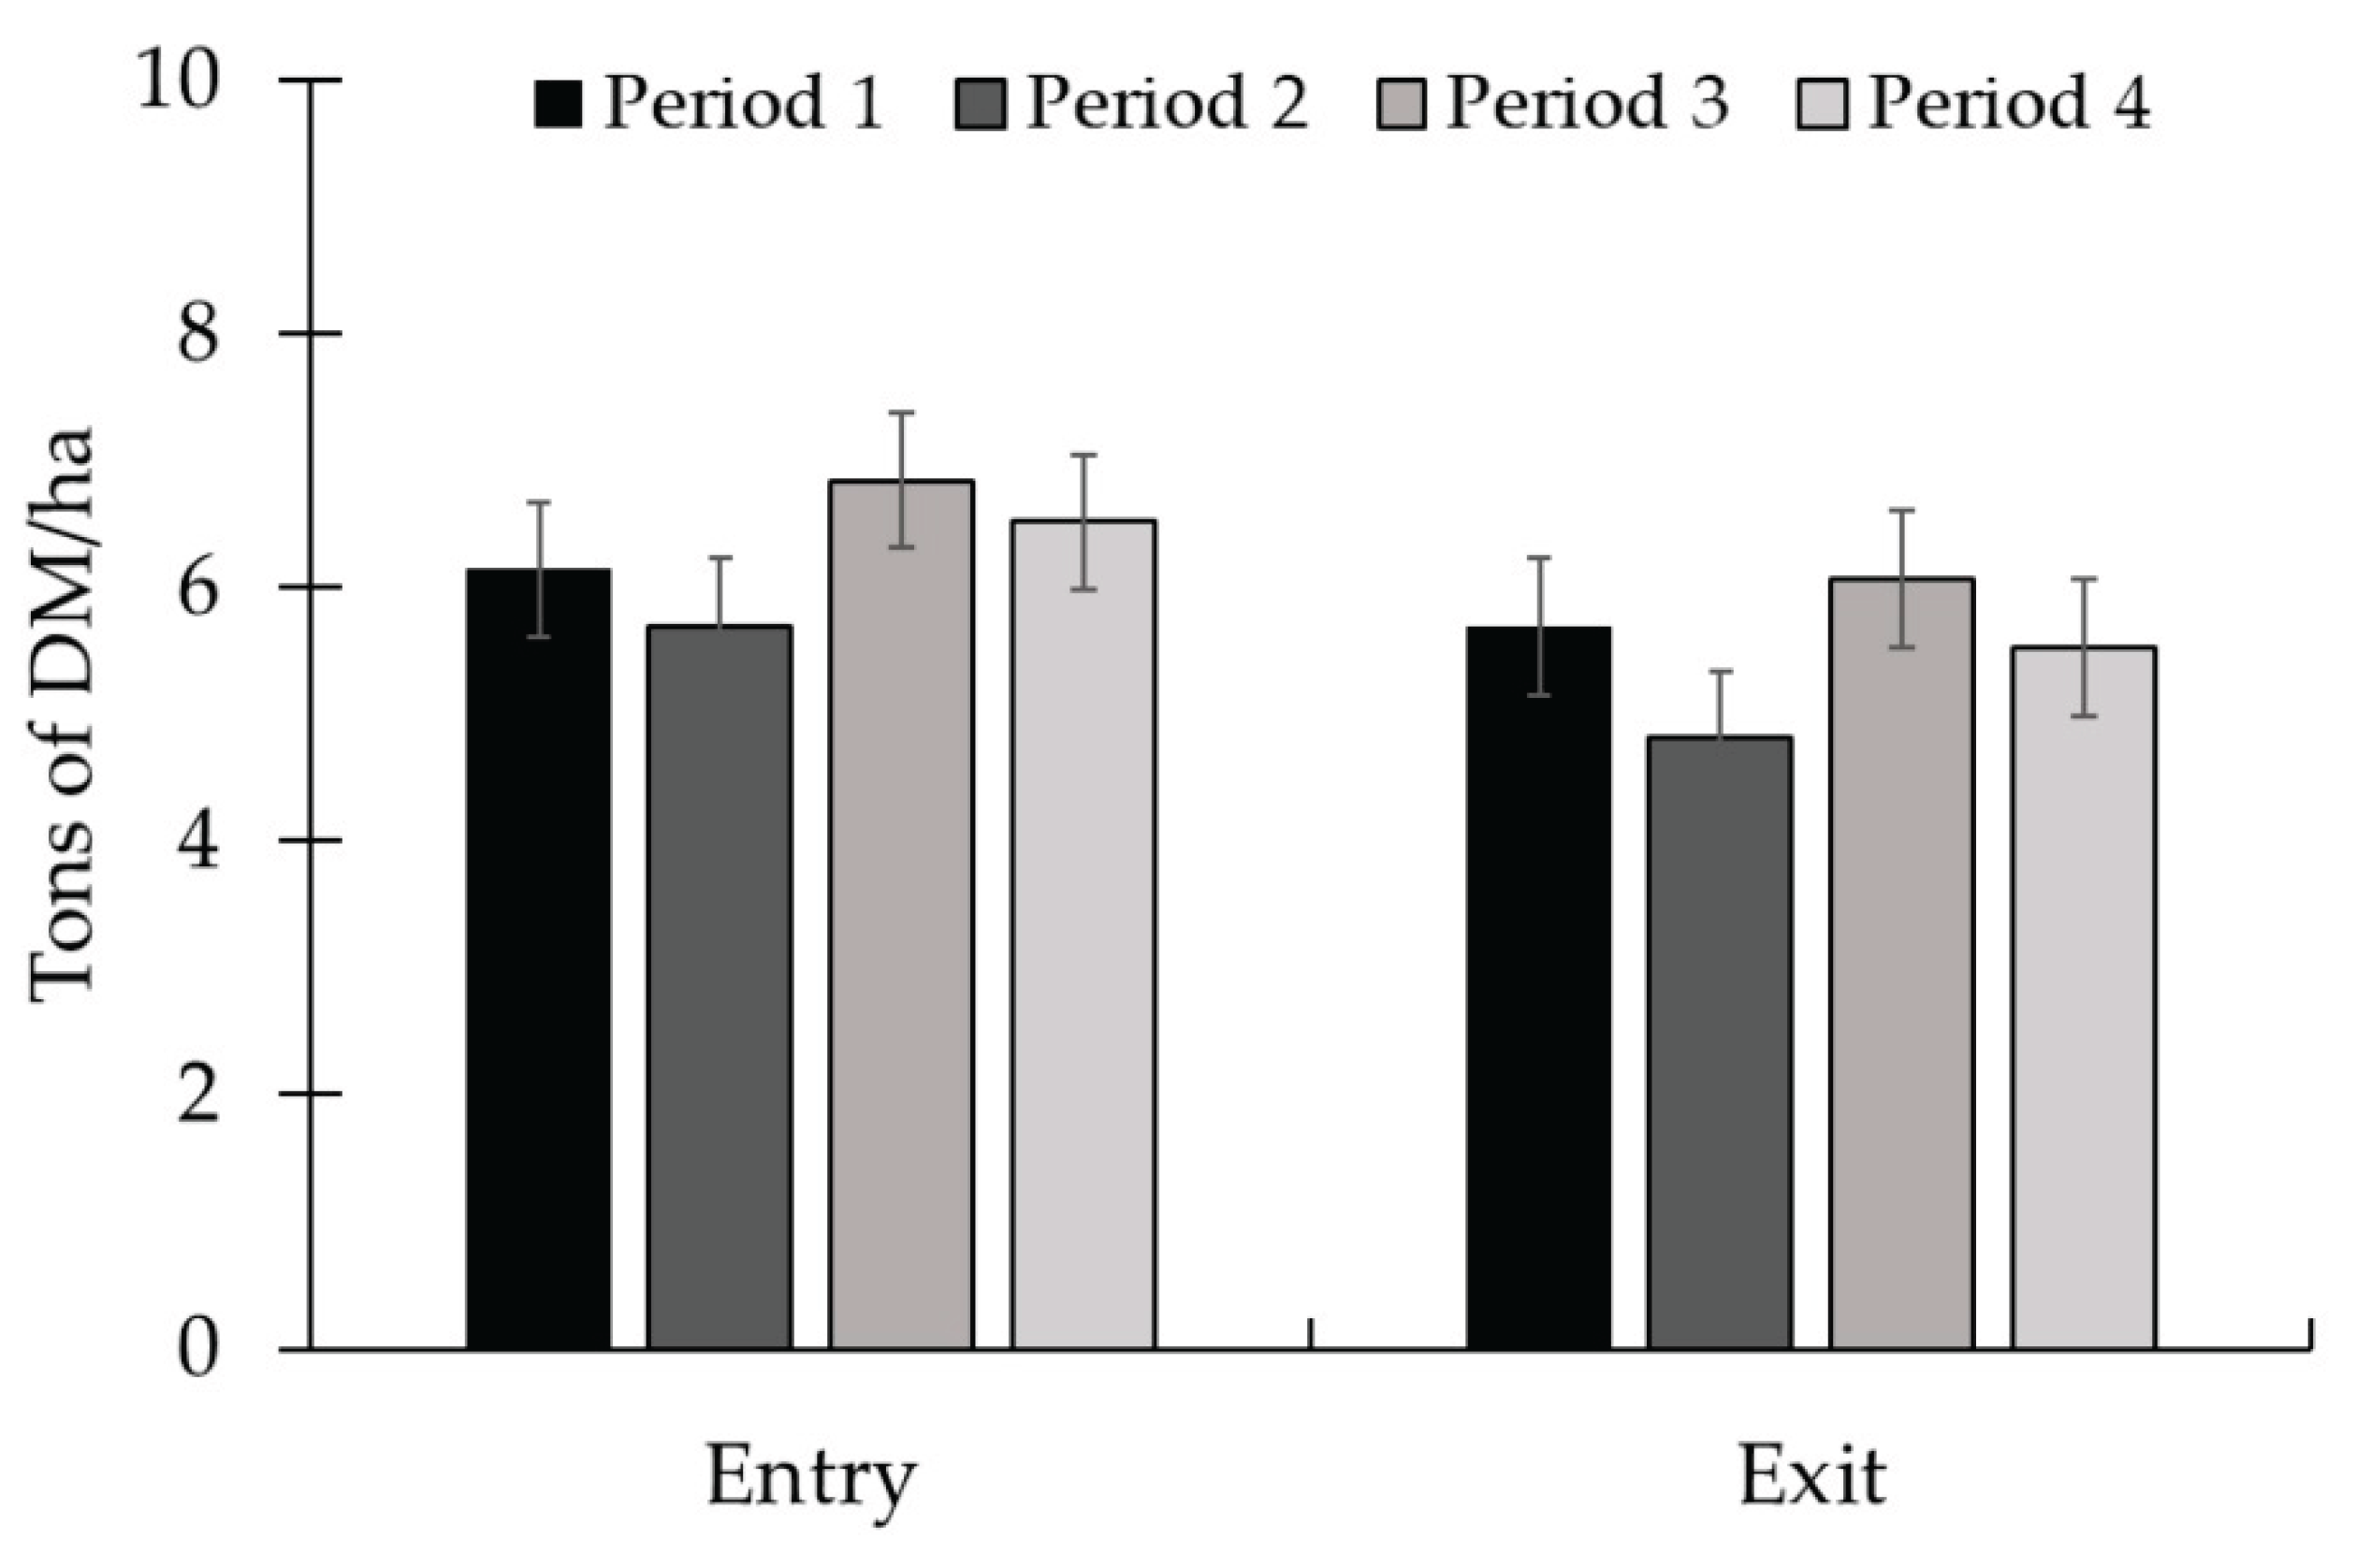
Figure 6.
Chemical composition of pasture in experimental periods (Exp. 2). There was no period effect on dry matter (DM) content. The highest organic matter (OM) content was observed in period 2 (P < 0.01). The crude protein (CP) content increased throughout the experiment (P < 0.01). The highest neutral detergent fiber (NDF) and acid detergent fiber (ADF) contents were observed in period 1, and the lowest were observed in periods 2 and 4 (P < 0.01). To assess the quality of the forage available in the paddocks, on d 14 of each experimental period, a sample was obtained per paddock through simulated grazing. The DM was determined by drying the samples at 105 °C in an oven for 24 h (AOAC, 1997), and the ash content was determined by burning the samples in a muffle furnace at 550 °C (AOAC, 1997). The OM was calculated using the equation: OM = 100 – ash. Total nitrogen determination was performed using a LECO TruMac N (Leco Corporation; Saint Joseph, MI, USA; AOAC, 1997) and the CP was obtained by multiplying the total N content by 6.25. The NDF (Van Soest et al., 1991) and ADF (Goering and Van Soest, 1970) was determined using as Ankom 2000 fiber analyzer (Ankom Tech. Corp. Macedon, NY, USA). Sodium sulfite and heat-stable α-amylase were added in the NDF analysis.
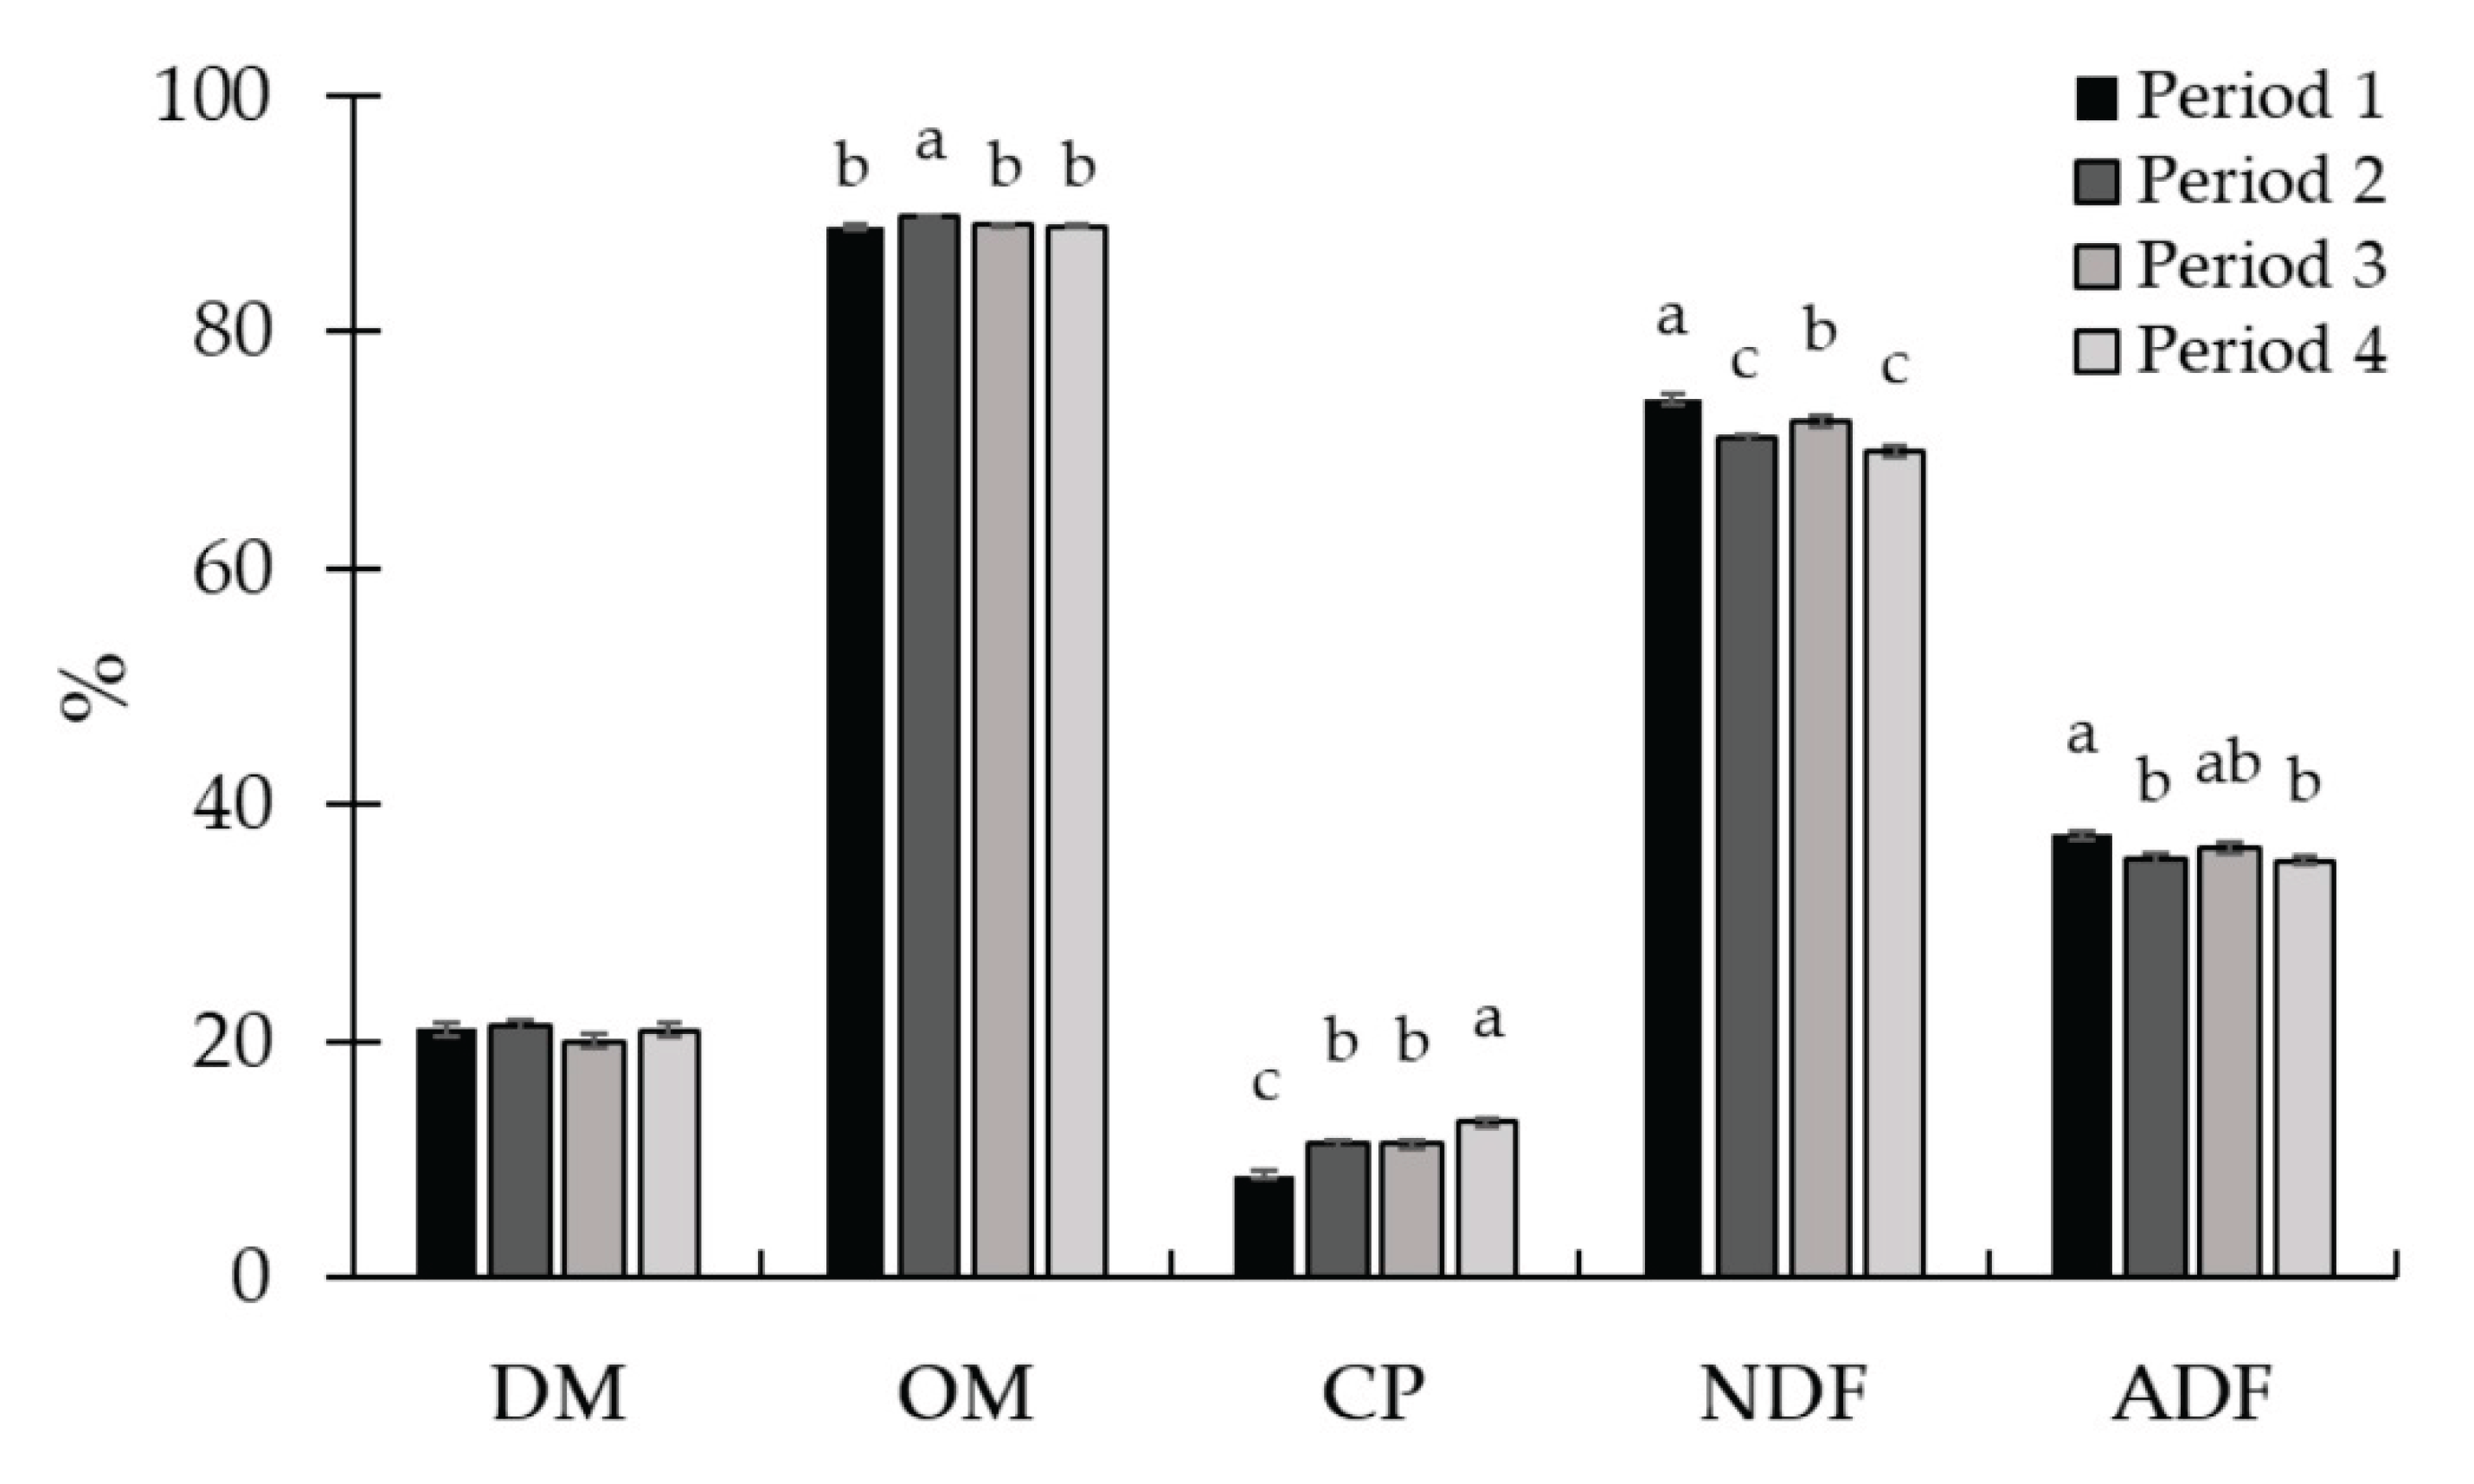
Figure 7.
Average daily gain in the experimental periods (Exp. 2). There was a period effect (P < 0.01) with the highest gains observed in periods 3 and 4, and the lowest ADG observed in period 1. The animals were weighed at the beginning of the experiment (d 0) and at the end of each period (d 28, 56, 84, and 112) after a 16-hour of feed and water withdrawal, using the idBeck 3.0 electronic scale (Irmãos Beckhauser e Cia Ltda, Paranavaí, PR, Brazil). The ADG (kg/d) was calculated by dividing the gain obtained by the duration of each period (28d).
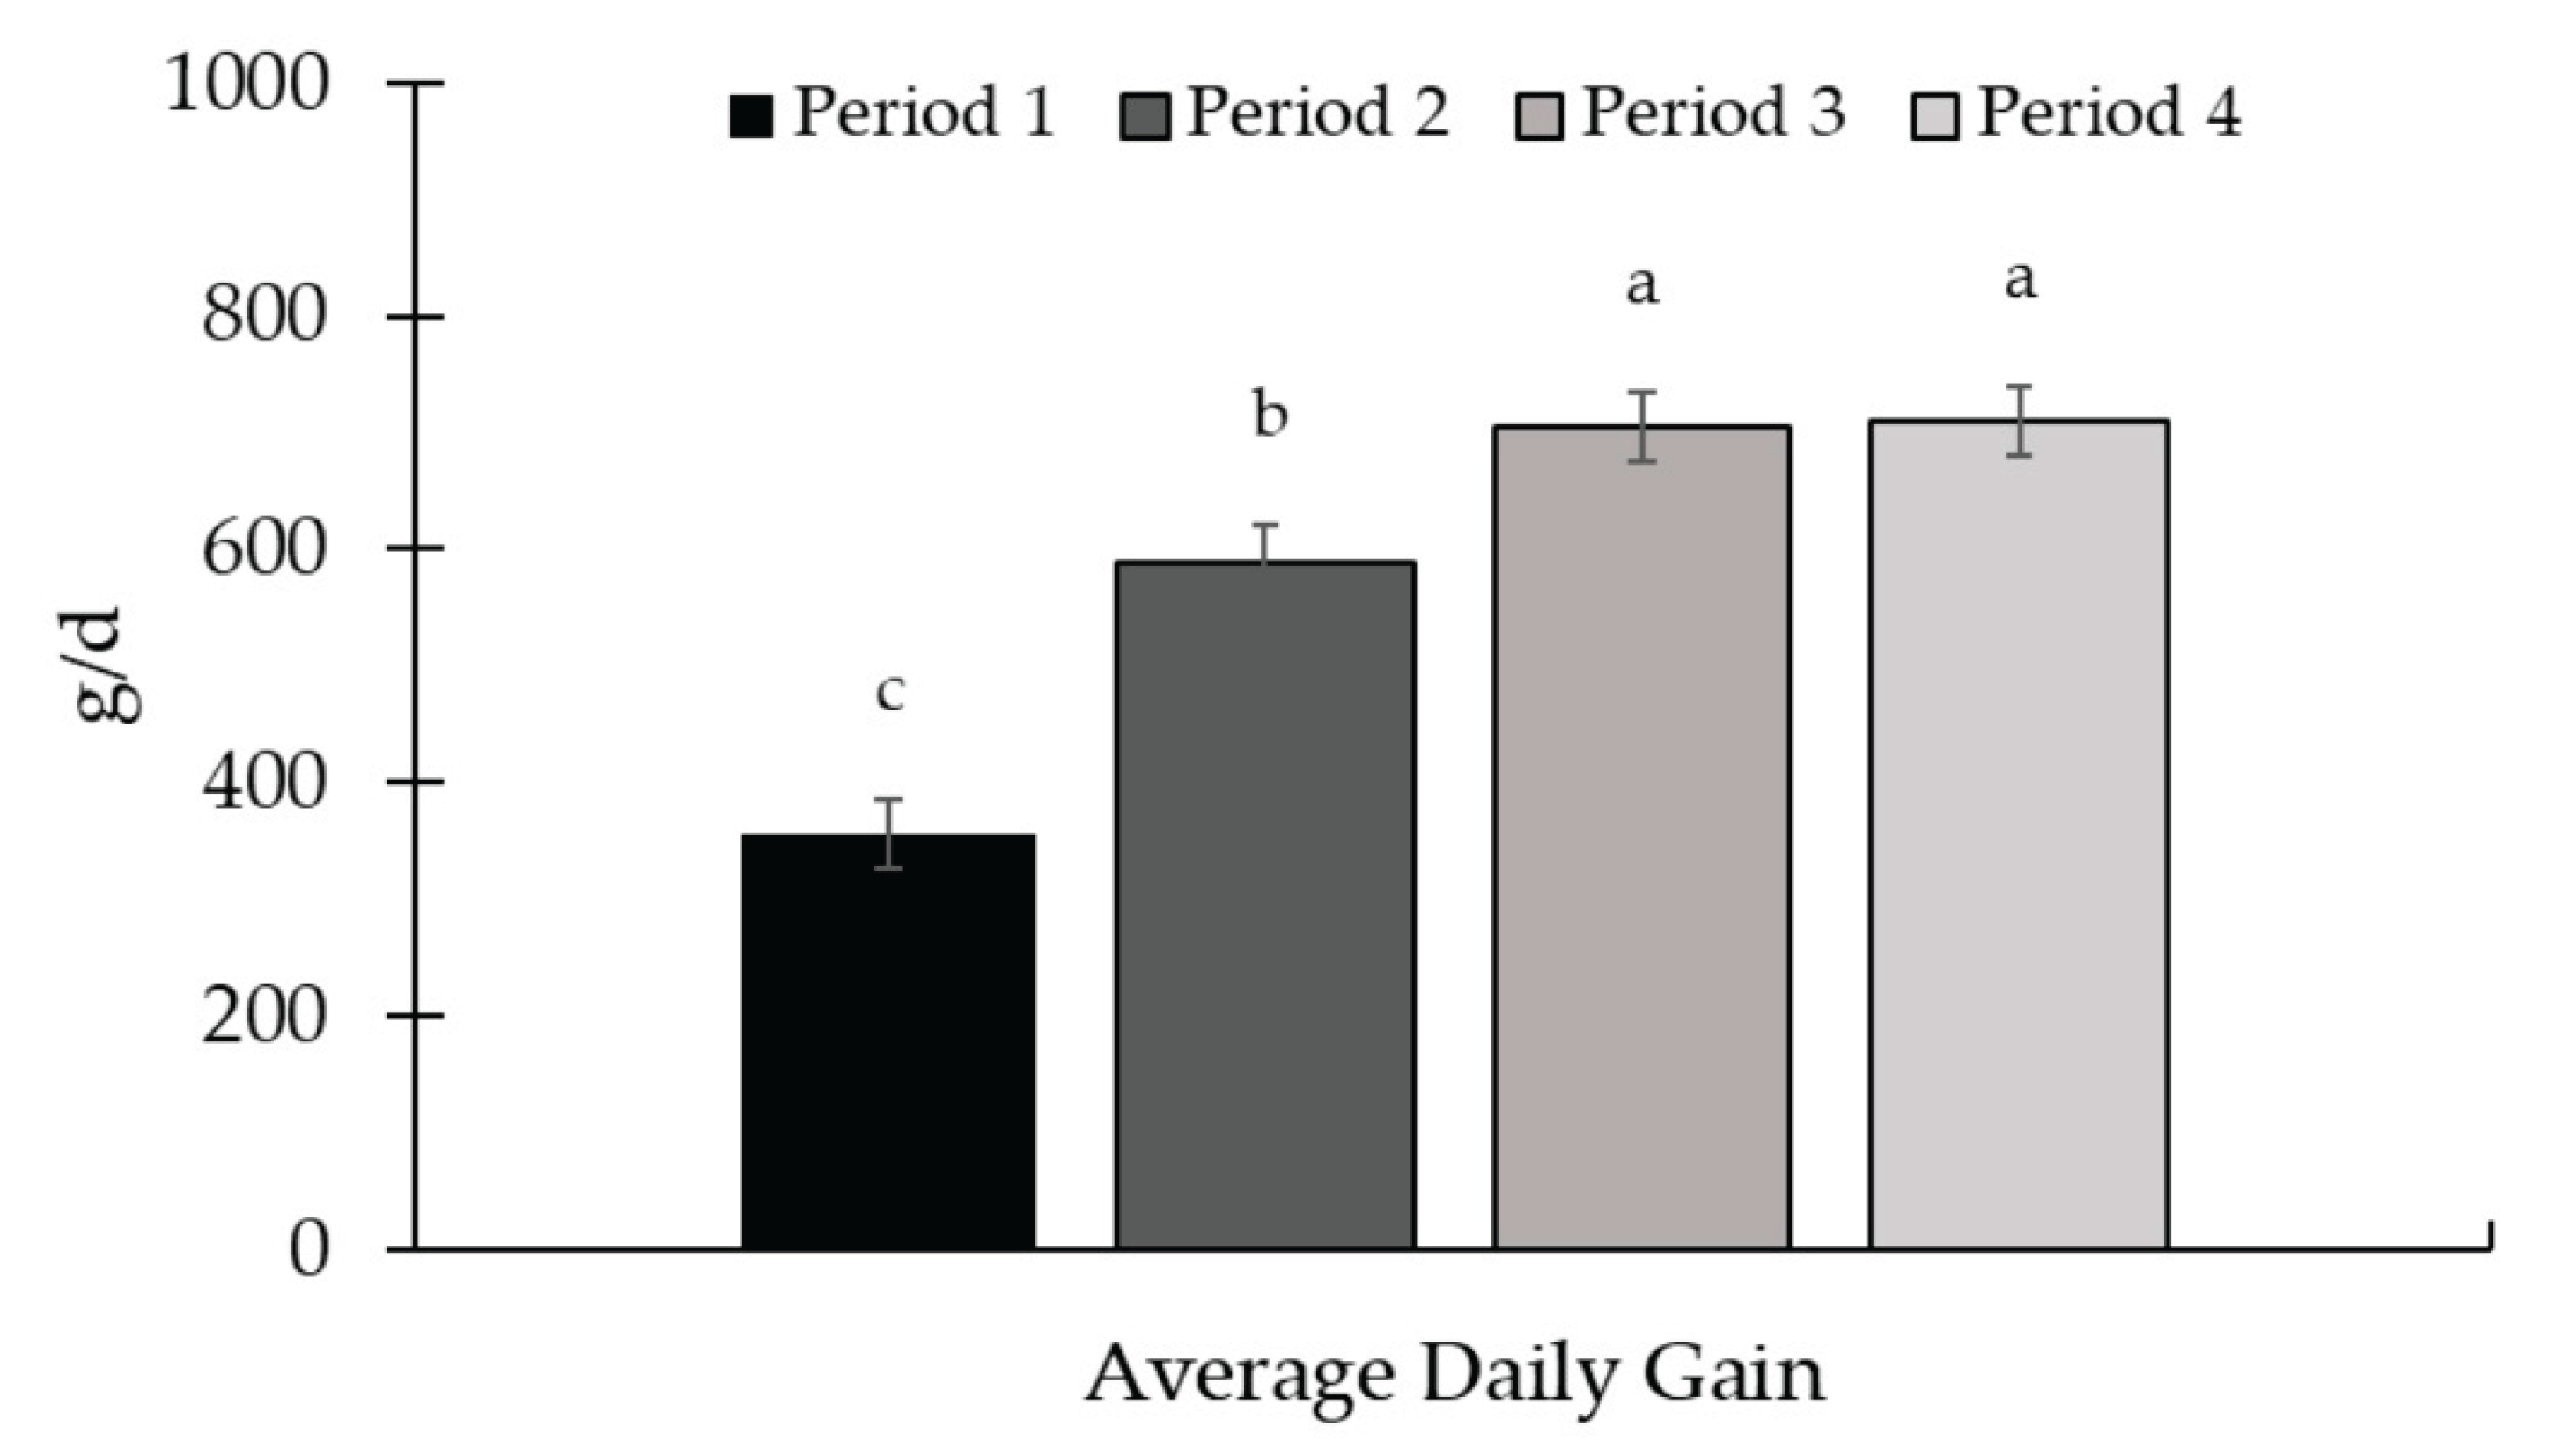
Figure 8.
Mineral supplement intake throughout the Exp. 2. There was a period effect (P < 0.01) with an increase in supplement intake during the study. The supplement was provided once a week, as well as the measurement of the refusal. The amount of supplement offered, and the refusal were quantified on the 1.0-g accuracy Toledo 9094C/4 electronic scale (Toledo do Brasil, São Bernardo do Campo, SP, Brazil). Supplements were offered in quantities sufficient to ensure at least 10% refusals, thereby permitting ad libitum intake. Samples of the supplement offered, and the leftovers were collected to determine the dry matter content (AOAC, 2000) for later calculation of the average supplement intake in the dry matter.
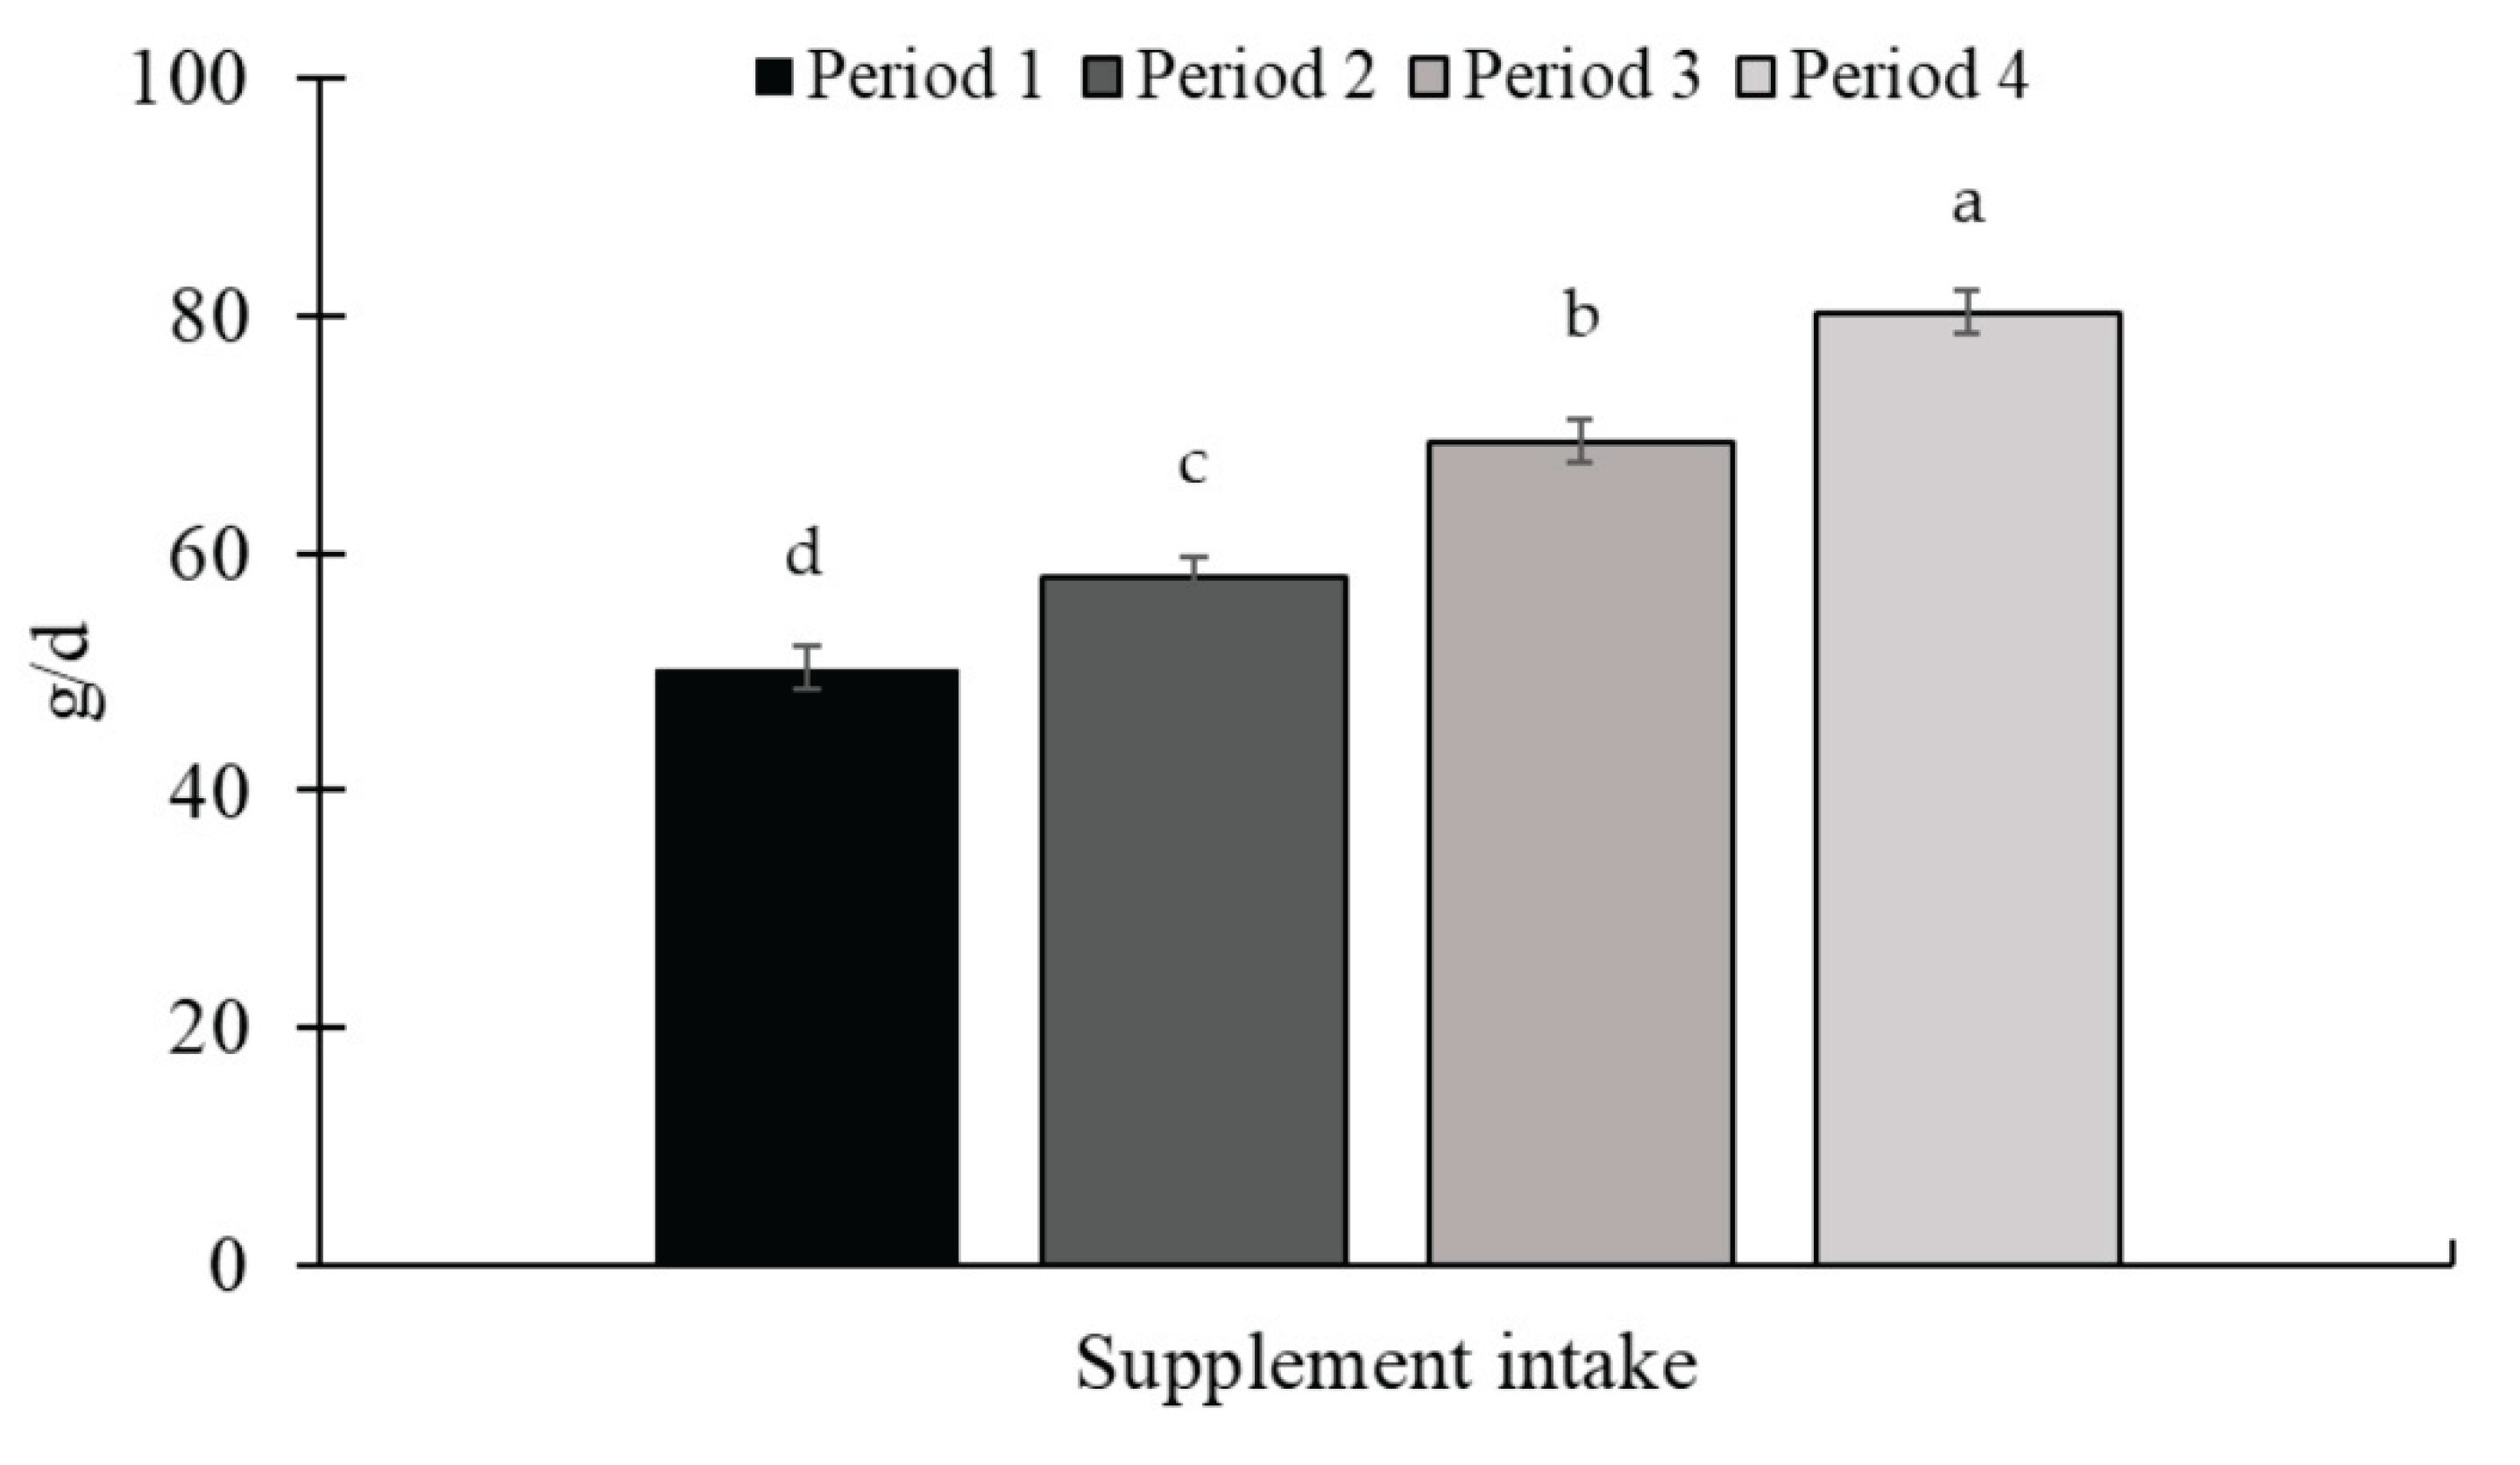
Figure 9.
Forage mass availability at the entry (d 0) and exit (d 28) periods in Exp. 3. Forage mass availability decreased throughout the experiment at the entry (P < 0.01) and exit (P < 0.01). Total forage availability in the paddocks was assessed at the entry and exit of the animals, i.e., on d 1 and 28 of each period, respectively. The quantitative samples were harvested close to the ground using 0.25-m2 metallic frames (0.5 × 0.5 m) placed on the representative sites. The samples obtained were sent to the laboratory for subsequent determination of the dry matter content and calculation of forage availability per hectare.
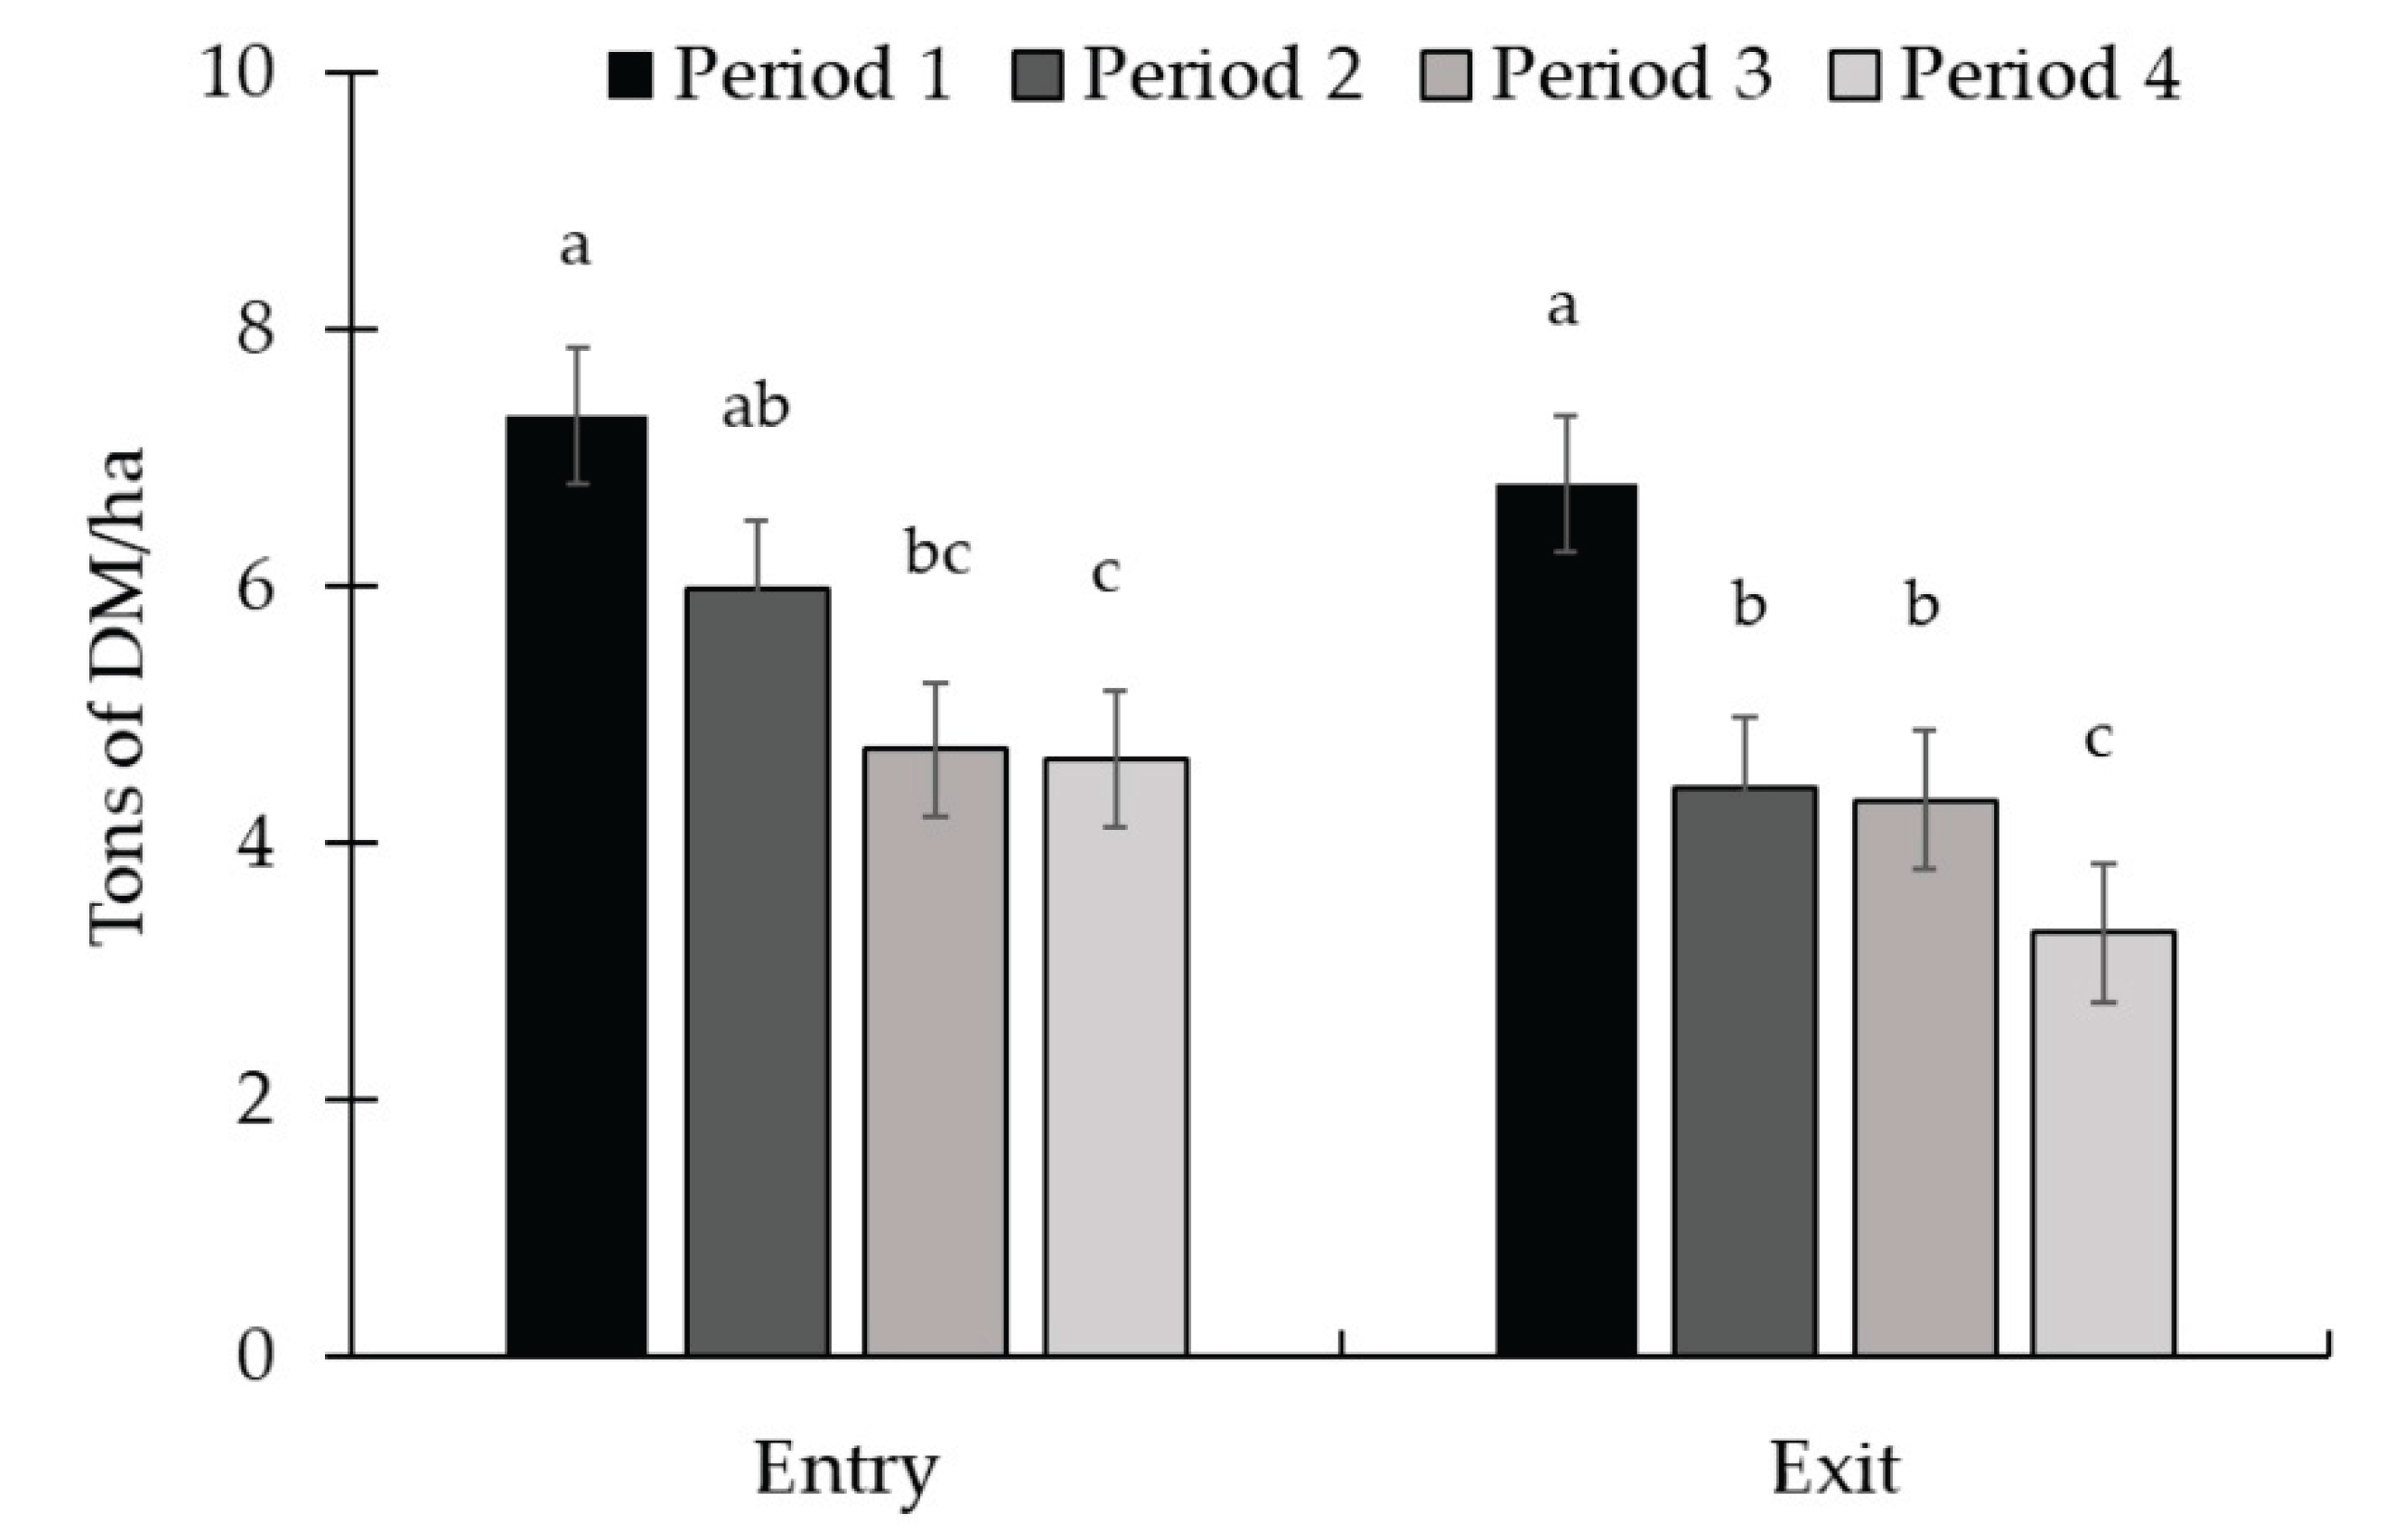
Figure 10.
Chemical composition of pasture throughout Exp. 3. There was a period effect (P ≤ 0.03) for all variables evaluated. The highest dry matter (DM) content was observed in period 2, while the lowest value occurred in period 4. The highest organic matter (OM) values were observed in periods 1 and 3. Regarding crude protein (CP), the highest value occurred in period 3 and the lowest value in period 4. The highest neutral detergent fiber (NDF) contents occurred in periods 1, 2, and 4. The highest acid detergent fiber (ADF) content occurred in period 2 and the lowest in period 3, with intermediate values in periods 3 and 4. To assess the quality of the forage available in the paddocks, on d 14 of each experimental period, a sample was obtained per paddock through simulated grazing. The DM was determined by drying the samples at 105 °C in an oven for 24 h (AOAC, 1997), and the ash content was determined by burning the samples in a muffle furnace at 550 °C (AOAC, 1997). The OM was calculated using the equation: OM = 100 – ash. Total nitrogen determination was performed using a LECO TruMac N (Leco Corporation; Saint Joseph, MI, USA; AOAC, 1997) and the CP was obtained by multiplying the total N content by 6.25. The NDF (Van Soest et al., 1991) and ADF (Goering and Van Soest, 1970) were determined using an Ankom 2000 fiber analyzer (Ankom Tech. Corp. Macedon, NY, USA). Sodium sulfite and heat-stable α-amylase were added in the NDF analysis.
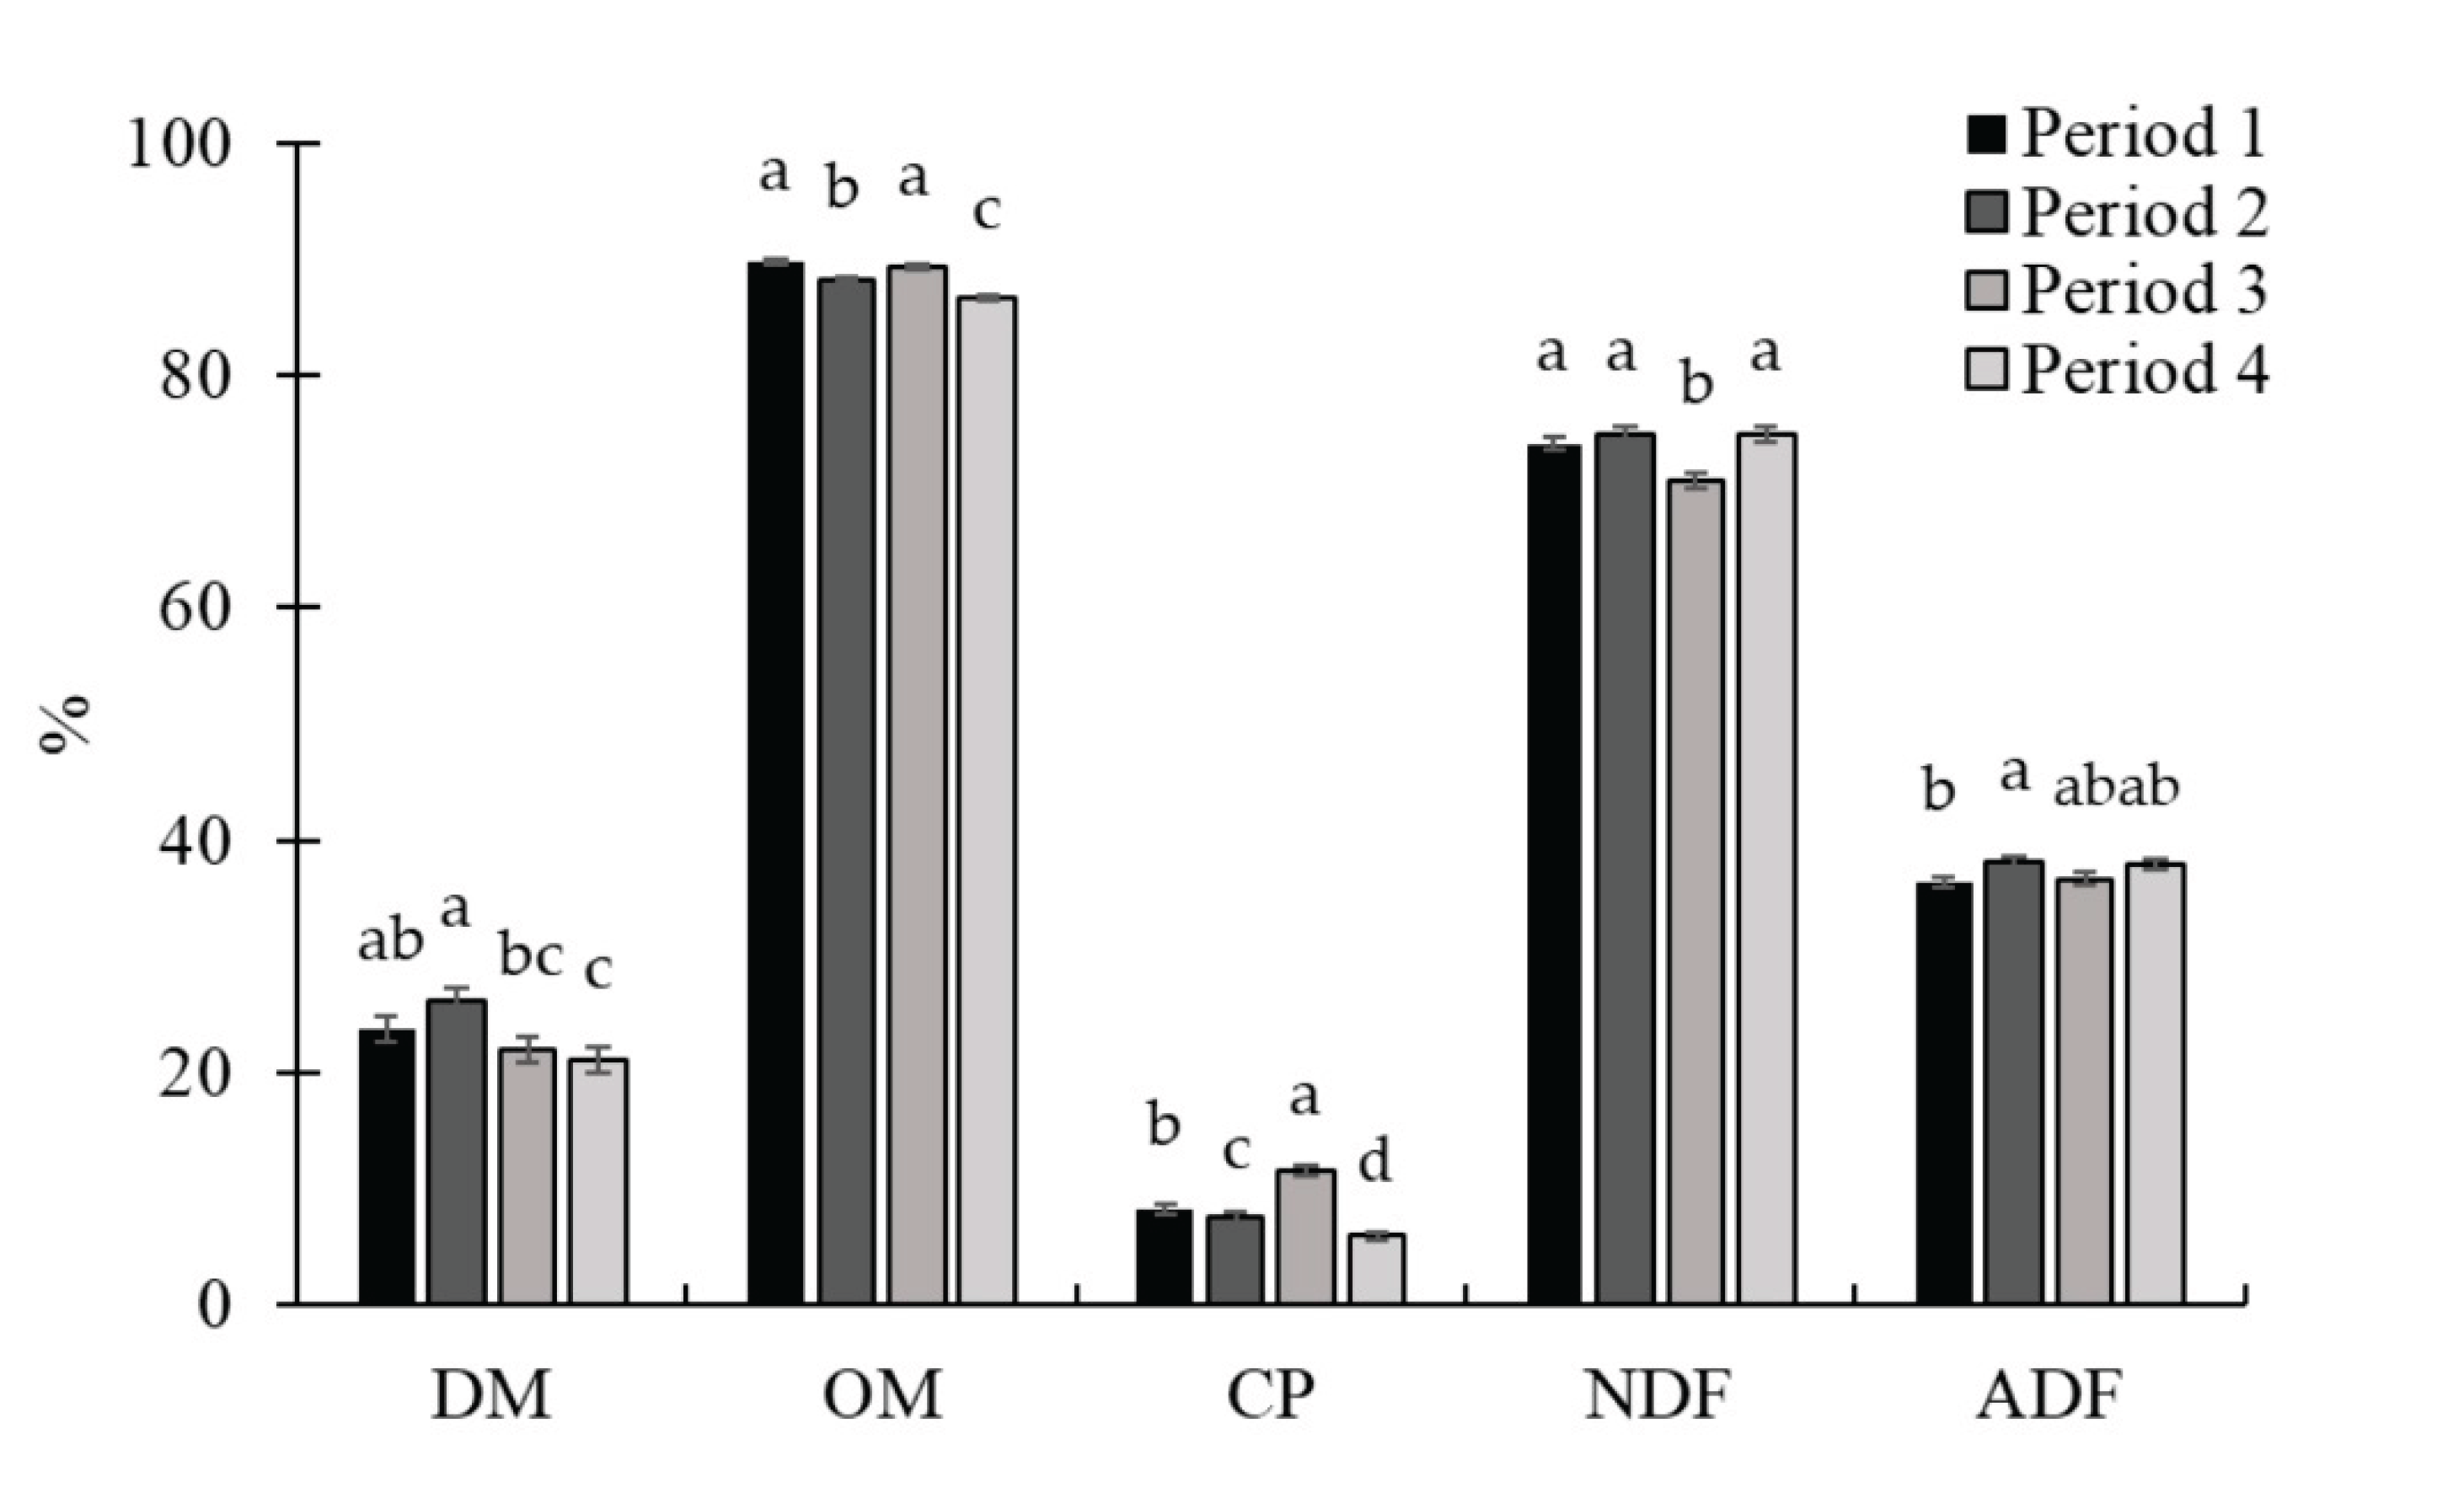
Figure 11.
Average daily gain in the experimental periods (Exp. 03). There was a period effect for average daily gain (ADG; P < 0.01), with the highest gain in period 3 and the lowest gain in period 4. The animals were weighed at the beginning of the experiment (d 0) and at the end of each period (d 28, 56, 84, and 112) after a 16-hour of feed and water withdrawal, using the idBeck 3.0 electronic scale (Irmãos Beckhauser e Cia Ltda, Paranavaí, PR, Brazil). The ADG (kg/d) was calculated by dividing the gain obtained by the duration of each period (28d).
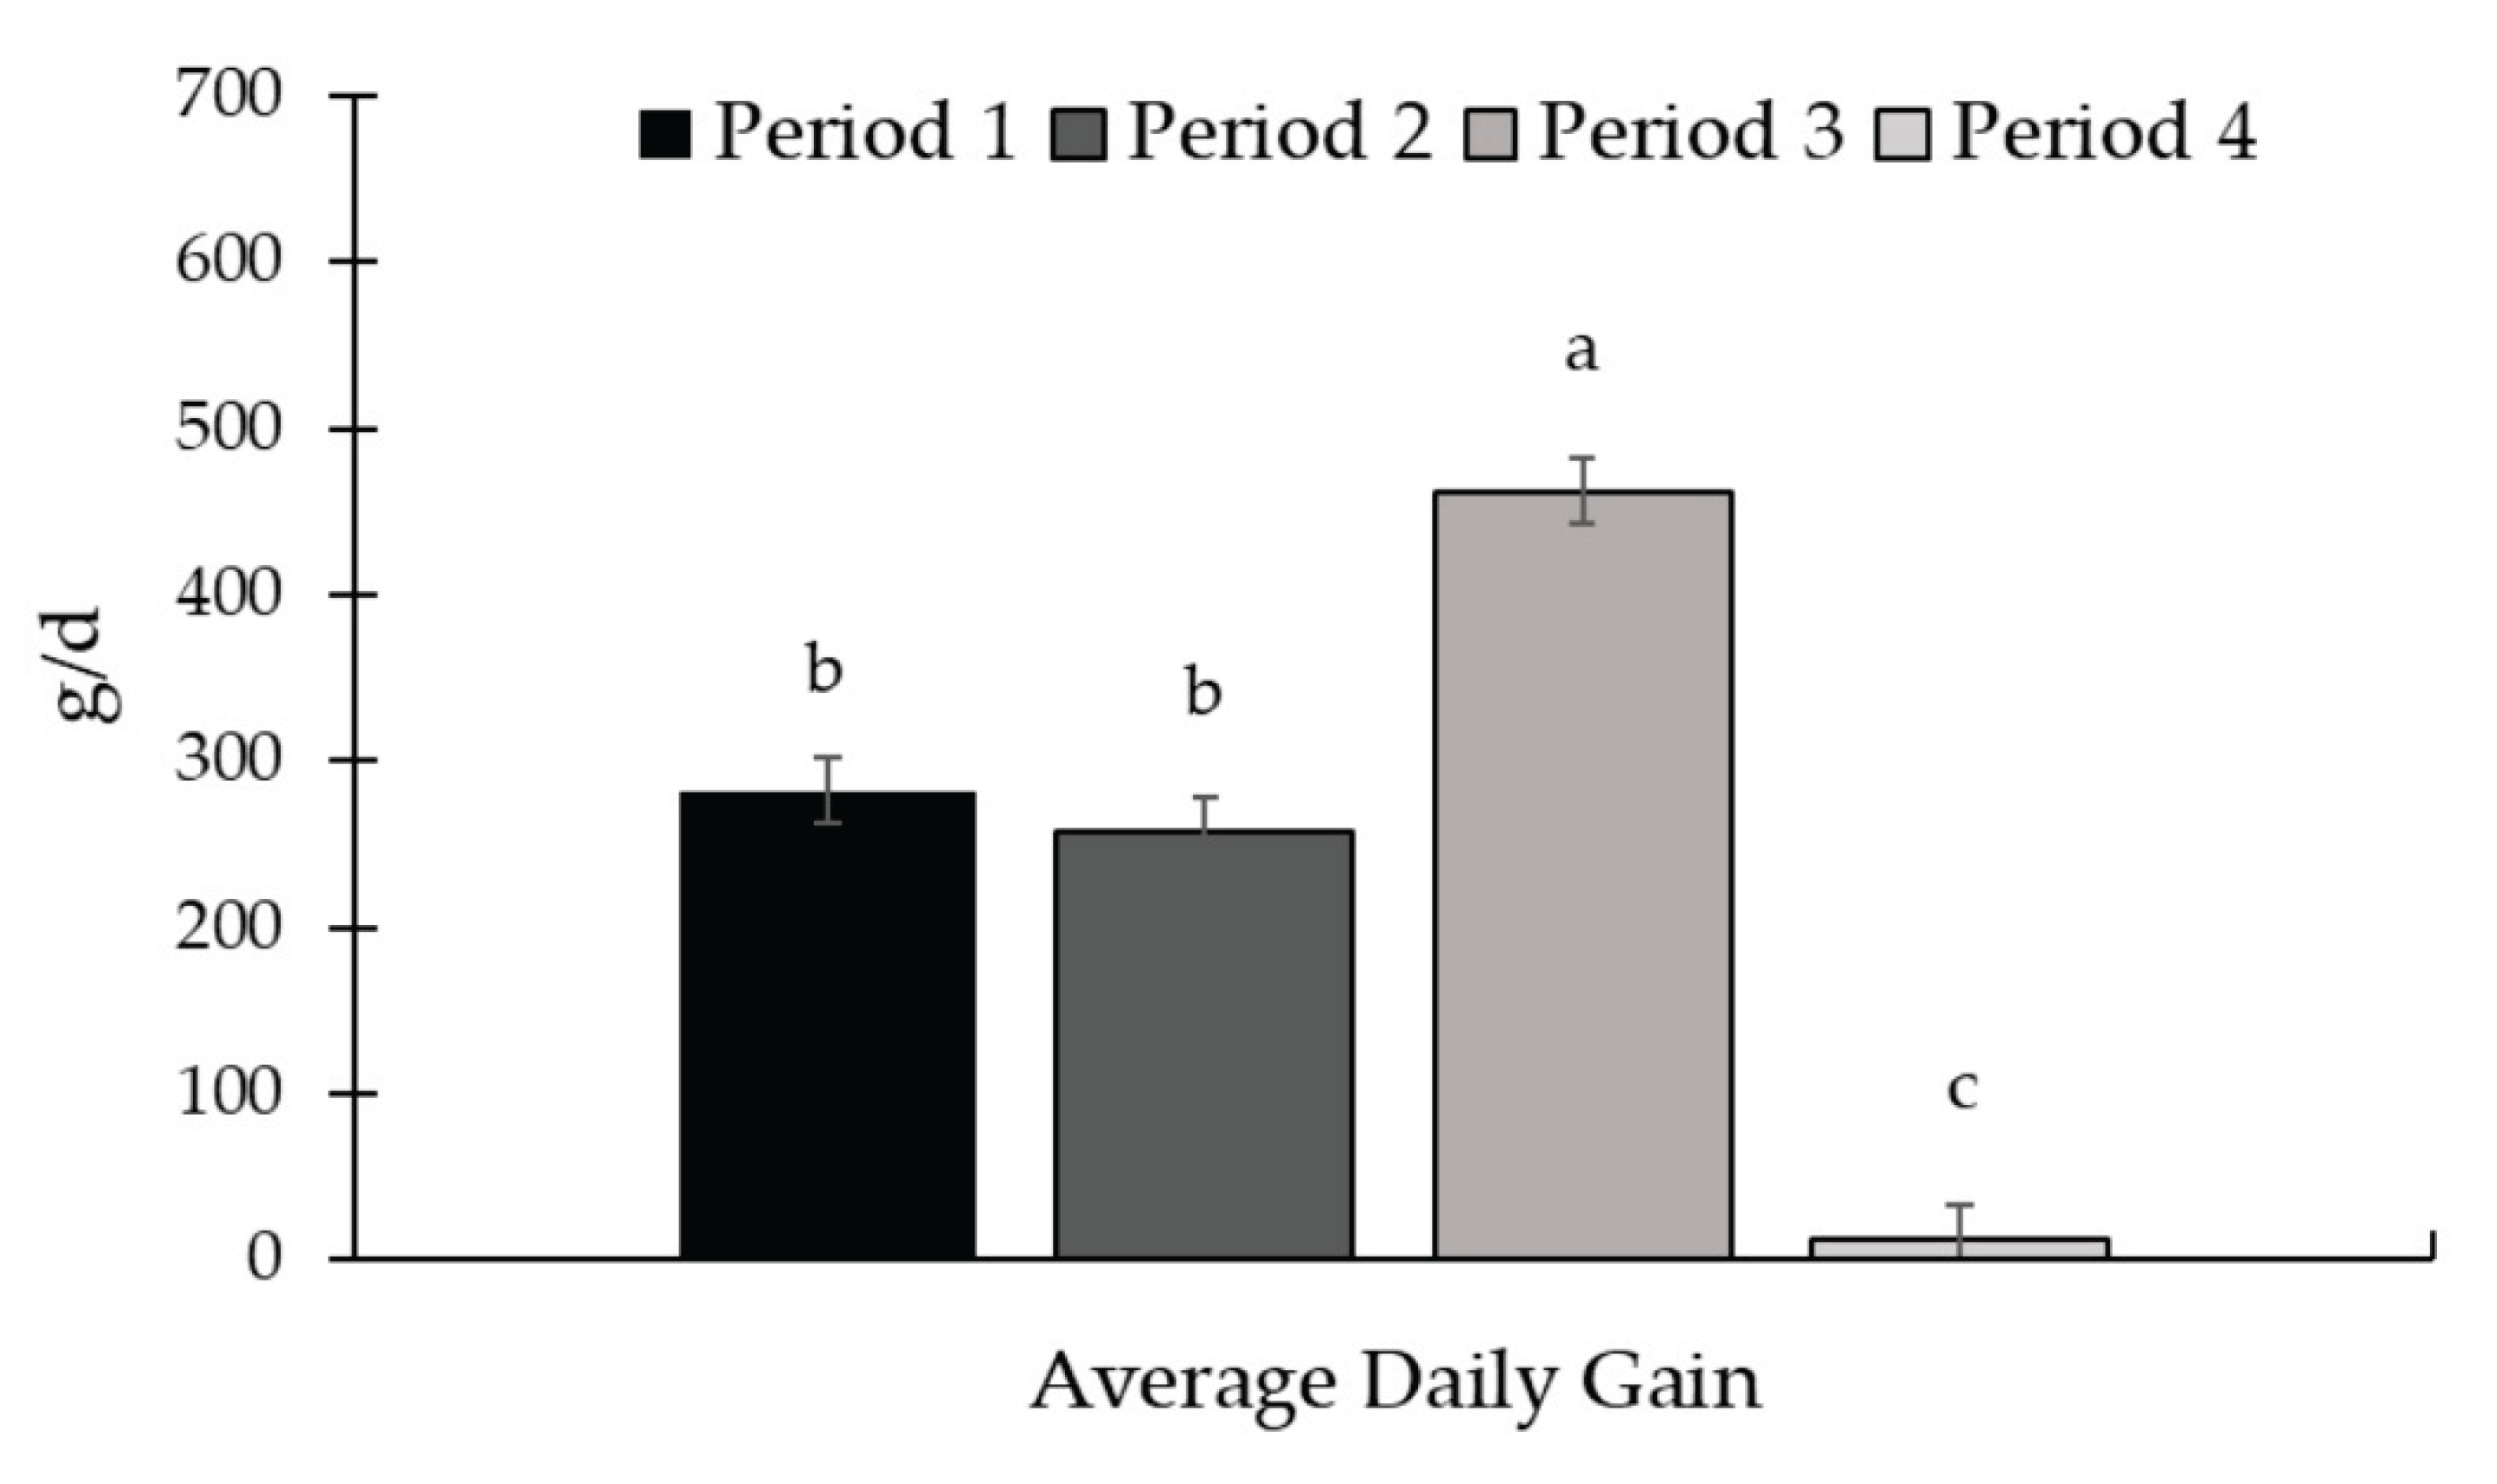
Figure 12.
Protein supplement intake throughout Experiment 3. There was a period effect (P < 0.01) for supplement intake, with higher intake in period 1 and lower in period 3. The supplement was provided once a week, as well as the measurement of the refusal. The amount of supplement offered, and the refusal were quantified on the 1.0-g accuracy Toledo 9094C/4 electronic scale (Toledo do Brasil, São Bernardo do Campo, SP, Brazil). Supplements were offered in quantities sufficient to ensure at least 10% refusals, thereby permitting ad libitum intake. Samples of the supplement offered, and the leftovers were collected to determine the dry matter content (AOAC, 2000) for later calculation of the average supplement intake in the dry matter.
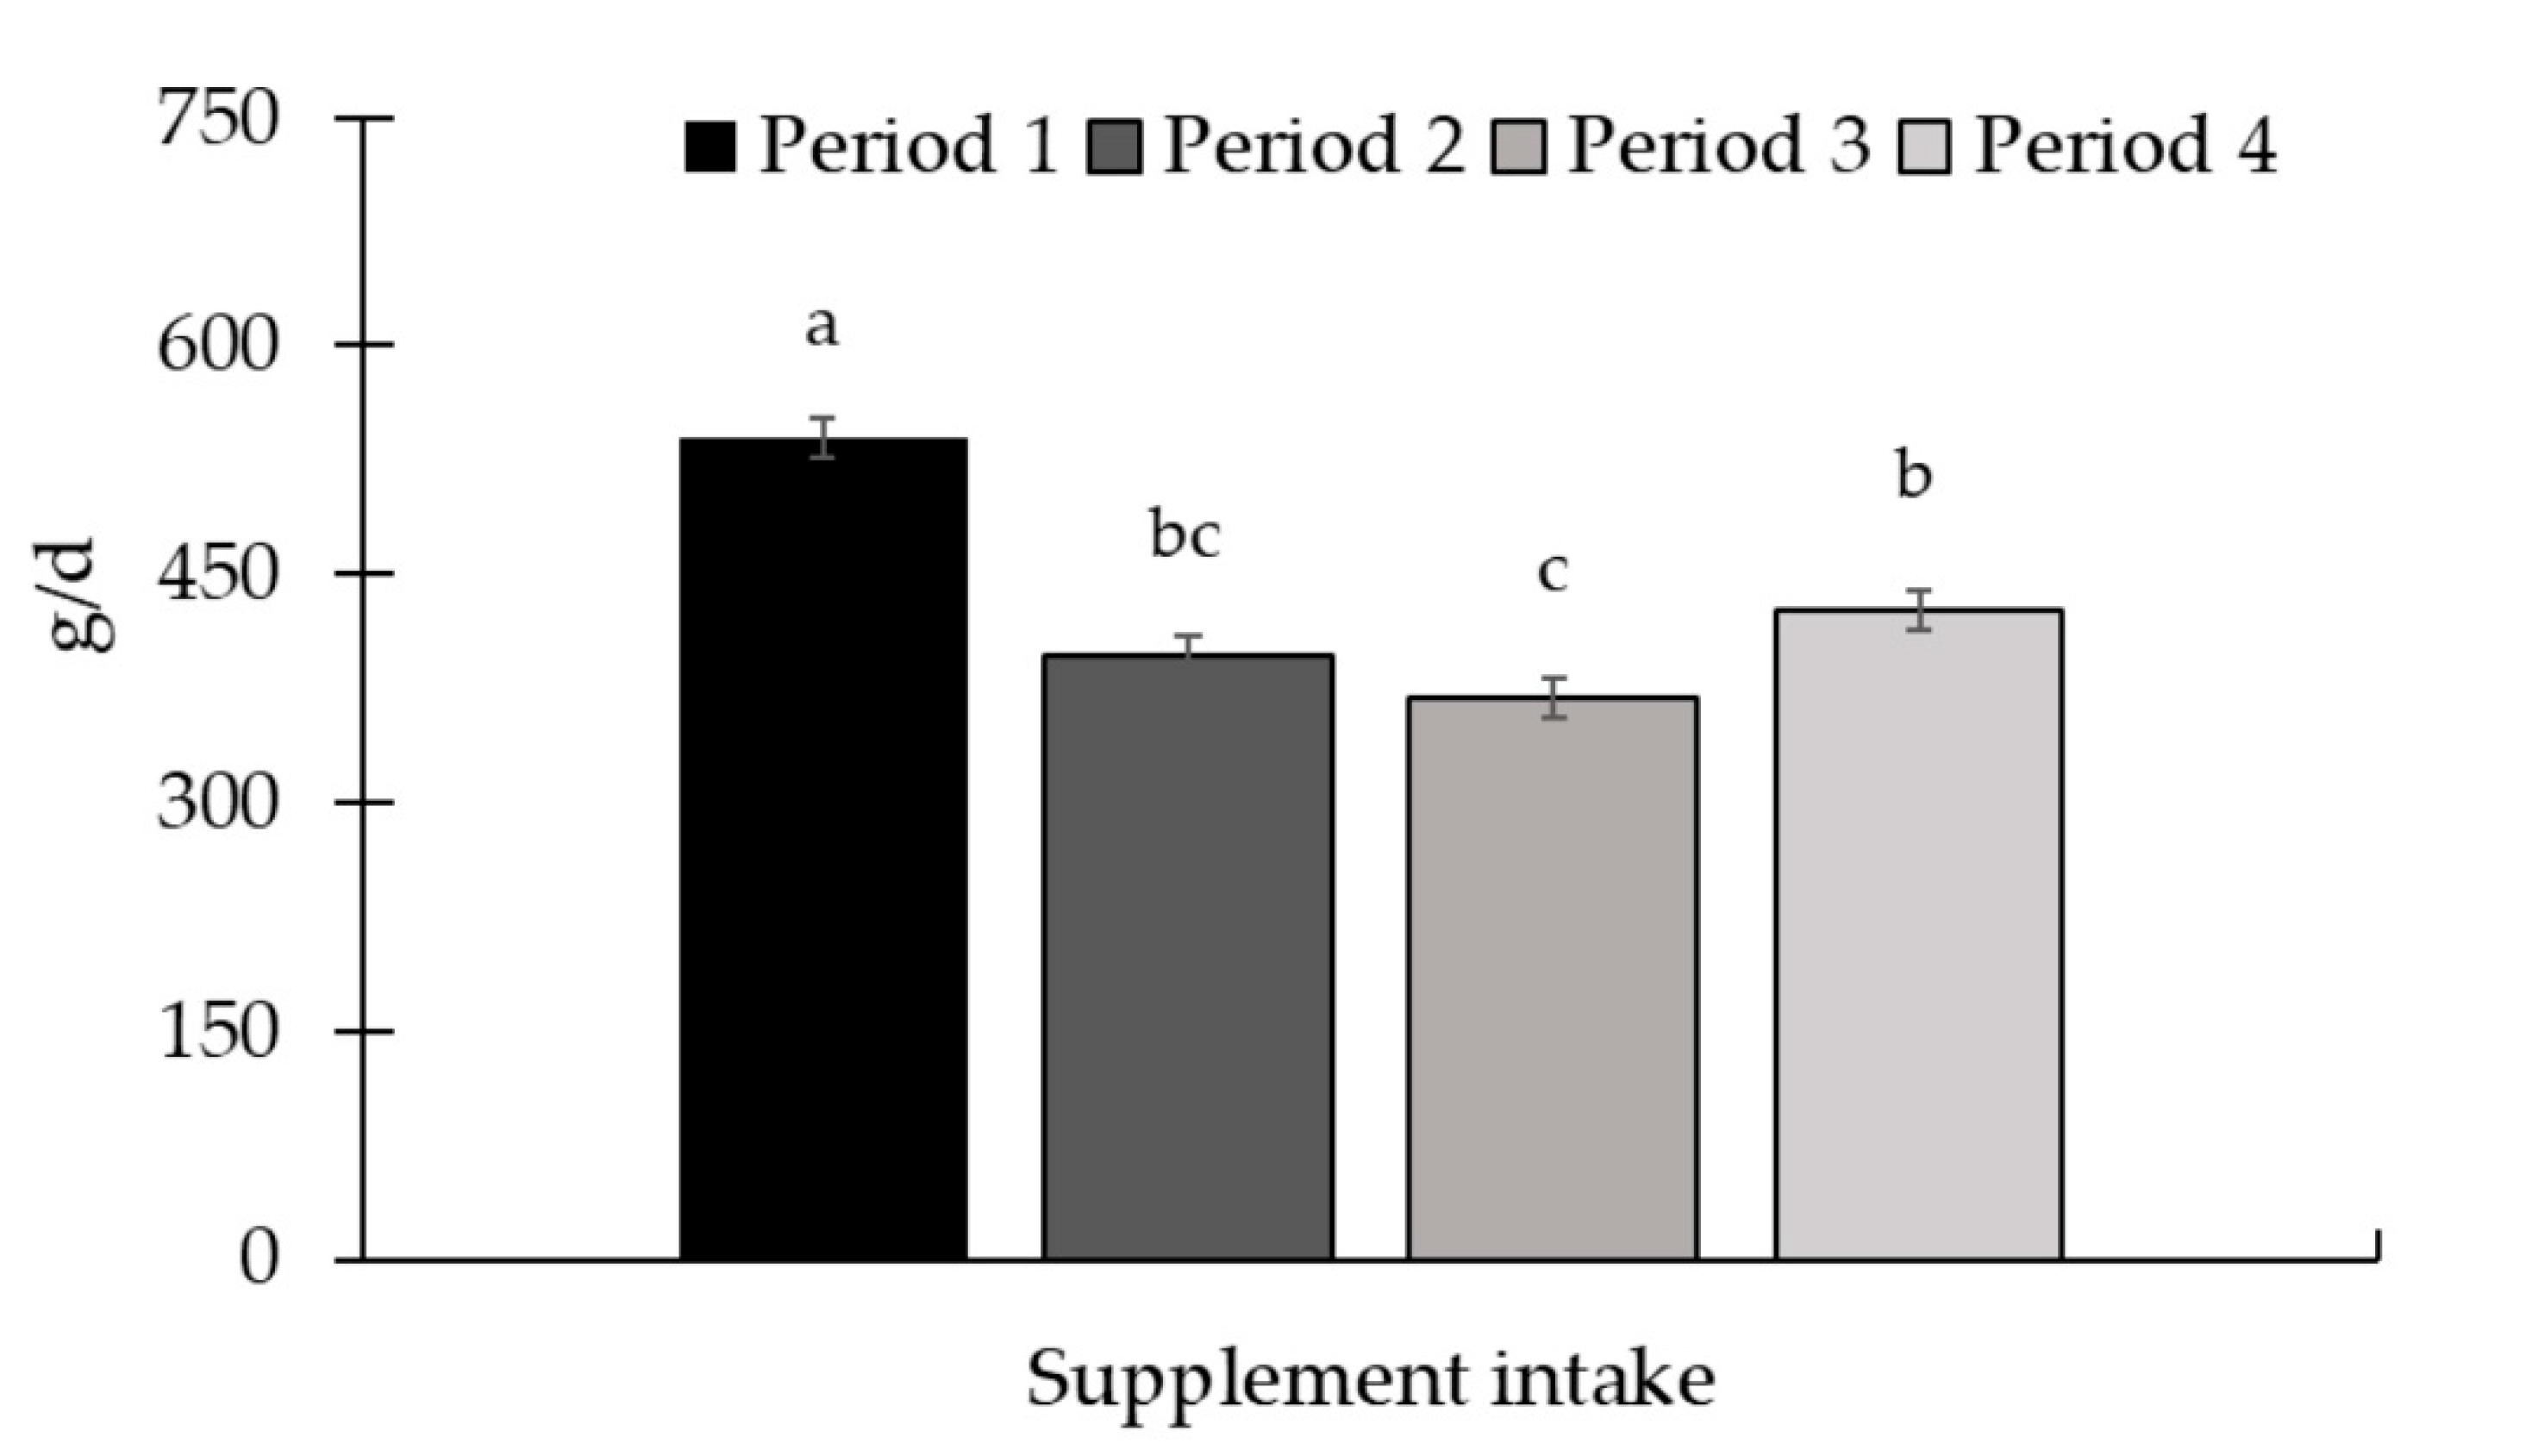

Table 1.
Nutritional and mineral composition of the supplements used during experiments 1, 2, and 3.1, 2.
Table 1.
Nutritional and mineral composition of the supplements used during experiments 1, 2, and 3.1, 2.
| Item | Experiments 1 and 2 | Experiment 3 | |||
|---|---|---|---|---|---|
| CONT | N1400 | N2100 | PROT | PROT250 | |
| g.kg-1 | |||||
| Calcium | 120.0 | 120.0 | 120.0 | 60.0 | 60.0 |
| Phosphorus | 60.0 | 60.0 | 60.0 | 15.0 | 15.0 |
| Sodium | 145 | 145 | 145 | 72.0 | 72.0 |
| Sulfur | 10.0 | 10.0 | 10.0 | 7.0 | 7.0 |
| mg.kg-1 | |||||
| Copper | 1,200 | 1,200 | 1,200 | 228.8 | 228.8 |
| Zinc | 3,450 | 3,450 | 3,450 | 800.0 | 800.0 |
| Iodine | 80.0 | 80.0 | 80.0 | 28.0 | 28.0 |
| Cobalt | 80.0 | 80.0 | 80.0 | 42.0 | 42.0 |
| Selenium | 20.0 | 20.0 | 20.0 | 5.0 | 5.0 |
| Narasin | 0 | 1400 | 2100 | 0 | 250 |
| Crude protein, % of DM | - | - | - | 30.0 | 30.0 |
¹Exp 1: Two hundred and forty Nellore calves were assigned into 30 groups of 8 calves each and randomly assigned to one of the three following treatments: 1) mineral supplementation with no fed additives [CONT, n =10]; 2) inclusion of 1400 mg of narasin/kg of supplement [N1400, n =10] and; 3) inclusion of 2100 mg of narasin/kg of supplement [N2100, n = 10]. The experimental period lasted 84 d, divided into 3 periods of 28 d each during the rainy season (from November 2016 to February 2017). Exp 2: Two hundred and forty weaned Nellore calves were assigned into 8 groups of 6 calves each and 12 groups of 8 calves each and randomly assigned to one of the two following treatments: 1) mineral supplementation with no fed additives [CONT, n = 10] or; 2) inclusion of 1400 mg of narasin/kg of supplement [N1400, n = 10]. The experimental period lasted 112 d, divided into 4 periods of 28 d each during the rainy season (from November 2017 to March 2018). 2One hundred and fifty weaned Nellore yearlings were assigned into 30 groups of 5 animals each and randomly assigned to one of the two following treatments: 1) protein supplementation with no feed additives [PROT, n = 15]; or 2) protein supplementation with inclusion of 250 mg of narasin/kg of protein supplement [PROT250, n = 15]. The experimental period lasted 112 d, divided into 4 periods of 28 d each during the dry season (from May 2018 to August 2018).
Table 2.
Forage availability and chemical composition of the paddocks covered by Urochloa brizantha cv. Marandu in Exp. 1.
Table 2.
Forage availability and chemical composition of the paddocks covered by Urochloa brizantha cv. Marandu in Exp. 1.
| Item | Treatments1 | SEM | P-Value | ||||||
|---|---|---|---|---|---|---|---|---|---|
| CONT | N1400 | N2100 | TRT | CONT vs. NAR | N1400 vs. N2100 | Period | T × P | ||
| Forage availability, T DM/ha2 | |||||||||
| Initial | 9.95 | 9.38 | 9.96 | 0.61 | 0.65 | 0.65 | 0.42 | 0.11 | 0.15 |
| Final | 8.67 | 8.27 | 8.97 | 0.41 | 0.45 | 0.91 | 0.21 | <0.01 | 0.22 |
| Chemical composition, %3 | |||||||||
| Dry matter | 24.16 | 23.64 | 23.79 | 0.41 | 0.56 | 0.30 | 0.76 | 0.59 | 0.23 |
| Organic matter | 91.25 | 91.37 | 91.09 | 0.29 | 0.71 | 0.94 | 0.41 | 0.39 | 0.46 |
| Crude protein | 9.33 | 9.32 | 9.29 | 0.27 | 0.91 | 0.77 | 0.76 | <0.01 | 0.19 |
| Neutral detergent fiber | 70.23 | 70.15 | 70.13 | 0.19 | 0.86 | 0.59 | 0.94 | <0.01 | 0.73 |
| Acid detergent fiber | 35.20 | 35.36 | 35.11 | 0.35 | 0.78 | 0.91 | 0.49 | 0.03 | 0.83 |
1CON = mineral supplementation without feed additives; N1400 = inclusion of 1400 mg of narasin/kg of supplement; N2100 = inclusion of 2100 mg of narasin/kg of supplement. 2Total forage availability in the paddocks was assessed at the entry and exit of the animals, i.e., on d 1 and 28 of each period, respectively. The quantitative samples were harvested close to the ground using 0.25-m2 metallic frames (0.5 × 0.5 m) placed on the representative sites. The samples obtained were sent to the laboratory for subsequent determination of the dry matter content and calculation of forage availability per hectare.
Table 3.
Experiment 1: Performance and supplement intake of Nellore calves receiving a mineral supplementation with no feed additives (CONT) or inclusion of 1400 (N1400) or 2100 (N2100) mg of narasin/kg of supplement.
Table 3.
Experiment 1: Performance and supplement intake of Nellore calves receiving a mineral supplementation with no feed additives (CONT) or inclusion of 1400 (N1400) or 2100 (N2100) mg of narasin/kg of supplement.
| Item | Treatments1 | SEM | P-Value | ||||||
|---|---|---|---|---|---|---|---|---|---|
| CONT | N1400 | N2100 | TRT | CONT vs. NAR | N1400 vs. N2100 | Period | T × P | ||
| Body weight, kg2 | |||||||||
| Initial | 176.9 | 176.9 | 176.6 | 0.20 | 0.57 | 0.58 | 0.37 | - | - |
| 28 d | 182.6 | 184.7 | 186.0 | 1.14 | 0.12 | 0.06 | 0.41 | - | - |
| 56 d | 198.6 | 204.0 | 206.2 | 1.43 | <0.01 | <0.01 | 0.28 | - | - |
| 84 d | 218.3 | 224.3 | 225.8 | 1.86 | 0.02 | <0.01 | 0.57 | - | - |
| Body weight changes, kg | 41.4 | 47.5 | 49.15 | 1.84 | 0.01 | <0.01 | 0.50 | - | - |
| Average daily gain, kg3 | 0.493 | 0.570 | 0.585 | 0.021 | <0.01 | <0.01 | 0.60 | <0.01 | 0.34 |
| Supplement intake, g/d4 | 63.7 | 62.1 | 60.7 | 1.74 | 0.33 | 0.18 | 0.50 | <0.01 | 0.40 |
11) mineral supplementation with no feed additives [CONT, n = 10]; 2) inclusion of 1400 mg of narasin/kg of supplement [N1400, n =10]; or 3) inclusion of 2100 mg of narasin/kg of supplement [N2100, n = 10].2Animals were weighed at the beginning of the experiment (d 0) and at the end of each period (d 28, 56, and 84) after a 16-hour of feed and water withdrawal, using the idBeck 3.0 electronic scale (Irmãos Beckhauser e Cia Ltda, Paranavaí, PR, Brazil).3The average daily gain (kg/d) was calculated by dividing the gain obtained by the duration of each period (28 d).4The supplement was provided once a week, as well as the measurement of the refusal. The amount of supplement offered, and the refusal were quantified on the 1.0 g accuracy Toledo 9094C/4 electronic scale (Toledo do Brasil, São Bernardo do Campo, SP, Brazil). Supplements were offered in quantities sufficient to ensure at least 10% refusals, thereby permitting ad libitum intake. Samples of the supplement offered, and the leftovers were collected to determine the dry matter content (AOAC, 2000) for later calculation of the average supplement intake in the dry matter.
Table 4.
Forage availability and chemical composition of the paddocks covered by Urochloa brizantha cv. Marandu in Exp. 2.
Table 4.
Forage availability and chemical composition of the paddocks covered by Urochloa brizantha cv. Marandu in Exp. 2.
| Item | Treatments1 | SEM | P-Value | |||
|---|---|---|---|---|---|---|
| CONT | N1400 | TRT | Period | T × P | ||
| Forage availability, T DM/ha2 | ||||||
| Initial | 6.43 | 6.18 | 0.46 | 0.57 | 0.22 | 0.72 |
| Final | 5.44 | 5.60 | 0.47 | 0.68 | 0.10 | 0.84 |
| Chemical composition3 | ||||||
| Dry matter | 20.56 | 21.17 | 0.44 | 0.28 | 0.29 | 0.26 |
| Organic matter | 89.11 | 89.21 | 0.12 | 0.44 | <0.01 | 0.81 |
| Crude protein | 11.30 | 11.19 | 0.24 | 0.67 | <0.01 | 0.96 |
| Neutral detergent fiber | 71.68 | 72.13 | 0.31 | 0.18 | <0.01 | 0.53 |
| Acid detergent fiber | 35.99 | 36.35 | 0.27 | 0.30 | <0.01 | 0.71 |
11) mineral supplementation with no fed additives [CONT, n = 10] and 2) inclusion of 1400 mg of narasin/kg of supplement [N1400, n = 10]. 2Total forage availability in the paddocks was assessed at the entry and exit of the animals, i.e., on d 1 and 28 of each period, respectively. The quantitative samples were harvested close to the ground using 0.25-m2 metallic frames (0.5 × 0.5 m) placed on the representative sites. The samples obtained were sent to the laboratory for subsequent determination of the dry matter content and calculation of forage availability per hectare.
Table 5.
Experiment 2: Performance and supplement intake of Nellore calves receiving a mineral supplementation with no feed additives (CONT) or inclusion of 1400 mg of narasin/kg of supplement (N1400).
Table 5.
Experiment 2: Performance and supplement intake of Nellore calves receiving a mineral supplementation with no feed additives (CONT) or inclusion of 1400 mg of narasin/kg of supplement (N1400).
| Item | Treatments1 | SEM | P-Value | |||
|---|---|---|---|---|---|---|
| CONT | N1400 | TRT | Period | T × P | ||
| Body weight, kg2 | ||||||
| Initial | 193.2 | 193.0 | 0.22 | 0.94 | - | - |
| 28 d | 202.0 | 204.2 | 0.88 | 0.08 | - | - |
| 56 d | 216.2 | 222.2 | 1.13 | <0.01 | - | - |
| 84 d | 234.8 | 243.0 | 1.32 | <0.01 | - | - |
| 112 d | 254.5 | 263.6 | 1.37 | <0.01 | - | - |
| Body weight changes, kg | 61.34 | 70.61 | 1.35 | <0.01 | - | - |
| Average daily gain, kg3 | 0.550 | 0.632 | 0.02 | <0.01 | <0.01 | 0.89 |
| Supplement intake, g/d4 | 64.07 | 64.94 | 1.76 | 0.25 | <0.01 | 0.17 |
11) mineral supplementation with no feed additives [CONT, n = 10]; and 2) inclusion of 1400 mg of narasin/kg of supplement [N1400, n = 10].2The animals were weighed at the beginning of the experiment (d 0) and at the end of each period (d 28, 56, 84, and 112) after a 16-hour of feed and water withdrawal, using the idBeck 3.0 electronic scale (Irmãos Beckhauser e Cia Ltda, Paranavaí, PR, Brazil).3The average daily gain (kg/d) was calculated by dividing the gain obtained by the duration of each period (28 d).4The supplement was provided once a week, as well as the measurement of the refusal. The amount of supplement offered, and the refusal were quantified on the 1.0 g accuracy Toledo 9094C/4 electronic scale (Toledo do Brasil, São Bernardo do Campo, SP, Brazil). Supplements were offered in quantities sufficient to ensure at least 10% refusals, thereby permitting ad libitum intake. Samples of the supplement offered, and the leftovers were collected to determine the dry matter content (AOAC, 2000) for later calculation of the average supplement intake in the dry matter.
Table 6.
Forage availability and chemical composition of the paddocks covered by Urochloa brizantha cv. Marandu in Exp. 3.
Table 6.
Forage availability and chemical composition of the paddocks covered by Urochloa brizantha cv. Marandu in Exp. 3.
| Item | Treatments1 | SEM | P-Value | |||
|---|---|---|---|---|---|---|
| PROT | PROT250 | TRT | Period | T × P | ||
| Forage availability, T DM/ha2 | ||||||
| Initial | 5.64 | 5.71 | 0.29 | 0.82 | <0.01 | 0.38 |
| Final | 4.70 | 4.71 | 0.29 | 0.97 | <0.01 | 0.89 |
| Chemical composition3 | ||||||
| Dry matter | 23.33 | 23.25 | 1.01 | 0.92 | <0.01 | 0.94 |
| Organic matter | 88.54 | 88.44 | 0.20 | 0.58 | <0.01 | 0.81 |
| Crude protein | 8.29 | 8.39 | 0.29 | 0.71 | <0.01 | 0.91 |
| Neutral detergent fiber | 73.70 | 73.81 | 0.44 | 0.82 | <0.01 | 0.99 |
| Acid detergent fiber | 37.21 | 37.38 | 0.33 | 0.72 | 0.03 | 0.46 |
11) protein supplementation with no feed additives [PROT, n = 15] and 2) inclusion of 250 mg of narasin/kg of protein supplement [PROT250, n = 15]. 2 Total forage availability in the paddocks was assessed at the entry and exit of the animals, i.e., on d 1 and 28 of each period, respectively. The quantitative samples were harvested close to the ground using 0.25-m2 metallic frames (0.5 × 0.5 m) placed on the representative sites. The samples obtained were sent to the laboratory for subsequent determination of the Dry matter content and calculation of forage availability per hectare.
Table 7.
Experiment 3: Performance and supplement intake of Nellore yearlings receiving a protein supplementation with no feed additives (PROT) or inclusion of 250 mg of narasin/kg of protein supplement (PROT250).
Table 7.
Experiment 3: Performance and supplement intake of Nellore yearlings receiving a protein supplementation with no feed additives (PROT) or inclusion of 250 mg of narasin/kg of protein supplement (PROT250).
| Item | Treatments1 | SEM | P-Value | |||
|---|---|---|---|---|---|---|
| PROT | PROT250 | TRT | Period | T × P | ||
| Body weight, kg2 | ||||||
| Initial | 332.0 | 331.8 | 0.13 | 0.58 | - | - |
| 28 d | 339.2 | 340.7 | 0.77 | 0.29 | - | - |
| 56 d | 346.0 | 348.1 | 0.76 | 0.08 | - | - |
| 84 d | 358.4 | 361.5 | 0.80 | 0.02 | - | - |
| 112 d | 357.7 | 363.0 | 0.84 | <0.01 | - | - |
| Body weight changes, kg | 25.77 | 31.12 | 0.84 | <0.01 | - | - |
| Average daily gain, kg3 | 0.230 | 0.278 | 0.016 | 0.04 | <0.01 | 0.88 |
| Supplement intake, g/d4 | 435.3 | 433.3 | 12.13 | 0.74 | <0.01 | 0.70 |
11) protein supplementation with no feed additives [PROT, n = 15] and 2) inclusion of 250 mg of narasin/kg of protein supplement [PROT250, n = 15].2The animals were weighed at the beginning of the experiment (d 0) and at the end of each period (d 28, 56, 84, and 112) after a 16-hour of feed and water withdrawal, using the idBeck 3.0 electronic scale (Irmãos Beckhauser e Cia Ltda, Paranavaí, PR, Brazil).3The average daily gain (kg/d) was calculated by dividing the gain obtained by the duration of each period (28d).4The supplement was provided once a week, as well as the measurement of the refusal. The amount of supplement offered, and the refusal were quantified on the 1.0-g accuracy Toledo 9094C/4 electronic scale (Toledo do Brasil, São Bernardo do Campo, SP, Brazil). Supplements were offered in quantities sufficient to ensure at least 10% refusals, thereby permitting ad libitum intake. Samples of the supplement offered, and the leftovers were collected to determine the dry matter content (AOAC, 2000) for later calculation of the average supplement intake in the dry matter.
Disclaimer/Publisher’s Note: The statements, opinions and data contained in all publications are solely those of the individual author(s) and contributor(s) and not of MDPI and/or the editor(s). MDPI and/or the editor(s) disclaim responsibility for any injury to people or property resulting from any ideas, methods, instructions or products referred to in the content. |
© 2025 by the authors. Licensee MDPI, Basel, Switzerland. This article is an open access article distributed under the terms and conditions of the Creative Commons Attribution (CC BY) license (http://creativecommons.org/licenses/by/4.0/).
Copyright: This open access article is published under a Creative Commons CC BY 4.0 license, which permit the free download, distribution, and reuse, provided that the author and preprint are cited in any reuse.


