Submitted:
12 June 2025
Posted:
12 June 2025
You are already at the latest version
Abstract
Coffee classification involves the differentiation of coffee based on species, geographical origin, and quality attributes. In this study, ground coffee samples from seventeen commercial brands: Mai, Honey, Duong, M Ja, Con Soc, Hat A, Trung Nguyen, Huong Viet, Vina, Phuc Long, TwitterBean, Nhan, Phuong Vi, Thu Ha, Nes, and Highland were analyzed using Attenuated Total Reflectance Fourier Transform Infrared (ATR-FTIR) spectroscopy. Spectra were acquired in transmittance mode over the range 400-4000 cm-1 with 128 scans per sample and a resolution of 10 cm-1. Sample surfaces were smoothed consistently during measurement to minimize variability. The resulting spectral data were compressed and subjected to multivariate statistical analysis, including Principal Component Analysis (PCA) and Linear Discriminant Analysis (LDA). These techniques were applied to classify four roasted coffee types: Arabica, Robusta, Moka, and Culi. PCA revealed that the first two principal components accounted for 72.99% and 11.97% of the total variance, respectively. While PCA enabled partial brand-level discrimination, LDA provided clear separation among all four coffee types. Our findings demonstrate that ATR-FTIR spectroscopy, when coupled with chemometric modeling, offers a rapid and robust alternative to conventional methods for coffee authentication. This approach enables effective classification of Vietnamese coffee products and holds promise for future applications in fraud detection and quality control.
Keywords:
coffee
; ATR-FTIR
; PCA
; LDA
; chemometric
1. Introduction
Coffee (Coffea spp.) has long been a widely consumed beverage in Vietnam. Globally, Vietnam ranks second only to Brazil in both coffee production and export volume, accounting for approximately 20% of the world’s annual coffee output [1]. In recent years, the Vietnamese coffee industry has expanded with the aim of improving varietal quality, leading to a more diverse and dynamic market. The two primary species cultivated in Vietnam are Robusta (Coffea canephora) and Arabica (Coffea arabica). Other varieties, such as Liberica (Coffea liberica), Moka, and Culi, are grown in smaller quantities [2,3].
Robusta is well-suited to the basaltic soils and climate of Vietnam’s Central Highlands and constitutes about 97% of the national coffee production [4,5,6,7]. Arabica, on the other hand, is mainly grown in Lam Dong province at elevations above 600 meters. Culi is a natural mutation of Arabica and Robusta, characterized by a single, rounded bean per fruit. Moka, a cultivar within the Arabica lineage introduced from France, is cultivated in Da Lat, Lam Dong [6].
The economic value associated with coffee variety has led to increasing incidences of varietal fraud and mislabeling aimed at boosting profit margins. This issue parallels similar trends reported across Vietnam’s food sector, where traceability, authenticity, and origin protection have become pressing concerns [8,9,10]. In addition, environmental pollution—such as pesticide residues, heavy metals, and industrial contaminants—has been shown to adversely affect the safety and quality of various agricultural products in Vietnam [11,12,13,14,15]. These challenges underscore the urgent need for reliable analytical approaches that not only verify product identity but also ensure food quality in the face of environmental and economic pressures. Studies have revealed widespread cases of adulteration and contamination in vegetables [11,13], rice [16,17,18], cashew nuts [19,20], green tea [21], and alcoholic beverages [22]. Such findings highlight the necessity of reliable analytical approaches for product verification.
Coffee is a chemically complex matrix containing more than 800 organic and inorganic compounds, each associated with different functional groups and therefore unique infrared (IR) absorption characteristics [8,23,24,25,26,27,28]. Spectroscopic fingerprinting techniques—such as Attenuated Total Reflectance-Fourier Transform Infrared (ATR-FTIR) spectroscopy—have emerged as powerful, non-destructive methods for rapid compositional analysis of coffee [25,28]. In combination with chemometric tools, including Principal Component Analysis (PCA), Linear Discriminant Analysis (LDA), and Mahalanobis distance analysis [29,30], ATR-FTIR has demonstrated high efficacy in authenticating coffee species and differentiating products by geographical origin [27,28].
Beyond coffee, these methods have been successfully applied to assess the authenticity and classify various food products in Vietnam, such as sausages [21], soybean [31], turmeric [32], mustard greens [33], ST25 rice [18], and even alcoholic beverages [22]. The use of complementary techniques like Inductively Coupled Plasma Mass Spectrometry (ICP-MS) and LC-MS/MS has further enhanced multivariate classification and traceability of food products [21,34,35].
This study aims to apply ATR-FTIR spectroscopy, in combination with multivariate statistical analysis, to differentiate commercially available Vietnamese coffee types. The findings are expected to support the development of a chemometric classification method to distinguish coffee species and brands, thereby contributing to product integrity and fraud prevention in the Vietnamese coffee market.
2. Experimental
2.1. Sample Collection and Preliminary Processing
Table 1 summarizes the information of 36 coffee samples representing four common types collected from commercial outlets in Hanoi, including 12 Arabica samples, 13 Robusta samples, 6 Moka samples, and 5 Culi samples. Each type was sampled at five different vendors to evaluate repeatability.
Brand names and origin information were obtained from packaging labels. Prior to analysis, all coffee samples were finely ground and homogenized.
2.2. Infrared Spectroscopy Analysis
Fourier-transform infrared (FTIR) spectra were recorded using a Nicolet™ iS50 FTIR spectrometer (Thermo Scientific, USA). Background spectra were collected and subtracted prior to each sample measurement. Samples were placed on a ZnSe crystal with a diamond element integrated into the ATR module. Spectra were acquired in the range of 400 to 4000 cm−1 with 128 scans per sample and a resolution of 10 cm−1. Ground coffee powders were analyzed directly on the ATR surface.
2.3. Multivariate Statistical Analysis
FTIR spectral data were exported into spreadsheet format and subjected to statistical analysis using Principal Component Analysis (PCA) with Pearson correlation (n−1) and Linear Discriminant Analysis (LDA). Data analysis was performed using XLSTAT version 2016.02.28451 integrated in Microsoft Excel and STATISTICA 12.
3. Results and Discussion
3.1. FTIR Spectral Analysis
The chemical composition of ground coffee is highly complex. In addition to well-characterized major constituents, numerous minor compounds remain unidentified but are expected to contribute significantly to the infrared spectral profile
Figure 1.
Summary of maximum absorbance peaks across 36 samples.
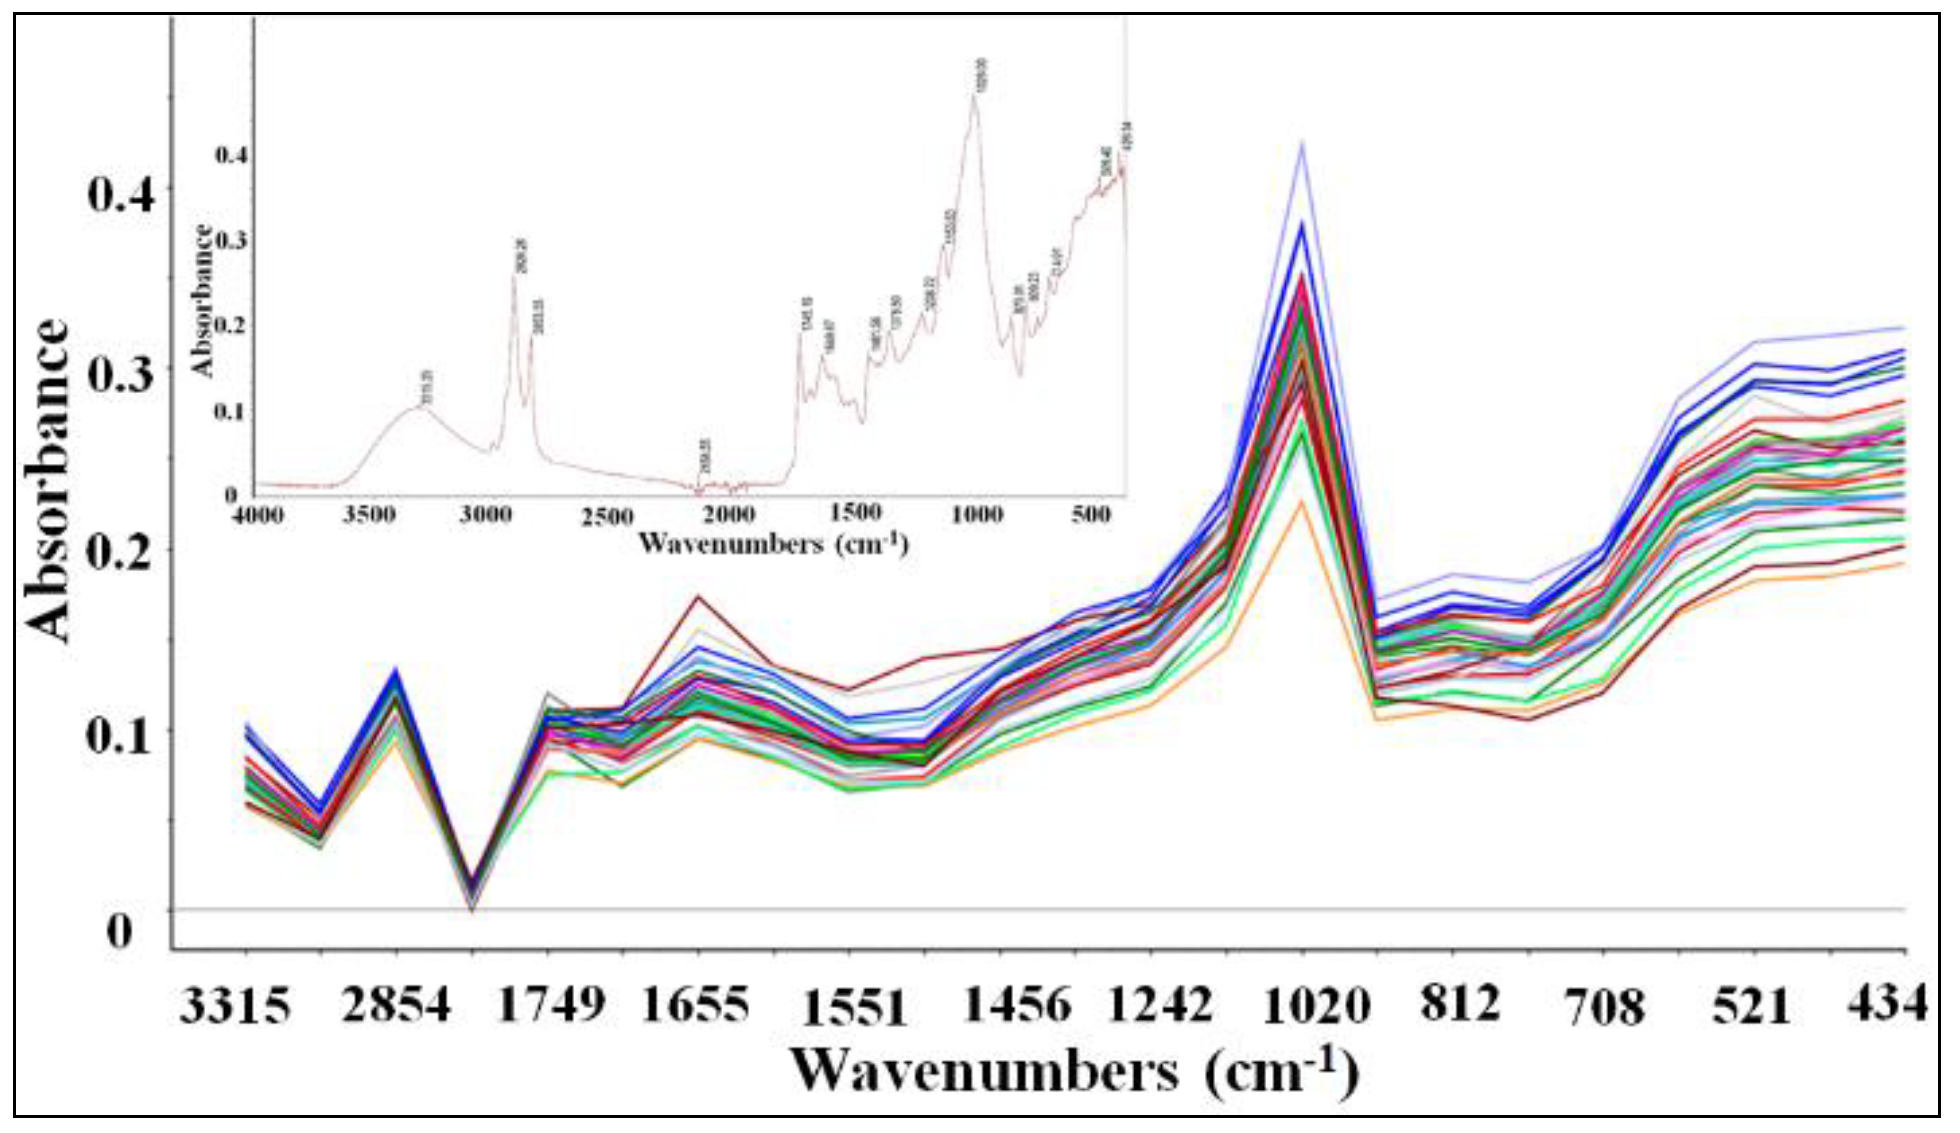
Identified functional groups included: stretching vibrations of -OH and -NH groups (3500-3050 cm−1), NH+ (3050-3000 cm−1), C-H (3000-2800 cm−1), C=O (1750-1650 cm−1), C=C (1650-1600 cm−1), C-O (1450-1000 cm−1), and deformation vibrations in the region 1000-500 cm−1.
To reduce data redundancy, only the spectral maxima were extracted for all samples. Figure 2 displays 23 selected peak intensities from the 36 coffee spectra. Visual inspection of the spectral profiles revealed insufficient resolution to discriminate coffee types by eye. Repeated measurements (n = 5) demonstrated a relative standard deviation (RSD) of 0.7%, with mean peak deviation within ±3%. Replicate samples, used to assess production-related variation, yielded an RSD of 1.0% and average deviation of ±5%.
3.2. Application of Principal Component Analysis (PCA)
Principal Component Analysis (PCA) was applied to evaluate both the origin effect and classification potential across the 36 samples. In the original dataset, many variables are expected to be correlated. PCA eliminates this redundancy via linear transformation, producing uncorrelated variables called principal components (PCs). These PCs reorder the data such that the first components retain the majority of the original information. The number of meaningful PCs is always less than the number of original variables, enabling further multivariate analysis [27]. Figure 3 shows a scree plot indicating eigenvalue and eigenvector contributions. The first two PCs accounted for 72.99% and 11.97% of total variance, respectively, together explaining over 80% of the dataset variability.
Although PCA was applicable to this dataset, it did not successfully classify coffee samples by species (see Figure 2). However, brand-based clustering within each coffee type was relatively effective. Moka and Culi samples were more clearly differentiated (Figure 3c,d and Figure 4d). The loading scatterplot (Figure 4c) indicated that wavelengths at 1947 cm−1 (combination bands and overtones) and 2854 cm−1 (intramolecular hydrogen-bonded –OH stretch) contributed most strongly to PC1, while other wavelengths contributed to the separation along PC2.
For Arabica coffee, the PCA model could clearly distinguish the Mai and M Ja brands (Figure 3a). The corresponding loading plot (Figure 4a) showed strong PC1 contributions from 766 and 870 cm−1 (deformation modes), and PC2 contributions from 1703 cm−1 (C=O stretch) and 1975 cm−1 (fingerprint region).
In the case of Robusta, the PCA model revealed some similarity between samples from Phuc Long, Duong, Vina, Me Trang, and Honey, as well as between Thu Ha and Phuong Vi. In contrast, M Ja, Trung Nguyen, and Hat A samples were distinctly separated (Figure 3b). The loading plot (Figure 4b) indicated that the 1975 cm−1 peak (fingerprint region) was the primary contributor to PC2 separation.
3.3. Application of Linear Discriminant Analysis (LDA)
Linear Discriminant Analysis (LDA) is a classification tool that constructs linear combinations (discriminant functions) of the original variables to maximize intergroup variance while minimizing intragroup variance [37,38]. When applied to the 36 sample dataset, LDA produced satisfactory discrimination. The analysis successfully separated the four coffee types: Robusta, Arabica, Moka, and Culi (Figure 5). Furthermore, brand-specific discrimination was also achieved for each type (Figure 6).
Compared to PCA, LDA demonstrated superior performance in both species-level and brand-level classification. The four coffee types were distinctly separated (Figure 5), and samples within each type were grouped according to supplier (Figure 6). In practice, differences in post-harvest processing or roasting methods between suppliers may introduce composition variability even within the same coffee type.
4. Conclusions
This study demonstrates that FTIR spectroscopy, when combined with Principal Component Analysis (PCA) and Linear Discriminant Analysis (LDA), is effective for the classification of roasted Arabica, Robusta, Moka, and Culi coffee from 17 commercial brands available in the Vietnamese market. The analytical workflow, which employs PCA followed by LDA using PC scores as input, provided clear discrimination among the coffee types.
These results represent an initial step toward developing a reliable analytical method for the classification of pure coffee products by type. Future investigations will address whether this approach can also detect blends of Arabica and Robusta. If successful, such capability would offer a rapid tool for detecting adulteration and verifying product authenticity.
References
- United States Department of Agriculture Report VM2020-0052. 2020.
- Vietnam Trade Promotion Agency. Vietnam Coffee Industry Report. 2007. [Google Scholar]
- Ukers, W. All About Coffee United States Department of Agriculture. 2009. [Google Scholar]
- Caporaso, N.; Whitworth, M.B.; Cui, C.; Fisk, I.D. Variability of single bean coffee volatile compounds of Arabica and robusta roasted coffees analysed by SPME-GC-MS. Food Research International 2018, 108, 628–640. [Google Scholar] [CrossRef]
- Ferruzzi, M.G. The influence of beverage composition on delivery of phenolic compounds from coffee and tea. Physiology & Behavior 2010, 100, 33–41. [Google Scholar] [CrossRef] [PubMed]
- Flament, I. Coffee flavor chemistry. West Sussex: John Wiley & Sons, Ltd. International Coffee Council. Country Coffee Profile: Vietnam. 124th Session 25–29 March 2019 Nairobi, Kenya.
- Lim, T.K. Coffea liberica. Edible Medicinal and Non-Medicinal Plants 2012, 710–714. [Google Scholar]
- Hai, Y.D.; Tran-Lam, T.-T.; Nguyen, T.Q.; Vu, N.D.; Ma, K.H.; Le, G.T. Acrylamide in daily food in the metropolitan area of Hanoi, Vietnam. Food Additives & Contaminants: Part B 2019, 12, 159–166. [Google Scholar] [CrossRef]
- Le, V.N.; Nguyen, Q.T.; Nguyen, T.D.; Nguyen, N.T.; Janda, T.; Szalai, G.; Le, T.G. The potential health risks and environmental pollution associated with the application of plant growth regulators in vegetable production in several suburban areas of Hanoi, Vietnam. Biologia Futura 2020, 71, 323–331. [Google Scholar] [CrossRef]
- Nguyen, T.Q.; Le, N.V.; Nguyen, T.N.; Truong, M.N.; Pham, T.T.P.; Nguyen, T.T.; Pham, D.H.; Bui, M.Q.; Nguyen, M.H.N. Analytical method development of Bifenthrin in dried meat-based foods using gas chromatography coupled to mass spectrometry. American Chemical Society (ACS) 2025. [CrossRef]
- Vu-Duc, N.; Nguyen-Quang, T.; Le-Minh, T.; Nguyen-Thi, X.; Tran, T.M.; Vu, H.A.; Nguyen, L.-A.; Doan-Duy, T.; Van Hoi, B.; Vu, C.-T.; et al. Multiresidue Pesticides Analysis of Vegetables in Vietnam by Ultrahigh-Performance Liquid Chromatography in Combination with High-Resolution Mass Spectrometry (UPLC-Orbitrap MS). Journal of Analytical Methods in Chemistry 2019, 1–12. [Google Scholar] [CrossRef]
- Dang, T.T.; Vo, T.A.; Duong, M.T.; Pham, T.M.; Van Nguyen, Q.; Nguyen, T.Q.; Bui, M.Q.; Syrbu, N.N.; Van Do, M. Heavy metals in cultured oysters (Saccostrea glomerata) and clams (Meretrix lyrata) from the northern coastal area of Vietnam. Marine Pollution Bulletin 2022, 184, 114140. [Google Scholar] [CrossRef]
- Le, V.N.; Nguyen, Q.T.; Nguyen, T.D.; Nguyen, N.T.; Janda, T.; Szalai, G.; Le, T.G. The potential health risks and environmental pollution associated with the application of plant growth regulators in vegetable production in several suburban areas of Hanoi, Vietnam. Biologia Futura 2020, 71, 323–331. [Google Scholar] [CrossRef]
- Nguyen, T.P.L.; Nguyen, V.T.A.; Do, T.T.T.; Nguyen Quang, T.; Pham, Q.L.; Le, T.T. Fatty Acid Composition, Phospholipid Molecules, and Bioactivities of Lipids of the Mud Crab Scylla paramamosain. Journal of Chemistry 2020, 1–9. [Google Scholar] [CrossRef]
- Quang Trung, N.; Thi Luyen, N.; Duc Nam, V.; Tien Dat, N. Chemical Composition and in Vitro Biological Activities of White Mulberry Syrup during Processing and Storage. Journal of Food and Nutrition Research 2018, 6, 660–664. [Google Scholar] [CrossRef]
- Nguyen, T.Q.; Tran-Lam, T.-T.; Nguyen, H.Q.; Dao, Y.H.; Le, G.T. Assessment of organic and inorganic arsenic species in Sengcu rice from terraced paddies and commercial rice from lowland paddies in Vietnam. Journal of Cereal Science 2021, 102, 103346. [Google Scholar] [CrossRef]
- Bui, M.Q.; Quan, T.C.; Nguyen, Q.T.; Tran-Lam, T.-T.; Dao, Y.H. Geographical origin traceability of Sengcu rice using elemental markers and multivariate analysis. Food Additives & Contaminants: Part B 2022, 15, 177–190. [Google Scholar] [CrossRef]
- Bui, D.T.; Truong, N.M.; Le, V.A.; Nguyen, H.K.; Bui, Q.M.; Pham, V.T.; Nguyen, Q.T. Preserving the Authenticity of ST25 Rice (Oryza sativa) from the Mekong Delta: A Multivariate Geographical Characterization Approach. Stresses 2023, 3, 653–664. [Google Scholar] [CrossRef]
- Le, L.H.T.; Tran-Lam, T.-T.; Nguyen, H.Q.; Quan, T.C.; Nguyen, T.Q.; Nguyen, D.T.; Dao, Y.H. A study on multi-mycotoxin contamination of commercial cashew nuts in Vietnam. Journal of Food Composition and Analysis 2021, 102, 104066. [Google Scholar] [CrossRef]
- Nguyen-Quang, T.; Bui-Quang, M.; Pham-Van, T.; Le-Van, N.; Nguyen-Hoang, K.; Nguyen-Minh, D.; Phung-Thi, T.; Le-Viet, A.; Tran-Ha Minh, D.; Nguyen-Tien, D.; et al. Classification of Vietnamese Cashew Nut (Anacardium occidentale L.) Products Using Statistical Algorithms Based on ICP/MS Data: A Study of Food Categorization. Journal of Analytical Methods in Chemistry 2023, 1–13. [Google Scholar] [CrossRef]
- Minh, T.N.; Van Thinh, P.; Anh, H.L.T.; Anh, L.V.; Khanh, N.H.; Van Nhan, L.; Trung, N.Q.; Dat, N.T. Chemometric classification of Vietnamese green tea (Camellia sinensis) varieties and origins using elemental profiling and FTIR spectroscopy. International Journal of Food Science and Technology 2024, 59, 9234–9244. [Google Scholar] [CrossRef]
- Truong Ngoc, M.; Nguyen, Q.T.; Pham, V.T.; Hoang, L.T.A.; Le, V.A.; Le, V.N.; Tran, H.M.D.; Nguyen, T.D. Assessing Vodka Authenticity and Origin in Vietnam’s Market: An Analytical Approach Using FTIR and ICP-MS with Multivariate Statistics. Journal of Analytical Methods in Chemistry 2024. [Google Scholar] [CrossRef]
- Flament, I. Coffee Flavor Chemistry; Wiley, 2002. [Google Scholar]
- Bicchi, C.P.; Panero, O.M.; Pellegrino, G.M.; Vanni, A.C. Characterization of Roasted Coffee and Coffee Beverages by Solid Phase Microextraction−Gas Chromatography and Principal Component Analysis. Journal of Agricultural and Food Chemistry 1997, 45, 4680–4686. [Google Scholar] [CrossRef]
- Lyman, D.J.; Benck, R.; Dell, S.; Merle, S.; Murray-Wijelath, J. FTIR-ATR Analysis of Brewed Coffee: Effect of Roasting Conditions. Journal of Agricultural and Food Chemistry 2003, 51, 3268–3272. [Google Scholar] [CrossRef] [PubMed]
- Santos, J.R.; Sarraguça, M.C.; Rangel, A.O.S.S.; Lopes, J.A. Evaluation of green coffee beans quality using near infrared spectroscopy: A quantitative approach. Food Chemistry 2012, 135, 1828–1835. [Google Scholar] [CrossRef] [PubMed]
- Kemsley, E. Discrimination between Coffea arabica and Coffea canephora variant robusta beans using infrared spectroscopy. Food Chemistry 1995, 54, 321–326. [Google Scholar] [CrossRef]
- Wang, J.; Jun, S.; Bittenbender, H.C.; Gautz, L.; Li, Q.X. Fourier Transform Infrared Spectroscopy for Kona Coffee Authentication. Journal of Food Science 2009, 74. [Google Scholar] [CrossRef]
- Mardia, K.V. Mahalanobis distances and angles. In Multivariate Analysis; Krishnaiah, P.R., Ed.; North-Holland: Amsterdam, The Netherlands, 1977; Volume 495, pp. 5–11. [Google Scholar]
- Jolliffe, I.T. Principal Components Analysis; Springer: New York, NY, USA, 1986. [Google Scholar]
- Nguyen-Quang, T.; Bui-Quang, M.; Truong-Ngoc, M. Rapid Identification of Geographical Origin of Commercial Soybean Marketed in Vietnam by ICP-MS. Journal of Analytical Methods in Chemistry 2021, 1–9. [Google Scholar] [CrossRef]
- Nguyen Thi, K.-O.; Do, H.-G.; Duong, N.-T.; Nguyen, T.D.; Nguyen, Q.-T. Geographical Discrimination of Curcuma longa L. in Vietnam Based on LC-HRMS Metabolomics. Natural Product Communications 2021, 16. [Google Scholar] [CrossRef]
- Le, V.N.; Nguyen, Q.T.; Nguyen, N.T.; Le, T.G.; Janda, T.; Szalai, G.; Rui, Y.-K. Simultaneous determination of plant endogenous hormones in green mustard by liquid chromatography—Tandem mass spectrometry. Chinese Journal of Analytical Chemistry 2021, 49, 111–117. [Google Scholar] [CrossRef]
- Nguyen, Q.; Nguyen, T.; Le, V.; Nguyen, N.; Truong, N.; Hoang, M.; Pham, T.; Bui, Q. Towards a Standardized Approach for the Geographical Traceability of Plant Foods Using Inductively Coupled Plasma Mass Spectrometry (ICP-MS) and Principal Component Analysis (PCA). Foods 2023, 12, 1848. [Google Scholar] [CrossRef]
- Nguyen-Quang, T.; Do-Hoang, G.; Truong-Ngoc, M. Multielement Analysis of Pakchoi (Brassica rapa L. ssp. chinensis) by ICP-MS and Their Classification according to Different Small Geographical Origins. Journal of Analytical Methods in Chemistry 2021, 1–11. [Google Scholar] [CrossRef]
- Mottaz, C.J. The Relative Importance of Intrinsic and Extrinsic Rewards as Determinants of Work Satisfaction. The Sociological Quarterly 1985, 26, 365–385. [Google Scholar] [CrossRef]
- Bui, Q.M.; Nguyen, Q.T.; Nguyen, T.T.; Nguyen, H.M.; Phung, T.T.; Le, V.A.; Truong, N.M.; Mac, T.V.; Nguyen, T.D.; Hoang, L.T.A.; et al. Multivariate Statistical Analysis for the Classification of Sausages Based on Physicochemical Attributes, Using Attenuated Total Reflectance-Fourier Transform Infrared (ATR-FTIR) and Inductively Coupled Plasma-Mass Spectrometry (ICP-MS). Journal of Analytical Methods in Chemistry 2024, 1–13. [Google Scholar] [CrossRef] [PubMed]
- Barbin, D.F.; Felicio ALde, S.M.; Sun, D.-W.; Nixdorf, S.L.; Hirooka, E.Y. Application of infrared spectral techniques on quality and compositional attributes of coffee: An overview. Food Research International 2014, 61, 23–32. [Google Scholar] [CrossRef]
Figure 2.
Classification results using PCA.
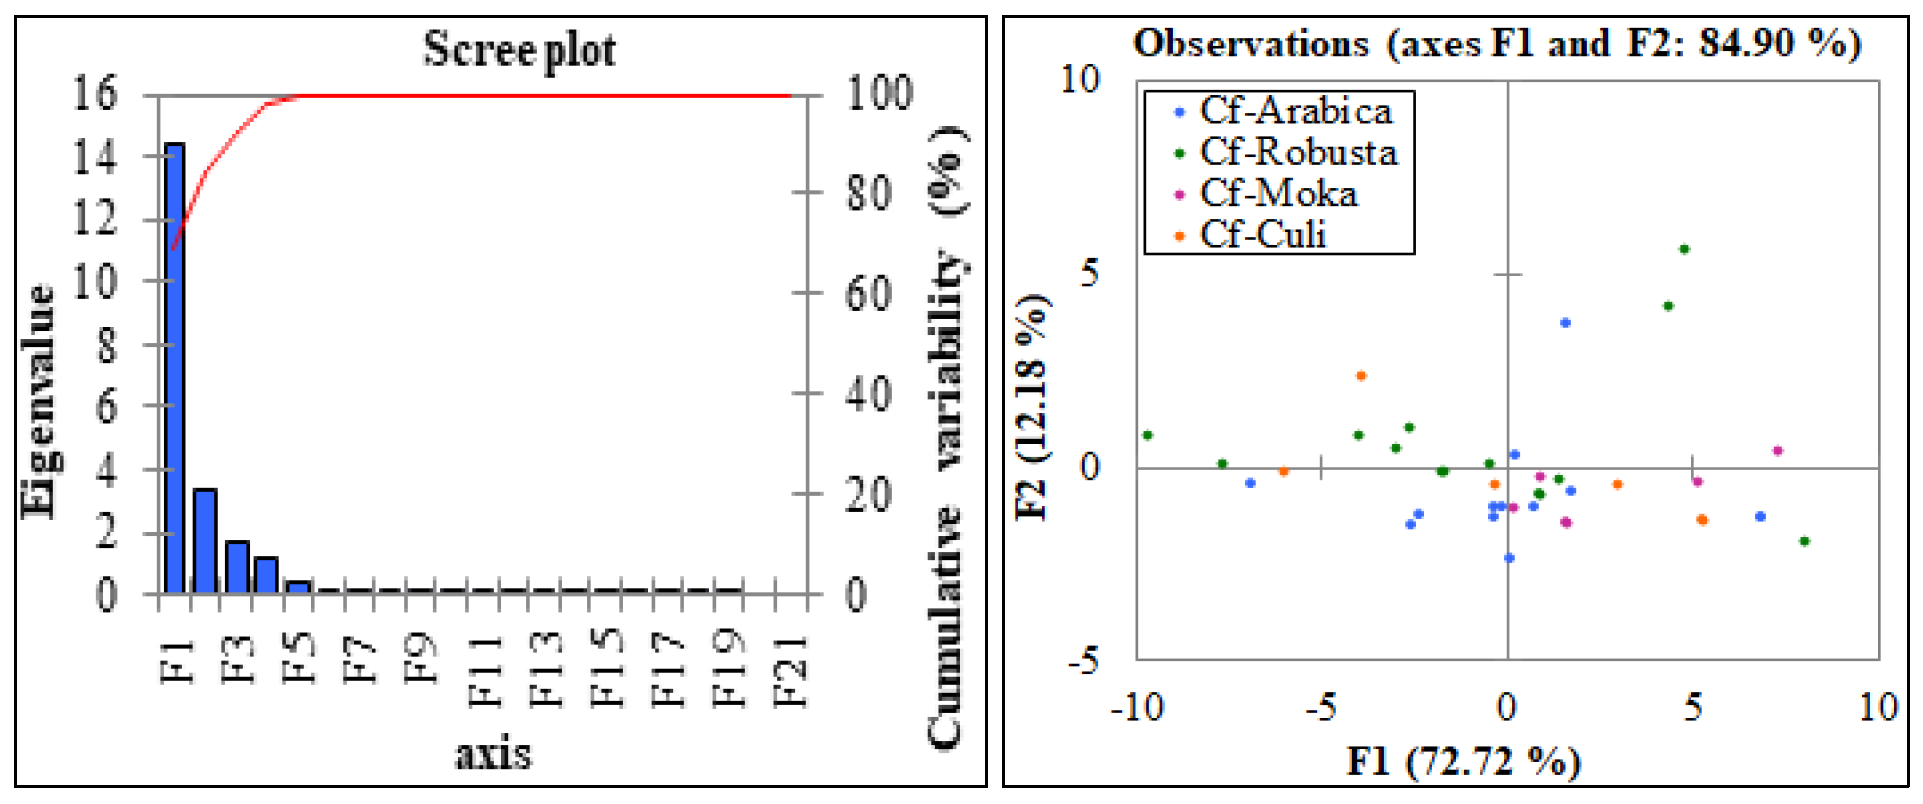
Figure 3.
PCA brand discrimination within Arabica (a), Robusta (b), Moka (c), and Culi (d) samples.
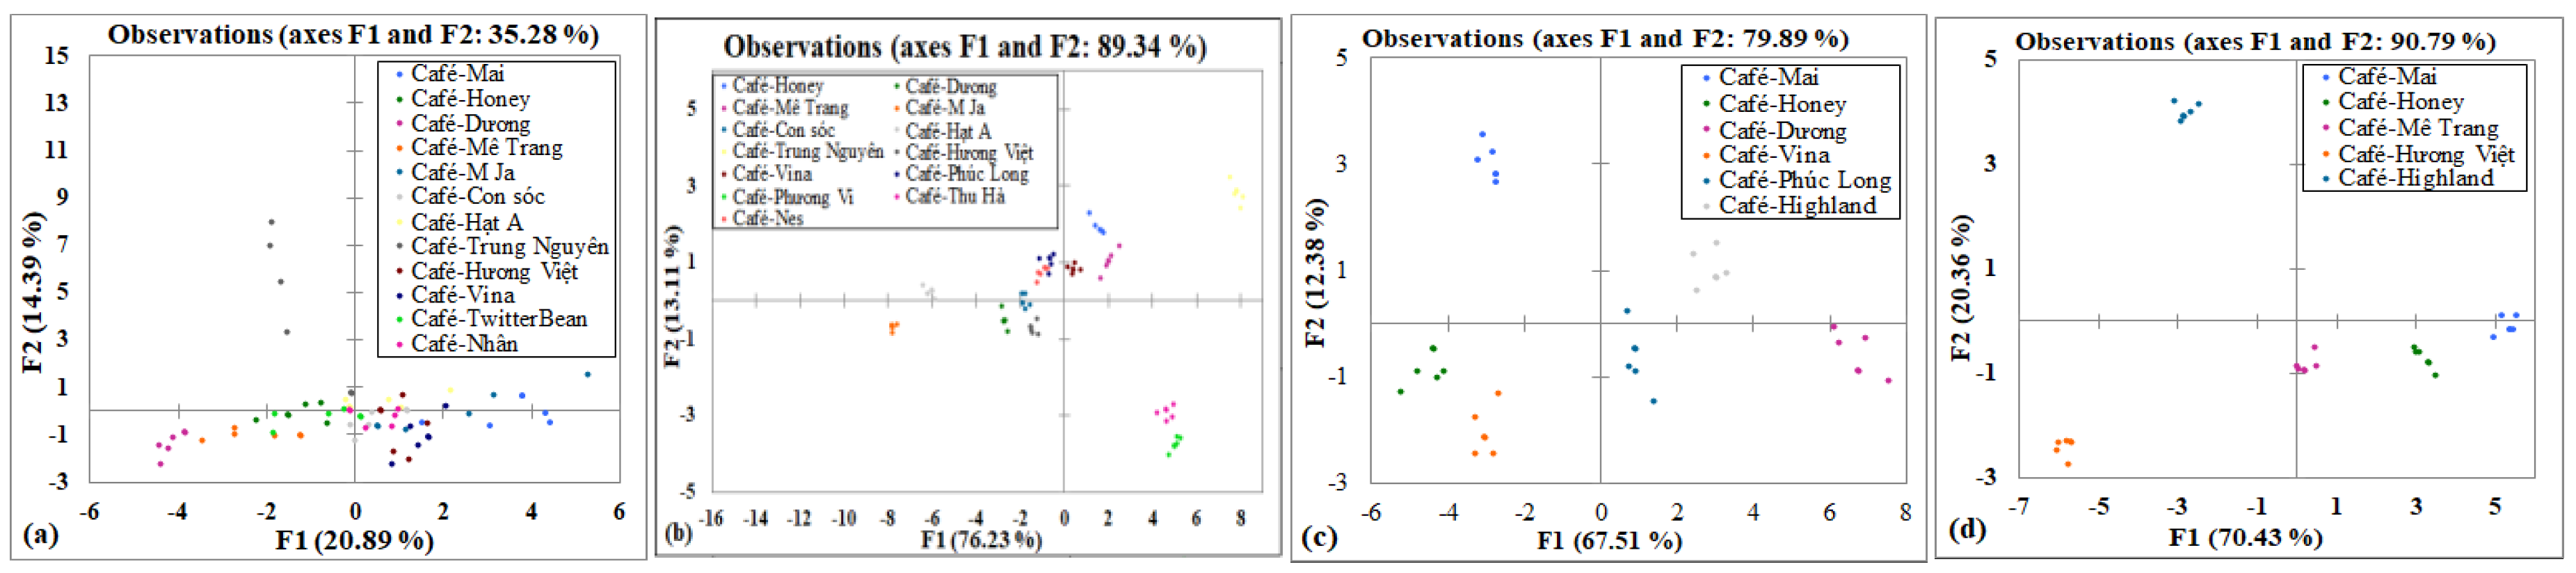
Figure 4.
PCA loading scatterplots for Arabica (a), Robusta (b), Moka (c), and Culi (d) samples.
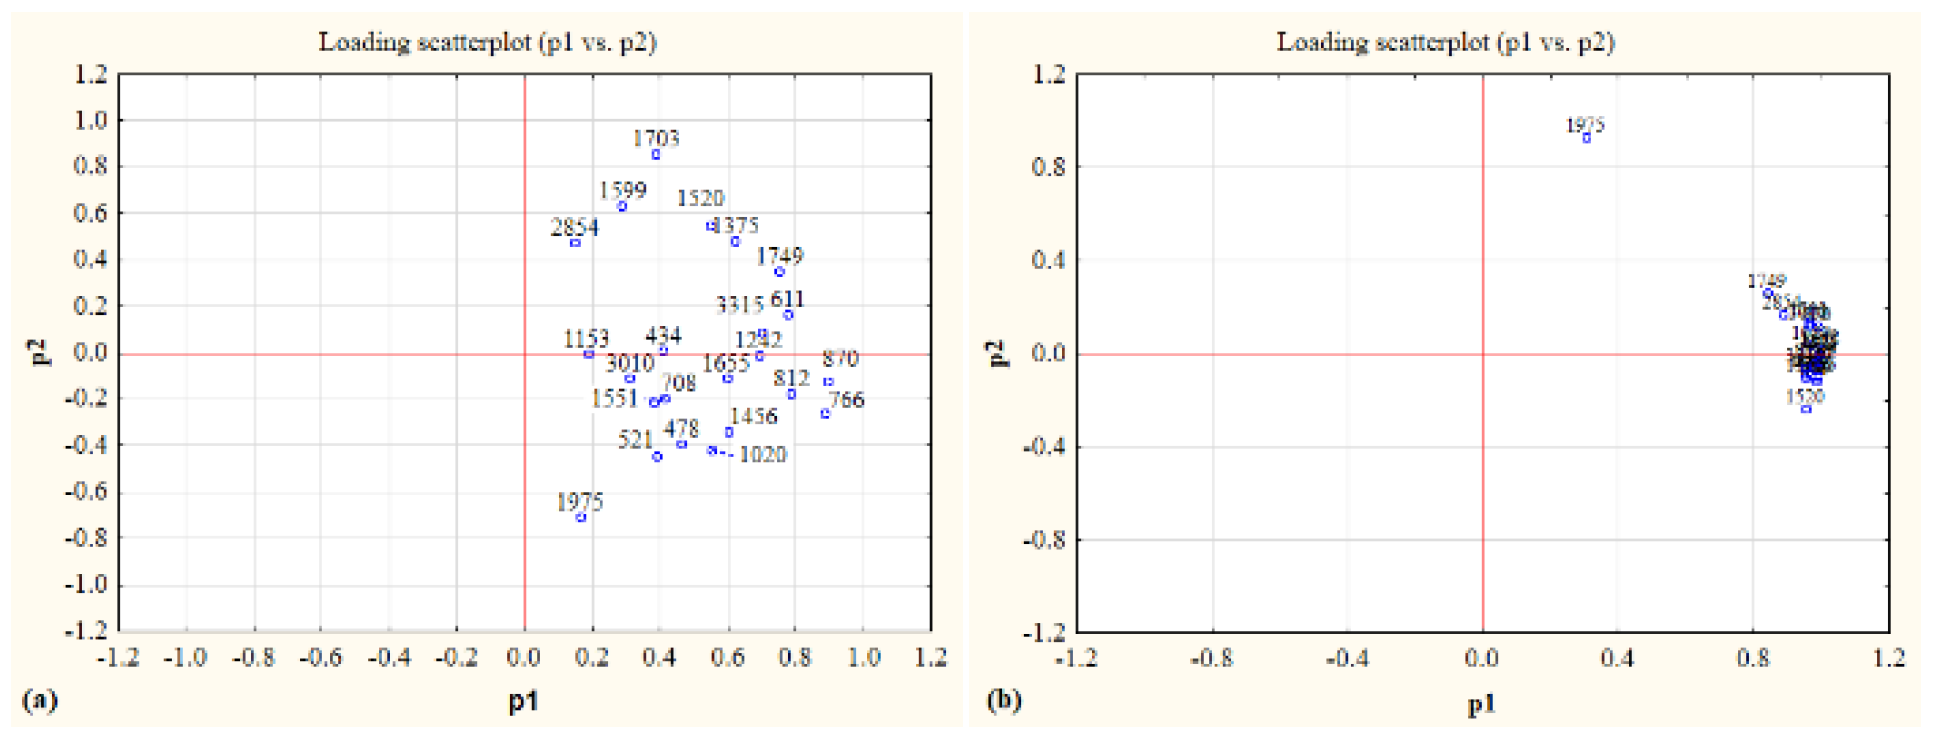
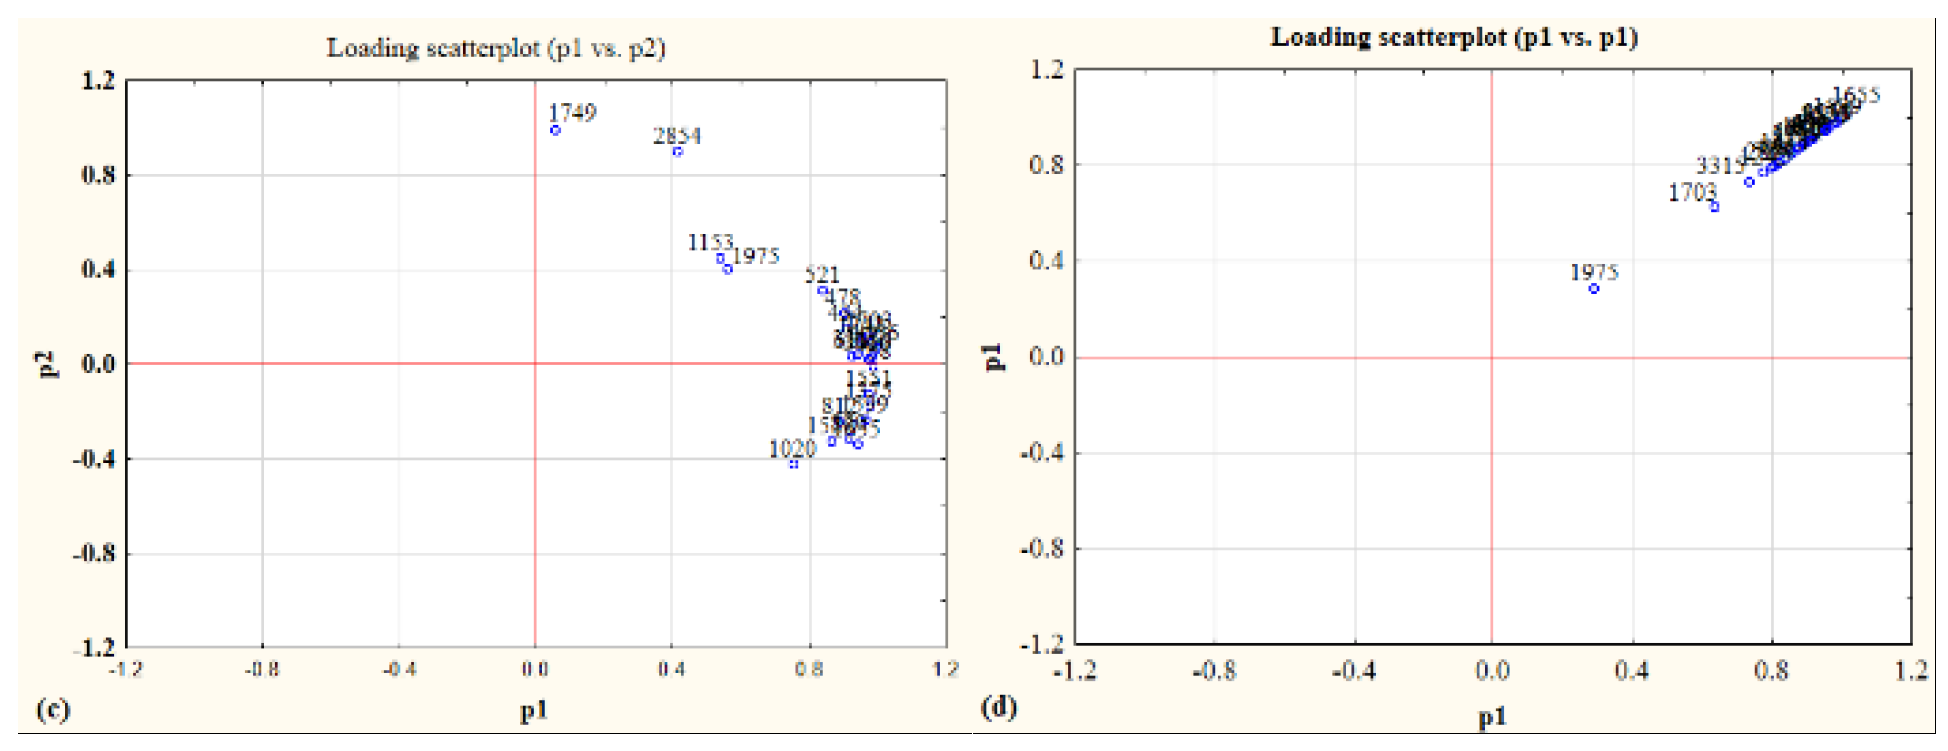
Figure 5.
Discriminant analysis results for coffee type classification.
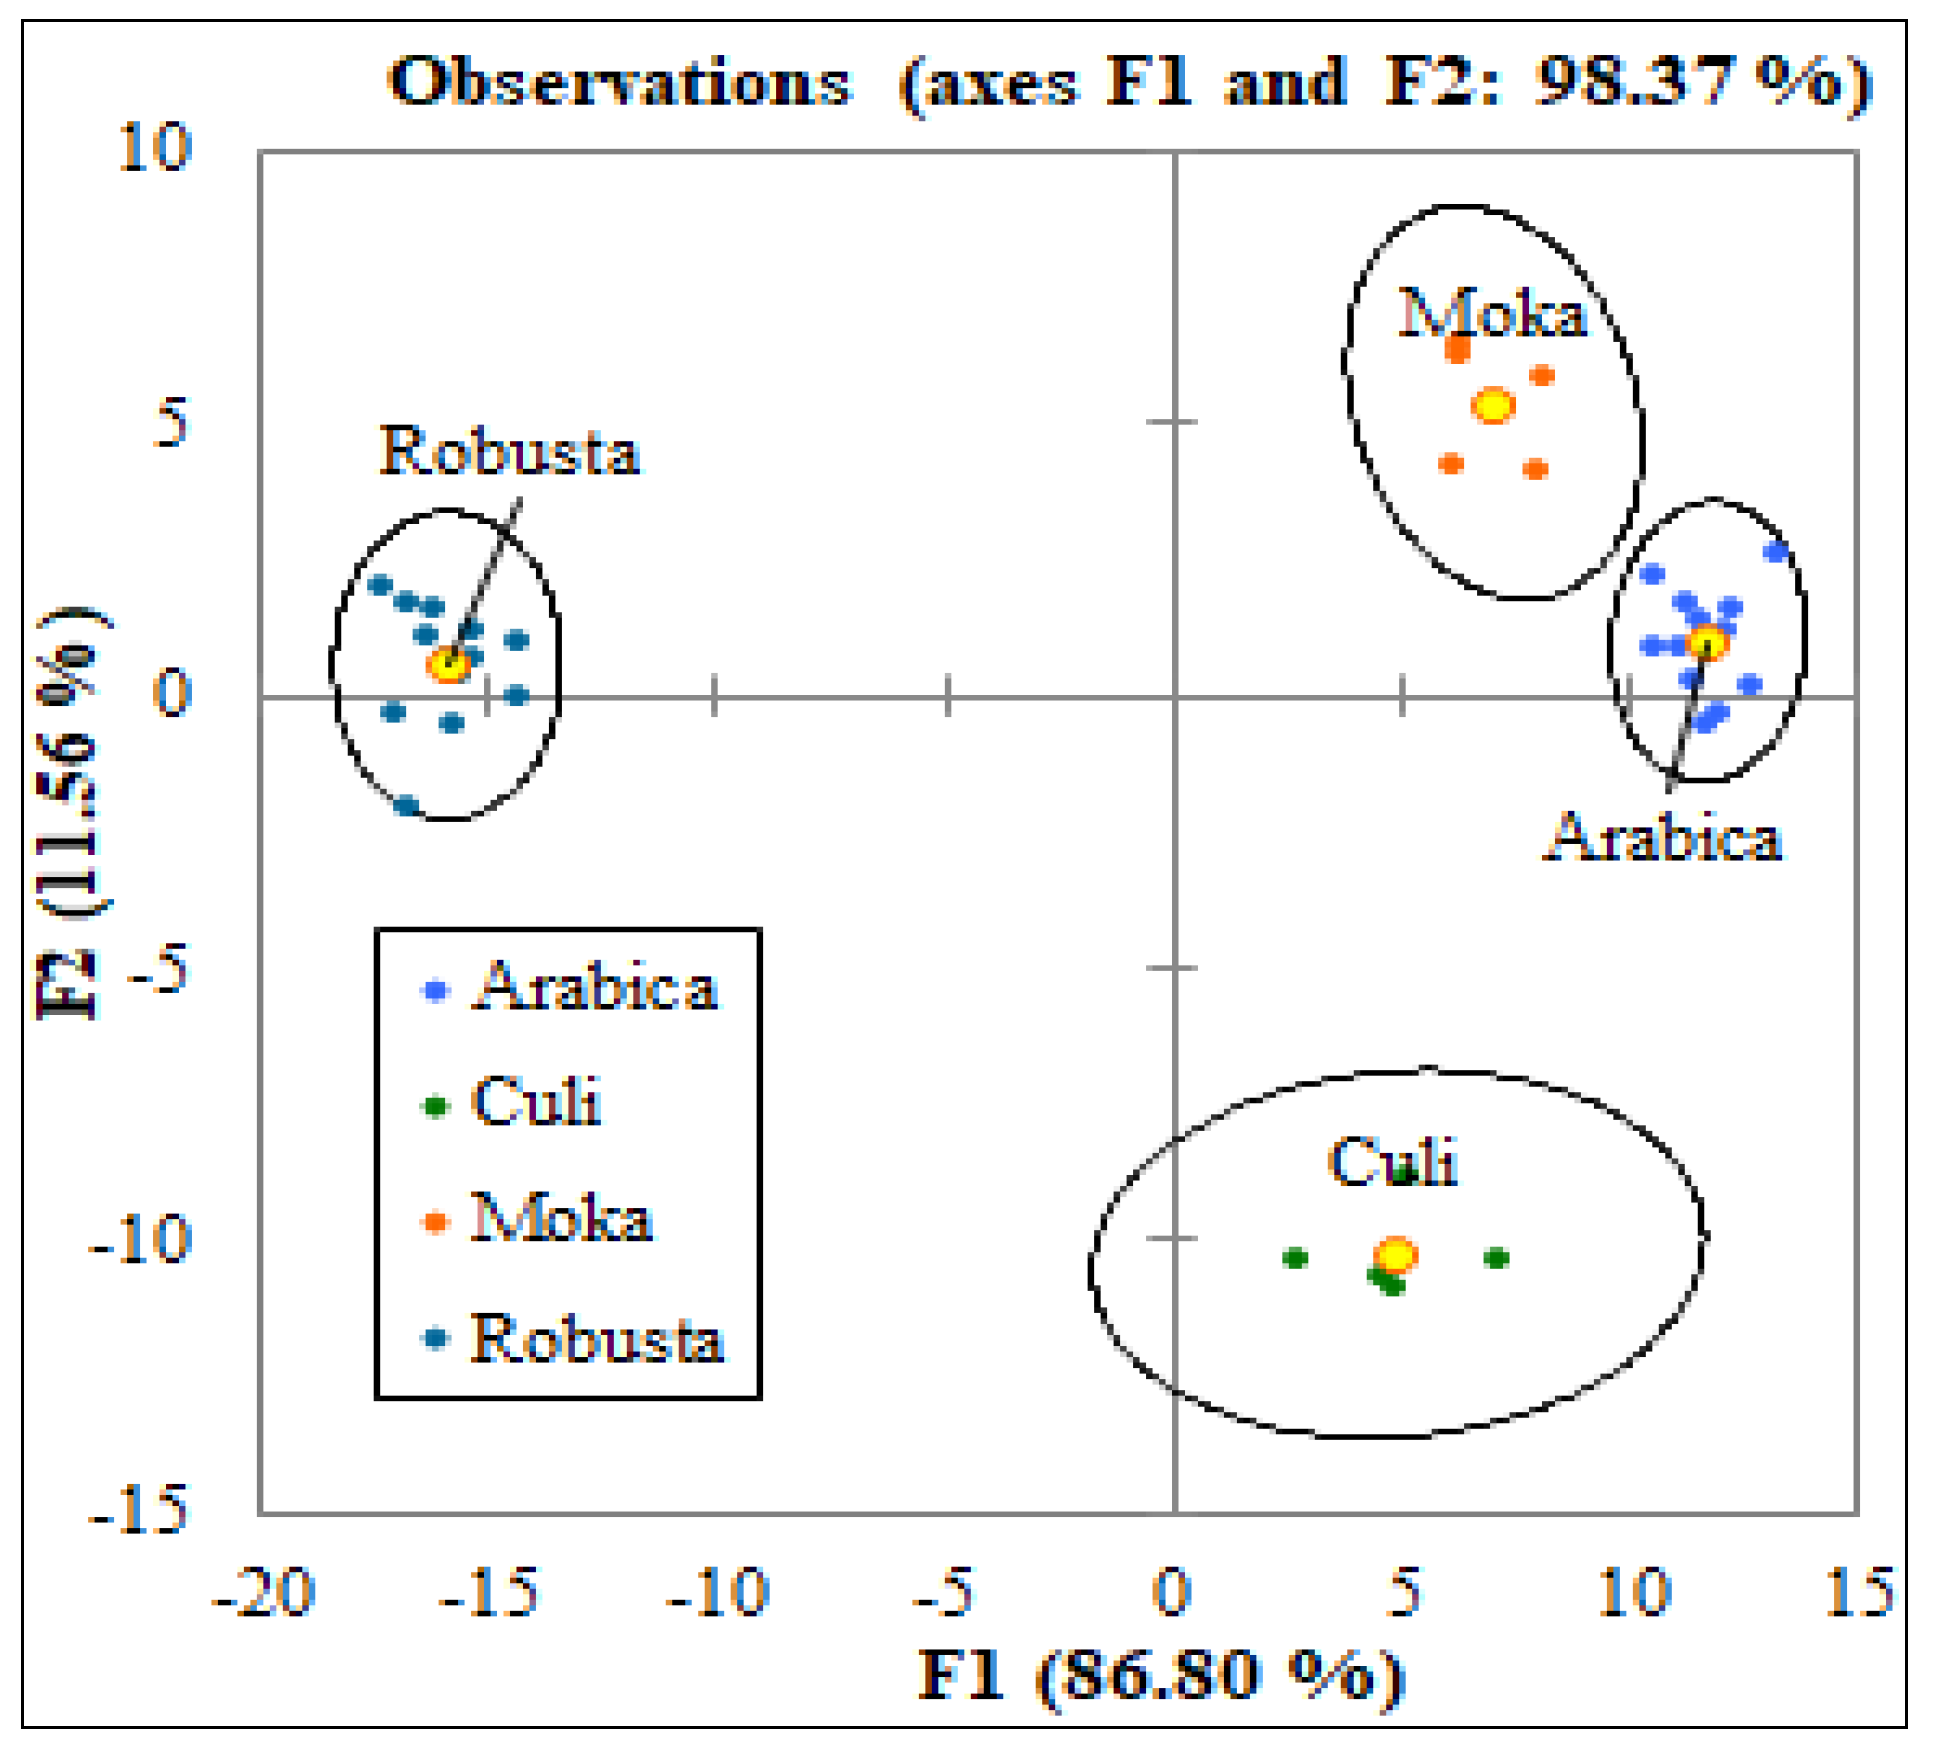
Figure 6.
Brand discrimination using LDA for Arabica (a), Robusta (b), Moka (c), and Culi (d).
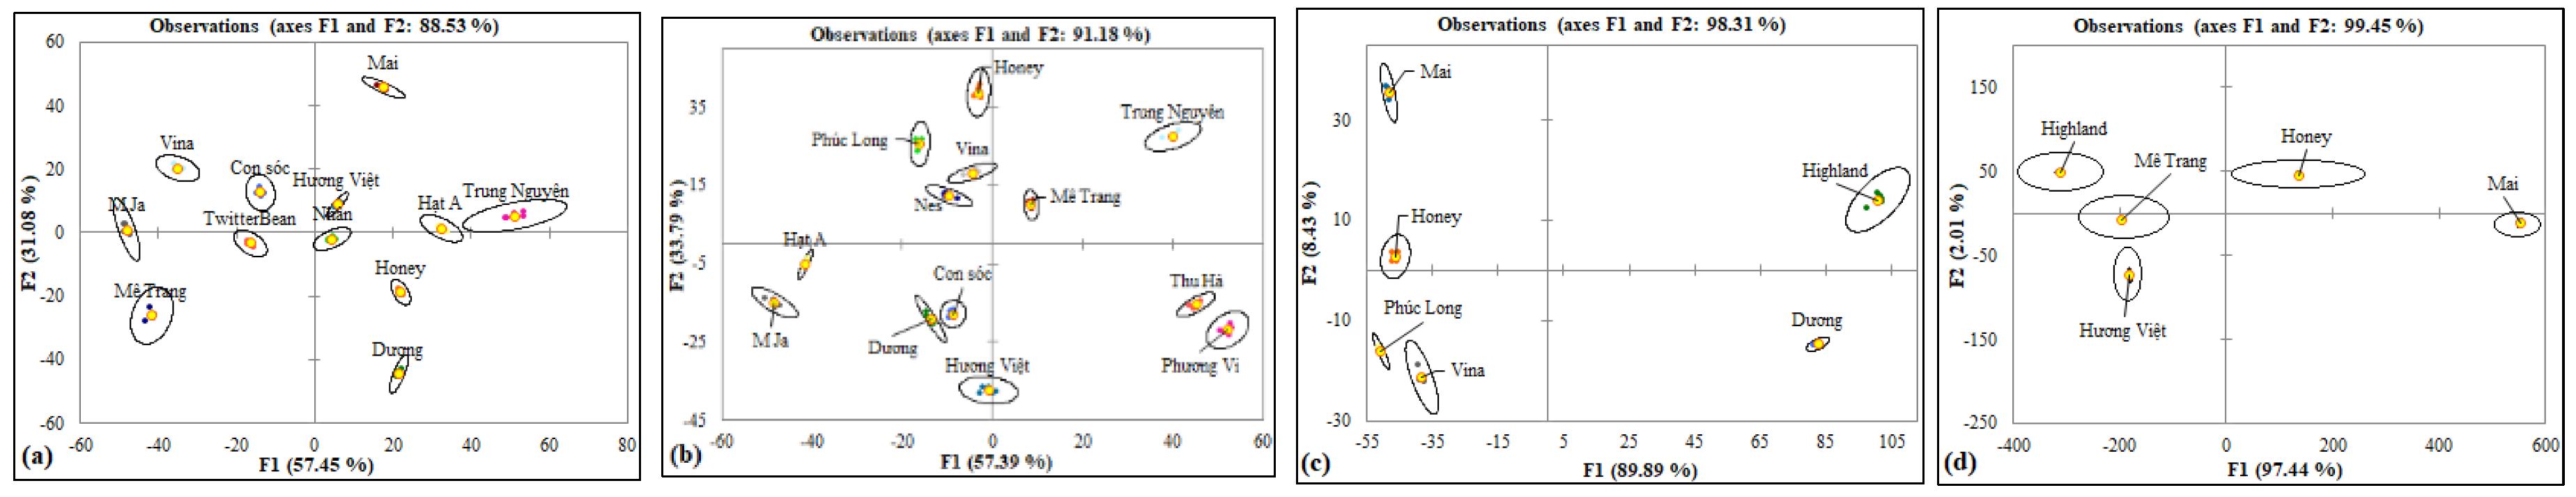

Table 1.
Sample information, brand names, and abbreviations.
| Brand | Sample information | |||
|---|---|---|---|---|
| Arabica | Robusta | Moka | Culi | |
| Mai | A1 | - | M1 | Cu1 |
| Honey | A2 | R2 | M2 | Cu2 |
| Dương | A3 | R3 | M3 | - |
| Mê Trang | A4 | R4 | - | Cu4 |
| M Ja | A5 | R5 | - | - |
| Con soc | A6 | R6 | - | - |
| Hat A | A7 | R7 | - | - |
| Trung Nguyen | A8 | R8 | - | - |
| Huong Viet | A9 | R9 | - | Cu9 |
| Vinacafe | A10 | R10 | M10 | - |
| Phuc Long | - | R11 | M11 | - |
| TwitterBean | A12 | - | - | - |
| Nhan | A13 | - | - | - |
| Phuong Vi | - | R14 | - | - |
| Thu Ha | - | R15 | - | - |
| Nescafe | - | R16 | - | - |
| Highland | - | - | M17 | Cu17 |
Disclaimer/Publisher’s Note: The statements, opinions and data contained in all publications are solely those of the individual author(s) and contributor(s) and not of MDPI and/or the editor(s). MDPI and/or the editor(s) disclaim responsibility for any injury to people or property resulting from any ideas, methods, instructions or products referred to in the content. |
© 2025 by the authors. Licensee MDPI, Basel, Switzerland. This article is an open access article distributed under the terms and conditions of the Creative Commons Attribution (CC BY) license (http://creativecommons.org/licenses/by/4.0/).
Copyright: This open access article is published under a Creative Commons CC BY 4.0 license, which permit the free download, distribution, and reuse, provided that the author and preprint are cited in any reuse.


