Submitted:
11 June 2025
Posted:
12 June 2025
You are already at the latest version
Abstract
Aronia (Aronia mitschurinii) is a contender to be amongst the most lucrative superfruits due to its incredibly potent antioxidant capabilities and extremely high content of anthocyanins. The high tannin and sorbitol content, however, limit Aronia’s widespread use and popularity due to bitter aftertaste and potential indigestions if consumed in large amounts. This study attempts to overcome the drawbacks and take advantage of antioxidants by creating a marketable power aid drinks that uses Aronia juice as a base, with the capability to compete on the market with popular sports beverages by being the only all-natural, organic, sugar-, colorants-, and preservants-free power aid on the market that claims on its labels polyphenols, flavonoids, anthocyanins, and some beneficial cations such as magnesium, selenium, iron and zinc, along with traditional sodium and potassium. Creating a power drink from Aronia requires resolving challenges presented by notably astringent taste of tannins, as well as the associated health issues relating to the over-consumption of excess sorbitol. In addition to this, the incorporation of herbal teas, organic flavorings, other superfruits, and even juvenile ginger for variety of flavors allows for the amalgamation of various additional health benefits and valuable essential oils and vitamins into the drink. Alkaloids, saponins, and anthraquinones are among the phytochemicals whose presence has been confirmed by preliminary screening results in addition to antioxidants and minerals. Further quantitative analysis of created drink formulations has shown ample amounts of anthocyanins (35mg/g Cyanidin-3-Glucoside Equivalents), flavonoids (2mg/g Quercetin Equivalents), and polyphenols (21mg/g Gallic Acid Equivalents) – even after the pasteurization process. The formulations of drinks, full phytochemical characterization, and results of initial public surveys are presented in this paper.
Keywords:
Aronia mitschurinii
; juvenile ginger
; holy basil
; power aid drinks
; phytochemical analysis
; all-organic
; sugar-free
; minerals
; antioxidants
1. Introduction
Aronia mitschurinii is a fruit-bearing shrub that is an intergeneric hybrid of Aronia melanocarpa and Sorbus aucuparia, bred by Russian scientist Ivan Mitschurin in the late 19th century. The genus Aronia is native to the eastern United States, and the hybrid Aronia mitschurinii is cultivated throughout the United States, including the eastern shore of Maryland [1]. Aronia is part of the Rosaceae family along with apples and pears but is hardy and very resistant to disease and most pests. It can also be grown more sustainably than other fruits commonly grown along the eastern coast of the US and in eastern Europe. This makes Aronia a desirable crop for farmers due to the feasibility of growing and the manageability of cultivating the crop organically. Recent investigations centered around cultural management [2] delved into the ramifications of nitrogen (N) application rates and forms, alongside planting density, on both fruit yield and quality. A comparison between nitrogen rates of 14g N per plant per year and 3g N per plant per year, administered as dry granules at the plant base, highlighted substantially elevated yields from plants subjected to the higher nitrogen rate across most years of analysis. The fruit is widely known to contain a high content of antioxidants and phenolic acids and has a dark red/purple color. Due to the ripening stage of cultivation, during harvest, the anthocyanin pigment concentration (APC) can range from 88-300 mg/g cyanidin-3-glucoside, which is approximately 15x greater than that found in blueberries. Although Aronia melanocarpa has a higher antioxidant content than Aronia mitschurinii, Aronia mitschurinii still produces significantly more fruit than Aronia melanocarpa, making it better for commercial production. In addition to this, and contrasting itself from other fruits and berries, Aronia mitschurinii contains polyphenols not only in its skin but also throughout the pulp, culminating in one of the highest known concentrations of antioxidants in any fruit [3]. Phytochemical analysis, as detailed in the literature for extracts from whole fruits [4,5], and conducted on Aronia mitschurinii juice, has highlighted aronia as a notable source of flavonoids, glycosides, phytosterols, alkaloids, sugars, and tannins. With significant levels of cellulose, pectin, and lignin, as well as a variety of minerals and vitamins, Aronia is an excellent source of dietary fiber in addition to its antioxidant content [6]. Furthermore, aronia has been shown to have anti-inflammatory, anti-cancer, anti-mutagenic, and antidiabetic properties. It also helps prevent liver damage and cardiovascular disease [7]. In addition to this, Aronia has also been found to decrease the accumulation of cadmium in the liver and kidneys [8].
Aronia’s market potential is due in part to its antioxidant content. More specifically, it is one of the richest sources of anthocyanins, flavanols, and polyphenols. However, the reason it remains untapped in the market is due to its astringent taste. This astringency is due to the tannin content present in Aronia; A phenolic compound also present in teas, which gives it a characteristically bitter taste. Aronia also contains a high concentration of sorbitol, a sugar-alcohol product of photosynthesis in plants [9], which is sometimes used as a sugar substitute in diet foods that can cause indigestion when consumed in excess. To circumvent sorbitol in drink products, concentrated Aronia juice must be diluted, reducing the overall concentration of sorbitol consumed while also alleviating bitterness due to the tannins.
Zingiber Officinale, more commonly known as Ginger, is a member of the Zingiberaceae plant family, home to other familiar plants such as cardamon and turmeric, and Ginger itself is a significant source of pungent ketones such as gingerol, giving ginger its characteristically strong aroma. Baby ginger separates itself from its mature counterpart by having a larger ratio of phytochemical activity; reportedly yielding twice the amount of phenolics, and up to three times the amount of antioxidant activity. Notable phytochemicals in Zingiber Officinale derived from its powdered form include polyphenolic compounds such as gingerol, saponins (4.01mg/100g), cyanogenic glycoside, phytin (0.28mg/100g), oxalate (0.26mg/100g), terpenes and tannins (0.02mg/100g) among various other essential oils and amino acids [10]. The primary bioactive compounds being those of 6-Gingerol, 6-Shogaol, zingerone, phenolics and flavonoids [11] 6-gingerol has been studied as a major contributor towards preventing obesity in the past, and since then, 6-shogaol has even been shown to inhibit lipid accumulation and inhibit adipogenesis, the accumulation of adipocytes as adipose tissue throughout the body. This adipose tissue is primarily used by the body for storing fat, which, in excess, leads to obesity. Fresh ginger is believed to have a potent effect in reducing obesity, and the major contributors in reducing obesity in processed ginger are the enriched shogaols and gingernone [12]. When combined in the drink formulation, it may be possible to harness the slew of health benefits of both the Aronia and Ginger plants, as well as potentially being a weight loss alternative.
Power drinks, often paralleled with energy drinks or sports drinks, by definition, are drinks that are said to provide benefits towards health and wellness in the human body. They provide health and wellness benefits to many people as they replenish the lost water in our bodies and give us electrolytes, which causes our bodies to regain energy. They are classified into three categories: isotonic, which means they have the same concentrations of glucose and sodium as the human body, hypertonic, with a greater quantity of sugar and sodium, and hypotonic, with a reduced amount of sugar and sodium.
Gatorade, for example, is an isotonic power drink that was designed to replenish lost water and electrolytes in the human body due to sweat or other causes. Other drinks, such as Vitamin Water, take a different approach and target vitamin deficiency within consumers. Within the body, there are four essential nutrient groups: vitamins, essential fatty acids, essential amino acids, and minerals. The distinction between organic and inorganic minerals dictates the nutritional value that can be obtained from dietary consumption. Chemically speaking, inorganic minerals are bonded to inorganic molecules such as sulfates or oxides, and though they are easy to produce, they suffer from diminished absorption, retention, and utilization within the human body [13]. Organic minerals are generally bonded to carbon-containing molecules and generally do not face the same issues as their inorganic counterparts, being that they are easily absorbed, retained, and utilized by the human body. Organic minerals come from the natural plant and animal foods we consume and lend themselves to greater bioavailability than inorganic minerals from soil or rocks, which then get processed into widely popular drinks and supplements. Sweeteners are among the most common ingredients in drink products, and are generally found under the umbrella of nutritive, or non-nutritive sweeteners. Carbohydrates that occur naturally in food, are added during food processing, or are incorporated by consumers prior to ingestion are known as nutritional sweeteners. Increased sugar consumption is linked to greater intake of calories, but it also degrades the quality of the diet. Obesity, prediabetes, type 2 diabetes, and cardiovascular disease are all made more likely by this.
A subgroup of these nutritive sweeteners, known as polyols, or sugar alcohols, lowers the amount of energy acquired from products and the risk of cavities, while retaining sweetness. The FDA considers non-natural sugars to be safe food additives that sweeten products with little to no carbohydrate energy. Acesulfame K, aspartame, luo han guo fruit extract, neotame, saccharin, sucralose, and stevia are among the non-natural sugars that are permitted for usage in the United States; stevia was selected as the sweetener for the power drink with an aronia base [14].
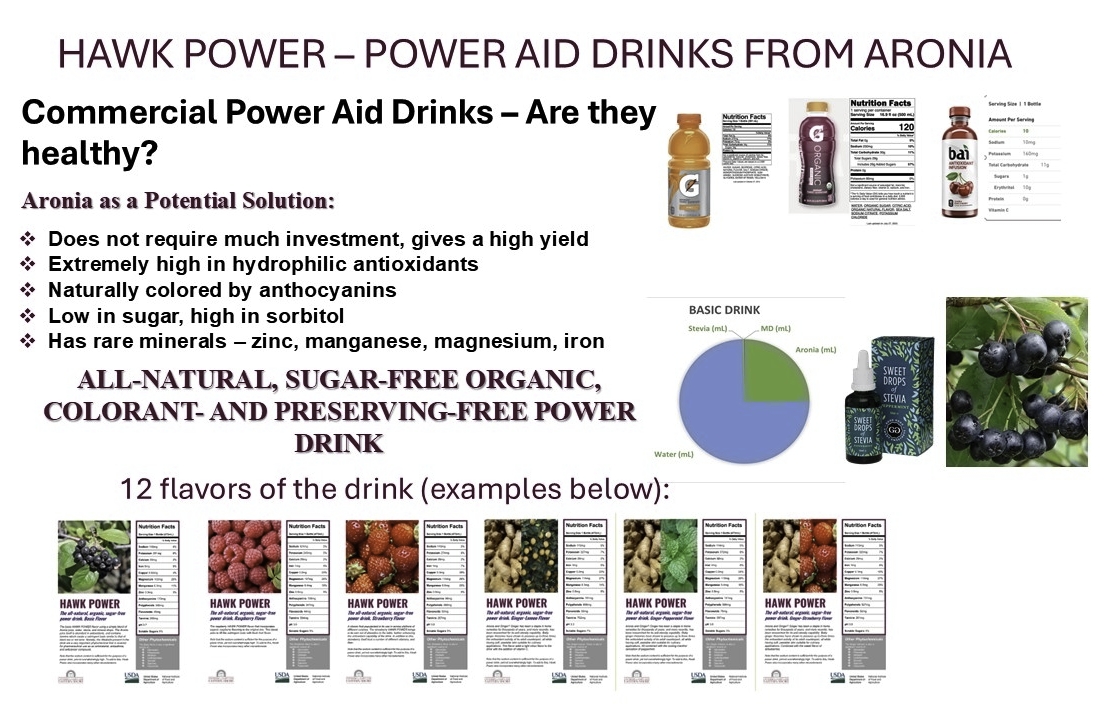
Aronia fruit’s incredibly high antioxidant content, naturally red-wine color, sorbitol as a preservative, and rich minerals and microelement palate make it an ideal candidate to use in the form of a power drink. In addition to this, Aronia contains vital minerals and microelements, making it an excellent candidate for a drink in the market promoting a healthy lifestyle. Here we present the development and characterization of a line of aronia-based power aid drinks. The Aronia-based power drinks aim to work around existing drawbacks of traditional power drinks by being all natural, organic, free of artificial colorant and flavorings, sugar free, containing a wide range of antioxidants, terpenes, essential oils, minerals, and microelements, using organic additives like herbal teas or similar berries for essential oils or other phytochemicals and finally by advertising the health benefits of the drink clearly on the label. Formulations, phytochemical characterization, nutrition information, and consumer feedback have been analyzed for the beverages made from aronia fruit, along with mineral content information found on traditional nutrition labels.
2. Materials and Methods
General information. Thermo Fischer Scientific™ aluminum chloride (99% extra pure, anhydrous, granules), ethyl alcohol (99% ACS spectroscopic grade), and quercetin hydrate (95%). Potassium acetate (certified ACS Crystalline), Na2CO3 anhydrous (HPLC grade powder), FeCl3 (anhydrous), 37% HCl (certified ACS), chloroform (Reagent ACS), H2SO4 (certified ACS), tannic acid, tetrazolium blue chloride, and glacial acetic acid were all purchased from Fisher Scientific™. MP Biomedicals (Santa Ana, CA) supplied the gallic acid monohydrate (ACS reagent grade) and Folin and Ciocalteu's Phenol reagent. Sodium acetate (Sigma Ultra minimum 99.0%) was obtained from Sigma-Aldrich. In every experiment, double-distilled water was used. The spectrophotometer used for all UV/Vis analyses was the Cary60. A Thermo ScientificTM Orion Star A212 tabletop conductometer was used to measure the conductivity. A Mettler ToledoTM FiveEasy tabletop pH meter was used to measure the pH.
Brix refractometry was conducted using a Fisherbrand™ HDR-P1 portable brix refractometer. Drink formulations consisted of Trace™ Organic trace mineral drops, FGO™ organic earl grey, chamomile, and peppermint tea, Herbal Hermit™ organic yerba mate tea, Nature Restore™ organic strawberry and raspberry powder, Micro-ingredients™ organic lemon juice powder, ECO-Taste™ freeze-dried organic fig powder, and Pure Mountain Botanicals™ Organic liquid stevia.
Drink formulations. Samples for the power drink analysis were created following the determination of the best-tasting prototype.
The basic 16oz bottle (473mL), total volume consisted of 59mL Aronia juice, 0.6mL of stevia, 1mL mineral drops, 414mL distilled water, and 0.5g of iodized salt.
The raspberry 16oz bottle (473mL), total volume consisted of 59mL Aronia juice, 0.6mL of stevia, 1mL mineral drops, 414mL distilled water, and 0.5g of iodized table salt combined with 6g of organic raspberry powder.
The strawberry 16oz bottle (473mL), total volume consisted of 59mL Aronia juice, 0.6mL of stevia, 1mL mineral drops, 414mL distilled water, and 0.5g of iodized table salt combined with 6g of organic strawberry powder.
The fig flavor 16oz bottle (473mL), total volume consisted of 59mL Aronia juice, 0.6mL of stevia, 1mL mineral drops, 414mL distilled water, and 0.5g of iodized table salt combined with 6g of organic fig powder.
The chamomile 16oz bottle (473mL), total volume consisted of 59mL Aronia juice, 0.6mL of stevia, 1mL mineral drops, 1 teabag of organic chamomile tea steeped in 414mL distilled water for five minutes at 100℃, and 0.5g of iodized table salt.
The yerba mate 16oz bottle (473mL), total volume consisted of 59mL Aronia juice, 0.6mL of stevia, 1mL mineral drops, 1 teabag of organic yerba mate tea steeped in 414mL distilled water for five minutes at 100℃, and 0.5g of iodized table salt.
The peppermint 16oz bottle (473mL), total volume consisted of 59mL Aronia juice, 0.6mL of stevia, 1mL mineral drops, 1 teabag of organic peppermint tea steeped in 414mL distilled water for five minutes at 100℃, and 0.5g of iodized table salt.
The ginger-infused 16oz bottle (473mL) volume consisted of 59mL Aronia juice, 0.6mL of stevia, 1mL mineral drops, 2g of baby ginger extracted in 414mL distilled water for five minutes at 100℃, and 0.5g of iodized table salt.
The ginger-lemon infused 16oz bottle (473mL), volume consisted of 59mL Aronia juice, 0.6mL of stevia, 1mL mineral drops, 2g of baby ginger extracted in 414mL distilled water for five minutes at 100℃, and 0.5g of iodized table salt combined with 6g of organic lemon powder.
The ginger-peppermint infused 16oz bottle (473mL), volume consisted of 59mL Aronia juice, 0.6mL of stevia, 1mL mineral drops, 2g of baby ginger, and 1 teabag extracted in 414mL distilled water for five minutes at 100℃, and 0.5g of iodized table salt.
The ginger-strawberry infused 16oz bottle (473mL), volume consisted of 59mL Aronia juice, 0.6mL of stevia, 1mL mineral drops, 2g of baby ginger extracted in 414mL distilled water for five minutes at 100℃, and 0.5g of iodized table salt combined with 6g of organic strawberry powder.
All drinks were pasteurized at 80℃ for 20 minutes and bottled before storage.
Aronia used for the experiments has grown at Wye Research and Education Center in Queenstown, MD. Hand-harvested berries were juiced using an EJWOX™ 20L Hydraulic fruit press, and the collected juice was stored at -20℃ until use. Before analysis, the drink samples were allowed to thaw to room temperature.
Analysis of Total Anthocyanins. The method described by Lee et al. was used to measure and calculate the concentration of anthocyanin pigment [15]. Drink samples were vortexed (if necessary) after being defrosted in room temperature water. A 200-fold dilution of each sample was made in 0.4M aqueous sodium acetate and 0.025M aqueous KCl. Each dilution's UV/Vis absorbance was measured with a Thermo Scientific Genesys 20 spectrophotometer at 520 and 700 nm. Performance of the instrument was validated by comparison measurements using a Thermo Scientific Genesys 20 spectrophotometer. Anthocyanin pigment concentration (APC) was calculated as cyanidin-3-glucoside equivalents in mg/L using Beer- Lambert’s Law:
where A = absorbance = (A520nm – A700nm) pH 1.0 – (A520nm – A700nm) pH 4.5); MW (molecular weight) = 449.2 g/mol for cyanidin-3-glucoside (cyd-3-glu); DF = dilution factor established above (40X); l = pathlength in cm; ɛ = 26,900 molar extinction coefficient, in L/mol/cm, for cyd-3-glu; and 103 = factor for conversion from g to mg.
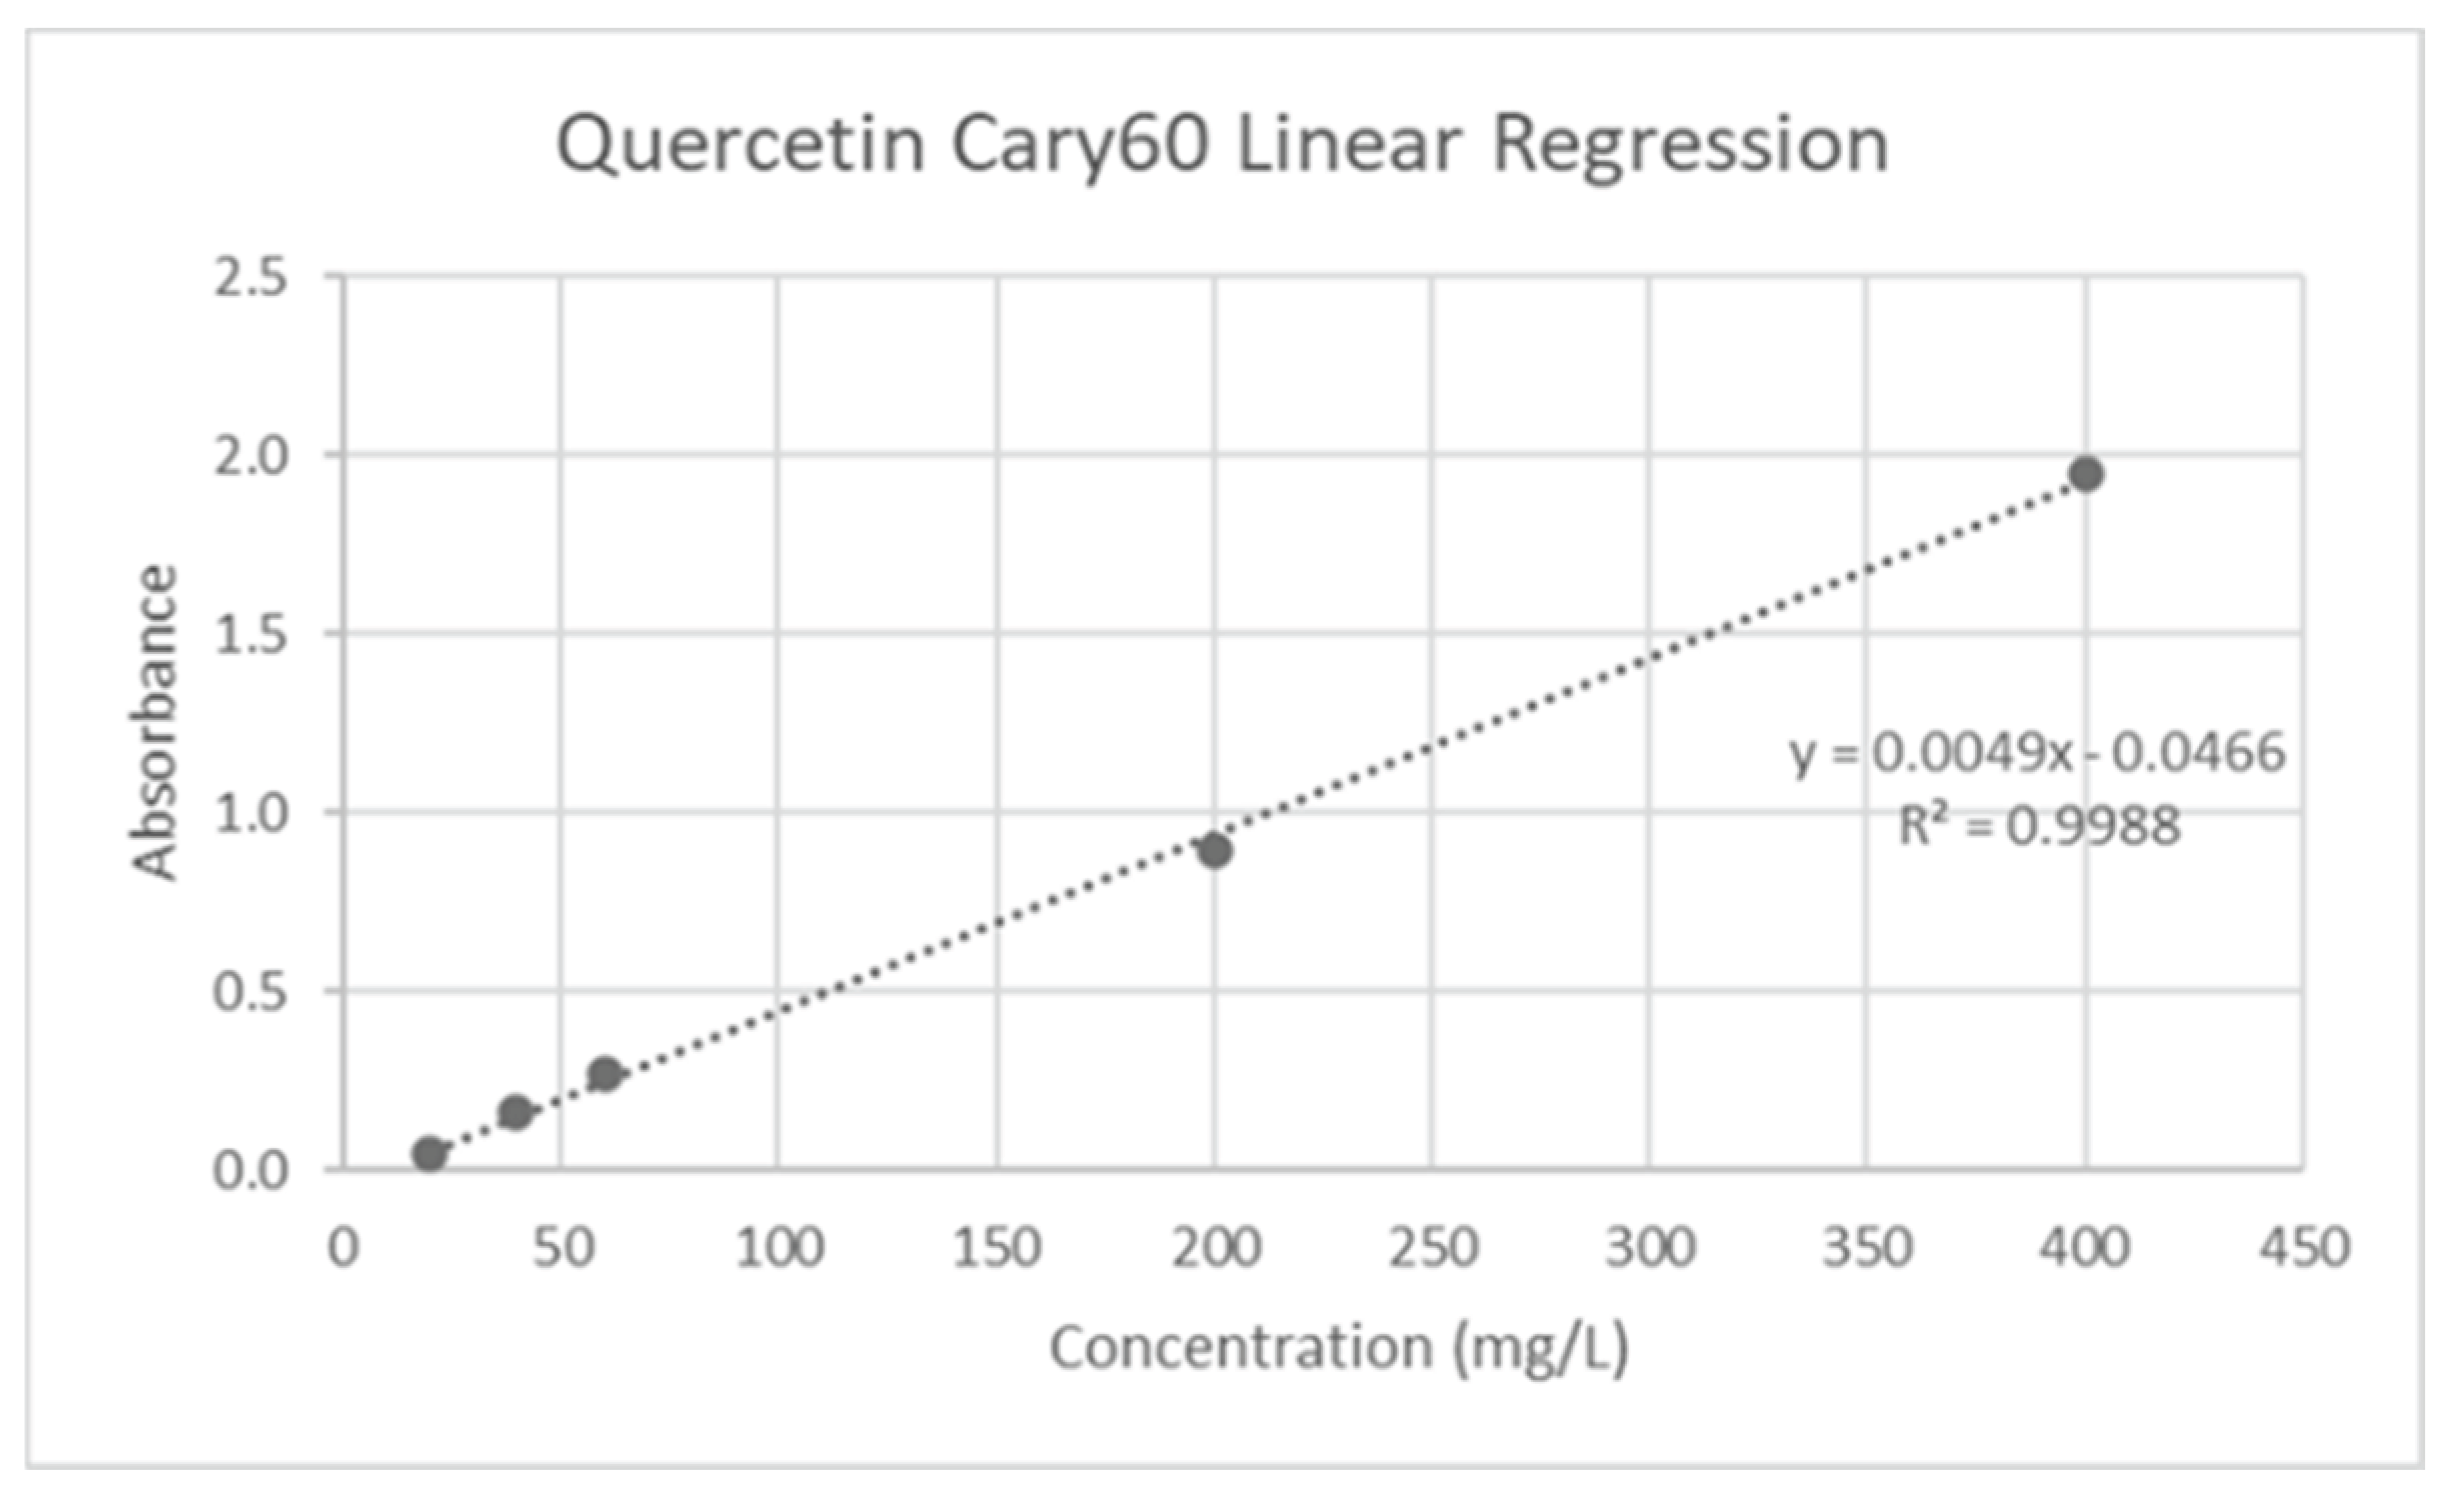
Analysis of Flavonoids. Flavonoids were identified by using the usual colorimetric analysis methods described by [16,17]. Quercetin solutions (20-400 mg/L R2=0.9988) were used to generate the standard calibration (Figure 6). 200 uL of the liquid sample, 600 uL of 95% ethanol in water, 40 uL of 1M potassium acetate, and 40 uL of 10% w/v aluminum chloride were added to a vial. Following a short incubation time, the sample was allowed to sit at room temperature for 30 minutes before receiving 1120 uL of distilled water in the vial. After measuring the absorbance at 415 nm, the following formula was used to calculate the Total Flavonoid Concentration (TFC) in milligrams of quercetin equivalent (QE)/gram of juice (J):
where A = average absorbance, and DF = dilution factor
Figure 1.
Quercetin calibration curve.
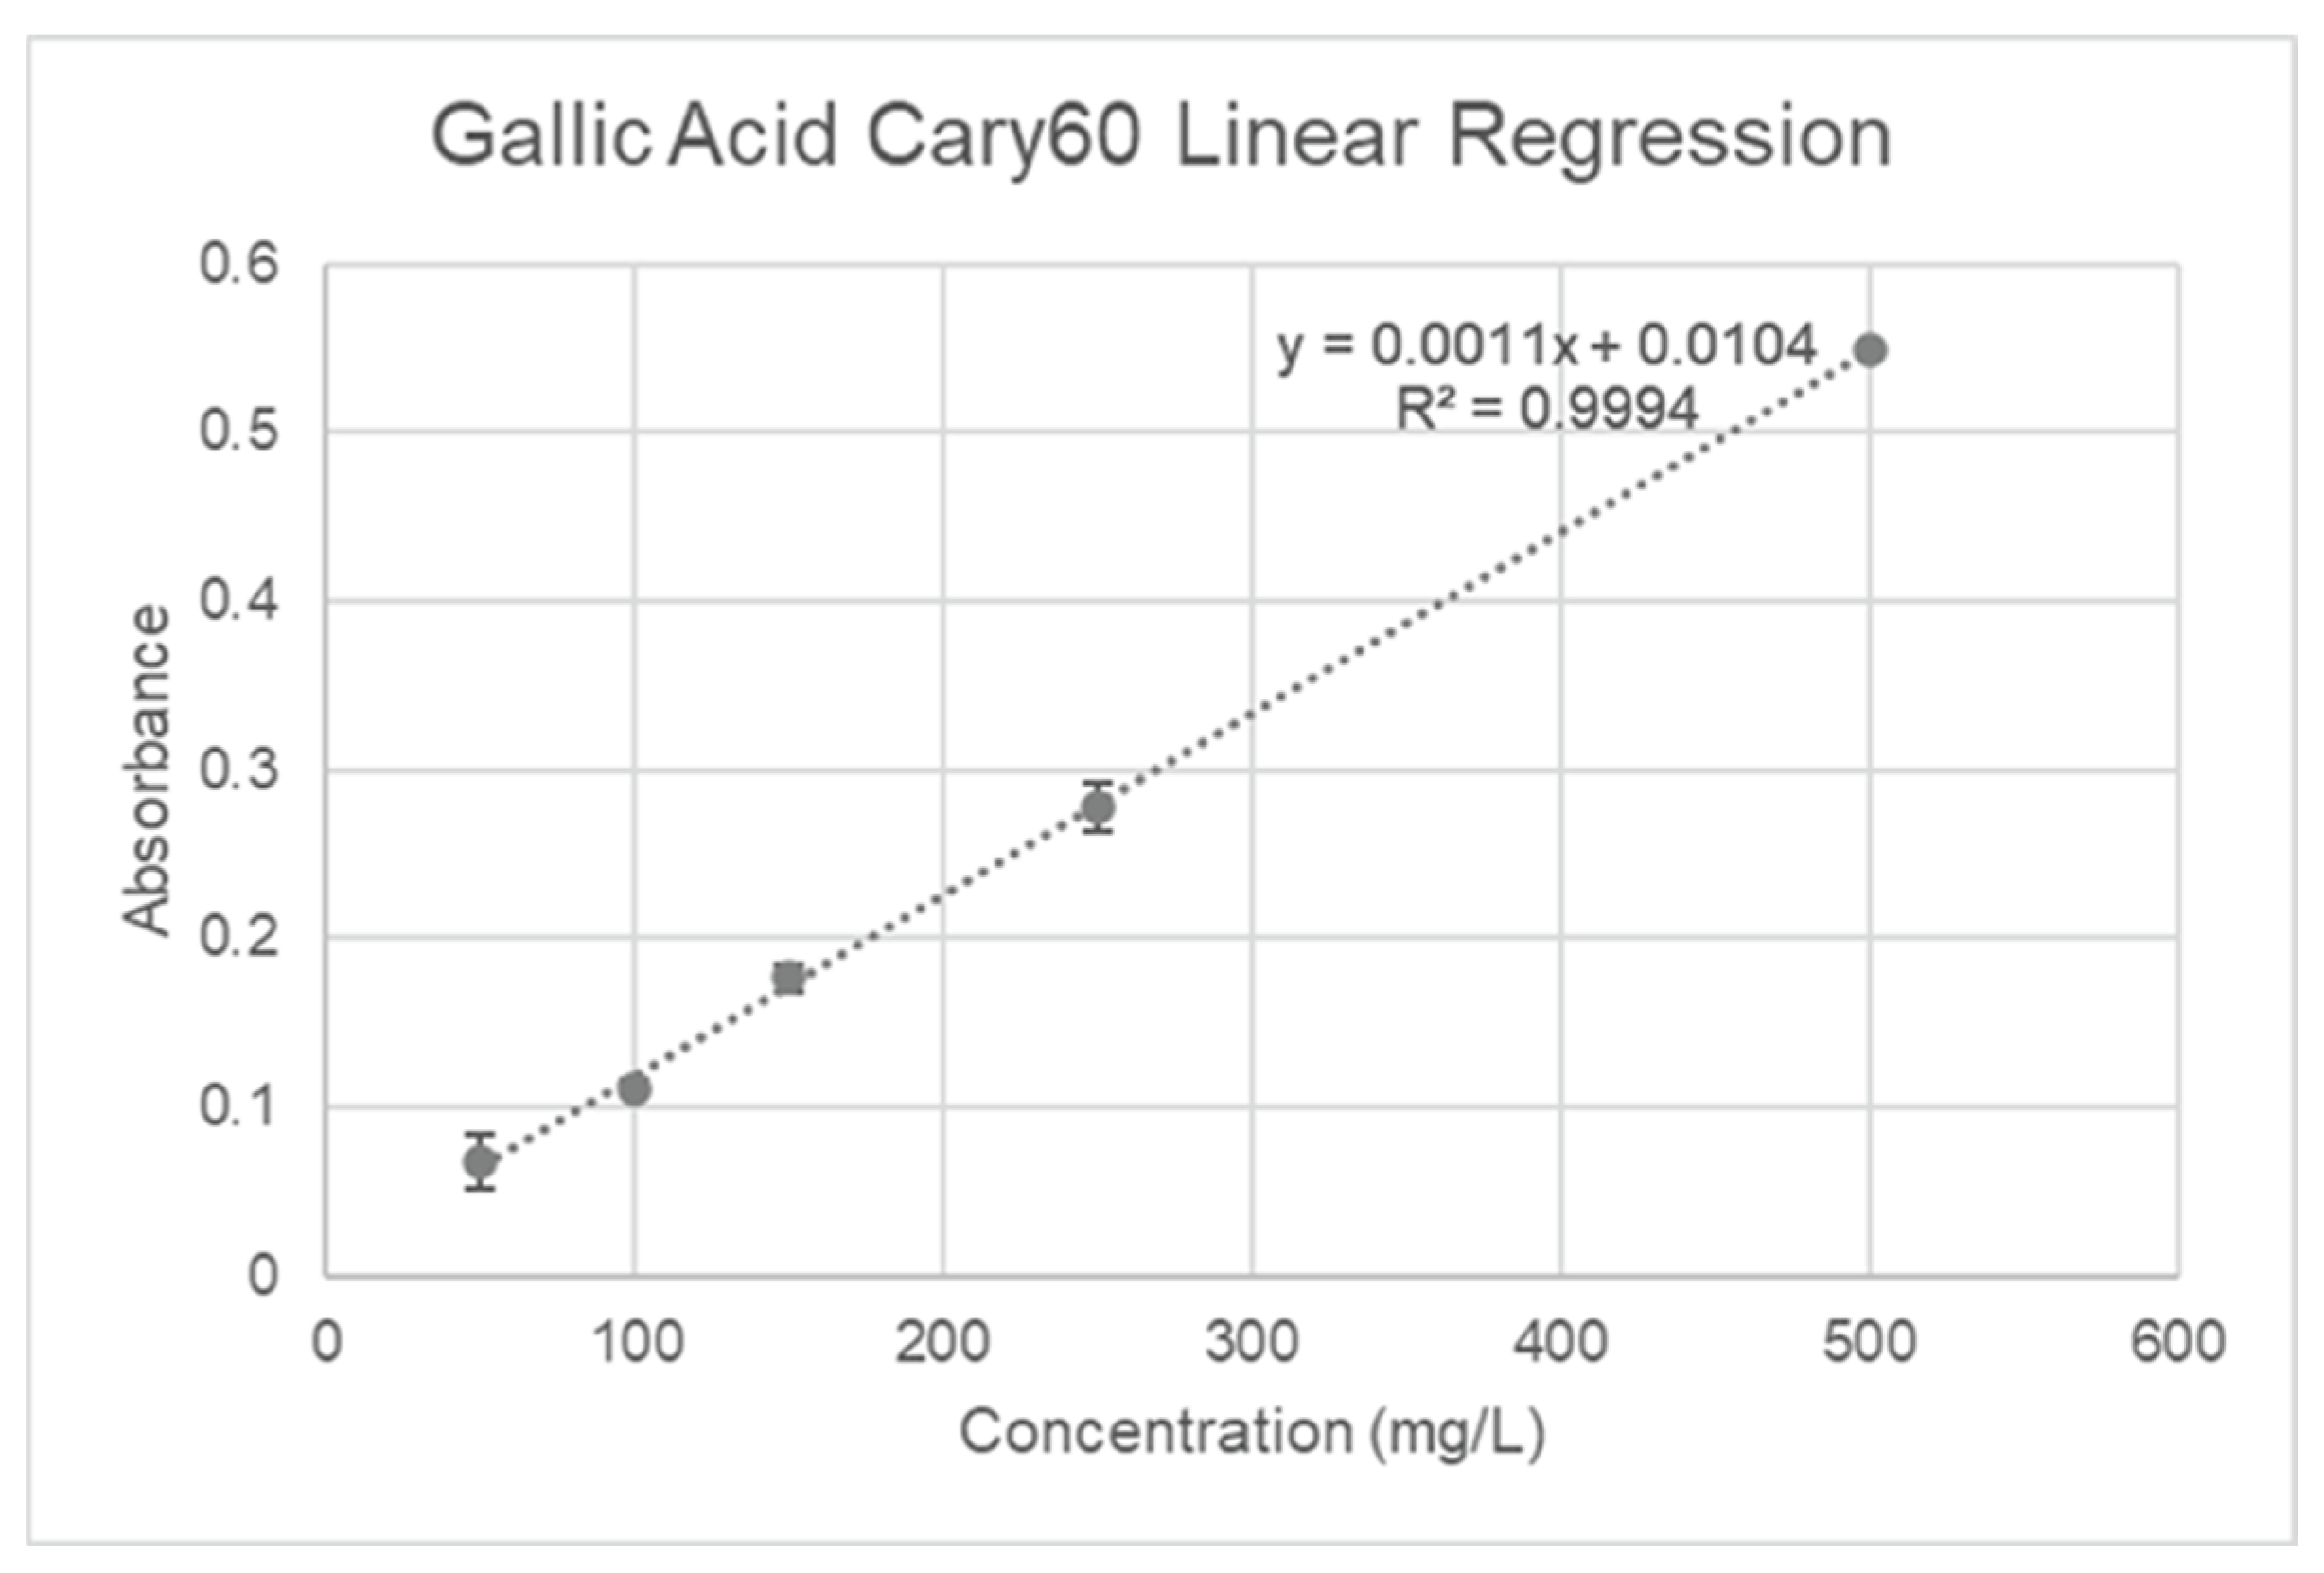
Analysis of Polyphenols. Polyphenols were identified following the conventional methods for colorimetric examination of plant material described in [18,19,20,21,22,23]. Gallic acid solutions (50-500 mg/L R2=0.9994) were used to generate the standard calibration (Figure 2). 20 uL of the liquid sample and 1580 uL of distilled water were added to a vial. Next, 100 uL of Folin-Ciocalteu's reagent was incorporated, and the combination was allowed to sit at room temperature for five minutes. After, the addition of 300 uL of a 20% w/v sodium carbonate solution, the samples were placed in an oven set to 40°C for 30 minutes to incubate.
The absorbance was then measured at 765nm and the Total Polyphenol Concentration (TPC) in mg of gallic acid equivalent (GAE)/g of juice (J) was then determined using the following equation:
where A = average absorbance, and DF = dilution factor
Figure 2.
Gallic Acid calibration curve.
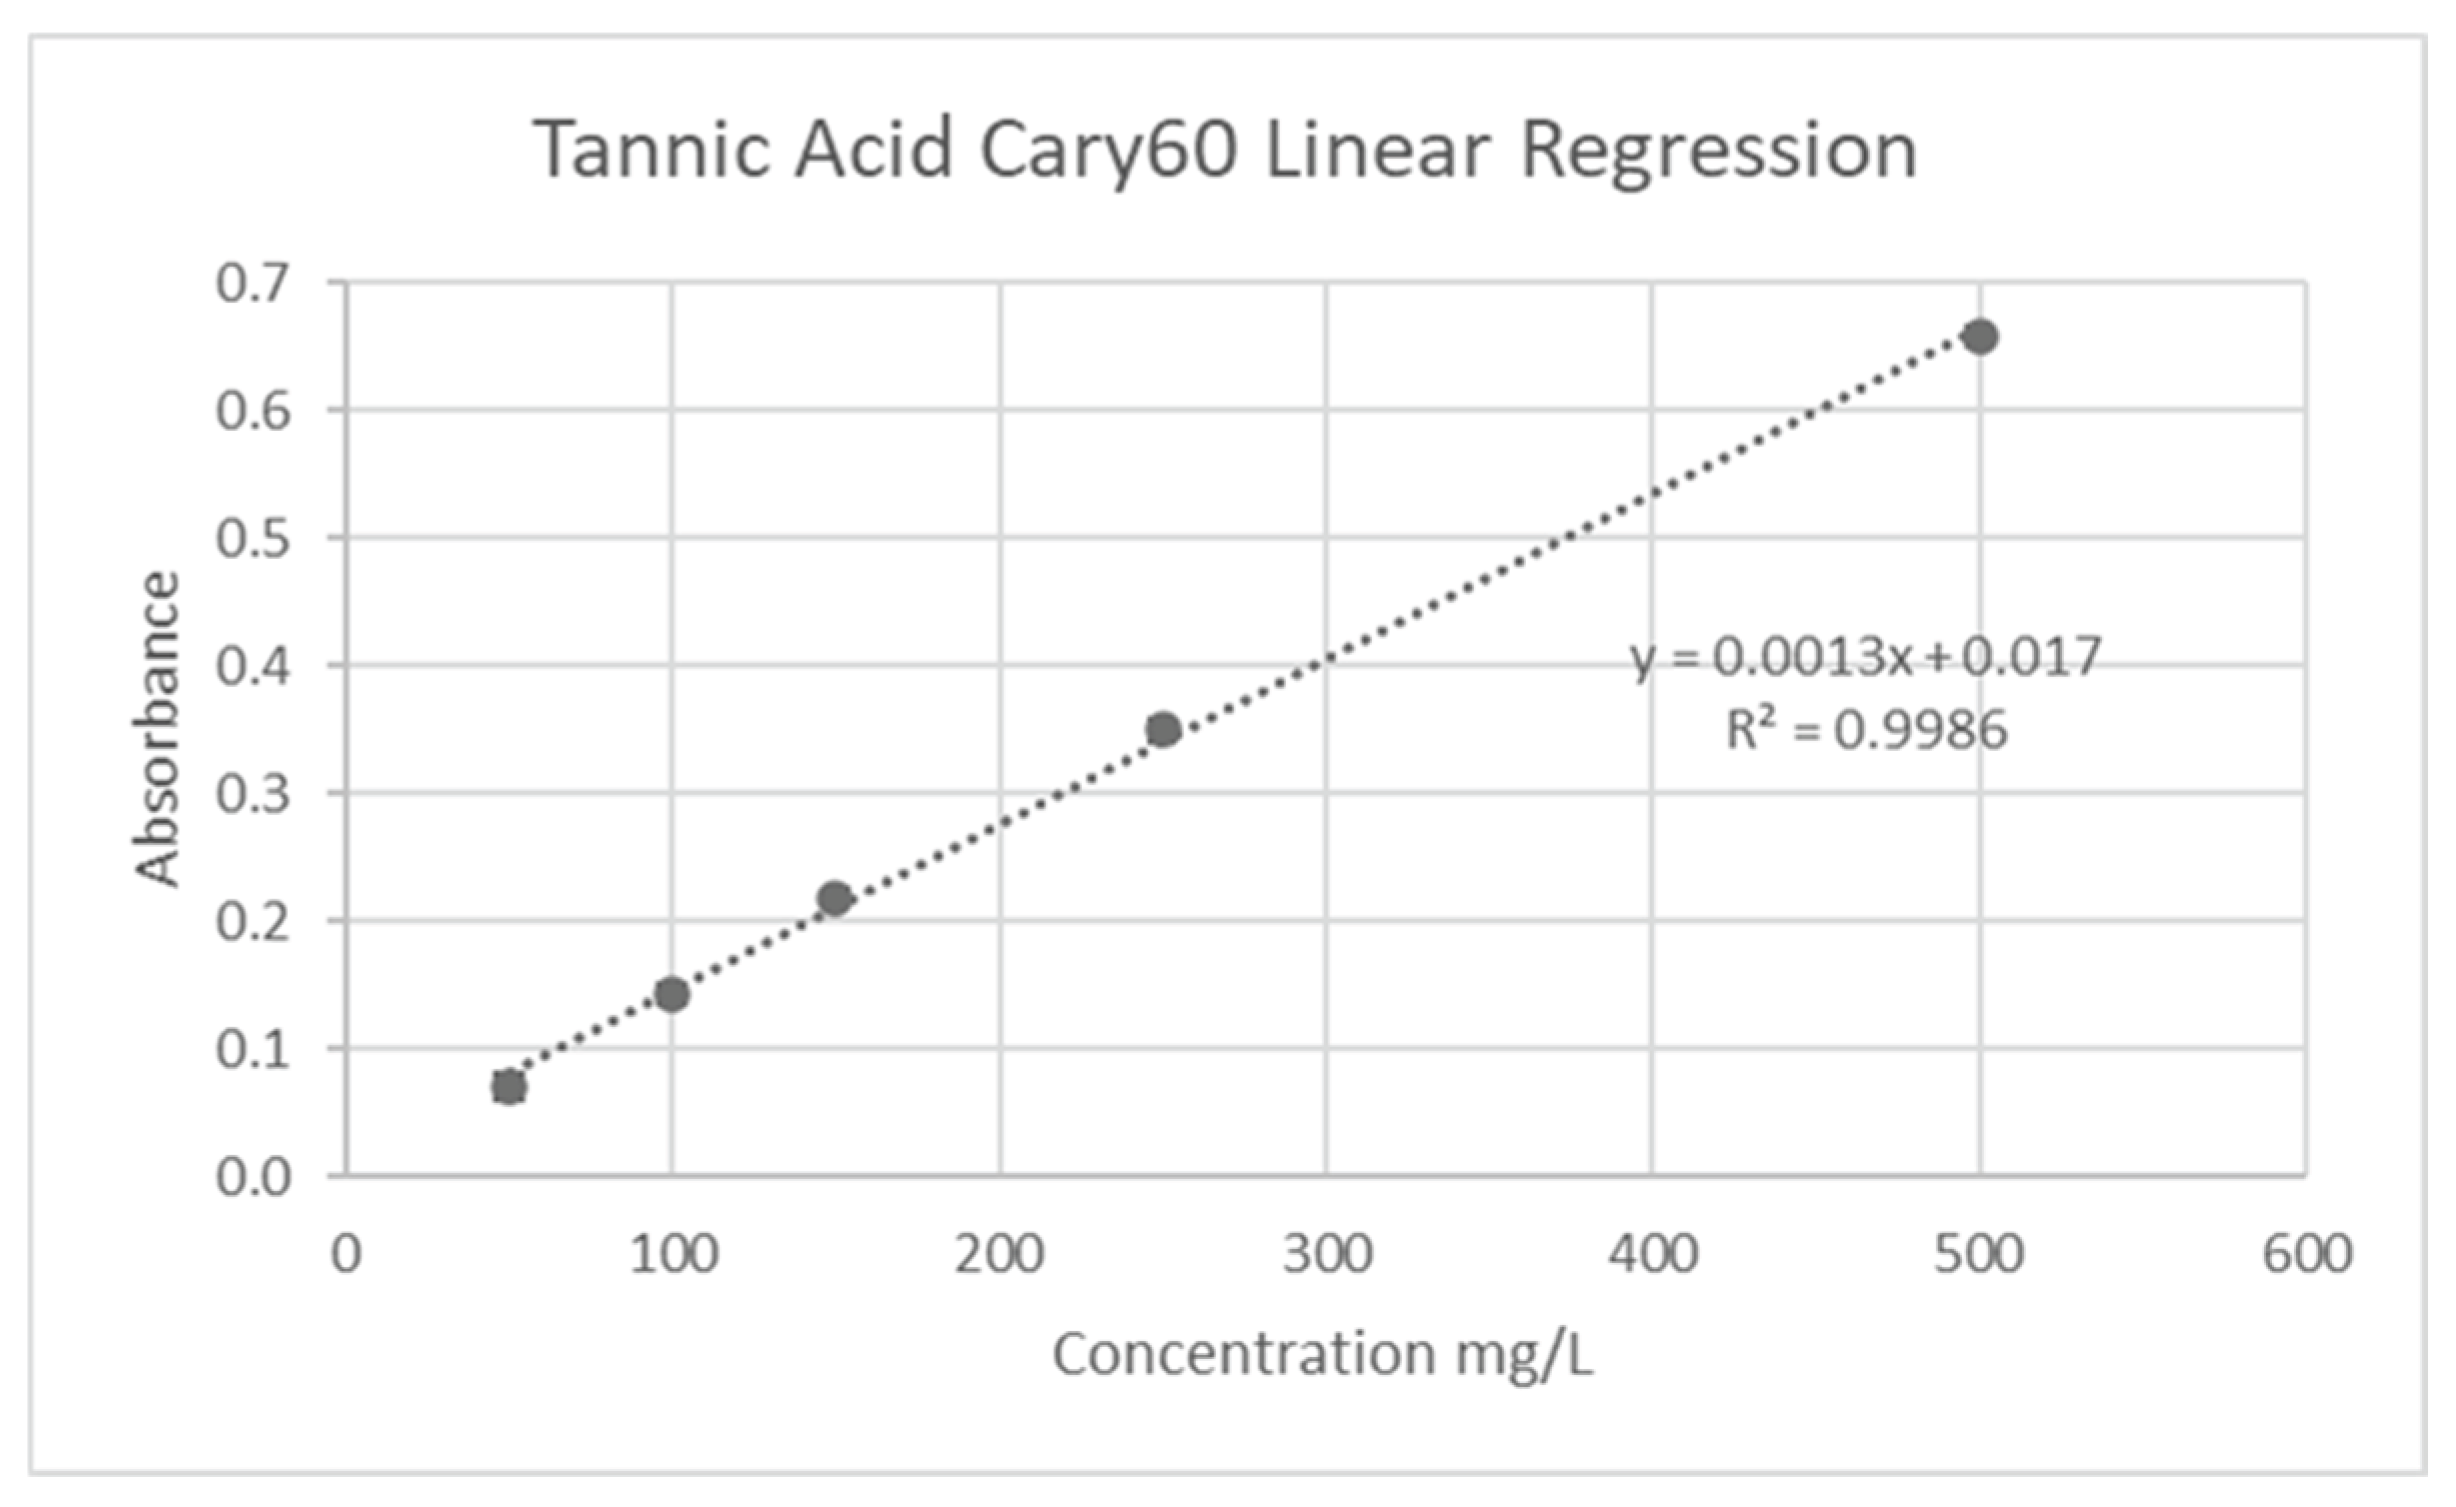
Analysis of Tannins. Tannins were identified using the conventional colorimetric analytical methods for plant material [24,25,26]. Tannic acid solutions (50-500 mg/L R2=0.9987) were used to generate the standard calibration (Figure 8). 300 uL of liquid sample, 100 uL of 0.01M tetrazolium blue chloride, and 100 uL of 0.2M sodium hydroxide solution were added to a vial. The samples were mixed with 1500 uL of 80% ethanol in water after a short incubation period, and the absorbance at 527 nm was then measured. The following formula was then used to calculate the Total Tannin Concentration (TTC) in milligrams of tannic acid equivalent (TAE)/gram of juice (J):
where A = average absorbance, and DF = dilution factor
Figure 3.
Tannic Acid calibration curve.
Brix Measurements. Brix percentages were collected on a Fisherbrand™ HDR-P1 portable brix refractometer. Two drops of the sample were placed onto the sample area, and the lid was closed to allow for measurement. After measuring the sample area was cleaned using distilled water and wiped clean using Kimwipes.
pH Measurements. pH experiments were conducted on a Mettler Toledo™ FiveEasy benchtop pH meter. Before measurement, the instrument underwent a three-point calibration at pH 7, 10, and 4.01.
Conductivity Measurements. Conductivity was measured via a Thermo Scientific™ Orion Star A212 benchtop conductometer.
Determination of Cations By ICP/MS. 2.5 mL of drink samples were placed into digestion tubes, along with 10 mL of Nitric acid. Digestion tubes were locked before placing them into the holster based on the listed configuration sheet for the number of samples. The CEM™ Mars-6 Digester was configured for EPA3015a plant material samples and set to run for 1 hour. Samples were then removed from the holster and transferred to 50 mL vials, which were then diluted to 50 mL total volume using DI water. Samples were finally transferred to 15 mL vials and labeled before sending out for ICP/MS analysis.
Statistical Analysis and Limits of Detection. The Clinical and Laboratory Standards Institute's guidelines and Ervin and Kariuki's examples were used to calculate the limit of detection (LOD) for anthocyanins [27]. Using examples from Ervin and Kariuki and a guideline created by the Clinical and Laboratory Standards Institute, the limit of detection for flavonoids was determined. Three duplicates of the quercetin stock solution in 95% ethanol were made, and the concentration of 1500 mg/L was tested against a 95% ethanol blank. Until the absorbance results remained unchanged, the sample was repeatedly diluted by a factor of two. The limit of detection for flavonoids was determined to be the final concentration. As seen in Figure 9, absorbance was measured at 510 nm [27].
Figure 4.
Quercetin Limit of Detection.

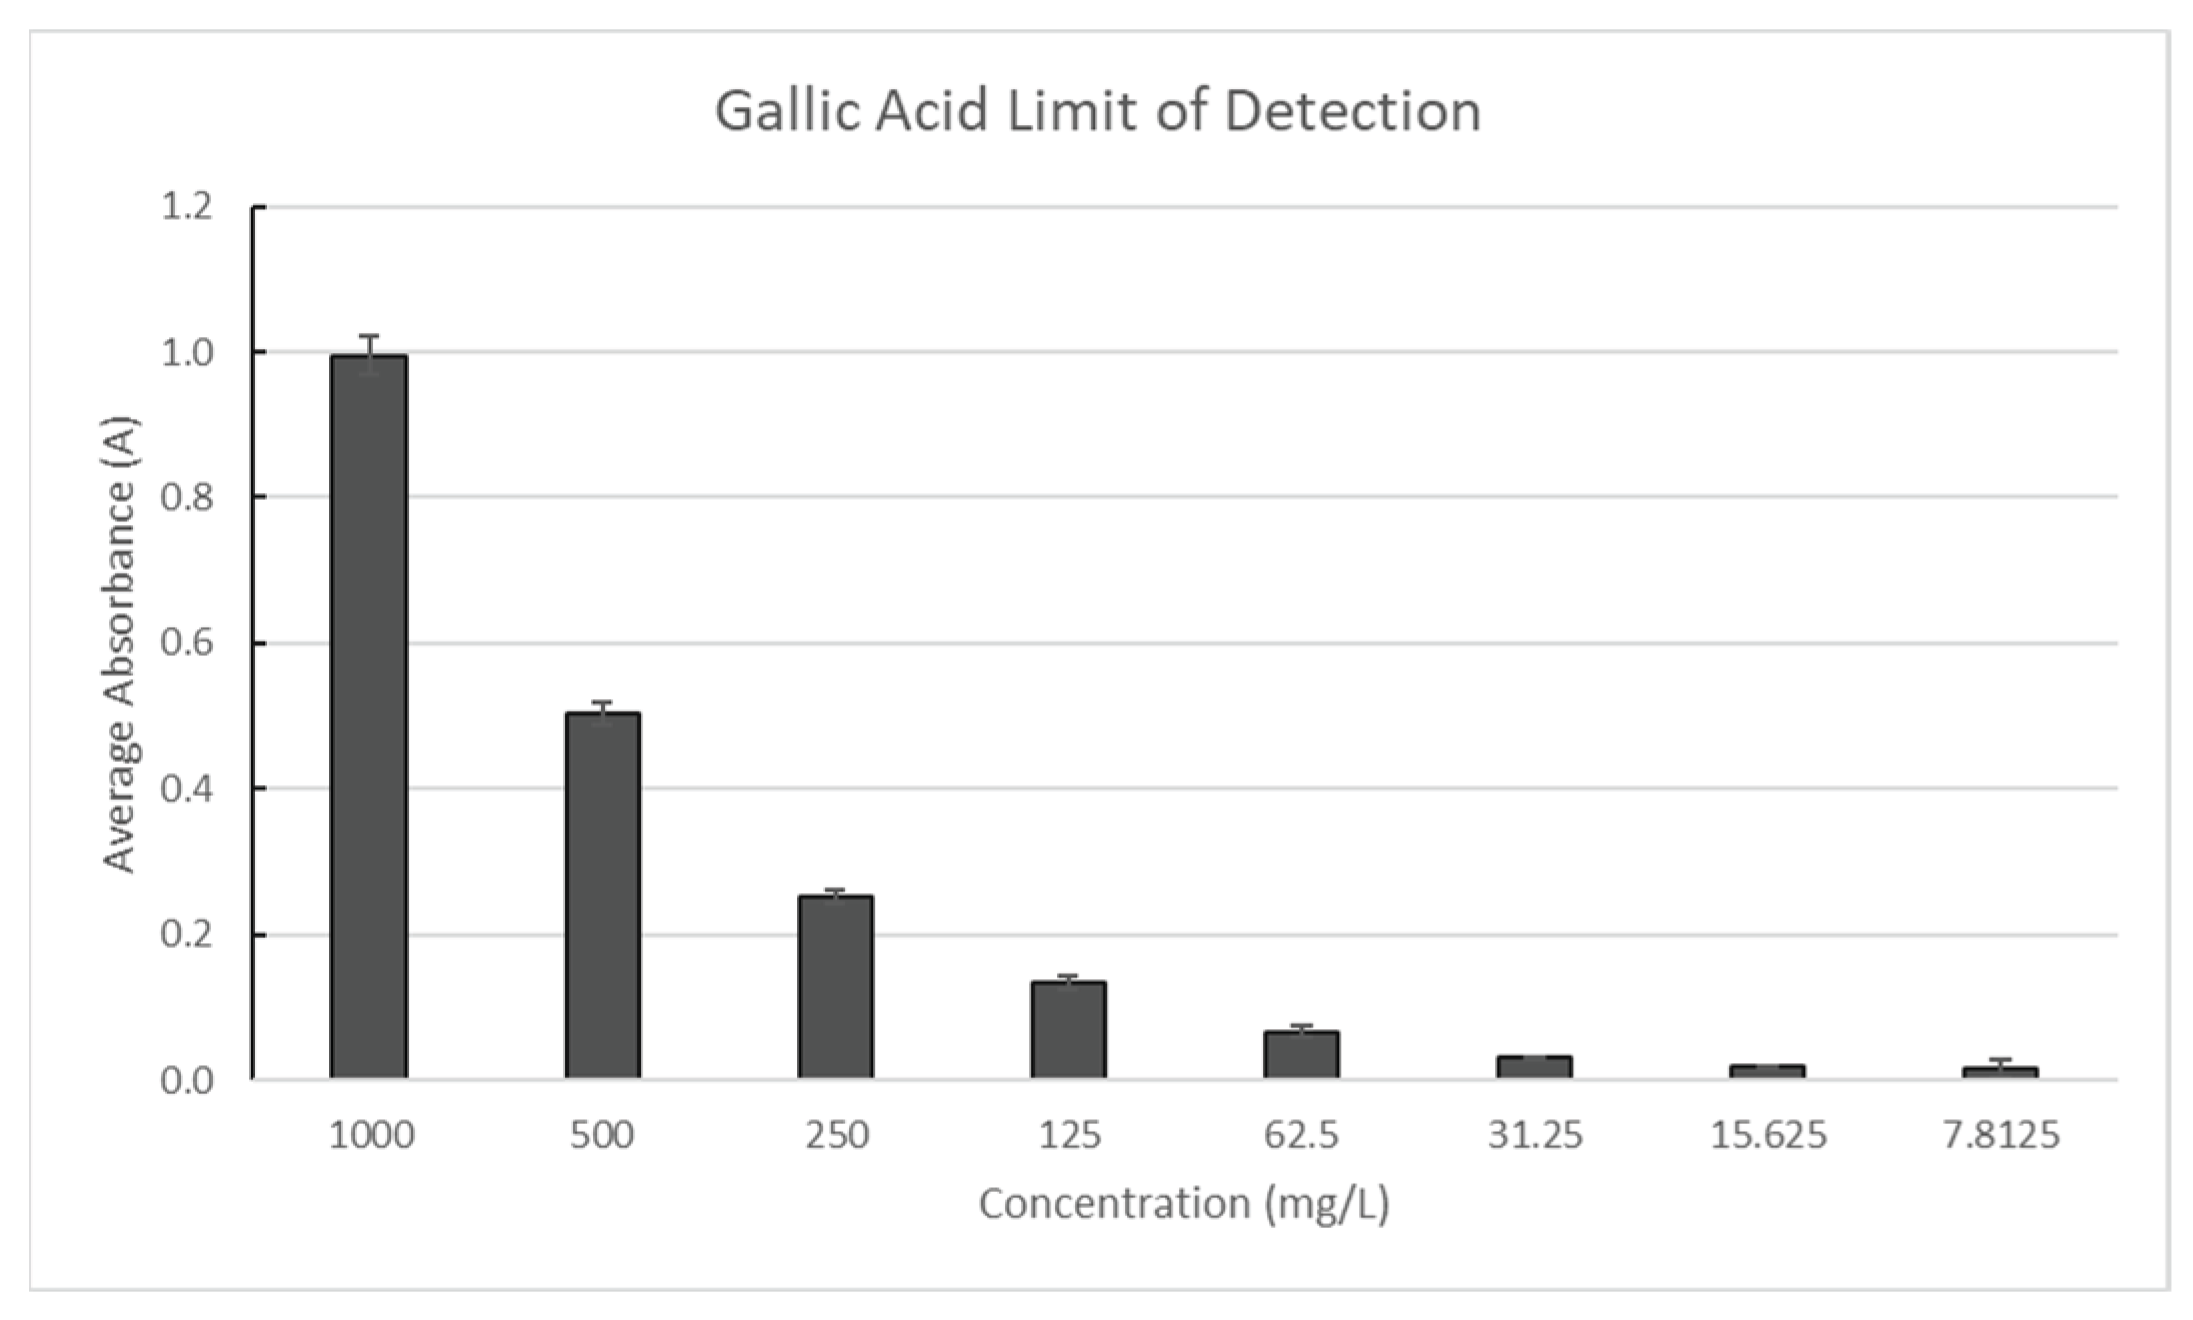
The gallic acid stock solution in 20% ethanol was made in triplicate with a concentration of 1000 mg/L and compared to a blank of distilled water to determine the polyphenol limit of detection. Until the absorbance results remained unchanged, the sample was repeatedly diluted by a factor of two. The limit of detection for polyphenols was determined to be the final concentration. As seen in Figure 10, absorbance was measured at 765 nm.
Figure 5.
Gallic Acid Limit of Detection.
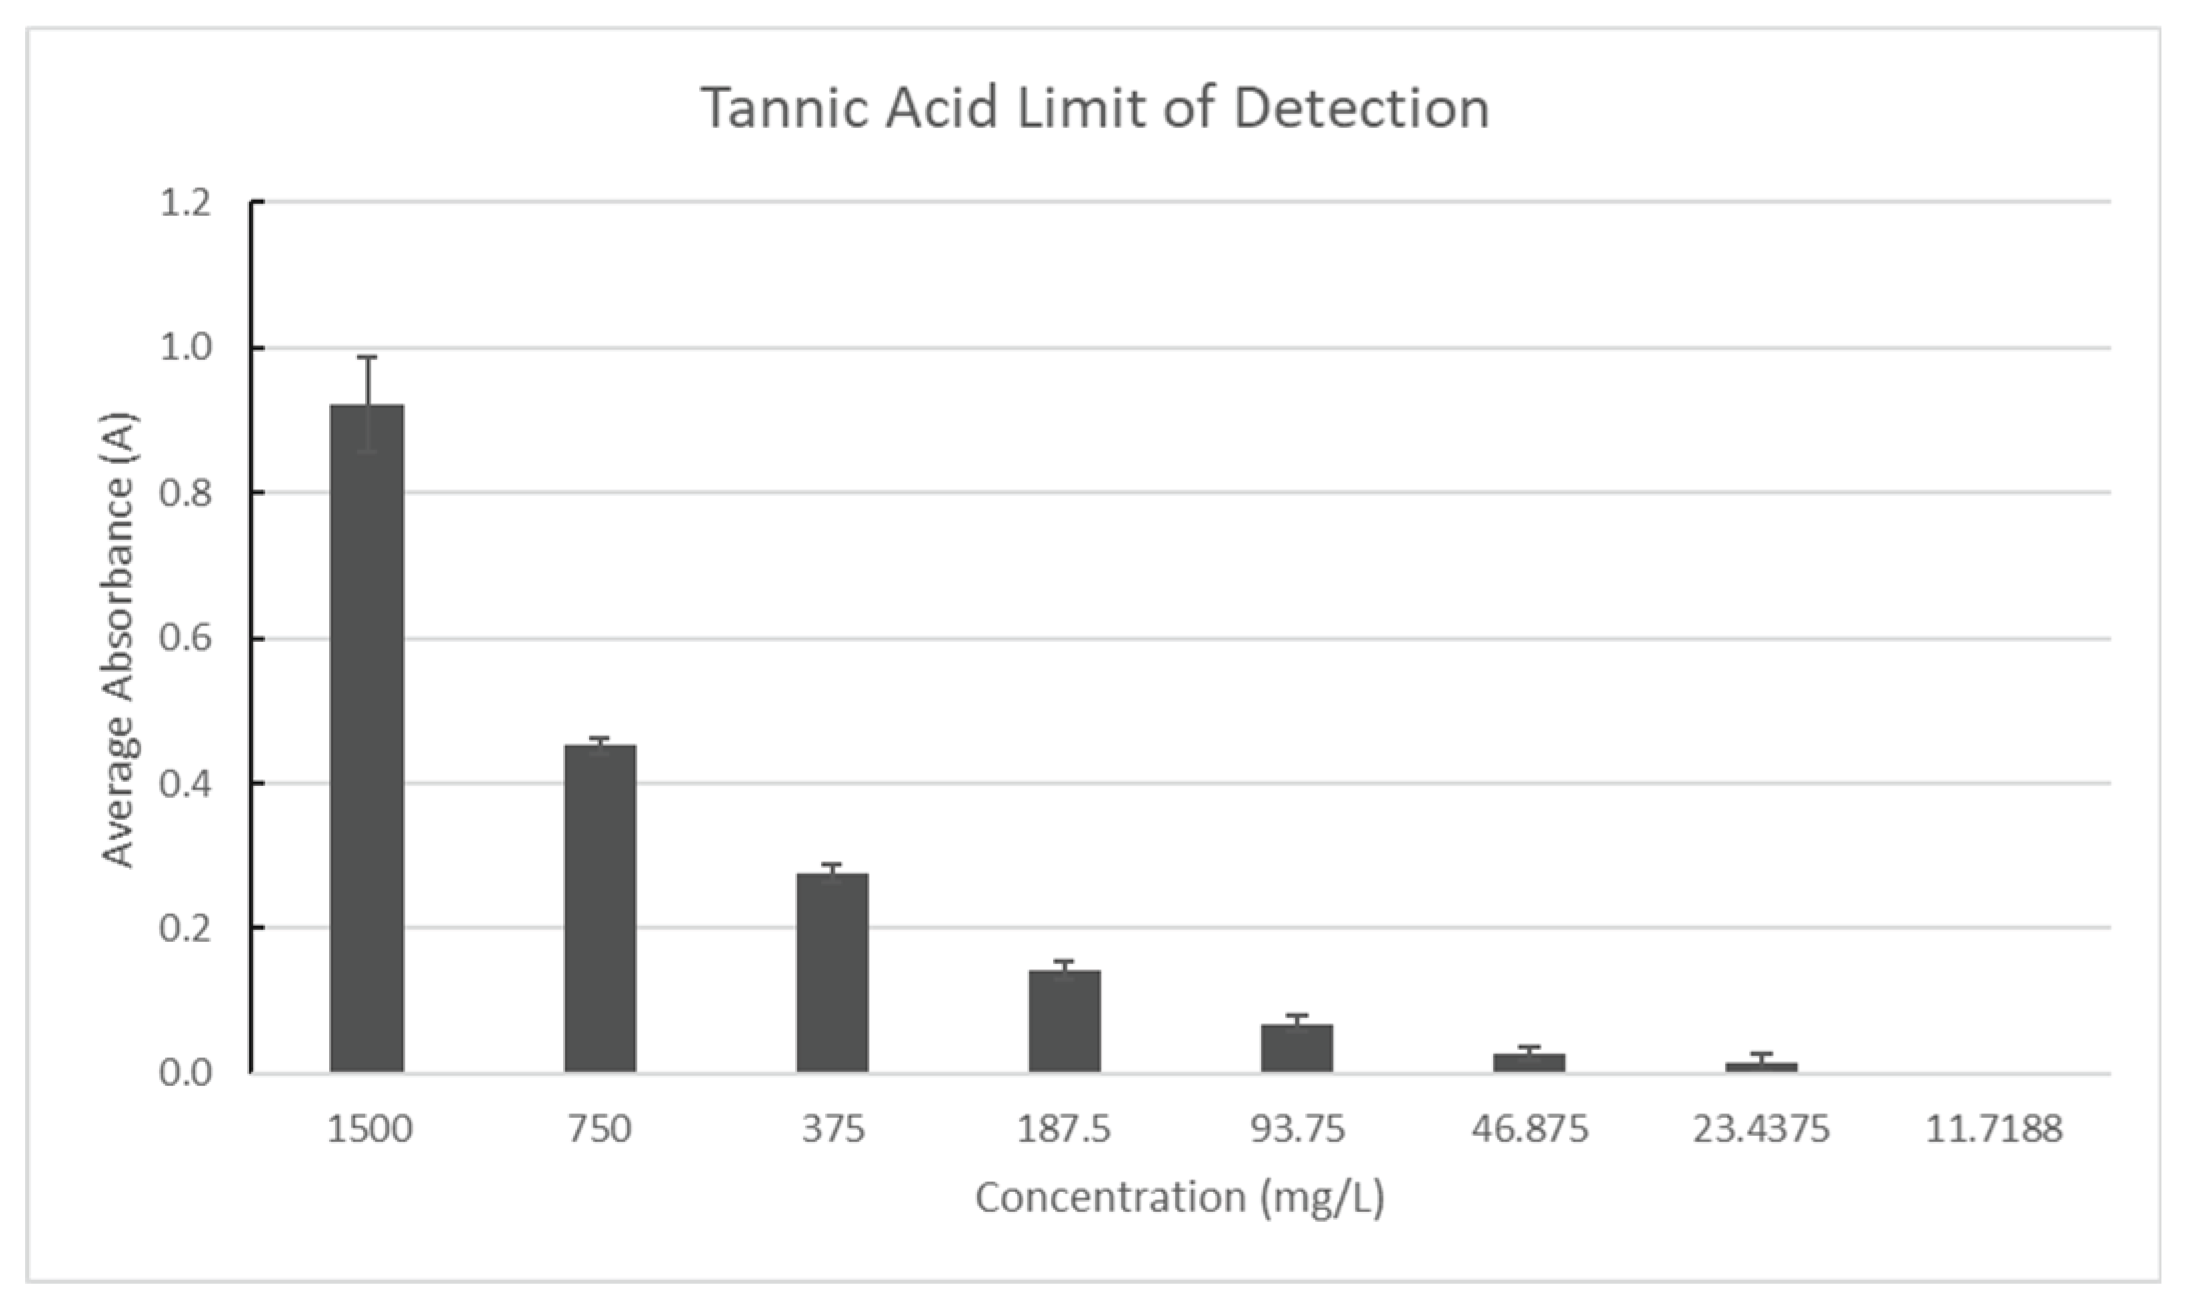
The Tannic Acid stock solution in 20% ethanol was made in triplicate with a concentration of 1500 mg/L and compared to a blank of distilled water to determine the tannin limit of detection. Until the absorbance results remained unchanged, the sample was repeatedly diluted by a factor of two. The limit of detection for tannins was determined to be the final concentration. As seen in Figure 11, absorbance was measured at 527 nm.
Figure 6.
Tannic Acid Limit of Detection.
The three sets of results obtained in triplicate for each experimental condition were used to compute the standard deviations for each experiment. To confirm that the results were statistically significant within the 95% confidence limit, a one-way ANOVA was conducted.
Phytochemical Screening. The aronia drinks' secondary metabolites were screened phytochemically using techniques taken from [28]. To find the final product's phytochemical makeup, aronia drink formulations with their corresponding ingredients were combined.
Tannins And Phenols. In test tubes, 1 g of each sample was added individually to 20 mL of DW. The mixture was heated for 10 min in a water bath; and then the liquid was vacuum filtered. Once the filtrate had cooled, 1 mL was diluted to a volume of 5 mL with DW, and 3 drops of 10% FeCl3 were added to the mixture. The development of a bluish-black or brownish-green precipitate ensured the presence of tannins and phenols.
Alkaloids. 5 mL of aqueous extract was mixed with 2 mL of 2M HCl. Each mixture was constantly stirred for 10 min while being heated in a water bath. It was then cooled, followed by filtration. The filtrate was analyzed for alkaloids using a few drops of Dragendorff’s reagents. The development of a reddish-brown precipitate indicated the presence of alkaloids.
Saponins. A total of 10 ml of DW was mixed with 1 g of each sample. The solution was boiled in a water bath for 10 min and filtered through an Erlenmeyer flask while it was still hot. The foam test was determined after cooling. A test tube containing 2.5 mL of filtrate was filled, diluted to a volume of 10 mL with DW, and shaken violently for 2 min. The formation of foam indicated that saponin is present in the filtrate.
Terpenoids. A total of 2 ml of chloroform was added to 5 mL of aqueous extract. To create a layer, 2 mL of concentrated H2SO4 was carefully added and gently shaken. The reddish-brown color in the inter-phase confirmed the presence of terpenoids.
Glycosides. 2mL of the aqueous extract was mixed with 1 mL of glacial acetic acid, 3 drops of FeCl3, and 3 drops of concentrated H2SO4. A green/blue precipitate was found to be present, which indicated the presence of glycosides.
Amino Acids. In 2 mL of aqueous extract, 6 drops of the 1M ninhydrin reagent were added. The solution was heated for 5 min in a water bath. The presence of amino acids was shown by the purple coloration of the solution.
2. Results and Discussion
Our final drink compositions are based on the consideration of three main factors: sorbitol content, tannin content, and taste. In doing so, the final drink composition is palatable while maintaining a high antioxidant content, and a theorized lower level of sorbitol.
All drinks were prepared using the industrial kitchen equipped with a heating plate, a pasteurization bowl with a holder for 12 positions of bottles. Drinks were prepared using the procedures described in the Materials and Methods, bottled into 16-oz bottles, and sealed after pasteurization. One bottle of each kind was taken into the phytochemical lab for the characterization, while the rest was used as samples during the tasting events with local communities of farmers before the taste surveys were taken.
Table 1 illustrates the totals of major antioxidants, along with pH, brix, and conductivity for the final line of drink flavors, which was developed based on customers’ reviews of taste during the agricultural outreach events. The in-depth explanations regarding each of the analyses are presented following Table 1.
Analysis of antioxidants. Spectrophotometric methods were used for the analysis of total anthocyanins, flavonoids, polyphenols, and tannins in drinks. The content was calculated both per mL of drink and per one standard 16 FL oz bottle.
The results for the total anthocyanins content are presented in the Figure 7.
As can be seen in Figure 7, the anthocyanin content in the drink formulations well exceeded expectations, as for each 16oz bottle, a minimum average concentration of 80mg cyanidin-3-glucoside equivalents was achieved. On the market, cyanidin-3-glucoside standards can average up to $253/10mg, meaning that each drink has incredible potential in both the food and pharmaceutical industries.
The results for the total polyphenols, flavonoids, and tannins are presented in Figure 8, Figure 9, and Figure 10, respectively.
Figure 8.
Total polyphenol concentration in drink formulations.
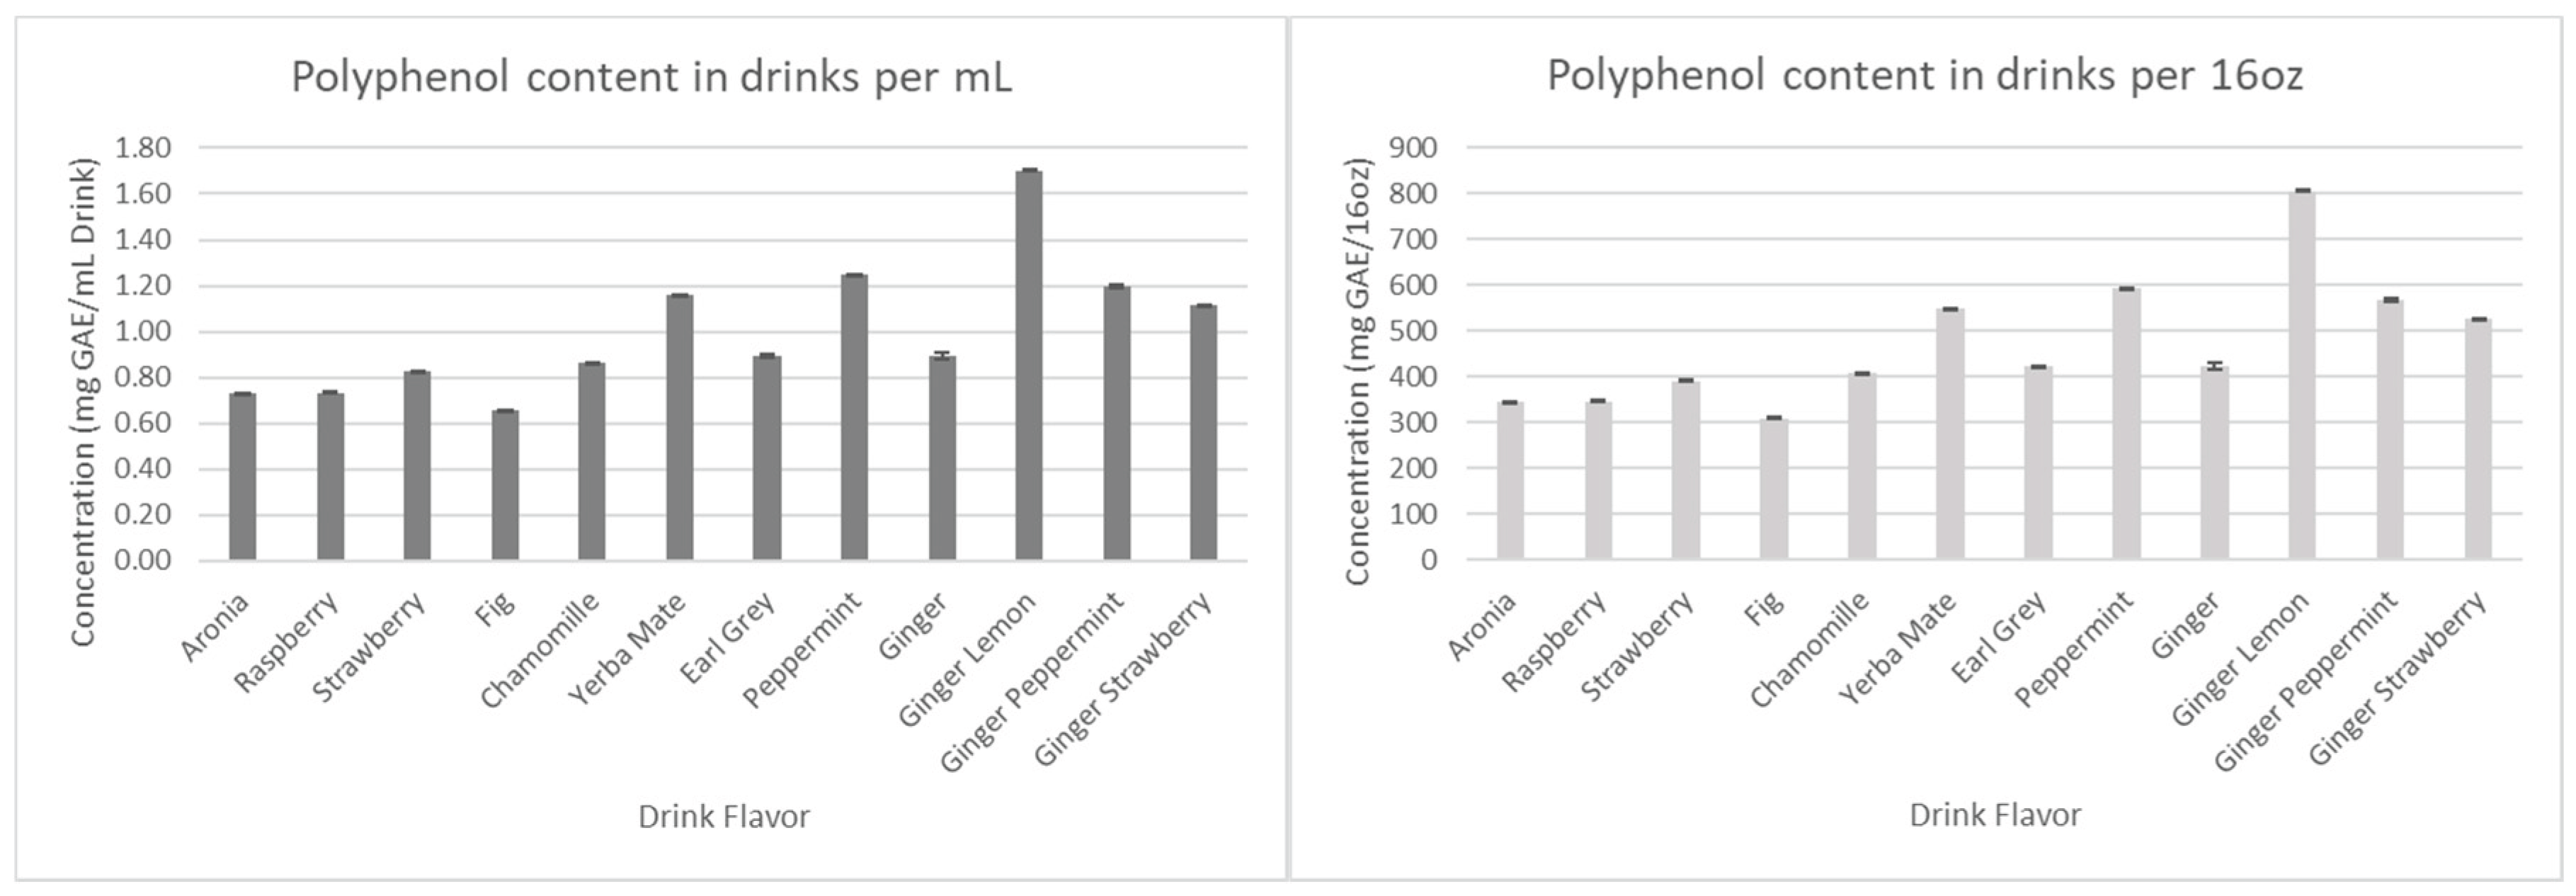
Figure 9.
Total flavonoid concentration in drink formulations.
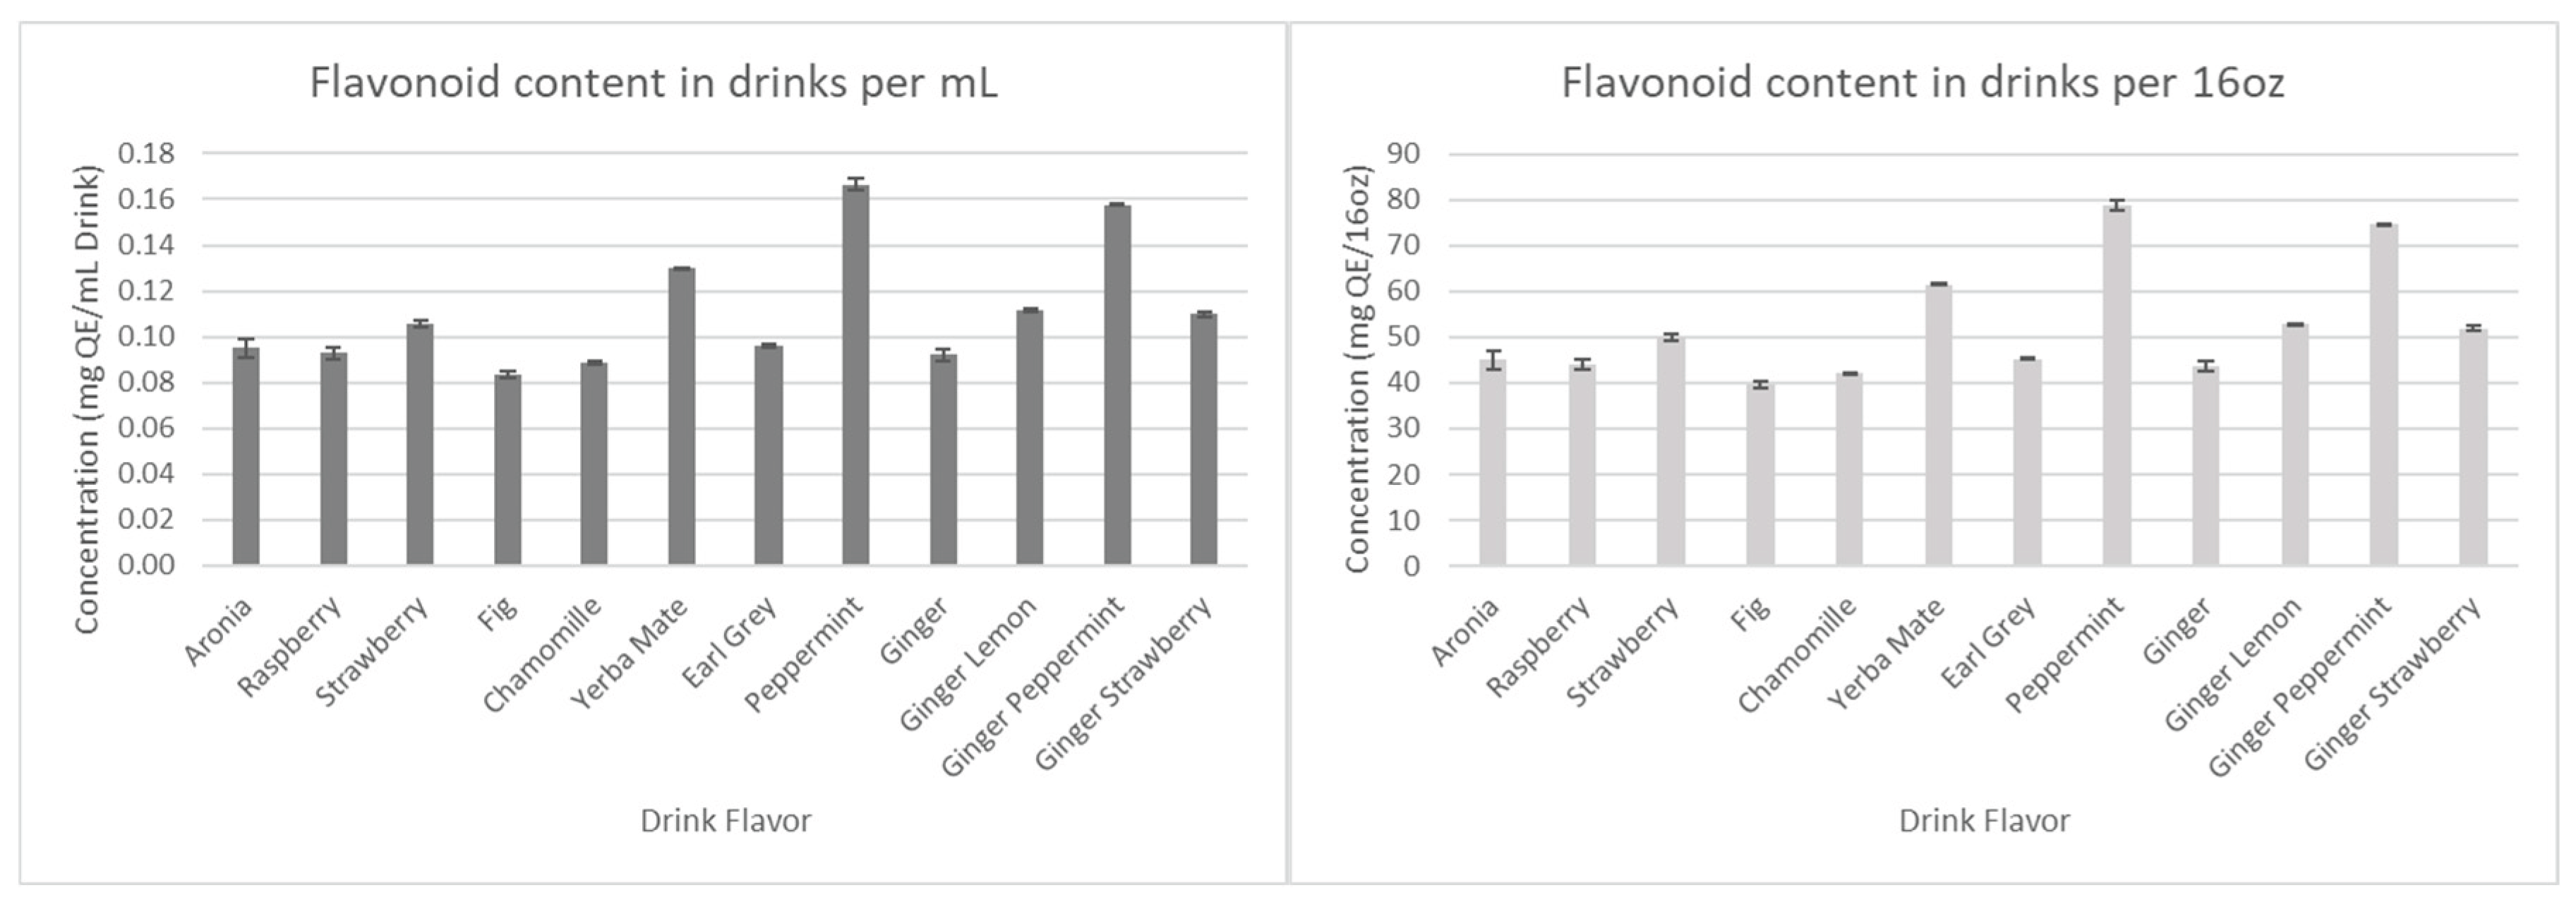
Figure 10.
Total tannin concentration in drink formulations.
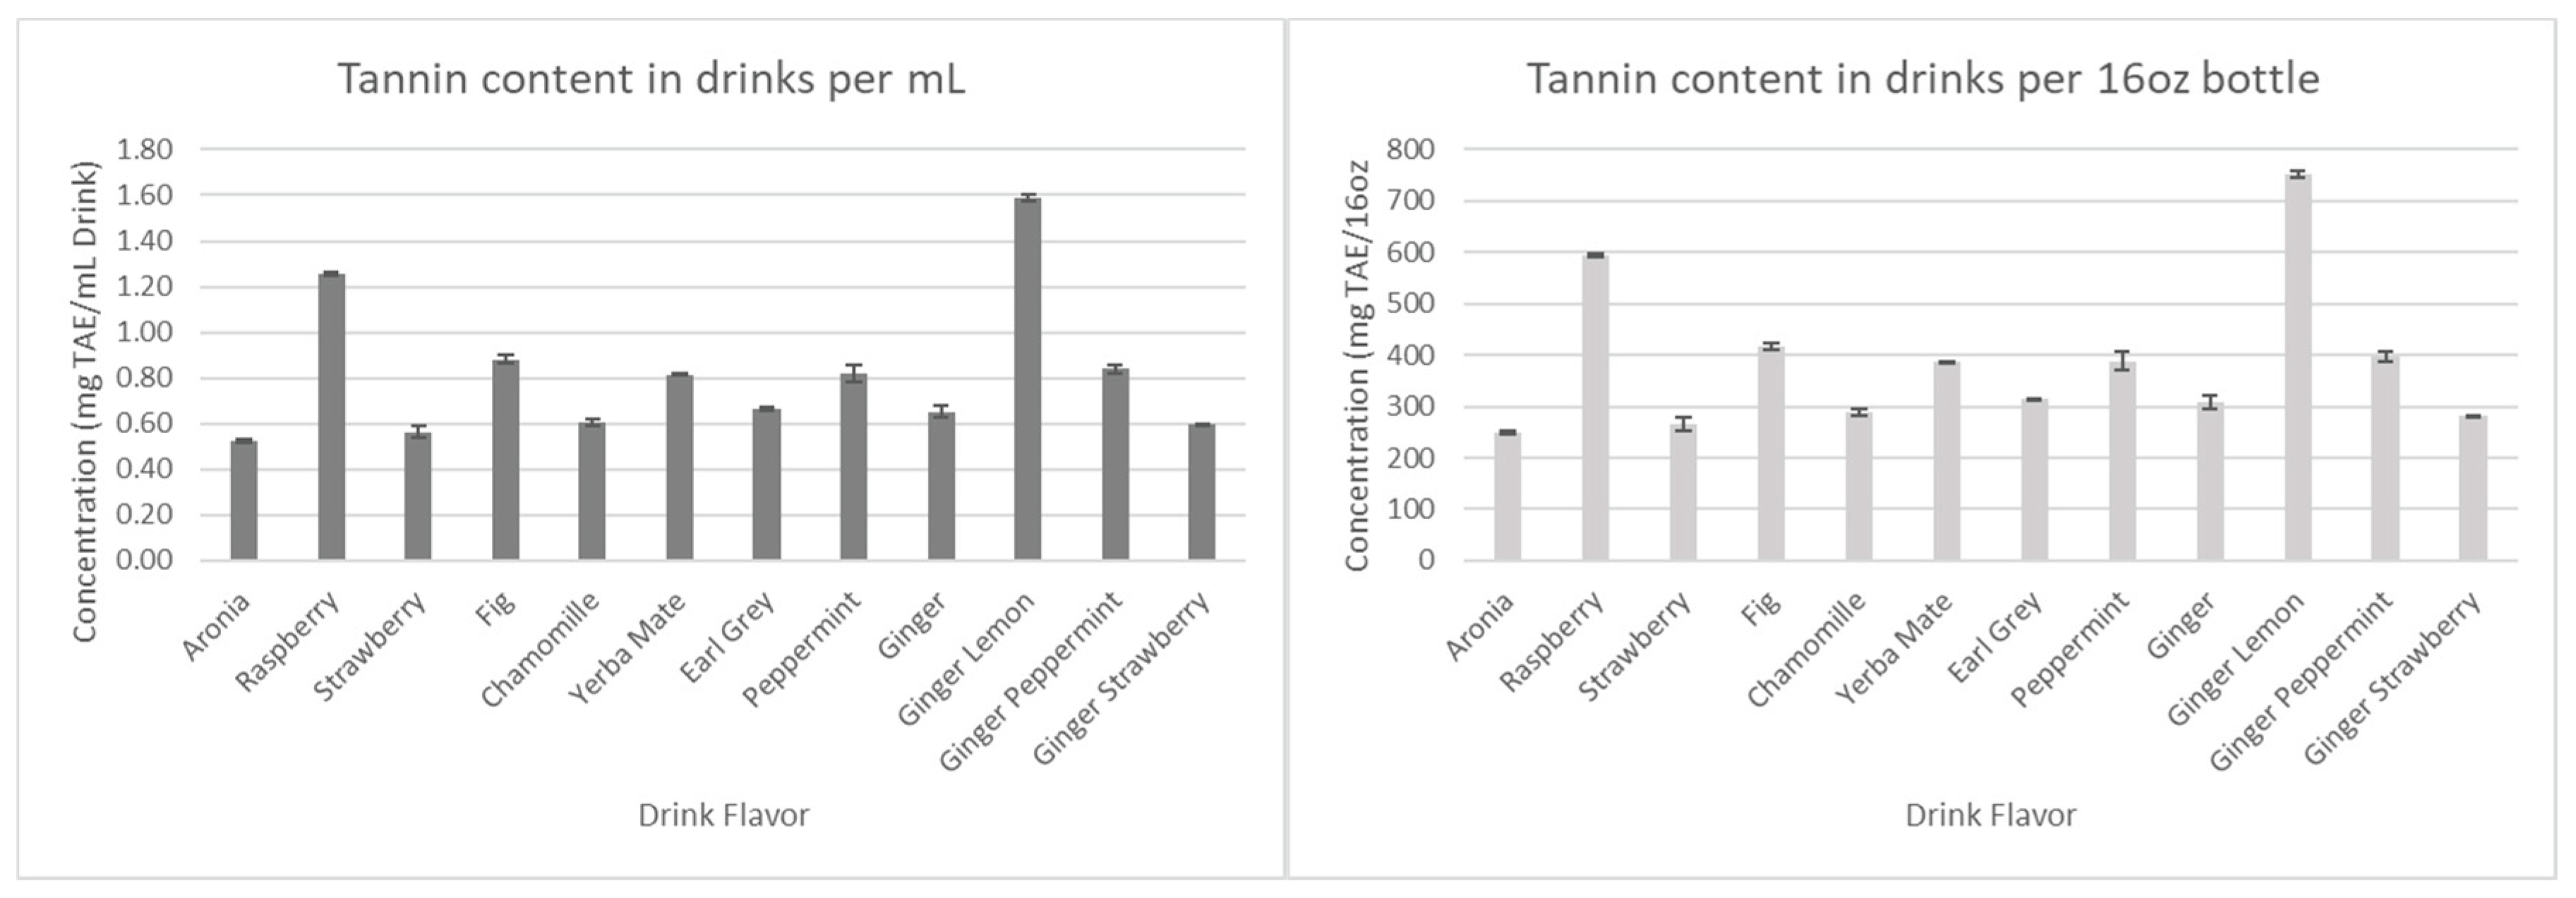
Considering that all the drinks have the same amount of aronia juice, we first assumed that all antioxidant concentration levels would remain relatively similar. However, as seen in Figure 7 and Figure 8, Ginger-Lemon and Earl Grey were found to contain the highest anthocyanin and polyphenol content among the drinks. Considering the combined phytochemical potential of aronia and ginger, it was expected that all drinks containing both aronia and ginger would have considerably higher antioxidants than those without. However, the results show that the antioxidants of these drinks remain comparable to basic aronia drinks, except for the aforementioned standouts. This trend continues in measurements for tannins and flavonoids.
Overall, we have found that ginger-lemon is the most effective drink formulation, based on its phytochemical content. The inability of the other ginger formulations to show significant changes in antioxidant content is something to be explored further during the technology transfer step.
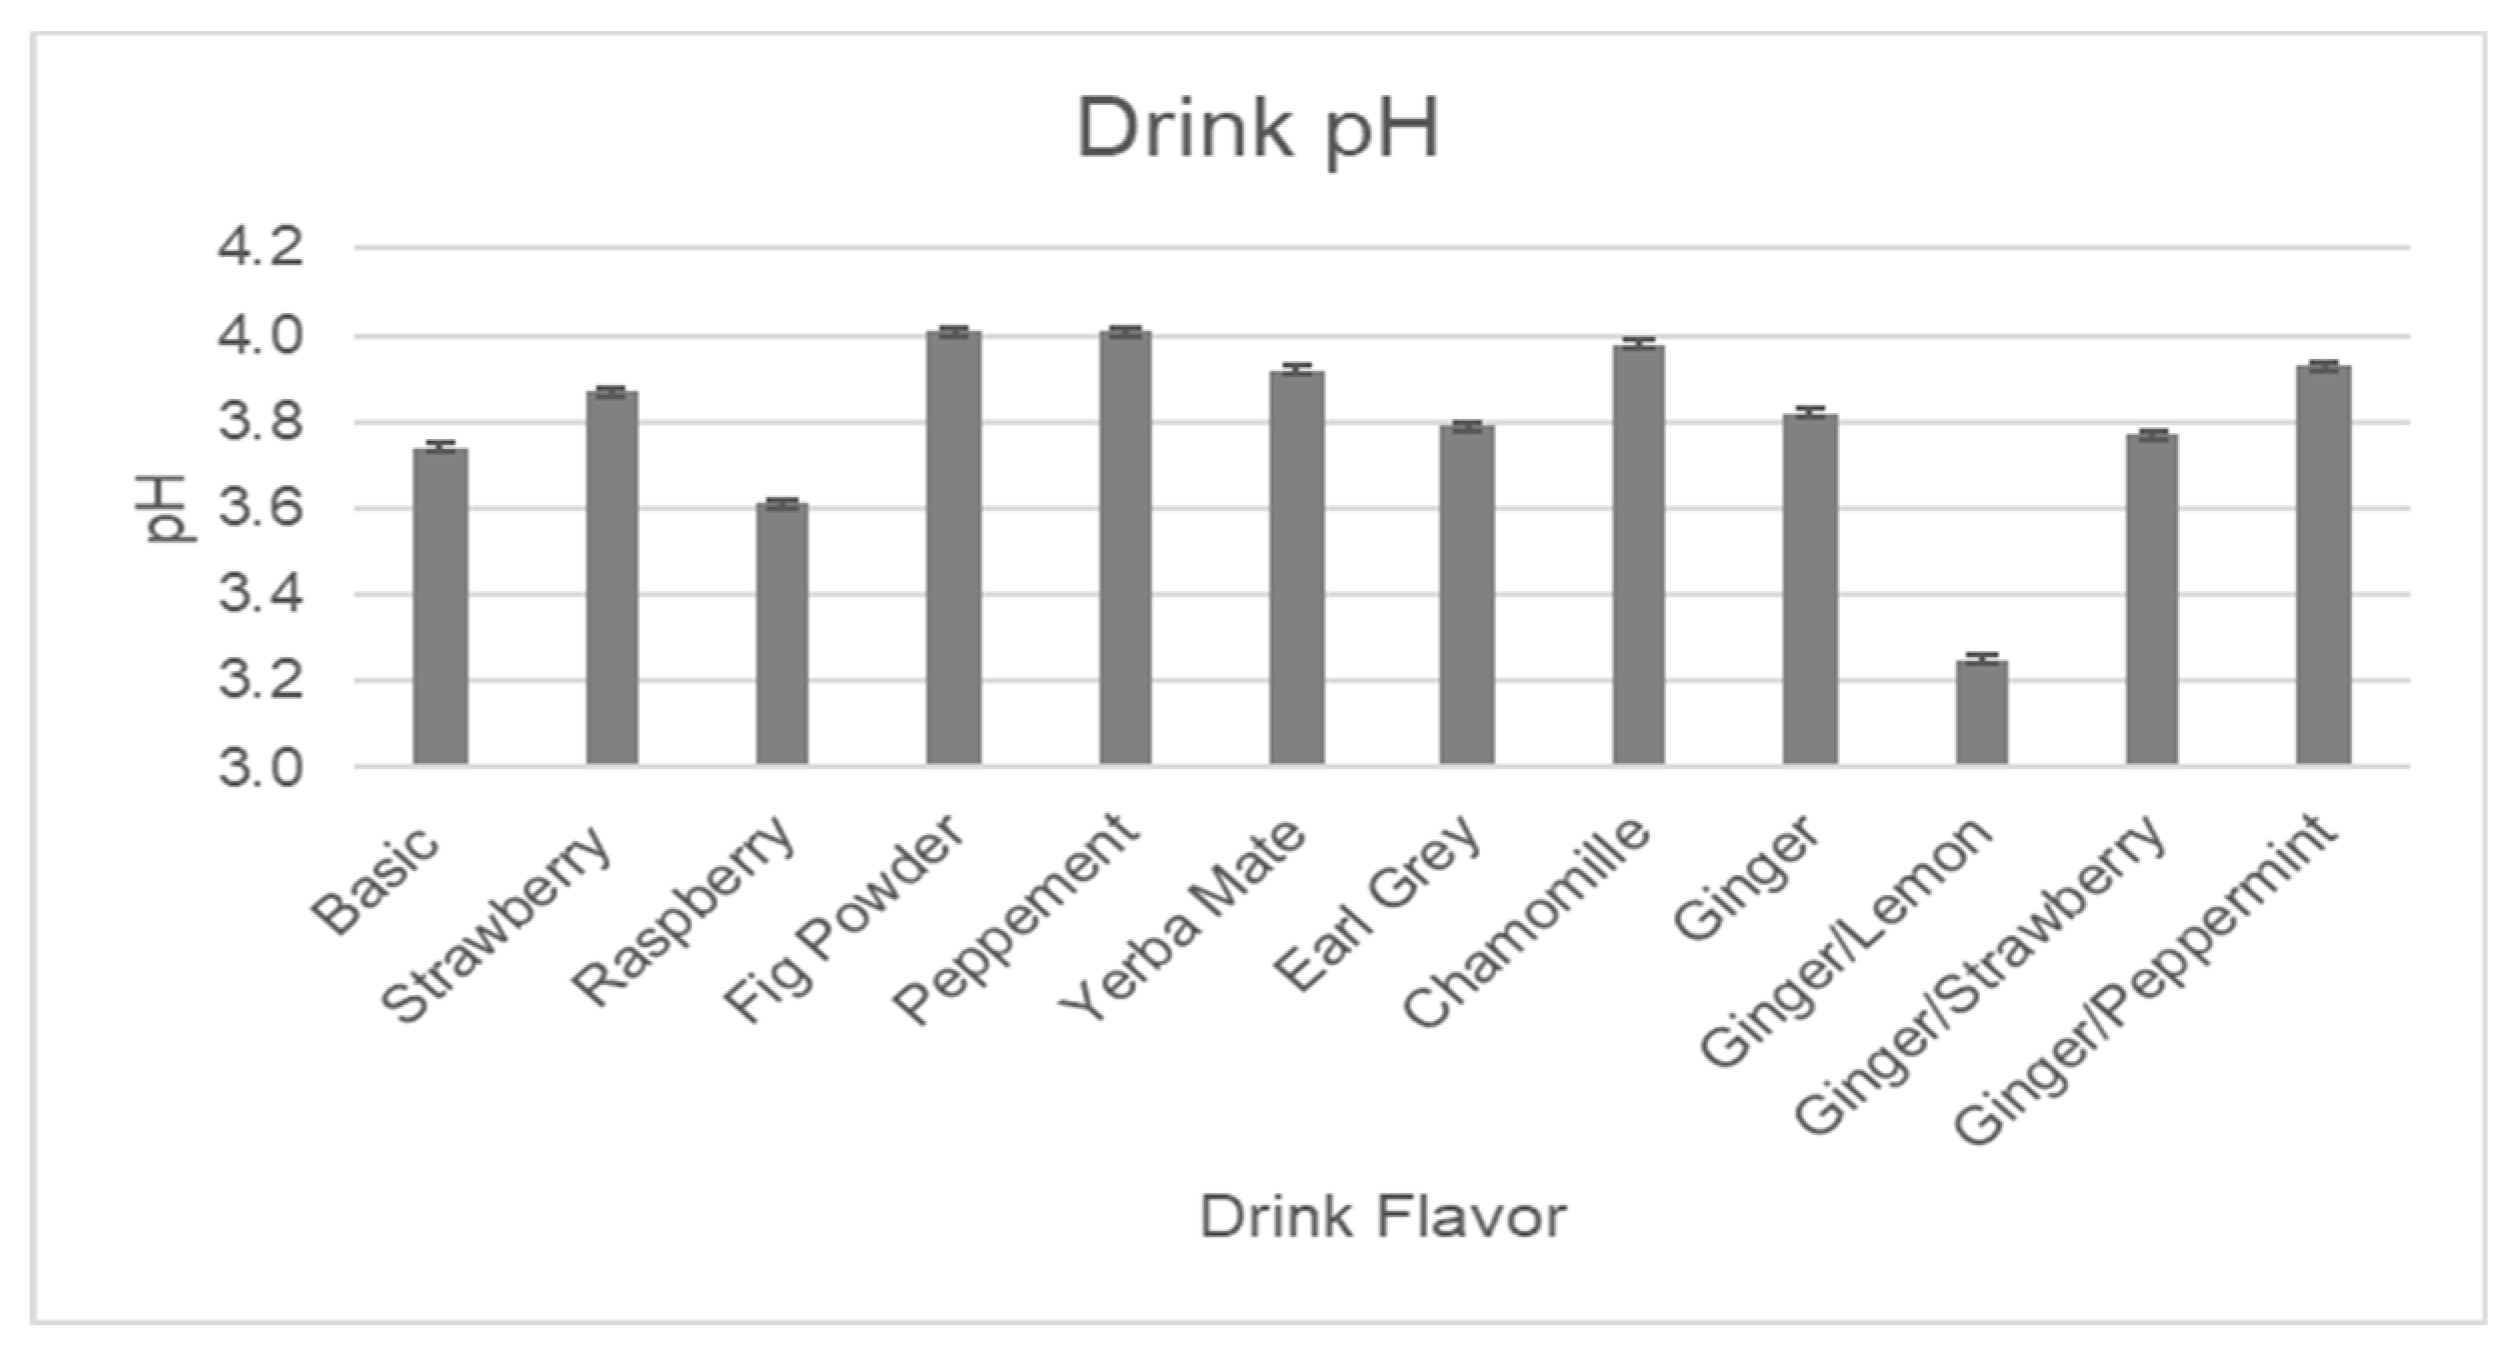
Figure 11, Figure 12 and Figure 13 below represent quantitative assays for pH, brix, and conductivity, which show very similar results for all formulations, indicating that some changes made to the base formulation by adding flavors have a very minor impact on the overall composition.
Figure 11.
Measured pH levels in drink formulations.
ICP/MS Analysis and Phytochemical Screening. Table 2 illustrates the results of qualitative screening of all drinks for major phytochemical groups. Obtained phytochemical screening results contained a slight level of variance between different flavors of drinks due to the nature of the different drink formulations and flavored additives. The primary purpose of these screenings is to allow for the addition of these phytochemicals to the drink label and for the drink to be considered as a significant source of said phytochemicals. The preliminary screening has shown the presence of tannins, flavonoids, saponins, steroids, glucosides, terpenoids, and carbohydrates in all flavors of drinks, while some drinks also have alkaloids.
Table 3 presents the results of minerals and microelements obtained by ICP/MS and compared with daily values (DV). ICP/MS results are based on analysis of the sample after digestion. Results suggest that each drink contains a suitable amount of Na, Mg, and K, bolstering the electrolyte capacity of the final product. However, due to aronia's presence, these drinks also provide a significant amount of zinc, iron, copper, and manganese, which increases their value for human health and well-being.
3. The Drink Survey
The power drink survey was created using Google Forms, which were programmed the way that after each new entry, the overall statistics are recalculated automatically.
The main purpose of this survey was to learn about market potential and customers’ preferences in taste for future commercialization of drinks. The survey was distributed electronically to farmers and members of local communities during extension outreach events in 2021-23, collecting and automatically processing the data and statistics. Conducting such an ongoing survey initially allowed us to make decisions regarding adding or terminating lines of drinks with flavors and additives. It also helped educate the public regarding power aid drinks on the market vs. our new lines of drinks, with an emphasis on their health benefits.
The survey includes an Introduction Statement introducing Hawk Power Aid Drinks (Hawk is a mascot of our school), and the goals for the project. This was followed by a description of the power drink, and subsequently, questions regarding demographic information, including, but not limited to: gender, age, ethnicity, education, and field of study, following questions about preferred drinks, taste aspects of drinks and the overall willingness to pursue such drinks in the future should they become available on the market.
Survey results were collected from various farms, conferences, and assemblies for the duration of 2020-2025. Survey results were used to reassess drink formulations and tweak them to meet the preferences of the public consumers. Figure 14 represents survey results when participants were asked to pick their three favorite drinks after tasting all of them.
Strawberry, Ginger with w/lemon, and Earl Grey were among the most popular drinks. This is due in part to the sweet notes of strawberry, the refreshing yet zesty taste of ginger-lemon, and the pungent yet bitter taste of Earl Grey -- all of which contribute to the success of these drinks in trial runs.
Figure 15 further narrows this data, as participants were then asked to choose their favorite out of the three most liked drinks.
Participants picked Ginger-lemon as the best drink formulation out of all 12 flavors. This may be linked to the time period in which the drinks were distributed. Lemonade is already a very popular and refreshing summer drink, so the success of ginger-lemon is somewhat expected.
Next (Figure 16, Figure 17, Figure 18, Figure 19 and Figure 20), we asked participants to rate the overall taste, sweetness, bitterness, sourness, and aftertaste of drinks. One of the most challenging aspects of creating the survey is extrapolating individual opinions and criticisms for a wide array of different drinks. With multiple drinks, a general consensus must be taken into account for the entire lineup of drinks.
Figure 17 gives insight into how sweet the drink formulations are, and from this result, it was concluded that slightly less stevia should be used moving forward. This, in addition to results for sourness and bitterness, all suggest the augmentation of sweetener in formulations.
As a result of the after-taste survey results, it was determined that an additional field would be a welcome addition in future iterations of the survey that would help to determine what after-taste is present in which specific drink formulation and help tackle the issue.
Finally, the last part of the survey was to determine the current level of awareness of the public regarding power drinks and their health benefits, along with an estimation of the readiness of the public to the product and price expectations. Figure 21 clearly illustrates that after outreach explanation activities, a significant portion of participants would be more willing to invest and consume such drinks in the future.
Results of the ‘More or less likely’ question gauge the general interest in the drink project and the effect of clearly advertised health benefits associated with power drinks. Figure 22 presents the public intake into the price of the drink.
We have estimated the potential price for the drinks to be between $3 and $4 per 16-oz bottle, while the production is done on farms using small batch bottling equipment. The question assessed the general willingness to pay for a price above current projections of 5$. From those results, it was found that less than 15% of participants were inclined to pay for the premium, while more than one-fourth were very willing to pay $5.
Figure 23 illustrates the potential frequency of consuming drinks by the public.
Both Figure 22 and Figure 23 give insight as to how much and how often people would be willing to consume the product for a relatively premium price point. Depending on total manufacturing costs (to be determined in the future), it may be necessary to adjust the price or size of the product to adapt to market demand.
Figure 24 summarizes the proposal for additional future drink flavors made by the public. Turmeric, ginger, and herbal teas were the most suggested future additives.
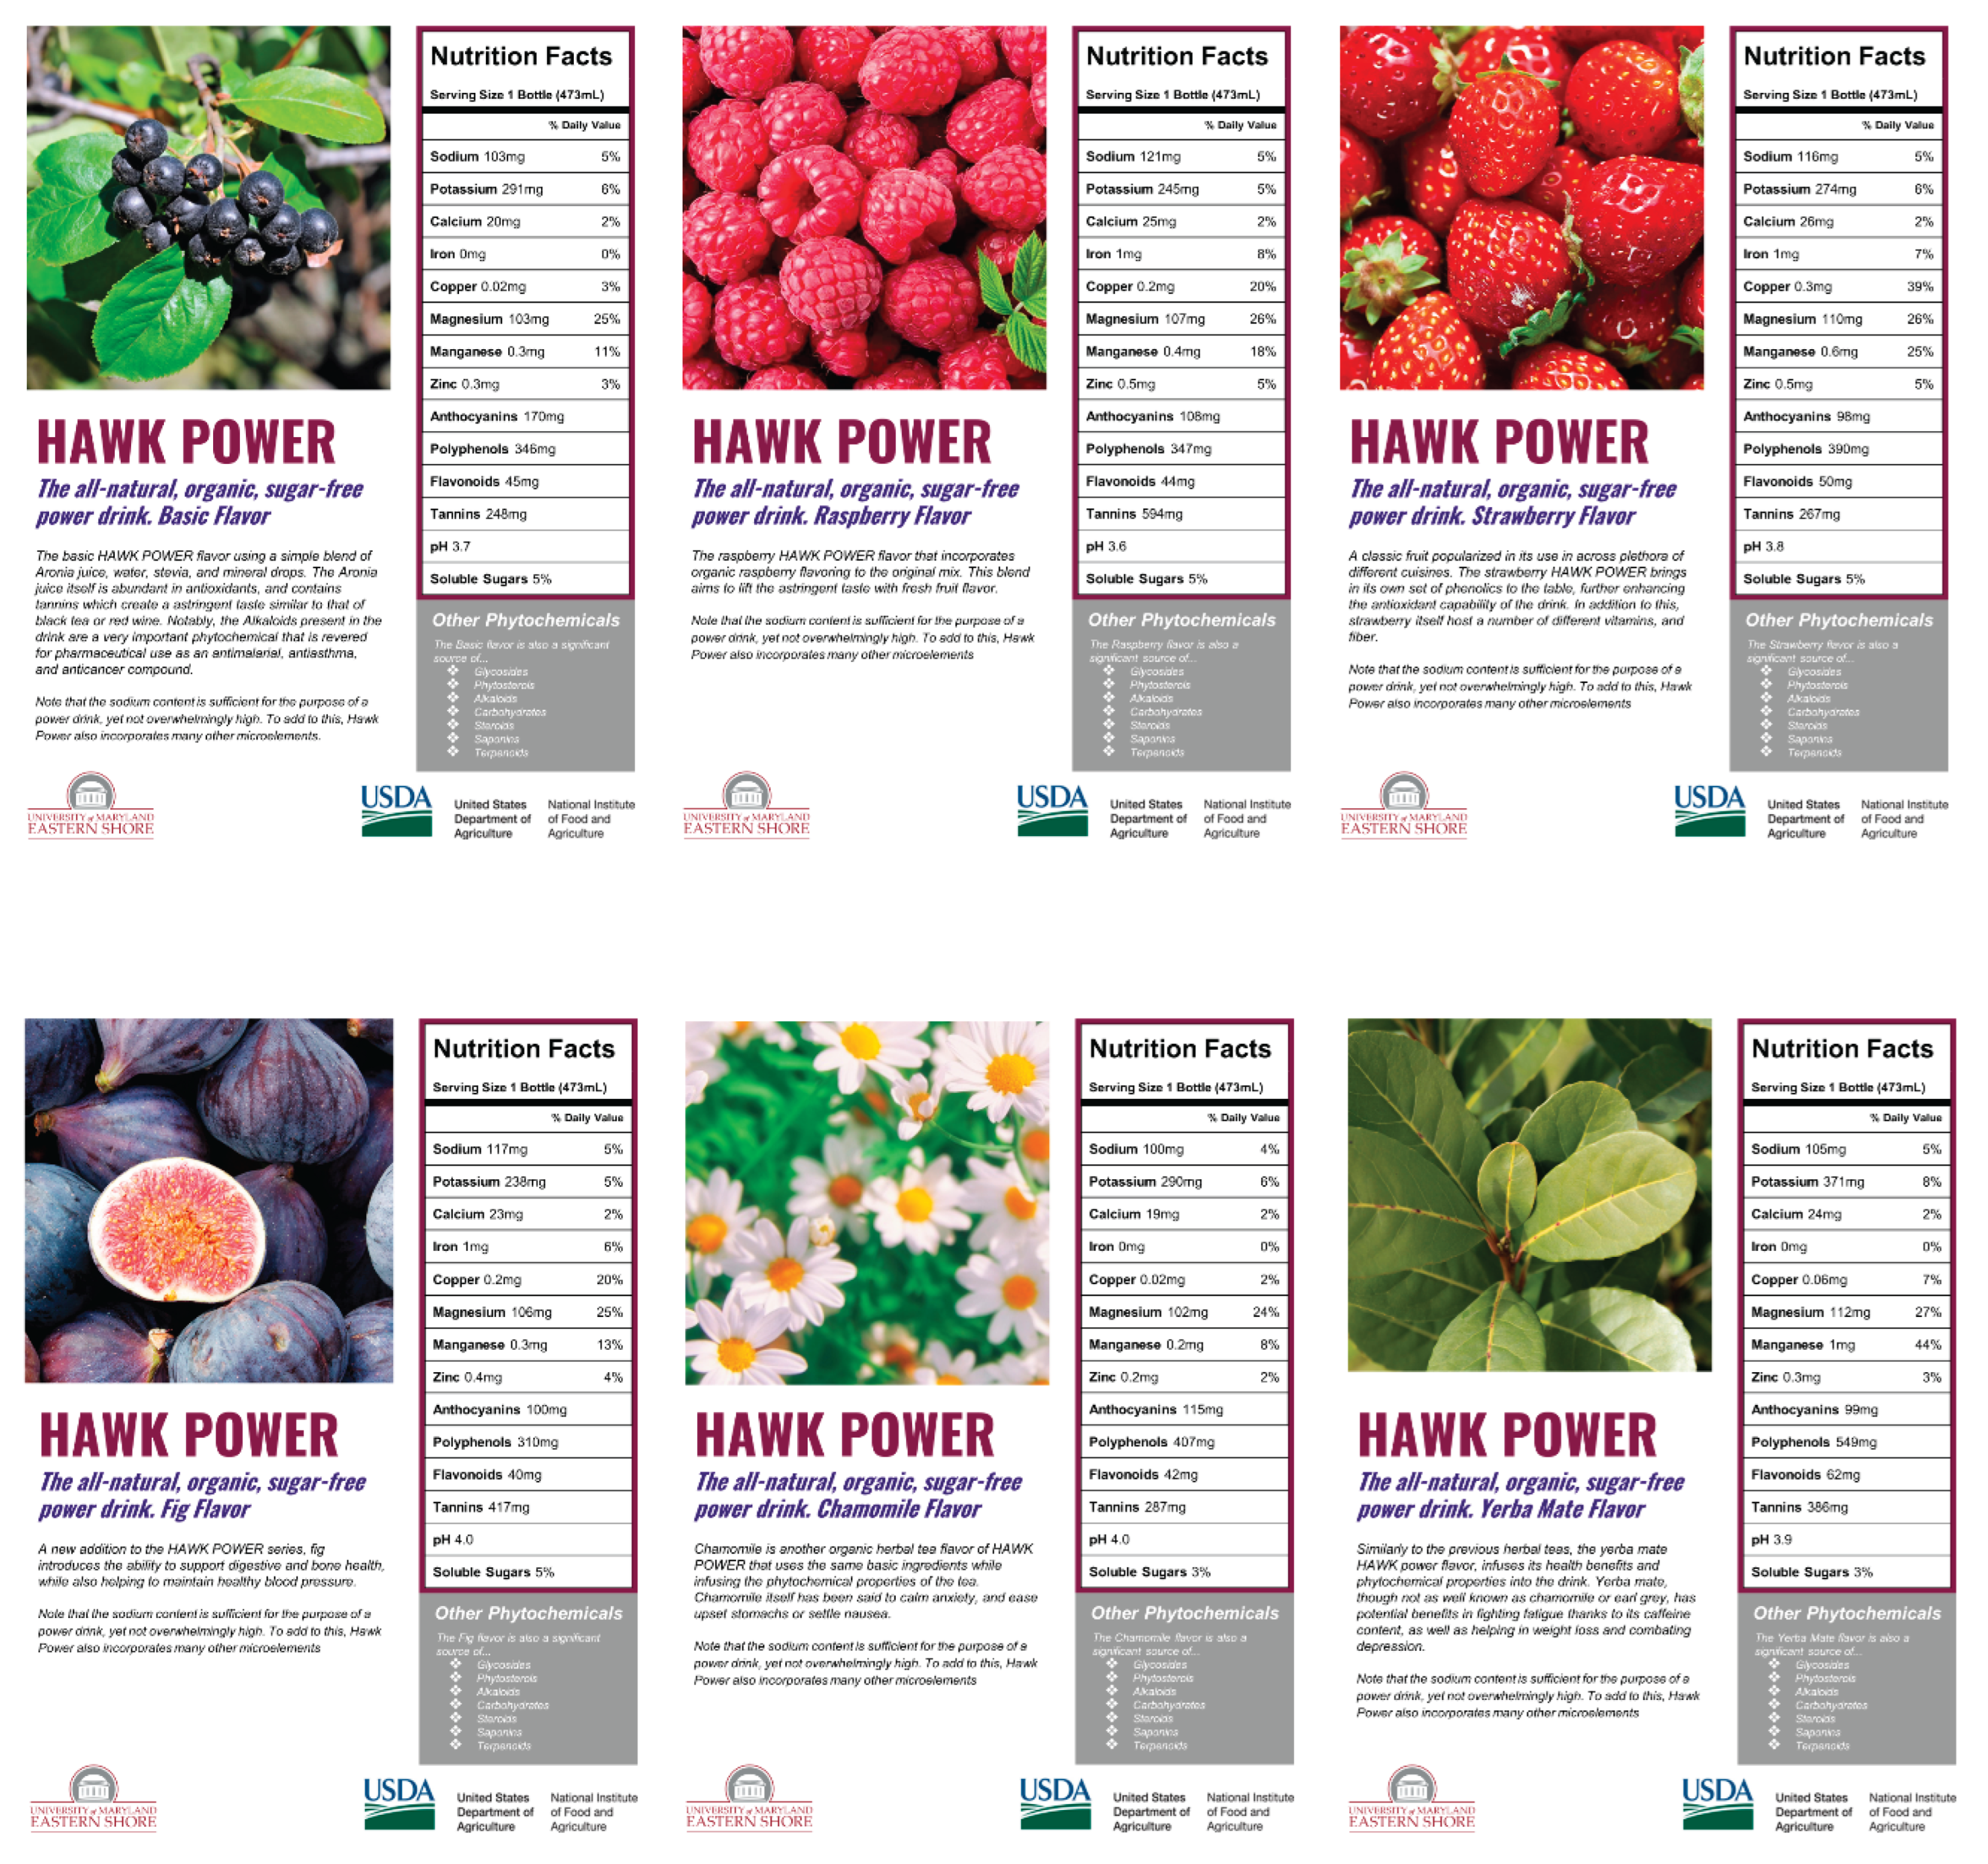
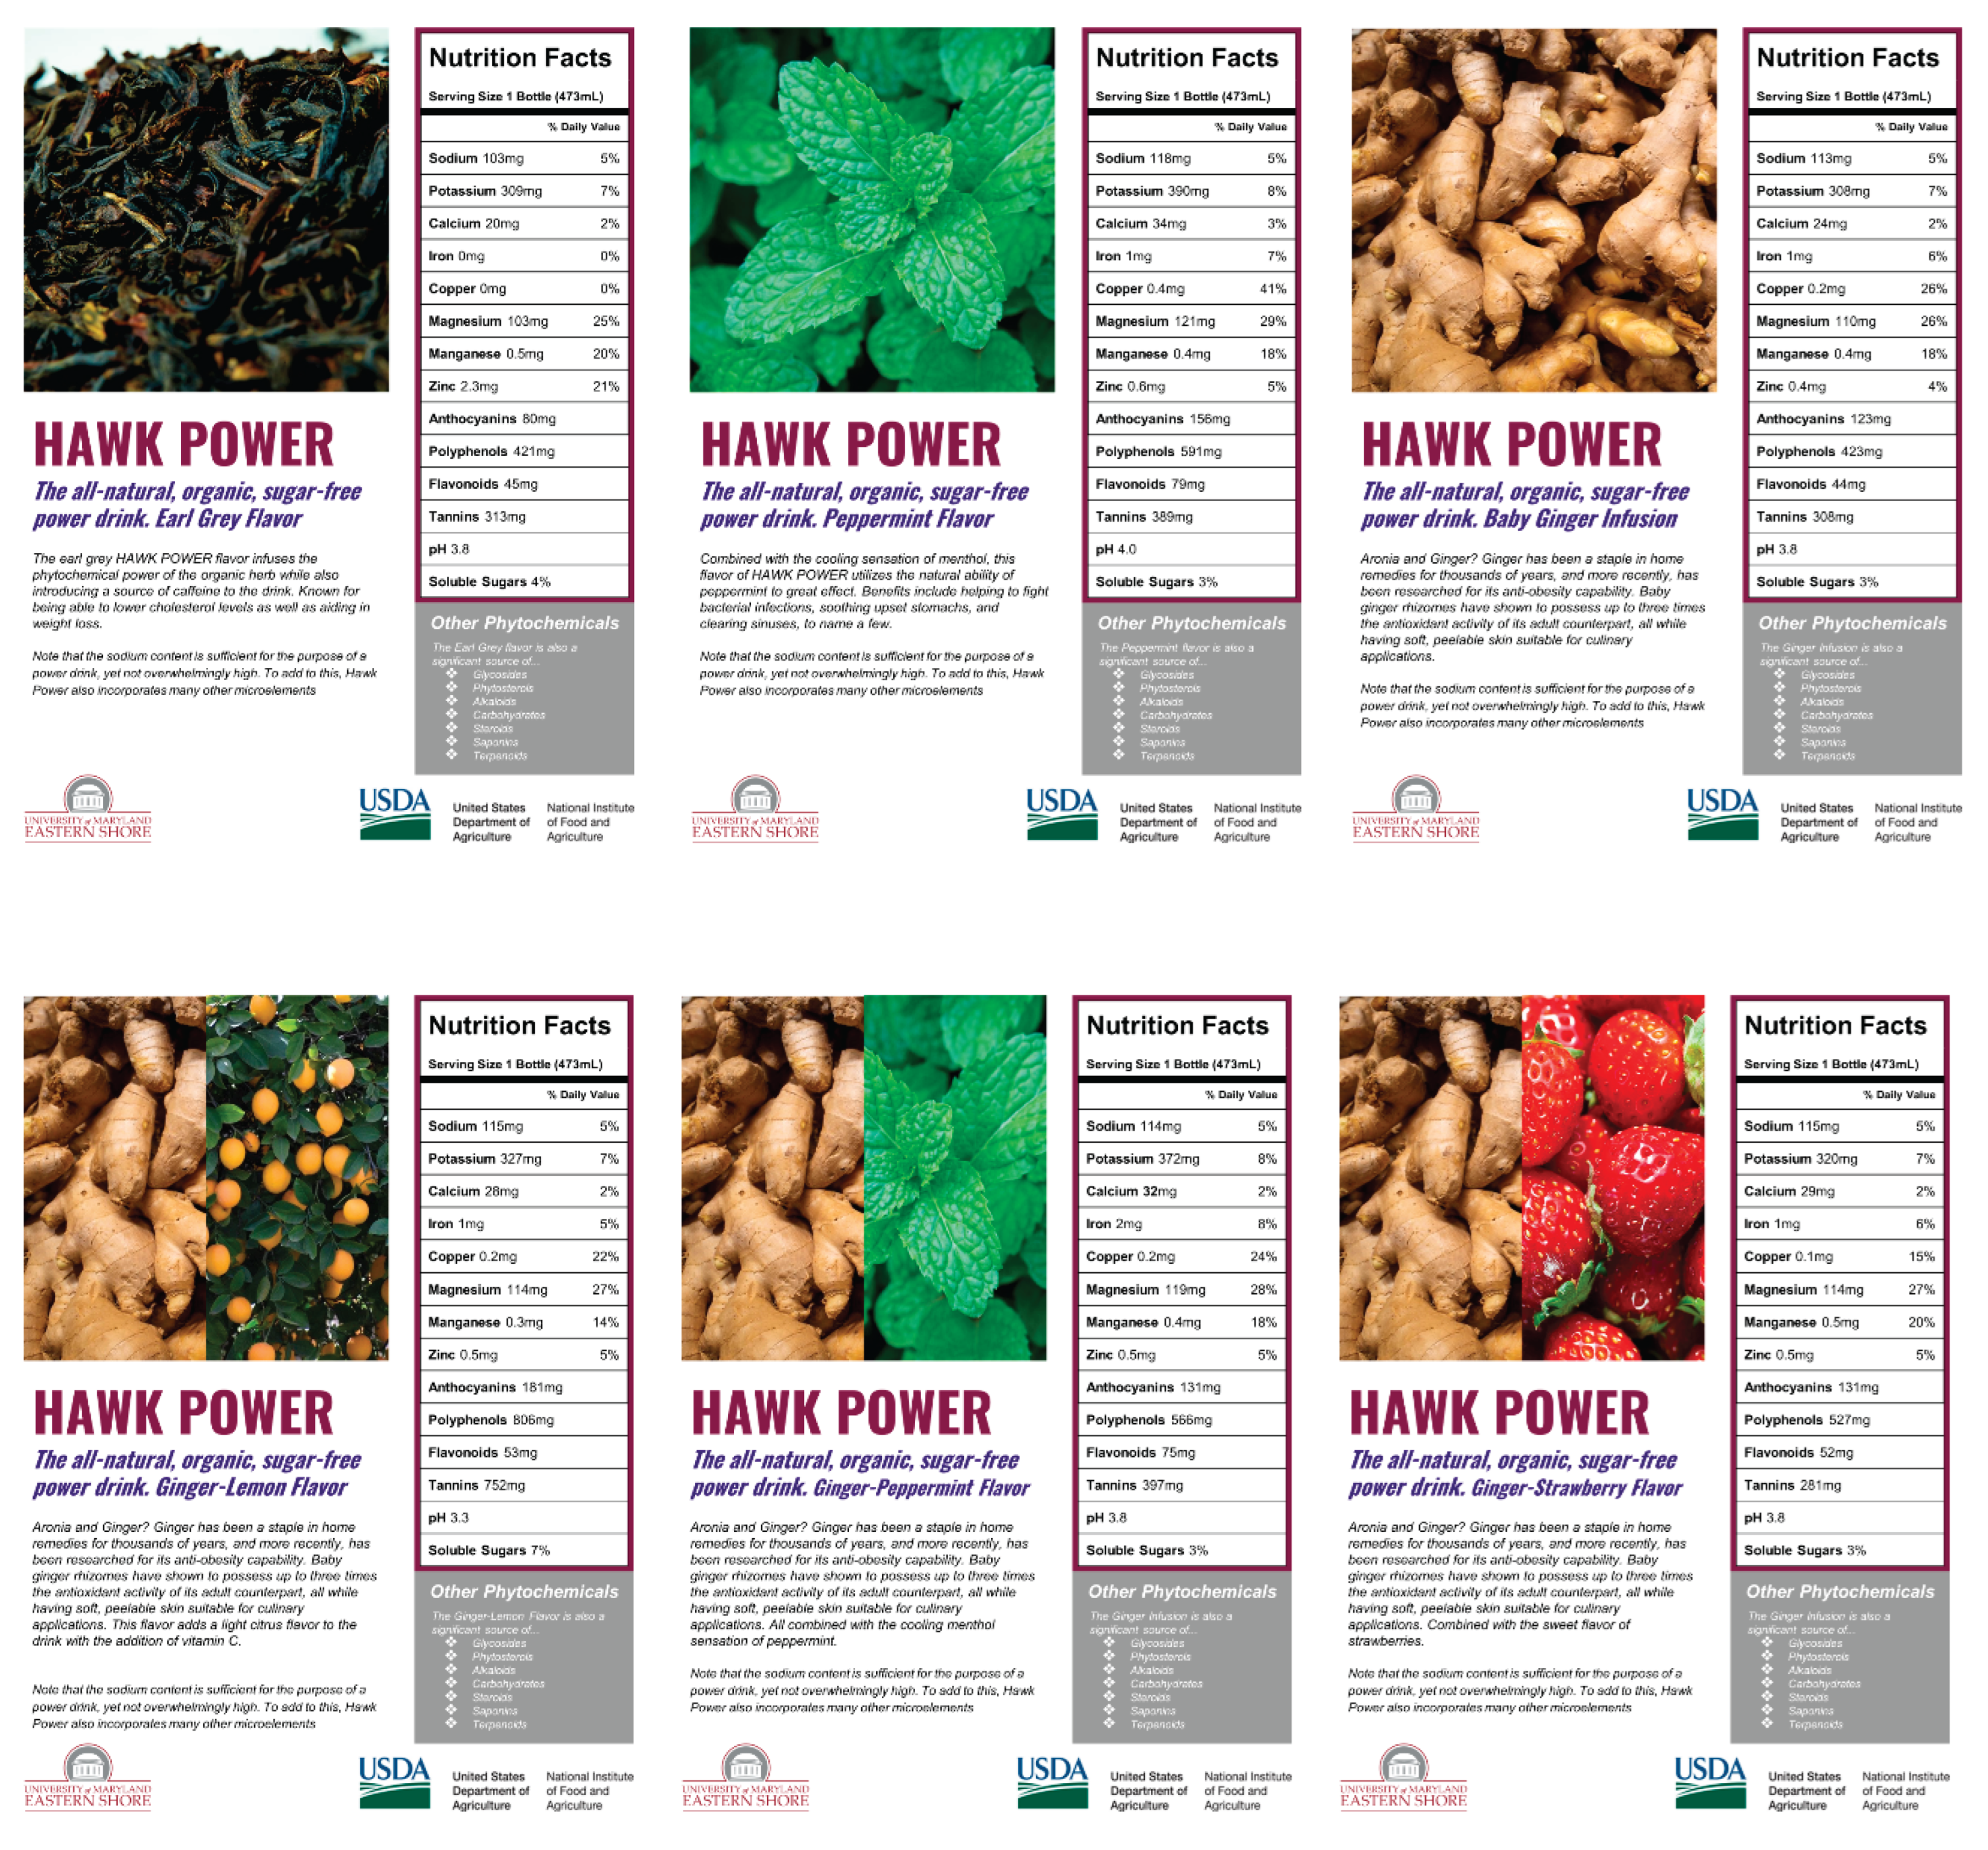
Drink Labels. Drink labels were created and designed through the collaborative efforts of the REEU summer program members and were made such that all relevant information surrounding a particular flavor line was clearly indicated and expressed.
Figure 25.
Label design for all existing drink formulations.
4. Conclusions
The formulation of an all-natural, organic power drink with no artificial additives, colorants, flavorings, or added sugars and its combination with herbal teas and natural flavors have been assessed in their antioxidant potency for the purpose of creating a new global market in health beverages capable of clearly labeling their effective ingredients. Based on the research conducted, the established optimum ratio of aronia berry juice to water- or water-soluble additives in the drink was 1:3. This was determined by analyzing taste, taking into consideration limitation for daily use of sorbitol, the regulation volume for fruit juice in sports drinks, and finally, maximizing antioxidant levels. This research explores the potential substitute of water with herbal teas and lyophilized organic powders of other berries and fruits in the formulation of the drink, which still serves to maintain the all-natural organic power drink claim while enriching the drinks with beneficial phytochemicals. For all 12 drink formulations described in this manuscript, the exact levels of antioxidants, pH, brix, conductivity, and minerals were determined to create accurate and marketable drink labels. It was found that across all prepared formulations, a minimum concentration of 80mg C3G, 300mg GAE, 40mg QE, and 200mg TAE was present in each 16-oz bottle (Anthocyanin, Polyphenol, Flavonoid, and Tannin content, respectively). Key electrolyte compounds such as Na, Ca, and K were quantified in all formulations, with levels mirroring those of current market sports drinks.
Supplementary Materials
The following supporting information can be downloaded at the website of this paper posted on Preprints.org, Table S1: Raw measurements of total polyphenols content of drink, Table S2: Measurements of anthocyanins content, Table S3: Brix, conductivity, and pH of drinks raw measurements, Table S4. Raw data for ICP/MS.
Author Contributions
Conceptualization, V.V.V.; methodology, B.S.; validation, K.S., L.O. and P.S.; formal analysis, B.S., K.S., and L.O. ; resources, V.V.V.; data curation, P.S.; writing—original draft preparation, B.S.; writing—review and editing, P.S and V.V.V,.; visualization, B.S.; supervision, V.V. V and A.G.R.; project administration, V.V.V., and A.G.R.; funding acquisition, V.V.V. All authors have read and agreed to the published version of the manuscript.
Funding
This work is supported by the AFRI-EWD-REEU program, grant no. 2020-69018-30655, from the U.S. Department of Agriculture, National Institute of Food and Agriculture, USDA-NIFA Evans-Allen Grants at UMES – accession number 1016197, – phytochemical characterization, and USDA-NIFA CBG grant 2021-38821-34601 in collaboration with Virginia State University for work with juvenile ginger. Any opinions, findings, conclusions, or recommendations expressed in this publication are those of the author(s) and should not be construed to represent any official USDA or U.S. Government.
Institutional Review Board Statement
Not relevant.
Informed Consent Statement
Not relevant.
Data Availability Statement
Not relevant.
Acknowledgments
We would like to thank consultant Dr. William Weaver from the University of Maryland Eastern Shore (UMES) for helping with analytical equipment, Ms. Henriette Den Ouden from UMES demonstration farm, Wye Research and Education Center for helping with outreach activities, Jalma, Mill Run, Ray’s and Habanera Farms in Maryland and New Jersey for cooperating in this project. We would like to thank undergraduate students for their minor contributions to the project: Elizabeth Wagner, Devki Shah, Ajmaani Whitter, Brooklyn Green, and Sade Omoare.
Conflicts of Interest
The Authors declare no conflict of interest.
Abbreviations
The following abbreviations are used in this manuscript:
| UV/Vis | ultraviolet–visible spectrophotometry |
| nm | Nanometer |
| ml | Milliliter |
| μL | microliter |
| M | molar |
| g | gram |
| mg | milligram |
| MPa | Megapascal |
| DF | dilution factor |
| DI water | de-ionized water |
| °C | degree Celsius |
| C3G | cyanidin-3-glucoside |
| DW | Dry Weight |
| FW | Fresh Weight |
| GAE | gallic acid equivalents |
| QE | Quercetin Equivalents |
References
- Brand, M. Aronia: Native Shrubs with Untapped Potential. Arnoldia 2010, 67, 14–25. [Google Scholar] [CrossRef]
- Green, B. V.; Aroh, B.; Fiorellino, N. M.; Ristvey, A. G.; Volkis, V. V. Effect of Cultural Management and Plant Age on the Yield, °Brix, and Antioxidant Content of Aronia Mitschurinii Grown in Maryland. ACS Omega 2023, 8, 4060–4071. [Google Scholar] [CrossRef]
- Pérez-Jiménez, J.; Neveu, V.; Vos, F.; Scalbert, A. Identification of the 100 Richest Dietary Sources of Polyphenols: An Application of the Phenol-Explorer Database. Eur. J. Clin. Nutr. 2010, 64 (Suppl. S3), S112–20. [Google Scholar] [CrossRef]
- Albuquerque, T. G.; Silva, M. A.; Oliveira, M. B. P. P.; Costa, H. S. Analysis, Identification, and Quantification of Anthocyanins in Fruit Juices. In Fruit Juices; Elsevier, 2018; pp 693–737.
- Gabrielska, J.; Oszmiański, J. Antioxidant Activity of Anthocyanin Glycoside Derivatives Evaluated by the Inhibition of Liposome Oxidation. Z. Naturforsch. C 2005, 60, 399–407. [Google Scholar] [CrossRef] [PubMed]
- Kobus, Z.; Nadulski, R.; Wilczyński, K.; Kozak, M.; Guz, T.; Rydzak, L. Effect of the Black Chokeberry (Aronia Melanocarpa (Michx.) Elliott) Juice Acquisition Method on the Content of Polyphenols and Antioxidant Activity. PLoS One 2019, 14, e0219585. [Google Scholar] [CrossRef]
- Valcheva-Kuzmanova, S.; Marazova, K.; Krasnaliev, I.; Galunska, B.; Borisova, P.; Belcheva, A. Effect of Aronia Melanocarpa Fruit Juice on Indomethacin-Induced Gastric Mucosal Damage and Oxidative Stress in Rats. Exp. Toxicol. Pathol. 2005, 56, 385–392. [Google Scholar] [CrossRef] [PubMed]
- Brzóska, M. M.; Rogalska, J.; Galazyn-Sidorczuk, M.; Jurczuk, M.; Roszczenko, A.; Tomczyk, M. Protective Effect of Aronia Melanocarpa Polyphenols against Cadmium-Induced Disorders in Bone Metabolism: A Study in a Rat Model of Lifetime Human Exposure to This Heavy Metal. Chem. Biol. Interact. 2015, 229, 132–146. [Google Scholar] [CrossRef]
- Mikulic-Petkovsek, M.; Schmitzer, V.; Slatnar, A.; Stampar, F.; Veberic, R. Composition of Sugars, Organic Acids, and Total Phenolics in 25 Wild or Cultivated Berry Species. J. Food Sci. 2012, 77, C1064–70. [Google Scholar] [CrossRef]
- Ogbuewu, I. P.; Jiwuba, P. D.; Ezeokeke, C. T.; Uchegbu, M. C.; Okoli, I. C.; Iloeje, M. U. Evaluation of Phytochemical and Nutritional Composition of Ginger Rhizome Powder. Int’l Journal of Agric. and Rural Dev 2014, 17, 1663–1670. [Google Scholar]
- Ghasemzadeh, A.; Jaafar, H. Z. E.; Rahmat, A. Optimization Protocol for the Extraction of 6-Gingerol and 6-Shogaol from Zingiber Officinale Var. Rubrum Theilade and Improving Antioxidant and Anticancer Activity Using Response Surface Methodology. BMC Complementary and Alternative Medicine 2015, 15. [Google Scholar] [CrossRef]
- Suk, S.; Kwon, G. T.; Lee, E.; Jang, W. J.; Yang, H.; Kim, J. H.; Thimmegowda, N. R.; Chung, M.-Y.; Kwon, J. Y.; Yang, S.; Kim, J. K.; Park, J. H. Y.; Lee, K. W. Gingerenone A, a Polyphenol Present in Ginger, Suppresses Obesity and Adipose Tissue Inflammation in High-Fat Diet-Fed Mice. Mol. Nutr. Food Res. 2017, 61, 1700139. [Google Scholar] [CrossRef] [PubMed]
- Walczyk, T. The Potential of Inorganic Mass Spectrometry in Mineral and Trace Element Nutrition Research. Fresenius J. Anal. Chem. 2001, 370, 444–453. [Google Scholar] [CrossRef]
- Fitch, C.; Keim, K. S.; Academy of Nutrition and Dietetics. Position of the Academy of Nutrition and Dietetics: Use of Nutritive and Nonnutritive Sweeteners. J. Acad. Nutr. Diet. 2012, 112, 739–758. [Google Scholar] [CrossRef] [PubMed]
- Lee, J.; Durst, R. W.; Wrolstad, R. E. Determination of Total Monomeric Anthocyanin Pigment Content of Fruit Juices, Beverages, Natural Colorants, and Wines by the pH Differential Method: Collaborative Study. J. AOAC Int. 2005, 88, 1269–1278. [Google Scholar] [CrossRef] [PubMed]
- Woisky, R. G.; Salatino, A. Analysis of Propolis: Some Parameters and Procedures for Chemical Quality Control. J. Apic. Res. 1998, 37, 99–105. [Google Scholar] [CrossRef]
- Jakobek, L.; Seruga, M.; Medvidovic-Kosanovic, M.; Novak, I. Anthocyanin Content and Antioxidant Activity of Various Red Fruit Juices. Deutsche Lebensmittel-rundschau 2007, 103, 58. [Google Scholar]
- Wojdyło, A.; Oszmiański, J.; Bober, I. The Effect of Addition of Chokeberry, Flowering Quince Fruits and Rhubarb Juice to Strawberry Jams on Their Polyphenol Content, Antioxidant Activity and Colour. Eur. Food Res. Technol. 2008, 227, 1043–1051. [Google Scholar] [CrossRef]
- Denev, P.; Kratchanova, M.; Petrova, I.; Klisurova, D.; Georgiev, Y.; Ognyanov, M.; Yanakieva, I. Black Chokeberry (Aronia Melanocarpa(Michx.) Elliot) Fruits and Functional Drinks Differ Significantly in Their Chemical Composition and Antioxidant Activity. J. Chem. 2018, 2018, 1–11. [Google Scholar] [CrossRef]
- Nowak, D.; Gośliński, M.; Wojtowicz, E. Comparative Analysis of the Antioxidant Capacity of Selected Fruit Juices and Nectars: Chokeberry Juice as a Rich Source of Polyphenols. Int. J. Food Prop. 2016, 19, 1317–1324. [Google Scholar] [CrossRef]
- Amin, A. S. Utilization of Tetrazolium Blue for the Colorimetric Assay of Tannins in Tea. Mikrochim. Acta 1997, 126, 105–108. [Google Scholar] [CrossRef]
- Antoine, M.-L.; Simon, C.; Pizzi, A. UV Spectrophotometric Method for Polyphenolic Tannin Analysis. J. Appl. Polym. Sci. 2004, 91, 2729–2732. [Google Scholar] [CrossRef]
- Deshpande, S. S.; Cheryan, M.; Salunkhe, D. K. Tannin Analysis of Food Products. Crit. Rev. Food Sci. Nutr. 1986, 24, 401–449. [Google Scholar] [CrossRef] [PubMed]
- Ervin, E. M.; Kariuki, J. K. Effect of Extraction Method on Antioxidant Determination in Produce by Differential Pulse Voltammetry. Int. J. Electrochem. Sci. 2014, 9, 6235–6245. [Google Scholar] [CrossRef]
- Mazumder, M. A. R.; Tolaema, A.; Chaikhemarat, P.; Rawdkuen, S. Antioxidant and Anti-Cytotoxicity Effect of Phenolic Extracts from Psidium Guajava Linn. Leaves by Novel Assisted Extraction Techniques. Foods 2023, 12. [Google Scholar] [CrossRef]
- Sigma Aldrich. https://www.sigmaaldrich.com/US/en/product/sial/phl89616 (accessed 01/08/2024).
Figure 7.
Total anthocyanin concentration in drink formulations.
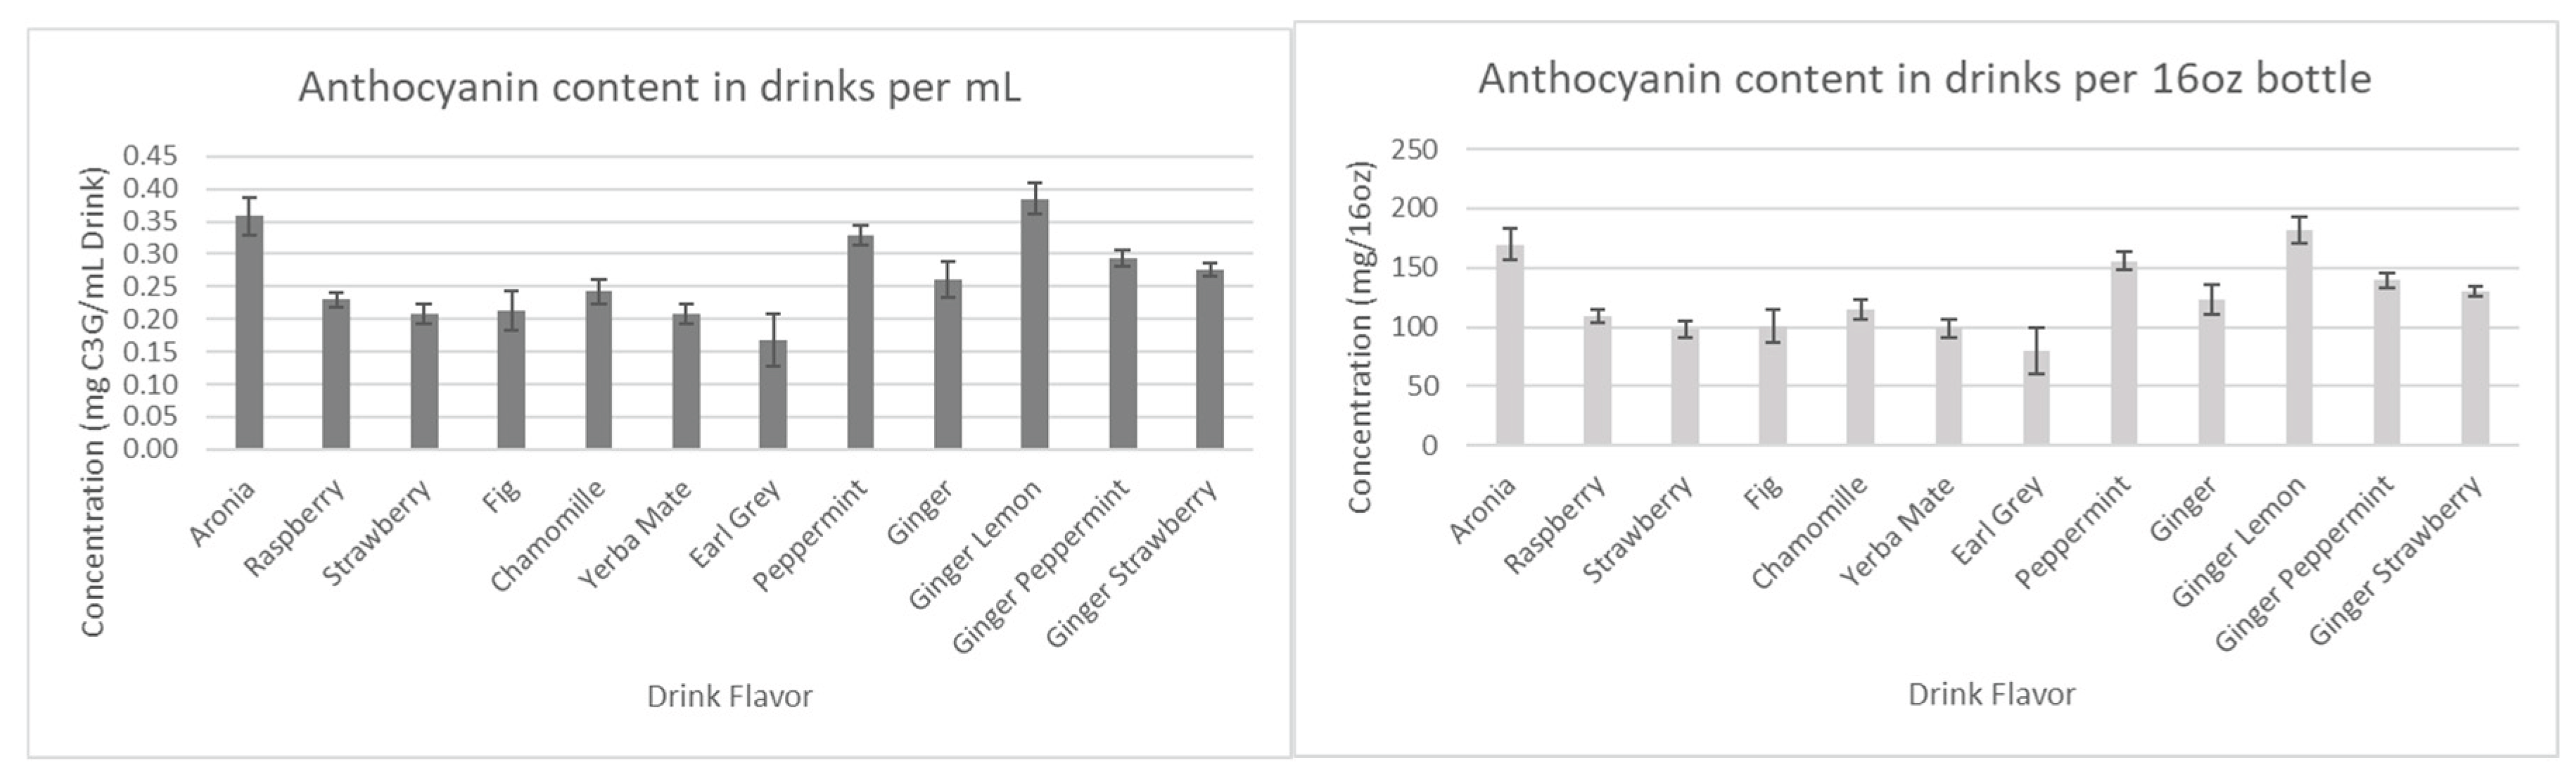
Figure 12.
Measured conductivity in drink formulations.
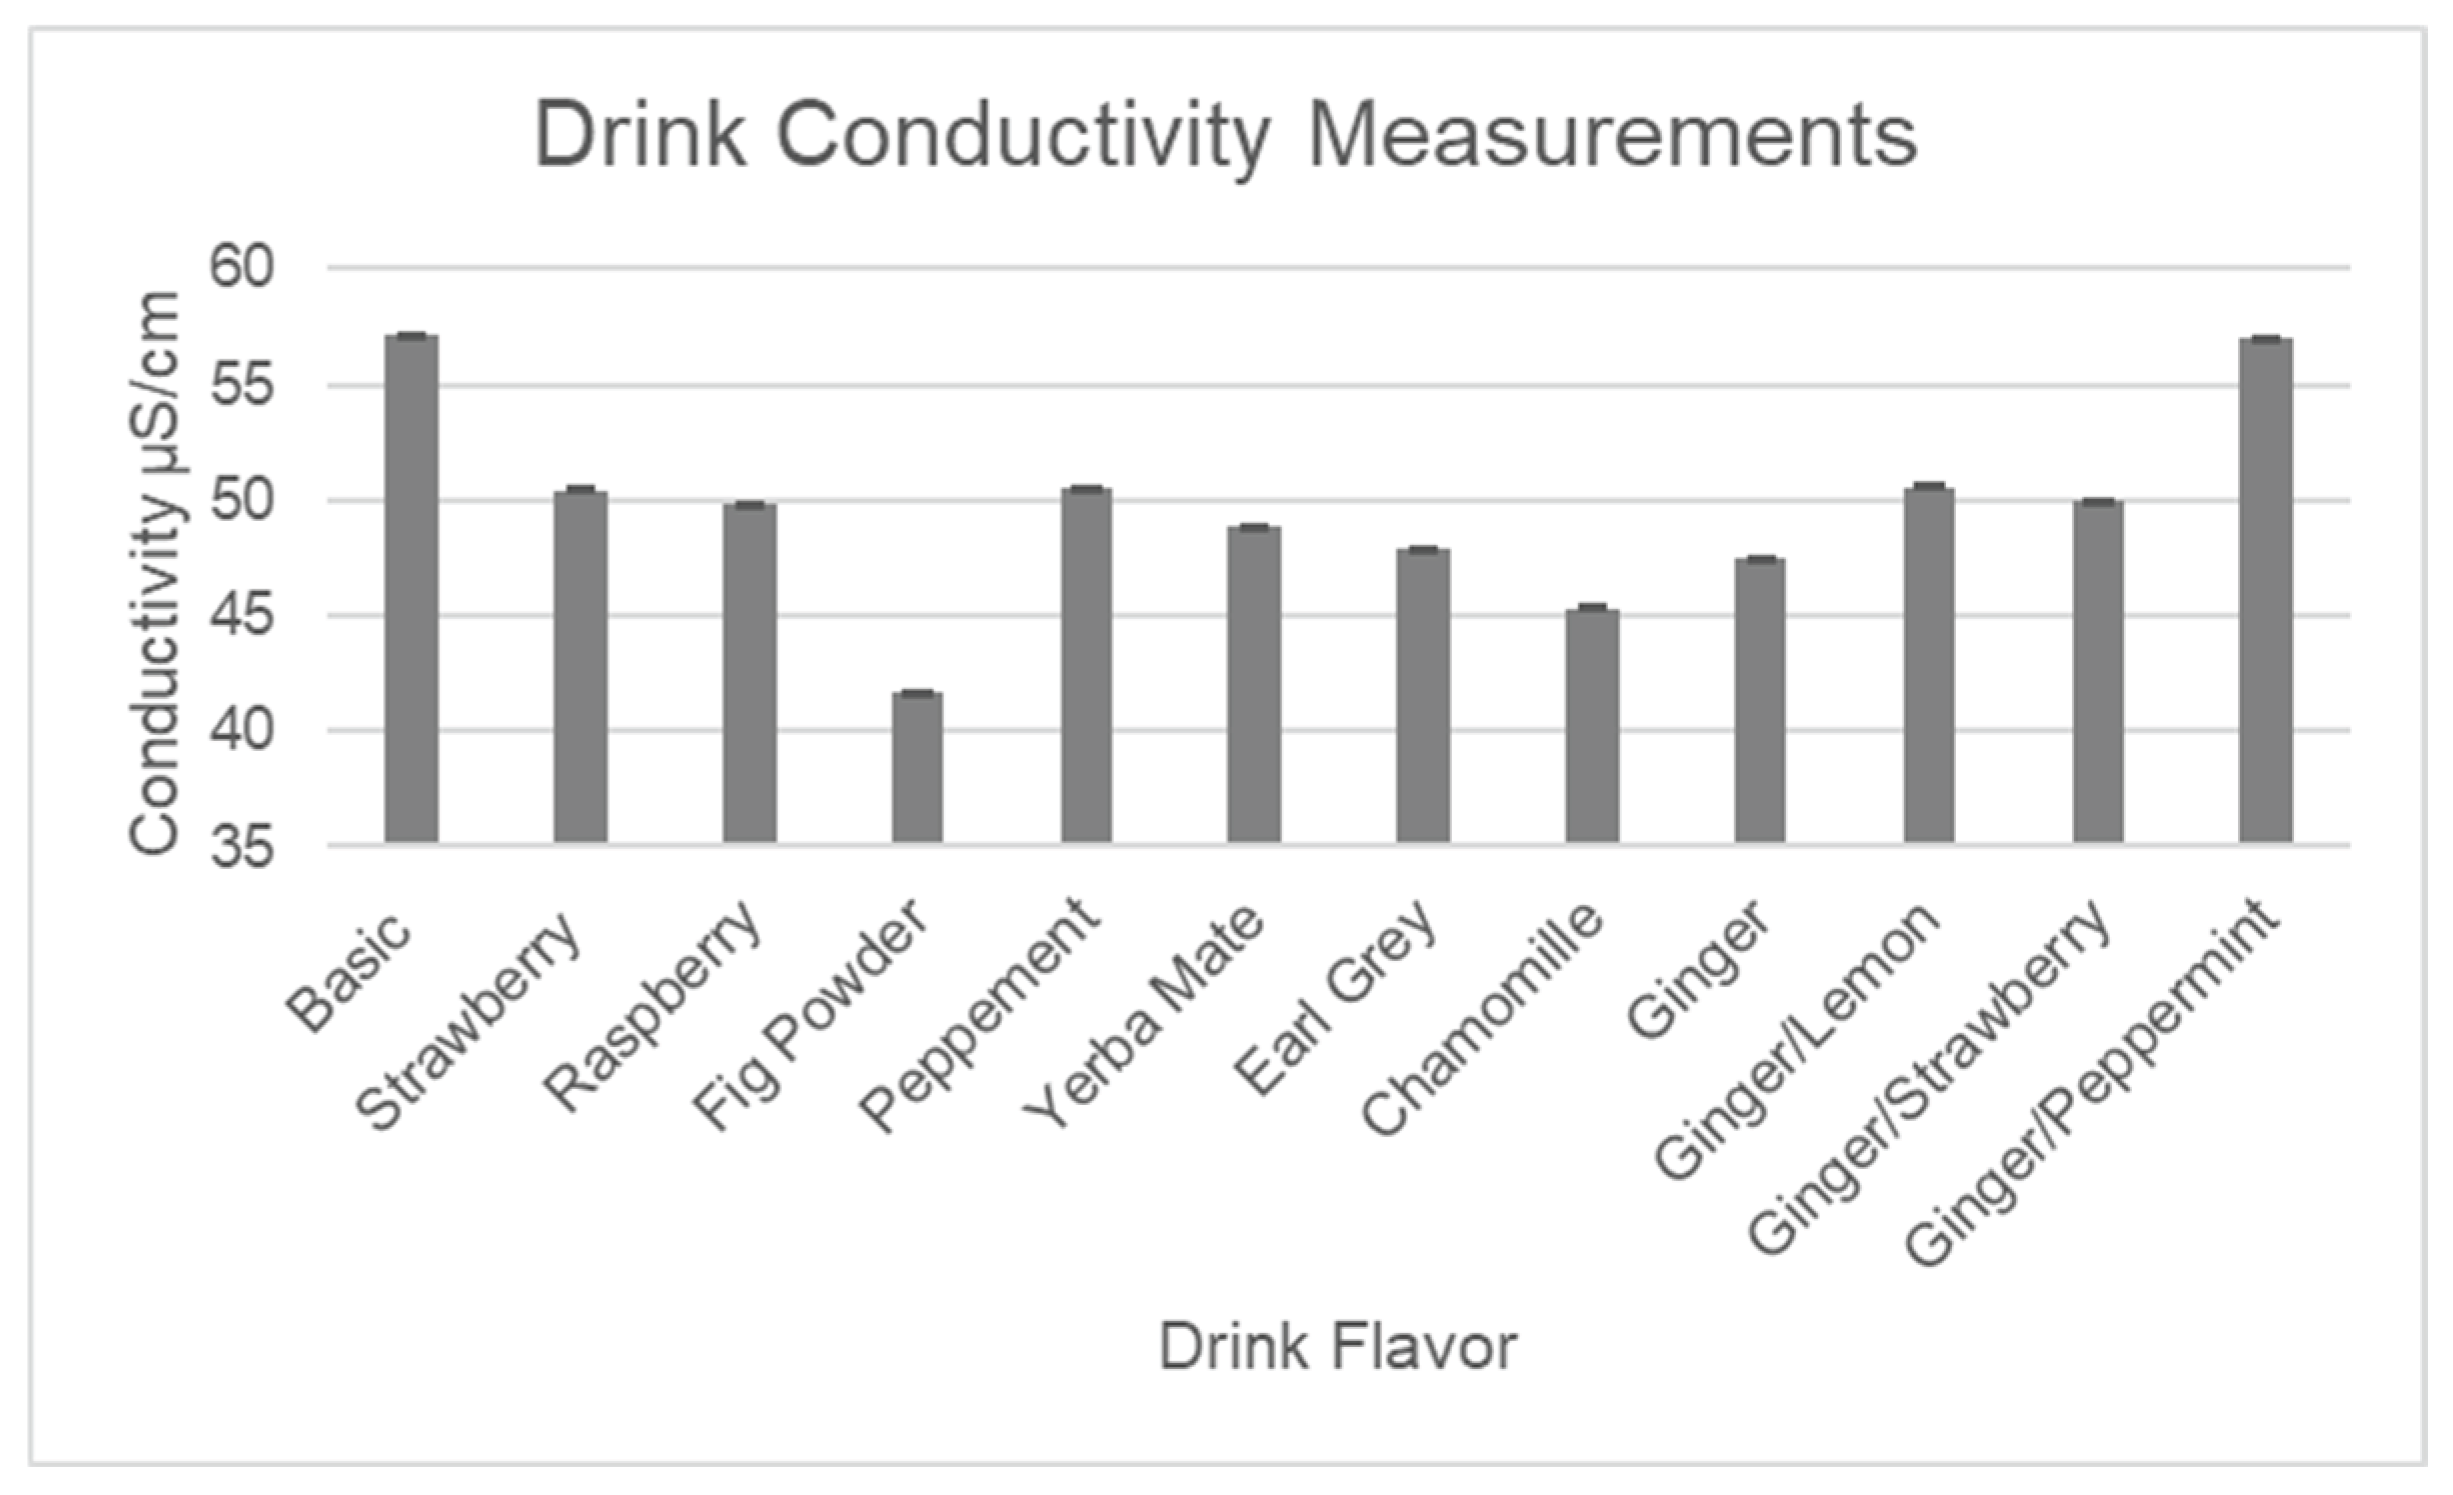
Figure 13.
Measured Brix in drink formulations.
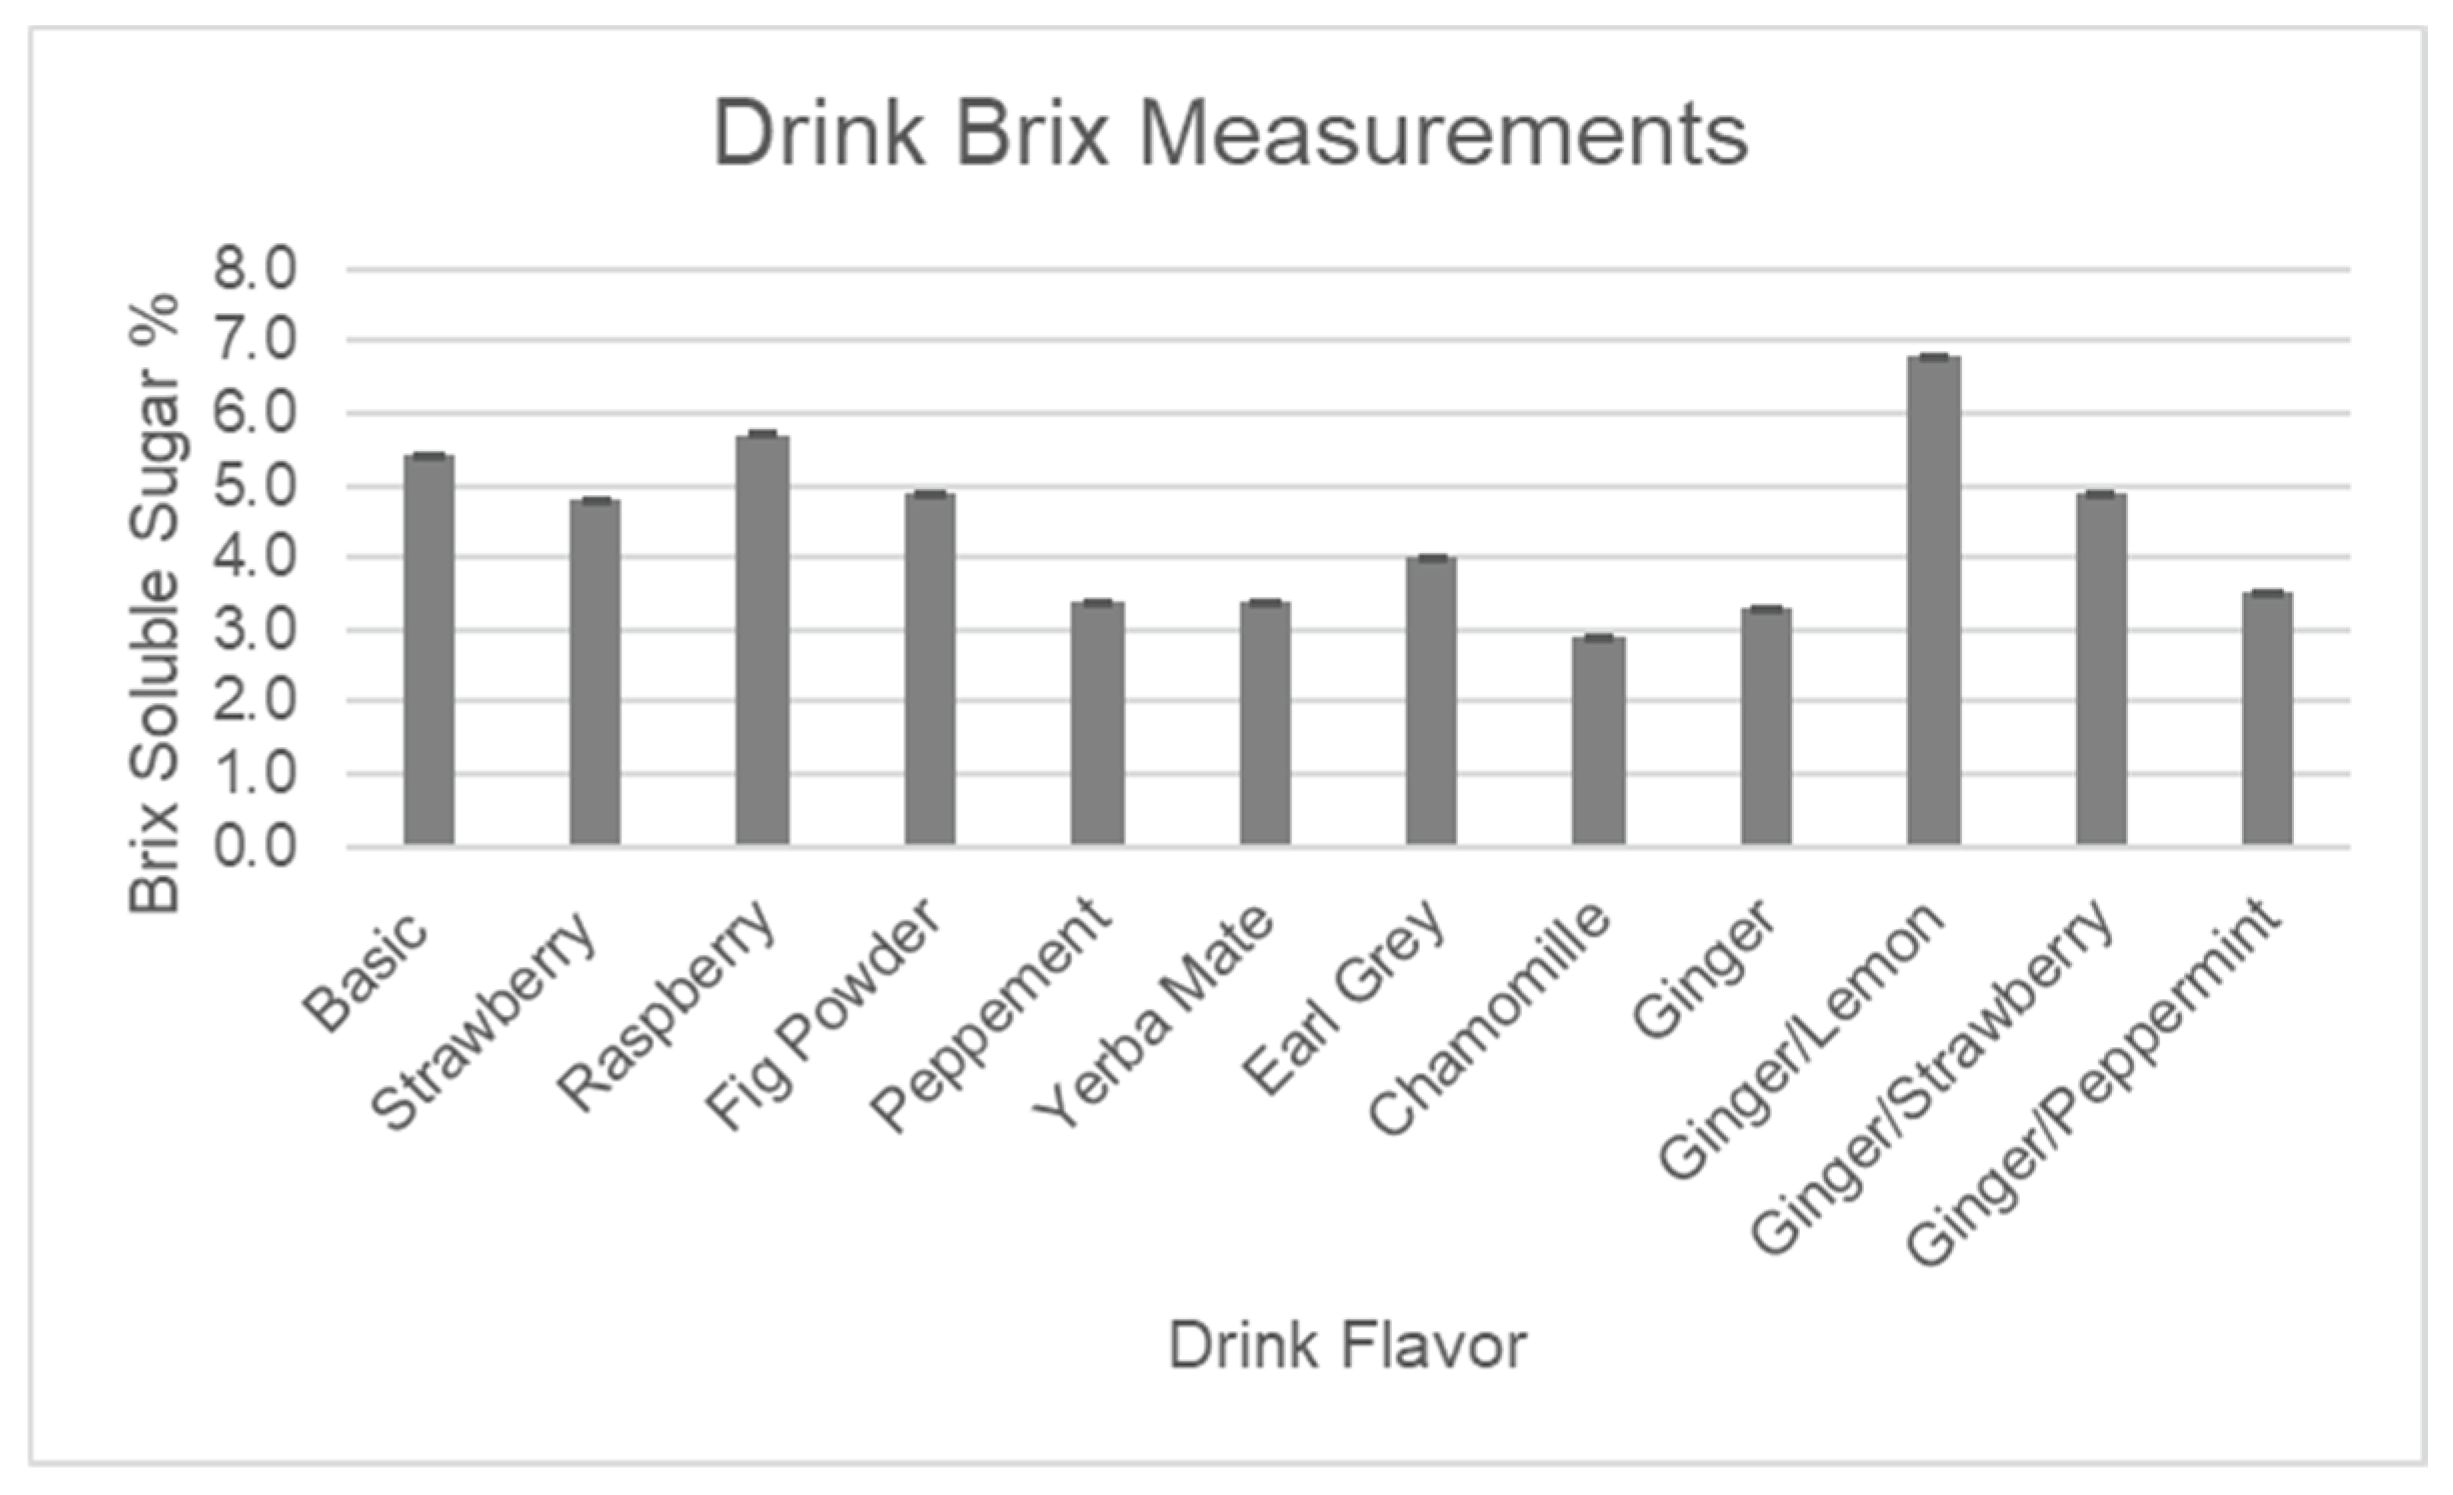
Figure 14.
Survey results for the ‘three most-liked’ drink formulations.
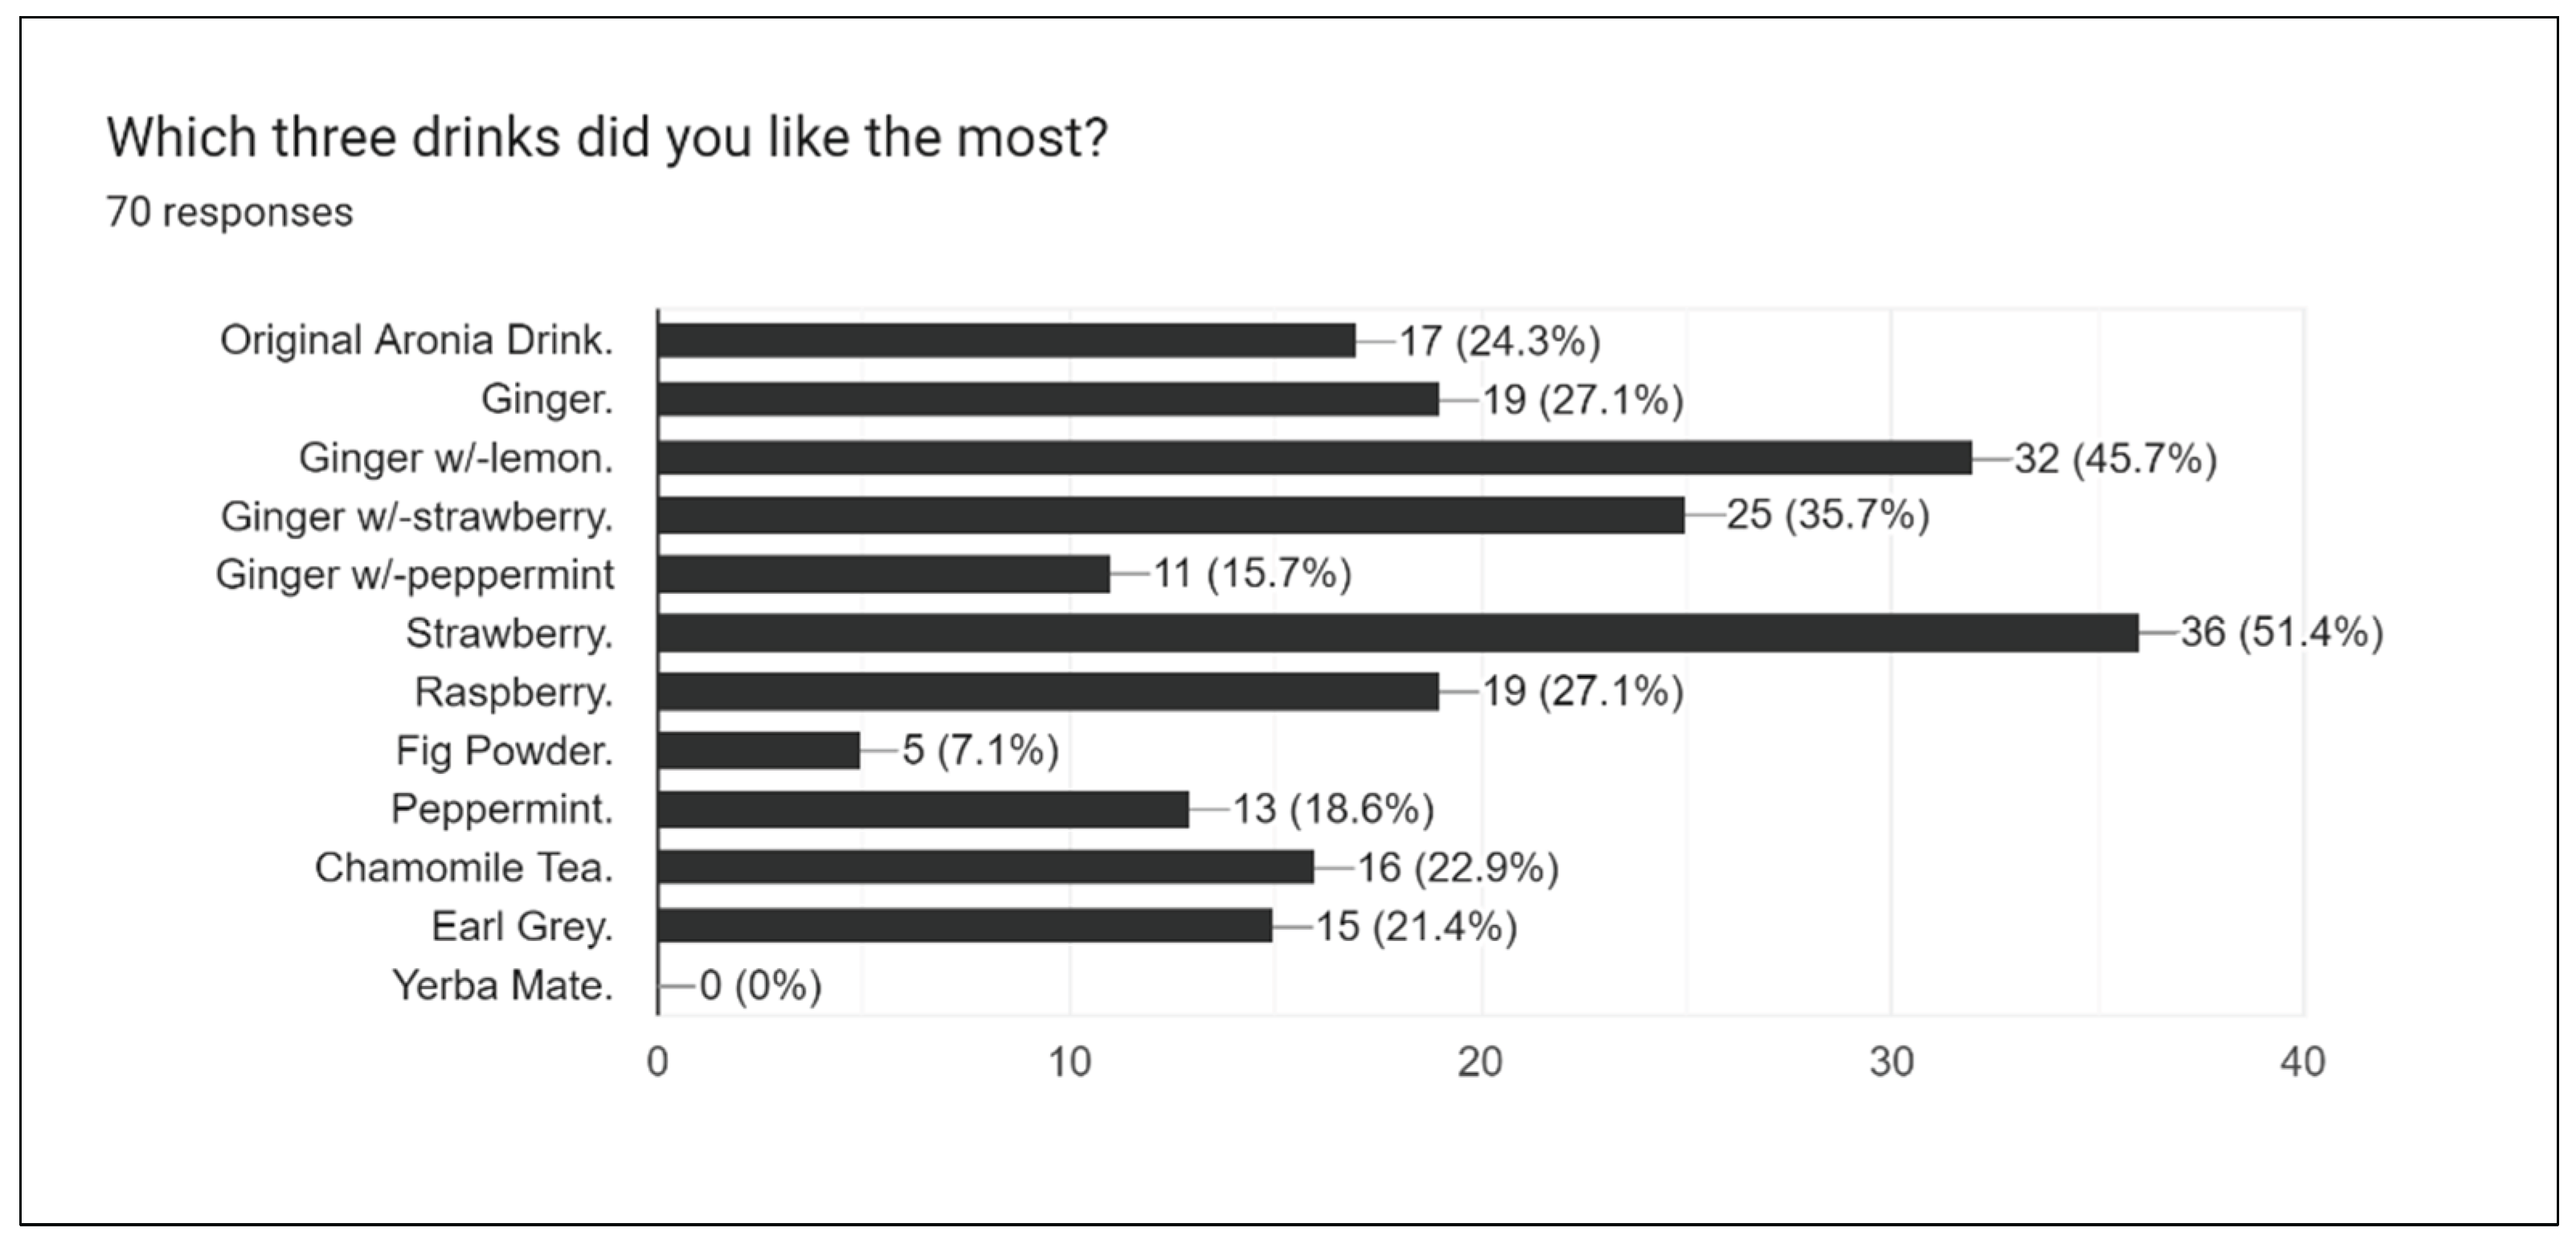
Figure 15.
‘Favorite drink’ is out of the top three selections.
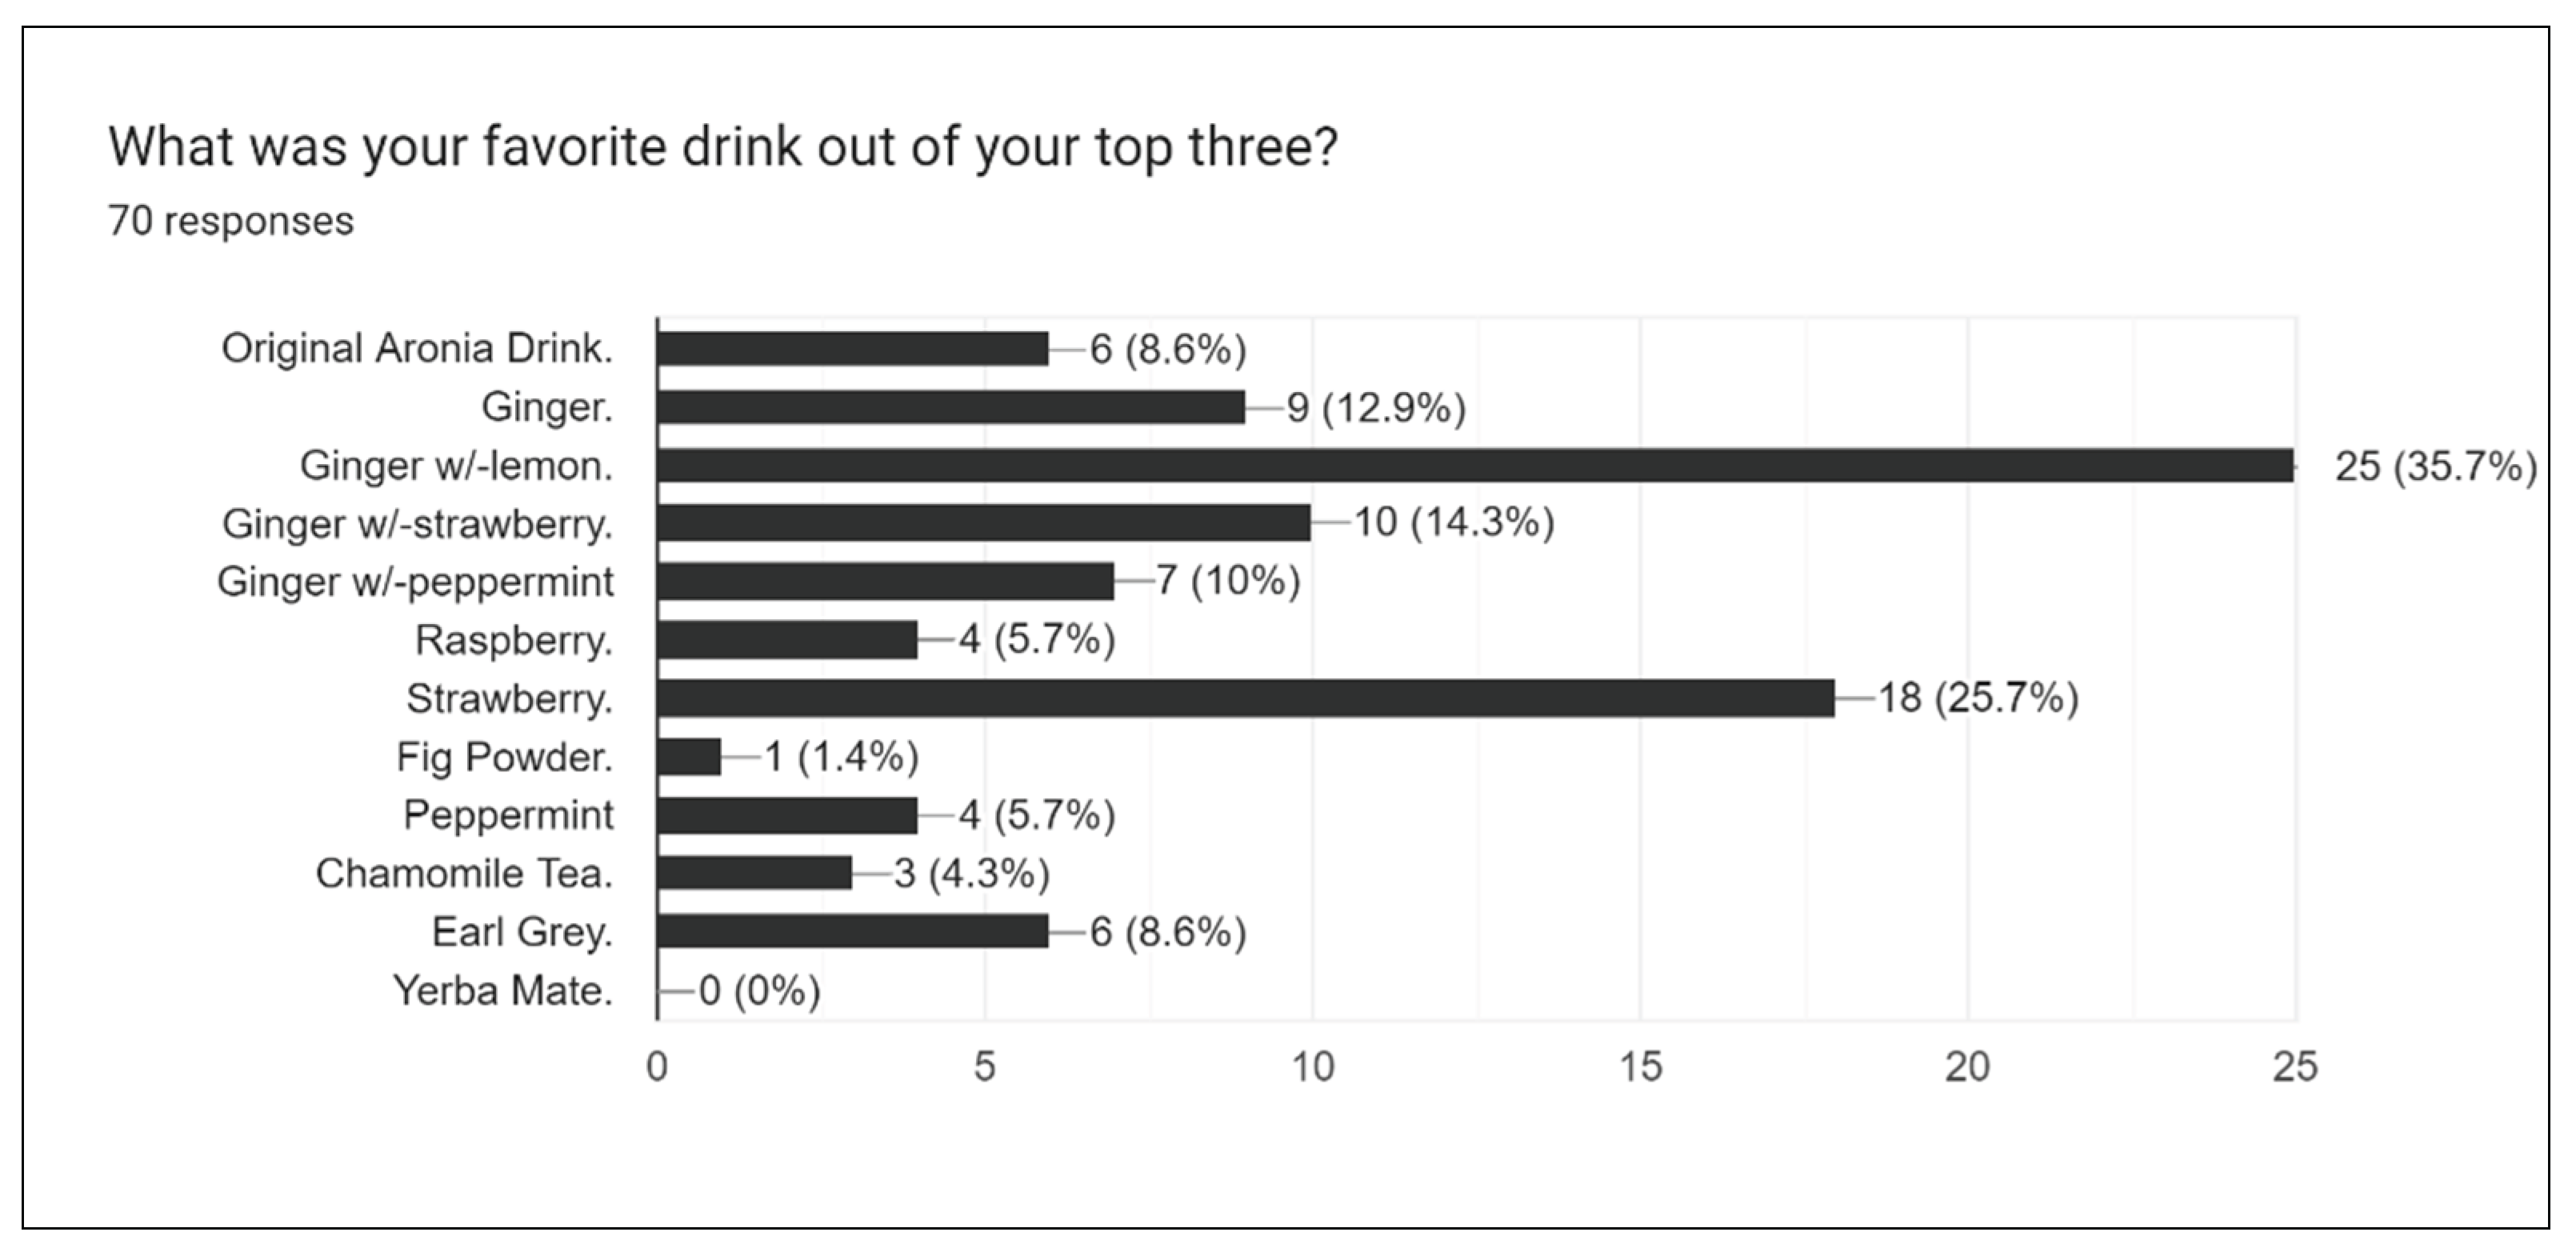
Figure 16.
Overall rating of taste.
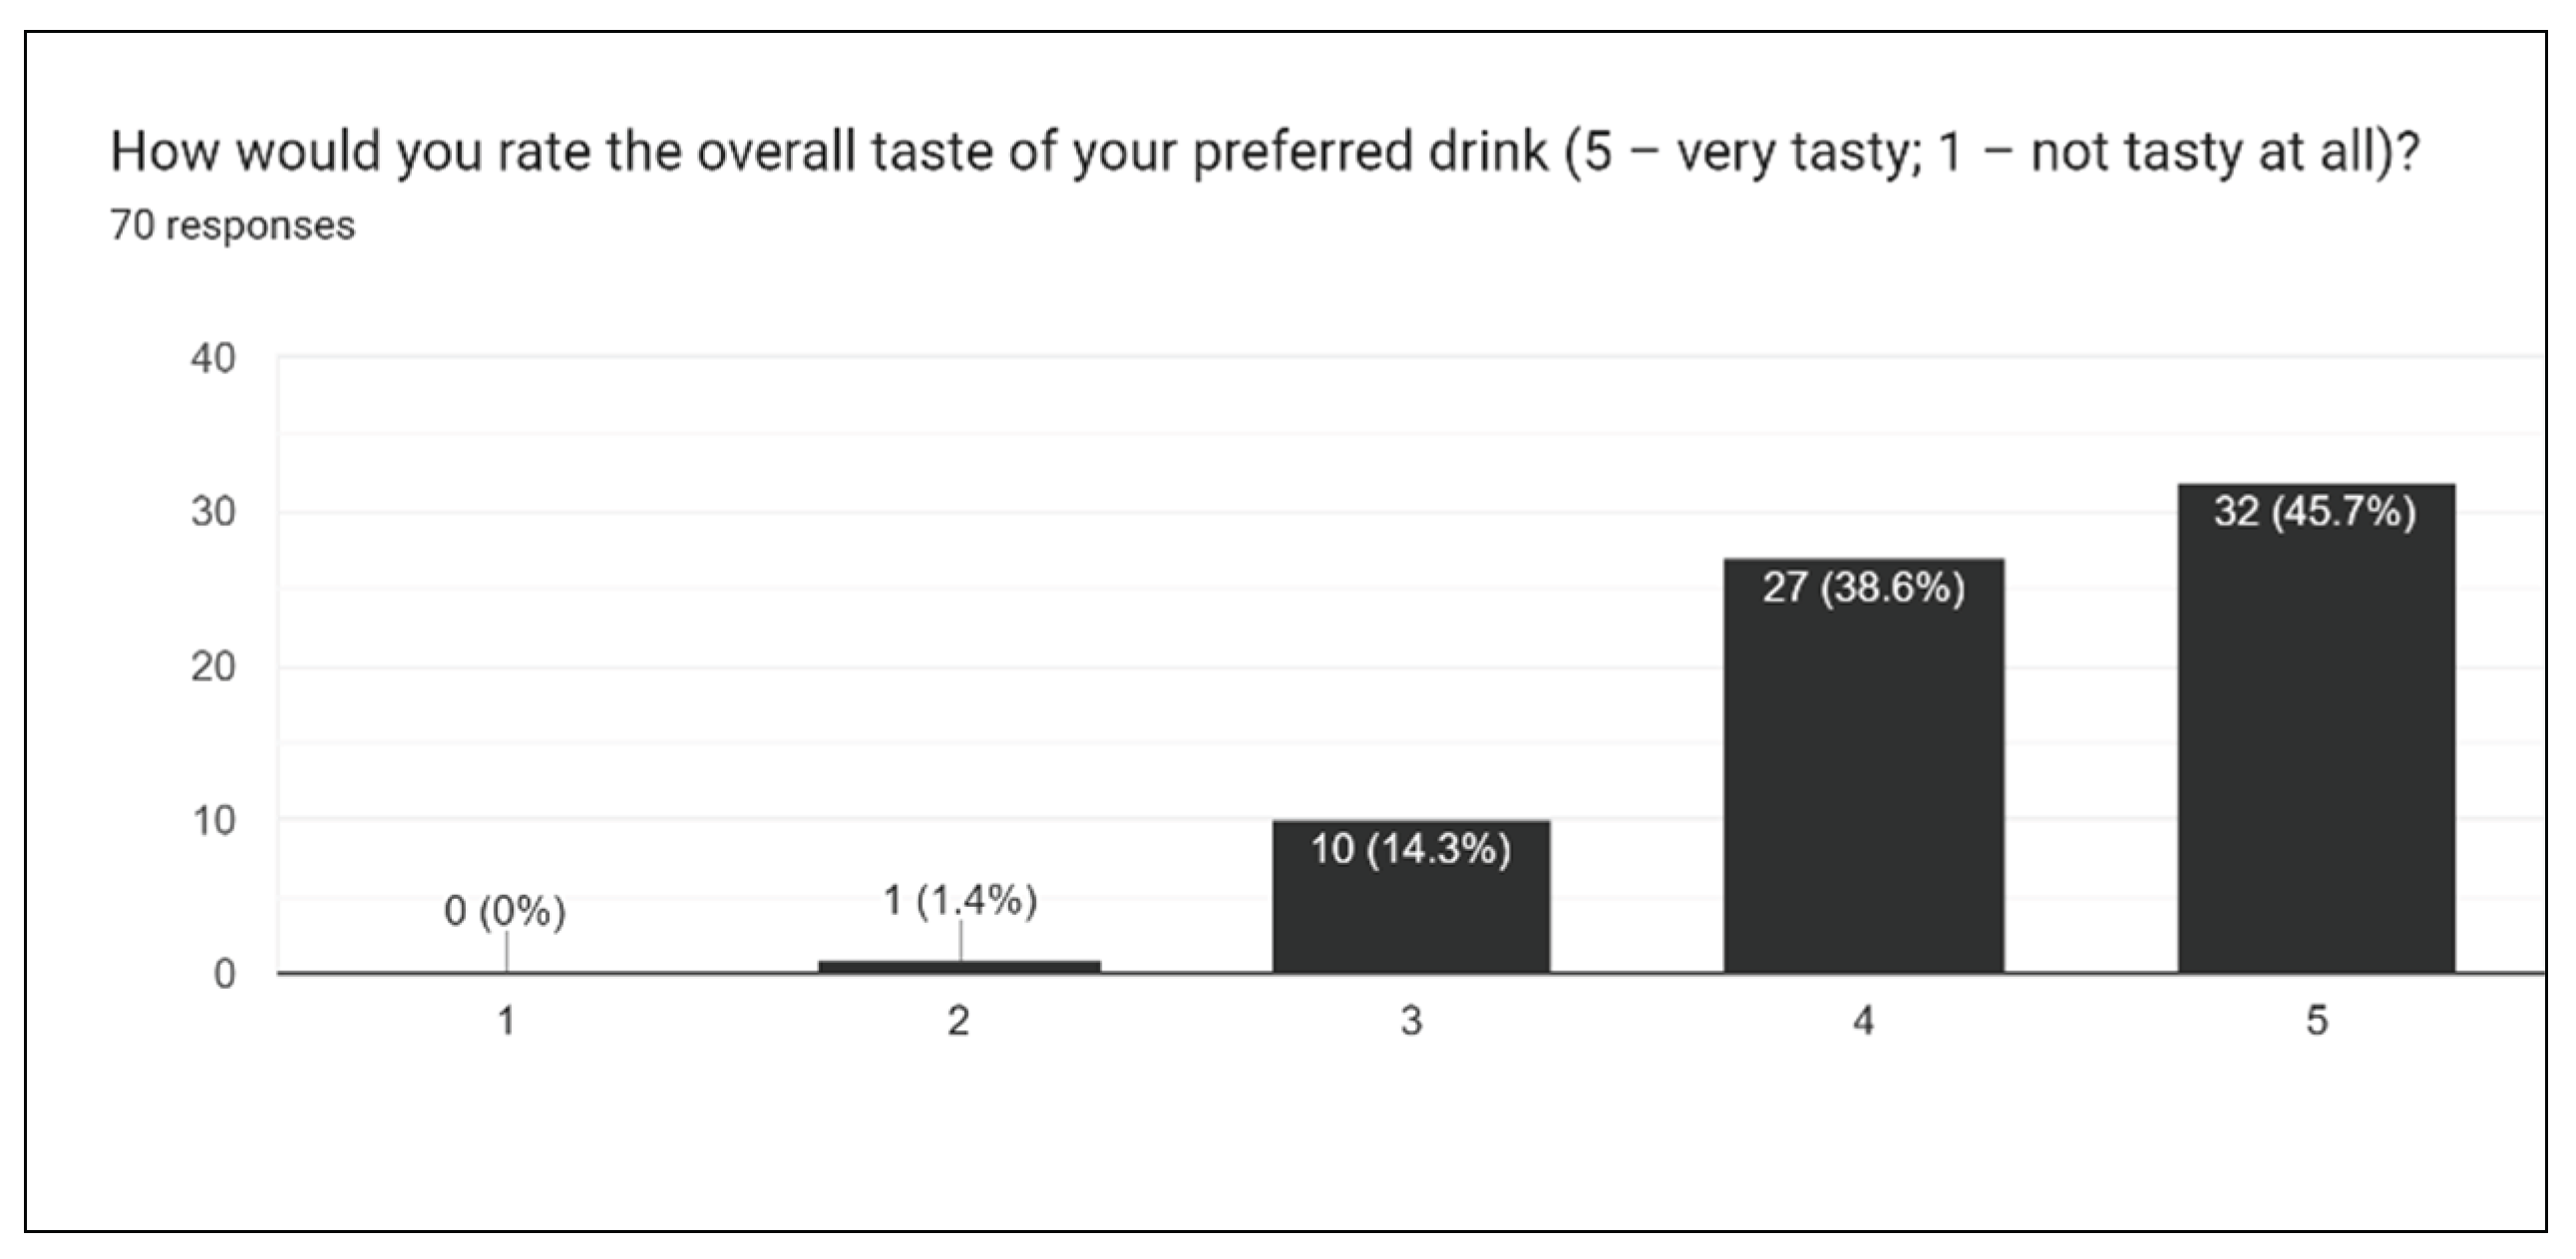
Figure 17.
Sweetness rate of drink.
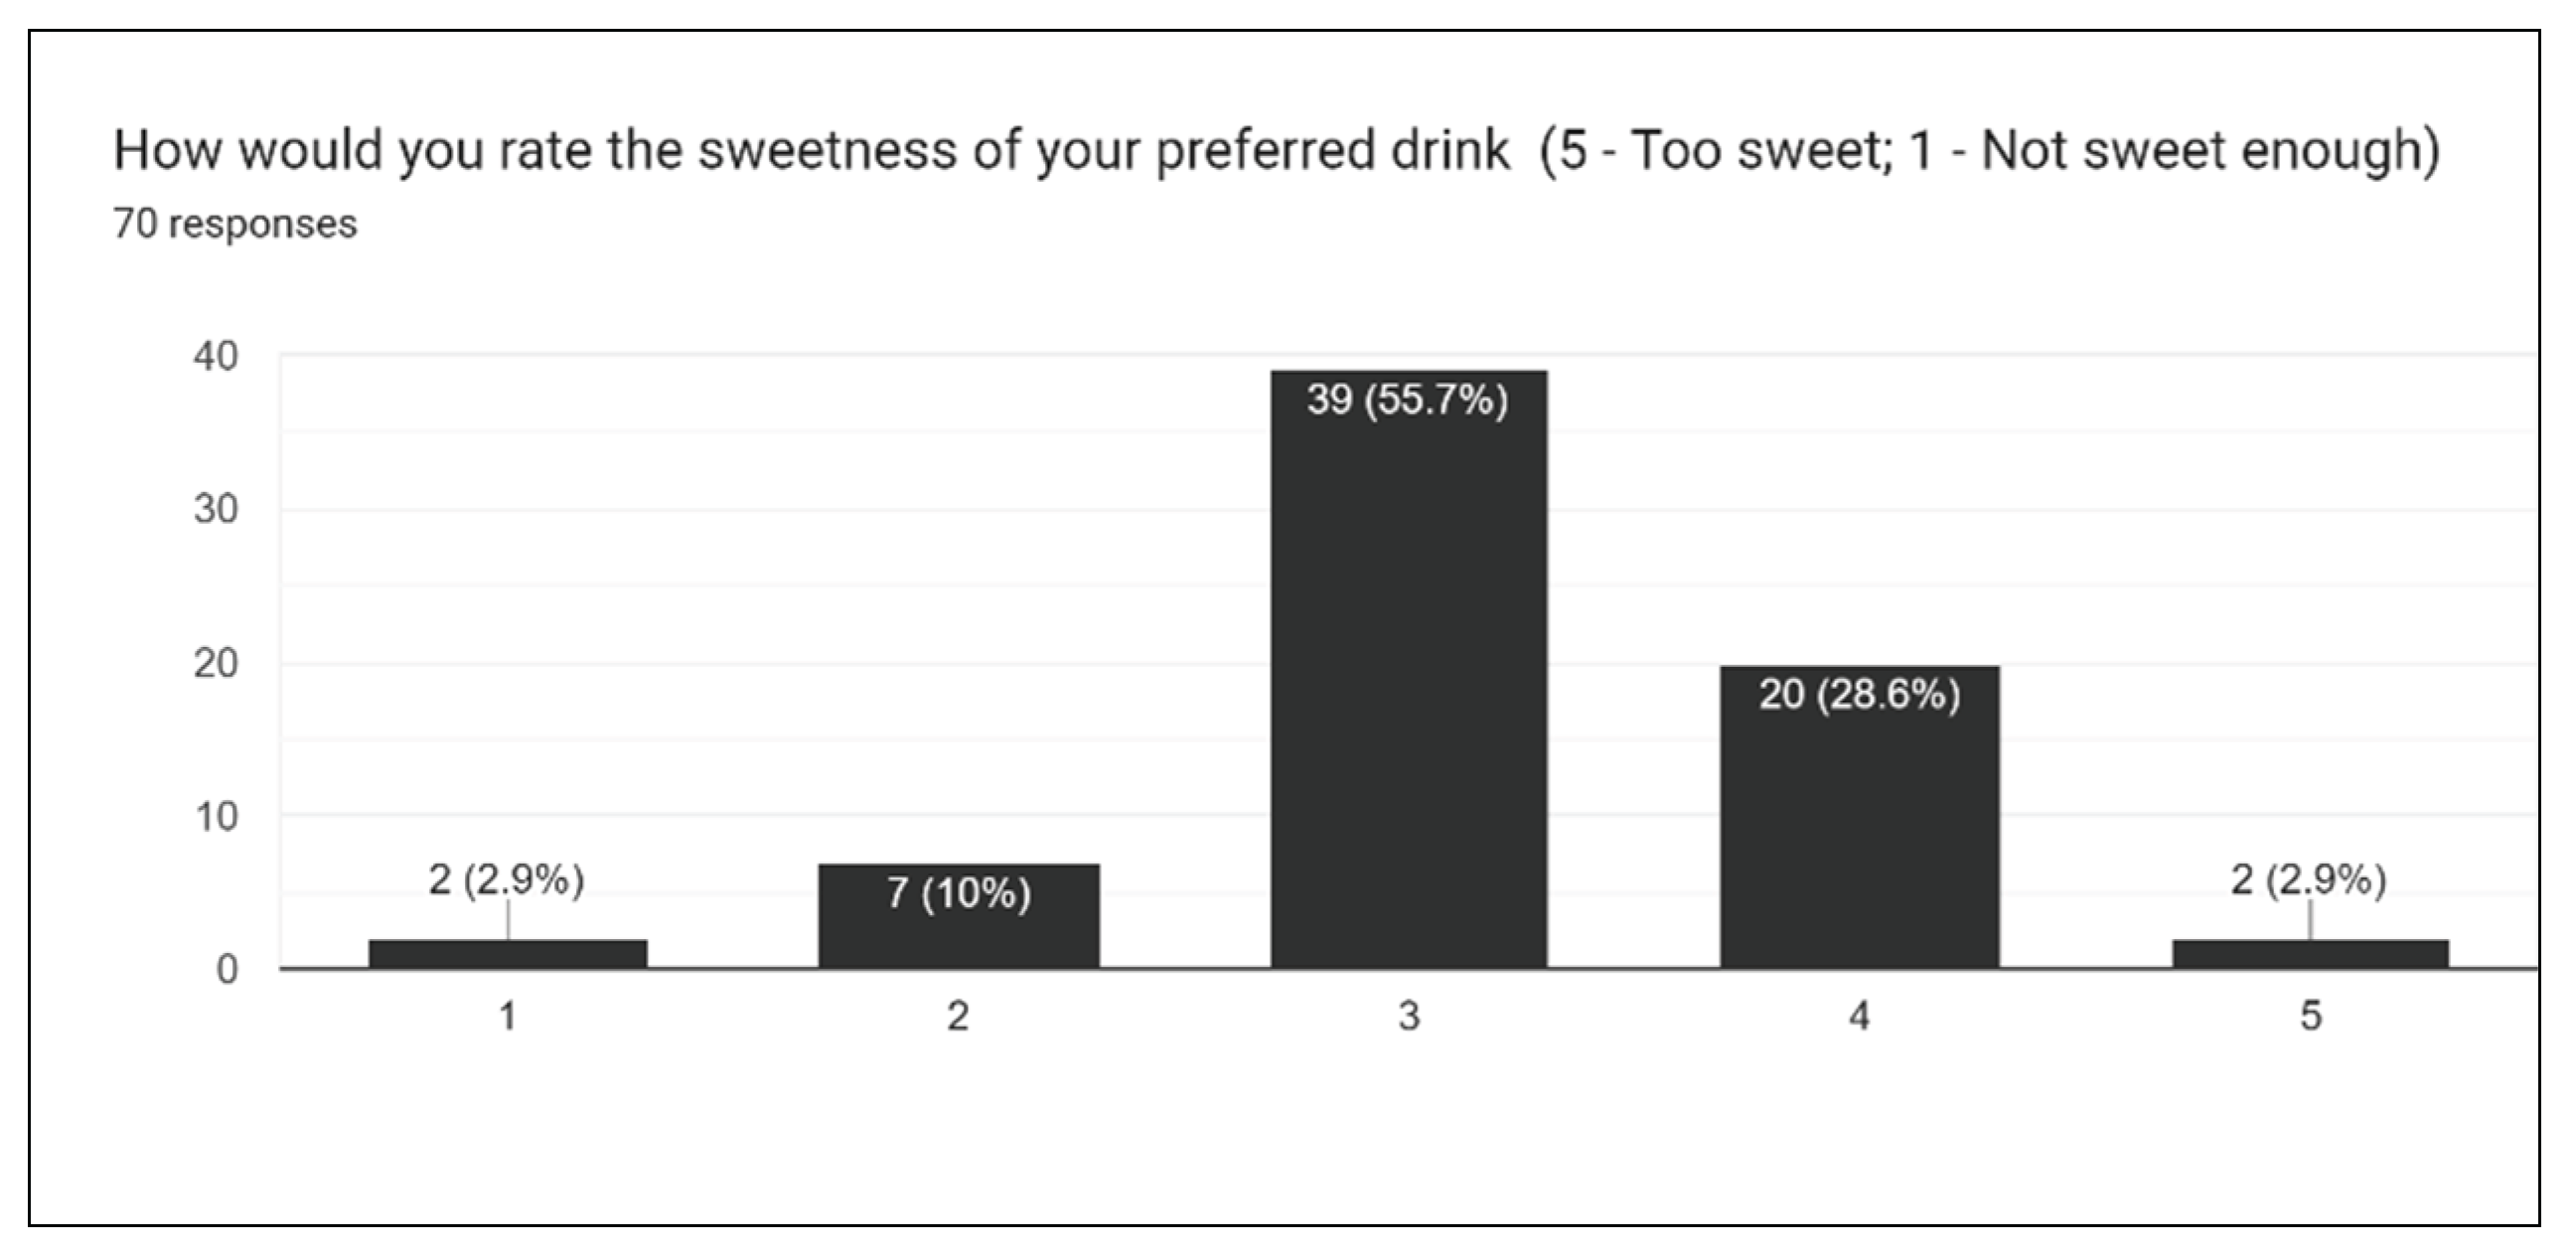
Figure 18.
Sourness rating of preferred drink.
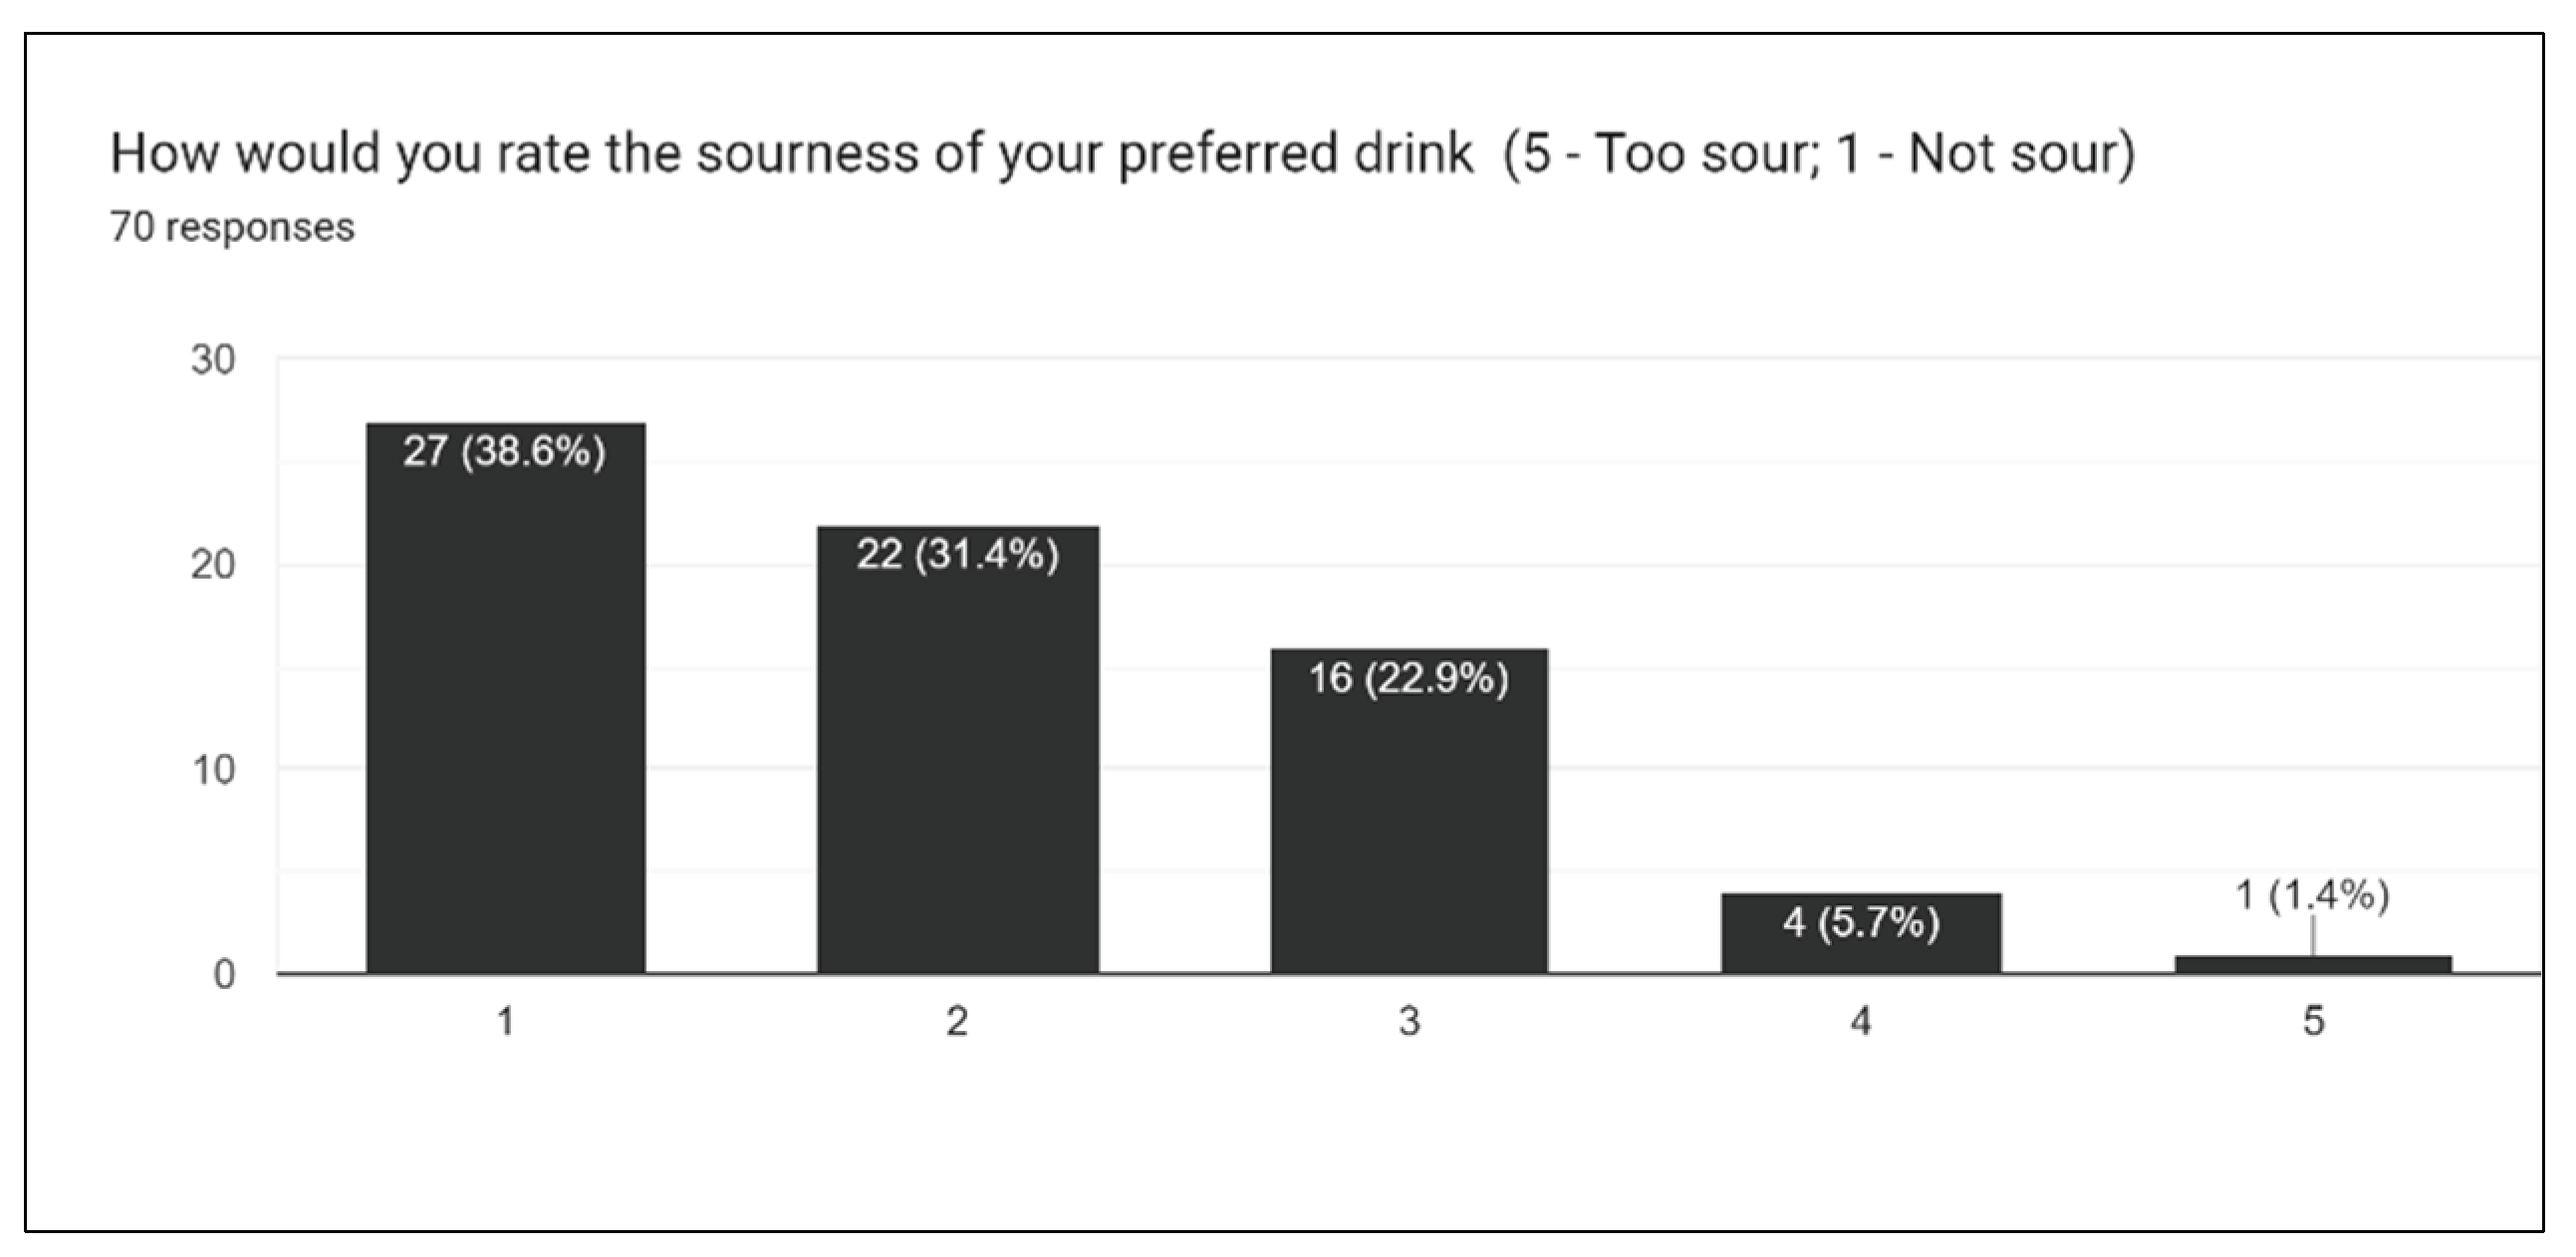
Figure 19.
Bitterness rating of preferred drink.
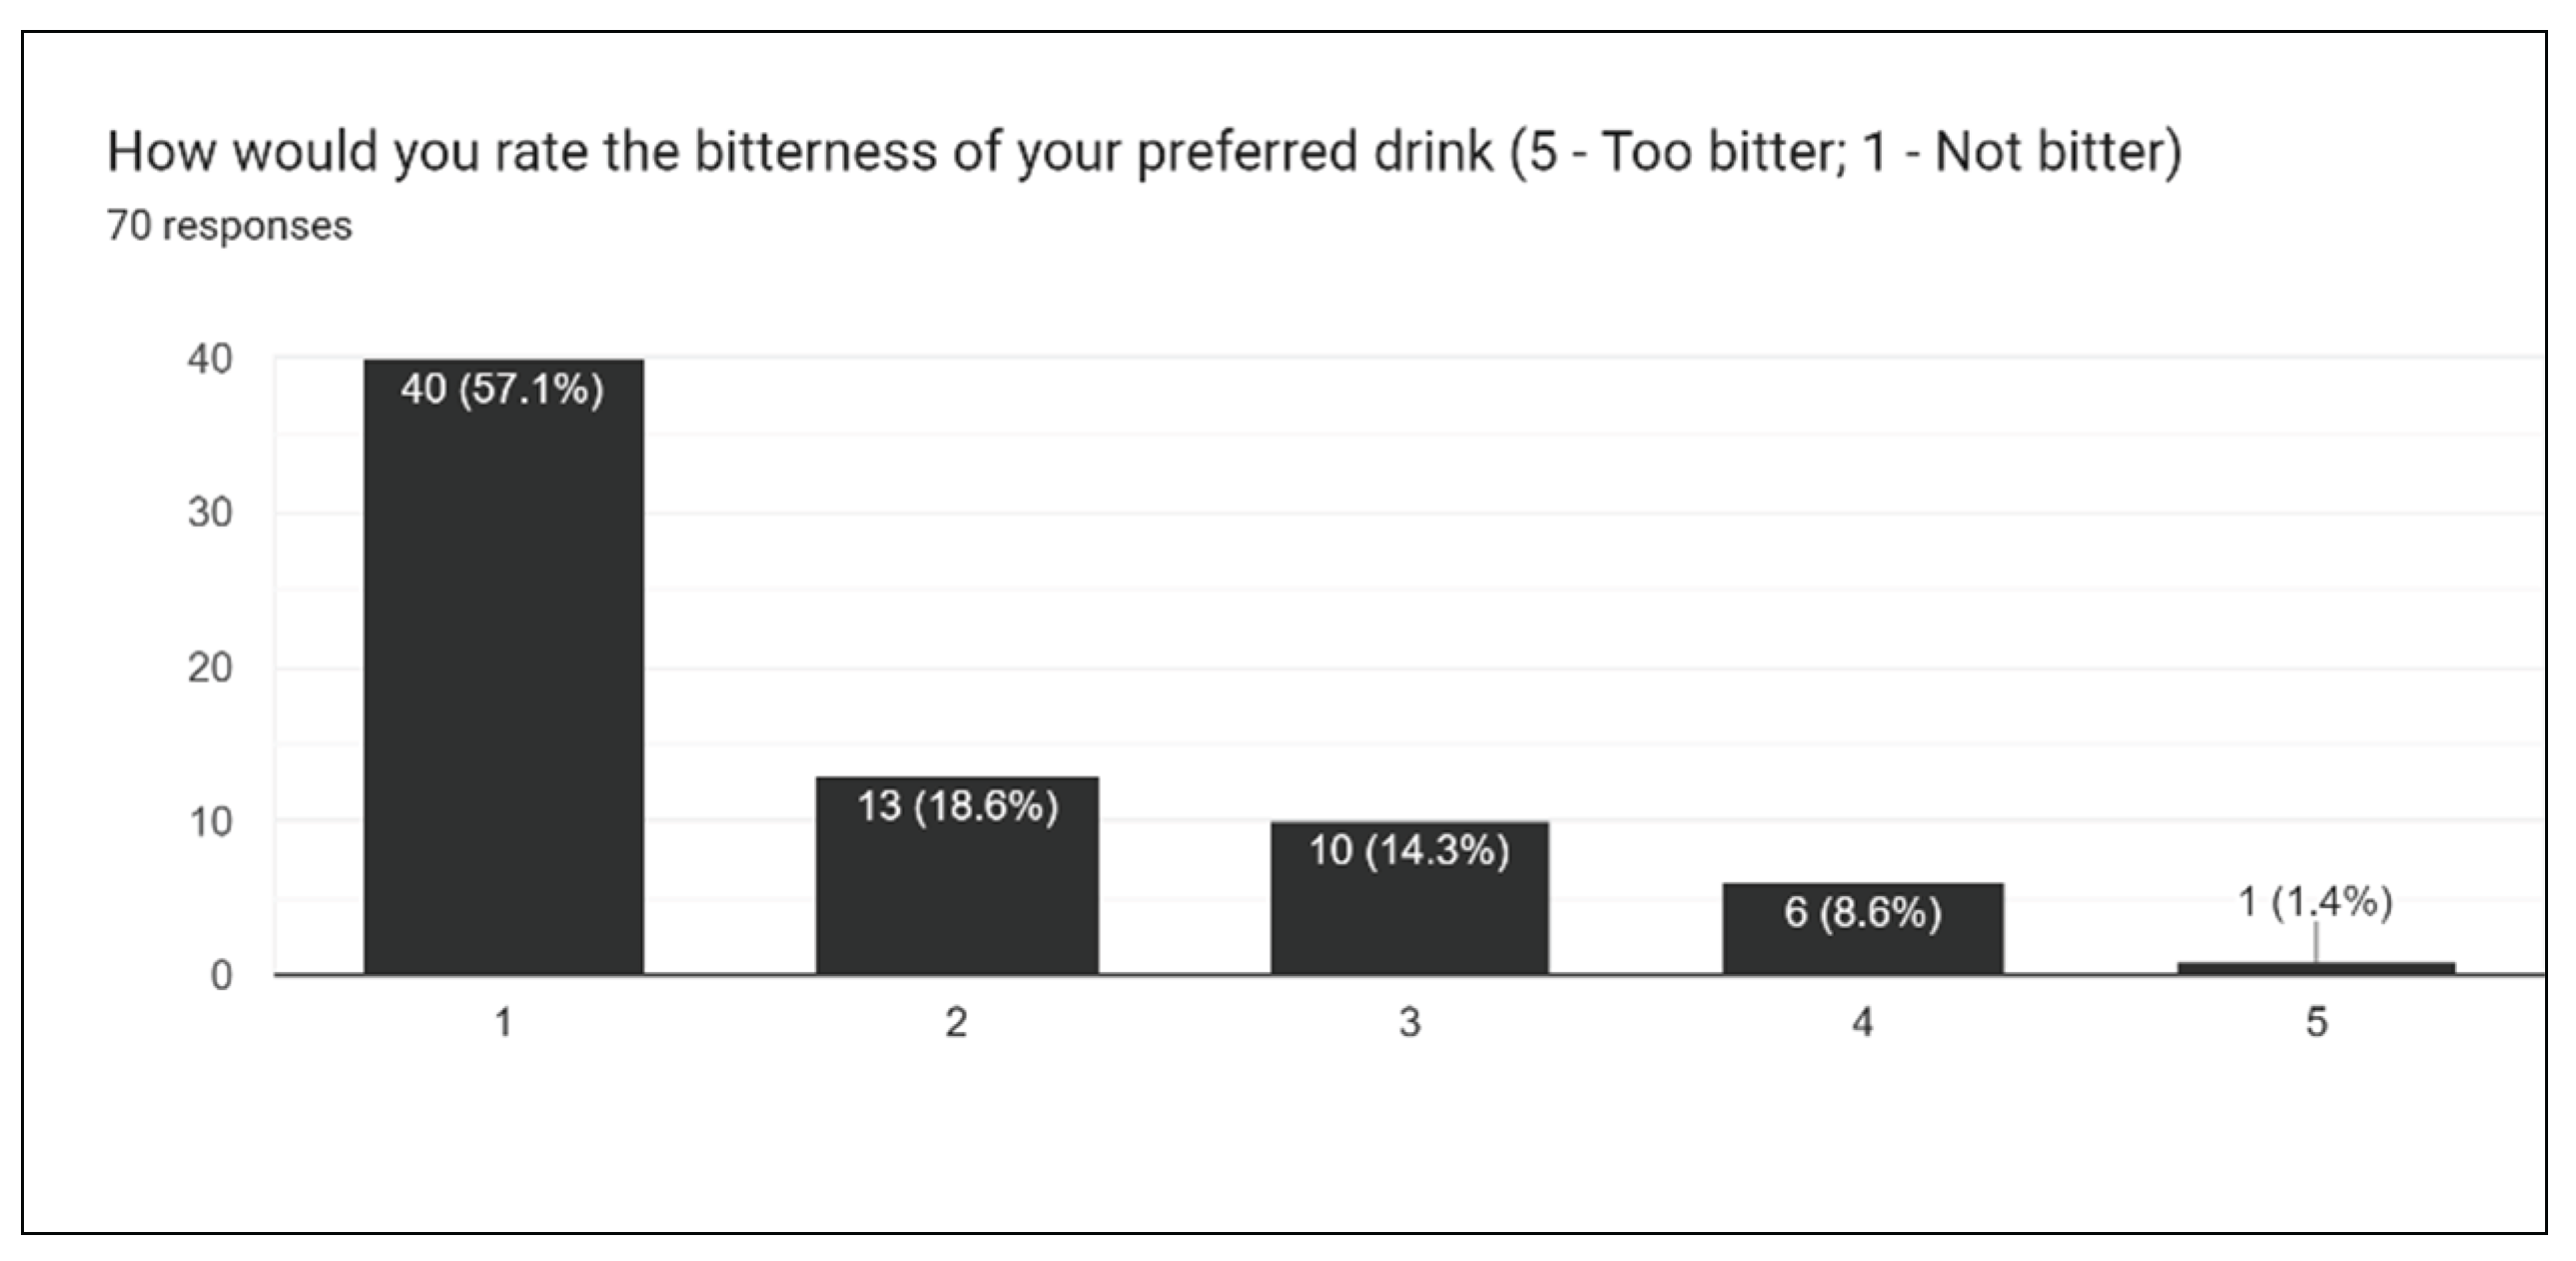
Figure 20.
After-taste results.
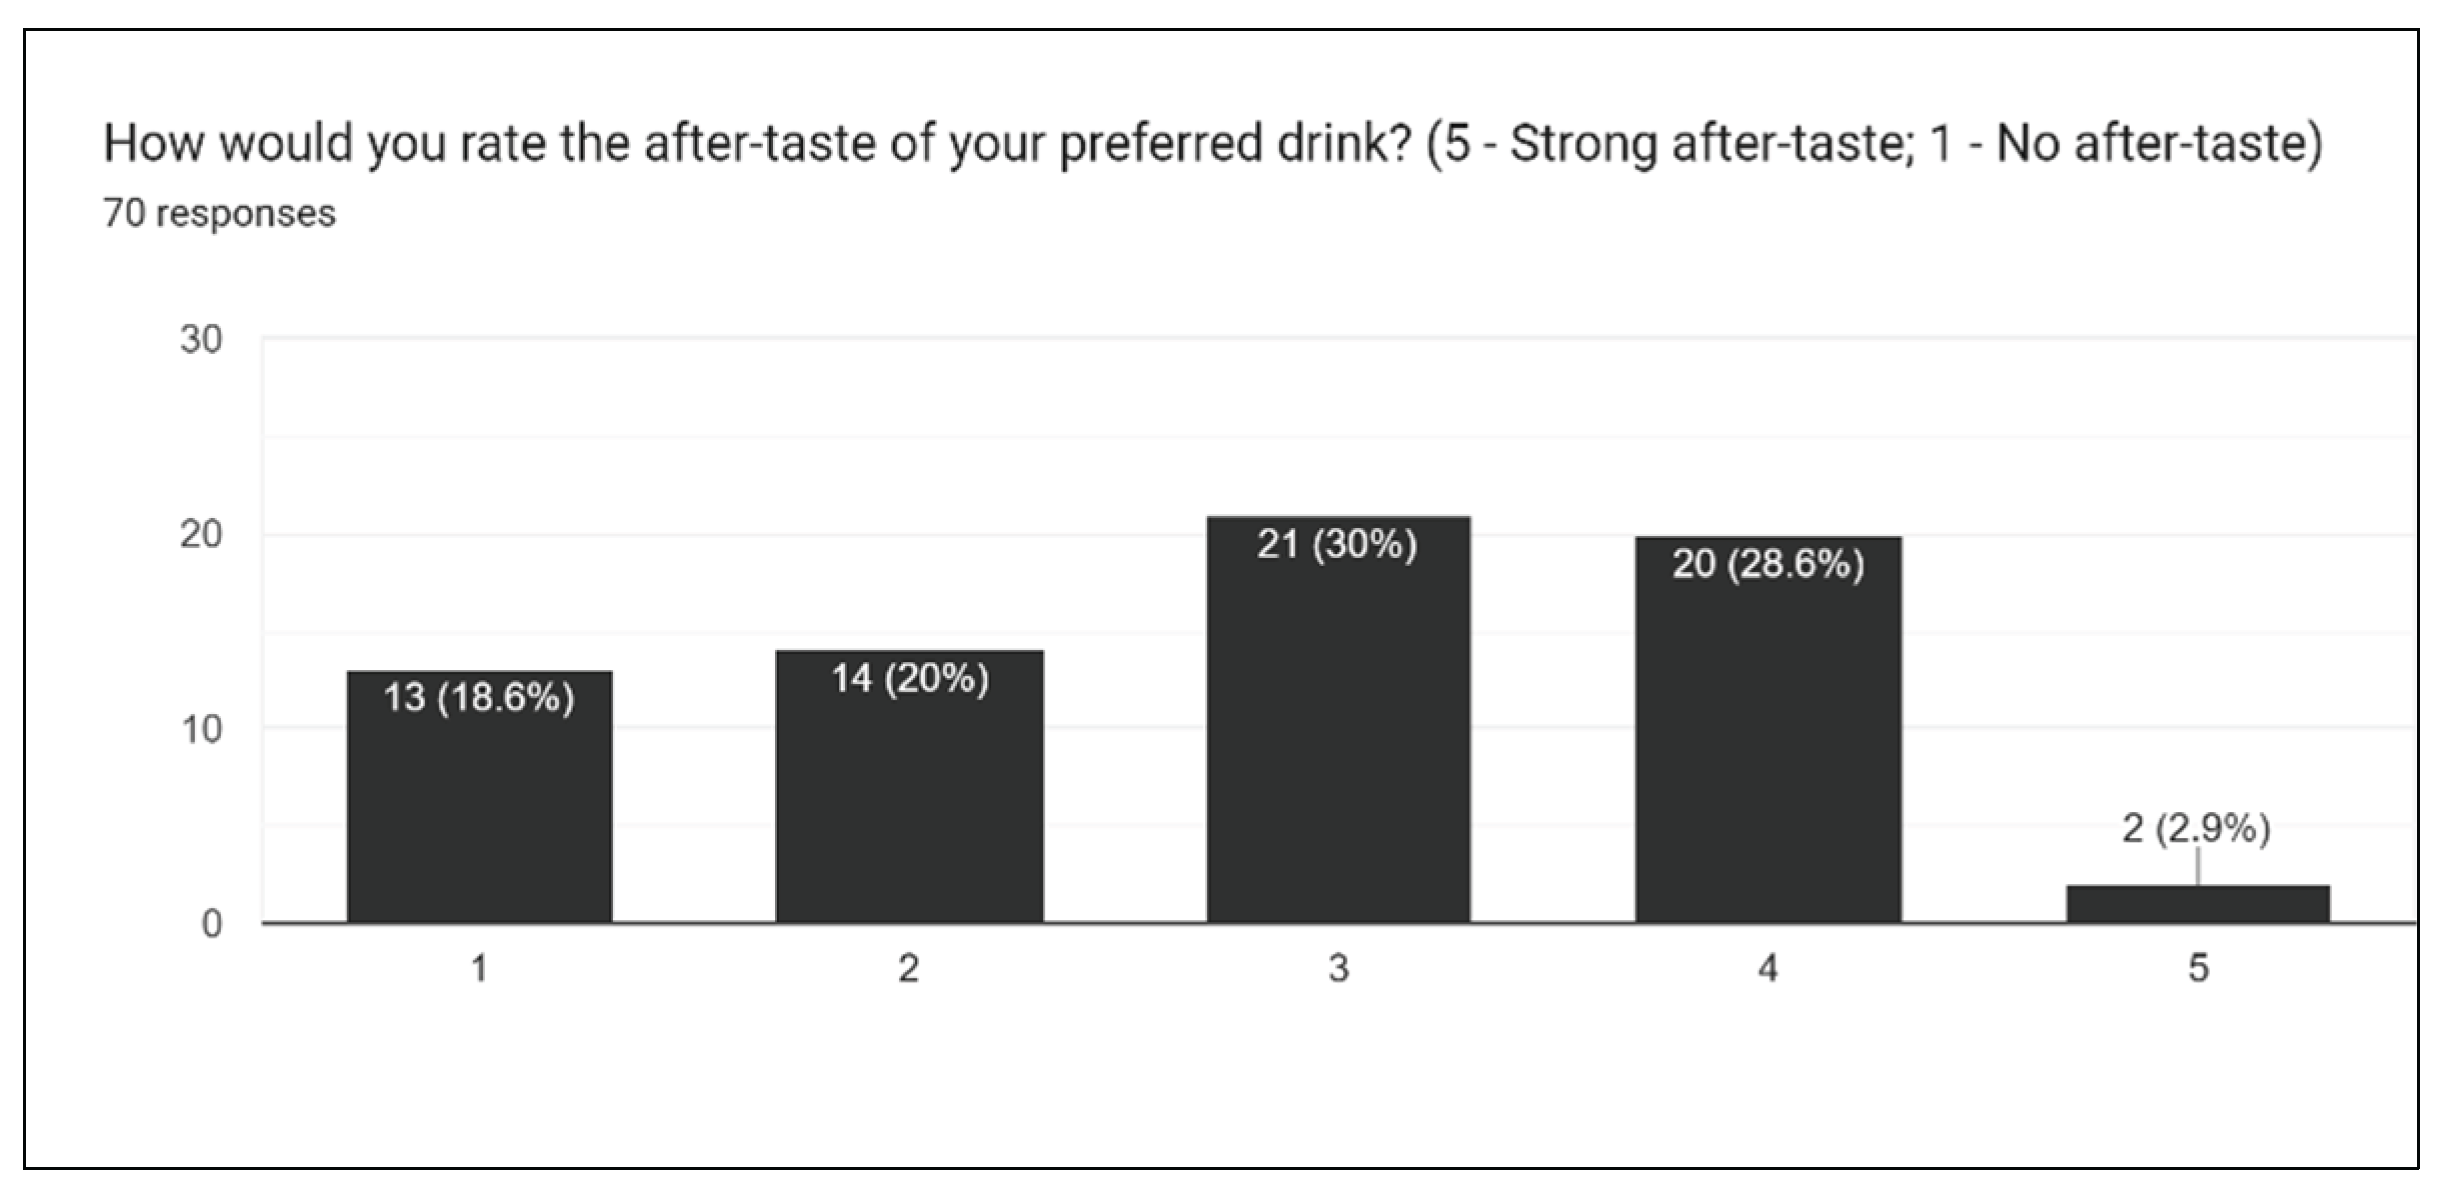
Figure 21.
Likelihood of consuming drinks after an educational program.
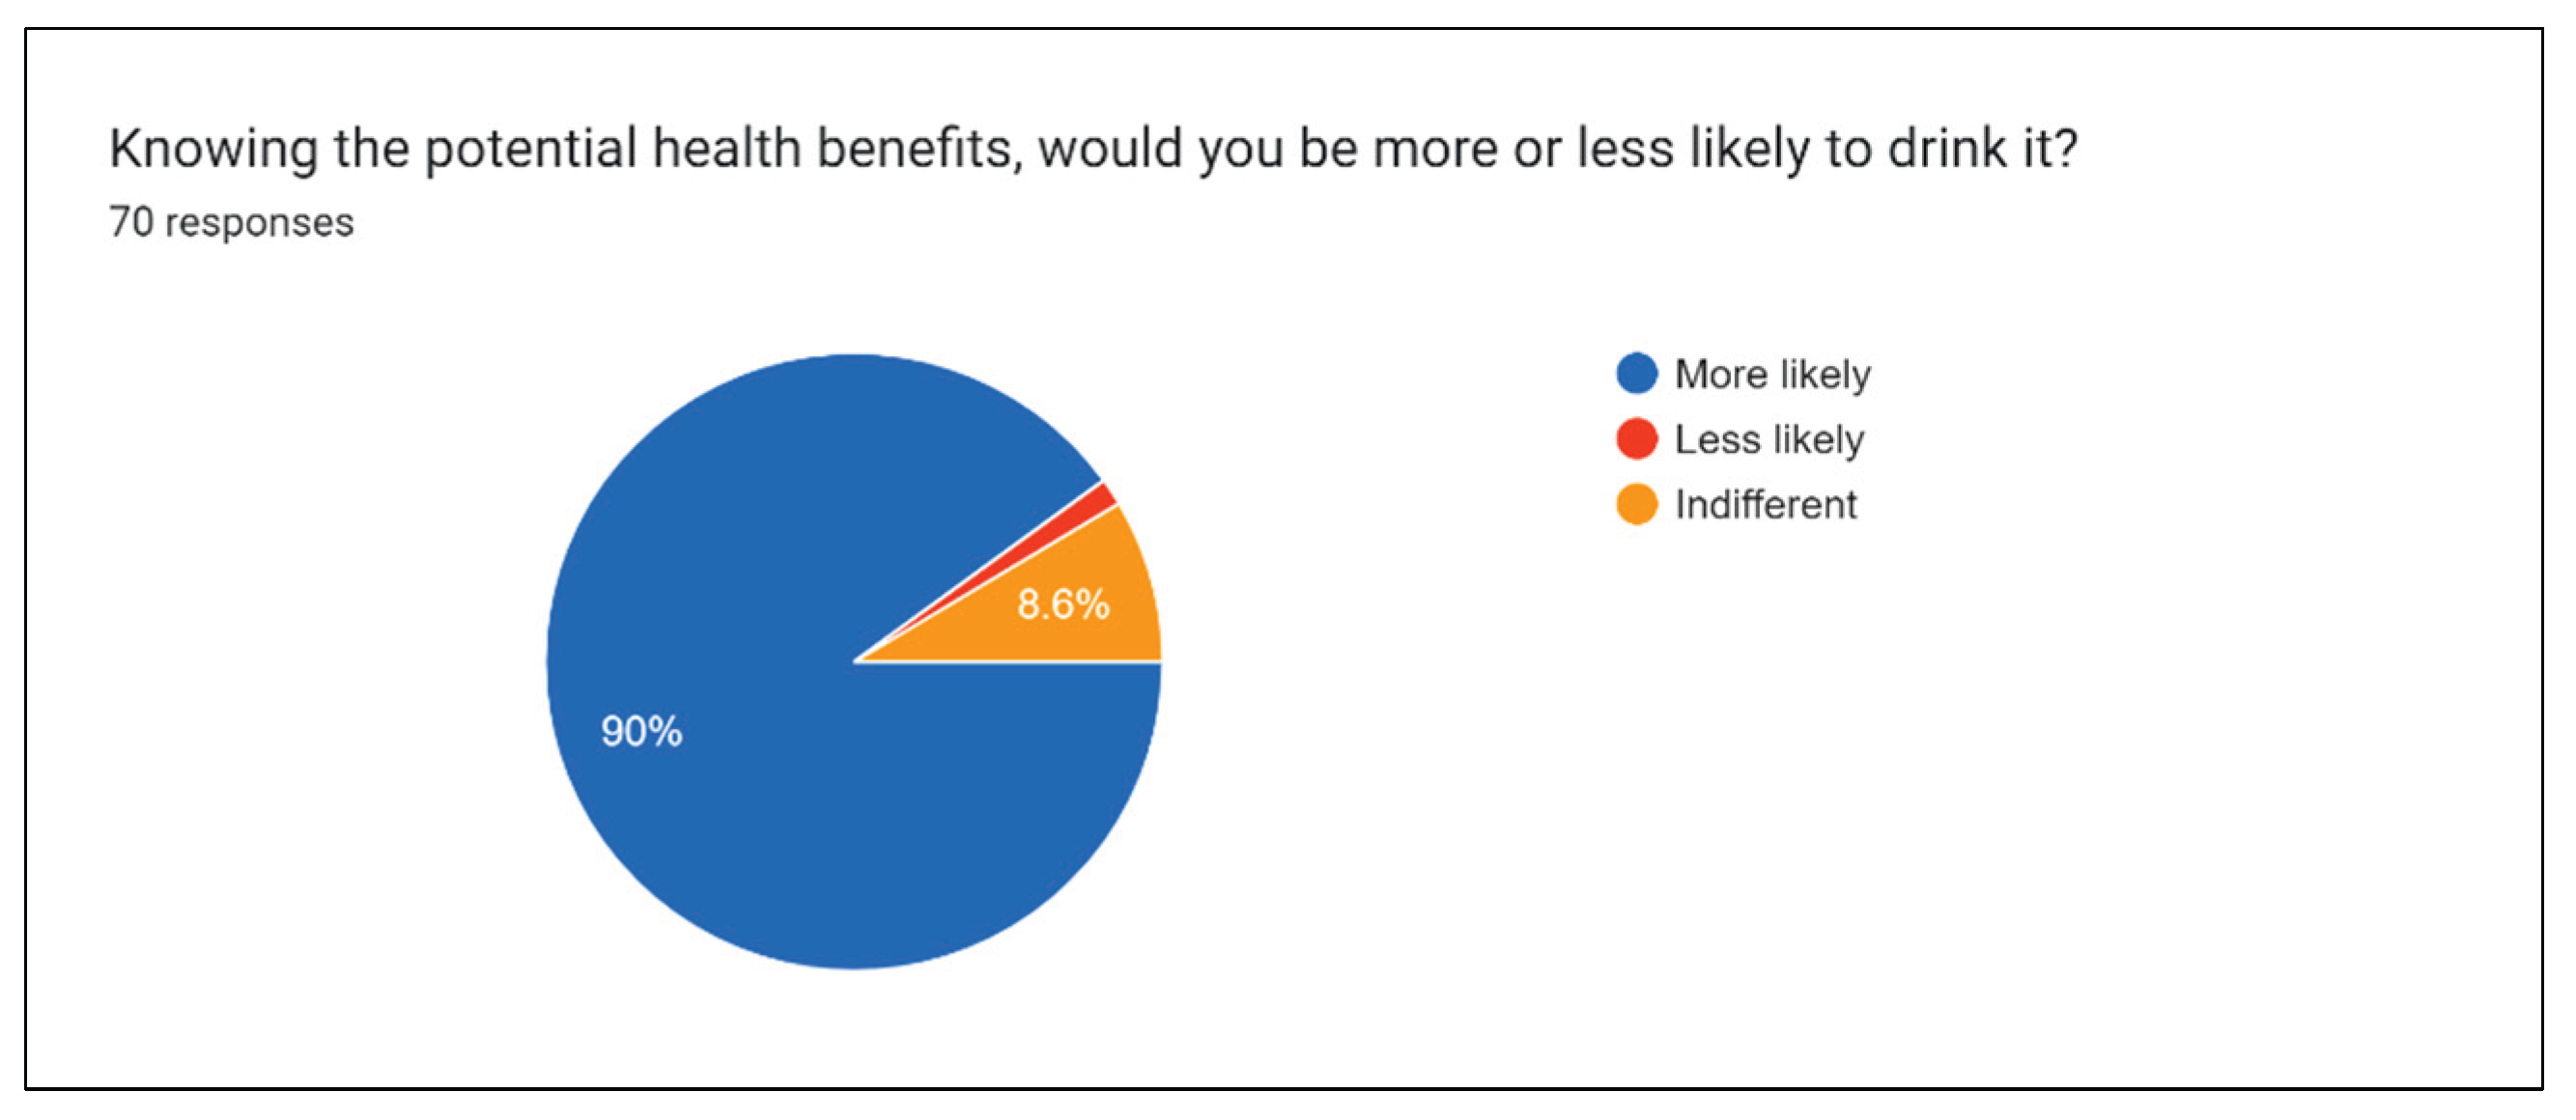
Figure 22.
‘How much would you pay?’.
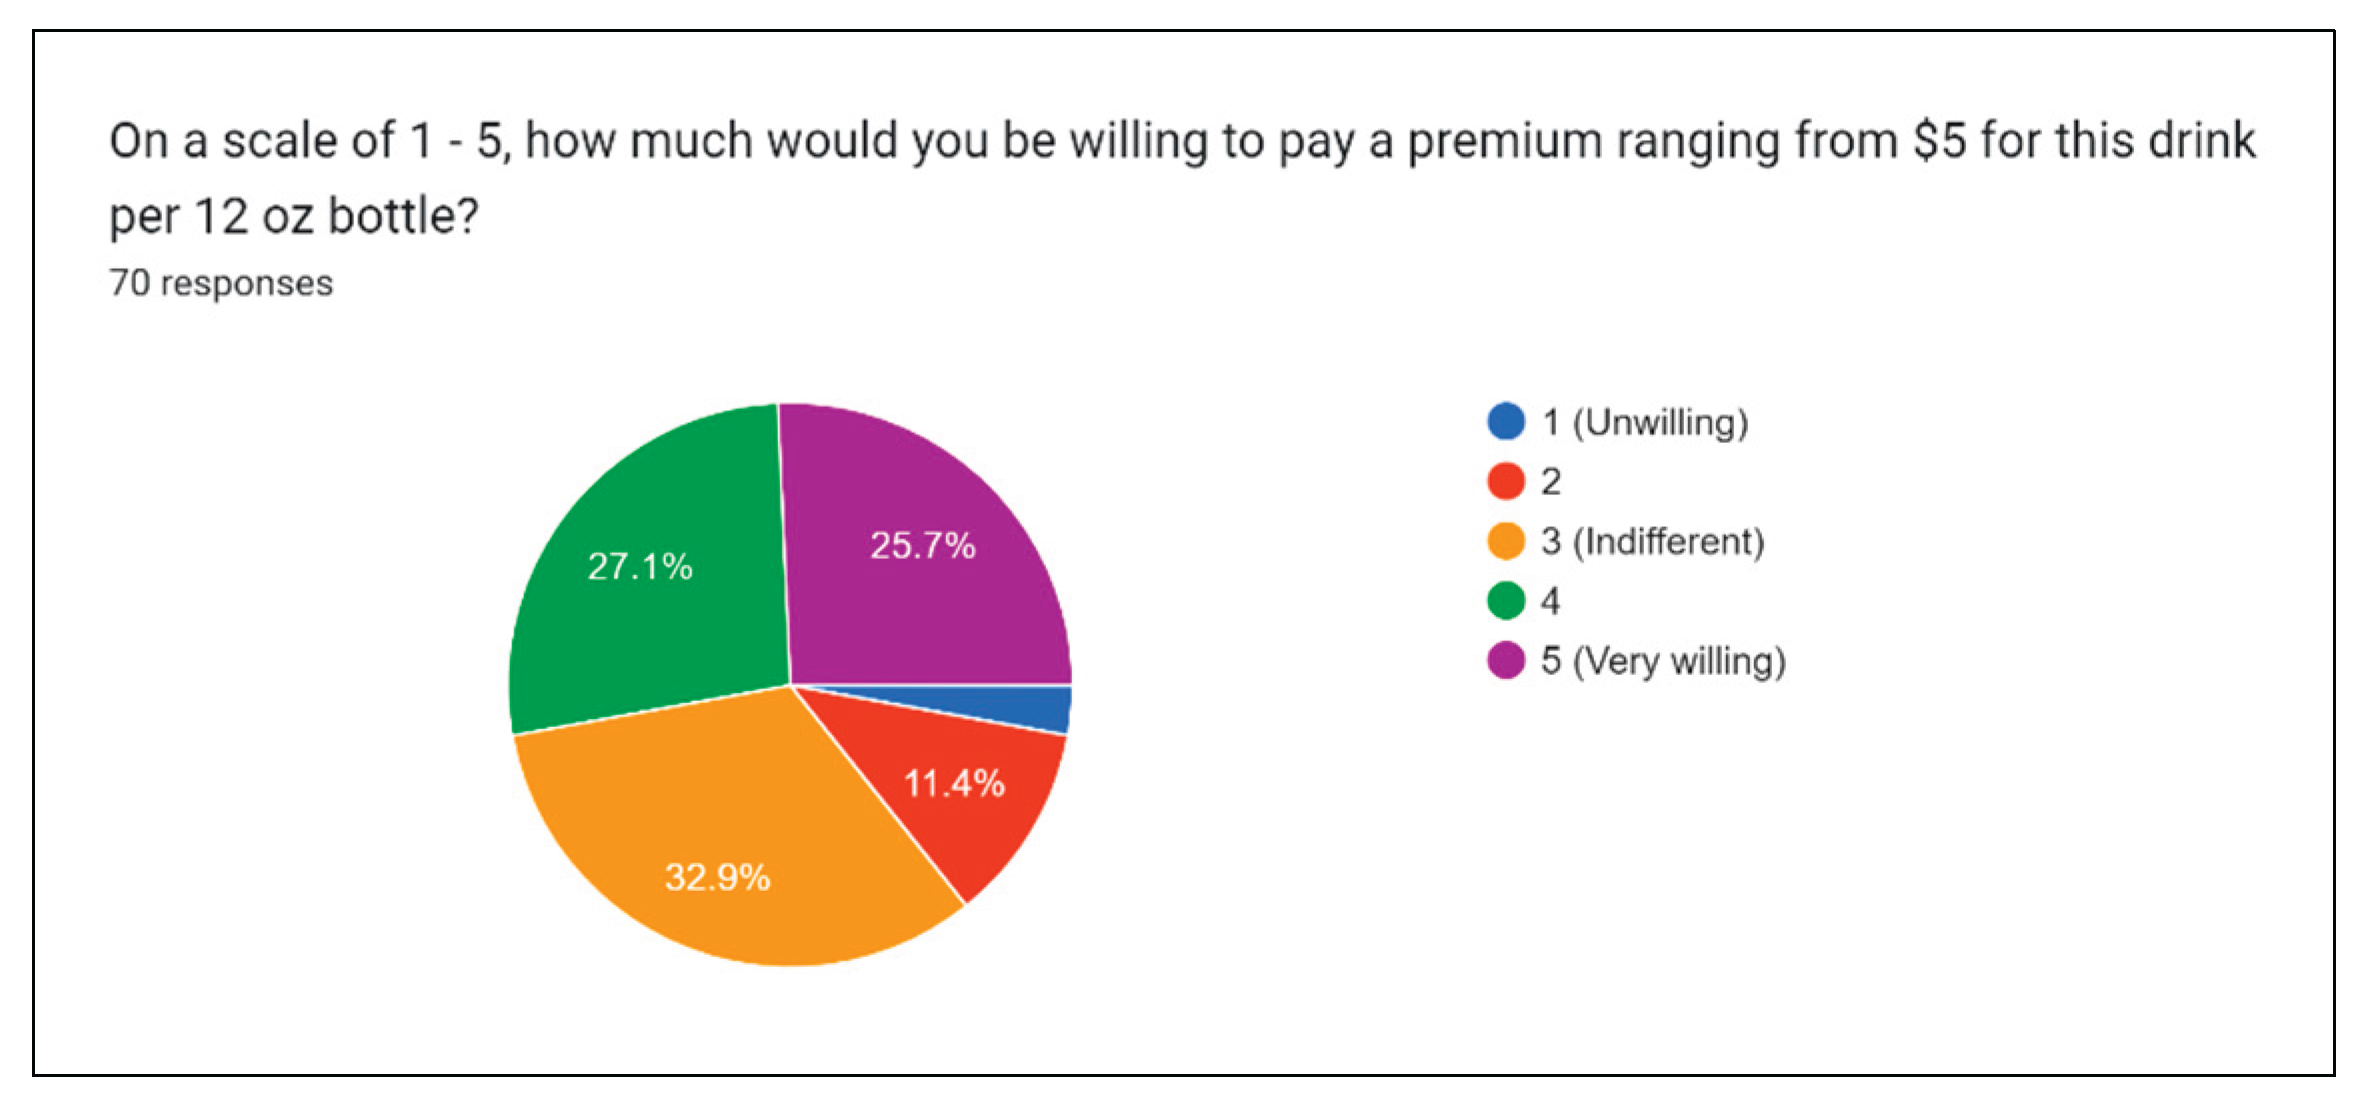
Figure 23.
Consuming product results.
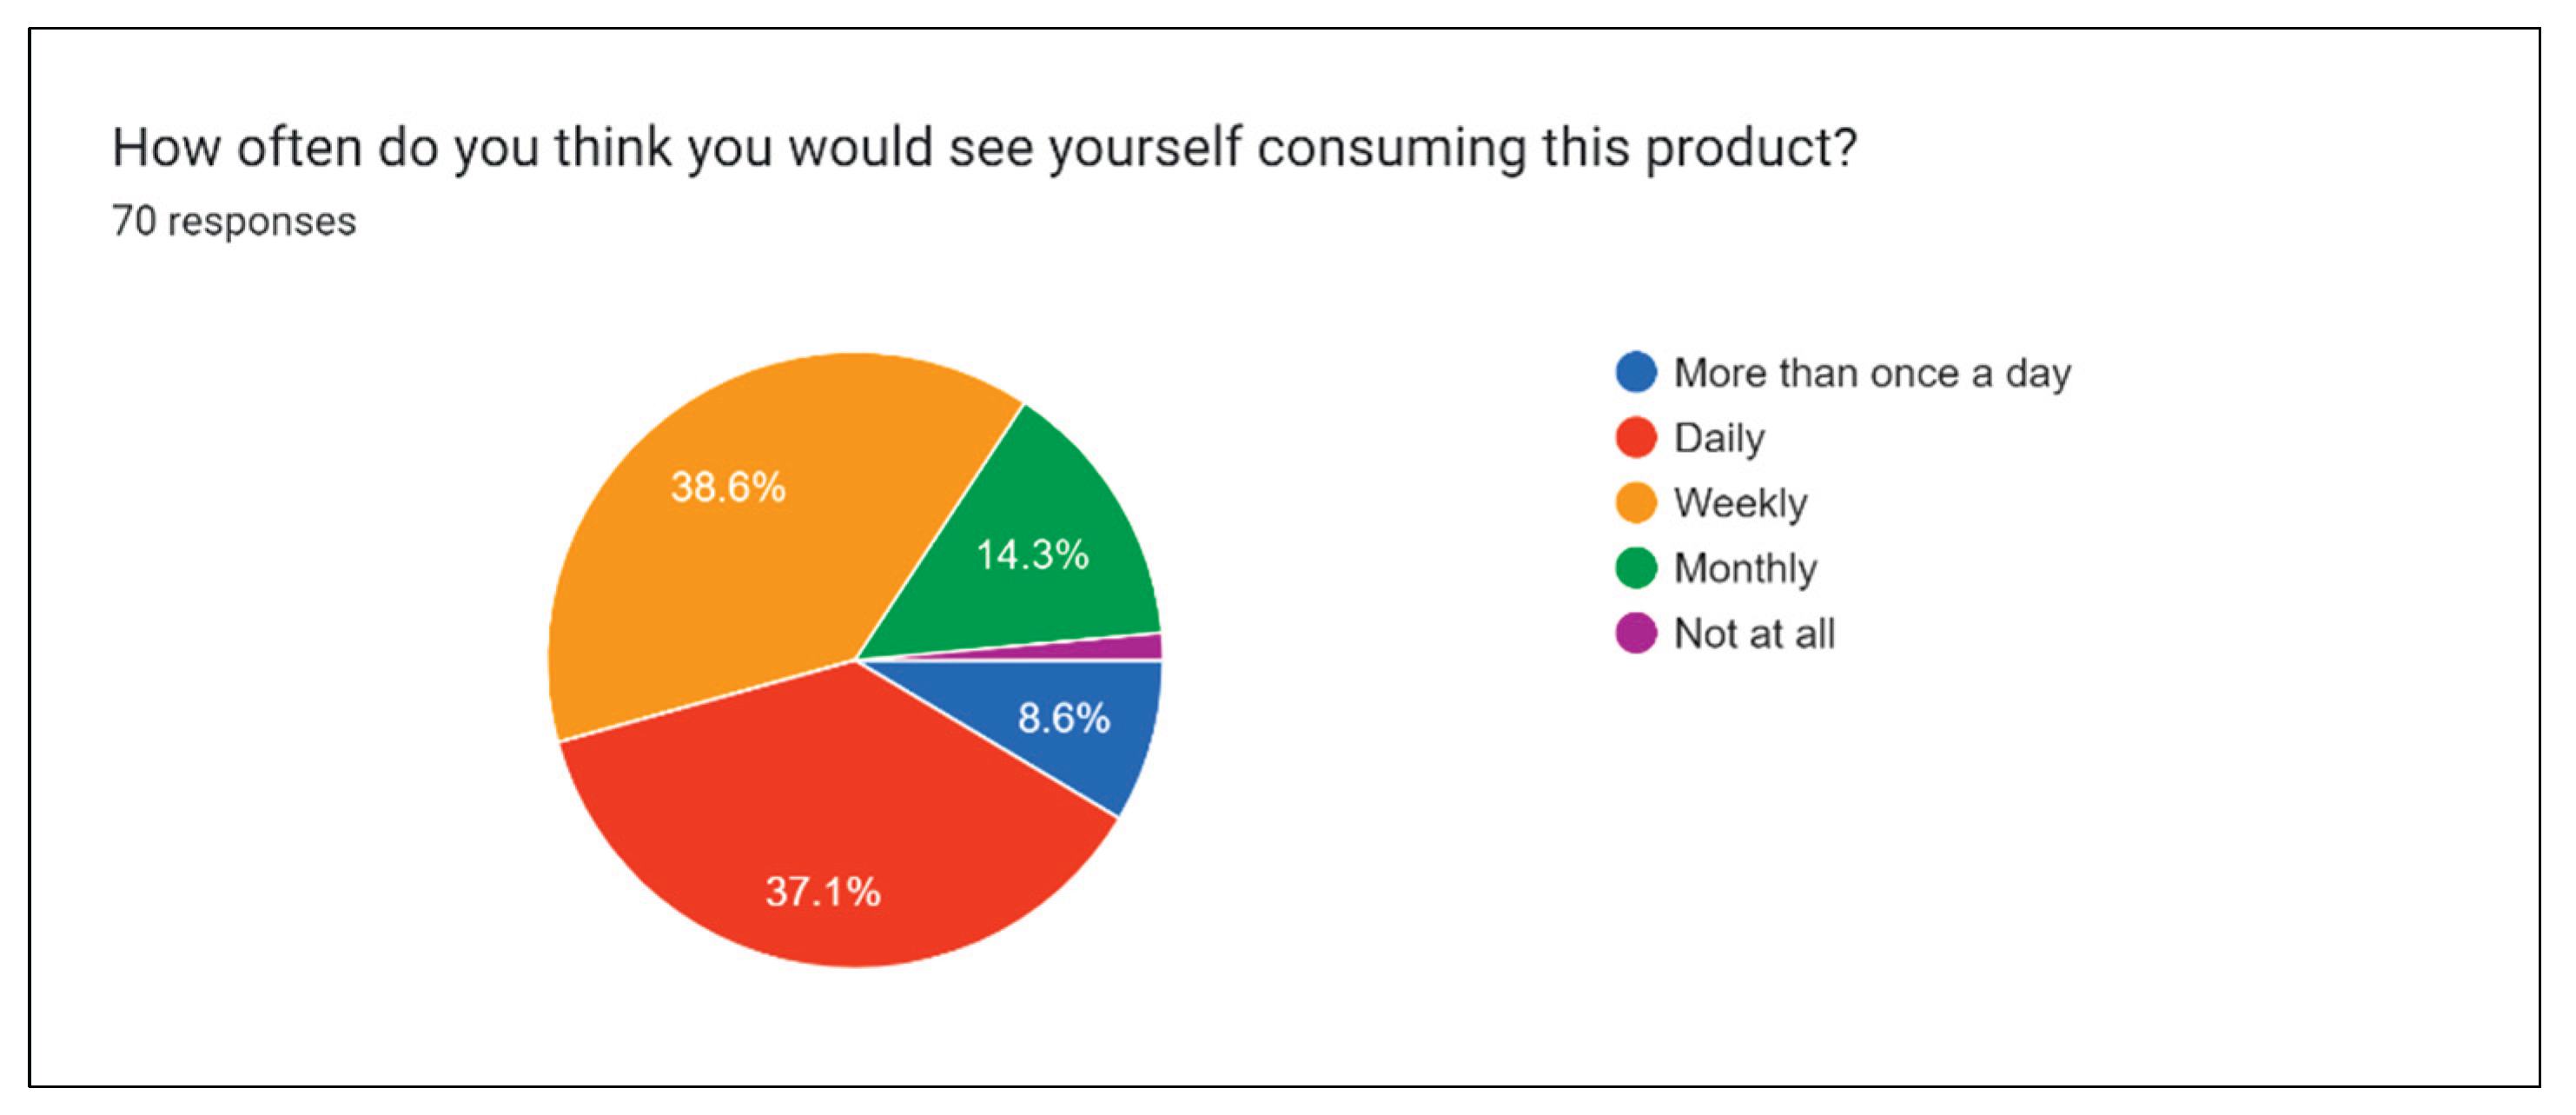
Figure 24.
Proposed additive results.
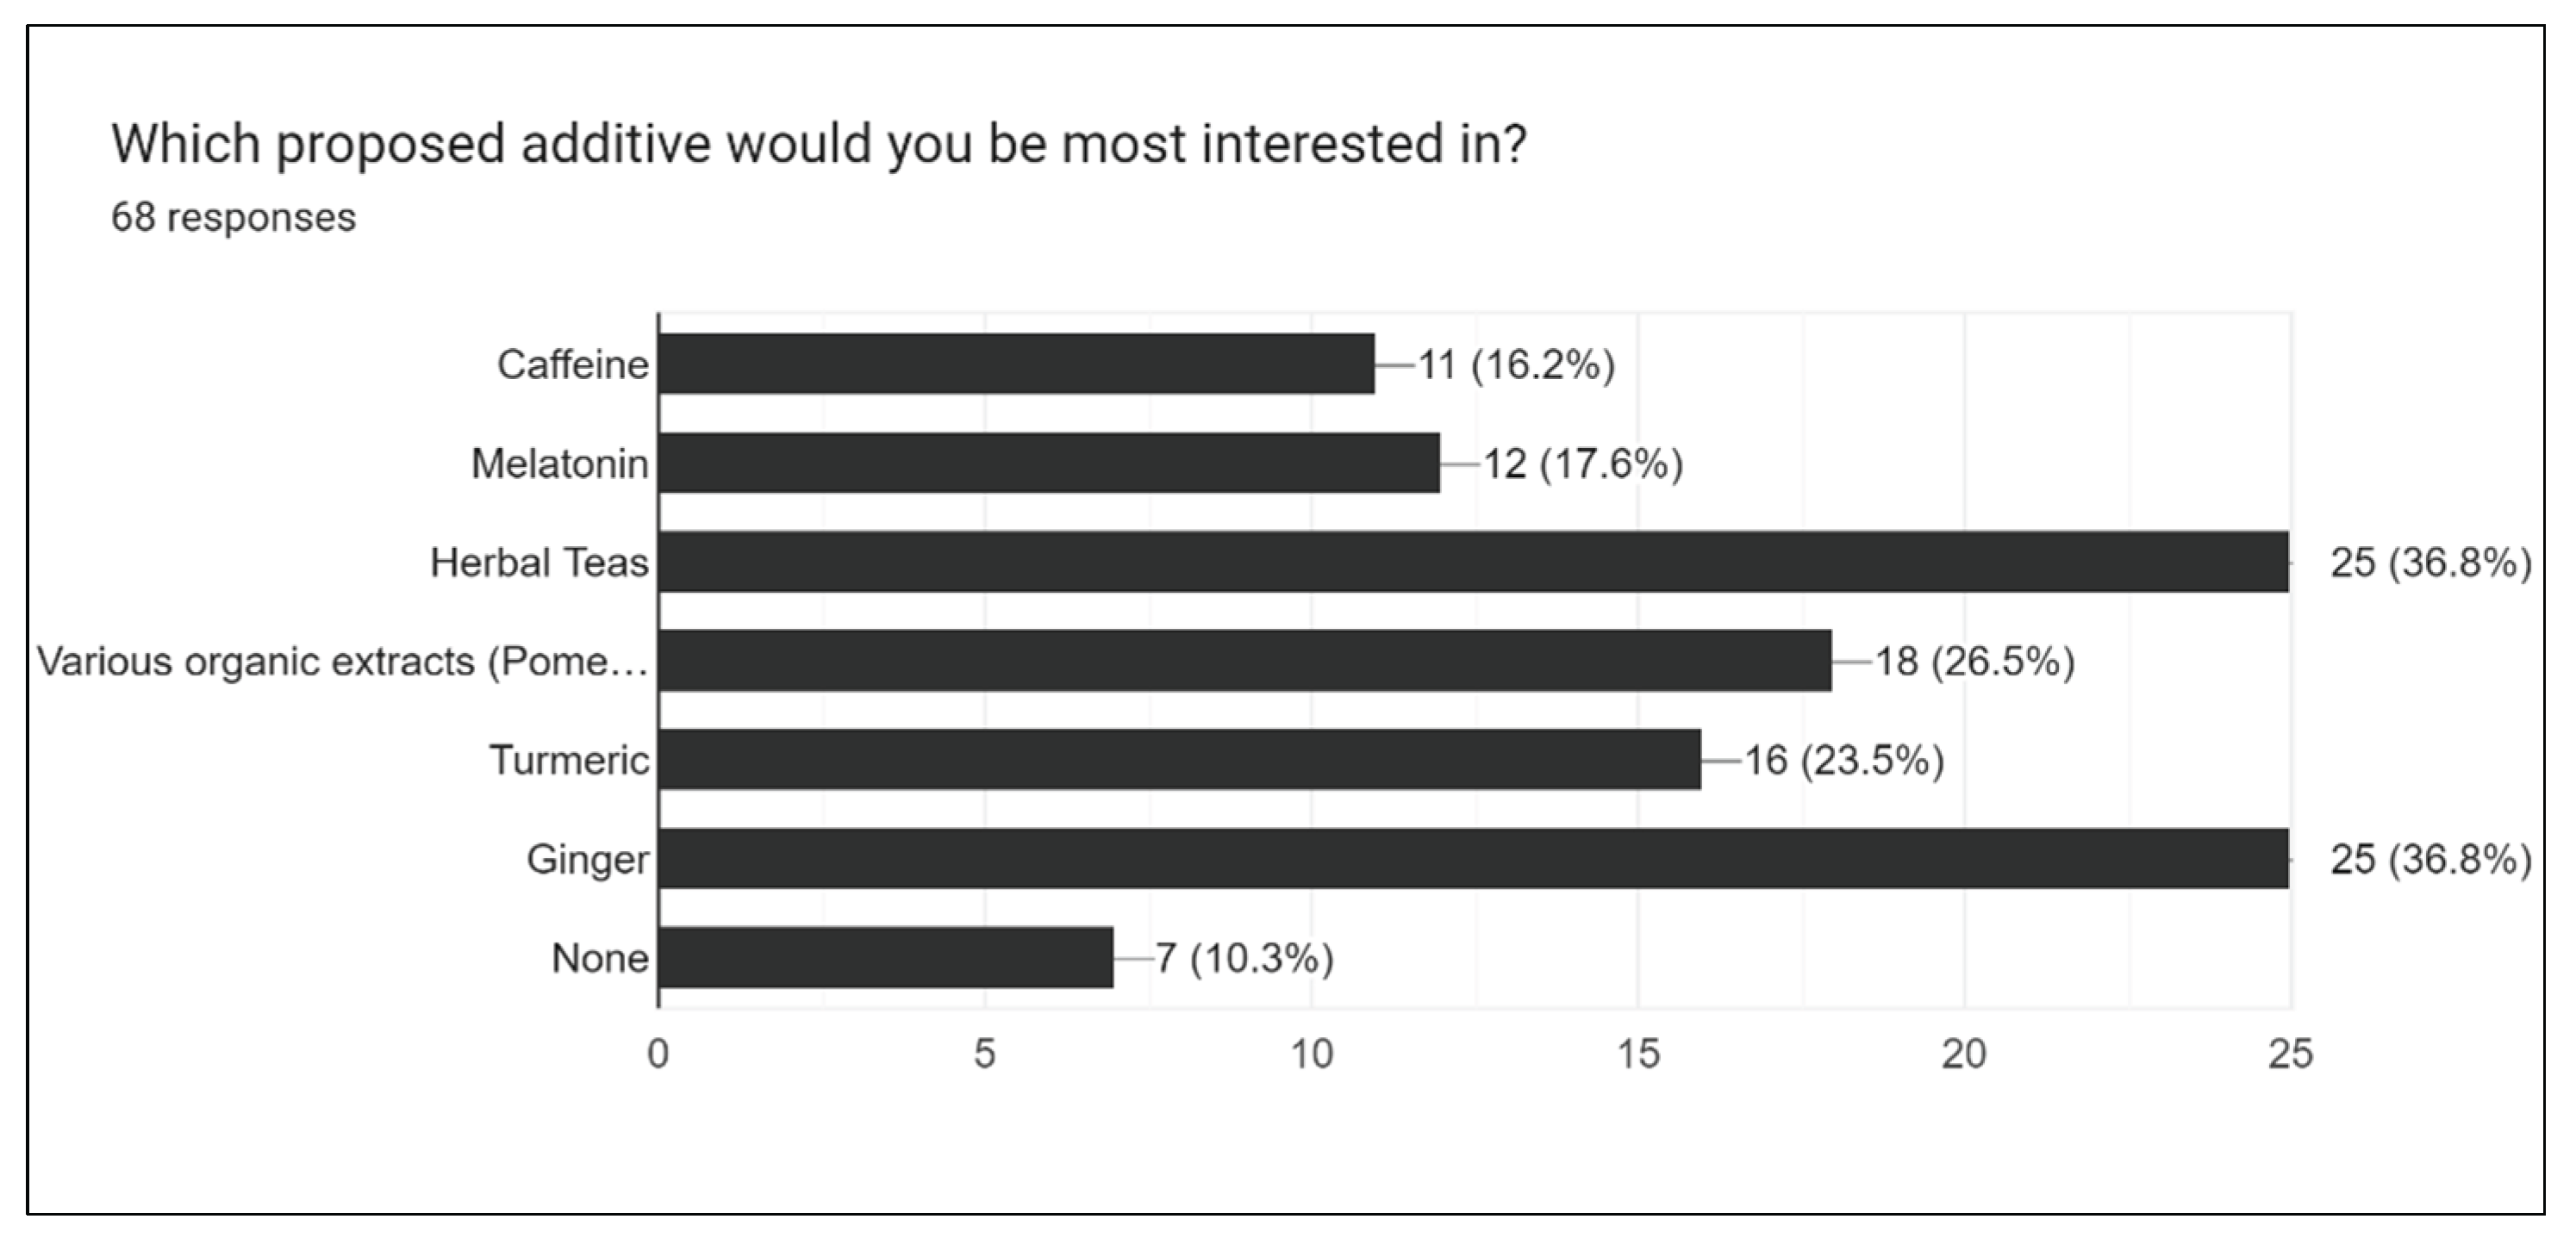

Table 1.
Antioxidant comparison of new drink formulations.
| Drink | Brix % | pH | Conductivity | APC | TPC | TFC | TTC |
|---|---|---|---|---|---|---|---|
| Basic | 5.4 | 3.74 | 57.16 | 89 | 6 | 1.31 | 0.64 |
| Ginger | 3.3 | 3.82 | 47.44 | 220 | 6 | 1.19 | 0.39 |
| Ginger/Lemon | 6.8 | 3.25 | 50.58 | 77 | 8 | 1.66 | 2.50 |
| Ginger/Strawberry | 4.9 | 3.77 | 49.95 | 31 | 0 | 1.19 | 0.93 |
| Ginger/Peppermint | 3.5 | 3.93 | 57.00 | 83 | 1 | 1.41 | 0.67 |
| Strawberry | 4.8 | 3.87 | 50.40 | 43 | 6 | 0.96 | 0.70 |
| Raspberry | 5.7 | 3.61 | 49.82 | 213 | 2 | 1.59 | 1.90 |
| Fig Powder | 4.9 | 4.01 | 41.65 | 36 | 14 | 1.58 | 2.08 |
| Peppermint | 3.4 | 4.01 | 50.48 | 41 | 9 | 0.87 | 0.76 |
| Earl Grey | 4.0 | 3.79 | 47.90 | 34 | 25 | 2.38 | 0.66 |
| Yerba Mate | 3.4 | 3.92 | 48.83 | 59 | 19 | 0.88 | 0.58 |
| Chamomile Tea | 2.9 | 3.98 | 45.32 | 28 | 12 | 0.46 | 0.54 |
APC in drinks was measured as mg/g of Cyanadin-3-Glucoside equivalents. TPC, TFC, and TTC were measured as mg/g of Gallic Acid, Quercetin, or Tannic acid equivalents, respectively. Conductivity was measured in uS/cm.
Table 2.
Phytochemical Screening results of ingredients.
| Flavor | Tannins | Flavonoids | Saponins | Steroids | Glycosides | Alkaloids | Terpenoids | Carbohydrates |
|---|---|---|---|---|---|---|---|---|
| B | + | + | + | + | + | + | + | + |
| R | + | + | + | + | + | + | + | + |
| S | + | + | + | + | + | + | + | + |
| F | + | + | + | + | + | + | + | + |
| C | + | + | + | + | + | + | + | + |
| EG | + | + | + | + | + | + | + | + |
| P | + | + | + | + | + | + | + | + |
| YM | + | + | + | + | + | + | + | + |
| G | + | + | + | + | + | - | + | + |
| GL | + | + | + | + | + | - | + | + |
| PG | + | + | + | + | + | - | + | + |
| SG | + | + | + | + | + | - | + | + |
B: basic drink; R: raspberry flavored drink; S: - strawberry flavored drink; F – fig flavored drink; C – chamomile flavored drink; EG – Earl Grey drink; P: peppermint flavor; YM – yerba mate flavor; G – ginger flavor; GL – ginger and lemon flavor; LG: Lemon Ginger, PG: Peppermint Ginger, SG: Strawberry Ginger.
Table 3.
ICP/MS analysis of cation presence in drink samples and berries (mg/serving).
| Analyte | Ca | Fe | Cu | K | Mg | Mn | Na | Zn |
|---|---|---|---|---|---|---|---|---|
| Basic | 20.1 | 0.0 | 0.0 | 291.6 | 103.1 | 0.3 | 103.5 | 0.3 |
| Raspberry | 24.8 | 1.4 | 0.2 | 245.0 | 107.9 | 0.4 | 121.9 | 0.5 |
| Strawberry | 26.3 | 1.3 | 0.3 | 274.4 | 110.3 | 0.6 | 116.3 | 0.5 |
| Fig | 23.4 | 1.1 | 0.2 | 238.1 | 106.0 | 0.3 | 117.4 | 0.4 |
| Chamomile | 19.4 | 0.0 | 0.0 | 290.0 | 102.4 | 0.2 | 100.2 | 0.2 |
| Yerba Mate | 24.0 | 0.0 | 0.1 | 371.8 | 112.9 | 1.0 | 105.4 | 0.3 |
| Earl Grey | 20.4 | 0.0 | 3.3 | 309.5 | 103.6 | 0.5 | 103.1 | 2.3 |
| Peppermint | 33.7 | 1.3 | 0.4 | 389.9 | 120.5 | 0.4 | 117.9 | 0.6 |
| Ginger | 24.3 | 1.1 | 0.2 | 307.6 | 110.3 | 0.4 | 113.4 | 0.4 |
| LG | 28.4 | 0.9 | 0.2 | 327.5 | 113.8 | 0.3 | 115.7 | 0.5 |
| PG | 31.7 | 1.5 | 0.2 | 371.7 | 119.2 | 0.4 | 114.4 | 0.5 |
| SG | 28.6 | 1.1 | 0.1 | 320.3 | 114.2 | 0.5 | 114.5 | 0.5 |
B: basic drink; R: raspberry flavored drink; S: - strawberry flavored drink; F – fig flavored drink; C – chamomile flavored drink; EG – earl grey drink; P: peppermint flavor; YM – yerba mate flavor; G – ginger flavor; GL – ginger and lemon flavor; LG: Lemon Ginger, PG: Peppermint Ginger, SG: Strawberry Ginger.
Disclaimer/Publisher’s Note: The statements, opinions and data contained in all publications are solely those of the individual author(s) and contributor(s) and not of MDPI and/or the editor(s). MDPI and/or the editor(s) disclaim responsibility for any injury to people or property resulting from any ideas, methods, instructions or products referred to in the content. |
© 2025 by the authors. Licensee MDPI, Basel, Switzerland. This article is an open access article distributed under the terms and conditions of the Creative Commons Attribution (CC BY) license (http://creativecommons.org/licenses/by/4.0/).
Copyright: This open access article is published under a Creative Commons CC BY 4.0 license, which permit the free download, distribution, and reuse, provided that the author and preprint are cited in any reuse.


